first-time freshman graduation rates · figure 3. proportion graduating in less than four years...
TRANSCRIPT
First-Time Freshman Graduation Rates
Biennial ReportApril, 2008
Catherine J [email protected] Research and Planning440 Day HallIthaca, NY 14853-2801
FIRST-TIME FRESHMAN GRADUATION RATES FALL 1980 - FALL 2001 ENTERING CLASSES BIENNIAL REPORT April 2008 Catherine J Alvord [email protected] Institutional Research and Planning 440 Day Hall Ithaca, NY 14853-2801 dpb.cornell.edu

First-Time Freshman Graduation Rates
ii
Table of Contents
List of Figures………………………………………….……………………………...…….. ii
List of Tables…………………………………………….…………….……………..….….. iii
Executive Summary……………………………………….………….…..…………...……. 1
Methodology……………………………………………….………….…..…………...……. 3
Population……………………………………………….………….…..……….…..…… 3
Principal Concept and Study Design…………………….………….…...……….….…… 3
Analysis……………………………………………………….…….………...……….......… 4
Overall Graduation Rates………………………………….…….…………………..…… 4
Graduation Rates by College……………………………….…….………………………. 5
Graduation Rates by Race/Ethnicity and Gender…………….….………………………... 9
OMEA/COSEP Graduation Rates by Race/Ethnicity…………..……………….……...… 12
Recruited Athletes Graduation Rates………………………………………….……...….. 13
Financial Aid Package Recipients Graduation Rates…………………………………….. 13
Attrition Group…………………………………………………………………………… 15
Inter-Institutional Comparisons…………………………………………………………... 19
List of Figures
1. Six-Year Graduation Rates………………………………………………………………….. 4
2. Four-, Five-, and Six-Year Graduation Rates………………………………………………. 4
3. Proportion Graduating in Less than Four Years……………………………………………. 5
4. Endowed Colleges’ Six-Year Graduation Rates……………………………………………. 5
5. Contract Colleges’ Six-Year Graduation Rates…………………………………………….. 6
6. Internal Transfer Patterns and Six-Year Graduation Rates Architecture, Art & Planning Matriculants……………………………………………….. 7
7. Internal Transfer Patterns and Six-Year Graduation Rates Arts & Sciences Matriculants…………………………………………………………….. 7
8. Internal Transfer Patterns and Six-Year Graduation Rates Engineering Matriculants………………………………………………………………….. 7
9. Internal Transfer Patterns and Six-Year Graduation Rates Hotel Administration Matriculants………………………………………………….…….. 7
First-Time Freshman Graduation Rates
10. Internal Transfer Patterns and Six-Year Graduation Rates Agriculture & Life Sciences Matriculants……………………………………………….. 8
11. Internal Transfer Patterns and Six-Year Graduation Rates Human Ecology Matriculants…………………………………….……………………….. 8
12. Internal Transfer Patterns and Six-Year Graduation Rates Industrial & Labor Relations Matriculants……………………………………………….. 8
13. Six-Year Graduation Rates by Race/Ethnicity…………………………………………...… 9
14. Four-, Five-, and Six-Year Graduation Rates -- African-American……………………… 10
15. Four-, Five-, and Six-Year Graduation Rates -- Hispanic American…………………..… 10
16. Four-, Five-, and Six-Year Graduation Rates -- Asian American……………………..…. 10
17. Four-, Five-, and Six-Year Graduation Rates -- White………………………………...… 10
18. Proportion Graduating in Less Than Four Years, First-Time Freshmen Entering Fall – Foreign Nationals……………………………..….. 11
19. Six-Year Graduation Rates by Gender……………………………………………………..11
20. Race/Ethnicity by Gender Six-Year Graduation Rates, First-Time Freshmen Entering Fall 2001……………………………………………..….. 12
21. Six-Year Graduation Rates for OMEA/COSEP Participants…………………………….. 12
22. Six-Year Graduation Rates for Recruited Athletes………………………………………. 13
23. Six-Year Graduation Rates for Financial Aid Recipients……….………………………. 14
24. Academic Standing of the Attrition Group………………………………………………. 15
25. Academic Standing of Attrition Group by College of Matriculation, First-Time Freshmen Entering Fall 2001…………………….…………………………. 15
26. Proportion of Attrition Group with G.P.A. < 2.00 by Race/Ethnicity……...……………. 16
27. Attrition Group Other Status, First-Time Freshmen Entering Fall 2001…..……………. 18
List of Tables
1. Financial Aid Package Recipients Graduating Within Six-Years by Race/Ethnicity, First-Time Freshmen Entering Fall 2001………………………………………………... 14
2. Categories of Attrition Group, First-Time Freshmen Entering Fall 2000…………………. 16
3. Categories of Attrition Group, First-Time Freshmen Entering Fall 2001…………………. 17
4. Percentage by SAT Quartiles Who Did Not Graduate Within Six-Years…………………. 17
5. Percentage by Geographic Admit Region Who Did Not Graduate Within Six-Years…….. 18
6. Six-Year Graduation Rates for Cornell and Overlap Group………………………………. 19
iii

First-Time Freshman Graduation Rates
Executive Summary • Of the first-time freshmen entering Cornell in Fall 2001, 92 percent earned a baccalaureate
degree from one of the seven undergraduate colleges within six years. Beginning with the first-time freshmen entering in Fall 1990, the graduation rate has been 90 percent or above. The Fall 2001 graduation rate represented an increase of nine percentage points over the freshman class that entered in Fall 1980. (See page 4)
• The proportion of students who graduated early -- completed their degree requirements prior
to the spring semester of their fourth year at Cornell (see Figure 3, page 5) -- continued to increase reaching 11 percent for those who entered in Fall 2001.
• Six-year graduation rates vary by the college where students matriculated, though graduation
rates have improved for those entering each of Cornell’s seven undergraduate colleges. (See pages 5-6) In general, graduation rates were higher for students who matriculated in Cornell's contract colleges.
• Not all students who entered Cornell as first-time freshmen graduated from the college in
which they matriculated. Students in the Colleges of Agriculture and Life Sciences and Human College were most likely to earn their degree from one of the other undergraduate colleges. (See pages 6-8)
• For those students who entered Cornell as first-time freshmen in Fall 1980, there was a gap of
approximately 17 percentage points between the combined African-American, Hispanic American, and Native American six-year graduation rate of about 70 percent and the composite 87 percent graduation rate for Asian American and white students. By the entering class of Fall 1987, this gap had reduced to about 12 percentage points. The gap has continued to narrow, particularly for Hispanic American students entering in Fall 2001 whose six-year graduation rate was within 8 percentage points of Asian American and white students. (See page 9)
• Graduation rates are consistently higher for women. First-time freshman women entering in
Fall 2001 graduated at 93 percent while men graduated at 91 percent. (See page 11) • Among U.S. citizens and permanent residents, women show a higher graduation rate within
each of the race/ethnicity groups. For students entering in Fall 2001 there was an 11 percentage points difference between African-American and Hispanic American men and women. The gender difference is reversed – though small at only two percentage points – among international students. (See page 12)
• Students participating in the Office of Minority Education Affairs and Committee on Special
Education Projects (OMEA/COSEP) program had an 88 percent six-year graduation rate for those entering in Fall 2001. African-American and Hispanic American students that participated in this program had a six-year graduation rate that was equivalent to the overall population graduation rates for students in these race/ethnicity groups. (See page 12)
1

First-Time Freshman Graduation Rates
• First-time freshmen who are recruited athletes generally graduate at rates equivalent to the total undergraduate population. Recruited athletes entering in Fall 2001 had a 92 percent graduation rate. (See page 13)
• There was a slightly greater likelihood for students who received Cornell loans, work-study, or
no financial aid to complete a degree within six years in comparison to those students who received Cornell grant aid. (See pages 13-14)
• A little over half of the Fall 2000 and two-thirds of the Fall 2001 attrition cohorts left Cornell
voluntarily before completing a degree while the remainder were required to leave or withdraw from the university. Additionally, approximately 11 percent of those classified in the attrition group of the Fall 2000 and 8 percent of the attrition group of the Fall 2001 entering first-time freshmen either earned a Cornell degree after the six-year study window or are still currently enrolled as undergraduates at Cornell. (See pages 16-17)
2

First-Time Freshman Graduation Rates
Methodology Population The population for this study is first-time freshman matriculants who were initially enrolled at Cornell in the Fall terms of 1980 through 2001. First-time freshmen are students who never attended any college (or other postsecondary institution) on a full-time basis. Included are students enrolled in the fall term that might have attended college for the first time in the prior summer term. Also included are students who entered with advanced standing (college credits earned before graduation from high school). Entering classes are identified by the date when they first entered the university. Transfer students -- those who come to Cornell from another college or university -- are excluded from this study. Principal Concept and Study Design The retention concept underlying this report is based on a six-year period from the point a student first matriculated in one of Cornell’s seven undergraduate colleges to the time of graduation. The methods employed in this research design are similar to those employed in retention research in most national studies. The research behind this report was conducted so that students who graduate within four, five, or six years are distinguished. Students who did not graduate from any of Cornell’s seven undergraduate colleges within six years of entering are classified in the attrition group, although a number are either currently enrolled or subsequently earn a Cornell undergraduate degree. A year is delineated in terms of the academic calendar and comprises the Fall and Spring semesters, and the Summer term. Students appearing in the four-year rate are those receiving degrees earlier than whichever Fall semester would signify the start of their fifth year. The single exception is in the College of Architecture, Art, and Planning where students enrolled in five-year programs have their time-to-degree window extended by a year. For example, students in five-year degree programs who graduate before the beginning of their sixth year are included among the four-year degree recipients. This was done in the interest of comparability since these students have made the same progress toward their degrees as those candidates for degrees normally requiring only four years of study. In addition, graduation rate information drawn from the annual Independent Postsecondary Education Data Sharing (IPEDS) Graduation Rate Survey is included to help place Cornell’s graduation rates into a larger context.
3

First-Time Freshman Graduation Rates
Analysis Overall Graduation Rates For the past decade, the six-year graduation rate of entering first-time freshmen has been at or above 90 percent. Of the 2,983 first-time freshmen who entered Cornell in Fall 2001, 92 percent earned a baccalaureate degree from one of the seven undergraduate colleges within six years of matriculation. This is an increase of nine percentage points over the 83 percent graduation rate of the 2,785 first-time freshman class who entered in Fall 1980 (see Figure 1).
Figure 1. Six-Year Graduation Rates for First-Time Freshmen Entering Fall
0%
20%
40%
60%
80%
100%
1980
1981
1982
1983
1984
1985
1986
1987
1988
1989
1990
1991
1992
1993
1994
1995
1996
1997
1998
1999
2000
2001
As Figure 2 indicates, the majority of students earn degrees in four years. For the Fall 1980 entering class, 73 percent earned a Cornell degree in four years, while the entering class of Fall 2001 saw 85 percent earning a degree in four years. The proportion of first-time freshmen requiring five years to earn an undergraduate degree decreased between the Fall 1980 (9 percent) and Fall 2001 (6 percent) entering classes. The proportion of those utilizing a sixth year to complete their degree requirements slightly declined -- 2 percent for the Fall 1980 entering class to 1 percent for those entering in Fall 2001.
Figure 2. Four-, Five-, and Six-Year Graduation Rates First-Time Freshmen Entering Fall
0%
20%
40%
60%
80%
100%
1980
1981
1982
1983
1984
1985
1986
1987
1988
1989
1990
1991
1992
1993
1994
1995
1996
1997
1998
1999
2000
2001
4 years 5 years 6 years
4

First-Time Freshman Graduation Rates
The proportion of students who graduate early, prior to the spring semester of their fourth year at Cornell, increased 8 percentage points between the Fall 1980 and the Fall 2001 entering classes. Eleven percent of the Fall 2001 entering class completed their degree requirements prior to the spring semester of their fourth year at Cornell (see Figure 3).
Figure 3. Proportion Graduating in Less Than Four YearsFirst-Time Freshmen Entering Fall
0%
20%
40%
60%
80%
100%
1980
1981
1982
1983
1984
1985
1986
1987
1988
1989
1990
1991
1992
1993
1994
1995
1996
1997
1998
1999
2000
2001
Graduation Rates by College Six-year graduation rates vary by the college in which students matriculate, though the rates increased for those entering all but one of Cornell’s seven undergraduate colleges over period studied (see Figure 4). For students entering the College of Arts and Sciences in Fall 1980, 81 percent earned a Cornell degree within six years. The proportion increased to 92 percent for the Fall 2001 entering class. The College of Engineering and School of Hotel Administration also saw increases, from 85 percent for both to 94 percent and 90 percent respectively.
Figure 4. Endowed Colleges' Six-Year Graduation RatesFirst-Time Freshmen Entering Fall
0%
20%
40%
60%
80%
100%
1980
1981
1982
1983
1984
1985
1986
1987
1988
1989
1990
1991
1992
1993
1994
1995
1996
1997
1998
1999
2000
2001
AA&P A&S Engineering Hotel
Six-year graduation rates in the College of Architecture, Art, and Planning are lower and more volatile than in the other endowed colleges. The college’s graduation rate peaked among students entering in Fall 1983 and Fall 1986 at 86 percent. The class entering in Fall 1982 showed the lowest graduation rate 65 percent with those entering in Fall 2001 also showed a
5

First-Time Freshman Graduation Rates
lower graduation rate of 65 percent. One reason for the volatility (beside the relatively smaller number of first-time freshmen entering the college each year) may be the college’s policy of allowing students in the Bachelor of Architecture (BArch) and Bachelor of Fine Arts (BFA) programs five years from the date the last course is completed to submit their graduation portfolio requirement. The degree is considered pending completion of generally non-course requirements (e.g. undergraduate thesis/portfolio) for five years. If there is outstanding thesis or course work after five years, the student must re-apply to the respective program to satisfy degree requirements for the year and term of the re-admit. For the first-time freshmen entering in Fall 2001, 40 students did not graduate within six-years. One-half of those students were “pending” their BArch degree requirements. If all “pending” students had completed this requirement by August 2007, the College’s six-year graduation rate would have been 83 percent rather than 65 percent. Six-year graduation rates for students who initially enrolled in any of Cornell’s contract colleges saw slight increases between the freshman classes entering in Fall 1980 and Fall 2001 (see Figure 5). For the Fall 2001 entering cohort, students who enrolled in the College of Agriculture and Life Sciences obtained the highest six-year graduation rate among the seven undergraduate colleges at 94 percent. The School of Industrial and Labor Relations’ graduation rate experienced an 8 percent increase between Fall 1980 (85 percent) and Fall 2001 (93 percent.) Over the period covered in this report, the highest college-specific graduation rate was obtained by students who entered the College of Human Ecology in Fall 1999: 98 percent of these students graduated in six years.
Figure 5. Contract Colleges' Six-Year Graduation RatesFirst-Time Freshmen Entering Fall
0%
20%
40%
60%
80%
100%
1980
1981
1982
1983
1984
1985
1986
1987
1988
1989
1990
1991
1992
1993
1994
1995
1996
1997
1998
1999
2000
2001
A&LS Human Ecology I&LR
Not all students who enter Cornell as first-time freshmen graduate from the same college in which they matriculate. The patterns of internal transfers have remained relatively stable over the period of investigation. Among the endowed colleges (see Figures 6-9), there is a considerable amount of internal transfers among students who initially enter the College of Architecture, Art and Planning. In contrast, there is very little internal transferring of students in the School of Hotel Administration.
6

First-Time Freshman Graduation Rates
Figure 6. Internal Transfer Patterns and Six-Year Graduation Rates First-Time Freshmen Entering Fall -- Architecture, Art & Planning
0%20%40%60%80%
100%
1980
1985
1990
1991
1992
1993
1994
1995
1996
1997
1998
1999
2000
2001
Perc
ent W
ithin
G
radu
ated
Same Endowed Contract
Figure 7. Internal Transfer Patterns and Six-Year Graduation Rates
First-Time Freshmen Entering Fall -- Arts & Sciences
0%20%40%60%80%
100%
1980
1985
1990
1991
1992
1993
1994
1995
1996
1997
1998
1999
2000
2001
Perc
ent W
ithin
G
radu
ated
Same Endowed Contract
Figure 8. Internal Transfer Patterns and Six-Year Graduation Rates
First-Time Freshmen Entering Fall -- Engineering
0%20%40%60%80%
100%
1980
1985
1990
1991
1992
1993
1994
1995
1996
1997
1998
1999
2000
2001
Perc
ent W
ithin
G
radu
ated
Same Endowed Contract
Figure 9. Internal Transfer Patterns and Six-Year Graduation Rates
First-Time Freshmen Entering Fall - Hotel Administration
0%20%40%60%80%
100%
1980
1985
1990
1991
1992
1993
1994
1995
1996
1997
1998
1999
2000
2001
Perc
ent W
ithin
G
radu
ated
Same Endowed Contract
7
First-Time Freshman Graduation Rates
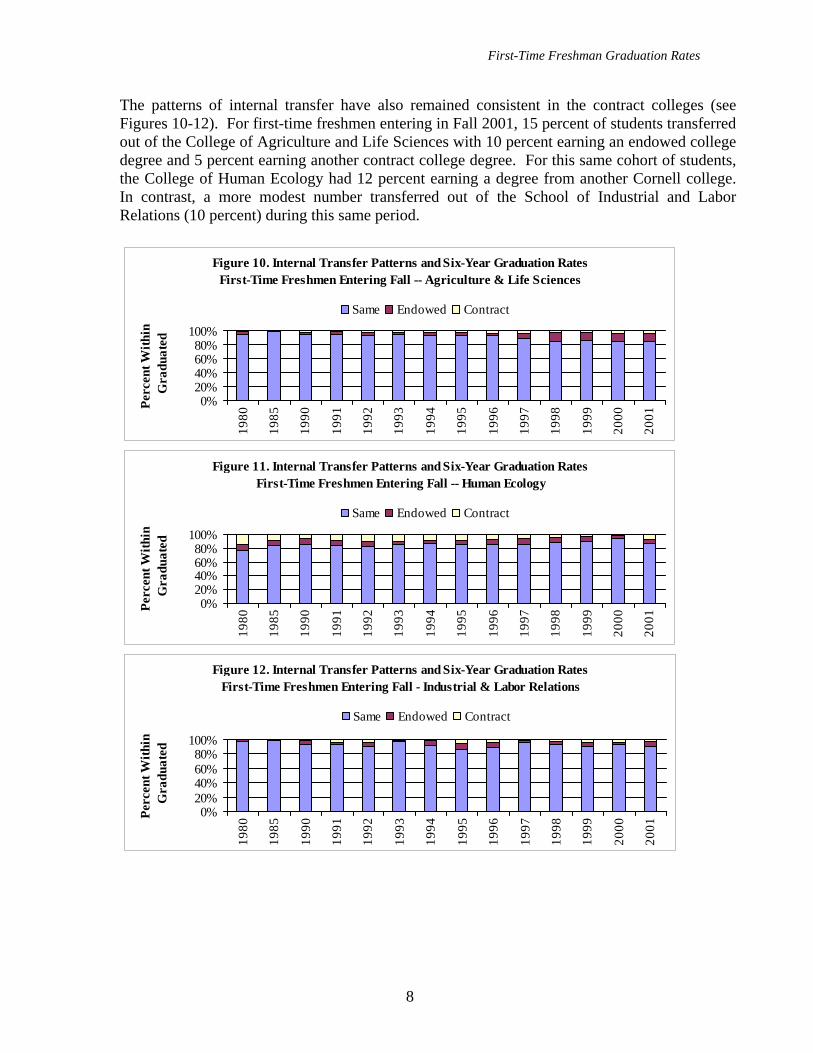
The patterns of internal transfer have also remained consistent in the contract colleges (see Figures 10-12). For first-time freshmen entering in Fall 2001, 15 percent of students transferred out of the College of Agriculture and Life Sciences with 10 percent earning an endowed college degree and 5 percent earning another contract college degree. For this same cohort of students, the College of Human Ecology had 12 percent earning a degree from another Cornell college. In contrast, a more modest number transferred out of the School of Industrial and Labor Relations (10 percent) during this same period.
Figure 10. Internal Transfer Patterns and Six-Year Graduation Rates First-Time Freshmen Entering Fall -- Agriculture & Life Sciences
0%20%40%60%80%
100%
1980
1985
1990
1991
1992
1993
1994
1995
1996
1997
1998
1999
2000
2001
Perc
ent W
ithin
G
radu
ated
Same Endowed Contract
Figure 11. Internal Transfer Patterns and Six-Year Graduation Rates
First-Time Freshmen Entering Fall -- Human Ecology
0%20%40%60%80%
100%
1980
1985
1990
1991
1992
1993
1994
1995
1996
1997
1998
1999
2000
2001
Perc
ent W
ithin
G
radu
ated
Same Endowed Contract
Figure 12. Internal Transfer Patterns and Six-Year Graduation Rates
First-Time Freshmen Entering Fall - Industrial & Labor Relations
0%20%40%60%80%
100%
1980
1985
1990
1991
1992
1993
1994
1995
1996
1997
1998
1999
2000
2001
Perc
ent W
ithin
G
radu
ated
Same Endowed Contract
8

First-Time Freshman Graduation Rates
Graduation Rates by Race/Ethnicity and Gender Graduation rates among race/ethnicity groups at Cornell over this period show a generally positive trend (see Figure 13). For those students who entered Cornell as first-time freshmen in Fall 1980, there was a gap of approximately 17 percentage points between the combined African-American, Hispanic American, and Native American six-year graduation rate of 70 percent and the composite 87 percent graduation rate for Asian American and white students. By the entering class of Fall 1989, this gap had been reduced to about 12 percentage points, and all five groups had seen gains in their individual six-year graduation rates. For the entering class of Fall 2001 the graduation rate for the under-represented minority group was 86 percent while the composite graduation rate for Asian American and white students was 93 percent, reducing the gap to 7 percentage points.
Figure 13. Six-Year Graduation Rates by Race/EthnicityFirst-Time Freshmen Entering Fall
0%20%
40%60%
80%100%
1980
1981
1982
1983
1984
1985
1986
1987
1988
1989
1990
1991
1992
1993
1994
1995
1996
1997
1998
1999
2000
2001
Nat. Am. Asian Am. Afr. Am. Hisp. Am. White
The volatility in six-year graduation rates among Native American students can be attributed primarily to the small numbers in each entering class. This has ranged from a low of three students in the Fall 1983 entering class to a high of 25 students entering in Fall 1995. For the Fall 2001 incoming class, Asian American and Hispanic American (9 percent each) students were somewhat lower in utilizing a fifth or sixth year to complete their degrees than African-American (15 percent) or white (6 percent) students (see Figures 14-17).
9

First-Time Freshman Graduation Rates
Figure 14. Four-, Five-, and Six-Year Graduation RatesFirst-Time Freshmen Entering Fall -- African American
0%20%40%60%80%
100%
1980
1985
1990
1991
1992
1993
1994
1995
1996
1997
1998
1999
2000
2001
Perc
ent W
ithin
G
radu
ated
4 years 5 years 6 years
Figure 15. Four-, Five-, and Six-Year Graduation Rates
First-Time Freshmen Entering Fall -- Hispanic American
0%20%40%60%80%
100%
1980
1985
1990
1991
1992
1993
1994
1995
1996
1997
1998
1999
2000
2001
Perc
ent W
ithin
G
radu
ated
4 years 5 years 6 years
Figure 16. Four-, Five-, and Six-Year Graduation RatesFirst-Time Freshmen Entering Fall -- Asian American
0%20%40%60%80%
100%
1980
1985
1990
1991
1992
1993
1994
1995
1996
1997
1998
1999
2000
2001
Perc
ent W
ithin
G
radu
ated
4 years 5 years 6 years
Figure 17. Four-, Five-, and Six-Year Graduation Rates
First-Time Freshmen Entering Fall -- White
0%20%40%60%80%
100%
1980
1985
1990
1991
1992
1993
1994
1995
1996
1997
1998
1999
2000
2001
Perc
ent W
ithin
G
radu
ated
4 years 5 years 6 years
10

First-Time Freshman Graduation Rates
Six-year graduation rates for foreign nationals are very similar to the rates for the Asian American and white groups. However, a higher proportion of foreign nationals than all other groups graduated in less than four years. For the cohorts entering in Fall 1990 though Fall 2001, between 11 and 35 percent of the foreign nationals graduated in less than 8 semesters (see Figure 18).
Figure 18. Proportion Graduating in Less Than Four YearsFirst-Time Freshmen Entering Fall -- Foreign Nationals
0%20%40%60%80%
100%
1990
1991
1992
1993
1994
1995
1996
1997
1998
1999
2000
2001
Female and male six-year graduation rates for first-time freshmen entering in the Fall are displayed in Figure 19. This rate has been consistently higher for women who have graduated at between 91 to 95 percent while men have graduated at a rate between 88 and 92 percent. The percentage difference between men and women six-year graduation rates has ranged from 1 percentage point for students entering in Fall 1998 to a high of 4 percentage points for students entering in Fall 1992. First-time freshman women entering in Fall 2001 graduated at 93 percent while men graduated at 91 percent, a gap of 2 percentage points.
Figure 19. Six-Year Graduation Rates by GenderFirst-Time Freshmen Entering in Fall
0%20%40%60%80%
100%
1987
1988
1989
1990
1991
1992
1993
1994
1995
1996
1997
1998
1999
2000
2001
Male Female
This higher graduation rate for women is more pronounced in several of the race/ethnicity groups. A one year snap-shot (see Figure 20) of the first-time freshman entering in Fall 2001 shows women graduated at higher rates than men in the following groups: Hispanic American (11 percentage points), African-American (11 percentage points), Asian American (4
11

First-Time Freshman Graduation Rates
percentage points), and white at 2 percentage points. All of the first-time freshmen Native American women graduated within six-years compared to 78 percent of the Native American men. The only group for men to graduate within six-years higher was foreign nationals at 2 percentage points over women.
Figure 20. Race/Ethnicity by Gender Six-Year Graduation RatesFirst-Time Freshmen Entering Fall 2001
0%
20%
40%
60%
80%
100%
Nat. Am. Asian Am. Afr. Am. Hisp. Am White Foreign
Male Female
OMEA/COSEP Graduation Rates by Race/Ethnicity The Office of Minority Education Affairs/Committee on Special Education Projects (OMEA/COSEP) offers and coordinates a comprehensive network of academic and administrative support services for students. Of the 2,983 first-time freshmen entering in Fall 2001, 16 percent or 482 students participated in OMEA/COSEP programs. The six-year graduation rate for this sub-set of students was 88 percent. As Figure 21 shows, the six-year graduation rates for first-time freshmen entering in Fall 2001 that participated in the programs offered through OMEA/COSEP are equivalent to overall population graduation rates (see Figures 14-17) within the African-American and Hispanic American race/ethnicity groups. Among this Fall 2001 cohort, 82 percent of African-Americans and 72 percent of Hispanic Americans participated in one or more OMEA/COSEP programs.
Figure 21. Six-Year Graduation Rate for OMEA/COSEP ParticipantsFirst-Time Freshmen Entering Fall
0%20%40%60%80%
100%
African Am. Asian Am. Hispanic Am. Other** Total
1990 1991 1992 1993 1994 1995 1996 1997 1998 1999 2000 2001
** Includes American Indian, white, and undeclared race/ethnicity.
12

First-Time Freshman Graduation Rates
Recruited Athletes Graduation Rates Overall, first-time freshmen who were recruited athletes graduated within six-years of matriculation at approximately the same rate as other first-time freshmen. Graduation rates for recruited athletes have fluctuated from 4 percentage points below the overall average in Fall 1996 and Fall 2000 to 2 percentage points above in Fall 1994 (see Figure 22). For first-time freshman recruited athletes entering in Fall 2001, the graduation rate was equal to the University’s overall graduation rate.
Figure 22. Six-Year Graduation Rate for Recruited AthletesFirst-Time Freshmen Entering Fall
0%
20%
40%
60%
80%
100%
1989
1990
1991
1992
1993
1994
1995
1996
1997
1998
1999
2000
2001
Athletes CU Total
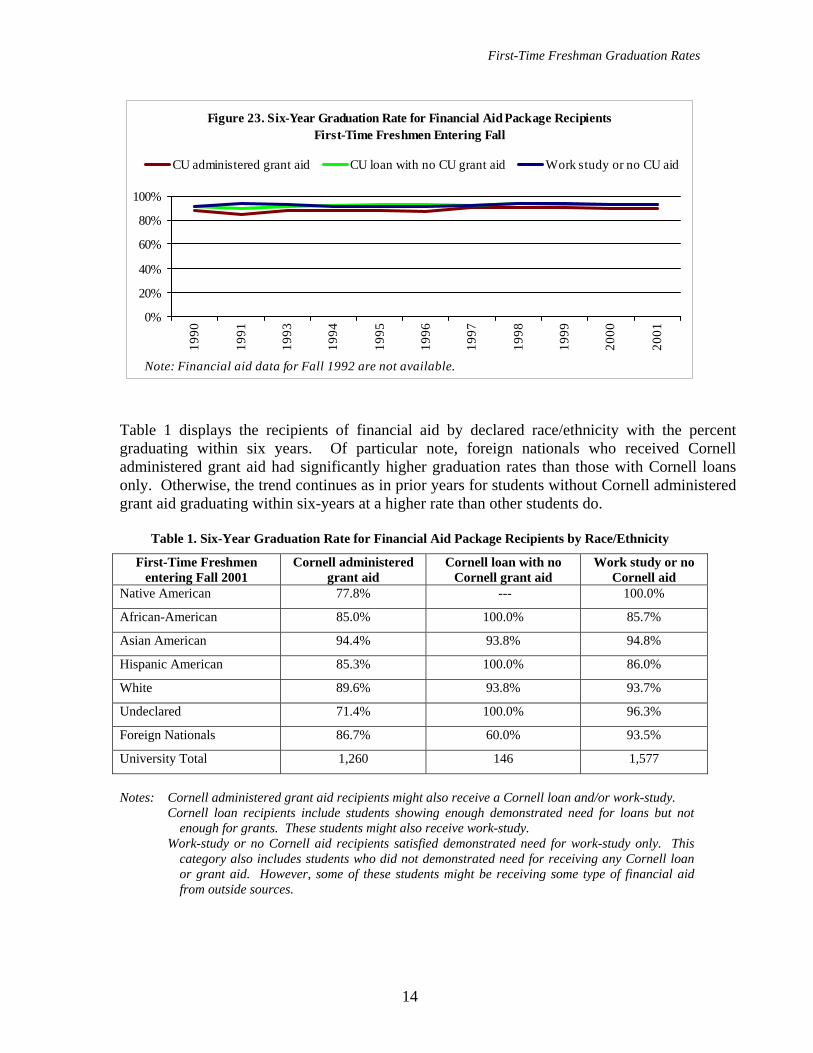
Financial Aid Package Recipients Graduation Rates Cornell operates a “need-blind” admissions policy, which ensures that all admissions decisions are made without regard to the financial circumstances of applicants. As a companion practice, Cornell provides only need based financial aid, meaning the institution is committed to providing students who demonstrate need with the financial support necessary to complete their undergraduate program. Financial aid programs provide funds to improve access opportunities for needy students and to lower the absolute cost for some through grants. Cornell financial aid is packaged such that students receiving Cornell administered grant aid typically come from families with the lowest income and considered most needy. Conversely, students receiving only work-study or no Cornell aid have comparatively greater family wealth and are less needy. Figure 23 displays the percentage of students who obtained a degree within six years of matriculating by the type of Cornell financial aid package received. Students receiving Cornell administered grants graduated at slightly lower rates than other financial aid recipients; students entering in Fall 2001 had six-year graduation rate of 90 percent. In contrast, first-time freshmen entering in Fall 2001 who did not receive any Cornell grant or loan packages graduated within the six-year window at the same rate as those who received Cornell loans without any Cornell administered grant aid at 93 percent.
13
First-Time Freshman Graduation Rates
Figure 23. Six-Year Graduation Rate for Financial Aid Package RecipientsFirst-Time Freshmen Entering Fall
0%
20%
40%
60%
80%
100%19
90
1991
1993
1994
1995
1996
1997
1998
1999
2000
2001
CU administered grant aid CU loan with no CU grant aid Work study or no CU aid
Note: Financial aid data for Fall 1992 are not available.
Table 1 displays the recipients of financial aid by declared race/ethnicity with the percent graduating within six years. Of particular note, foreign nationals who received Cornell administered grant aid had significantly higher graduation rates than those with Cornell loans only. Otherwise, the trend continues as in prior years for students without Cornell administered grant aid graduating within six-years at a higher rate than other students do.
Table 1. Six-Year Graduation Rate for Financial Aid Package Recipients by Race/Ethnicity
First-Time Freshmen entering Fall 2001
Cornell administered grant aid
Cornell loan with no Cornell grant aid
Work study or no Cornell aid
Native American 77.8% --- 100.0%
African-American 85.0% 100.0% 85.7%
Asian American 94.4% 93.8% 94.8%
Hispanic American 85.3% 100.0% 86.0%
White 89.6% 93.8% 93.7%
Undeclared 71.4% 100.0% 96.3%
Foreign Nationals 86.7% 60.0% 93.5%
University Total 1,260 146 1,577
Notes: Cornell administered grant aid recipients might also receive a Cornell loan and/or work-study. Cornell loan recipients include students showing enough demonstrated need for loans but not
enough for grants. These students might also receive work-study. Work-study or no Cornell aid recipients satisfied demonstrated need for work-study only. This
category also includes students who did not demonstrated need for receiving any Cornell loan or grant aid. However, some of these students might be receiving some type of financial aid from outside sources.
14
First-Time Freshman Graduation Rates
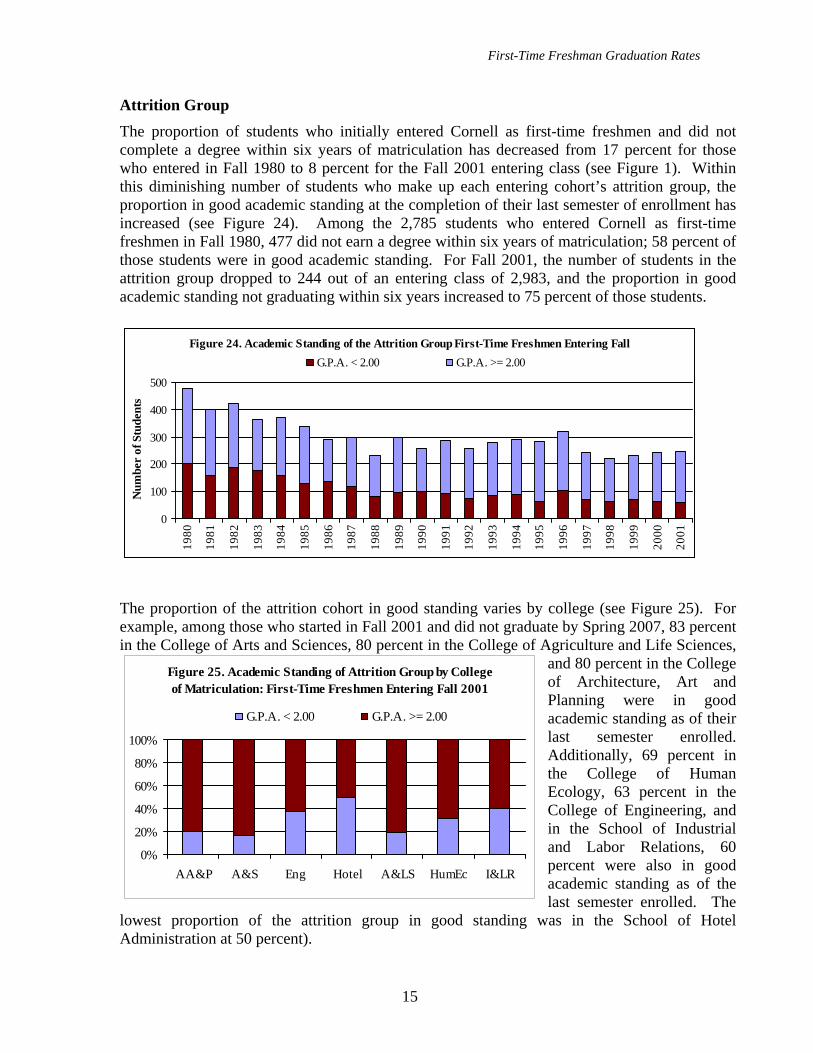
Attrition Group The proportion of students who initially entered Cornell as first-time freshmen and did not complete a degree within six years of matriculation has decreased from 17 percent for those who entered in Fall 1980 to 8 percent for the Fall 2001 entering class (see Figure 1). Within this diminishing number of students who make up each entering cohort’s attrition group, the proportion in good academic standing at the completion of their last semester of enrollment has increased (see Figure 24). Among the 2,785 students who entered Cornell as first-time freshmen in Fall 1980, 477 did not earn a degree within six years of matriculation; 58 percent of those students were in good academic standing. For Fall 2001, the number of students in the attrition group dropped to 244 out of an entering class of 2,983, and the proportion in good academic standing not graduating within six years increased to 75 percent of those students.
Figure 24. Academic Standing of the Attrition Group First-Time Freshmen Entering Fall
0
100
200
300
400
500
1980
1981
1982
1983
1984
1985
1986
1987
1988
1989
1990
1991
1992
1993
1994
1995
1996
1997
1998
1999
2000
2001
Num
ber
of S
tude
nts
G.P.A. < 2.00 G.P.A. >= 2.00
Figure 25. Academic Standing of Attrition Group by College of Matriculation: First-Time Freshmen Entering Fall 2001
0%
20%
40%
60%
80%
100%
AA&P A&S Eng Hotel A&LS HumEc I&LR
G.P.A. < 2.00 G.P.A. >= 2.00
The proportion of the attrition cohort in good standing varies by college (see Figure 25). For example, among those who started in Fall 2001 and did not graduate by Spring 2007, 83 percent in the College of Arts and Sciences, 80 percent in the College of Agriculture and Life Sciences,
and 80 percent in the College of Architecture, Art and Planning were in good academic standing as of their last semester enrolled. Additionally, 69 percent in the College of Human Ecology, 63 percent in the College of Engineering, and in the School of Industrial and Labor Relations, 60 percent were also in good academic standing as of the last semester enrolled. The
lowest proportion of the attrition group in good standing was in the School of Hotel Administration at 50 percent).
15

First-Time Freshman Graduation Rates
There are also differences in the academic standing of this attrition group by race, as displayed in Figure 26. For the first-time freshmen entering in Fall 2001, about a third or less of the Asian American, African-American and white attrition groups had a final G.P.A of less than 2.0 (a “C” average). For Hispanic American students, the proportion of the attrition group with a G.P.A. of less than 2.0 has ranged from a high of 46 percent for the Fall 1991 entering class to a low of 12.5 percent for the Fall 1997 entering class. The proportion of African-American students in the attrition group with a G.P.A. of less than 2.0 had fallen from 73 percent for the Fall 1980 entering class to 35 percent for the Fall 2001 entering class.
Figure 26. Proportion of Attrition Group with G.P.A < 2.00 by Race/EthnicityFirst-Time Freshmen Entering Fall 1980 and Fall 1990 through Fall 2001
0%20%40%
60%80%
100%
1980
1990
1991
1992
1993
1994
1995
1996
1997
1998
1999
2000
2001
African Am. Asian Am Hispanic Am White
Additional information about the status of individuals who were part of the attrition groups for the entering classes of Fall 2000 and Fall 2001 is provided below. Table 2 shows a little over a quarter (60 of 241 students) of the Fall 2000 attrition group was required to leave or withdraw from Cornell. Over half of all the individuals in this attrition cohort took a non-required leave or withdrawal (149 of 241 students). It is noteworthy that a total of 11 percent of the attrition group either earned a Cornell degree after the six-year study window (18 individuals) or are still currently enrolled as undergraduates at Cornell (9 individuals).
Table 2. Categories of Attrition Group, First-Time Freshmen Entering Fall 2000
Reason AA&P A&S Eng Hotel A&LS HumEc I&LR Total Graduated After Six-Year Window From Cornell 2 5 6 2 3 --- --- 18
Registered as of Fall 2006 at Cornell 2 1 2 1 2 1 --- 9 Leave
Medical 1 19 7 1 5 2 --- 35 Required 3 17 9 1 2 --- 4 36 Voluntary 2 17 10 4 12 1 1 48
Withdrawal Required 2 --- 12 5 4 6 --- 29 Voluntary 3 18 10 1 10 --- 2 44
Other/Unknown 9 5 4 1 2 --- 1 22 Total Attrition Group 25 82 60 16 40 10 8 241
16

First-Time Freshman Graduation Rates
The figures for the 2001 attrition cohort are largely similar: one quarter (62 of 244 students) were required to leave or withdraw from Cornell (see Table 3). Close to two-thirds of the total individuals in this attrition cohort took a non-required leave or withdrawal (163 of 244 students). A total of 8 percent of the attrition group either earned a Cornell degree after the six-year study window (3 individuals) or are still currently registered as undergraduates (16 individuals).
Table 3. Categories of Attrition Group, First-Time Freshmen Entering Fall 2001
Reason AA&P A&S Eng Hotel A&LS HumEc I&LR Total Graduated After Six-Year Window From Cornell 1 1 1 --- --- --- --- 3
Currently Registered at Cornell 1 8 4 2 1 --- --- 16 Pending B.Arch or B.F.A. Portfolio 20 --- --- --- --- --- --- 20 Leave
Medical --- 13 8 2 3 2 --- 28 Required 6 9 2 4 3 --- 5 29 Voluntary 3 24 5 1 13 1 2 49
Withdrawal Required 3 1 17 3 2 7 --- 33 Voluntary 4 15 5 1 12 6 2 45
Other/Unknown 2 7 1 3 7 --- 1 21 Total Attrition Group 40 78 43 16 41 16 10 244
Entering SAT scores do not play a significant role in explaining why students did not earn a Cornell degree within six years of matriculating (see Table 4). In the most recent years, students entering with SAT scores above the Cornell median were slightly more likely to graduate within six years than those students entering with in the lower SAT quartile. However, the difference is modest in size: about 7 percent of students with “high” SAT scores, as compared to about 10 percent of students with SAT scores in the lower quartile of Cornell students. The association between SAT score and attrition was even weaker for those first-time freshmen entering in Fall 1993 and Fall 1994.
Table 4. Percentage by SAT Combined Scores Quartiles Who Did Not Graduate Within Six Years First-Time Freshmen Entering Fall
SAT Quartiles
Fall 1990
Fall 1991
Fall 1992
Fall 1993
Fall 1994
Fall 1995
Fall 1996
Fall 1997
Fall 1998
Fall 1999
Fall 2000
Fall 2001
0% - 24% 13.0% 11.7% 9.1% 9.6% 13.1% 12.9% 13.7% 10.7% 8.5% 9.2% 8.5% 10.2%25% - 49% 8.4% 10.0% 8.9% 8.9% 8.7% 8.1% 9.6% 6.7% 6.6% 6.9% 7.6% 8.4%50% - 74% 6.6% 8.5% 8.5% 8.4% 7.4% 7.5% 8.6% 6.3% 7.5% 6.1% 7.9% 6.9%
75% - 100% 8.5% 8.5% 8.9% 8.3% 9.5% 8.6% 9.0% 8.6% 6.4% 7.0% 7.0% 6.8%
In reviewing whether the geographic origin of students enrolling is associated with their likelihood of graduating, Table 5 indicates a slightly greater chance of not graduating for U.S. citizens/permanent residents attending from greater distances. Students who matriculated from
17

First-Time Freshman Graduation Rates
New York, New England, the Middle Atlantic states, and outside the United States were somewhat more likely to earn a degree within six years than those students from the remaining states and U.S. possessions. While the association between geographic origin and graduation status is statistically significant, the degree of association is small enough not to cause concern given the overriding institutional commitment to enrolling a geographically diverse class.
Table 5. Percentage by Geographic Admit Region Who Did Not Graduate Within Six Years First-Time Freshmen Entering Fall
Admit Region Fall 1990
Fall 1991
Fall 1992
Fall1992
Fall1993
Fall1994
Fall 1995
Fall 1996
Fall 1997
Fall 1998
Fall 1999
Fall 2000
Fall 2001
New York 7.2% 8.2% 7.9% 7.9% 7.1% 7.7% 7.0% 8.7% 7.2% 6.6% 6.0% 7.6% 7.1%New England/ Middle Atlantic 8.6% 8.3% 7.8% 7.8% 8.9% 9.5% 8.2% 10.6% 7.1% 6.4% 7.9% 7.6% 8.1%Other U.S. 12.7%13.3%12.2%12.2%11.3%15.0% 13.8% 12.5% 9.8% 9.0% 8.7% 9.4% 9.0%Foreign Citizens 11.9% 9.2% 7.3% 7.3% 8.3% 8.4% 9.1% 9.1% 9.7% 11.0% 7.7% 9.0% 6.7% Students who have not graduated within six years sometimes go onto graduate at Cornell later, or graduate from another institution. Of the 244 students in the Fall 2001 attrition cohort, 3 students have since obtained a degree from Cornell after the six-year mark, 16 are currently enrolled at Cornell, and another 20 are pending B.Arch or B.F.A. portfolio requirements. Data from the National Student Clearinghouse indicate an addition 93 students have either obtained their bachelor’s degree from – or are currently enrolled at – another 4-year institution. These figures imply that only 112 students (or 46 percent of the attrition cohort) are neither already degree recipients nor actively making progress towards their degree.
Figure 27. Attrition Group Other StatusFirst-Time Freshmen Entering Fall 2001
0
50
100
150
Gra
d C
U >
6yrs
Gra
d O
ther
Inst
itutio
n
Enro
lled
CU
Enro
lled
Oth
erIn
stitu
tion
Pend
ing
B.A
rch/
B.F
.A.
Tota
l Attr
ition
Num
ber
of S
tude
nts
18

First-Time Freshman Graduation Rates
19
Inter-Institutional Comparisons Starting with first-time freshmen entering in Fall 1991, the Integrated Postsecondary Exchange Data System (IPEDS) has collected graduation rate information as a federal requirement. Table 6 displays reported graduation rates for Cornell and fifteen institutions in its common application and admission overlap group.
Table 6. Six-Year Graduation Rates for Cornell and Overlap Group: First-Time Freshmen Entering in Fall and Graduating Before September of Sixth Year
Institution
Fall 1991
Cohort
Fall 1992
Cohort
Fall 1993
Cohort
Fall 1994
Cohort
Fall 1995
Cohort
Fall 1996
Cohort
Fall 1997
Cohort
Fall 1998
Cohort
Fall 1999
Cohort
Fall 2000
CohortHarvard 97% 97% 97% 96% 97% 98% 98% 98% 98% 98% Princeton 96% 95% 96% 97% 97% 97% 97% 97% 98% 97% Yale 96% 94% 95% 95% 94% 95% 96% 96% 97% 96% Stanford 93% 93% 91% 93% 93% 93% 94% 95% 95% 95% U Penn 89% 90% 89% 91% 92% 92% 92% 94% 94% 94% Brown 92% 93% 93% 94% 94% 95% 96% 96% 95% 94% Dartmouth 94% 94% 94% 92% 95% 95% 95% 96% 94% 94% Duke 92% 93% 92% 93% 91% 93% 92% 94% 93% 94% Columbia 87% 89% 87% 87% 89% 92% 92% 93% 92% 93% MIT 89% 92% 91% 92% 92% 91% 92% 92% 94% 93% Northwestern 90% 91% 92% 92% 92% 93% 93% 92% 93% 93% Johns Hopkins 89% 88% 87% 85% 87% 88% 88% 88% 88% 92% U Virginia, Main 92% 92% 91% 91% 92% 92% 92% 92% 93% 92% Cornell 90% 91% 91% 90% 91% 90% 92% 92% 93% 92% U Michigan, Ann Arbor 82% 83% 82% 82% 83% 84% 85% 87% 87% 87% Binghamton 79% 82% 81% 82% 81% 79% 80% 78% 77% 78% Note: Institutions sorted in descending order by first-time freshmen entering Fall 2000 graduation rate.
Source: IPEDS Graduation Rate Survey