first results from the meg/re12 experiment at psi
DESCRIPTION
First results from the MEG/RE12 experiment at PSI. A.M. Baldini 29 sep 2009. Hep-ex:0908.2594v1 18 Aug 2009. Most recent m + e + g Experiments. Two orders of magnitude improvement tough experimental challenge! But - PowerPoint PPT PresentationTRANSCRIPT
First results from the MEG/RE12 experiment at PSI
A.M. Baldini 29 sep 2009 Hep-ex:0908.2594v1 18 Aug 2009

2
Most recent + e+ Experiments
Lab. Year Upper limit Experiment or Auth.
PSI 1977 < 1.0 10-9 A. Van der Schaaf et al.
TRIUMF 1977 < 3.6 10-9 P. Depommier et al.
LANL 1979 < 1.7 10-10 W.W. Kinnison et al.
LANL 1986 < 4.9 10-11 Crystal Box
LANL 1999 < 1.2 10-11 MEGA
PSI ~2011 ~ 10-13 MEG
Two orders of magnitude improvement tough experimental challenge! But
several SUSY GUT and SUSY see-saw models predict BRs at the reach of
MEG
3
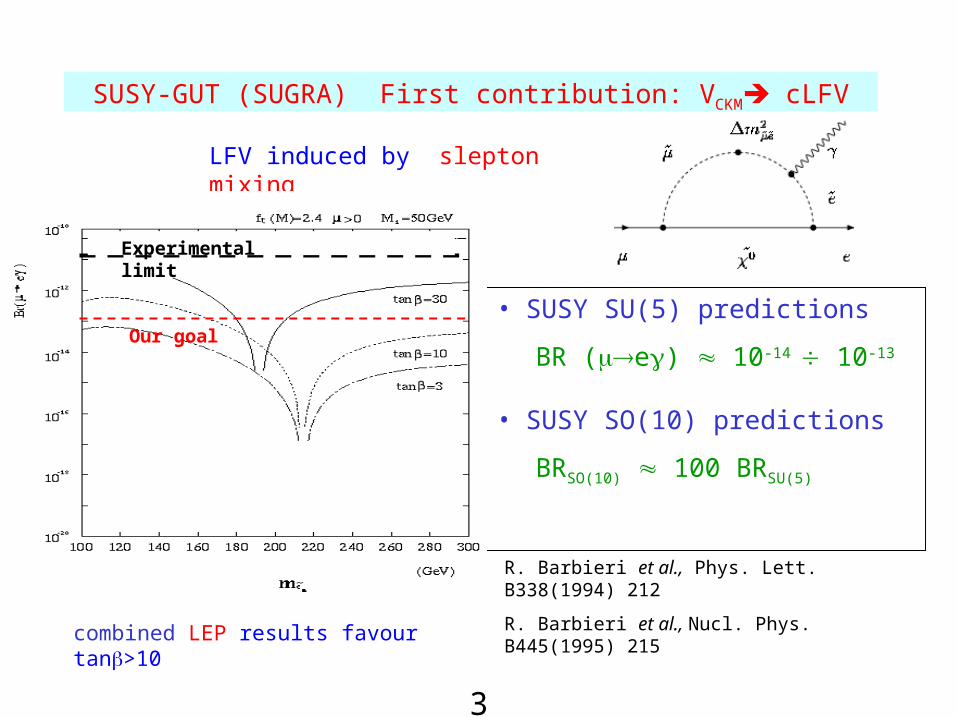
SUSY-GUT (SUGRA) First contribution: VCKM cLFV
• SUSY SU(5) predictions
BR (e) 10-14 10-
13
• SUSY SO(10) predictions
BRSO(10) 100 BRSU(5) R. Barbieri et al., Phys. Lett. B338(1994) 212
R. Barbieri et al., Nucl. Phys. B445(1995) 215
LFV induced by slepton mixing
Our goal
Experimental limit
combined LEP results favour tan>10

4
SO10

5
Our goal
Experimental limit
VPMNS ( oscillationscLFV
J. Hisano, N. Nomura, Phys. Rev. D59 (1999)
Independent contribution to slepton mixing from masses (see-saw model): V less known tan()=3
0
tan()=1
After SNO After Kamland
-5410R in the Standard Model !!If it is seen it is not SM!

6
Signal and background
e+ +
e = 180°
Ee = E = 52.8 MeV
Te = T
signal e
background
physical
e
e+ +
accidental
e e
ee
eZ eZ
e+ +

7
The sensitivity is limited by the accidental background
2phys.b. RnRnRn μacc.b.μμsig , ,
2eγeγ ΔΔ θt 2
γe ΔΔ EE accBR
Integral on the detector resolutions of the Michel and radiative decay spectra
Effective BRback (nback/R)
The n. of acc. backg events (nacc.b.) depends quadratically on the muon rateand on how well we measure the experimental quantities:
e- relative timing and angle, positron and photon energy
μR

8
Required Performances
Exp./Lab Year Ee/Ee
(%)
E/E
(%)
te (ns)
e
(mrad)
Stop rate
(s-1)
Duty cyc.(%)
BR
(90% CL)
SIN 1977 8.7 9.3 1.4 - 5 x 10⁵ 100 3.6 x 10⁻⁹
TRIUMF 1977 10 8.7 6.7 - 2 x 10⁵ 100 1 x 10⁻⁹
LANL 1979 8.8 8 1.9 37 2.4 x 10⁵ 6.4 1.7 x 10⁻¹⁰
Crystal Box 1986 8 8 1.3 87 4 x 10⁵ (6..9) 4.9 x 10⁻¹¹
MEGA 1999 1.2 4.5 1.6 17 2.5 x 10⁸ (6..7) 1.2 x 10⁻¹¹
MEG 2011 0.8 4 0.15 19 2.5 x 10⁷ 100 1 x 10-13
FWHM
BRacc.b. 2 10-14 and BRphys.b. 0.1 BRacc.b. with the following resolutions
Need of a DC muon beam
BR (e) 10-13 reachable

9
Experimental method
1m
e+
Liq. Xe Scin tilla tionDetector
Drift Cham ber
Liq. Xe Scin tilla tionDetector
e+
Tim ing Counter
Stopping TargetThin S uperconducting Coil
M uon Beam
Drift Cham ber
Detector outline1. Stopped beam of 3 107
/sec in a 150 m target
2. Solenoid spectrometer & drift chambers for e+ momentum
3. Scintillation counters for e+ timing
4. Liquid Xenon calorimeter for detection (scintillation)
• Method proposed in 1998: PSI-RR-99-05: 10-14 possibility
• MEG proposal: september 2002: 10-13 goal: A. Baldini and T. Mori spokespersons: Italy, Japan, Switzerland, Russia

10
Detector Construction
SwitzerlandSwitzerlandDrift ChambersBeam LineDAQ
JapanJapanLXe Calorimeter, Spectrometer’s magnet
RussiaRussiaLXe TestsBeam line
ItalyItalye+ counter Trigger LXe Calorimeter
USA(UCI)USA(UCI)Calibrations/Target/DC pressure system

11
Next slides...
1. The PSI E5 beamline
2. The Positron spectrometer
3. The Liquid Xenon calorimeter
4. DAQ
5. The 2008 run
6. Future

12
1) The PSI E5 DC beam
Primary proton beam
• 1.8 mA of 590 MeV/c protons (most intense DC beam in the world)
• 29 MeV/c muons from decay of stop at rest: fully polarized
+
Particles intensity as a function of the selected momentum

13
Beam studies
Optimization of the beam elements:
•Wien filter for /e separation
• Degrader to reduce the momentum stopping in a 150 m CH2 target
• Solenoid to couple beam with COBRA spectrometer
Results (4 cm target): Z-version
• R (total) 1.3*108 +/s• R (after W.filter & Coll.) 1.1*108 +/s• R (stop in target) 6*107 +/s• Beam spot (target) 10 mm /e separation (at collimator) 7.5 (12 cm)
108 /s could be stopped in the target but only 3x10⁷ are used because of accidental background

14
2) The positron spectrometer: COBRA spectrometer
Gradient field Uniform field
COnstant Bending RAdius (COBRA) spectrometer
• Constant bending radius independent of emission angles
• High pT positrons quickly swept out
Gradient field Uniform field

15
The magnet
• Bc = 1.26T current = 359A• Five coils with three different diameters • Compensation coils to suppress the stray field around the LXe detector• High-strength aluminum stabilized superconductor
thin magnet (1.46 cm Aluminum, 0.2 X0)

16
Gradient field

17
The drift chambers
• 16 chamber sectors aligned radially with 10°intervals
• Two staggered arrays of drift cells• Chamber gas: He-C2H6 mixture• Vernier pattern to measure z-
position made of 15 m kapton foils
(X,Y) ~200 m (drift time) (Z) ~ 300 m (charge divisionvernier strips)
goals

18
2 10-3 X0 along positrons trajectory

19
The Timing Counter
• One (outer) layer of scintillator read by PMTs : timing• One inner layer of scintillating fibers read by APDs: trigger (the long. Position
is needed for a fast estimate of the positron direction)•Goal time~ 40 psec (100 ps FWHM)
BC404
5 x 5 mm2

20
TC Final Design
• A PLASTIC SUPPORT STRUCTURE ARRANGES THESCINTILLATOR BARS AS REQUESTED
• THE BARS ARE GLUED ONTOTHE SUPPORT
• INTERFACE ELEMENTS ARE GLUED ONTO THE BARS AND SUPPORT THEFIBRES
• FIBRES ARE GLUED AS WELL
• TEMPORARY ALUMINIUM BEAMS ARE USED TO HANDLE THE DETECTOR DURING INSTALLATION
• PTFE SLIDERS WILL ENSUREA SMOOTH MOTION ALONG THE RAILS
PM-Scintillator Coupler
Scintillator Housing
Scintillator Slab
Main Support
Divider Board
PM
APD
APD F.E. BoardFibers
APD Cooled Support
21

22
• 800 l of Liquid Xe
• 848 PMT immersed in LXe
• Only scintillation light
• High luminosity
• Unsegmented volume
3) The Liquid Xe calorimeter
Liq. Xe
H.V.
Vacuum
for thermal insulation
Al Honeycombwindow
PMT
Refrigerator
Cooling pipe
Signals
fillerPlastic
1.5m
Experimental
checkIn a Large Prototype

23
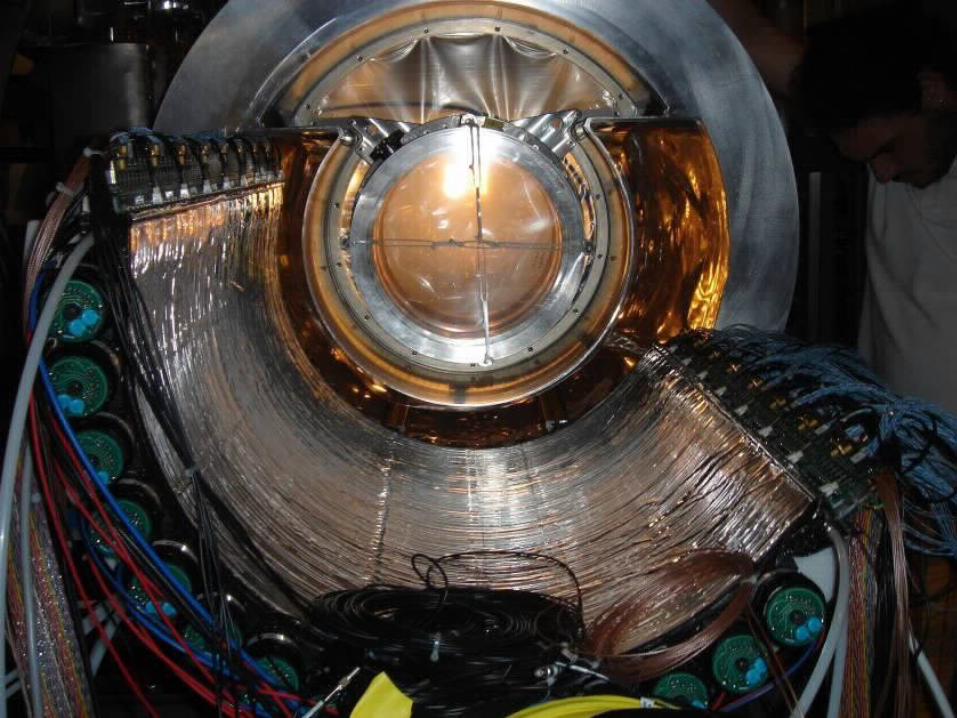
The liquid xenon calorimeter

24
1st generation R6041Q 2nd generation R9288TB 3rd generation R9288ZA
228 in the LP (2003 CEX and TERAS)
127 in the LP (2004 CEX)
111 In the LP (2004 CEX) Not used yet in the LP
Rb-Sc-Sb
Mn layer to keep surface resistance at low temp.
K-Sc-Sb
Al strip to fit with the dynode pattern to keep surface resistance at low temp.
K-Sc-Sb
Al strip density is doubled.
4% loss of the effective area.
1st compact version
QE~4-6%
Under high rate background,
PMT output reduced by 10
-20% with a time constant of
order of 10min.
Higher QE ~12-14%
Good performance in high rate BG
Still slight reduction of output in very high BG
Higher QE~12-14%
Much better performance in very high BG
PMT development
OK!

New (2009) liquid phase purification system completely
made inside the collaboration (F. Sergiampietri)
Xenon purification
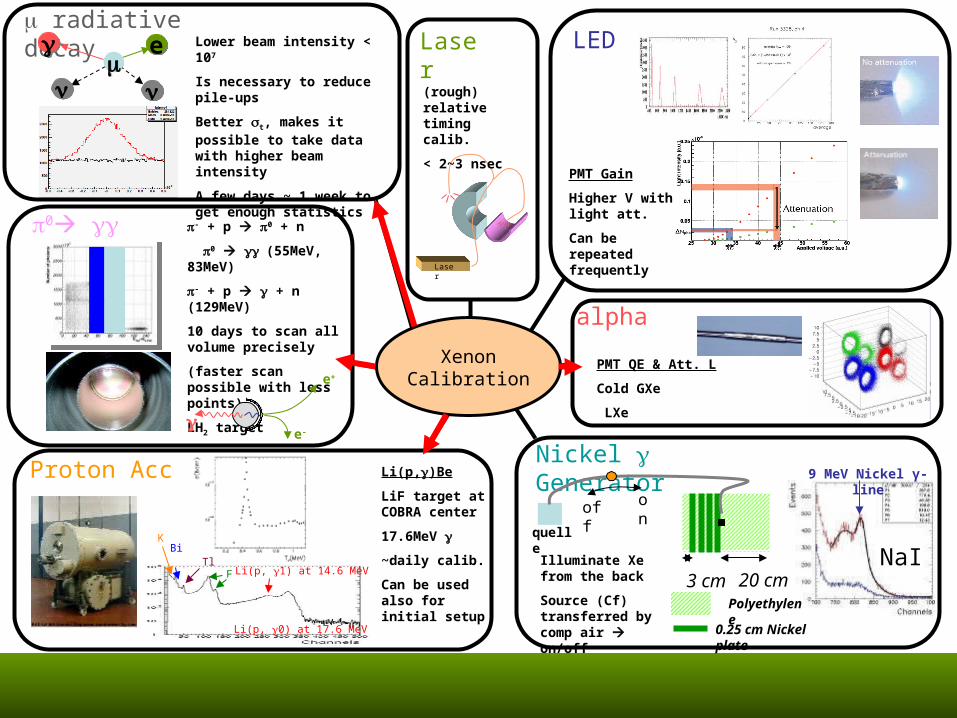
LED
PMT Gain
Higher V with light att.
Can be repeated frequently
alpha
PMT QE & Att. L
Cold GXe
LXe
Laser
Laser
(rough) relative timing calib.
< 2~3 nsec
Nickel Generator 9 MeV Nickel γ-line
NaI
Polyethylene
0.25 cm Nickel plate
3 cm 20 cm
quelle
onoff
Illuminate Xe from the back
Source (Cf) transferred by comp air on/off
Proton Acc Li(p,)Be
LiF target at COBRA center
17.6MeV
~daily calib.
Can be used also for initial setup
KBi
TlF
Li(p, 0) at 17.6 MeV
Li(p, 1) at 14.6 MeV
radiative decay
0 - + p 0 + n
0 (55MeV, 83MeV)
- + p + n (129MeV)
10 days to scan all volume precisely
(faster scan possible with less points)
LH2 target
e+
e-
ee
Lower beam intensity < 107
Is necessary to reduce pile-ups
Better t, makes it possible to take data with higher beam intensity
A few days ~ 1 week to get enough statistics
XenonCalibration

Calorimeter energy Resolution and uniformity at Calorimeter energy Resolution and uniformity at 55 MeV by means of55 MeV by means of
Energy Energy resolution on resolution on the calorimer the calorimer Entrance faceEntrance face
RR = 1.5% = 1.5%FWHM = 4.6 FWHM = 4.6 %%


29
CW beam line

30
LITHIUM - spectrum +FLUORINE - spectrum
LiF target
Automatic insertion/Extraction from
the experiment center (target)

31
4) DAQ: trigger
Beam rate 108 s-
1
Fast LXe energy sum > 45MeV2103 s-1
g interaction point (PMT of max charge)
e+ hit point in timing counter
time correlation – e+ 200 s-1
angular correlation – e+ 20 s-1
•Uses easily quantities:
energy
•Positron- coincidence in time and direction
•Built on a FADC-FPGA architecture
•More complex algorithms implementable
1 board
2 VME 6U
1 VME 9U
Type2
Type2
LXe inner face
(312 PMT)
. .
. 20 boards
20 x 48
Type1Type1
Type1
16
3
Type2
2 boards
. . .
10 boards
10 x 48
Type1Type1
Type1
16
3
LXe lateral faces
(488 PMT: 4 to 1 fan-in)
Type2
1 board
. . .
12 boards
12 x 48
Type1Type1
Type1
16
3
Timing counters
(160 PMT) Type2Type2
2 boards2 x 48
4 x 48
2 x 48
5 Hz in 2008 data taking

On-line Eγ resolution
σ = 3.8%
45 MeV threshold
(@4 from signal)
55 MeV γ-line from π0-decay

DAQ: readout The Domino Principle
Shift RegisterClock
IN
Out
“Time stretcher” GHz MHz“Time stretcher” GHz MHz
Waveform stored
Inverter “Domino” ring chain0.2-2 ns
FADC 33 MHz
Keep Domino wave running in a circular fashion and stop by trigger Domino Ring Sampler (DRS)
Keep Domino wave running in a circular fashion and stop by trigger Domino Ring Sampler (DRS)
Low cost One “oscilloscope” per channel

34
Liquid xenon: waveforms: 2 digitizers
Trigger@100 MHz
DRS2 @ 500 MHz or 2 GHz

35
4) 2008 run
CW Calibration each three days during 2008 run
- First 3 months physics data taking (september-december 2008)
-DCHs instability on part of the chambers after some months of operation: reduction of efficiency to 30% (now 2009 corrected: new HV distribution system )
-Xe LY increase (now 2009 at the nominal value)

2008
2009

In 2009 xenon scintillation waveforms have the right time decay constant: longer for
gammas
2008 2009

2008 run : 1014 muons stopped in target
RD
RD
RD
RD
RD
Programmed beam
shutdowns
RDCooling system
repair
Air test in COBRA
We also took RMD data once/week at reduced beam intensity


DCH DCH resolutions from 2008 dataresolutions from 2008 data
Tracks with two turns in the spectrometer are used to detetrmine theAngular resolutions
=14 mrad =14 mrad =10 mrad=10 mrad
= 25 mrad= 25 mrad = 18 mrad= 18 mrad
The edge of Michel positrons used todetermine momentum resolution
corecore = 374 keV (60%) = 374 keV (60%) tail1tail1 = 1.06 MeV (33%) = 1.06 MeV (33%)
tail2tail2 = 2 MeV (7%) = 2 MeV (7%)

Timing resolutions from 2008 dataTiming resolutions from 2008 data
Intrinsic timing resolution by using positrons hitting several bars
Photon - positron timing resolution by using Radiative muon decay: physical background
Problems with DRS2 : will improve with DRS4
Tps

Dedicated RMD runs at lower thresholds

Blind analysis: EBlind analysis: E vs vs tte e windowwindow

Sidebands (Sidebands (||TeTe| > 1 ns| > 1 ns ) are used to ) are used to MEASUREMEASURE accidental background accidental background
distributionsdistributions
Radiative decay + In flight positron annihilation + Radiative decay + In flight positron annihilation + resolutionresolution + + pileup: pileup: in agreement with MCsin agreement with MCs
Energy

Likelihood analysis: Likelihood analysis: accidentalsaccidentals + + radiative radiative + signal + signal PDFs to fit data + PDFs to fit data +
Feldman CousinsFeldman Cousins
6.140 Sig
N
Best fit in the signal region
Agreement of 3 different analyses

EE vs E vs Ee+e+

MM
SeeS
f
pTCDCptrackDCAf
)MeV|( )|MeV,( )( 5050
Normalization: measured Michel events simultaneous with the normal MEG trigger
keBRNe )(
)( )( )|()|(
)|(
M
S MtrPsctrackATCetrackMichelTRG
eMEGTRG
f
fNk
me
dove:dove:
pre-scaling 10pre-scaling 1077
-Independent of instantaneous beam rate
- Nearly insensitive to positron acceptance and efficiency factors associated with DCH and TC

90% CL limit90% CL limit
• 90 % C.L. NSig 14.6 corresponds to BR(→e) 3.0 x 10⁻¹¹
• Computed sensitivityComputed sensitivity 1.3 x 10⁻¹¹ • Statistical fluctuation 5%Statistical fluctuation 5%• From side bands analysis we expected 0.9 (left) and 2.1 From side bands analysis we expected 0.9 (left) and 2.1
(right) x 10(right) x 10-11-11
• Bad luckBad luck
49
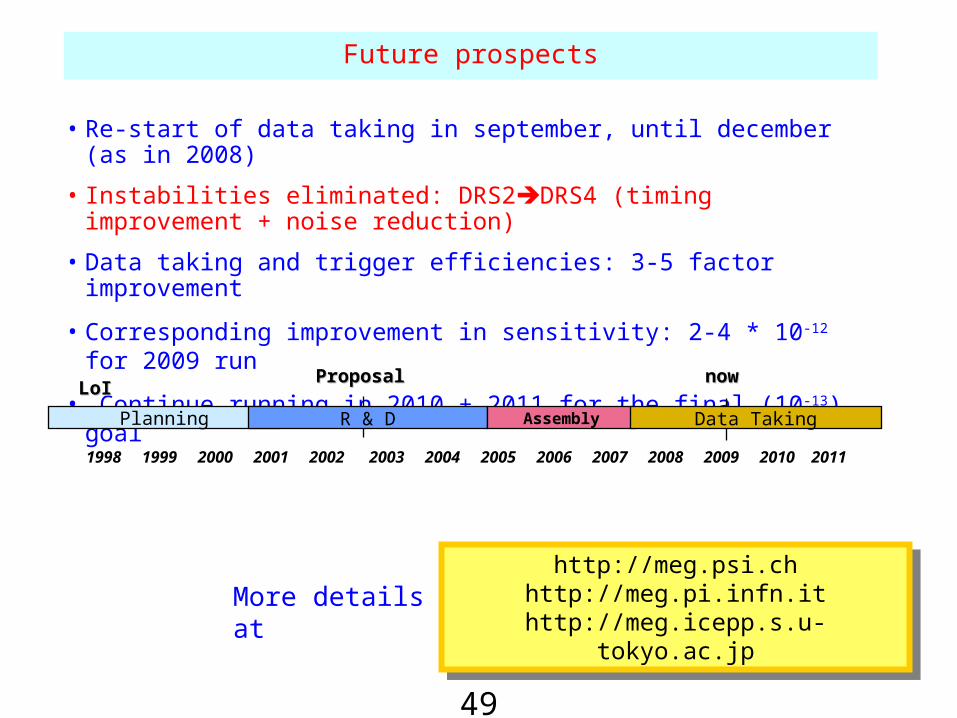
http://meg.psi.chhttp://meg.pi.infn.it
http://meg.icepp.s.u-tokyo.ac.jp
http://meg.psi.chhttp://meg.pi.infn.it
http://meg.icepp.s.u-tokyo.ac.jp
Future prospects
• Re-start of data taking in september, until december (as in 2008)
• Instabilities eliminated: DRS2DRS4 (timing improvement + noise reduction)
• Data taking and trigger efficiencies: 3-5 factor improvement
• Corresponding improvement in sensitivity: 2-4 * 10-12 for 2009 run
• Continue running in 2010 + 2011 for the final (10-13) goal
More details at
1998 1999 2000 2001 2002 2003 2004 2005 2006 2007 2008 2009 2010 2011
Planning R & D Assembly Data Taking
nownowLoILoI
ProposalProposal

50
P
1
D
DDD
D
D
d
PPd
decay) e isotropic (for factor nSuppressio
cos
1
cos
cos
)cos1)(cos1(cos
(Y. Kuno et al., MEG TN1, 1997 and references)
)cos1( : in H.E.
)cos1( : in H.E.
ePee
Pe
D
P
Det. 2Det. 1
• For suitable geometry big factors can be obtained
• This is not the case for MEG (detailed calculations are necessary )
• In some theories (minimal SU(5) model) the positron has a definite helicity P is less effective
e

51
DRS charge vs Trigger WFM Charge (TC)