first quarter 2020 results and 2020 updated …investors.nblmidstream.com/~/media/files/n/noble...dj...
TRANSCRIPT

www.nblmidstream.com NASDAQ: NBLX 1
First Quarter 2020 Results and 2020 Updated Guidance
May 8, 2020
www.nblmidstream.com NASDAQ: NBLX 2
Forward Looking Statements
2
This presentation contains certain “forward-looking statements” within the meaning of federal securities law. Words such as “anticipates”, “believes”, “expects”, “intends”, “will”, “should”,“may”, “estimates”, and similar expressions may be used to identify forward-looking statements. Forward-looking statements are not statements of historical fact and reflect NobleMidstream Partners LP’s (Noble Midstream or the Partnership) current views about future events. No assurances can be given that the forward-looking statements contained in thispresentation will occur as projected and actual results may differ materially from those projected.
Forward-looking statements are based on current expectations, estimates and assumptions that involve a number of risks and uncertainties that could cause actual results to differmaterially from those projected. These risks include, without limitation, our customers’ ability to meet their drilling and development plans, changes in general economic conditions,competitive conditions in the Partnership’s industry, actions taken by third-party operators, gatherers, processors and transporters, the demand for crude oil and natural gas gatheringand processing services, the Partnership’s ability to successfully implement its business plan, the Partnership’s ability to complete internal growth projects on time and on budget, theability of third parties to complete construction of pipelines in which the Partnership holds equity interests on time and on budget, the price and availability of debt and equity, theavailability and price of crude oil and natural gas to the consumer compared to the price of alternative and competing fuels, and other risks inherent in the Partnership’s business,including those described under “Risk Factors” and “Forward-Looking Statements” in the Partnership's most recent Annual Report on Form 10-K and in other reports on we file with theSecurities and Exchange Commission (SEC). These reports are also available from the Partnership’s office or website, www.nblmidstream.com. Forward-looking statements are basedon the estimates and opinions of management at the time the statements are made. Noble Midstream does not assume any obligation to update forward-looking statements shouldcircumstances, management’s estimates, or opinions change.
This presentation also contains certain non-GAAP measures of financial performance that management believes are good tools for internal use and the investment community inevaluating Noble Midstream’s overall financial performance. Please see slide 11 for definitions and reconciliations of the non-GAAP financial measures used in this presentation to themost directly comparable GAAP financial measures.
www.nblmidstream.com NASDAQ: NBLX 3
3
Continued Execution Driving Record Quarterly Results
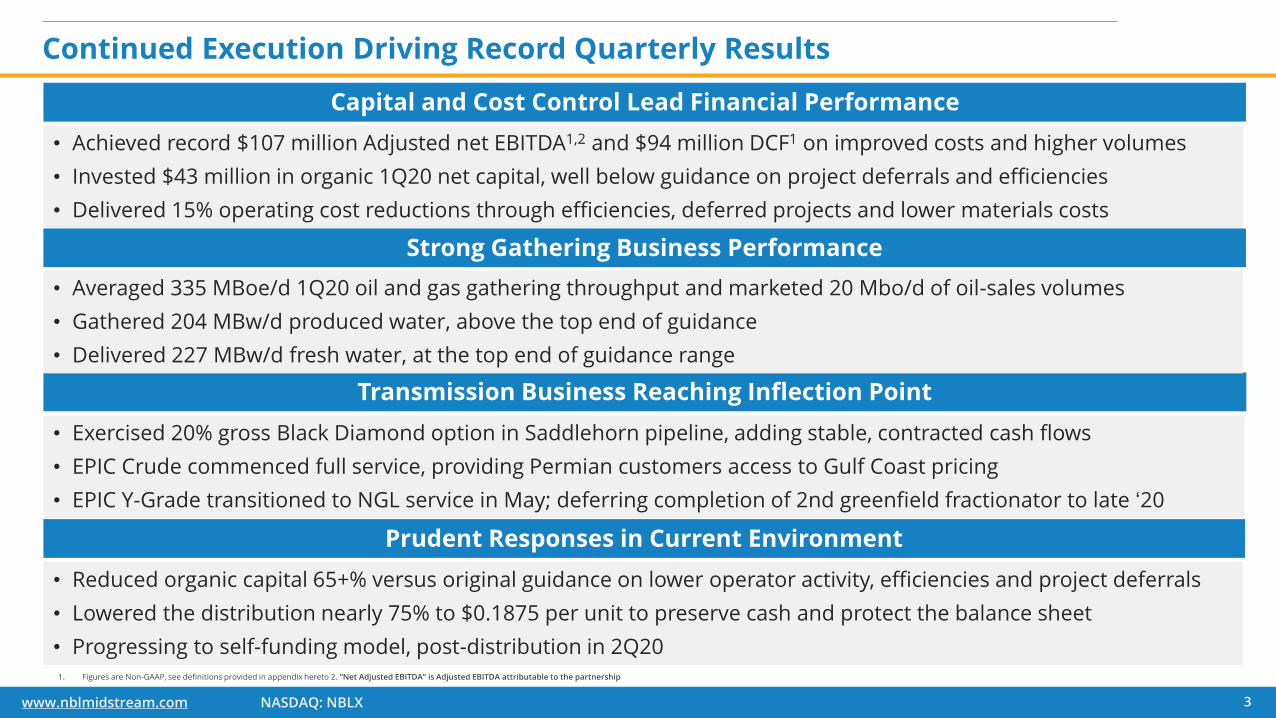
• Achieved record $107 million Adjusted net EBITDA1,2 and $94 million DCF1 on improved costs and higher volumes
• Invested $43 million in organic 1Q20 net capital, well below guidance on project deferrals and efficiencies
• Delivered 15% operating cost reductions through efficiencies, deferred projects and lower materials costs
• Reduced organic capital 65+% versus original guidance on lower operator activity, efficiencies and project deferrals
• Lowered the distribution nearly 75% to $0.1875 per unit to preserve cash and protect the balance sheet
• Progressing to self-funding model, post-distribution in 2Q20
• Exercised 20% gross Black Diamond option in Saddlehorn pipeline, adding stable, contracted cash flows
• EPIC Crude commenced full service, providing Permian customers access to Gulf Coast pricing
• EPIC Y-Grade transitioned to NGL service in May; deferring completion of 2nd greenfield fractionator to late ‘20
Capital and Cost Control Lead Financial Performance
Strong Gathering Business Performance
Transmission Business Reaching Inflection Point
Prudent Responses in Current Environment
1. Figures are Non-GAAP, see definitions provided in appendix hereto 2. “Net Adjusted EBITDA” is Adjusted EBITDA attributable to the partnership
• Averaged 335 MBoe/d 1Q20 oil and gas gathering throughput and marketed 20 Mbo/d of oil-sales volumes
• Gathered 204 MBw/d produced water, above the top end of guidance
• Delivered 227 MBw/d fresh water, at the top end of guidance range

www.nblmidstream.com NASDAQ: NBLX 4
Actuals 1Q20 Guidance1Q19 4Q19 1Q20
Gro
ss V
olu
me
s Oil and Gas Gathered (MBoe/d) 291 355 335 318 - 332
PW Gathered (MBw/d) 162 219 204 180 - 190
FW Delivered (MBw/d) 220 126 227 210 - 230
Fin
an
cia
ls
Adjusted EBITDA ($MM)1,2
63 73 107 94 - 101
DCF ($MM)1
54 65 94 75 - 82
Distribution Coverage Ratio1,3
1.9x 1.2x 5.5x 1.2x - 1.3x
Organic Capex ($MM)4 36 48 43 60 - 70
Equity Investment Capital ($MM) - 105 148 180 - 220
First-Quarter 2020 Volume and Cost Outperformance
1. Figures are Non-GAAP, see definition and reconciliation provided in appendix hereto2. “Net Adjusted EBITDA” is Adjusted EBITDA attributable to the partnership3. Pro-forma for the distribution reduction4. Excludes additions to investments
✓
✓
✓
✓ = Better than the Midpoint of Guidance
✓
✓
✓
✓

www.nblmidstream.com NASDAQ: NBLX 5
Adjusting Cost Structure to Current Environment
Aligning Costs to Current Environment
▪ ~$140 million organic capital reduction from 2020 original guidance
▪ Majority of remaining capital tied to well connections
▪ Ability to capture incremental EBITDA with minimal capital
▪ ~15% operating cost reduction, increasing EBITDA by $15 to $20 million
Driving Further Cash Reductions and Efficiencies in 2020
▪ G&A improvements through executive salary reductions, implementation of a furlough program, and contractor workforce downsizing
▪ Self-funding model creates an opportunity to pay down debt and reduce interest costs
▪ Optimizing facilities for lower customer activity and volumes
▪ Continuing to renegotiate vendor agreements$200
$300
$400
$0
$150
$300
February Guidance Updated 2020 Outlook
Gross Organic Capital Expenditures
25%+ per-well connect cost improvement
Organic Capital Connection Cost ($/well)
$MMConnection
Costs ($K)
Cash cost reductions enable Noble Midstream to self-fund beginning in 2Q20
-$100
-$50
$0
$50
1Q20A 2Q20E 3Q20E 4Q20E
Cash Flow less Total Capital Distributions$MM
Majority of 2020E Equity Investment
Capital spent in 1Q20
Self Funding in 2Q20 and Beyond

www.nblmidstream.com NASDAQ: NBLX 6
Adjusting to Uncertain Times, Revising 2020 Outlook
1. Figures are Non-GAAP; see definition and reconciliation in Appendix hereto2. “Net Adjusted EBITDA” is Adjusted EBITDA attributable to the partnership
Minimal Organic Capital Remaining; Equity Investment Capital Declining
▪ 2020E organic capital budget reduced by 65% with ~$30 million remaining for the year
▪ Equity investment range tightened to reflect completion of EPIC crude mainline and closing of Saddlehorn acquisition
2020 Volume Guidance Suspended on Production Uncertainty
▪ Net Adjusted EBITDA1,2 and DCF scenarios reflect curtailments and conservative JV pipeline forecasts
▪ Leverage and Coverage remain strong even in significant curtailment
2020 Revised Outlook
Evaluating and Preparing for Multiple Scenarios
Upper Range Case Lower Range Case
Moderate (<10 Mboe/d)
curtailments for two months
Significant (>50 MBoe/d)
curtailments through August
Assuming minimal incremental connection activity until early 2021
Net Adjusted EBITDA1,2
Net Debt to 2020 TTM EBITDA¹
$370 - $410 MM
3.9x to 4.3x
2020E DCF Coverage¹
> 4.0x
Net Organic Capital
$60 - $80 MM
Equity Investment Capital
Distributable Cash Flow1
$280 - $310 MM
$240 - $260 MM

www.nblmidstream.com NASDAQ: NBLX 7
Asset and Customer Diversification Differentiates Noble Midstream
Diversified Portfolio with Multiple Cash Flow Drivers
▪ Intermediate and long-haul pipeline startups bolster cash flow quality and provide EBITDA1,2 growth in 2020 and 2021
▪ 60 to 70% joint venture investment volumes are protected by MVCs
▪ 20% of 2020 EBITDA1,2 contracted, including equity investments and fresh water delivery
▪ Pipeline contract tenor provides multi-year cash flow security
High-Quality Customer Base
▪ Strong investment-grade sponsor volume underpins gathering and pipeline dedications
▪ G&P assets backed by strong producers and quality acreage
▪ BB+ average credit rating across gathering and transmission customer base
▪ ~35 customers, reducing exposure to any single operator or shipper
1. Figures are Non-GAAP; see definitions in Appendix 2. Net Adjusted EBITDA is adjusted EBITDA to the Partnership3. As of May 1, 2020
2020E EBITDA1,2 Composition
By Service By Customer By Area
Vs. 100% G&P at
IPO in 2016
Vs. only NBL as
customer at IPO in
2016
Vs. 100% DJ Basin
Activity at IPO in
2016
G&P76%
Pipeline14%
Fresh Water10%
NBL81%
Third Party 19%
DJ76%
Permian24%
~80%Gathering EBITDA from Investment Grade Producers
~40%Transmission EBITDA from Investment Grade Customers
Investment Grade Customer Base3
www.nblmidstream.com NASDAQ: NBLXwww.nblmidstream.com NASDAQ: NBLX
Equity Investment Inflection, Y-Grade Started Up in 2Q20
8
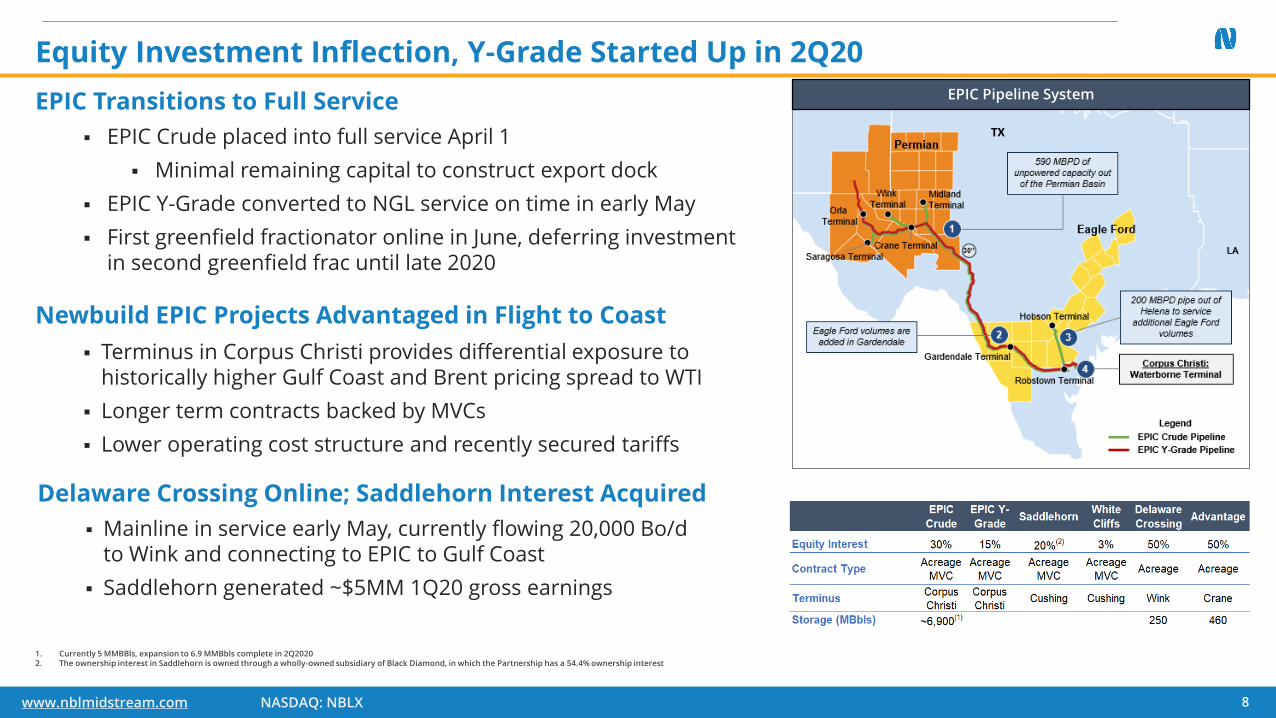
EPIC Transitions to Full Service
▪ EPIC Crude placed into full service April 1
▪ Minimal remaining capital to construct export dock
▪ EPIC Y-Grade converted to NGL service on time in early May
▪ First greenfield fractionator online in June, deferring investment in second greenfield frac until late 2020
Newbuild EPIC Projects Advantaged in Flight to Coast
▪ Terminus in Corpus Christi provides differential exposure to historically higher Gulf Coast and Brent pricing spread to WTI
▪ Longer term contracts backed by MVCs
▪ Lower operating cost structure and recently secured tariffs
EPIC Pipeline System
1. Currently 5 MMBBls, expansion to 6.9 MMBbls complete in 2Q20202. The ownership interest in Saddlehorn is owned through a wholly-owned subsidiary of Black Diamond, in which the Partnership has a 54.4% ownership interest
Delaware Crossing Online; Saddlehorn Interest Acquired
▪ Mainline in service early May, currently flowing 20,000 Bo/d to Wink and connecting to EPIC to Gulf Coast
▪ Saddlehorn generated ~$5MM 1Q20 gross earnings
TX

www.nblmidstream.com NASDAQ: NBLX 9
DJ Basin
▪ ~550,000 core net acre dedication and 15+ customers
▪ 16 additional Mustang connections in 2Q20, all in April
▪ 85% of suspended activity will be on low-cost adjacent section development
▪ 60 MBw/d Fresh Water Delivery MVC ($19 million estimated in 2H20) providing backstop to reduced activity
▪ Gathered first third-party volumes from new customer, Verdad
Delaware Basin
▪ ~120,000 core net acres across 20+ customers
▪ Northern CGF1 supersystem enhances efficiency
▪ Seven well connections in April and then minimal remaining organic capital expected in 2020
▪ Potential for third-party activity to resume 4Q20
1Q19
2Q19
Gathering Segment Supported by Core Acreage and Strong Customers
$0
$125
$250
$375
2018 2019 2020E
EBITDA Capital
$0
$50
$100
$150
2018 2019 2020EEBITDA Capital
CGF Build-Out
Infrastructure Build-Out and Core Acreage Boost Future Project Returns
Pe
rmia
n B
asi
nD
J B
asi
n
$MM
$MM
1. Centralized Gathering Facility

www.nblmidstream.com NASDAQ: NBLX 10
Transitioning to Self-Funding Business Model
▪ 75% distribution reduction preserves approximately $200 million in annual cash flow and accelerates self funding model
▪ Generating excess cash flow after total net capital and distributions starting in 2Q20
▪ Ability to delever and improve liquidity, with incremental cash flow anticipated to reduce debt
Leverage Improving throughout the Year
▪ 4.0x Net Debt to TTM EBITDA1 at 1Q20, $418 million in liquidity
▪ $1.15B revolver stable, not up for redetermination until 2023
▪ Revised outlook well below covenant leverage threshold of 5.0x in 2020
▪ Focused on term loan, addressing mid-year 2021 maturity
Net Debt to 2020E TTM EBITDA1
Distribution Coverage Ratio1
1. Figures are Non-GAAP; see definitions and reconciliation in Appendix hereto
0.0x
2.0x
4.0x
6.0x
2019 2020E Target
3.9x – 4.3x
3.0x
4.1x
0.0x
2.0x
4.0x
6.0x
2019 2020E Target
> 4.0x
>1.5x1.4x
Revised Distribution Policy Improves Leverage and Coverage
Covenant 5.0x
www.nblmidstream.com NASDAQ: NBLX 11
Non-GAAP Financial Measures
11
This presentation includes Adjusted EBITDA, Distributable Cash Flow, Distribution Coverage Ratio, Annualized Leverage Ratio and ROACE, all of which are non-GAAP measures which may be used periodically by management when discussing our financial results with investors and analysts.
We define Adjusted EBITDA as net income before income taxes, net interest expense, depreciation and amortization, transaction expenses, unit-based compensation and certain other items that we do no view as indicative of our ongoing performance. Additionally, Adjusted EBITDA reflects the adjusted earnings impact of our unconsolidated investments by adjusting our equity earnings or losses from our unconsolidated investments to reflect our proportionate share of their EBITDA. Prior period Adjusted EBITDA has been reclassified to conform to the current period presentation.
Adjusted EBITDA is used as a supplemental financial measure by management and by external users of our financial statements, such as investors, industry analysts, lenders and ratings agencies, to assess:• our operating performance as compared to those of other companies in the midstream energy industry, without regard to financing methods, historical cost basis or capital structure;• the ability of our assets to generate sufficient cash flow to make distributions to our partners; • our ability to incur and service debt and fund capital expenditures; • and the viability of acquisitions and other capital expenditure projects and the returns on investment of various investment opportunities.
We define Distributable Cash Flow as Adjusted EBITDA plus distributions received from our unconsolidated investments less our proportionate share of Adjusted EBITDA from unconsolidated investments, estimated maintenance capital expenditures and cash interest paid. Prior period distributable cash flow has been reclassified to conform to the current period presentation.
Distributable Cash Flow is used by management to evaluate our overall performance. Our partnership agreement requires us to distribute all available cash on a quarterly basis, and Distributable Cash Flow is one of the factors used by the board of directors of our general partner to help determine the amount of available cash that is available to our unitholders for a given period. We define Distribution Coverage Ratio as Distributable Cash Flow divided by total distributions declared. The Distribution Coverage Ratio is used by management to illustrate our ability to make our distributions each quarter.
We define ROACE as earnings before interest and taxes divided by (average total assets – average current liabilities). ROACE is used by management to measure the efficiency of the utilization of the capital that we employ.
We define Annualized Leverage Ratio as total debt divided by quarterly adjusted EBITDA attributable to the Partnership, annualized for four quarters. Annualized Leverage Ratio is used by management to assess our ability to incur and service debt and fund capital expenditures.
We believe that the presentation of Adjusted EBITDA, Distributable Cash Flow, Distribution Coverage Ratio, Annualized Leverage Ratio and ROACE provide information useful to investors in assessing our financial condition and results of operations. The GAAP measure most directly comparable to Adjusted EBITDA, Distributable Cash Flow, Distribution Coverage Ratio, Annualized Leverage Ratio and ROACE is Net Income. Adjusted EBITDA, Distributable Cash Flow, Distribution Coverage Ratio, Annualized Leverage Ratio and ROACE should not be considered alternatives to net income or any other measure of financial performance or liquidity presented in accordance with GAAP. Adjusted EBITDA, Distributable Cash Flow, Distribution Coverage Ratio, Annualized Leverage Ratio and ROACE exclude some, but not all, items that affect net income, and these measures may vary from those of other companies. As a result, Adjusted EBITDA, Distributable Cash Flow, Distribution Coverage Ratio, Annualized Leverage Ratio and ROACE as presented herein may not be comparable to similarly titled measures of other companies.
In addition to Net Income, the GAAP measure most directly comparable to Adjusted EBITDA and Distributable Cash Flow is net cash provided by operating activities. Adjusted EBITDA and Distributable Cash Flow should not be considered alternatives to net income, net cash provided by operating activities or any other measure of financial performance or liquidity presented in accordance with GAAP. Due to the forward-looking nature of net cash provided by operating activities, management cannot reliably predict certain of the necessary components of the most directly comparable forward-looking GAAP measures, such as future impairments and future changes in working capital. Accordingly, Noble Midstream is unable to present a quantitative reconciliation of the aforementioned forward-looking non-GAAP financial measures to net cash provided by operating activities. Amounts excluded from these non-GAAP measures in future periods could be significant.

www.nblmidstream.com NASDAQ: NBLX 12
1001 Noble Energy WayHouston, TX 77070
Contact Information
Park Carrere
Investor Relations
281.872.3208