first quarter 2019 update february 6, 2019
TRANSCRIPT

First Quarter 2019 UpdateFebruary 6, 2019

Forward-Looking Statements 1
This release contains forward-looking statements within the meaning of Section 27A of the Securities Act of 1933, as amended, Section 21E of the Securities Exchange Act of1934, as amended, and the Private Securities Litigation Reform Act of 1995. NJR cautions readers that the assumptions forming the basis for forward-looking statements includemany factors that are beyond NJR’s ability to control or estimate precisely, such as estimates of future market conditions and the behavior of other market participants. Wordssuch as “anticipates,” “estimates,” “expects,” “projects,” “may,” “will,” “intends,” “plans,” “believes,” “should” and similar expressions may identify forward-looking statementsand such forward-looking statements are made based upon management’s current expectations, assumptions and beliefs as of this date concerning future developments andtheir potential effect upon NJR. There can be no assurance that future developments will be in accordance with management’s expectations, assumptions and beliefs or that theeffect of future developments on NJR will be those anticipated by management. Forward-looking statements in this release include, but are not limited to, certain statementsregarding NJR’s NFE guidance for fiscal 2019, forecasted contribution of business segments to fiscal 2019 NFE and beyond, future NJNG customer and utility gross margingrowth, future NJR capital expenditures, infrastructure investments, Clean Energy Ventures’ ITC-eligible projects and demand for residential solar, earnings and dividend growth,as well as the ability to close and successfully implement the Adelphia Gateway acquisition, and construct the SRL and PennEast Pipeline projects.
The factors that could cause actual results to differ materially from NJR’s expectations include, but are not limited to, risks associated with our investments in clean energyprojects, including the availability of regulatory and tax incentives, the availability of viable projects, our eligibility for ITCs, the future market for SRECs and electricity prices, andoperational risks related to projects in service; the ability to obtain governmental and regulatory approvals, land-use rights, electric grid connection (in the case of clean energyprojects) and/or financing for the construction, development and operation of our unregulated energy investments, pipeline transportation systems and NJNG and Midstreaminfrastructure projects, including NJ RISE, SRL, PennEast and Adelphia Gateway, in a timely manner; risks associated with acquisitions and the related integration of acquiredassets with our current operations, including our planned Adelphia Gateway acquisition; volatility of natural gas and other commodity prices and their impact on NJNG customerusage, NJNG’s BGSS incentive programs, our Energy Services segment operations and our risk management efforts; the ability to comply with current and future regulatoryrequirements; the level and rate at which NJNG’s costs and expenses are incurred and the extent to which they are approved for recovery from customers through theregulatory process, including through future base rate case filings; the impact of a disallowance of recovery of environmental-related expenditures and other regulatorychanges; the performance of our subsidiaries; operating risks incidental to handling, storing, transporting and providing customers with natural gas; access to adequate suppliesof natural gas and dependence on third-party storage and transportation facilities for natural gas supply; the regulatory and pricing policies of federal and state regulatoryagencies; timing of qualifying for ITCs due to delays or failures to complete planned solar projects and the resulting effect on our effective tax rate and earnings; the results oflegal or administrative proceedings with respect to claims, rates, environmental issues, natural gas cost prudence reviews and other matters; changes in rating agencyrequirements and/or credit ratings and their effect on availability and cost of capital to our company; risks related to cyberattack or failure of information technology systems;the impact of volatility in the equity and credit markets on our access to capital; the impact to the asset values and resulting higher costs and funding obligations of our pensionand post-employment benefit plans as a result of potential downturns in the financial markets, lower discount rates, revised actuarial assumptions or impacts associated withthe Patient Protection and Affordable Care Act; commercial and wholesale credit risks, including the availability of creditworthy customers and counterparties, and liquidity inthe wholesale energy trading market; accounting effects and other risks associated with hedging activities and use of derivatives contracts; the ability to optimize our physicalassets; weather and economic conditions; changes to tax laws and regulations; any potential need to record a valuation allowance for our deferred tax assets; the ability tocomply with debt covenants; demographic changes in NJR’s service territory and their effect on NJR’s customer growth; the impact of natural disasters, terrorist activities andother extreme events on our operations and customers; the costs of compliance with present and future environmental laws, including potential climate change-relatedlegislation; environmental-related and other uncertainties related to litigation or administrative proceedings; risks related to our employee workforce; and risks associated withthe management of our joint ventures and partnerships, and investment in a master limited partnership. The aforementioned factors are detailed in the “Risk Factors” sectionsof our Form 10-K that we filed with the Securities and Exchange Commission (SEC) on November 20, 2018, which is available on the SEC’s Web site at sec.gov. Informationincluded in this release is representative as of today only, and while NJR periodically reassesses material trends and uncertainties affecting NJR’s results of operations andfinancial condition in connection with its preparation of management’s discussion and analysis of results of operations and financial condition contained in its Quarterly andAnnual Reports filed with the SEC, NJR does not, by including this statement, assume any obligation to review or revise any particular forward-looking statement referencedherein in light of future events.
Forward-Looking Statements 2
This presentation includes the non-GAAP measures, NFE and utility gross margin. As an indicator of the Company’s operating performance, these measures should not beconsidered an alternative to, or more meaningful than, GAAP measures, such as cash flows, net income, operating income or earnings per share.
NFE excludes unrealized gains or losses on derivative instruments related to the Company’s unregulated subsidiaries and certain realized gains and losses on derivativeinstruments related to natural gas that has been placed into storage at Energy Services, net of applicable tax adjustments, as described below. Volatility associated with thechange in value of these financial and physical commodity contracts is reported in the income statement in the current period. In order to manage its business, NJR views itsresults without the impacts of the unrealized gains and losses, and certain realized gains and losses, caused by changes in value of these financial instruments and physicalcommodity contracts prior to the completion of the planned transaction because it shows changes in value currently as opposed to when the planned transaction ultimately issettled. An annual estimated effective tax rate is calculated for NFE purposes and any necessary quarterly tax adjustment is applied to CEV, as such adjustment is related to taxcredits generated by CEV.
NJNG’s utility gross margin represents the results of revenues less natural gas costs, sales and other taxes and regulatory rider expenses, which are key components of thecompany’s operations that move in relation to each other. Natural gas costs, sales and other taxes and regulatory rider expense are passed through to customers and therefore,have no effect on gross margin.
Management uses NFE and utility gross margin as supplemental measures to other GAAP results to provide a more complete understanding of the Company’s performance.Management believes these non-GAAP measures are more reflective of the Company’s business model, provide transparency to investors and enable period-to-periodcomparability of financial performance. In providing fiscal 2019 earnings guidance, management is aware that there could be differences between reported GAAP earnings andNFE due to matters such as, but not limited to, the positions of our energy-related derivatives. Management is not able to reasonably estimate the aggregate impact of theseitems on reported earnings and therefore is not able to provide a reconciliation to the corresponding GAAP equivalent for its operating earnings guidance without unreasonableefforts. For a full discussion of our non-GAAP financial measures, please see NJR’s most recent Form 10-K, Item 7. This information has been provided pursuant to therequirements of SEC Regulation G.

NJR Strategic Outlook
Ensure safe and reliable service to customers
Provide growth through investments in regulated and non-regulated
infrastructure projects
Deliver superior performance to customers and shareowners
Infrastructure Investments• Southern Reliability Link• PennEast• Adelphia Gateway
Safety and Reliability• SAFE II• NJ RISE• Southern Reliability Link
Clean Energy• Commercial Solar • Residential Solar
3
Superior Return• Strong, Consistent Shareholder Return• Reliable Dividend Growth
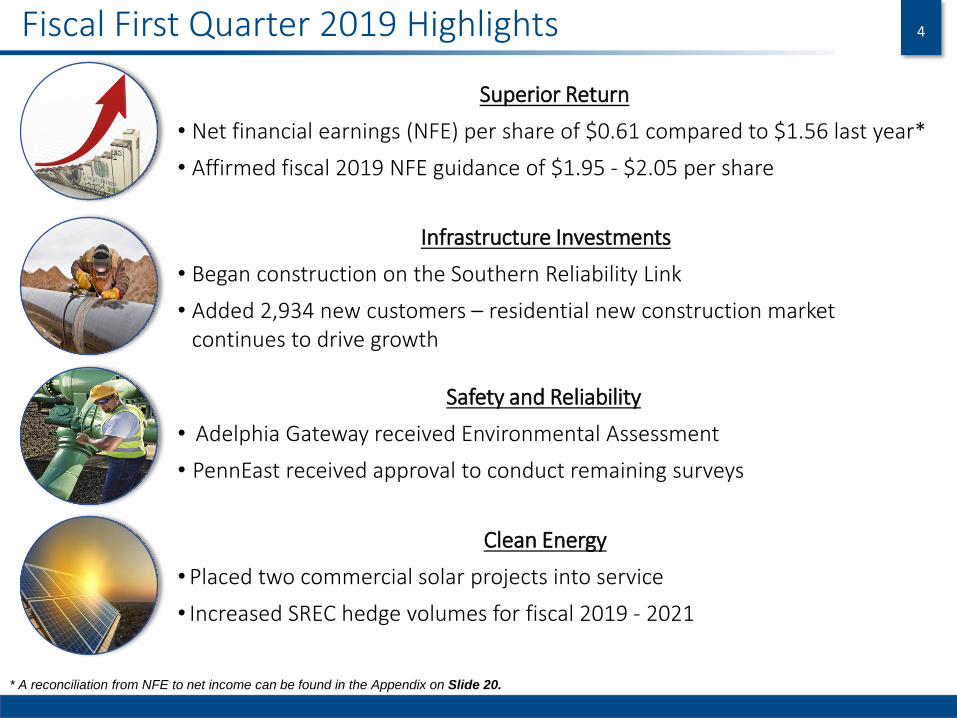
Fiscal First Quarter 2019 Highlights 4
Superior Return
• Net financial earnings (NFE) per share of $0.61 compared to $1.56 last year*
• Affirmed fiscal 2019 NFE guidance of $1.95 - $2.05 per share
Safety and Reliability
• Adelphia Gateway received Environmental Assessment
• PennEast received approval to conduct remaining surveys
Clean Energy
•Placed two commercial solar projects into service
• Increased SREC hedge volumes for fiscal 2019 - 2021
Infrastructure Investments
• Began construction on the Southern Reliability Link
• Added 2,934 new customers – residential new construction market continues to drive growth
* A reconciliation from NFE to net income can be found in the Appendix on Slide 20.
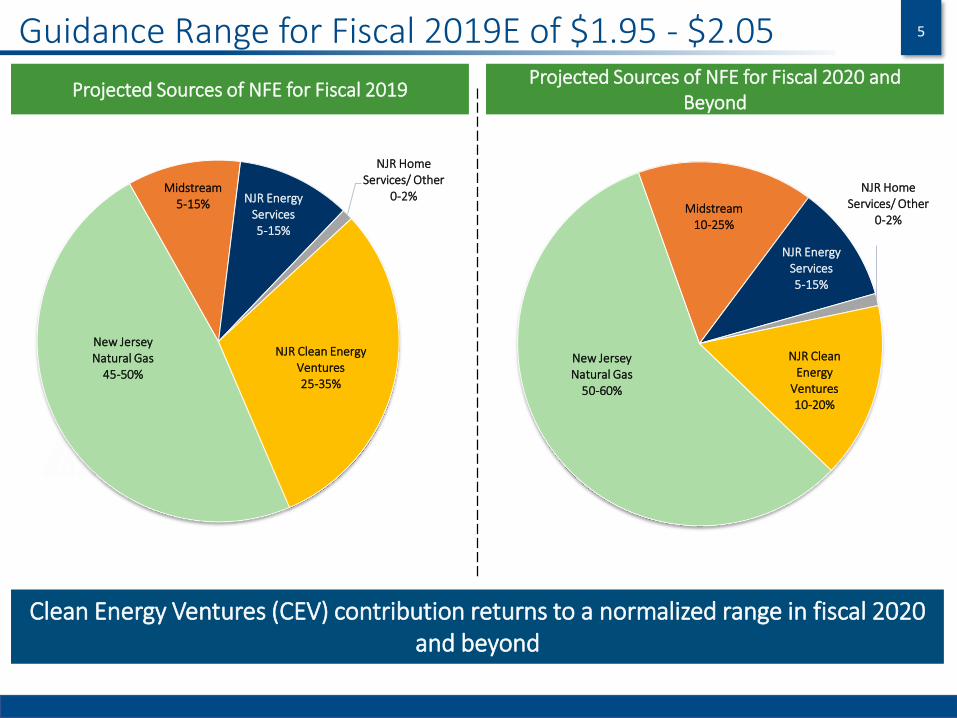
Guidance Range for Fiscal 2019E of $1.95 - $2.05 5
New Jersey Natural Gas
45-50%
Midstream5-15% NJR Energy
Services5-15%
NJR Home Services/ Other
0-2%
NJR Clean Energy Ventures25-35%
Projected Sources of NFE for Fiscal 2019
Clean Energy Ventures (CEV) contribution returns to a normalized range in fiscal 2020 and beyond
Projected Sources of NFE for Fiscal 2020 and Beyond
New Jersey Natural Gas
50-60%
Midstream10-25%
NJR Energy Services5-15%
NJR Home Services/ Other
0-2%
NJR Clean Energy
Ventures10-20%

Changes in Net Financial Earnings – FY 1Q19 6
Three Months Ended December 31, 2018
$8.0
-$11.9
$135.3
-$2.4
-$13.9
-$61.0$54.1
$0.0
$50.0
$100.0
$150.0
December 31, 2017 NJNG Midstream CEV Energy Services HS/Other December 31, 2018
Mill
ion
s
Lower BGSS Incentives and Higher O&M
Expenses 2017 Tax Act
2017 Tax Act
Lack of sustained volatility
2017 Tax Act
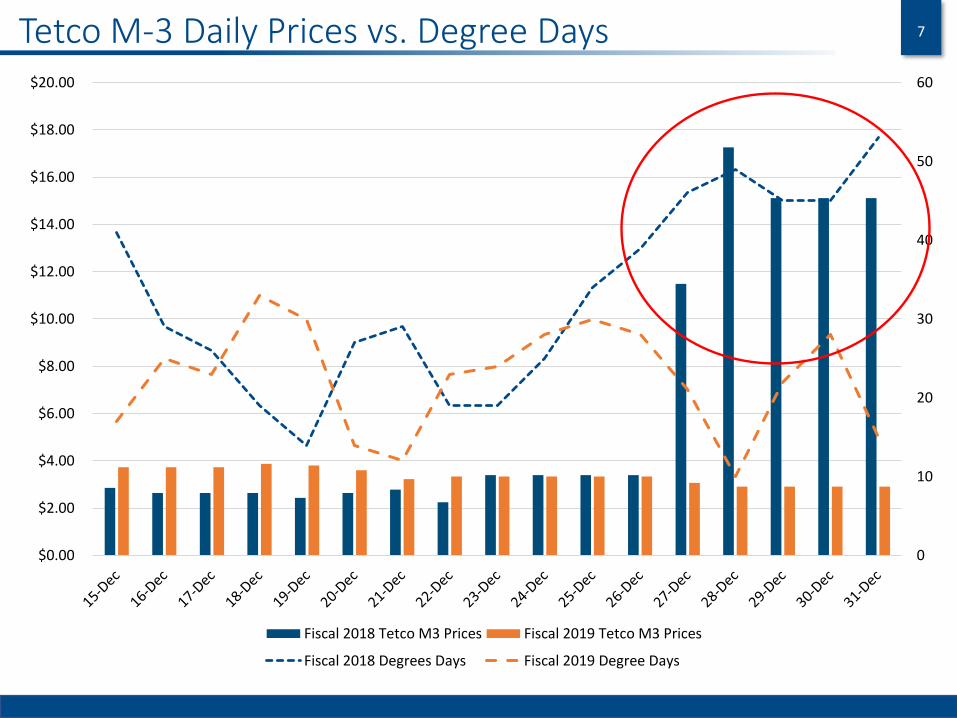
Tetco M-3 Daily Prices vs. Degree Days 7
0
10
20
30
40
50
60
$0.00
$2.00
$4.00
$6.00
$8.00
$10.00
$12.00
$14.00
$16.00
$18.00
$20.00
Fiscal 2018 Tetco M3 Prices Fiscal 2019 Tetco M3 Prices
Fiscal 2018 Degrees Days Fiscal 2019 Degree Days

SREC Hedging Strategy Stabilizes Revenue 8
257
310
203
0
50
100
150
200
250
300
350
EY19 EY20 EY21
Tho
usa
nd
s o
f SR
ECs
Hedged Unhedged Operational and Under Construction
278
311 313
Pct. Hedged:
Average Price:
Current Price (EY):
92%
$192
$230
100%
$196
$227
65%
$192
$198
As of December 31, 2018; Source: InterContinental Exchange

NJNG Capital Investment – December 31, 2018 9
CAPITAL INVESTMENT
($MM)
1Q 2019E STATUS
NJNG 1 1
Customer Growth $9.4 $42.0 Added 2,934 new customers in FY1Q19 and on target to add 9,667 annually for FY2019
Maintenance 20.0 68.6 Capital spending on track to enhance system safety and reliability
Cost of Removal/Other 10.9 140.3 Capital spending on track to take replaced/retired pipe out of service
SAFE II 11.2 38.1 Replaced 12 miles of unprotected steel pipe; program will replace 276 miles by fiscal year-end 2021
NJ RISE 4.9 31.7 Continued to install distribution main to improve service resiliency into the southern portion of the Seaside Barrier Island
Southern Reliability Link 3.3 154.5 Expected in service date of early 2020
Total NJNG $59.7 $475.2

CAPITAL INVESTMENT
($MM)
1Q 2019E STATUS
CEV* 1 1
Residential Solar $4.9 $30.2 Added 166 new customers during fiscal 1Q19; now serve over 7,400 customers
Commercial Solar 47.2 138.5 Placed two commercial solar projects into service during fiscal 1Q19, totaling 19.2 MW of capacity
Total CEV $52.1 $168.7
Midstream 1 1
PennEast $0.0 5.1Received favorable ruling allowing PennEast to conduct required surveys, which are currently underway
Adelphia Gateway 1.5 275.1Received Environmental Assessment from FERC; recommendation that there is no significant environmental impact
Total Midstream $1.5 $280.2
CEV & Midstream Capital Investment – December 31, 2018 10
* Spending based on projects placed into service and eligible for ITC
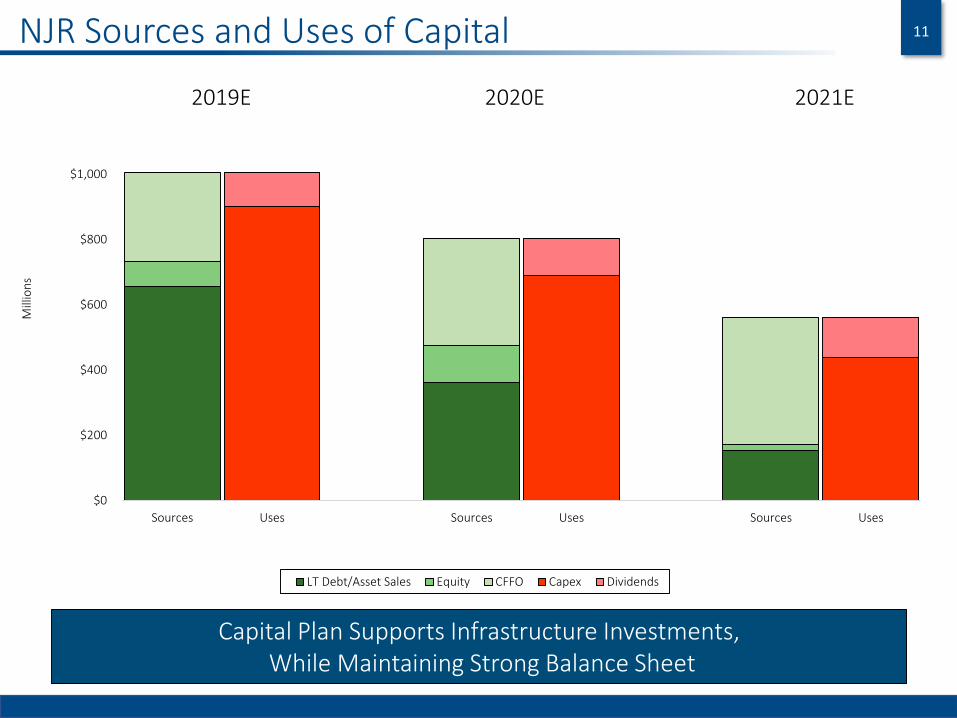
NJR Sources and Uses of Capital 11
$0
$200
$400
$600
$800
$1,000
Sources Uses Sources Uses Sources Uses
Mill
ion
s
LT Debt/Asset Sales Equity CFFO Capex Dividends
2020E 2021E2019E
Capital Plan Supports Infrastructure Investments,While Maintaining Strong Balance Sheet

Q&A

Appendix

Strong NJNG Customer Growth 14
First Quarter Fiscal 2019
• 2,934 new customers added– 2,076 new construction– 858 conversions
65%35%
New Construction Conversions
2019 New Customer Additions Forecast
0
2,500
5,000
7,500
10,000
FY 1Q18 FY 1Q19 FY18A FY19E*
Cu
sto
mer
s
New Construction Conversions
9,667
New Customer Additions
2,9342,637
28,000 – 30,000 new customers estimated from 2019-2021; 1.8 percent annually
9,596
* Based on the midpoint of NJNG FY2019 to FY2021 new customer addition estimates
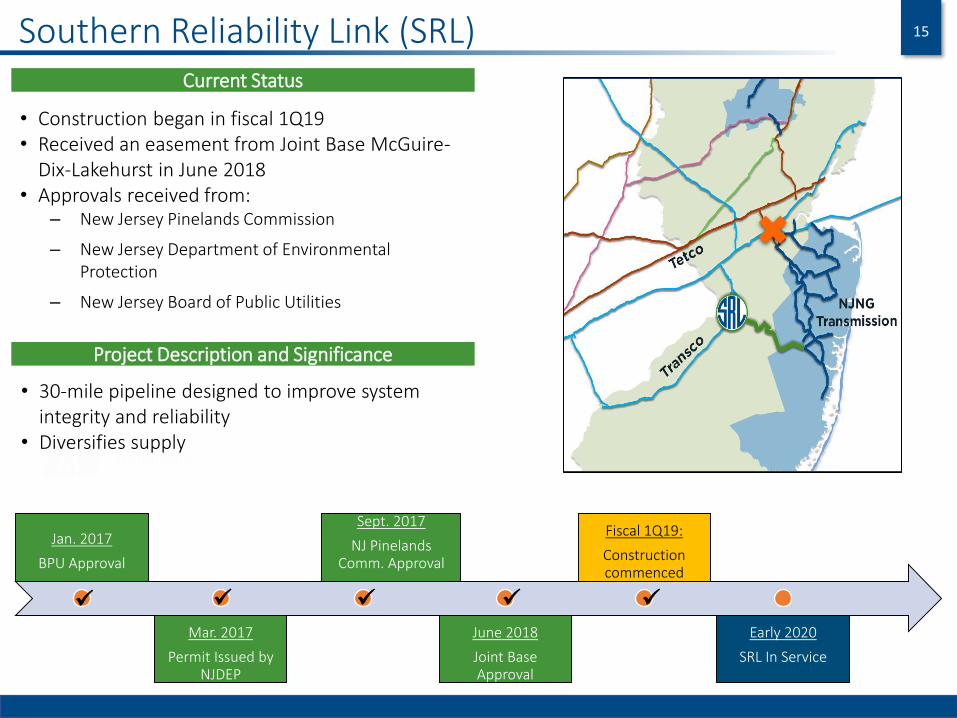
Southern Reliability Link (SRL) 15
Project Description and Significance
• 30-mile pipeline designed to improve system integrity and reliability
• Diversifies supply
Current Status
• Construction began in fiscal 1Q19• Received an easement from Joint Base McGuire-
Dix-Lakehurst in June 2018• Approvals received from:
– New Jersey Pinelands Commission
– New Jersey Department of Environmental Protection
– New Jersey Board of Public Utilities
Jan. 2017
BPU Approval
Mar. 2017
Permit Issued by NJDEP
Sept. 2017
NJ Pinelands Comm. Approval
June 2018
Joint Base Approval
Fiscal 1Q19:
Construction commenced
Early 2020
SRL In Service
✓✓✓ ✓ ✓
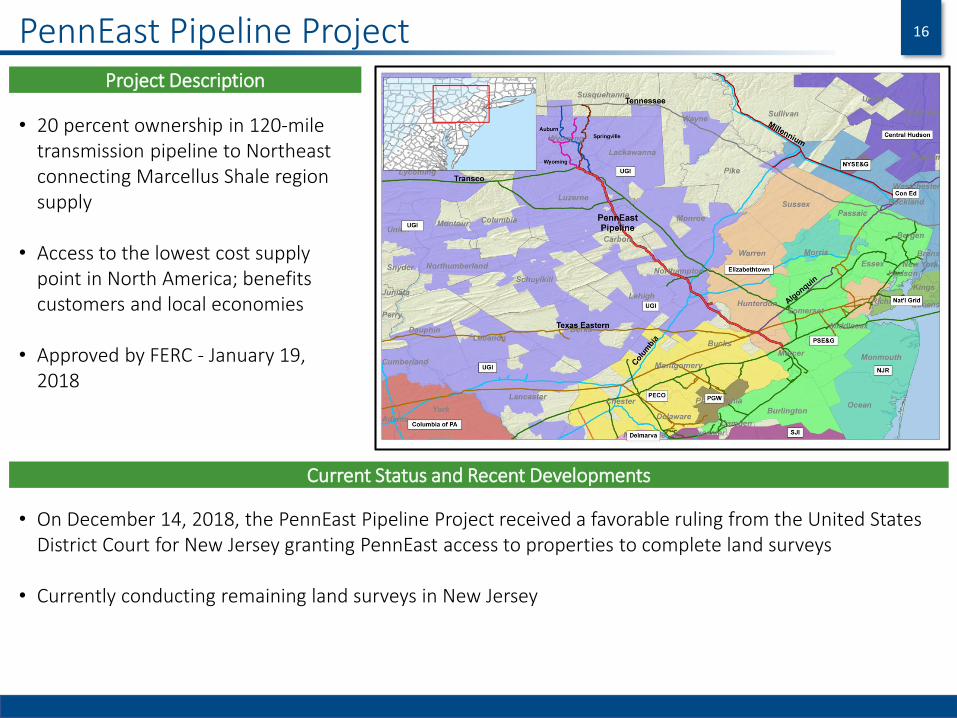
PennEast Pipeline Project 16
Project Description
• 20 percent ownership in 120-mile transmission pipeline to Northeast connecting Marcellus Shale region supply
• Access to the lowest cost supply point in North America; benefits customers and local economies
• Approved by FERC - January 19, 2018
Current Status and Recent Developments
• On December 14, 2018, the PennEast Pipeline Project received a favorable ruling from the United States District Court for New Jersey granting PennEast access to properties to complete land surveys
• Currently conducting remaining land surveys in New Jersey
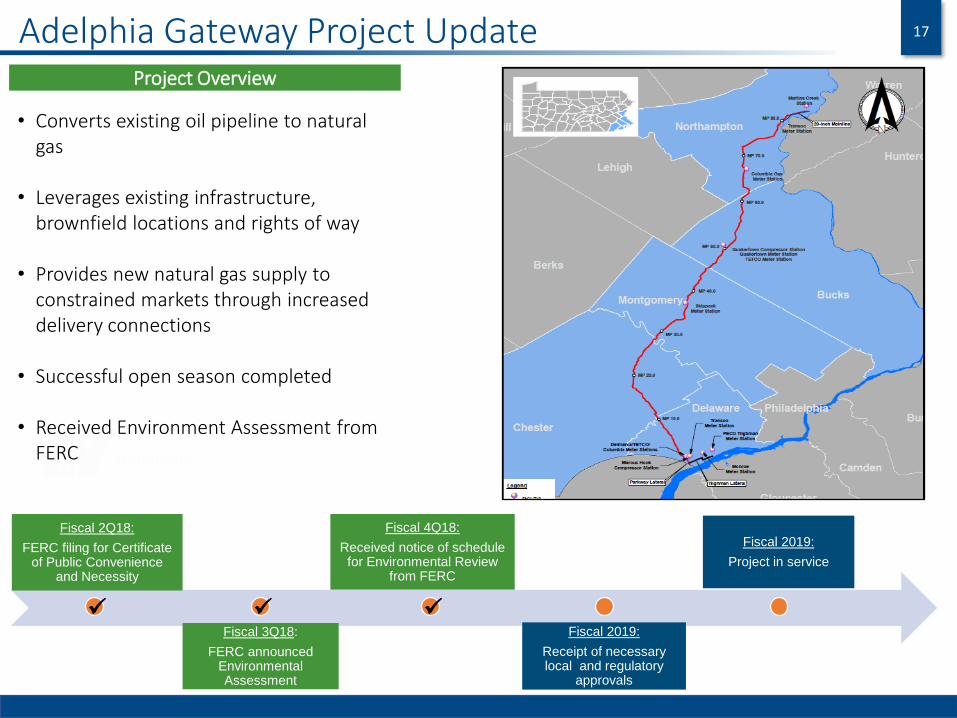
Adelphia Gateway Project Update 17
Project Overview
• Converts existing oil pipeline to natural gas
• Leverages existing infrastructure, brownfield locations and rights of way
• Provides new natural gas supply to constrained markets through increased delivery connections
• Successful open season completed
• Received Environment Assessment from FERC
Fiscal 2Q18:
FERC filing for Certificate of Public Convenience
and Necessity
Fiscal 3Q18:
FERC announced Environmental Assessment
Fiscal 4Q18:
Received notice of schedule for Environmental Review
from FERC
Fiscal 2019:
Receipt of necessary local and regulatory
approvals
Fiscal 2019:
Project in service
✓✓✓
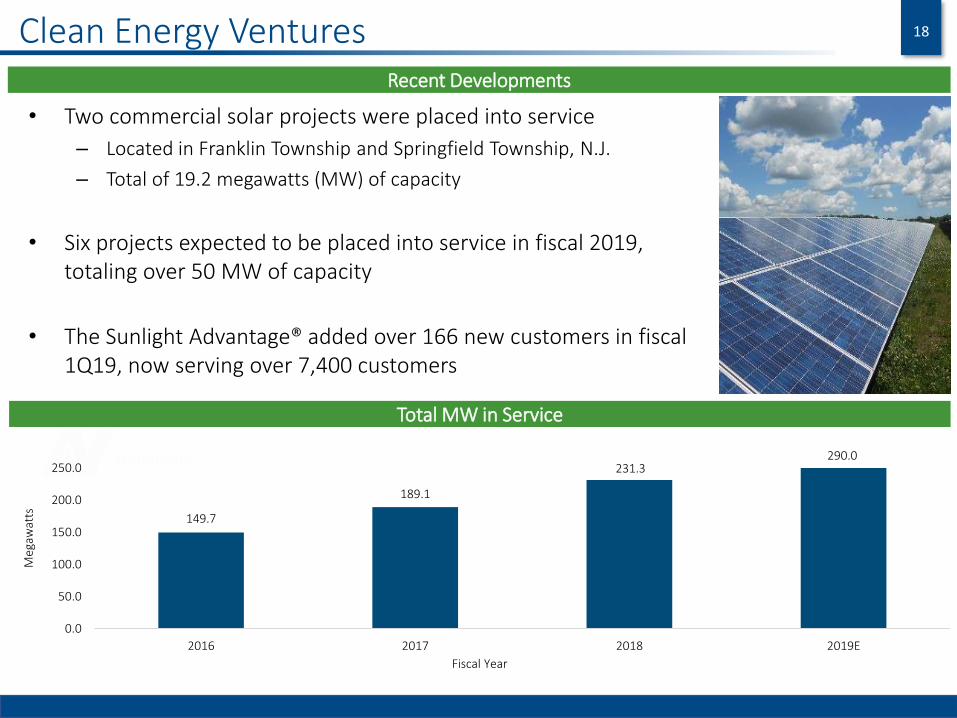
Clean Energy Ventures 18
Recent Developments
Total MW in Service
• Two commercial solar projects were placed into service
– Located in Franklin Township and Springfield Township, N.J.
– Total of 19.2 megawatts (MW) of capacity
• Six projects expected to be placed into service in fiscal 2019, totaling over 50 MW of capacity
• The Sunlight Advantage® added over 166 new customers in fiscal 1Q19, now serving over 7,400 customers
149.7
189.1
231.3290.0
0.0
50.0
100.0
150.0
200.0
250.0
2016 2017 2018 2019E
Meg
awat
ts
Fiscal Year

Fiscal 2019 First Quarter NFE 19
Net Financial Earnings ($MM)
Company 2018 2017 Variance
New Jersey Natural Gas $31.7 $34.1 ($2.4)
NJR Midstream 3.7 17.5 (13.8)
Subtotal 35.4 51.6 (16.2)
NJR Clean Energy Ventures 10.2 71.2 (61.0)
NJR Energy Services 8.4 20.3 (11.9)
NJR Home Services/Other 0.1 (7.8) 7.9
Total $54.1 $135.3 ($81.2)
Per basic share $0.61 $1.56 ($0.95)
Three Months Ended
December 31,

Reconciliation of Non-GAAP Measures 20
A reconciliation of NFE for the three months ended December 31, 2018 and 2017 to net income is provided below:

Dividend Growth Rate of 6 – 8 Percent Annually 21
$0.96
$1.02
$1.09
$1.17
0%
10%
20%
30%
40%
50%
60%
70%
80%
90%
100%
$0.00
$0.20
$0.40
$0.60
$0.80
$1.00
$1.20
2016 2017 2018** 2019
Pay
ou
t R
atio
Div
iden
d P
er
Shar
e
Fiscal Year
Ind. Div Rate Payout *
Dividends Per Share
* 2019 payout based on midpoint of fiscal 2019 guidance
** Includes out-performance of Energy Services and tax reform vs. expectations, lowering payout
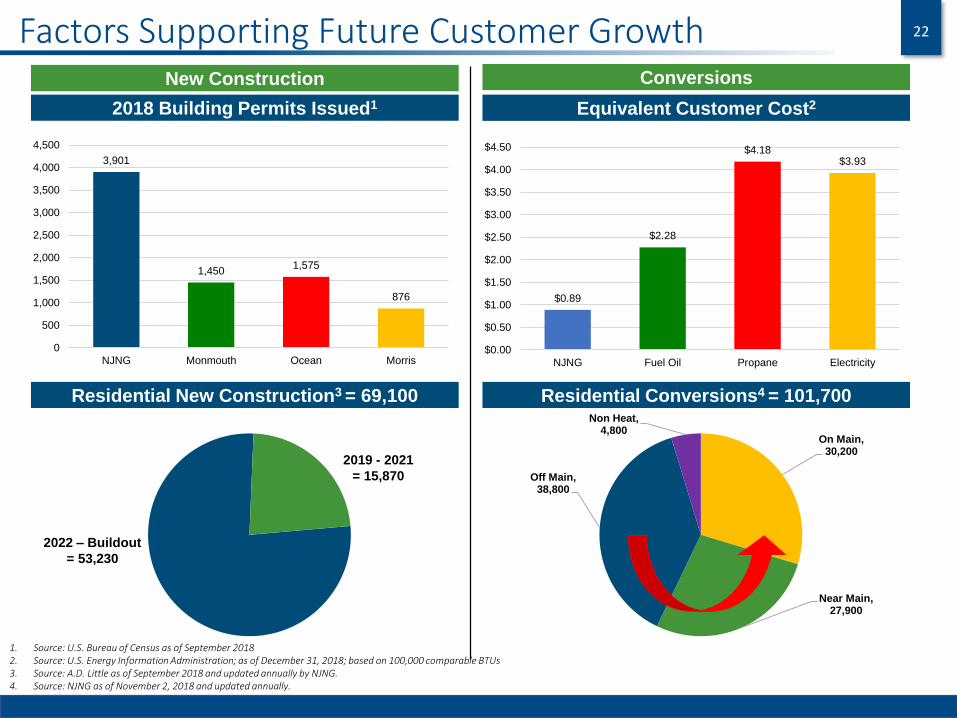
Factors Supporting Future Customer Growth 22
New Construction Conversions
2018 Building Permits Issued1 Equivalent Customer Cost2
$0.89
$2.28
$4.18$3.93
$0.00
$0.50
$1.00
$1.50
$2.00
$2.50
$3.00
$3.50
$4.00
$4.50
NJNG Fuel Oil Propane Electricity
3,901
1,4501,575
876
0
500
1,000
1,500
2,000
2,500
3,000
3,500
4,000
4,500
NJNG Monmouth Ocean Morris
Residential New Construction3 = 69,100 Residential Conversions4 = 101,700
2019 - 2021
= 15,870
2022 – Buildout
= 53,230
On Main, 30,200
Near Main, 27,900
Off Main, 38,800
Non Heat, 4,800
1. Source: U.S. Bureau of Census as of September 20182. Source: U.S. Energy Information Administration; as of December 31, 2018; based on 100,000 comparable BTUs3. Source: A.D. Little as of September 2018 and updated annually by NJNG.4. Source: NJNG as of November 2, 2018 and updated annually.

SREC Hedging Strategy Stabilizes Income 23
296265
203
0
50
100
150
200
250
300
350
FY19 FY20 FY21
Tho
usa
nd
s o
f SR
ECs
Hedged Unhedged Operational and Under Construction
313
Pct. Hedged:
Average Price:
Current Price:
100%
$200
$229
85%
$191
$217
65%
$191
$182
As of December 31, 2018; Source: InterContinental Exchange (ICE)
296 312
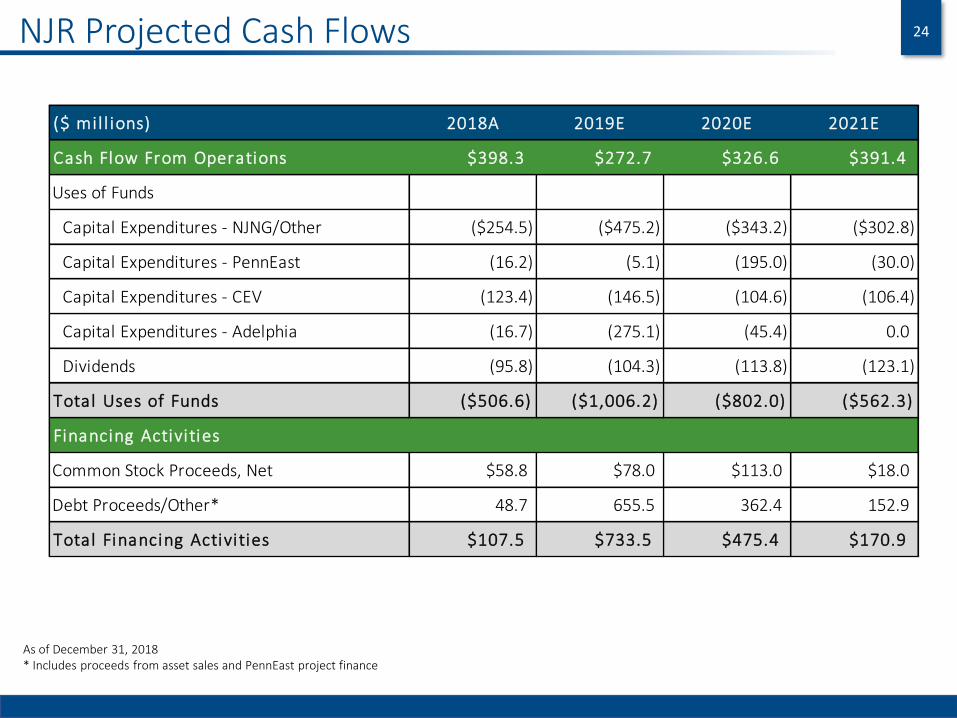
NJR Projected Cash Flows 24
($ mil l ions) 2018A 2019E 2020E 2021E
Cash Flow From Operations $398.3 $272.7 $326.6 $391.4
Uses of Funds
Capital Expenditures - NJNG/Other ($254.5) ($475.2) ($343.2) ($302.8)
Capital Expenditures - PennEast (16.2) (5.1) (195.0) (30.0)
Capital Expenditures - CEV (123.4) (146.5) (104.6) (106.4)
Capital Expenditures - Adelphia (16.7) (275.1) (45.4) 0.0
Dividends (95.8) (104.3) (113.8) (123.1)
Total Uses of Funds ($506.6) ($1,006.2) ($802.0) ($562.3)
Financing Activities
Common Stock Proceeds, Net $58.8 $78.0 $113.0 $18.0
Debt Proceeds/Other* 48.7 655.5 362.4 152.9
Total Financing Activities $107.5 $733.5 $475.4 $170.9
As of December 31, 2018 * Includes proceeds from asset sales and PennEast project finance