first nine months 2017 - welcome to novo nordisk a/s announcement no 83 / 2017 financial report for...
TRANSCRIPT

Novo Nordisk A/S Investor Relations
Novo Allé 2880 Bagsværd Denmark
Telephone: +45 4444 8888 www.novonordisk.com
CVR No: 24 25 67 90
Company announcement No 83 / 2017
Financial report for the period 1 January 2017 to 30 September 2017
1 November 2017
Novo Nordisk increased reported operating profit by 5% in the first nine months of 2017 Reported sales increased by 2% to DKK 83.7 billion (3% in local currencies)
Sales within diabetes and obesity care increased by 7% to DKK 69.7 billion (8% in local currencies). Sales of Tresiba® increased by 117% to DKK 5.4 billion (118% in local currencies). Sales of Victoza® increased by 15% to DKK 16.9 billion (15% in local currencies). Sales of Saxenda® increased by 80% to DKK 1.9 billion (77% in local currencies) Sales within biopharmaceuticals declined by 18% to DKK 14.0 billion (18% in local currencies), primarily reflecting an impact from the introduction of a generic version of the hormone replacement therapy product Vagifem® and from rebate adjustments for human growth hormone in Q1 2016, both in the USA, whereas sales within haemophilia were broadly unchanged. Sales within International Operations increased by 3% in Danish kroner (5% in local currencies) driven by sales growth in all business regions. Sales within North America Operations were unchanged in both Danish kroner and local currencies, reflecting the non-recurring effects in biopharmaceuticals impacting growth negatively by 5 percentage points. Operating profit increased by 5% reported in Danish kroner and by 6% in local currencies to DKK 38.9 billion. Net profit increased by 2% to DKK 29.9 billion. Diluted earnings per share increased by 5% to DKK 12.03. In August, Novo Nordisk showed that the once-weekly GLP-1 semaglutide was superior to once-weekly dulaglutide on glucose control and weight loss in people with type 2 diabetes in the SUSTAIN 7 trial. In October, semaglutide received a positive 16-0 vote in favour of approval from an FDA Advisory Committee. In August, Novo Nordisk also obtained approval of the Victoza® label expansion for cardiovascular risk reduction in the USA, and in September the label expansion for the reduced risk of severe hypoglycaemia with Tresiba® was endorsed by CHMP in the EU. Also in September, Novo Nordisk obtained approval of the new fast-acting mealtime insulin Fiasp® in the USA. The financial outlook for 2017 has been updated and the sales growth measured in local currencies is now expected to be in the range of 2% to 3% compared with the previous range of 1% to 3%. A negative currency impact of 2 percentage points is now expected. Operating profit growth measured in local currencies is now expected to be in the range of 3% to 6% compared with the previous range of 1% to 5%. A negative currency impact of 3 percentage points is now expected. The preliminary outlook for 2018 in local currencies indicates low to mid single-digit growth in both sales and operating profit. Sales growth reported in Danish kroner is expected to be 3 percentage points lower than in local currencies, and reported operating profit growth is expected to be 4 percentage points lower. Lars Fruergaard Jørgensen, president and CEO: “We continue to deliver on our plans for 2017, and we are very pleased with the recent clinical and regulatory progress for our key products. We are currently preparing the global launch of semaglutide, which provides a unique opportunity to improve the treatment of people with type 2 diabetes.”

Financial report for the period 1 January 2017 to 30 September 2017 Page 2 of 34
Company announcement No 83 / 2017
ABOUT NOVO NORDISK Novo Nordisk is a global healthcare company with more than 90 years of innovation and leadership in diabetes care. This heritage has given us experience and capabilities that also enable us to help people defeat obesity, haemophilia, growth disorders and other serious chronic conditions. Headquartered in Denmark, Novo Nordisk employs approximately 41,700 people in 77 countries, and markets its products in more than 165 countries. Novo Nordisk’s B shares are listed on Nasdaq Copenhagen (Novo-B). Its ADRs are listed on the New York Stock Exchange (NVO). For more information, visit novonordisk.com. CONFERENCE CALL DETAILS On 1 November 2017 at 12.30 CET, corresponding to 7.30 am EDT, a conference call will be held. Investors will be able to listen in via a link on novonordisk.com, which can be found under ‘Investors’. Presentation material for the conference call will be available approximately one hour before on the same page. WEBCAST DETAILS On 2 November 2017 at 14.15 CET, corresponding to 9.15 am EDT, management will give a presentation to institutional investors and sell-side analysts in London. A webcast of the presentation can be followed via a link on novonordisk.com, which can be found under ‘Investors’. Presentation material for the webcast will be made available on the same page. FINANCIAL CALENDAR 21 November 2017 Capital Markets Day 1 February 2018 Financial Statement for 2017 6 February 2018 PDF Version of Annual Report 2017 7 February 2018 Deadline for the company’s receipts of shareholder proposals for the
Annual General Meeting 2018 23 February 2018 Printed version of the Annual Report 2017 22 March 2018 Annual General Meeting 2018 2 May 2018 Financial Statement for the first three months of 2018 8 August 2018 Financial Statement for the first six months of 2018 1 November 2018 Financial Statement for the first nine months of 2018 CONTACTS FOR FURTHER INFORMATION Media: Katrine Sperling +45 3079 6718 [email protected] Ken Inchausti (US) +1 267 809 7552 [email protected] Investors: Peter Hugreffe Ankersen +45 3075 9085 [email protected] Hanna Ögren +45 3079 8519 [email protected] Anders Mikkelsen +45 3079 4461 [email protected] Christina Kjær +45 3079 3009 [email protected]
Kasper Veje (US) +1 609 235 8567 [email protected] Further information about Novo Nordisk is available on novonordisk.com.
Financial report for the period 1 January 2017 to 30 September 2017 Page 3 of 34
Financial Performance Outlook R&D Sustainability Equity Corporate
governance Legal Financial Information
Company announcement No 83 / 2017
LIST OF CONTENTS FINANCIAL PERFORMANCE .................................................................................... 4
Consolidated financial statement for the first nine months of 2017 ....................... 4 Sales development ......................................................................................... 5 Diabetes and obesity care, sales development ................................................... 6 Biopharmaceuticals, sales development ........................................................... 11 Development in costs and operating profit ....................................................... 12 Financial items (net) ..................................................................................... 13 Capital expenditure and free cash flow ............................................................ 13 Key developments in the third quarter of 2017 ................................................. 13
OUTLOOK .......................................................................................................... 15 RESEARCH & DEVELOPMENT UPDATE .................................................................... 17 SUSTAINABILITY UPDATE .................................................................................... 20 EQUITY ............................................................................................................. 21 CORPORATE GOVERNANCE .................................................................................. 22 LEGAL MATTERS ................................................................................................. 22 MANAGEMENT STATEMENT .................................................................................. 25 FINANCIAL INFORMATION ................................................................................... 26
Appendix 1: Quarterly numbers in DKK ......................................................... 26 Appendix 2: Income statement and statement of comprehensive income ........... 27 Appendix 3: Balance sheet ........................................................................... 28 Appendix 4: Statement of cash flows............................................................. 29 Appendix 5: Statement of changes in equity .................................................. 30 Appendix 6: Regional sales split ................................................................... 31 Appendix 7: Key currency assumptions ......................................................... 32 Appendix 8: Quarterly numbers in USD (additional information) ....................... 33 Appendix 9: Non-IFRS financial measures (additional information) .................... 34

Financial report for the period 1 January 2017 to 30 September 2017 Page 4 of 34
Financial Performance Outlook R&D Sustainability Equity Corporate
governance Legal Financial Information
Company announcement No 83 / 2017
FINANCIAL PERFORMANCE
CONSOLIDATED FINANCIAL STATEMENT FOR THE FIRST NINE MONTHS OF 2017 These unaudited consolidated financial statements for the first nine months of 2017 have been prepared in accordance with IAS 34 ‘Interim Financial Reporting’ and on the basis of the same accounting policies as were applied in the Annual Report 2016 of Novo Nordisk. Novo Nordisk has adopted all new, amended or revised accounting standards and interpretations (‘IFRSs’) as published by the IASB that are endorsed by the EU and effective for the accounting period beginning on 1 January 2017. These IFRSs have not had a significant impact on the consolidated financial statements for the first nine months of 2017. The impact of the new standards IFRS 9, IFRS 15 and IFRS 16, which are issued, but have not yet come into effect, is described in the Annual Report 2016. The assessment of the impact is unchanged. Furthermore, the financial report including the consolidated financial statements for the first nine months of 2017 and Management’s review have been prepared in accordance with additional Danish disclosure requirements for interim reports of listed companies. Amounts in DKK million, except number of shares, earnings per share and full-time equivalent employees.
PROFIT AND LOSS 9M 2017 9M 2016 % change 9M 2016
to 9M 2017
DKK millionNet sales 83,704 82,208 2%
Gross profit 70,772 69,943 1%Gross margin 84.6% 85.1%
Sales and distribution costs 20,045 20,468 (2%)Percent of sales 23.9% 24.9%
Research and development costs 10,031 10,093 (1%)Percent of sales 12.0% 12.3%
Administrative costs 2,666 2,796 (5%)Percent of sales 3.2% 3.4%
Other operating income, net 890 640 39%
Operating profit 38,920 37,226 5%Operating margin 46.5% 45.3%
Financial items (net) (811) (370) 119%Profit before income taxes 38,109 36,856 3%
Income taxes 8,232 7,630 8%Effective tax rate 21.6% 20.7%
Net profit 29,877 29,226 2%Net profit margin 35.7% 35.6%
OTHER KEY NUMBERS
Depreciation, amortisation and impairment losses 2,277 2,077 10%Capital expenditure (tangible assets) 5,636 4,559 24%
Net cash generated from operating activities 35,136 37,161 (5%)Free cash flow 29,722 31,603 (6%)
Total assets 97,891 87,340 12%Equity 46,946 41,327 14%Equity ratio 48.0% 47.3%
Average number of diluted shares outstanding (million) 2,484.5 2,540.6 (2%)Diluted earnings per share / ADR (in DKK) 12.03 11.50 5%
Full-time equivalent employees end of period 41,656 42,605 (2%)
Financial report for the period 1 January 2017 to 30 September 2017 Page 5 of 34
Financial Performance Outlook R&D Sustainability Equity Corporate
governance Legal Financial Information
Company announcement No 83 / 2017
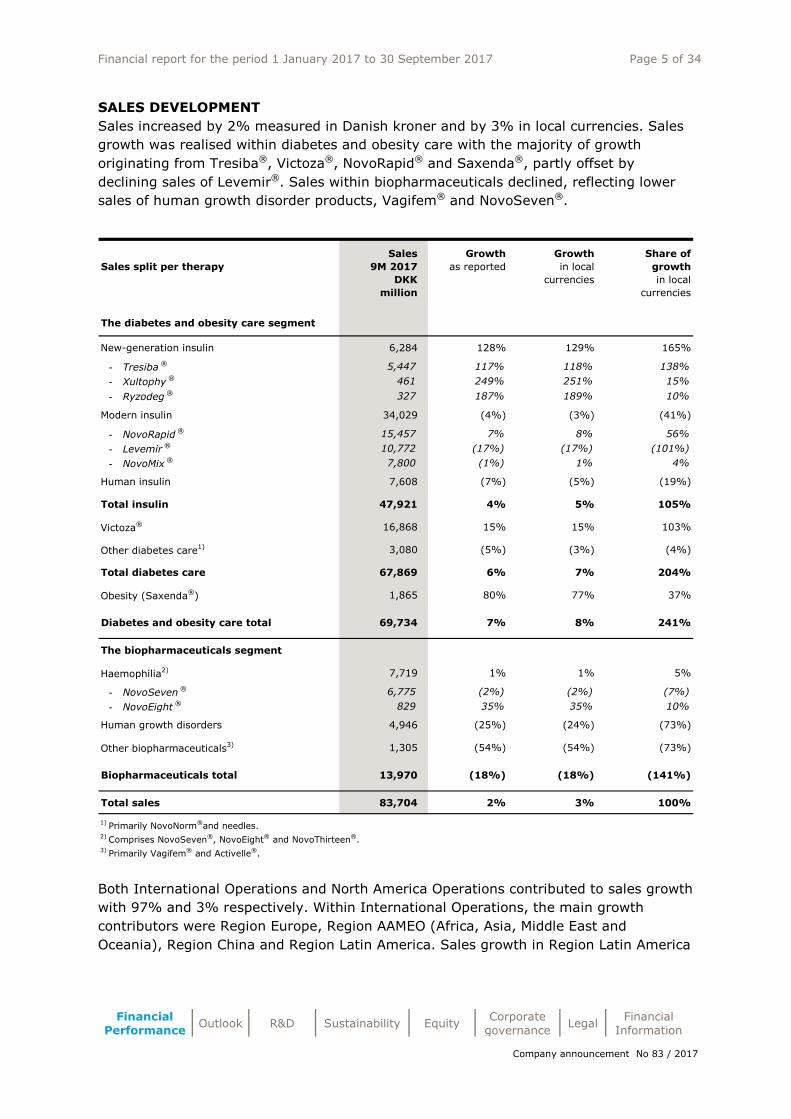
SALES DEVELOPMENT Sales increased by 2% measured in Danish kroner and by 3% in local currencies. Sales growth was realised within diabetes and obesity care with the majority of growth originating from Tresiba®, Victoza®, NovoRapid® and Saxenda®, partly offset by declining sales of Levemir®. Sales within biopharmaceuticals declined, reflecting lower sales of human growth disorder products, Vagifem® and NovoSeven®.
Both International Operations and North America Operations contributed to sales growth with 97% and 3% respectively. Within International Operations, the main growth contributors were Region Europe, Region AAMEO (Africa, Asia, Middle East and Oceania), Region China and Region Latin America. Sales growth in Region Latin America
Sales split per therapySales
9M 2017 DKK
million
Growthas reported
Growthin local
currencies
Share of growthin local
currencies
The diabetes and obesity care segment
New-generation insulin 6,284 128% 129% 165%
- Tresiba ® 5,447 117% 118% 138%- Xultophy ® 461 249% 251% 15%- Ryzodeg ® 327 187% 189% 10%
Modern insulin 34,029 (4%) (3%) (41%)
- NovoRapid ® 15,457 7% 8% 56%- Levemir ® 10,772 (17%) (17%) (101%)- NovoMix ® 7,800 (1%) 1% 4%
Human insulin 7,608 (7%) (5%) (19%)
Total insulin 47,921 4% 5% 105%
Victoza® 16,868 15% 15% 103%
Other diabetes care1) 3,080 (5%) (3%) (4%)
Total diabetes care 67,869 6% 7% 204%
Obesity (Saxenda®) 1,865 80% 77% 37%
Diabetes and obesity care total 69,734 7% 8% 241%
The biopharmaceuticals segment
Haemophilia2) 7,719 1% 1% 5%
- NovoSeven ® 6,775 (2%) (2%) (7%)- NovoEight ® 829 35% 35% 10%
Human growth disorders 4,946 (25%) (24%) (73%)
Other biopharmaceuticals3) 1,305 (54%) (54%) (73%)
Biopharmaceuticals total 13,970 (18%) (18%) (141%)
Total sales 83,704 2% 3% 100%
1) Primarily NovoNorm®and needles.2) Comprises NovoSeven®, NovoEight® and NovoThirteen®.3) Primarily Vagifem® and Activelle®.
Financial report for the period 1 January 2017 to 30 September 2017 Page 6 of 34
Financial Performance Outlook R&D Sustainability Equity Corporate
governance Legal Financial Information
Company announcement No 83 / 2017
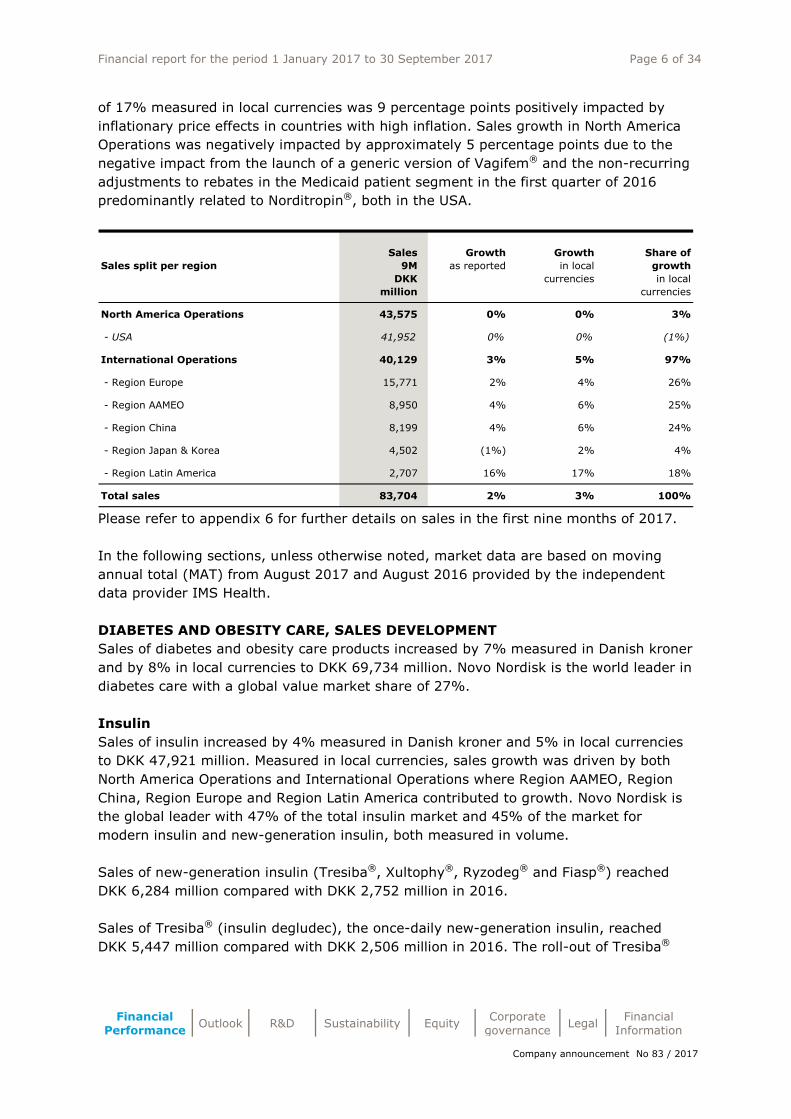
of 17% measured in local currencies was 9 percentage points positively impacted by inflationary price effects in countries with high inflation. Sales growth in North America Operations was negatively impacted by approximately 5 percentage points due to the negative impact from the launch of a generic version of Vagifem® and the non-recurring adjustments to rebates in the Medicaid patient segment in the first quarter of 2016 predominantly related to Norditropin®, both in the USA.
Please refer to appendix 6 for further details on sales in the first nine months of 2017. In the following sections, unless otherwise noted, market data are based on moving annual total (MAT) from August 2017 and August 2016 provided by the independent data provider IMS Health.
DIABETES AND OBESITY CARE, SALES DEVELOPMENT Sales of diabetes and obesity care products increased by 7% measured in Danish kroner and by 8% in local currencies to DKK 69,734 million. Novo Nordisk is the world leader in diabetes care with a global value market share of 27%.
Insulin Sales of insulin increased by 4% measured in Danish kroner and 5% in local currencies to DKK 47,921 million. Measured in local currencies, sales growth was driven by both North America Operations and International Operations where Region AAMEO, Region China, Region Europe and Region Latin America contributed to growth. Novo Nordisk is the global leader with 47% of the total insulin market and 45% of the market for modern insulin and new-generation insulin, both measured in volume. Sales of new-generation insulin (Tresiba®, Xultophy®, Ryzodeg® and Fiasp®) reached DKK 6,284 million compared with DKK 2,752 million in 2016. Sales of Tresiba® (insulin degludec), the once-daily new-generation insulin, reached DKK 5,447 million compared with DKK 2,506 million in 2016. The roll-out of Tresiba®
Sales split per regionSales
9M DKK
million
Growthas reported
Growthin local
currencies
Share of growthin local
currencies
North America Operations 43,575 0% 0% 3%
- USA 41,952 0% 0% (1%)
International Operations 40,129 3% 5% 97%
- Region Europe 15,771 2% 4% 26%
- Region AAMEO 8,950 4% 6% 25%
- Region China 8,199 4% 6% 24%
- Region Japan & Korea 4,502 (1%) 2% 4%
- Region Latin America 2,707 16% 17% 18%
Total sales 83,704 2% 3% 100%

Financial report for the period 1 January 2017 to 30 September 2017 Page 7 of 34
Financial Performance Outlook R&D Sustainability Equity Corporate
governance Legal Financial Information
Company announcement No 83 / 2017
continues and the product has been launched in 56 countries. In the USA where Tresiba® was launched broadly in January 2016, the product maintains wide commercial and Medicare Part D formulary coverage. Generally, Tresiba® has shown solid penetration in markets with reimbursement at a similar level to insulin glargine U100, whereas penetration remains modest in markets with restricted market access. In September 2017, Novo Nordisk obtained the approval of Tresiba® in China. Novo Nordisk expects to launch Tresiba® in China without reimbursement and with limited market access in the first quarter of 2018. Sales of Xultophy®, a once-daily combination of insulin degludec (Tresiba®) and liraglutide (Victoza®), reached DKK 461 million compared with DKK 132 million in 2016. Sales growth was driven by both International Operations, where predominantly Region Europe contributed to growth, and North America Operations. Xultophy® has now been launched in 16 countries; in the USA launched under the brand name Xultophy® 100/3.6 in May 2017. Sales of Ryzodeg®, a soluble formulation of insulin degludec and insulin aspart, reached DKK 327 million compared with DKK 114 million in 2016. Sales growth was driven by International Operations, where Region Japan & Korea and Region AAMEO contributed to growth. Ryzodeg® has now been marketed in 14 countries, and feedback from patients and prescribers remains encouraging. The novel mealtime insulin Fiasp®, fast-acting insulin aspart, received marketing authorisation from the European Commission in the first quarter of 2017 and approvals were also received in Norway, Iceland and Canada. In September 2017, Novo Nordisk received the approval of Fiasp® in the USA. Fiasp® is expected to be launched in the USA in fourth quarter of 2017 and has now been launched in eight countries including recent launches in the UK and Germany. Sales of modern insulin decreased by 4% in Danish kroner and by 3% in local currencies to DKK 34,029 million. The decline reflects lower sales in North America Operations of Levemir® due to price pressure in the basal insulin segment as well as the impact following the introduction of the new-generation insulin Tresiba® and lower NovoMix® sales, as the pre-mix insulin market continues to decline. Sales growth within International Operations partly offset the declining sales, where Region China and Region AAMEO were the main contributors to growth. Sales of modern insulin and new-generation insulin in total constitute 84% of Novo Nordisk’s sales of insulin measured in value.

Financial report for the period 1 January 2017 to 30 September 2017 Page 8 of 34
Financial Performance Outlook R&D Sustainability Equity Corporate
governance Legal Financial Information
Company announcement No 83 / 2017
Source: IMS, August 2017 data MAT. * Data for 11 selected private markets representing approximately 70% of total Novo Nordisk’s diabetes care sales in the region. ** Data for mainland China, excluding Hong Kong and Taiwan. *** Data for three selected private markets representing approximately 70% of total Novo Nordisk’s diabetes care sales in the region.
North America Operations Sales of insulin in North America Operations increased by 3% in both Danish kroner and in local currencies. Sales growth was driven by higher sales of Tresiba® and NovoLog® due to underlying volume growth of both the basal and short-acting insulin market and market share gain in the basal insulin segment. Sales growth was partly countered by lower Levemir® sales due to lower realised prices for basal insulin as well as an impact from patients switching to Tresiba®. 57% of Novo Nordisk’s volume of the new-generation insulin and modern insulin in the USA is used in the prefilled devices FlexPen® and FlexTouch®.
International Operations Sales of insulin in International Operations increased by 4% in Danish kroner and by 6% in local currencies. Sales growth was driven by both new-generation insulin and modern insulin, partly offset by declining human insulin sales.
Region Europe Sales of insulin in Region Europe increased by 2% in Danish kroner and by 3% in local currencies. Sales were driven by Xultophy® and the continued penetration of Tresiba® as well as a positive contribution from both NovoRapid® and Fiasp® across the region, partly offset by contracting Levemir® sales reflecting the continued roll-out of Tresiba® as well as declining human insulin and NovoMix® sales.
Region AAMEO Sales of insulin in Region AAMEO increased by 6% in Danish kroner and by 9% in local currencies. The sales growth is reflecting the growth of the overall diabetes care market driven by modern insulins as well as the new-generation insulin Tresiba® and Ryzodeg®, partly offset by declining human insulin sales. Currently, 63% of Novo Nordisk’s insulin volume in the major private markets in Region AAMEO is used in devices.
Region China Sales of insulin in Region China increased by 5% in Danish kroner and by 8% in local currencies. The sales growth is driven by continued growth in the modern insulin
INSULIN MARKET SHARES(volume, MAT)
August August August August2017 2016 2017 2016
Global 47% 46% 45% 45%North America Operations 38% 37% 39% 38%
USA 38% 37% 40% 38%International Operations 50% 50% 48% 48%
Region Europe 44% 46% 44% 45%Region AAMEO* 56% 57% 51% 52%Region China** 59% 59% 61% 61%Region Japan & Korea 49% 49% 49% 48%Region Latin America*** 42% 40% 40% 40%
Novo Nordisk’s shareof total insulin market
Novo Nordisk’s shareof the modern insulin and
new-generation insulin market

Financial report for the period 1 January 2017 to 30 September 2017 Page 9 of 34
Financial Performance Outlook R&D Sustainability Equity Corporate
governance Legal Financial Information
Company announcement No 83 / 2017
products, where Novo Nordisk has improved its market share in each insulin segment, partly offset by declining human insulin sales.
Region Japan & Korea Sales of insulin in Region Japan & Korea decreased by 3% in Danish kroner and were unchanged in local currencies. The sales development in local currencies reflects lower modern insulin and human insulin sales in the region reflecting the declining insulin volume market in Japan which is offset by continued positive uptake of Ryzodeg® and positive contribution from Tresiba® in Japan and Korea.
Region Latin America Sales of insulin in Region Latin America increased by 17% in Danish kroner and by 20% in local currencies. The sales development reflects the continued growth of the modern insulins and strong uptake of Tresiba® as well as modest growth of human insulin. Currently, 45% of Novo Nordisk’s insulin volume in the major private markets in Region Latin America is used in devices, primarily FlexPen® and FlexTouch®.
Victoza® (GLP-1 therapy for type 2 diabetes) Victoza® sales increased by 15% in both Danish kroner and in local currencies to DKK 16,868 million. Sales growth is predominantly driven by North America Operations comprising 89% share of growth. The GLP-1 segment’s value share of the total diabetes care market has increased to 11.3% compared with 9.1% 12 months ago. Victoza® is the market leader in the GLP-1 segment with a 51% value market share.
Source: IMS, August 2017 data MAT. * Data for 11 selected private markets representing approximately 70% of Novo Nordisk’s total diabetes care sales in the region. ** Data for mainland China, excluding Hong Kong and Taiwan. *** Data for three selected private markets representing approximately 70% of Novo Nordisk’s total diabetes care sales in the region.
North America Operations Sales of Victoza® in North America Operations increased by 19% in both Danish kroner and in local currencies. Sales growth is driven by an underlying prescription volume growth of the GLP-1 class of more than 20% in the USA, a positive impact from higher realised prices and higher inventory levels. The growth of the GLP-1 market continues to be driven by a competing once-weekly product and Victoza®. The value share of the GLP-1 class of the total North American diabetes care market has increased to 13.3%.
GLP-1 MARKET SHARES(value, MAT)
August August August August2017 2016 2017 2016
Global 11.3% 9.1% 51% 60%North America Operations 13.3% 10.6% 50% 58%
USA 13.4% 10.7% 50% 57%International Operations 6.3% 5.7% 58% 68%
Region Europe 10.2% 9.4% 60% 68%Region AAMEO* 2.5% 2.3% 49% 57%Region China** 0.9% 0.9% 65% 53%Region Japan & Korea 4.3% 3.0% 44% 65%Region Latin America*** 5.1% 4.2% 79% 91%
GLP-1 share of totaldiabetes care market
Victoza® shareof GLP-1 market

Financial report for the period 1 January 2017 to 30 September 2017 Page 10 of 34
Financial Performance Outlook R&D Sustainability Equity Corporate
governance Legal Financial Information
Company announcement No 83 / 2017
Despite intensified competition, Victoza® is still the market leader in the GLP-1 class with a 50% value market share.
International Operations Sales of Victoza® in International Operations increased by 5% in Danish kroner and by 6% in local currencies. Sales growth is driven by Region AAMEO, Region Latin America, Region Europe and Region China. The value share of the GLP-1 class of the total International Operations diabetes care market has increased to 6.3% from 5.7% in 2016. Victoza® is the market leader with a 58% value market share.
Region Europe Sales in Region Europe were unchanged in Danish kroner and increased by 2% in local currencies. The sales growth in local currencies was driven by United Kingdom, Germany and the Nordic countries partly offset by declining sales in selected countries reflecting intensified competition from a once-weekly GLP-1 product. In Region Europe, the share of the GLP-1 class of the total diabetes care market in value has increased to 10.2%. Despite intensified competition, Victoza® remains the market leader in Region Europe in the GLP-1 class with a 60% value market share.
Region AAMEO Sales in Region AAMEO increased by 26% in both Danish kroner and in local currencies. Sales growth is primarily driven by a number of countries in the Middle East as well as India, Russia, and Egypt. The value share of the GLP-1 class of the total diabetes care market increased to 2.5%. Victoza® is the GLP-1 market leader across Region AAMEO with a value market share of 49%. Region China Sales in Region China increased by 9% in Danish kroner and by 10% in local currencies. In China, the GLP-1 class only represents 0.9% of the total diabetes care market measured in value, and Victoza® holds a GLP-1 value market share in the class of 65%. In July 2017, Victoza® was the first GLP-1 to be listed on the Chinese National Reimbursement Drug List, and provincial reimbursement is now in the process of being implemented across the country.
Region Japan & Korea Sales in Region Japan & Korea decreased by 4% in Danish kroner and by 2% in local currencies. The sales development reflects the intensified competition which is partly offset by continued expansion of the GLP-1 market in Japan. In Region Japan & Korea, the GLP-1 class represents 4.3% of the total diabetes care market value compared with 3.0% in 2016. Victoza® remains the leader in the class with a value market share of 44%.
Region Latin America Sales in Region Latin America increased by 20% in Danish kroner and by 15% in local currencies. The sales growth reflects the continued expansion of the GLP-1 markets across the region. In Region Latin America, the GLP-1 class represents 5.1% of the total

Financial report for the period 1 January 2017 to 30 September 2017 Page 11 of 34
Financial Performance Outlook R&D Sustainability Equity Corporate
governance Legal Financial Information
Company announcement No 83 / 2017
diabetes care market value compared with 4.2% in 2016. Victoza® remains the leader in the class with a value market share of 79%.
Other diabetes care Sales of other diabetes care products, which predominantly consist of oral antidiabetic products and needles, declined by 5% in Danish kroner and by 3% in local currencies to DKK 3,080 million. Declining sales were seen in International Operations, where all regions apart from Region AAMEO and Region Latin America experienced lower sales, as well as lower sales in North America Operations.
Saxenda® (obesity care) Sales of Saxenda®, liraglutide 3 mg for weight management, increased by 80% in Danish kroner and by 77% in local currencies to DKK 1,865 million. Sales growth was driven by both North America Operations and International Operations, where Region Latin America, especially Brazil, Region AAMEO and Region Europe contributed to growth. Saxenda® was launched in May 2015 in the USA and has obtained broad commercial formulary market access, but generally with prior authorisation requirements. Saxenda® has now been launched in 23 countries.
BIOPHARMACEUTICALS, SALES DEVELOPMENT Sales of biopharmaceutical products declined by 18% measured in both Danish kroner and in local currencies to DKK 13,970 million. Sales were declining in North America Operations reflecting a negative impact of 24 percentage points from a generic version of the hormone replacement therapy product Vagifem® and from rebate adjustments for human growth hormone in Q1 2016, both in the USA. Sales in International Operations declined by 1% in Danish kroner and increased by 1% in local currencies.
Haemophilia Sales of haemophilia products increased by 1% measured in both Danish kroner and in local currencies to DKK 7,719 million. The sales increase was primarily driven by NovoSeven® and the roll-out of NovoEight® in Region Europe. This was partly offset by lower NovoSeven® sales in Region Latin America, Region AAMEO and Region Japan & Korea as well as North America Operations.
Human growth disorders Sales of human growth disorder products decreased by 25% measured in Danish kroner and by 24% in local currencies to DKK 4,946 million. The sales decline reflects the significant positive non-recurring adjustment in the USA in the first quarter of 2016, related to rebates in the Medicaid patient segment for the period 2010-2015, as well as an impact from intensified competition impacting realised prices and to some extent volumes in the USA. Declining sales was also observed in International Operations driven by Region AAMEO and Region Europe partly offset by Region Japan & Korea. Novo Nordisk is the leading company in the global human growth disorder market with a 29% market share measured in volume.

Financial report for the period 1 January 2017 to 30 September 2017 Page 12 of 34
Financial Performance Outlook R&D Sustainability Equity Corporate
governance Legal Financial Information
Company announcement No 83 / 2017
Other biopharmaceuticals Sales of other products within biopharmaceuticals, which predominantly consist of hormone replacement therapy-related (HRT) products, declined by 54% measured in both Danish kroner and in local currencies to DKK 1,305 million. The sales decline reflects a negative impact from the launch of a generic version of Vagifem® in the USA in the fourth quarter of 2016.
DEVELOPMENT IN COSTS AND OPERATING PROFIT The cost of goods sold increased by 5% in Danish kroner and by 6% in local currencies to DKK 12,932 million, resulting in a gross margin of 84.6% measured in both Danish kroner and in local currencies, compared with 85.1% in 2016. The gross margin was negatively impacted by lower prices primarily reflecting intensified competition in the insulin segment and the non-recurring Medicaid rebate adjustments in 2016, both in the USA. In addition, the gross margin was negatively impacted by asset impairments and slightly lower capacity utilisation. The gross margin development was partly offset by a positive contribution from product mix due to higher Victoza® and Tresiba® sales, countered by lower sales of Vagifem® following the launch of a generic version in the USA. Sales and distribution costs decreased by 2% in Danish kroner and by 1% in local currencies to DKK 20,045 million. The decline in sales and distribution costs reflects lower promotional activities in the USA following the Tresiba® launch in 2016, reduced manning and broad cost control initiatives, partly offset by increased sales force and promotional costs in Region Latin America and Region China as well as increased costs related to legal cases. Research and development costs decreased by 1% in Danish kroner and remained broadly unchanged in local currencies to DKK 10,031 million. The development in costs measured in local currencies reflects an increase in development costs due to the PIONEER programme for oral semaglutide, where all 10 planned trials have now been fully recruited, partly countered by an impact related to the completion of the cardiovascular outcomes trial DEVOTE and by lower biopharmaceuticals development costs following the completion of the regulatory process for N9-GP. The increase in development costs were partially offset by lower research costs following the updated R&D strategy announced in October 2016 leading to the discontinuation of a number of research projects. Administration costs decreased by 5% in Danish kroner and by 4% in local currencies to DKK 2,666 million. The lower administrative costs are mainly related to general cost control initiatives. Other operating income (net) was DKK 890 million compared with DKK 640 million in 2016. The increase in Other operating income reflects the positive contribution from the divestment of the C5aR inflammation asset to Innate Pharma in the third quarter of 2017.
Financial report for the period 1 January 2017 to 30 September 2017 Page 13 of 34
Financial Performance Outlook R&D Sustainability Equity Corporate
governance Legal Financial Information
Company announcement No 83 / 2017
Operating profit increased by 5% in Danish kroner and by 6% in local currencies to DKK 38,920 million.
FINANCIAL ITEMS (NET) Financial items (net) showed a loss of DKK 811 million compared with a loss of DKK 370 million in 2016. In line with Novo Nordisk’s treasury policy, Novo Nordisk hedges the most significant foreign exchange risks for the group mainly through foreign exchange forward contracts. The foreign exchange (net) result was a loss of DKK 740 million compared with a loss of DKK 349 million in 2016. The development in the first nine months of 2017 primarily reflects loss on foreign exchange hedging involving the US dollar and Chinese yuan versus the Danish krone. The financial items (net) for the first nine months of 2017 is after a positive market value of financial contracts as per the end of September 2017 of approximately DKK 2 billion has been deferred for income recognition later in 2017 and 2018.
CAPITAL EXPENDITURE AND FREE CASH FLOW Net capital expenditure for property, plant and equipment was DKK 5.6 billion compared with DKK 4.6 billion in 2016. Net capital expenditure was primarily related to investments in a new production facility for a range of diabetes active pharmaceutical ingredients in Clayton, North Carolina, USA, a new diabetes care filling capacity in Hillerød, Denmark and an expansion of the manufacturing capacity for biopharmaceutical products in Kalundborg, Denmark. Free cash flow was DKK 29.7 billion compared with DKK 31.6 billion in 2016. The decrease of 6% compared with 2016 primarily reflects a negative impact from higher income taxes paid.
KEY DEVELOPMENTS IN THE THIRD QUARTER OF 2017 Please refer to appendix 1 for an overview of the quarterly numbers in DKK and to appendix 6 for details on sales in the third quarter of 2017. Sales in the third quarter of 2017 decreased by 3% in Danish kroner and increased by 2% in local currencies compared with the same period in 2016. Sales growth measured in local currencies was driven by new-generation insulin, Victoza®, Saxenda® and NovoSeven® partly offset by Vagifem®, modern insulin, human growth disorders and human insulin. From a geographic perspective, sales growth in local currencies was driven by International Operations growing by 7%, partly offset by a decline in sales of 3% in North America Operations. The declining sales in North America Operations reflect lower Vagifem® sales following the launch of a generic version and an impact from rebate and price adjustments for diabetes care products, both in the USA. The gross margin was 83.9% in the third quarter of 2017 compared with 85.5% in the same period last year. The decline of 1.6 percentage points of the gross margin reflects a negative currency impact of 0.9 percentage point, a negative price effect in the USA,

Financial report for the period 1 January 2017 to 30 September 2017 Page 14 of 34
Financial Performance Outlook R&D Sustainability Equity Corporate
governance Legal Financial Information
Company announcement No 83 / 2017
partly related to rebate and price adjustments as well as slightly lower capacity utilisation for certain products, partly offset by a positive impact from product mix. Sales and distribution costs decreased by 5% in Danish kroner and by 1% in local currencies compared with the same period in 2016 reflecting lower promotional activities in the USA following the Tresiba® launch in 2016, reduced manning and broad cost control initiatives, partly offset by increased sales and distribution costs in International Operations across all regions. Research and development costs decreased by 4% in Danish kroner and by 2% in local currencies compared with the same period in 2016. The decrease in costs is driven by lower research costs following the updated R&D strategy announced in October 2016 leading to the discontinuation of a number of research projects. Development costs increased predominantly due to the PIONEER development programme for oral semaglutide and other diabetes care development programmes partly offset by lower costs related to the completion of the cardiovascular outcomes trial DEVOTE. Administrative costs decreased by 12% in Danish kroner and by 9% in local currencies compared with the same period in 2016. The declining costs reflect severance costs in third quarter of 2016 as well as general cost control initiatives. Other operating income (net) was DKK 423 million in the third quarter of 2017 compared with DKK 202 million in the same period last year. The increase in Other operating income reflects the positive contribution from the divestment of the C5aR inflammation asset to Innate Pharma. Operating profit decreased by 3% in Danish kroner and increased by 5% in local currencies compared with the same period in 2016.

Financial report for the period 1 January 2017 to 30 September 2017 Page 15 of 34
Financial Performance Outlook R&D Sustainability Equity Corporate
governance Legal Financial Information
Company announcement No 83 / 2017
OUTLOOK
OUTLOOK 2017 The current expectations for 2017 are summarised in the table below:
For 2017, sales growth is now expected to be in the range of 2% to 3% growth, measured in local currencies. This reflects expectations for continued robust performance for Victoza® and Tresiba® as well as a contribution from Saxenda® and Xultophy®. This is expected to be partly countered by an impact from lower realised prices in the USA, especially in the basal insulin and growth hormone segments, the loss of exclusivity for Vagifem® in the USA and further intensifying global competition within diabetes care and biopharmaceuticals. Given the current exchange rates versus the Danish krone, growth reported in DKK is now expected to be around 2 percentage points lower than the local currency level. For 2017, operating profit growth is now expected to be in the range of 3% to 6% growth, measured in local currencies. The increased expectation for operating profit growth primarily reflects the updated outlook for sales growth and the impact from broad cost control measures. The outlook also reflects a planned increase in fourth quarter of 2017 in the sales and distribution cost ratio to support commercialisation efforts for key products as well as in the research and development cost ratio to support the progress of Novo Nordisk’s pipeline. Given the current exchange rates versus the Danish krone, growth reported in DKK is now expected to be around 3 percentage points lower than the local currency level. For full year 2017, Novo Nordisk now expects financial items (net) to amount to a loss of around DKK 0.3 billion. The current expectation for full year 2017 reflects losses on non-hedged currencies partly offset by gains associated with foreign exchange hedging contracts, mainly related to the US dollar and Japanese yen versus the Danish krone. The expectation for financial items (net) reflects that approximately DKK 0.6
Expectations are as reported,if not otherwise stated
Expectations 1 November 2017
Expectations 9 August 2017
Sales growthin local currencies 2% to 3% 1% to 3%
as reported Around 2 percentage points lower Around 3 percentage points lower
Operating profit growthin local currencies 3% to 6% 1% to 5%
as reported Around 3 percentage points lower Around 4 percentage points lower
Financial items (net) Loss of around DKK 0.3 billion Loss of around DKK 0.2 billion
Effective tax rate 21% to 22% 21% to 22%
Capital expenditure Around DKK 9 billion Around DKK 9.5 billion
Depreciation, amortisationand impairment losses Around DKK 3.5 billion Around DKK 3.0 billion
Free cash flow DKK 30-34 billion DKK 29-33 billion

Financial report for the period 1 January 2017 to 30 September 2017 Page 16 of 34
Financial Performance Outlook R&D Sustainability Equity Corporate
governance Legal Financial Information
Company announcement No 83 / 2017
billion in relation to foreign exchange hedging contracts as per 27 October 2017 would be deferred for income recognition in 2018. The effective tax rate for 2017 is expected to be in the range of 21-22%, a level broadly similar to the statutory corporate tax rate in Denmark of 22%. Capital expenditure is now expected to be around DKK 9 billion in 2017, primarily related to investments in additional capacity for active pharmaceutical ingredient production within diabetes care, a capacity expansion of the diabetes care filling and an expansion of the manufacturing capacity for biopharmaceutical products. Depreciation, amortisation and impairment losses are now expected to be around DKK 3.5 billion. Free cash flow is now expected to be DKK 30-34 billion. With regard to the financial outlook for 2018, Novo Nordisk expects to provide detailed guidance on expectations in connection with the release of the full-year financial results for 2017 on 1 February 2018. At present, the preliminary plans for 2018 in local currencies indicate low to mid single-digit growth in sales and low to mid single-digit growth in operating profit. The preliminary plans reflect expectations for continued robust performance of Victoza®, of the portfolio of new-generation insulins and modern insulins as well as a positive sales contribution from Saxenda® and the expected launch of semaglutide. Sales growth from these products are expected to be partly countered by intensifying global competition both within diabetes care and biopharmaceuticals, especially within the haemophilia inhibitor segment, as well as continued pricing pressure within diabetes care especially in the USA. Overall, the expectations are based on an assumption of a broadly unchanged global macroeconomic environment. Given the current level of exchange rates versus the Danish krone, reported sales growth in 2018 is expected to be 3 percentage points lower than in local currencies and reported operating profit growth in 2018 is expected to be 4 percentage points lower. All of the above expectations are based on the assumptions that the global economic and political environment will not significantly change business conditions for Novo Nordisk during 2017 and 2018, and that currency exchange rates, especially the US dollar, will remain at the current level versus the Danish krone. Please refer to appendix 7 for key currency assumptions. Novo Nordisk has hedged expected net cash flows in a number of invoicing currencies and, all other things being equal, movements in key invoicing currencies will impact Novo Nordisk’s operating profit as outlined in the table below.

Financial report for the period 1 January 2017 to 30 September 2017 Page 17 of 34
Financial Performance Outlook R&D Sustainability Equity Corporate
governance Legal Financial Information
Company announcement No 83 / 2017
Key invoicing currencies
Impact on Novo Nordisk’s operating profit in the next 12 months of a 5% immediate movement in currency
Hedging period (months)
USD DKK 1,900 million 12
CNY DKK 305 million 6*
JPY DKK 185 million 12
GBP DKK 85 million 12
CAD DKK 80 million 11
* Chinese yuan traded offshore (CNH) used as proxy when hedging Novo Nordisk’s CNY currency exposure
The financial impact from foreign exchange hedging is included in Financial items (net).
RESEARCH & DEVELOPMENT UPDATE
DIABETES CHMP endorses Tresiba® (NN1250) label update in the EU – new label reflects significant reduction in the risk of severe hypoglycaemia In September 2017, Novo Nordisk announced that the Committee for Medicinal Products for Human Use (CHMP), under the European Medicines Agency (EMA), had endorsed an update of the EU label with immediate effect for Tresiba® (insulin degludec) to include results from the DEVOTE trial on severe hypoglycaemia. DEVOTE is a randomised, multinational and double-blinded trial conducted to confirm the cardiovascular safety of Tresiba® compared to insulin glargine U100 when added to standard of care, in people with type 2 diabetes. In the DEVOTE trial, the primary endpoint was achieved by demonstrating non-inferiority of major adverse cardiovascular events with Tresiba® compared to insulin glargine U100. Severe hypoglycaemia was evaluated as a secondary endpoint in the trial and 27% fewer patients in the Tresiba® treated group experienced an episode of severe hypoglycaemia, resulting in a 40% overall rate reduction of total episodes of adjudicated severe hypoglycaemia. Furthermore, patients in the Tresiba® treated group experienced a 53% relative reduction in the rate of nocturnal severe hypoglycaemia. These differences were all statistically significant. Novo Nordisk’s new fast-acting mealtime insulin Fiasp® (NN1218) approved in the USA In September 2017, Novo Nordisk announced that the US Food and Drug Administration (FDA) had approved Fiasp® (fast-acting insulin aspart), a new fast-acting mealtime insulin, for the treatment of adults with diabetes. The FDA’s decision comes after Fiasp® in clinical trials demonstrated benefits for people in need of improved overall glucose control. Fiasp® is an innovative formulation of insulin aspart (NovoLog®), developed with the aim of obtaining pharmacokinetic and pharmacodynamic properties that more

Financial report for the period 1 January 2017 to 30 September 2017 Page 18 of 34
Financial Performance Outlook R&D Sustainability Equity Corporate
governance Legal Financial Information
Company announcement No 83 / 2017
closely match the natural physiological insulin mealtime response of a person without diabetes. In clinical trials, Fiasp® has demonstrated clinically relevant improvement in long-term glucose level (HbA1c). These results were achieved with a comparable overall rate of severe or blood-sugar confirmed hypoglycaemia between Fiasp® and insulin aspart. Victoza® (NN2211) approved in the USA as the only type 2 diabetes treatment indicated to reduce the risk of major adverse cardiovascular events In August 2017, the FDA approved a new indication for Victoza® (liraglutide) to reduce the risk of major adverse cardiovascular (CV) events in adults with type 2 diabetes and established CV disease. The FDA’s decision was based on the results from the LEADER trial, which demonstrated that Victoza® statistically significantly reduced the risk of cardiovascular death, non-fatal heart attack or non-fatal stroke by 13% vs placebo, when added to standard of care. The reduction reflects that 14.9% of patients on placebo experienced cardiovascular death, non-fatal heart attack or non-fatal stroke versus 13.0% of patients on Victoza®; the absolute risk reduction for Victoza® was 1.9 percentage points. The overall risk reduction was derived from a statistically significant 22% reduction in cardiovascular death with Victoza® treatment vs placebo, with 6.0% of patients on placebo experiencing a cardiovascular death versus 4.7% of patients on Victoza® leading to an absolute risk reduction for Victoza® of 1.3 percentage points, as well as non-significant reductions in non-fatal heart attack and non-fatal stroke. LEADER was a multicentre, international, randomised, double-blind, placebo-controlled trial, investigating the long-term (3.5–5 years) effects of Victoza® compared to placebo, both in addition to standard of care, in people with type 2 diabetes at high risk of major cardiovascular events. The landmark LEADER trial was initiated in September 2010 and randomised 9,340 people with type 2 diabetes from 32 countries. Semaglutide (NN9536) superior to dulaglutide on glucose control and weight loss in people with type 2 diabetes in SUSTAIN 7 In August 2017, Novo Nordisk announced the SUSTAIN 7 trial results, demonstrating that people with type 2 diabetes treated with once-weekly semaglutide experienced superior reduction in HbA1c and body weight compared to treatment with dulaglutide. The 40-week trial investigated the efficacy and safety of 0.5 mg semaglutide compared with 0.75 mg dulaglutide and 1.0 mg semaglutide compared with 1.5 mg dulaglutide, when added to metformin. From a mean baseline HbA1c of 8.2%, 0.5 mg semaglutide achieved a statistically significant and superior reduction of 1.5% compared with a reduction of 1.1% with 0.75 mg dulaglutide. People treated with 1.0 mg semaglutide experienced a statistically significant and superior reduction of 1.8% compared with a reduction of 1.4% with 1.5 mg dulaglutide. Using the American Diabetes Association (ADA) treatment target of HbA1c below or equal to 7.0%, 68% of people treated with 0.5 mg semaglutide, compared with 52% of people treated with 0.75 mg dulaglutide, reached the treatment goal, and 79% of
Financial report for the period 1 January 2017 to 30 September 2017 Page 19 of 34
Financial Performance Outlook R&D Sustainability Equity Corporate
governance Legal Financial Information
Company announcement No 83 / 2017
people treated with 1.0 mg semaglutide, compared to 67% with 1.5 mg dulaglutide reached the treatment goal. Using the American Association of Clinical Endocrinologists (AACE) treatment target of HbA1c below or equal to 6.5%, 49% of people treated with 0.5 mg semaglutide compared with 34% of people treated with 0.75 mg dulaglutide reached the treatment goal, and 67% of people treated with 1.0 mg semaglutide compared to 47% with 1.5 mg dulaglutide reached the treatment goal. Furthermore, from a mean baseline body weight of 95 kg and a BMI of 33.5 kg/m2, people treated with 0.5 mg semaglutide experienced a statistically significant and superior weight loss of 4.6 kg compared to 2.3 kg with 0.75 mg dulaglutide. People treated with 1.0 mg semaglutide experienced a statistically significant and superior weight loss of 6.5 kg compared to 3.0 kg with 1.5 mg dulaglutide. 44% of people treated with 0.5 mg semaglutide compared with 23% of people treated with 0.75 mg dulaglutide achieved more or equal to 5% body weight loss and 63% of people with 1.0 mg semaglutide compared with 30% of people treated with 1.5 mg dulaglutide. In the trial, semaglutide demonstrated a safe and well-tolerated profile consistent with results from the SUSTAIN programme. The most common adverse event for both semaglutide dosages was mild to moderate nausea, which was overall comparable to dulaglutide and diminished over time. Premature treatment discontinuation due to adverse events was less than 10% across all treatment groups. The number of people reporting an adverse event of diabetic retinopathy was low and comparable in both the semaglutide and dulaglutide groups (4 and 5 events, respectively). Semaglutide (NN9536) received positive 16-0 vote in favour of approval from FDA Advisory Committee In December 2016, Novo Nordisk submitted the New Drug Application (NDA) to the FDA for once-weekly semaglutide based on a global development programme involving more than 8,000 adults with type 2 diabetes in eight SUSTAIN phase 3a clinical trials, including a cardiovascular outcomes trial. In October 2017, the FDA called for an Endocrinologic and Metabolic Drugs Advisory Committee (EMDAC), where the panel members were asked to discuss whether Novo Nordisk had provided adequate evidence to establish the efficacy and safety profile of semaglutide for the treatment of type 2 diabetes in adults. The members of the EMDAC voted 16-0 in favour of the approval of once-weekly semaglutide to improve glycaemic control in adults with type 2 diabetes. One member of the committee abstained. BIOPHARMACEUTICALS Novo Nordisk has completed the main phase of the phase 3a trial with NovoEight® (NN7008) in paediatric previously untreated patients with haemophilia A Novo Nordisk has completed the main phase of the guardian 4 trial with NovoEight®. The guardian 4 trial is a prospective phase 3a trial evaluating safety and efficacy of NovoEight® in previously untreated patients (age <6 years). The primary endpoint in the trial was the incidence rate of FVIII inhibitors in the main phase of the trial.

Financial report for the period 1 January 2017 to 30 September 2017 Page 20 of 34
Financial Performance Outlook R&D Sustainability Equity Corporate
governance Legal Financial Information
Company announcement No 83 / 2017
In the main phase, 24 out of 56 patients (42.9%) developed an inhibitor, which is within the range of expectation for the patient population recruited for the trial. Analysis demonstrated that the presence of a high-risk gene mutation was the only associated risk factor for inhibitor development. No other safety concerns were observed in the trial. The extension phase of the guardian 4 trial is ongoing and the trial is expected to conclude in second half of 2018. Concizumab (NN7415) phase 2 trials initiated In August 2017, Novo Nordisk initiated two phase 2 trials for concizumab named explorer 4 and explorer 5. Explorer 4 is a global open-label randomised trial including 24 people with haemophilia A or B with inhibitors. The trial objective is to demonstrate that concizumab is efficacious in preventing bleeding episodes in comparison to on-demand-treatment and to establish the safety of the use of rFVIIa for the treatment of breakthrough bleeding episodes in people with haemophilia A or B with inhibitors. Explorer 5 is a global open-label trial including 30 people with haemophilia A. The trial objective is to demonstrate that concizumab is efficacious in preventing bleeding episodes in people with haemophilia A.
SUSTAINABILITY UPDATE
The number of employees in Novo Nordisk decreased by 2.2% The number of full-time equivalent employees at the end of the first nine months of 2017 decreased by 2.2% compared with 12 months ago. The total number of employees was 42,247, corresponding to 41,656 full-time positions. The decrease is the result of workforce reductions in North America Operations and Region Europe effectuated in the last quarter of 2016 and the transferral of the Steno Diabetes Center to the Capital Region of Denmark as of 1 January 2017. Areas in which there was notable growth include Region AAMEO and the Global Shared Service Center in Bangalore, India. Cities Changing Diabetes partnership set goals to prevent more than 100 million new diabetes cases by 2045 An international coalition of cities has called for an ambitious global goal to prevent more than 100 million new cases of diabetes by 2045. The target is set out alongside new research in a report launched in October by the Cities Changing Diabetes partnership at a global summit in Houston, Texas. Achieving the goal requires cutting rates of obesity by a quarter, which would prevent more than 100 million people globally developing diabetes and could lead to savings of USD 200 billion annually by 2045.

Financial report for the period 1 January 2017 to 30 September 2017 Page 21 of 34
Financial Performance Outlook R&D Sustainability Equity Corporate
governance Legal Financial Information
Company announcement No 83 / 2017
EQUITY
Total equity was DKK 46,946 million at the end of the first nine months of 2017, equivalent to 48.0% of total assets, compared with 47.3% at the end of the first nine months of 2016. Please refer to appendix 5 for further elaboration of changes in equity.
2017 share repurchase programme On 9 August 2017, Novo Nordisk announced a share repurchase programme of DKK 3.9 billion to be executed from 9 August to 30 October 2017, as part of an overall 2017 programme of up to DKK 16 billion to be executed during a 12-month period. The purpose of the programme is to reduce the company’s share capital and to meet obligations arising from share-based incentive programmes. Under the programme, Novo Nordisk has repurchased 12,943,860 B shares for an amount of DKK 3.9 billion in the period from 9 August to 30 October 2017. The programme was concluded on 30 October 2017. As of 30 October 2017, Novo Nordisk A/S and its wholly-owned affiliates owned 45,995,383 of its own B shares, corresponding to 1.8% of the total share capital. As of 30 October 2017, Novo Nordisk A/S has repurchased a total of 44,891,831 B shares equal to a transaction value of DKK 12.2 billion under the up to DKK 16 billion programme beginning 2 February 2017. The Board of Directors has based on the increased expectations for cash flow generation in 2017 approved an expansion of the 2017 share repurchase programme with DKK 1.0 billion to DKK 17 billion. The execution of Novo Nordisk’s 2017 share repurchase programme of DKK 17 billion to be executed during a 12-month period beginning 2 February 2017 continues, and a new share repurchase programme has been initiated in accordance with Article 5 of Regulation No 596/2014 of the European Parliament and Council of 16 April 2014 (MAR). For that purpose, Novo Nordisk has appointed Nordea Danmark, filial af Nordea Bank AB (publ) as lead manager to execute the programme independently and without influence from Novo Nordisk. The purpose of the programme is to reduce the company's share capital and to meet obligations arising from share-based incentive programmes. Under the agreement, Nordea Danmark, filial af Nordea Bank AB (publ) will repurchase shares on behalf of Novo Nordisk for an amount of DKK 4.8 billion during the trading period starting today, 1 November and ending on 30 January 2018. A maximum of 641,356 shares can be bought during one single trading day, equal to 20% of the average daily trading volume of Novo Nordisk B shares on Nasdaq Copenhagen during the month of October 2017, and a maximum of 37,198,648 shares in total can be bought during the trading period. At least once every seven trading days, Novo Nordisk will issue an announcement in respect of the transactions made under the repurchase programme.
Financial report for the period 1 January 2017 to 30 September 2017 Page 22 of 34
Financial Performance Outlook R&D Sustainability Equity Corporate
governance Legal Financial Information
Company announcement No 83 / 2017
CORPORATE GOVERNANCE
Changes in Novo Nordisk’s management As of 1 October 2017, Camilla Sylvest was appointed executive vice president of Commercial Strategy & Corporate Affairs. She will be overall responsible for the company’s corporate functions within marketing, market access, strategy, communication, stakeholder relations and sustainability. Camilla Sylvest has from August 2015 to September 2017 served as senior vice president and general manager of Novo Nordisk’s Region China. She started her career in Novo Nordisk in 1996, following which she had roles in headquarters and regions within pricing, health economics, marketing and sales effectiveness. She holds an MSc in Economics from University of Southern Denmark and an Executive MBA from Scandinavian International Management Institute. Furthermore, effective from 15 August 2017, Doug Langa, head of North America Operations was promoted to executive vice president. His responsibilities remain unchanged. Doug Langa joined the company in 2011 and has over 25 years of experience in the pharmaceutical and medical device industry. He graduated from Widener University and earned his MBA from Fordham University. With these changes, the members of Novo Nordisk’s Executive Management are:
• Lars Fruergaard Jørgensen, president and CEO • Jesper Brandgaard, EVP, CFO and head of Biopharm • Maziar Mike Doustdar, EVP, International Operations (based in Zurich,
Switzerland) • Lars Green, EVP, Business Services & Compliance • Doug Langa, EVP, North America Operations (based in Princeton, New Jersey,
USA) • Camilla Sylvest, EVP, Commercial Strategy & Corporate Affairs • Mads Krogsgaard Thomsen, EVP, chief science officer • Henrik Wulff, EVP, Product Supply
Only Danish-based members of Executive Management are registered with the Danish Business Authority.
LEGAL MATTERS
Novo Nordisk reaches resolution with the US federal government and various states about an investigation concerning sales and marketing practices for Victoza® On 5 September 2017, Novo Nordisk announced a resolution with the US federal government and various states about an investigation launched in February 2011 concerning sales and marketing practices for Victoza®. The settlement resolved claims alleging Novo Nordisk did not fully comply with communicating safety information based on a U.S. Food and Drug Administration (FDA)-approved Risk Evaluation and Mitigation

Financial report for the period 1 January 2017 to 30 September 2017 Page 23 of 34
Financial Performance Outlook R&D Sustainability Equity Corporate
governance Legal Financial Information
Company announcement No 83 / 2017
Strategy (REMS) for Victoza®. In connection with this settlement, Novo Nordisk has also resolved several private whistle-blower cases related to the government’s investigation. Novo Nordisk has been informed that allegations raised in a separate whistle-blower lawsuit relating to the promotion of Victoza® from 2015 to the present, a period outside the scope of the underlying US federal government investigation, will not be pursued by the US federal or state governments and the complaint filed against Novo Nordisk in connection with those claims is hence expected to be dismissed.
Product liability lawsuits related to Victoza® As of 30 October 2017, Novo Nordisk, along with the majority of incretin-based product manufacturers in the US, is a defendant in product liability lawsuits related to use of incretin-based medications. To date, 242 plaintiffs have named Novo Nordisk in product liability lawsuits, predominantly claiming damages for pancreatic cancer that allegedly developed as a result of using Victoza® and other GLP-1/DPP-IV (incretin-based) products. 161 of the Novo Nordisk plaintiffs have also named other defendants in their lawsuits. Most Novo Nordisk plaintiffs have filed suit in California federal and state courts. In November 2015, the California federal and state courts overseeing the vast majority of cases in the incretin-based products liability litigation issued an order granting the defendants’ motion for summary judgment on federal pre-emption in all pancreatic cancer cases before those courts as of mid-Q4 2015. As a result of these rulings, 237 of the pancreatic cancer claims naming Novo Nordisk have been dismissed or stayed pending the outcome of an appeal. Currently, Novo Nordisk does not have any individual trials scheduled in 2017. Novo Nordisk does not expect the pending claims to have a material impact on its financial position, operating profit and cash flow.

Financial report for the period 1 January 2017 to 30 September 2017 Page 24 of 34
Financial Performance Outlook R&D Sustainability Equity Corporate
governance Legal Financial Information
Company announcement No 83 / 2017
FORWARD-LOOKING STATEMENTS Novo Nordisk’s reports filed with or furnished to the US Securities and Exchange Commission (SEC), including this document as well as the company’s Annual Report 2016 and Form 20-F, both filed with the SEC in February 2017, and written information released, or oral statements made, to the public in the future by or on behalf of Novo Nordisk, may contain forward-looking statements. Words such as ‘believe’, ‘expect’, ‘may’, ‘will’, ‘plan’, ‘strategy’, ‘prospect’, ‘foresee’, ‘estimate’, ‘project’, ‘anticipate’, ‘can’, ‘intend’, ‘target’ and other words and terms of similar meaning in connection with any discussion of future operating or financial performance identify forward-looking statements. Examples of such forward-looking statements include, but are not limited to: statements of targets, plans, objectives or goals for future operations, including those
related to Novo Nordisk’s products, product research, product development, product introductions and product approvals as well as cooperation in relation thereto
statements containing projections of or targets for revenues, costs, income (or loss), earnings per share, capital expenditures, dividends, capital structure, financial items (net) and other financial measures
statements regarding future economic performance, future actions and outcome of contingencies such as legal proceedings
statements regarding the assumptions underlying or relating to such statements. In this document, examples of forward-looking statements can be found under the headings ‘Outlook’, ‘Research and Development update’, Equity’ and ‘Legal matters’. These statements are based on current plans, estimates and projections. By their very nature, forward-looking statements involve inherent risks and uncertainties, both general and specific. Novo Nordisk cautions that a number of important factors, including those described in this document, could cause actual results to differ materially from those contemplated in any forward-looking statements. Factors that may affect future results include, but are not limited to, global as well as local political and economic conditions, including interest rate and currency exchange rate fluctuations, delay or failure of projects related to research and/or development, unplanned loss of patents, interruptions of supplies and production, product recalls, unexpected contract breaches or terminations, government-mandated or market-driven price decreases for Novo Nordisk’s products, introduction of competing products, reliance on information technology, Novo Nordisk’s ability to successfully market current and new products, exposure to product liability and legal proceedings and investigations, changes in governmental laws and related interpretation thereof, including on reimbursement, intellectual property protection and regulatory controls on testing, approval, manufacturing and marketing, perceived or actual failure to adhere to ethical marketing practices, investments in and divestitures of domestic and foreign companies, unexpected growth in costs and expenses, failure to recruit and retain the right employees, and failure to maintain a culture of compliance. Please also refer to the overview of risk factors in ‘Risk management’ on pp 40-43 of the Annual Report 2016 available on novonordisk.com. Unless required by law, Novo Nordisk is under no duty and undertakes no obligation to update or revise any forward-looking statement after the distribution of this document, whether as a result of new information, future events or otherwise.
Financial report for the period 1 January 2017 to 30 September 2017 Page 25 of 34
Financial Performance Outlook R&D Sustainability Equity Corporate
governance Legal Financial Information
Company announcement No 83 / 2017
MANAGEMENT STATEMENT
The Board of Directors and Executive Management have reviewed and approved the financial report of Novo Nordisk A/S for the first nine months of 2017. The financial report has not been audited or reviewed by the company’s independent auditors. The financial report for the first nine months of 2017 has been prepared in accordance with IAS 34 ‘Interim Financial Reporting’ and accounting policies set out in the Annual Report 2016 of Novo Nordisk, amended with accounting policy regarding associated companies. Furthermore, the financial report for the first nine months of 2017 and Management’s Review are prepared in accordance with additional Danish disclosure requirements for interim reports of listed companies. In our opinion, the accounting policies used are appropriate and the overall presentation of the financial report for the first nine months of 2017 is adequate. Furthermore, in our opinion, Management’s Review includes a true and fair account of the development in the operations and financial circumstances, of the results for the period and of the financial position of the Group as well as a description of the most significant risks and elements of uncertainty facing the Group in accordance with Danish disclosure requirements for listed companies. Besides what has been disclosed in the quarterly financial report, no changes in the Group’s most significant risks and uncertainties have occurred relative to what was disclosed in the consolidated annual report for 2016. Bagsværd, 1 November 2017 Executive Management:
Lars Fruergaard Jørgensen President and CEO
Jesper Brandgaard CFO
Lars Green
Camilla Sylvest
Mads Krogsgaard Thomsen
Henrik Wulff
Board of Directors:
Göran Ando Chairman
Jeppe Christiansen Vice chairman
Brian Daniels
Sylvie Grégoire Liz Hewitt Liselotte Hyveled
Kasim Kutay Anne Marie Kverneland Helge Lund
Søren Thuesen Pedersen Stig Strøbæk

Financial report for the period 1 January 2017 to 30 September 2017 Page 26 of 34
Financial Performance Outlook R&D Sustainability Equity Corporate
governance Legal Financial Information
Company announcement No 83 / 2017
FINANCIAL INFORMATION
APPENDIX 1: QUARTERLY NUMBERS IN DKK
(Amounts in DKK million, except number of full-time equivalent employees, earnings per share and number of shares outstanding).% change
Q3 2017 vsQ3 Q2 Q1 Q4 Q3 Q2 Q1 Q3 2016
Net sales 26,614 28,638 28,452 29,572 27,537 27,459 27,212 (3%)
Gross profit 22,342 24,229 24,201 24,654 23,551 23,414 22,978 (5%)Gross margin 83.9% 84.6% 85.1% 83.4% 85.5% 85.3% 84.4%
Sales and distribution costs 6,497 6,761 6,787 7,909 6,860 6,867 6,741 (5%)Percentage of sales 24.4% 23.6% 23.9% 26.7% 24.9% 25.0% 24.8%
Research and development costs 3,328 3,414 3,289 4,470 3,458 3,331 3,304 (4%)Percentage of sales 12.5% 11.9% 11.6% 15.1% 12.6% 12.1% 12.1%
Administrative costs 896 857 913 1,166 1,015 873 908 (12%)Percentage of sales 3.4% 3.0% 3.2% 3.9% 3.7% 3.2% 3.3%
Other operating income, net 423 189 278 97 202 154 284 109%
Operating profit 12,044 13,386 13,490 11,206 12,420 12,497 12,309 (3%)Operating margin 45.3% 46.7% 47.4% 37.9% 45.1% 45.5% 45.2%
Financial income 392 421 258 (21) (3) 93 23 N/AFinancial expenses (26) 1,164 744 243 116 (12) 379 (122%)Financial items (net) 418 (743) (486) (264) (119) 105 (356) (451%)
Profit before income taxes 12,462 12,643 13,004 10,942 12,301 12,602 11,953 1%
Income taxes 2,692 2,692 2,848 2,243 2,498 2,634 2,498 8%
Net profit 9,770 9,951 10,156 8,699 9,803 9,968 9,455 0%
Depreciation, amortisation and impairment losses 706 863 708 1,116 736 717 624 (4%)Capital expenditure (net) 2,098 1,934 1,604 2,502 1,784 1,684 1,091 18%Net cash generated from operating activities 12,921 10,117 12,098 11,153 15,189 14,497 7,475 (15%)Free cash flow 10,930 8,392 10,400 8,388 12,501 12,743 6,359 (13%)
Total assets 97,891 97,825 94,213 97,539 87,340 88,269 82,368 12%Total equity 46,946 48,436 40,301 45,269 41,327 42,585 37,284 14%Equity ratio 48.0% 49.5% 42.8% 46.4% 47.3% 48.2% 45.3%
Full-time equivalent employees end of period 41,656 41,385 41,636 41,971 42,605 42,265 41,571 (2%)
Basic earnings per share/ADR (in DKK) 3.96 4.01 4.07 3.46 3.88 3.93 3.72 2%Diluted earnings per share/ADR (in DKK) 3.96 4.01 4.06 3.46 3.87 3.92 3.71 2%Average number of shares outstanding (million) 2,465.6 2,480.2 2,495.8 2,512.6 2,526.5 2,536.3 2,544.3 (2%)Average number of diluted shares outstanding (million) 2,469.4 2,484.1 2,500.0 2,517.1 2,530.9 2,540.8 2,550.1 (2%)
Sales by business segment: New-generation insulin 2,099 2,493 1,692 1,707 1,143 983 626 84% Modern insulin 10,648 11,289 12,092 12,219 11,770 11,806 11,715 (10%) Human insulin 2,485 2,521 2,602 2,938 2,760 2,667 2,725 (10%) Total insulin 15,232 16,303 16,386 16,864 15,673 15,456 15,066 (3%)
Victoza® 5,343 5,775 5,750 5,397 5,106 4,952 4,591 5%
Other diabetes care 988 1,006 1,086 1,026 1,095 1,015 1,131 (10%)
Total diabetes care 21,563 23,084 23,222 23,287 21,874 21,423 20,788 (1%)
Obesity (Saxenda®) 640 686 539 540 418 376 243 53% Diabetes and obesity care total 22,203 23,770 23,761 23,827 22,292 21,799 21,031 0%
Haemophilia 2,404 2,739 2,576 2,821 2,285 2,530 2,836 5% Human growth disorders 1,621 1,679 1,646 2,202 2,003 2,158 2,407 (19%)
Other biopharmaceuticals 386 450 469 722 957 972 938 (60%) Biopharmaceuticals total 4,411 4,868 4,691 5,745 5,245 5,660 6,181 (16%)
Sales by geographic segment: North America Operations 13,532 15,103 14,940 15,873 14,719 14,453 14,197 (8%) - USA 12,967 14,583 14,402 15,343 14,174 13,947 13,730 (9%) International Operations 13,082 13,535 13,512 13,699 12,818 13,006 13,015 2% - Region Europe 5,190 5,355 5,226 5,275 5,093 5,298 5,016 2% - Region AAMEO 2,929 3,057 2,964 2,937 2,790 2,842 3,011 5% - Region China 2,531 2,608 3,060 2,540 2,534 2,509 2,875 (0%) - Region Japan & Korea 1,462 1,573 1,467 1,691 1,588 1,611 1,335 (8%) - Region Latin America 970 942 795 1,256 813 746 778 19%
Segment operating profit: Diabetes and obesity care 9,298 10,735 10,631 8,575 9,874 9,229 8,424 (6%) Biopharmaceuticals 2,746 2,651 2,859 2,631 2,546 3,268 3,885 8%
20162017
Financial report for the period 1 January 2017 to 30 September 2017 Page 27 of 34
Financial Performance Outlook R&D Sustainability Equity Corporate
governance Legal Financial Information
Company announcement No 83 / 2017
APPENDIX 2: INCOME STATEMENT AND STATEMENT OF COMPREHENSIVE INCOME
9M 9M Q3 Q3DKK million 2017 2016 2017 2016
Income statement
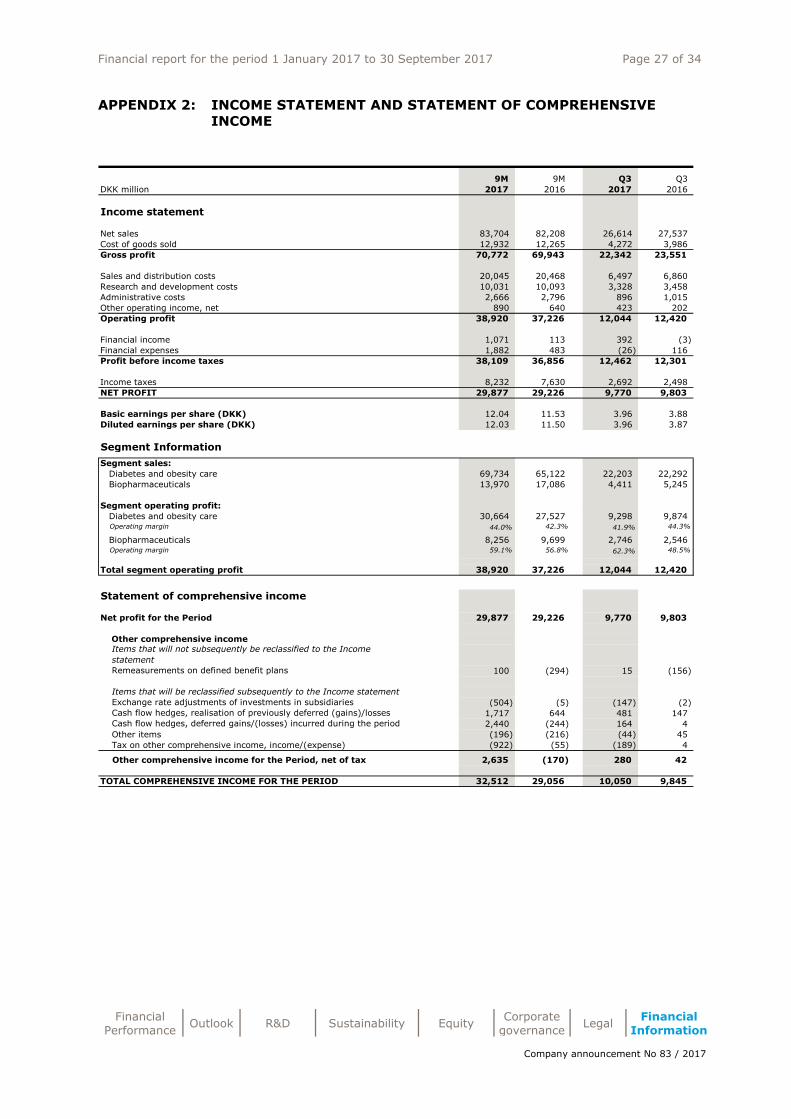
Net sales 83,704 82,208 26,614 27,537 Cost of goods sold 12,932 12,265 4,272 3,986 Gross profit 70,772 69,943 22,342 23,551 Sales and distribution costs 20,045 20,468 6,497 6,860 Research and development costs 10,031 10,093 3,328 3,458 Administrative costs 2,666 2,796 896 1,015 Other operating income, net 890 640 423 202 Operating profit 38,920 37,226 12,044 12,420
Financial income 1,071 113 392 (3) Financial expenses 1,882 483 (26) 116 Profit before income taxes 38,109 36,856 12,462 12,301
Income taxes 8,232 7,630 2,692 2,498 NET PROFIT 29,877 29,226 9,770 9,803
Basic earnings per share (DKK) 12.04 11.53 3.96 3.88 Diluted earnings per share (DKK) 12.03 11.50 3.96 3.87
Segment InformationSegment sales: Diabetes and obesity care 69,734 65,122 22,203 22,292 Biopharmaceuticals 13,970 17,086 4,411 5,245
Segment operating profit: Diabetes and obesity care 30,664 27,527 9,298 9,874 Operating margin 44.0% 42.3% 41.9% 44.3%
Biopharmaceuticals 8,256 9,699 2,746 2,546 Operating margin 59.1% 56.8% 62.3% 48.5%
Total segment operating profit 38,920 37,226 12,044 12,420
Statement of comprehensive income
Net profit for the Period 29,877 29,226 9,770 9,803
Other comprehensive income Items that will not subsequently be reclassified to the Income statement Remeasurements on defined benefit plans 100 (294) 15 (156)
Items that will be reclassified subsequently to the Income statement Exchange rate adjustments of investments in subsidiaries (504) (5) (147) (2) Cash flow hedges, realisation of previously deferred (gains)/losses 1,717 644 481 147 Cash flow hedges, deferred gains/(losses) incurred during the period 2,440 (244) 164 4 Other items (196) (216) (44) 45 Tax on other comprehensive income, income/(expense) (922) (55) (189) 4
Other comprehensive income for the Period, net of tax 2,635 (170) 280 42
TOTAL COMPREHENSIVE INCOME FOR THE PERIOD 32,512 29,056 10,050 9,845

Financial report for the period 1 January 2017 to 30 September 2017 Page 28 of 34
Financial Performance Outlook R&D Sustainability Equity Corporate
governance Legal Financial Information
Company announcement No 83 / 2017
APPENDIX 3: BALANCE SHEET
DKK million 30 Sep 2017 31 Dec 2016
ASSETS
Intangible assets 2,615 2,714 Property, plant and equipment 33,128 30,179 Investment in associated company 780 809 Deferred income tax assets 2,841 2,683 Other financial assets 1,433 1,388 TOTAL NON-CURRENT ASSETS 40,797 37,773
Inventories 15,230 14,341 Trade receivables 17,199 20,234 Tax receivables 322 1,552 Other receivables and prepayments 2,632 2,411 Marketable securities 3 2,009 Derivative financial instruments 2,574 529 Cash at bank 19,134 18,690 TOTAL CURRENT ASSETS 57,094 59,766
TOTAL ASSETS 97,891 97,539
EQUITY AND LIABILITIES
Share capital 500 510 Treasury shares (8) (9) Retained earnings 45,262 46,111 Other reserves 1,192 (1,343) TOTAL EQUITY 46,946 45,269
Deferred income tax liabilities 1,358 13 Retirement benefit obligations 1,331 1,451 Provisions 3,129 3,370 Total non-current liabilities 5,818 4,834
Current debt 260 229 Trade payables 4,530 6,011 Tax payables 5,565 3,976 Other liabilities 13,660 14,181 Derivative financial instruments 219 2,578 Provisions 20,893 20,461 Total current liabilities 45,127 47,436
TOTAL LIABILITIES 50,945 52,270
TOTAL EQUITY AND LIABILITIES 97,891 97,539

Financial report for the period 1 January 2017 to 30 September 2017 Page 29 of 34
Financial Performance Outlook R&D Sustainability Equity Corporate
governance Legal Financial Information
Company announcement No 83 / 2017
APPENDIX 4: STATEMENT OF CASH FLOWS
DKK million 9M 2017 9M 2016
Net profit 29,877 29,226
Adjustment for non-cash items: Income taxes in the Income Statement 8,232 7,630 Depreciation, amortisation and impairment losses 2,277 2,077 Other non-cash items 1,828 1,423 Change in working capital (1,836) (3,518) Interest received 90 110 Interest paid (69) (44) Income taxes paid (5,263) 257 Net cash generated from operating activities 35,136 37,161
Purchase of intangible assets (315) (941) Proceeds from sale of property, plant and equipment 6 2 Purchase of property, plant and equipment (5,102) (4,561) Proceeds from other financial assets 11 16 Purchase of other financial assets (40) (100) Sale of marketable securities 2,006 2,029 Purchase of marketable securities - (530) Dividend received from associated company 26 26 Net cash used in investing activities (3,408) (4,059)
Purchase of treasury shares, net (12,243) (10,962) Dividends paid (18,844) (23,830) Net cash used in financing activities (31,087) (34,792)
NET CASH GENERATED FROM ACTIVITIES 641 (1,690)
Cash and cash equivalents at the beginning of the year 18,461 15,850 Exchange gain/(loss) on cash and cash equivalents (229) (79) Cash and cash equivalents at the end of the period 18,873 14,081
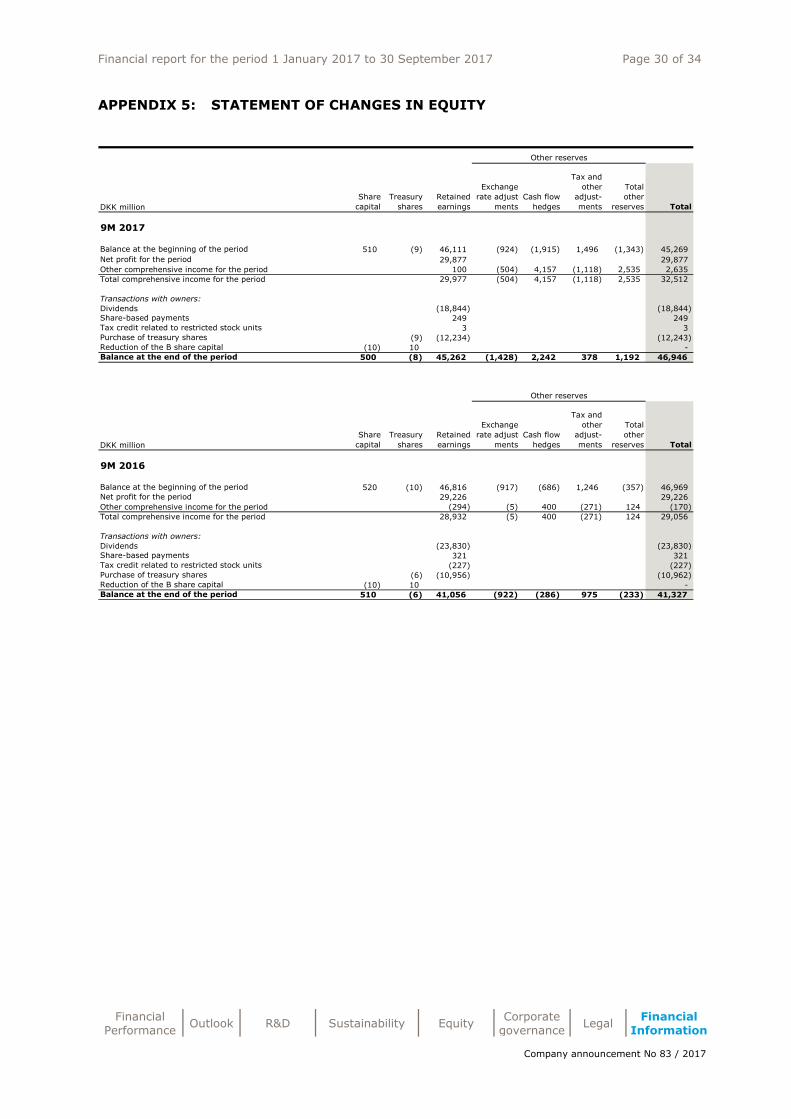
Financial report for the period 1 January 2017 to 30 September 2017 Page 30 of 34
Financial Performance Outlook R&D Sustainability Equity Corporate
governance Legal Financial Information
Company announcement No 83 / 2017
APPENDIX 5: STATEMENT OF CHANGES IN EQUITY
DKK millionShare
capital Treasury
shares Retained earnings
Exchange rate adjust-
ments Cash flow
hedges
Tax and other
adjust-ments
Total other
reserves Total
9M 2017
Balance at the beginning of the period 510 (9) 46,111 (924) (1,915) 1,496 (1,343) 45,269 Net profit for the period 29,877 29,877 Other comprehensive income for the period 100 (504) 4,157 (1,118) 2,535 2,635 Total comprehensive income for the period 29,977 (504) 4,157 (1,118) 2,535 32,512
Transactions with owners:Dividends (18,844) (18,844) Share-based payments 249 249 Tax credit related to restricted stock units 3 3 Purchase of treasury shares (9) (12,234) (12,243) Reduction of the B share capital (10) 10 - Balance at the end of the period 500 (8) 45,262 (1,428) 2,242 378 1,192 46,946
DKK millionShare
capital Treasury
shares Retained earnings
Exchange rate adjust-
ments Cash flow
hedges
Tax and other
adjust-ments
Total other
reserves Total
9M 2016
Balance at the beginning of the period 520 (10) 46,816 (917) (686) 1,246 (357) 46,969 Net profit for the period 29,226 29,226 Other comprehensive income for the period (294) (5) 400 (271) 124 (170) Total comprehensive income for the period 28,932 (5) 400 (271) 124 29,056
Transactions with owners:Dividends (23,830) (23,830) Share-based payments 321 321 Tax credit related to restricted stock units (227) (227) Purchase of treasury shares (6) (10,956) (10,962) Reduction of the B share capital (10) 10 - Balance at the end of the period 510 (6) 41,056 (922) (286) 975 (233) 41,327
Other reserves
Other reserves

Financial report for the period 1 January 2017 to 30 September 2017 Page 31 of 34
Financial Performance Outlook R&D Sustainability Equity Corporate
governance Legal Financial Information
Company announcement No 83 / 2017
APPENDIX 6: REGIONAL SALES SPLIT
Q3 2017 sales split per region
DKK million TotalNorth
America Operations
USA
Inter-national
Operations
Region Europe
Region AAMEO
Region China
Region Japan & Korea
Region Latin America
The diabetes and obesity care segmentNew-generation insulin 2,099 1,186 1,179 913 435 125 - 246 107 % change in local currencies 93% 115% 113% 71% 95% 100% - 38% 61%
Tresiba ® 1,758 1,168 1,163 590 242 67 - 182 99 % change in local currencies 75% 111% 110% 32% 37% 63% - 8% 63%
Modern insulin 10,648 5,231 5,058 5,417 2,101 1,423 1,331 361 201 % change in local currencies (5%) (13%) (14%) 6% (4%) 15% 14% (10%) 52%
NovoRapid ® 5,054 2,795 2,700 2,259 1,082 559 307 227 84 % change in local currencies 9% 7% 8% 10% 2% 20% 22% 0% 58%Levemir ® 3,163 2,078 2,011 1,085 567 224 175 30 89 % change in local currencies (23%) (31%) (32%) 1% (12%) 9% 26% (19%) 52%NovoMix ® 2,431 358 346 2,073 452 640 849 104 28 % change in local currencies 1% (12%) (11%) 4% (8%) 13% 9% (25%) 36%
Human insulin 2,485 487 447 1,998 437 532 718 55 256 % change in local currencies (6%) (11%) (11%) (5%) (11%) (11%) (2%) (18%) 16%Total insulin 15,232 6,904 6,684 8,328 2,973 2,080 2,049 662 564 % change in local currencies 2% (3%) (3%) 7% 2% 10% 8% 2% 36%Victoza® 5,343 3,974 3,842 1,369 855 197 51 143 123 % change in local currencies 9% 11% 11% 6% 7% 18% (23%) (2%) 9%Other diabetes care 988 223 185 765 155 127 375 92 16 % change in local currencies (5%) (11%) (14%) (2%) (10%) 11% (8%) 16% 55%Total diabetes care 21,563 11,101 10,710 10,462 3,983 2,404 2,475 897 703 % change in local currencies 4% 1% 1% 6% 3% 10% 4% 2% 31%Obesity (Saxenda®) 640 504 462 136 27 42 - - 67 % change in local currencies 59% 38% 36% 261% 286% 180% - - 325%Diabetes and obesity care total 22,203 11,605 11,173 10,598 4,010 2,446 2,475 897 770 % change in local currencies 5% 2% 2% 7% 3% 11% 4% 2% 38%
The biopharmaceuticals segmentHaemophilia 2,404 1,167 1,093 1,237 628 247 52 170 140 % change in local currencies 10% 1% 2% 20% 7% 98% 104% 6% 4%
NovoSeven ® 2,112 1,094 1,025 1,018 484 224 52 123 135 % change in local currencies 8% 2% 2% 16% 2% 84% 100% 1% 1%NovoEight ® 253 46 46 207 139 21 - 42 5 % change in local currencies 23% (17%) (16%) 38% 24% 2000% - 15% -
Human growth disorders 1,621 649 648 972 375 164 3 370 60 % change in local currencies (14%) (24%) (24%) (6%) (5%) (32%) 33% 8% 20%Other biopharmaceuticals 386 111 54 275 177 72 1 25 - % change in local currencies (58%) (82%) (90%) (1%) (2%) 11% 0% (12%) (100%)Biopharmaceuticals total 4,411 1,927 1,795 2,484 1,180 483 56 565 200 % change in local currencies (12%) (27%) (29%) 6% 1% 11% 94% 7% 7%
Total sales 26,614 13,532 12,967 13,082 5,190 2,929 2,531 1,462 970 % change in local currencies 2% (3%) (4%) 7% 3% 11% 5% 4% 31%% change as reported (3%) (8%) (9%) 2% 2% 5% 0% (8%) 19%Share of growth 100% (114%) (120%) 214% 34% 75% 31% 15% 59%
9M 2017 sales split per region
DKK million TotalNorth
America Operations
USA
Inter-national
Operations
Region Europe
Region AAMEO
Region China
Region Japan & Korea
Region Latin America
The diabetes and obesity care segmentNew-generation insulin 6,284 3,791 3,782 2,493 1,182 307 2 712 290 % change in local currencies 129% 204% 203% 67% 99% 65% - 37% 54%
Tresiba ® 5,447 3,735 3,730 1,712 717 184 2 540 269 % change in local currencies 118% 200% 199% 38% 59% 51% - 8% 56%
Modern insulin 34,029 17,457 16,921 16,572 6,386 4,274 4,188 1,138 586 % change in local currencies (3%) (10%) (10%) 6% (2%) 14% 16% (12%) 27%
NovoRapid ® 15,457 8,705 8,416 6,752 3,187 1,668 952 699 246 % change in local currencies 8% 7% 7% 10% 4% 20% 24% (1%) 40%Levemir ® 10,772 7,398 7,186 3,374 1,804 687 525 101 257 % change in local currencies (17%) (23%) (23%) 1% (7%) 4% 31% (20%) 20%NovoMix ® 7,800 1,354 1,318 6,446 1,395 1,919 2,711 338 83 % change in local currencies 1% (13%) (13%) 4% (7%) 13% 11% (26%) 15%
Human insulin 7,608 1,414 1,286 6,194 1,315 1,689 2,366 175 649 % change in local currencies (5%) 0% 1% (6%) (12%) (6%) (4%) (20%) 3%Total insulin 47,921 22,662 21,990 25,259 8,883 6,270 6,556 2,025 1,525 % change in local currencies 5% 3% 3% 6% 3% 9% 8% 0% 20%Victoza® 16,868 12,658 12,263 4,210 2,538 669 212 432 359 % change in local currencies 15% 19% 19% 6% 2% 26% 10% (2%) 15%Other diabetes care 3,080 679 560 2,401 453 364 1,252 289 43 % change in local currencies (3%) (5%) (7%) (2%) (6%) 4% (4%) (1%) 26%Total diabetes care 67,869 35,999 34,813 31,870 11,874 7,303 8,020 2,746 1,927 % change in local currencies 7% 8% 8% 6% 2% 10% 6% 0% 19%Obesity (Saxenda®) 1,865 1,489 1,373 376 66 116 - - 194 % change in local currencies 77% 53% 49% 439% 319% 300% - - 705% Diabetes and obesity care total 69,734 37,488 36,185 32,246 11,940 7,419 8,020 2,746 2,121 % change in local currencies 8% 9% 9% 7% 3% 11% 6% 0% 28%
The biopharmaceuticals segmentHaemophilia 7,719 3,768 3,623 3,951 2,106 799 164 495 387 % change in local currencies 1% 1% 2% 1% 13% (10%) 31% (4%) (22%)
NovoSeven® 6,775 3,450 3,315 3,325 1,672 753 163 359 378 % change in local currencies (2%) (1%) 0% (3%) 8% (14%) 31% (9%) (24%)NovoEight® 829 246 246 583 413 35 1 125 9 % change in local currencies 35% 30% 30% 38% 37% 386% - 10% -
Human growth disorders 4,946 1,836 1,831 3,110 1,185 541 11 1,175 198 % change in local currencies (24%) (45%) (45%) (1%) (3%) (22%) 0% 10% 29%Other biopharmaceuticals 1,305 483 313 822 540 191 4 86 1 % change in local currencies (54%) (77%) (84%) 4% 4% 4% 33% 9% (80%)Biopharmaceuticals total 13,970 6,087 5,767 7,883 3,831 1,531 179 1,756 586 % change in local currencies (18%) (34%) (35%) 1% 6% (13%) 29% 6% (11%)
Total sales 83,704 43,575 41,952 40,129 15,771 8,950 8,199 4,502 2,707 % change in local currencies 3% 0% 0% 5% 4% 6% 6% 2% 17%% change as reported 2% 0% 0% 3% 2% 4% 4% (1%) 16%Share of growth 100% 3% (1%) 97% 26% 25% 24% 4% 18%

Financial report for the period 1 January 2017 to 30 September 2017 Page 32 of 34
Financial Performance Outlook R&D Sustainability Equity Corporate
governance Legal Financial Information
Company announcement No 83 / 2017
APPENDIX 7: KEY CURRENCY ASSUMPTIONS
DKK per 100 2015 averageexchange rates
2016 averageexchange rates
YTD 2017 average exchange rates
as of 27 October 2017
Currentexchange rates
as of 27 October 2017
USD 673 673 666 641
CNY 107.0 101.3 98.0 96.4
JPY 5.56 6.21 5.94 5.62
GBP 1,028 911 851 839
CAD 527 508 511 498

Financial report for the period 1 January 2017 to 30 September 2017 Page 33 of 34
Financial Performance Outlook R&D Sustainability Equity Corporate
governance Legal Financial Information
Company announcement No 83 / 2017
APPENDIX 8: QUARTERLY NUMBERS IN USD (ADDITIONAL INFORMATION)
(Amounts in USD million, except full-time equivalent employees, earnings per share and number of shares outstanding). % change % change
Q3 2017 vs Q3 2017 vsQ3 Q2 Q1 Q4 Q3 Q2 Q1 Q3 2016 in USD Q3 2016 in DKK
Net sales 4,198 4,230 4,073 4,290 4,130 4,165 4,017 2% (3%)
Gross profit 3,526 3,579 3,465 3,575 3,532 3,551 3,392 0% (5%)Gross margin 83.9% 84.6% 85.1% 83.4% 85.5% 85.3% 84.4%
Sales and distribution costs 1,023 999 972 1,150 1,028 1,042 995 0% (5%)Percentage of sales 24.4% 23.6% 23.9% 26.7% 24.9% 25.0% 24.8%
Research and development costs 523 504 471 651 519 505 488 1% (4%)Percentage of sales 12.5% 11.9% 11.6% 15.1% 12.6% 12.1% 12.1%
Administrative costs 141 126 131 169 152 133 134 (7%) (12%)Percentage of sales 3.4% 3.0% 3.2% 3.9% 3.7% 3.2% 3.3%
Other operating income, net 65 28 40 13 30 24 42 117% 109%
Operating profit 1,904 1,978 1,931 1,618 1,863 1,895 1,817 2% (3%)Operating margin 45.3% 46.7% 47.4% 37.9% 45.1% 45.5% 45.2%
Financial income 61 62 37 (3) (1) 15 3 N/A N/AFinancial expenses 3 172 106 36 17 0 55 (82%) (122%)Financial items (net) 58 (110) (69) (39) (18) 15 (52) (422%) (451%)
Profit before income taxes 1,962 1,868 1,862 1,579 1,845 1,910 1,765 6% 1%
Income taxes 424 398 408 323 375 399 369 13% 8%
Net profit 1,538 1,470 1,454 1,256 1,470 1,511 1,396 5% 0%
Depreciation, amortisation and impairment losses 112 127 101 163 110 109 92 2% (4%)Capital expenditure (net) 327 285 230 366 268 254 161 22% 18%Net cash generated from operating activities 2,017 1,499 1,732 1,611 2,277 2,184 1,104 (11%) (15%)Free cash flow 1,706 1,244 1,489 1,207 1,874 1,920 939 (9%) (13%)
Total assets 15,540 15,004 13,532 13,826 13,082 13,173 12,585 19% 12%Total equity 7,452 7,429 5,789 6,417 6,190 6,355 5,697 20% 14%Equity ratio 48.0% 49.5% 42.8% 46.4% 47.3% 48.2% 45.3%
Full-time equivalent employees end of period 41,656 41,385 41,636 41,971 42,605 42,265 41,571 (2%) (2%)
Basic earnings per share/ADR (in USD) 0.62 0.60 0.58 0.50 0.59 0.59 0.55 5% 2%Diluted earnings per share/ADR (in USD) 0.63 0.59 0.58 0.50 0.58 0.59 0.55 9% 2%Average number of shares outstanding (million) 2,465.6 2,480.2 2,495.8 2,512.6 2,526.5 2,536.3 2,544.3 (2%) (2%)Average number of diluted sharesoutstanding (million) 2,469.4 2,484.1 2,500.0 2,517.1 2,530.9 2,540.8 2,550.1 (2%) (2%)
Sales by business segment: New-generation insulin 330 367 242 250 171 149 92 93% 84% Modern insulin 1,681 1,670 1,731 1,772 1,765 1,790 1,730 (5%) (10%) Human insulin 391 372 373 426 414 405 402 (6%) (10%) Total insulin 2,402 2,409 2,346 2,448 2,350 2,344 2,224 2% (3%)
Victoza® 843 853 823 783 766 750 678 10% 5% Other diabetes care 156 149 155 148 165 154 167 (5%) (10%) Total diabetes care 3,401 3,411 3,324 3,379 3,281 3,248 3,069 4% (1%)
Obesity (Saxenda®) 101 101 77 79 62 57 36 63% 53% Diabetes and obesity care total 3,502 3,512 3,401 3,458 3,343 3,305 3,105 5% 0%
Haemophilia 380 403 369 409 343 384 419 11% 5% Human growth disorders 255 248 236 319 301 328 355 (15%) (19%) Other biopharmaceuticals 61 67 67 104 143 148 138 (57%) (60%) Biopharmaceuticals total 696 718 672 832 787 860 912 (12%) (16%)
Sales by geographic segment: North America Operations 2,139 2,230 2,139 2,304 2,207 2,192 2,096 (3%) (8%) - USA 2,050 2,154 2,062 2,226 2,127 2,114 2,027 (4%) (9%) International Operations 2,059 2,000 1,934 1,986 1,923 1,973 1,921 7% 2% - Region Europe 816 791 748 765 763 803 741 7% 2% - Region AAMEO 461 452 424 424 420 431 444 10% 5% - Region China 401 386 438 367 380 382 424 6% (0%) - Region Japan & Korea 230 232 210 246 238 244 197 (3%) (8%) - Region Latin America 151 139 114 184 122 113 115 24% 19%
Segment operating profit: Diabetes and obesity care 1,472 1,586 1,522 1,240 1,480 1,399 1,243 (1%) (6%) Biopharmaceuticals 432 392 409 378 383 496 574 13% 8%
2017 2016
Key figures are translated into USD as additional information - the translation is based on the average exchange rate for income statement and the exchange rate at the balance sheet date for balance sheet items. The specified percent changes in DKK are based on the changes in the 'Quarterly numbers in DKK', see appendix 1. The specified percentage changes in USD is calculated as a development in USD numbers in this appendix.

Financial report for the period 1 January 2017 to 30 September 2017 Page 34 of 34
Financial Performance Outlook R&D Sustainability Equity Corporate
governance Legal Financial Information
Company announcement No 83 / 2017
APPENDIX 9: NON-IFRS FINANCIAL MEASURES (ADDITIONAL INFORMATION)
In this Company Announcement, Novo Nordisk discloses certain financial measures of the Group’s financial performance, financial position and cash flows that reflect adjustments to the directly comparable measures calculated and presented in accordance with IFRS. These non-IFRS financial measures may not be defined and calculated by other companies in the same manner and may thus not be comparable with such measures. The non-IFRS financial measures presented in the Company Announcement are:
• Sales growth in local currencies • Operating profit growth in local currencies • Free cash flow
Sales and operating profit growth in local currencies When referred to ‘growth in local currencies’ it means that the effect of changes in exchange rates is excluded. It is defined as sales/operating profit for the period measured at prior period average exchange rates compared with realised sales/operating profit for the prior period. Management believes that growth in local currencies is relevant information for investors in order to understand the underlying development in sales and operating profit by adjusting for the impact of currency fluctuations.
Free cash flow Novo Nordisk defines free cash flow as ’net cash generated from operating activities’ less ‘net cash used in investing activities’ excluding net change of marketable securities. A positive free cash flow shows that the Group is able to finance its activities and that external financing is thus not necessary for the Group’s operating activities. Therefore, management believes that this non-IFRS liquidity measure provides useful information to investors in addition to the most directly comparable IFRS financial measure ‘Net cash generated from operating activities’.
9M 9M Q3 Q3DKK million 2017 2016 2017 2016
Net sales 83,704 82,208 26,614 27,537 Effect of exchange rate 651 1,805 1,343 468 Sales in local currencies 84,355 84,013 27,957 28,005
Operating profit in local currencies9M 9M Q3 Q3
DKK million 2017 2016 2017 2016
Operating profit 38,920 37,226 12,044 12,420 Effect of exchange rate 433 855 995 153 Operating profit in local currencies 39,353 38,081 13,039 12,573
Sales in local currencies
9M 9M Q3 Q3DKK million 2017 2016 2017 2016
Net cash generated from operating activites 35,136 37,161 12,921 15,189Net cash used in investing activites (3,408) (4,059) (1,991) (2,677) Net purchase of marketable securities (2,006) (1,499) - (11) Free cash flow 29,722 31,603 10,930 12,501
Free cash flow