fires in dormitory-type properties
TRANSCRIPT
Fires in Dormitory-Type PropertiesSupporting Tables
September 2021Richard Campbell
Copyright © September 2021 National Fire Protection Association® (NFPA®)

Fires in Dormitory-Type Fires, 9/2021 1 NFPA Research, Quincy, MA
Fires in Dormitory-Type Properties: Supporting Tables
The tables in this document are a companion to the report of the same name. The table topics are listed below. The statistics in this analysis are national estimates of the fires reported to US municipal fire departments and so exclude fires reported only to federal or state agencies. The estimates are projections based on the detailed information collected in the US Fire Administration’s National Fire Incident Reporting System (NFIRS 5.0) and the National Fire Protection Association’s (NFPA) annual fire department experience survey. Except for property use and incident type, fires with unknown or unreported data were allocated proportionally in the calculations of national estimates. Rounding varies by detail in the tables.
NFIRS property use codes 460-469 were used to identify structure fires in dormitories, fraternity and sorority houses, monasteries, bunkhouses, barracks, and nurses’ quarters or related properties reported.
Property damage was adjusted for inflation in Table 1 only. No inflation adjustments were made for the 2015–2019 annual averages shown in the remaining tables. Property loss projections can be heavily influenced by the inclusion or exclusion of one unusually serious fire.
Please refer to How NFPA’s National Estimates Are Calculated for Fires for explanatory details about the methods used.
Fires in Dormitory-Type Properties by: Page Table 1. Year 2 Table 2. Month 4 Table 3. Day of the Week 5 Table 4. Time of Day 6 Table 5. Leading Cause 7 Table 6. Equipment Involved in Ignition 8 Table 7. Cause of Ignition 9 Table 8. Factor Contributing to Ignition 10 Table 9. Heat Source 12 Table 10. Area of Origin 14 Table 11. Item First Ignited 15 Table 12. Property Use 16
Fires in Dormitory-Type Fires, 9/2021 2 NFPA Research, Quincy, MA
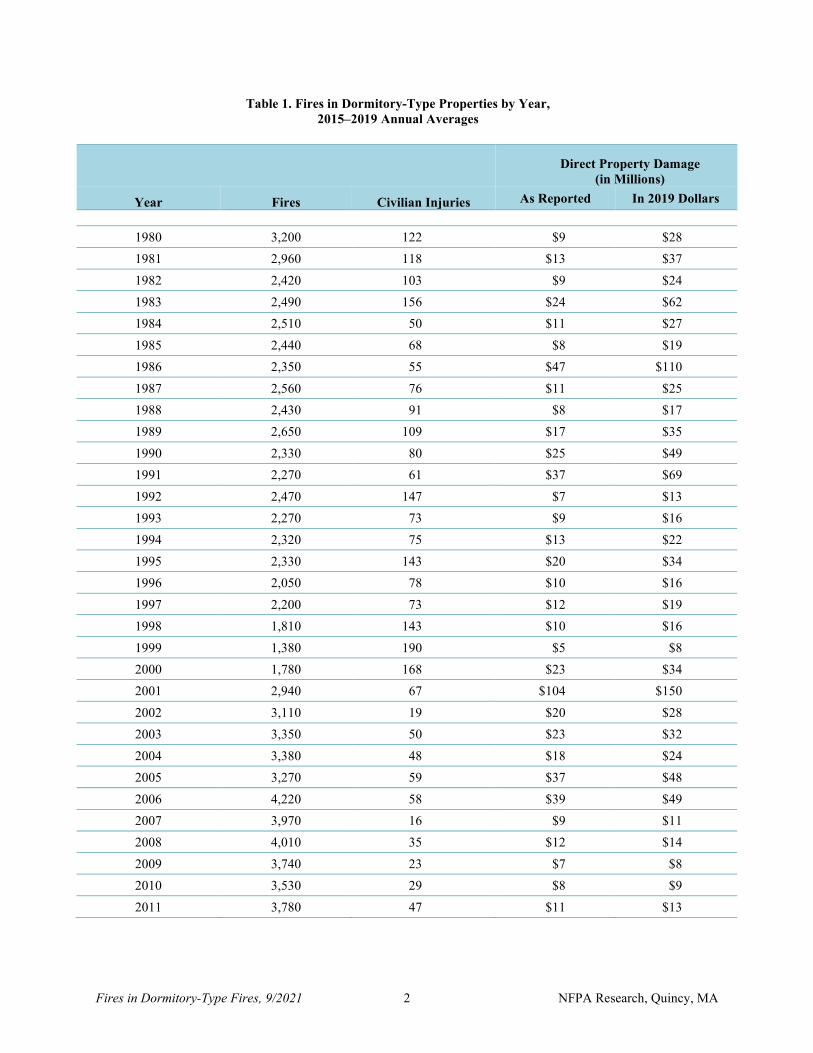
Table 1. Fires in Dormitory-Type Properties by Year, 2015–2019 Annual Averages
Direct Property Damage
(in Millions)
Year Fires Civilian Injuries As Reported In 2019 Dollars
1980 3,200 122 $9 $28 1981 2,960 118 $13 $37 1982 2,420 103 $9 $24 1983 2,490 156 $24 $62 1984 2,510 50 $11 $27 1985 2,440 68 $8 $19 1986 2,350 55 $47 $110 1987 2,560 76 $11 $25 1988 2,430 91 $8 $17 1989 2,650 109 $17 $35 1990 2,330 80 $25 $49 1991 2,270 61 $37 $69 1992 2,470 147 $7 $13 1993 2,270 73 $9 $16 1994 2,320 75 $13 $22 1995 2,330 143 $20 $34 1996 2,050 78 $10 $16 1997 2,200 73 $12 $19 1998 1,810 143 $10 $16 1999 1,380 190 $5 $8 2000 1,780 168 $23 $34 2001 2,940 67 $104 $150 2002 3,110 19 $20 $28 2003 3,350 50 $23 $32 2004 3,380 48 $18 $24 2005 3,270 59 $37 $48 2006 4,220 58 $39 $49 2007 3,970 16 $9 $11 2008 4,010 35 $12 $14 2009 3,740 23 $7 $8 2010 3,530 29 $8 $9 2011 3,780 47 $11 $13
Fires in Dormitory-Type Fires, 9/2021 3 NFPA Research, Quincy, MA
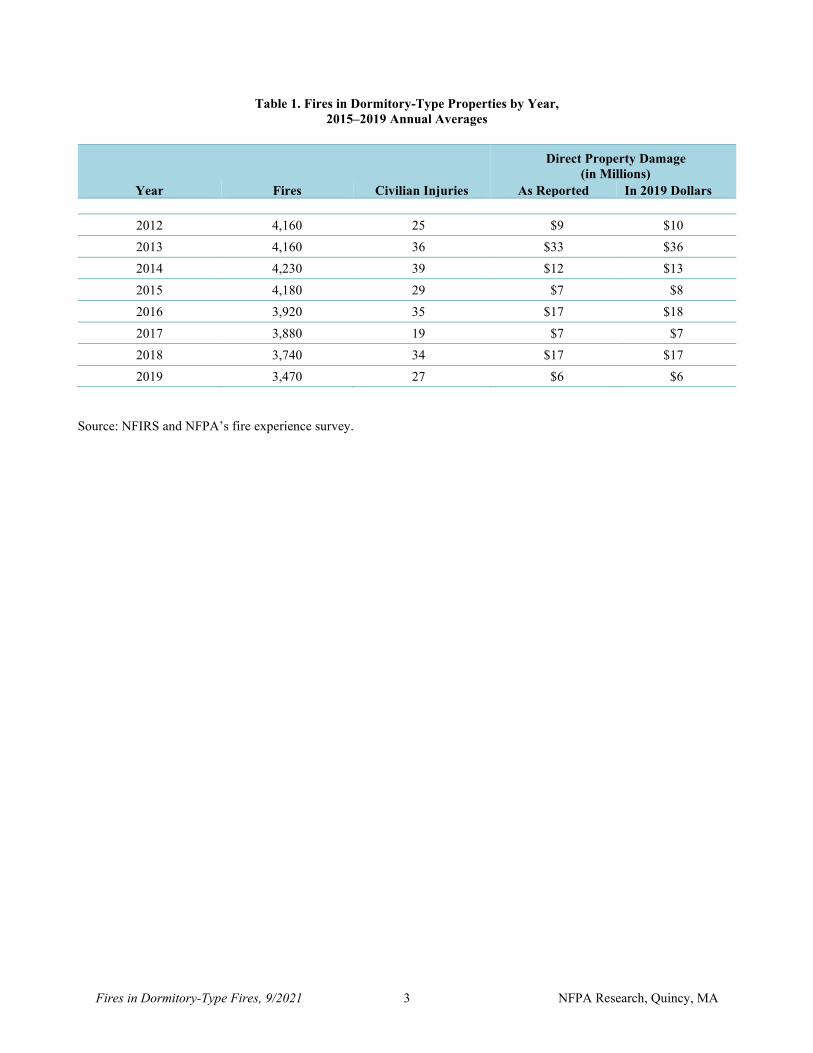
Table 1. Fires in Dormitory-Type Properties by Year, 2015–2019 Annual Averages
Direct Property Damage
(in Millions) Year Fires Civilian Injuries As Reported In 2019 Dollars
2012 4,160 25 $9 $10 2013 4,160 36 $33 $36 2014 4,230 39 $12 $13 2015 4,180 29 $7 $8 2016 3,920 35 $17 $18 2017 3,880 19 $7 $7 2018 3,740 34 $17 $17 2019 3,470 27 $6 $6
Source: NFIRS and NFPA’s fire experience survey.
Fires in Dormitory-Type Fires, 9/2021 4 NFPA Research, Quincy, MA
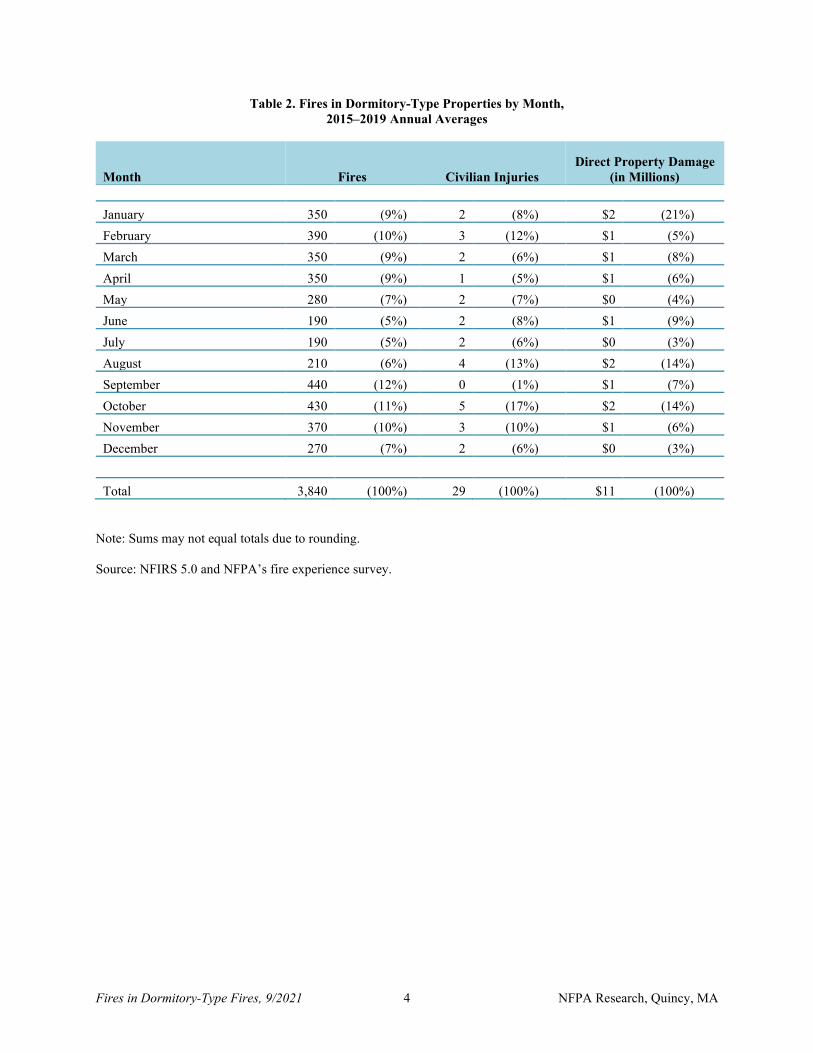
Table 2. Fires in Dormitory-Type Properties by Month, 2015–2019 Annual Averages
Month Fires Civilian Injuries Direct Property Damage
(in Millions) January 350 (9%) 2 (8%) $2 (21%) February 390 (10%) 3 (12%) $1 (5%) March 350 (9%) 2 (6%) $1 (8%) April 350 (9%) 1 (5%) $1 (6%) May 280 (7%) 2 (7%) $0 (4%) June 190 (5%) 2 (8%) $1 (9%) July 190 (5%) 2 (6%) $0 (3%) August 210 (6%) 4 (13%) $2 (14%) September 440 (12%) 0 (1%) $1 (7%) October 430 (11%) 5 (17%) $2 (14%) November 370 (10%) 3 (10%) $1 (6%) December 270 (7%) 2 (6%) $0 (3%)
Total 3,840 (100%) 29 (100%) $11 (100%)
Note: Sums may not equal totals due to rounding. Source: NFIRS 5.0 and NFPA’s fire experience survey.
Fires in Dormitory-Type Fires, 9/2021 5 NFPA Research, Quincy, MA
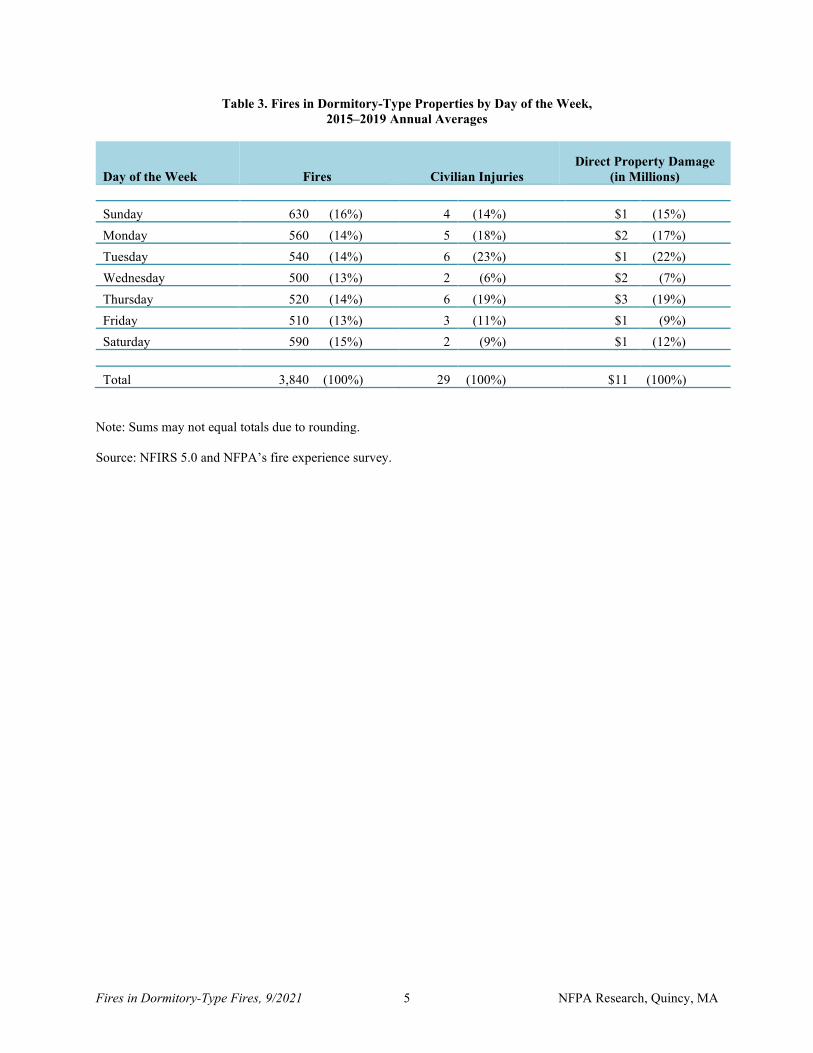
Table 3. Fires in Dormitory-Type Properties by Day of the Week, 2015–2019 Annual Averages
Day of the Week Fires Civilian Injuries Direct Property Damage
(in Millions) Sunday 630 (16%) 4 (14%) $1 (15%) Monday 560 (14%) 5 (18%) $2 (17%) Tuesday 540 (14%) 6 (23%) $1 (22%) Wednesday 500 (13%) 2 (6%) $2 (7%) Thursday 520 (14%) 6 (19%) $3 (19%) Friday 510 (13%) 3 (11%) $1 (9%) Saturday 590 (15%) 2 (9%) $1 (12%)
Total 3,840 (100%) 29 (100%) $11 (100%)
Note: Sums may not equal totals due to rounding. Source: NFIRS 5.0 and NFPA’s fire experience survey.

Fires in Dormitory-Type Fires, 9/2021 6 NFPA Research, Quincy, MA
Table 4. Fires in Dormitory-Type Properties by Time of Day, 2015–2019 Annual Averages
Time of Day Fires Civilian Injuries
Direct Property Damage (in Millions)
Midnight–12:59 a.m. 140 (4%) 1 (3%) $1 (10%) 1:00–1:59 a.m. 100 (3%) 1 (2%) $0 (1%) 2:00–2:59 a.m. 80 (2%) 3 (12%) $0 (4%) 3:00–3:59 a.m. 60 (2%) 0 (0%) $0 (3%) 4:00–4:59 a.m. 50 (1%) 1 (5%) $2 (19%) 5:00–5:59 a.m. 40 (1%) 2 (6%) $0 (5%) 6:00–6:59 a.m. 40 (1%) 0 (1%) $0 (2%) 7:00–7:59 a.m. 60 (2%) 2 (6%) $0 (2%) 8:00–8:59 a.m. 80 (2%) 0 (1%) $0 (1%) 9:00–9:59 a.m. 110 (3%) 0 (0%) $0 (2%) 10:00–10:59 a.m. 130 (3%) 0 (1%) $0 (4%) 11:00–11:59 a.m. 170 (4%) 1 (2%) $0 (2%) 12:00–12:59 p.m. 190 (5%) 2 (6%) $0 (1%) 1:00–1:59 p.m. 170 (4%) 0 (1%) $0 (1%) 2:00–2:59 p.m. 170 (4%) 1 (5%) $0 (3%) 3:00–3:59 p.m. 190 (5%) 1 (4%) $0 (4%) 4:00–4:59 p.m. 200 (5%) 1 (5%) $0 (2%) 5:00–5:59 p.m. 280 (7%) 1 (4%) $1 (13%) 6:00–6:59 p.m. 310 (8%) 2 (9%) $0 (4%) 7:00–7:59 p.m. 330 (9%) 1 (4%) $0 (3%) 8:00–8:59 p.m. 280 (7%) 3 (10%) $0 (4%) 9:00–9:59 p.m. 270 (7%) 2 (7%) $0 (4%) 10:00–10:59 p.m. 200 (5%) 2 (6%) $0 (2%) 11:00–11:59 p.m. 170 (4%) 0 (1%) $1 (5%) Total 3,840 (100%) 1 (100%) $0 (100%)
Note: Sums may not equal totals due to rounding. Source: NFIRS 5.0 and NFPA’s fire experience survey.
Fires in Dormitory-Type Fires, 9/2021 7 NFPA Research, Quincy, MA
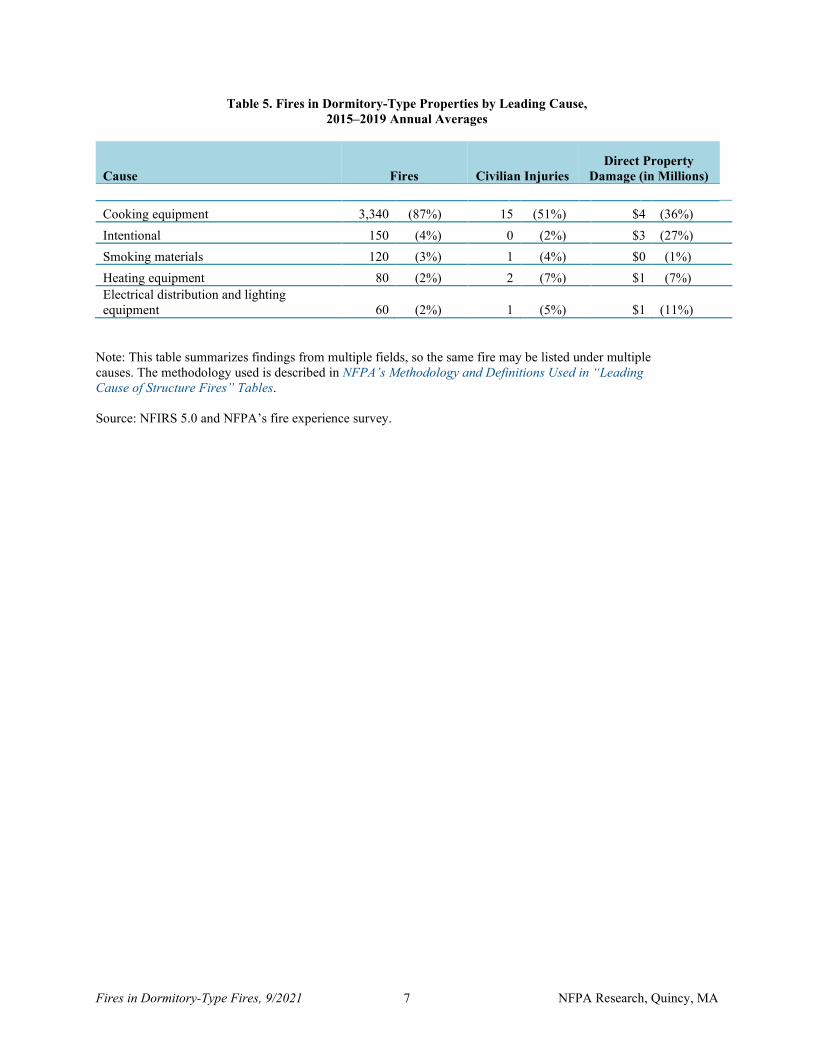
Table 5. Fires in Dormitory-Type Properties by Leading Cause, 2015–2019 Annual Averages
Cause Fires Civilian Injuries Direct Property
Damage (in Millions) Cooking equipment 3,340 (87%) 15 (51%) $4 (36%) Intentional 150 (4%) 0 (2%) $3 (27%) Smoking materials 120 (3%) 1 (4%) $0 (1%) Heating equipment 80 (2%) 2 (7%) $1 (7%) Electrical distribution and lighting equipment 60 (2%) 1 (5%) $1 (11%)
Note: This table summarizes findings from multiple fields, so the same fire may be listed under multiple causes. The methodology used is described in NFPA’s Methodology and Definitions Used in “Leading Cause of Structure Fires” Tables. Source: NFIRS 5.0 and NFPA’s fire experience survey.

Fires in Dormitory-Type Fires, 9/2021 8 NFPA Research, Quincy, MA
Table 6. Fires in Dormitory-Type Properties by Equipment Involved in Ignition, 2015–2019 Annual Averages
Equipment Involved in Ignition Fires Civilian Injuries
Direct Property Damage
(in Millions) Cooking equipment 3,340 (87%) 15 (51%) $4 (36%) Confined cooking fire 3,230 (84%) 8 (27%) $0 (2%) Range with or without oven, cooking surface 80 (2%) 6 (21%) $1 (13%) Other known cooking equipment 30 (1%) 1 (3%) $2 (21%) Contained trash or rubbish fire 150 (4%) 1 (4%) $0 (0%) Heating equipment 80 (2%) 2 (7%) $1 (7%) Fixed or portable space heater 40 (1%) 2 (7%) $0 (4%) Confined fuel burner or boiler fire 30 (1%) 0 (0%) $0 (0%) Other known heating equipment 20 (0%) 0 (0%) $0 (2%) No equipment involved in ignition 70 (2%) 8 (29%) $3 (24%) Electrical distribution and lighting equipment 60 (2%) 1 (5%) $1 (11%) Wiring and related equipment 20 (1%) 0 (0%) $1 (7%) Other known electrical distribution or lighting equipment 40 (1%) 1 (5%) $0 (4%) Clothes dryer 50 (1%) 0 (0%) $0 (2%) Fan 30 (1%) 1 (2%) $1 (12%) Other known equipment involved in ignition 70 (2%) 1 (2%) $1 (8%) Total 3,840 (100%) 29 (100%) $11 (100%)
Note: Sums may not equal totals due to rounding. Source: NFIRS 5.0 and NFPA’s fire experience survey.
Fires in Dormitory-Type Fires, 9/2021 9 NFPA Research, Quincy, MA
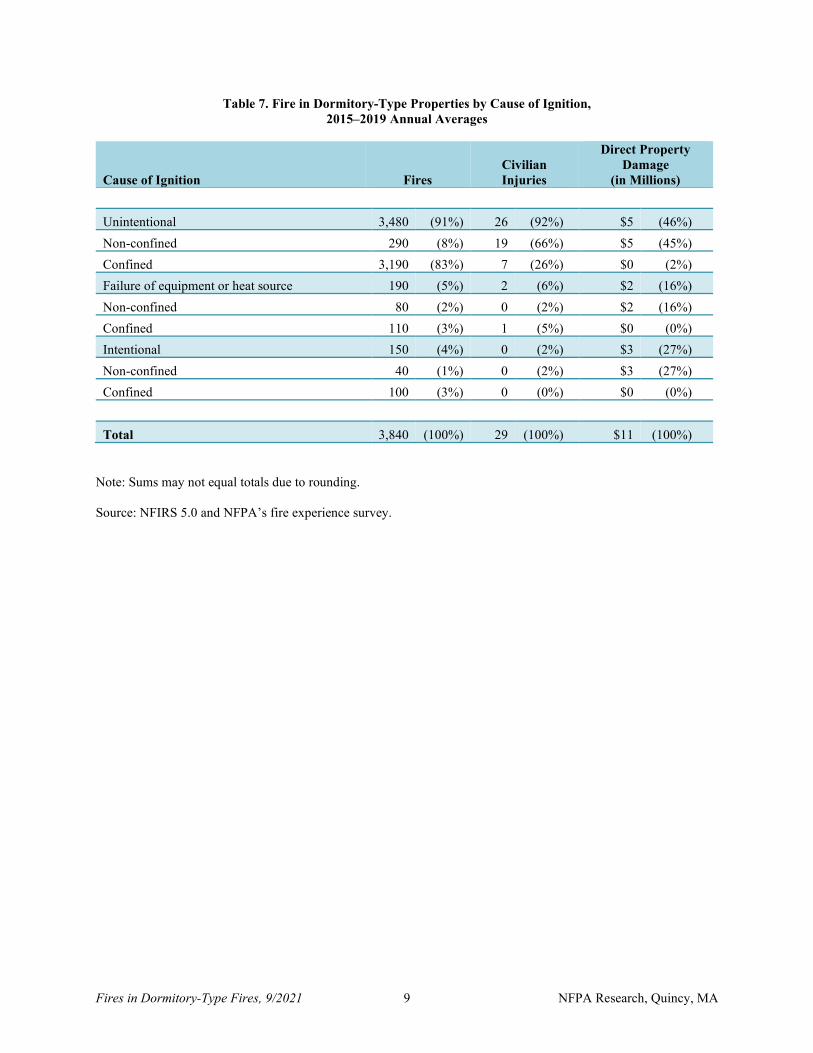
Table 7. Fire in Dormitory-Type Properties by Cause of Ignition, 2015–2019 Annual Averages
Cause of Ignition Fires Civilian Injuries
Direct Property Damage
(in Millions) Unintentional 3,480 (91%) 26 (92%) $5 (46%) Non-confined 290 (8%) 19 (66%) $5 (45%) Confined 3,190 (83%) 7 (26%) $0 (2%) Failure of equipment or heat source 190 (5%) 2 (6%) $2 (16%) Non-confined 80 (2%) 0 (2%) $2 (16%) Confined 110 (3%) 1 (5%) $0 (0%) Intentional 150 (4%) 0 (2%) $3 (27%) Non-confined 40 (1%) 0 (2%) $3 (27%) Confined 100 (3%) 0 (0%) $0 (0%) Total 3,840 (100%) 29 (100%) $11 (100%)
Note: Sums may not equal totals due to rounding. Source: NFIRS 5.0 and NFPA’s fire experience survey.
Fires in Dormitory-Type Fires, 9/2021 10 NFPA Research, Quincy, MA
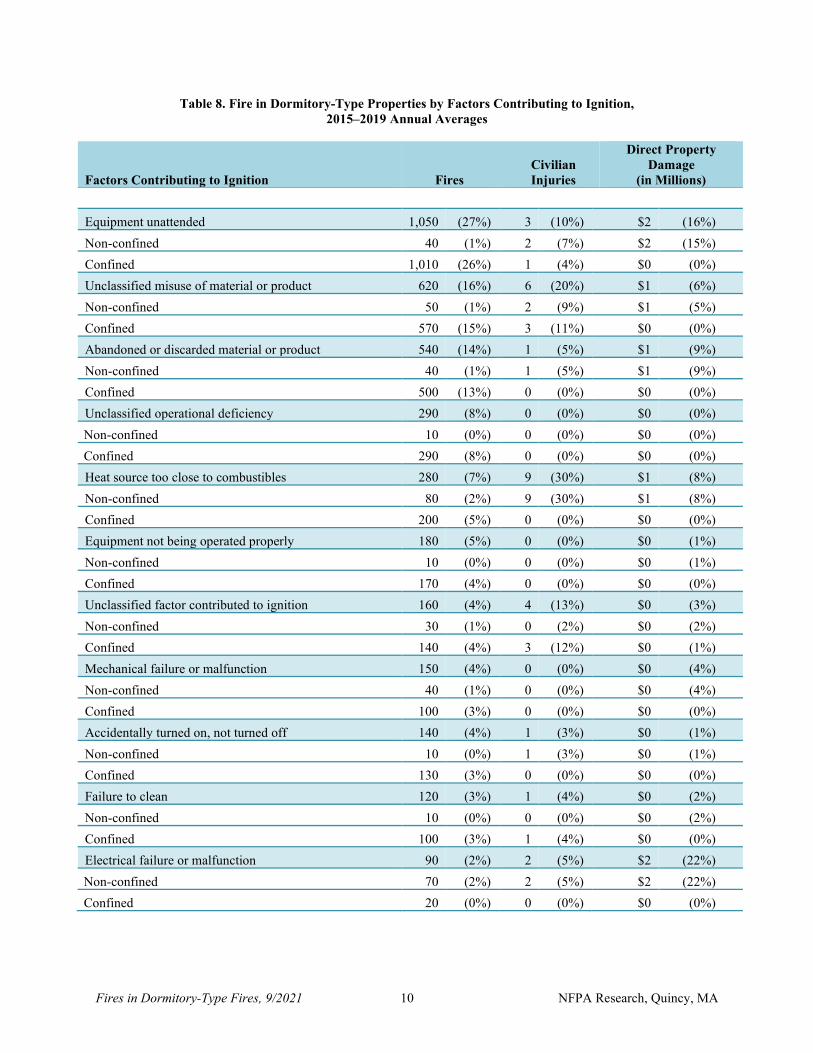
Table 8. Fire in Dormitory-Type Properties by Factors Contributing to Ignition, 2015–2019 Annual Averages
Factors Contributing to Ignition Fires Civilian Injuries
Direct Property Damage
(in Millions) Equipment unattended 1,050 (27%) 3 (10%) $2 (16%) Non-confined 40 (1%) 2 (7%) $2 (15%) Confined 1,010 (26%) 1 (4%) $0 (0%) Unclassified misuse of material or product 620 (16%) 6 (20%) $1 (6%) Non-confined 50 (1%) 2 (9%) $1 (5%) Confined 570 (15%) 3 (11%) $0 (0%) Abandoned or discarded material or product 540 (14%) 1 (5%) $1 (9%) Non-confined 40 (1%) 1 (5%) $1 (9%) Confined 500 (13%) 0 (0%) $0 (0%) Unclassified operational deficiency 290 (8%) 0 (0%) $0 (0%) Non-confined 10 (0%) 0 (0%) $0 (0%) Confined 290 (8%) 0 (0%) $0 (0%) Heat source too close to combustibles 280 (7%) 9 (30%) $1 (8%) Non-confined 80 (2%) 9 (30%) $1 (8%) Confined 200 (5%) 0 (0%) $0 (0%) Equipment not being operated properly 180 (5%) 0 (0%) $0 (1%) Non-confined 10 (0%) 0 (0%) $0 (1%) Confined 170 (4%) 0 (0%) $0 (0%) Unclassified factor contributed to ignition 160 (4%) 4 (13%) $0 (3%) Non-confined 30 (1%) 0 (2%) $0 (2%) Confined 140 (4%) 3 (12%) $0 (1%) Mechanical failure or malfunction 150 (4%) 0 (0%) $0 (4%) Non-confined 40 (1%) 0 (0%) $0 (4%) Confined 100 (3%) 0 (0%) $0 (0%) Accidentally turned on, not turned off 140 (4%) 1 (3%) $0 (1%) Non-confined 10 (0%) 1 (3%) $0 (1%) Confined 130 (3%) 0 (0%) $0 (0%) Failure to clean 120 (3%) 1 (4%) $0 (2%) Non-confined 10 (0%) 0 (0%) $0 (2%) Confined 100 (3%) 1 (4%) $0 (0%) Electrical failure or malfunction 90 (2%) 2 (5%) $2 (22%) Non-confined 70 (2%) 2 (5%) $2 (22%) Confined 20 (0%) 0 (0%) $0 (0%)
Fires in Dormitory-Type Fires, 9/2021 11 NFPA Research, Quincy, MA
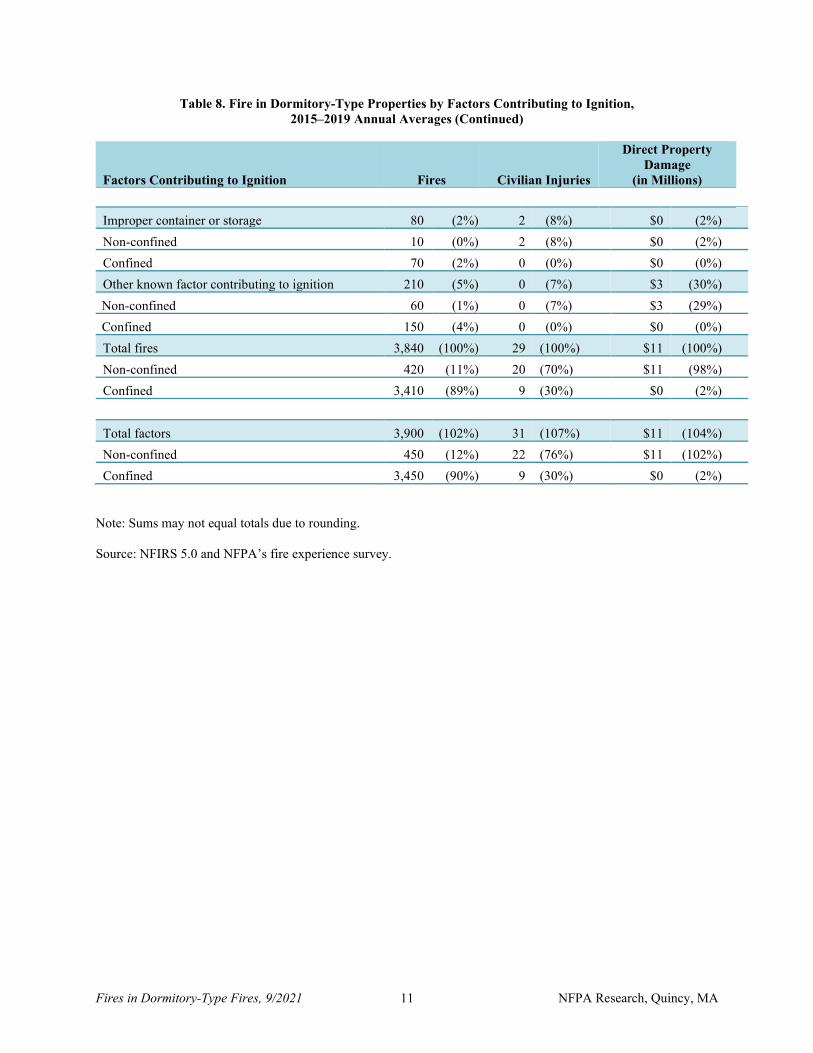
Table 8. Fire in Dormitory-Type Properties by Factors Contributing to Ignition, 2015–2019 Annual Averages (Continued)
Factors Contributing to Ignition Fires Civilian Injuries
Direct Property Damage
(in Millions)
Improper container or storage 80 (2%) 2 (8%) $0 (2%) Non-confined 10 (0%) 2 (8%) $0 (2%) Confined 70 (2%) 0 (0%) $0 (0%) Other known factor contributing to ignition 210 (5%) 0 (7%) $3 (30%) Non-confined 60 (1%) 0 (7%) $3 (29%) Confined 150 (4%) 0 (0%) $0 (0%) Total fires 3,840 (100%) 29 (100%) $11 (100%) Non-confined 420 (11%) 20 (70%) $11 (98%) Confined 3,410 (89%) 9 (30%) $0 (2%) Total factors 3,900 (102%) 31 (107%) $11 (104%) Non-confined 450 (12%) 22 (76%) $11 (102%) Confined 3,450 (90%) 9 (30%) $0 (2%)
Note: Sums may not equal totals due to rounding. Source: NFIRS 5.0 and NFPA’s fire experience survey.
Fires in Dormitory-Type Fires, 9/2021 12 NFPA Research, Quincy, MA
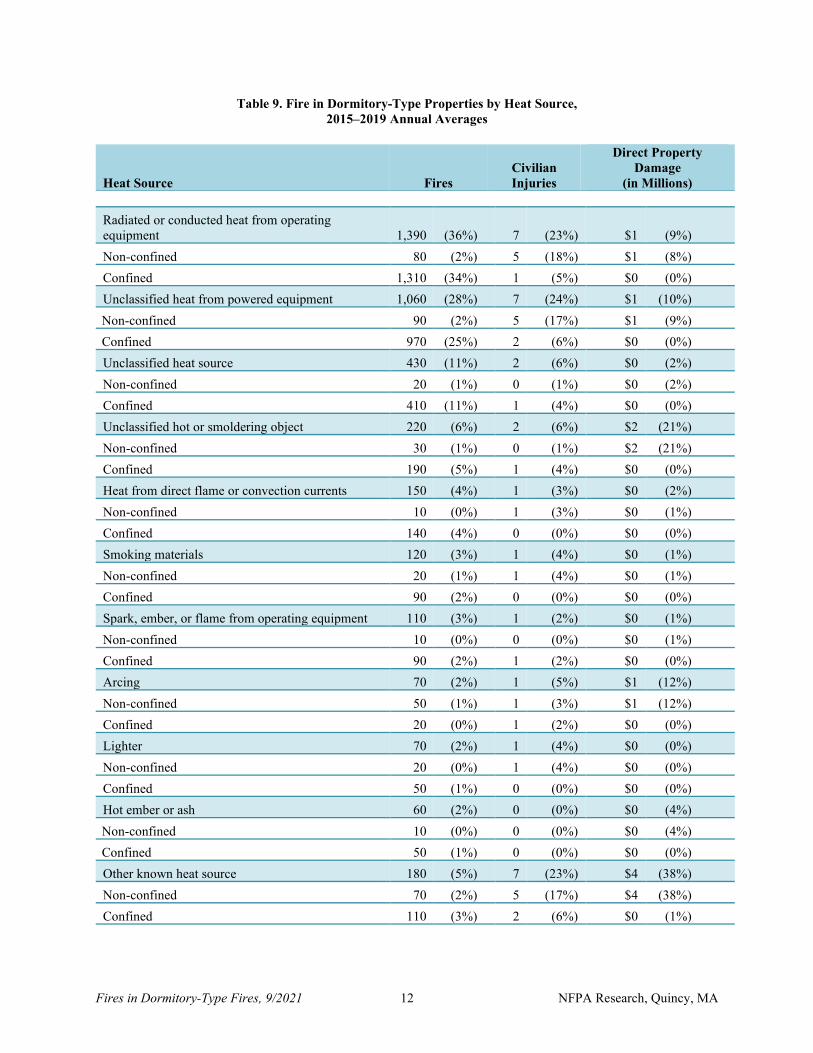
Table 9. Fire in Dormitory-Type Properties by Heat Source, 2015–2019 Annual Averages
Heat Source Fires Civilian Injuries
Direct Property Damage
(in Millions) Radiated or conducted heat from operating equipment 1,390 (36%) 7 (23%) $1 (9%) Non-confined 80 (2%) 5 (18%) $1 (8%) Confined 1,310 (34%) 1 (5%) $0 (0%) Unclassified heat from powered equipment 1,060 (28%) 7 (24%) $1 (10%) Non-confined 90 (2%) 5 (17%) $1 (9%) Confined 970 (25%) 2 (6%) $0 (0%) Unclassified heat source 430 (11%) 2 (6%) $0 (2%) Non-confined 20 (1%) 0 (1%) $0 (2%) Confined 410 (11%) 1 (4%) $0 (0%) Unclassified hot or smoldering object 220 (6%) 2 (6%) $2 (21%) Non-confined 30 (1%) 0 (1%) $2 (21%) Confined 190 (5%) 1 (4%) $0 (0%) Heat from direct flame or convection currents 150 (4%) 1 (3%) $0 (2%) Non-confined 10 (0%) 1 (3%) $0 (1%) Confined 140 (4%) 0 (0%) $0 (0%) Smoking materials 120 (3%) 1 (4%) $0 (1%) Non-confined 20 (1%) 1 (4%) $0 (1%) Confined 90 (2%) 0 (0%) $0 (0%) Spark, ember, or flame from operating equipment 110 (3%) 1 (2%) $0 (1%) Non-confined 10 (0%) 0 (0%) $0 (1%) Confined 90 (2%) 1 (2%) $0 (0%) Arcing 70 (2%) 1 (5%) $1 (12%) Non-confined 50 (1%) 1 (3%) $1 (12%) Confined 20 (0%) 1 (2%) $0 (0%) Lighter 70 (2%) 1 (4%) $0 (0%) Non-confined 20 (0%) 1 (4%) $0 (0%) Confined 50 (1%) 0 (0%) $0 (0%) Hot ember or ash 60 (2%) 0 (0%) $0 (4%) Non-confined 10 (0%) 0 (0%) $0 (4%) Confined 50 (1%) 0 (0%) $0 (0%) Other known heat source 180 (5%) 7 (23%) $4 (38%) Non-confined 70 (2%) 5 (17%) $4 (38%) Confined 110 (3%) 2 (6%) $0 (1%)
Fires in Dormitory-Type Fires, 9/2021 13 NFPA Research, Quincy, MA
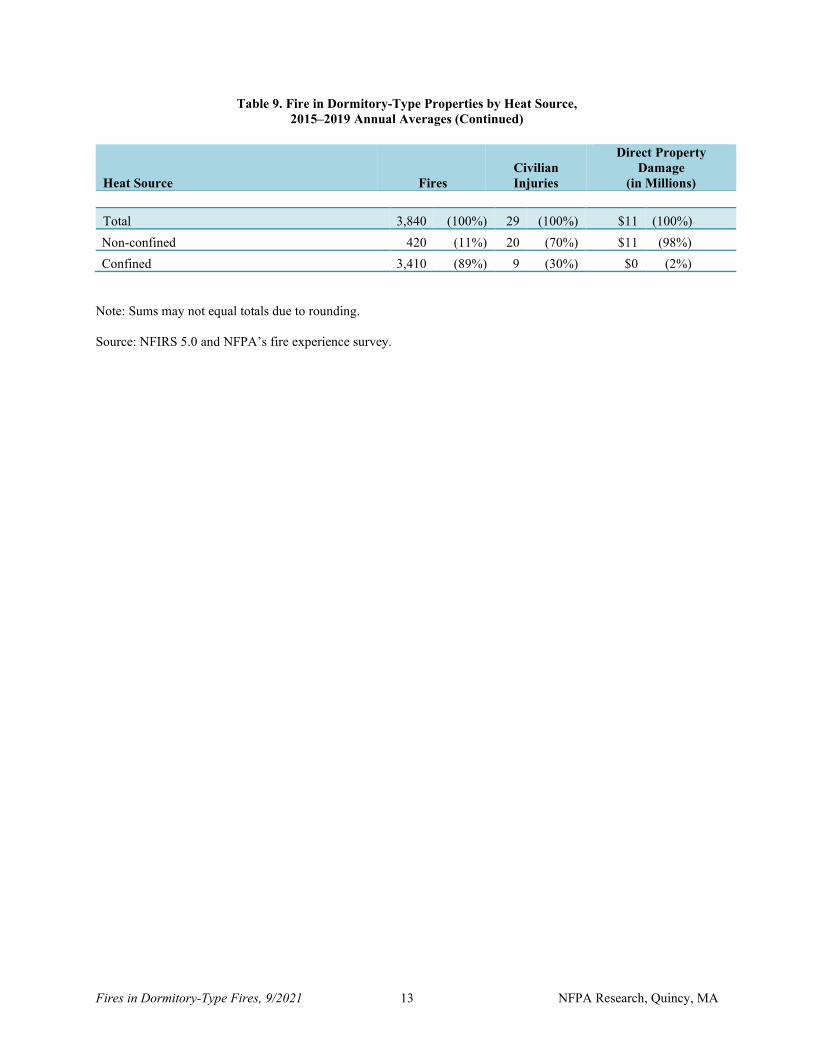
Table 9. Fire in Dormitory-Type Properties by Heat Source, 2015–2019 Annual Averages (Continued)
Heat Source Fires Civilian Injuries
Direct Property Damage
(in Millions) Total 3,840 (100%) 29 (100%) $11 (100%) Non-confined 420 (11%) 20 (70%) $11 (98%) Confined 3,410 (89%) 9 (30%) $0 (2%)
Note: Sums may not equal totals due to rounding. Source: NFIRS 5.0 and NFPA’s fire experience survey.
Fires in Dormitory-Type Fires, 9/2021 14 NFPA Research, Quincy, MA
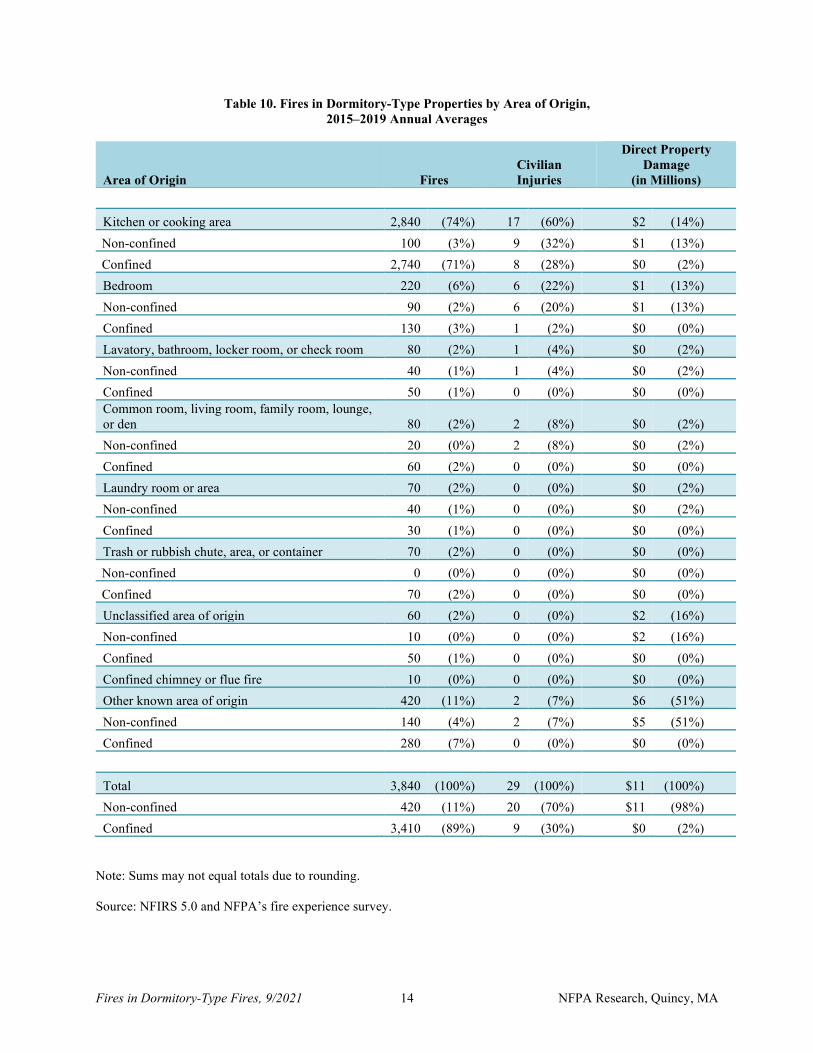
Table 10. Fires in Dormitory-Type Properties by Area of Origin, 2015–2019 Annual Averages
Area of Origin Fires Civilian Injuries
Direct Property Damage
(in Millions) Kitchen or cooking area 2,840 (74%) 17 (60%) $2 (14%) Non-confined 100 (3%) 9 (32%) $1 (13%) Confined 2,740 (71%) 8 (28%) $0 (2%) Bedroom 220 (6%) 6 (22%) $1 (13%) Non-confined 90 (2%) 6 (20%) $1 (13%) Confined 130 (3%) 1 (2%) $0 (0%) Lavatory, bathroom, locker room, or check room 80 (2%) 1 (4%) $0 (2%) Non-confined 40 (1%) 1 (4%) $0 (2%) Confined 50 (1%) 0 (0%) $0 (0%) Common room, living room, family room, lounge, or den 80 (2%) 2 (8%) $0 (2%) Non-confined 20 (0%) 2 (8%) $0 (2%) Confined 60 (2%) 0 (0%) $0 (0%) Laundry room or area 70 (2%) 0 (0%) $0 (2%) Non-confined 40 (1%) 0 (0%) $0 (2%) Confined 30 (1%) 0 (0%) $0 (0%) Trash or rubbish chute, area, or container 70 (2%) 0 (0%) $0 (0%) Non-confined 0 (0%) 0 (0%) $0 (0%) Confined 70 (2%) 0 (0%) $0 (0%) Unclassified area of origin 60 (2%) 0 (0%) $2 (16%) Non-confined 10 (0%) 0 (0%) $2 (16%) Confined 50 (1%) 0 (0%) $0 (0%) Confined chimney or flue fire 10 (0%) 0 (0%) $0 (0%) Other known area of origin 420 (11%) 2 (7%) $6 (51%) Non-confined 140 (4%) 2 (7%) $5 (51%) Confined 280 (7%) 0 (0%) $0 (0%) Total 3,840 (100%) 29 (100%) $11 (100%) Non-confined 420 (11%) 20 (70%) $11 (98%) Confined 3,410 (89%) 9 (30%) $0 (2%)
Note: Sums may not equal totals due to rounding. Source: NFIRS 5.0 and NFPA’s fire experience survey.
Fires in Dormitory-Type Fires, 9/2021 15 NFPA Research, Quincy, MA
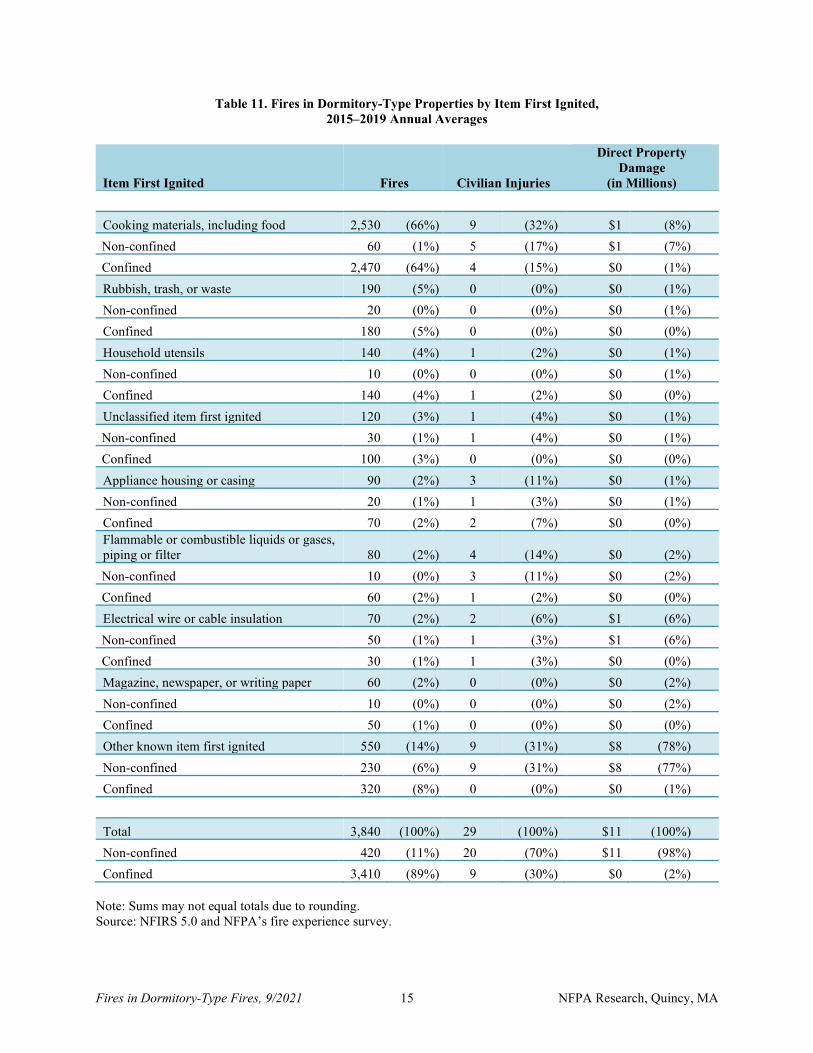
Table 11. Fires in Dormitory-Type Properties by Item First Ignited, 2015–2019 Annual Averages
Item First Ignited Fires Civilian Injuries
Direct Property Damage
(in Millions) Cooking materials, including food 2,530 (66%) 9 (32%) $1 (8%) Non-confined 60 (1%) 5 (17%) $1 (7%) Confined 2,470 (64%) 4 (15%) $0 (1%) Rubbish, trash, or waste 190 (5%) 0 (0%) $0 (1%) Non-confined 20 (0%) 0 (0%) $0 (1%) Confined 180 (5%) 0 (0%) $0 (0%) Household utensils 140 (4%) 1 (2%) $0 (1%) Non-confined 10 (0%) 0 (0%) $0 (1%) Confined 140 (4%) 1 (2%) $0 (0%) Unclassified item first ignited 120 (3%) 1 (4%) $0 (1%) Non-confined 30 (1%) 1 (4%) $0 (1%) Confined 100 (3%) 0 (0%) $0 (0%) Appliance housing or casing 90 (2%) 3 (11%) $0 (1%) Non-confined 20 (1%) 1 (3%) $0 (1%) Confined 70 (2%) 2 (7%) $0 (0%) Flammable or combustible liquids or gases, piping or filter 80 (2%) 4 (14%) $0 (2%) Non-confined 10 (0%) 3 (11%) $0 (2%) Confined 60 (2%) 1 (2%) $0 (0%) Electrical wire or cable insulation 70 (2%) 2 (6%) $1 (6%) Non-confined 50 (1%) 1 (3%) $1 (6%) Confined 30 (1%) 1 (3%) $0 (0%) Magazine, newspaper, or writing paper 60 (2%) 0 (0%) $0 (2%) Non-confined 10 (0%) 0 (0%) $0 (2%) Confined 50 (1%) 0 (0%) $0 (0%) Other known item first ignited 550 (14%) 9 (31%) $8 (78%) Non-confined 230 (6%) 9 (31%) $8 (77%) Confined 320 (8%) 0 (0%) $0 (1%)
Total 3,840 (100%) 29 (100%) $11 (100%) Non-confined 420 (11%) 20 (70%) $11 (98%) Confined 3,410 (89%) 9 (30%) $0 (2%)
Note: Sums may not equal totals due to rounding. Source: NFIRS 5.0 and NFPA’s fire experience survey.

Fires in Dormitory-Type Fires, 9/2021 16 NFPA Research, Quincy, MA
Table 12. Structure Fires in Dormitory-Type Properties by Property Use, 2015–2019 Annual Averages
Property Use Fires Civilian Deaths
Civilian Injuries
Direct Property Damage
(in Millions)
Unclassified dormitory-type residence 3,150 (82%) 2 (100%) 24 (83%) $6 (59%) Barracks or dormitory 500 (13%) 0 (0%) 4 (15%) $4 (34%) Sorority or fraternity house 180 (5%) 0 (0%) 1 (2%) $1 (7%)
Total 3,840 (100%) 2 (100%) 29 (100%) $11 (100%)
Note: Sums may not equal totals due to rounding. Source: NFIRS 5.0 and NFPA’s fire experience survey.
Acknowledgements
The National Fire Protection Association thanks all the fire departments and state fire authorities who participate in the National Fire Incident Reporting System (NFIRS) and the annual NFPA fire experience survey. These firefighters are the original sources of the detailed data that makes this analysis possible. Their contributions allow us to estimate the size of the fire problem.
We are also grateful to the US Fire Administration for its work in developing, coordinating, and maintaining NFIRS.
To learn more about research at NFPA visit nfpa.org/research.
E-mail: [email protected].
NFPA No. PKG04ST