university housing fires (2007-2009) · university housing fires (2007-2009) ... fire incident...
TRANSCRIPT

Topical Fire reporT SerieS
U.S. Department of Homeland Security • U.S. Fire Administration National Fire Data Center • Emmitsburg, Maryland 21727
www.usfa.fema.gov/statistics/
Volume 12, Issue 9 / August 2011
University Housing Fires (2007-2009)
These topical reports are designed to explore facets of the U.S. fire problem as depicted through data collected in the U.S. Fire Administration’s (USFA’s) National Fire Incident Reporting System (NFIRS). Each topical report briefly addresses the nature of the specific fire or fire-related topic, highlights important findings from the data, and may suggest other resources to consider for further information. Also included are recent examples of fire inci-dents that demonstrate some of the issues addressed in the report or that put the report topic in context.
Findings■ An estimated 3,800 university housing fires occur each year in the United States.■ Eighty-eight percent of university housing fires are cooking fires. Small, confined cooking
fires account for 81 percent of university housing fires. However, cooking fires comprise only 9 percent of nonconfined university housing fires.
■ University housing fires occur most frequently in the late summer and fall, peaking in September at 12 percent. Fires in September, October, and November account for 33 percent of all fires throughout the year.
■ The leading causes of nonconfined university housing fires are intentional (16 percent), other unintentional or careless actions (12 percent), open flame (11 percent), and other heat (10 percent).
■ Smoke alarms were present in 85 percent of nonconfined fires in occupied university housing.
From 2007 to 2009, an estimated 3,800 university hous-ing fires occurred in the United States each year. These
fires account for approximately 1 percent of total residen-tial building fires responded to by fire departments across the United States.1, 2, 3 University housing fires resulted in a yearly average of 0 deaths, 25 injuries, and $9 million in property loss.
This topical report addresses the characteristics of univer-sity housing fires reported to the National Fire Incident Reporting System (NFIRS) between 2007 and 2009 and is an update to the topical report, University Housing Fires (Volume 10, Issue 1, released June 2010). In NFIRS, university hous-ing fires are considered to be fires in college and university residential buildings that include dormitories and fraternity and sorority houses.
The U.S. Consumer Product Safety Commission (CPSC) reports an increase in dormitory and university hous-ing fires in recent years. The number of university and dormitory housing fires increased from 1,800 per year in the late 1990s to 3,300 per year in 2005.4 Students bring more items from home to make their college stays more comfortable, including high-powered electrical equipment and appliances. However, the equipment can be danger-ous when used improperly or left unsupervised, especially in dormitory rooms. The CPSC reported that fires are more common during the evenings and weekends when
most students are in residence halls. Most of the fires are cooking-related (hot plates, microwaves, portable grills, etc.), but the majority of deaths occur in bedrooms.5 It should be noted, however, that the 1990’s university hous-ing estimates are based on NFIRS Version 4.1 data, with recent estimates based on NFIRS Version 5.0 data. There are substantial differences between the two data collection systems, and as a result, the estimates from the two systems may not be comparable. Because the two NFIRS data col-lection systems captured the data differently, the increase in university housing fires shown by CPSC may not necessarily reflect a true trend change.
In a joint statement in 2007, the CPSC, the U.S. Fire Administration (USFA), the National Fire Protection Association (NFPA), and the University of Maryland’s Fire Marshal urged students, families, and school administra-tors across the Nation to be aware of the fire hazards and to take precautions.6 In addition, the Higher Education Opportunity Act, passed by Congress in 2008, now requires universities and colleges to publish an annual fire safety report and maintain a fire reporting log. As part of this law, institutions must provide a description of each oncampus housing fire safety policy and sprinkler system as well as rules regarding fire safety education, training, and evacua-tion procedures in each residence. Along with this, univer-sities must provide statistics on fire losses for each calendar year, as well as details on specific fire incidents.7

TFRS Volume 12, Issue 9/University Housing Fires (2007-2009) Page 2
Type of FiresBuilding fires consist of two major categories of incidents: fires that are confined to specific types of equipment or objects (confined fires) and those that are not (noncon-fined fires). Confined building fires are small fire incidents
that are limited in scope and confined to noncombustible containers.8 Confined fires rarely result in serious injury or large content losses, and are expected to have no signifi-cant accompanying property losses due to flame damage.9 Eighty-seven percent of university housing fires are con-fined fires, as shown in Table 1.
Table 1. University Housing Fires by Type of Incident (2007-2009)
Incident Type PercentNonconfined Fires 12.6Confined Fires 87.4
Cooking fire, confined to container 81.3Chimney or flue fire, confined to chimney or flue 0.3Incinerator overload or malfunction, fire contained 0.2Fuel burner/boiler malfunction, fire contained 0.9Commercial compactor fire, confined to rubbish 0.1Trash or rubbish fire, contained 4.7
Total Incidents 100.0Source: NFIRS 5.0.
Loss MeasuresTable 2 presents losses, averaged over this 3-year period, for residential building fires and university housing fires
reported to NFIRS.10 The average number of deaths and injuries per 1,000 fires, as well as dollar loss per fire, in university housing are well below the same figures for resi-dential building fires (excluding university housing fires).
Table 2. Loss Measures for University Housing Fires (3-year average, 2007-2009)
MeasuresResidential Building Fires
(Excludes University Housing Fires)
University Housing Fires
Confined University Housing Fires
Nonconfined University Housing Fires
Average Loss:Fatalities/1,000 Fires 5.6 0.4 0.0 3.1Injuries/1,000 Fires 28.7 5.2 1.0 34.2Dollar Loss/Fire $17,090 $1,970 $80 $15,130
Source: NFIRS 5.0.Notes: 1) No deaths were reported to NFIRS in confined university housing fires during 2007–2009; the resulting loss of 0.0 fatalities per 1,000 fires reflects only data reported to NFIRS. 2) Average loss for fatalities and injuries is computed per 1,000 fires; average dollar loss is computed per fire and is rounded to the nearest $10. 3) When calculating the average dollar loss per fire for 2007–2009, the 2007 and 2008 dollar loss values were adjusted to their equivalent 2009 dollar loss values to account for inflation.
Table 3 presents the percentage distribution of property use for all university housing fires, confined university hous-ing fires, and nonconfined university housing fires. Fires in dormitories and dormitory-type residences account for 95 percent of all university housing fires. These fires also account for 96 percent of confined university housing fires
and 87 percent of nonconfined university housing fires. While sorority and fraternity housing fires are not substan-tial in terms of the overall number of university housing fires, they play a bigger role in nonconfined fires. They account for 13 percent of fires in this category, while only 4 percent in the confined category.
Table 3. Percentage Distribution of Property Use for University Housing Fires (3-year average, 2007-2009)
Property Use All University Housing Fires
Confined University Housing Fires
Nonconfined University Housing Fires
Dormitory and Dormitory-type residence 94.9 96.0 87.0Sorority House, Fraternity House 5.1 4.0 13.0Total 100.0 100.0 100.0Source: NFIRS 5.0.

TFRS Volume 12, Issue 9/University Housing Fires (2007-2009) Page 3
When University Housing Fires OccurAs shown in Figure 1, university housing fires occur mainly in the early evening hours from 5 to 10 p.m., peaking from 7 to 9 p.m., and then declining throughout the evening and into the early morning hours. The lowest point is from
5 to 6 a.m.11 The distribution of fires by time of alarm is very similar to that of residential fires (excluding university housing fires), but there tend to be more fires in university housing in the evening hours. This may be due to when most students are in their residences and cooking evening meals.
Figure 1. University Housing Fires by Time of Alarm (2007–2009)
0.0
1.0
2.0
3.0
4.0
5.0
6.0
7.0
8.09.0
11PM
-Mid
10PM
-11P
M
9PM
-10P
M
8PM
-9PM
7PM
-8PM
6PM
-7PM
5PM
-6PM
4PM
-5PM
3PM
-4PM
2PM
-3PM
1PM
-2PM
12PM
-1PM
11AM
-12P
M
10AM
-11A
M
9AM
-10A
M
8AM
-9AM
7AM
-8AM
6AM
-7AM
5AM
-6AM
4AM
-5AM
3AM
-4AM
2AM
-3AM
1AM
-2AM
Mid
-1AM
Time of Alarm
Perc
ent o
f Uni
vers
ity H
ousi
ng F
ires
3.7
2.5 2.82.1
1.5 1.2 1.4 1.72.4
4.0
8.5 8.3
6.35.5
4.64.5 4.6 4.8 5.1
6.7
7.7
4.4
Residential Building Fires(excluding UniversityHousing Fires)
2.73.1
Source: NFIRS 5.0.
As shown in Figure 2, university housing fires occur most frequently in the late summer and fall, peaking in September at 12 percent. Fires in September, October, and November account for 33 percent of all fires throughout the year. This is primarily due to the fact that these monthsconstitute the beginning of the academic year for most students. From December to April, fires fluctuate between
8 and 9 percent, accounting for 44 percent of fires for the year. Fires decline dramatically during the summer months, mainly because students are not in attendance at universities and student housing may be unoccupied. This is in contrast to residential building fires (excluding univer-sity housing fires), where fires occur most frequently in the winter months and dip in the summer months.
Figure 2. University Housing Fires by Month (2007–2009)
Month of Year
Perc
ent o
f Uni
vers
ity H
ousi
ng F
ires
0.0
2.0
4.0
6.0
8.0
10.0
12.0
14.0
Dece
mbe
r
Nove
mbe
r
Octo
ber
Sept
embe
r
Augu
st
July
JuneMay
April
Mar
ch
Febr
uary
Janu
ary
9.0 9.2 9.0
5.15.9
11.8
8.08.4
4.9
10.011.1
7.6
Residential Building Fires (Excluding University Housing Fires)
Source: NFIRS 5.0.

TFRS Volume 12, Issue 9/University Housing Fires (2007-2009) Page 4
Causes of University Housing FiresEighty-eight percent of all university housing fires are cook-ing fires as shown in Table 4. The next four causes account for 7 percent of all university housing fires: intentionally set fires (2 percent), heating (2 percent), open flame (1 per-cent), and other unintentional, careless actions (1 percent).12
While candle fires, a subset of open flame fires, have been a major concern in university housing, they constitute half of 1 percent of all university housing fires. This may be due to the fact that only a small number of these fires are actu-ally reported to NFIRS. This lack of reporting could be due to campus regulations banning candles, combined with the lack of data from confined fires.
Table 4. Leading Causes of University Housing Fires (2007-2009)
Cause Percent (Unknowns Apportioned)Cooking 87.5Intentional 2.2Heating 1.7Open Flame 1.3Other Unintentional, Careless 1.3Source: NFIRS 5.0.
Confined FiresConfined fires are allowed abbreviated NFIRS reporting and many reporting details of the fire are not required and not reported. These fires are small in nature and often do not cause significant injury or damage. The three major areas where data are available—time of day, month, and cause—confined fires dominate the overall university housing fire profile. Thirty-nine percent of confined university housing fires occur between 5 and 10 p.m., with the peak occur-ring between 7 and 8 p.m. Confined fires most often occur in the months of September, October, and November in the calendar year, and then decline throughout the rest of the academic year, with the lowest points in June and July. Cooking is the cause of 97 percent of confined university housing fires, which is not surprising given that cooking is the cause of 88 percent of all university housing fires.
Nonconfined FiresThe next sections of this topical report address nonconfined university housing fires, where detailed fire data are avail-able, such as equipment involved in ignition, heat source, etc. While these fires are not as prevalent as confined fires in university housing, they often cause serious injury and property damage.
Causes of Nonconfined University Housing FiresWhile cooking is the leading cause of university housing fires overall, it is only a small percentage of nonconfined university housing fires (9 percent). As shown in Figure 3, the leading causes of nonconfined university fires are inten-tional (16 percent), other unintentional, careless actions (12 percent), open flame (11 percent), and other heat (10 percent).

TFRS Volume 12, Issue 9/University Housing Fires (2007-2009) Page 5
Figure 3. Causes of Nonconfined University Housing Fires (2007–2009)
0.0 5.0 10.0 15.0 20.0 25.0
Unknown
Investigation with Arson Module
Other Unintentional, Careless
Equipment Misoperation, Failure
Exposure
Natural
Other Equipment
Other Heat
Open Flame
Appliances
Electrical Malfunction
Cooking
Heating
Smoking
Playing with Heat Source
Intentional
Percent of Nonconfined University Housing Fires with Cause Determined
Percent of All Nonconfined University Housing Fires
15.712.4
0.80.6
5.54.4
4.23.3
9.07.2
9.47.5
5.94.7
10.88.6
10.38.2
1.00.8
2.31.92.1
1.79.7
11.59.1
1.81.5
7.7
20.5
Percent of Nonconfined University Housing Fires
Caus
es
Source: NFIRS 5.0.Note: Causes are listed in order of the USFA Cause Hierarchy for ease of comparison of fire causes across different aspects of the fire problem. Fires are assigned to 1 of 16 cause
groupings using a hierarchy of definitions, approximately as shown in the chart above. A fire is included in the highest category into which it fits. If it does not fit the top category, then the second one is considered, and if not that one, the third, and so on. For example, if the fire is judged to be intentionally set and a match was used to ignite it, it is classified as intentional and not open flame because intentional is higher in the hierarchy.
Where Nonconfined University Housing Fires Start (Area of Fire Origin)Nonconfined university housing fires occur in a variety of areas, but most start in either the kitchen or cooking area
(24 percent) or the bedroom (18 percent). Fires that start in laundry areas (7 percent), bathrooms (7 percent), hallways and corridors (4 percent), and common rooms or dens (4 percent) make up an additional 22 percent of nonconfined fires (Table 5).
Table 5. Leading Areas of Fire Origin in Nonconfined University Housing Fires (2007-2009)
Area of Origin Percent (Unknowns Apportioned)Cooking Area, Kitchen 24.3Bedrooms 18.4Laundry Area 7.2Bathroom 6.8Hallway Corridor 4.1Common Room, Den 3.5Source: NFIRS 5.0.
For intentionally-set nonconfined fires, 19 percent are set in the hallways or corridors of the building, while 17 percent are first set in the bedroom. Intentionally-set nonconfined fires also occur in bathrooms (10 percent), the egress or exit areas of buildings (8 percent), common rooms or dens (5 percent), and kitchens (5 percent).
The second leading cause of nonconfined university hous-ing fires is other unintentional or careless actions, where the majority of these fires start in the kitchen or cooking area (44 percent). Fires in the bedroom account for an additional 24 percent of nonconfined other unintentional fires.

TFRS Volume 12, Issue 9/University Housing Fires (2007-2009) Page 6
Fires involving open flame in bedrooms account for 34 percent of the total of all nonconfined university housing open-flame fires. Open-flame fires also start in the kitchen or cooking area (14 percent) and the bathroom (8 percent), totaling 22 percent.
The majority of nonconfined university housing fires where the cause is “other heat” start mainly in the bedroom (22 percent) or the cooking area/kitchen (22 percent). Other heat fires also start in the laundry area (6 percent) and on the exterior roof (6 percent).
How Nonconfined University Housing Fires Start (Heat Source)The heat source categories for nonconfined university housing fires are shown in Figure 4. Heat from operating
equipment accounts for 51 percent of nonconfined univer-sity housing fires. This category includes heat from other operating equipment, which accounts for 19 percent of all nonconfined university housing fires, as well as radiated or conducted heat from operating equipment, which com-prises 18 percent of these fires. The second-leading heat source category is heat from open flame or smoking mate-rials, which totals 25 percent of nonconfined university housing fires. This category includes such heat sources as candles, cigarettes, lighters, and matches. The third largest category for heat source is hot or smoldering objects. This category can include such heat sources as hot ash or embers from fireplaces and heat sparked from friction, and accounts for 13 percent of these fires.
Figure 4. Sources of Heat in Nonconfined University Housing Fires by Major Category (2007–2009)
0.0 10.0 20.0 30.0 40.0 50.0 60.0
Undetermined
Multiple Heat Sources
Explosives, Fireworks
Chemicals, Natural Heat Sources
Heat Spread from Another Fire
Other Heat Source
Hot or Smoldering Object
Heat from Open Flame or Smoking Materials
Operating Equipment
Percent of Nonconfined University Housing Fires with Heat Source Determined
Percent of All Nonconfined University Housing Fires
50.738.8
24.718.9
12.59.5
6.55.0
2.41.9
1.81.3
1.20.9
0.10.1
23.5
Percent of Nonconfined University Housing FiresSource: NFIRS 5.0.
Of the causes for nonconfined university housing fires, 39 percent specifically involve equipment of some fashion.13 In these cases, the leading heat source is heat from operating equipment, accounting for 84 percent of these fires. Of the 24 percent of fires that start in the cooking area or kitchen (Table 5), 31 percent of these fires are started by heat from powered equipment, 30 percent are started by radiated or conducted heat from operating equipment, and 6 percent are started by a spark, ember, or flame from operating equipment.
As shown in Table 5, 18 percent of nonconfined univer-sity housing fires start in the bedroom. Of these fires, 11 percent are started by heat from operating equipment, 17 percent are started by radiated or conducted heat from operating equipment, and 8 percent are started by elec-trical arcing. Although candles are strictly prohibited in residences by many schools, they still make up 14 percent of nonconfined university housing fires that start in the bedroom.

TFRS Volume 12, Issue 9/University Housing Fires (2007-2009) Page 7
Fire Spread in Nonconfined University HousingFire spread in nonconfined university housing is generally contained to the object of origin (43 percent), or to the room of origin (41 percent), as shown in Figure 5. When
these statistics are combined with the implied fire spread for confined fires (that is, confined fires are implied to be confined to the object of origin), 92 percent of all univer-sity housing fires are found to be confined to the object of origin.
Figure 5. Extent of Fire Spread in Nonconfined University Housing Fires (2007–2009)
0.0 10.0 20.0 30.0 40.0 50.0
Beyond building of origin
Confined to building of origin
Confined to floor of origin
Confined to room of origin
Confined to object of origin
Percent of Nonconfined University Housing Fires
43.0
40.7
5.4
8.5
2.4
Source: NFIRS 5.0.
Factors Contributing to IgnitionTable 6 shows the leading factors contributing to ignition of nonconfined university housing fires. Abandoned or discarded materials or products were the leading factors contributing to ignition at 15 percent, with placing a heat
source too close to combustibles at 14 percent. These two factors, coupled with a general misuse of material or prod-ucts at 12 percent, accounted for 40 percent of all noncon-fined university housing fires.14 Equipment left unattended was a factor contributing to ignition in an additional 10 percent of the nonconfined university housing fires.
Table 6. Leading Factors Contributing to Ignition for Nonconfined University Housing Fires (Where Factor Contributing Specified, 2007-2009)
Factors Contributing to Ignition Percent of Nonconfined University Housing Fires (Unknowns Apportioned)
Abandoned or discarded materials or products 14.8Heat source too close to combustibles 14.1Misuse of material or product, other 11.5Equipment unattended 9.6Source: NFIRS 5.0.Notes: Indicates only incidents where factors that contributed to the ignition of the fire were specified. Multiple factors contributing to ignition may be noted for each incident.
Alerting/Suppression Systems in University Housing FiresTechnologies to detect and extinguish fires have been a major contributor to the drop in fire fatalities and injuries over the past 30 years. Smoke alarms are now present in the majority of residential buildings, including university housing. In addition, the use of residential sprinklers is
widely supported by the fire service, and based on NFIRS data, is more common in university housing than in any other residential property type.
Smoke alarm data are available for both confined and non-confined fires, although for confined fires, the data are very limited in scope. As different levels of data are collected on smoke alarms in confined and nonconfined fires, the

TFRS Volume 12, Issue 9/University Housing Fires (2007-2009) Page 8
analyses are performed separately. Note that the data pre-sented in Tables 7 to 9 are the raw counts from the NFIRS data set and are not scaled to national estimates of smoke alarms in university housing fires. In addition, NFIRS does not allow for the determination of the type of smoke alarm—that is, if the smoke alarm was photoelectric or ionization, or the location of the smoke alarm with respect to the area of fire origin.
Smoke Alarms in Nonconfined Fires
Because of various avenues of fire notification in university housing, the detailed smoke alarm analyses in this section focus on all nonconfined fires in university housing.15
Smoke alarms were reported as present in 82 percent of nonconfined fires in university housing (Table 7). In 9 per-cent of nonconfined fires in university housing, there were no smoke alarms present. In another 9 percent of these fires, firefighters were unable to determine if a smoke alarm was present.
When smoke alarms were present (82 percent) and the alarm operational status is considered, the percentage of smoke alarms reported as present consists of:
• smoke alarms present and operated—63 percent;
• present but did not operate—13 percent (fire too small, 9 percent; alarm did not operate, 4 percent); and
• present, but operational status unknown—6 percent.
When the subset of incidents where smoke alarms were reported as present are analyzed separately and as a whole, smoke alarms were reported to have operated in 77 percent of the incidents. The alarms did not operate in 16 percent of the incidents (in 5 percent of the incidents, the alarm failed to operate; in 11 percent, the fire was too small to activate the alarm). The operational status of the alarm was undetermined in 7 percent of these incidents.
Table 7. NFIRS Smoke Alarm Data for Nonconfined University Housing Fires (NFIRS, 2007-2009)
Presence of Smoke Alarms Smoke alarm operational status Smoke Alarm Effectiveness Count Percent
Present
Fire too small to activate smoke alarm 87 9.0
Smoke alarm operated
Smoke alarm alerted occupants, occupants respondedSmoke alarm alerted occupants, occupants failed to respondNo occupants
5143732
53.33.83.3
Smoke alarm failed to alert occupants 5 0.5Undetermined 18 1.9
Smoke alarm failed to operate 41 4.3Undetermined 53 5.5
None present 90 9.3Undetermined 87 9.0Total Incidents 964 100.0Source: NFIRS 5.0.Notes: The data presented in this table are raw data counts from the NFIRS data set. They do not represent national estimates of smoke alarms in nonconfined university housing fires. They are presented for infor-
mational purposes. Total may not add to 100 percent due to rounding.
Smoke Alarms in Confined Fires
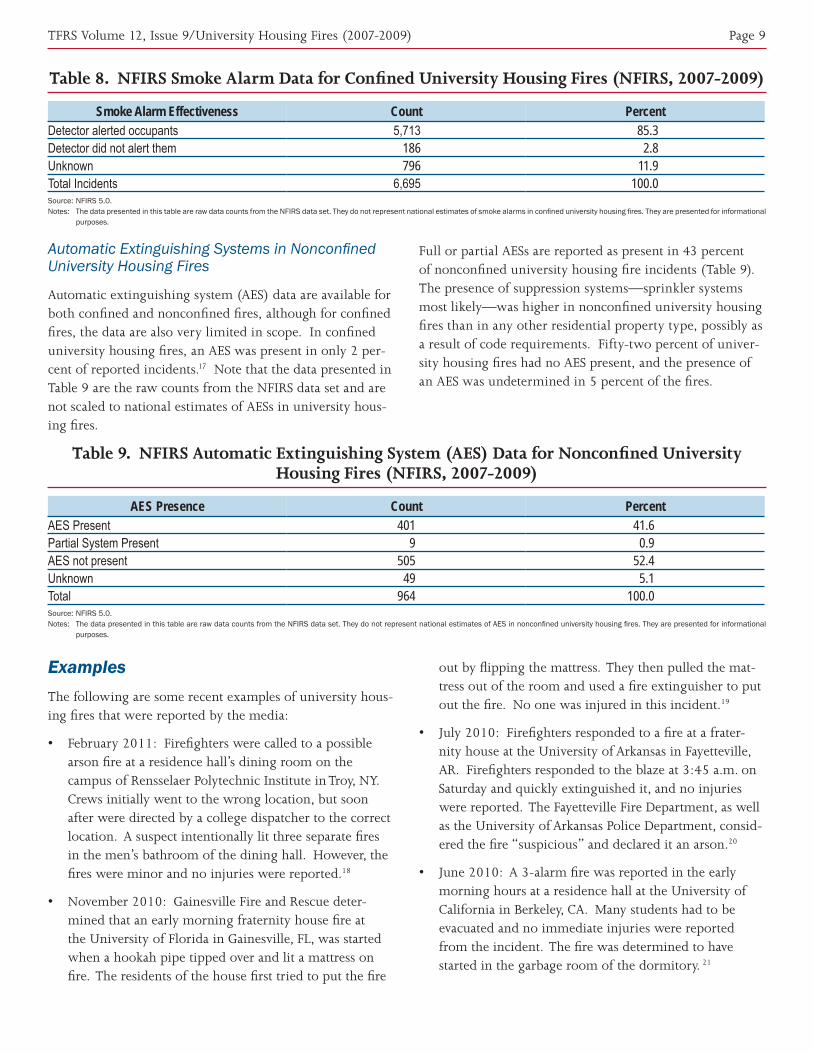
Less information about smoke alarm status is collected for confined fires, but the data still give important insights about the effectiveness of alerting occupants in these types of fires. Smoke alarms alerted occupants in 85 percent of the reported confined university housing fires (Table 8). In other words, in about 85 percent of fires in these build-ings, residents received a warning from a smoke alarm. The data suggest that smoke alarms may alert residents to confined fires as the early alerting allowed the occupants to
extinguish the fires, or the fires self-extinguished. If this is the case, it is an example of the contribution to overall safety and the ability to rapidly respond to fires in early stages that smoke alarms afford. Details on smoke alarm effectiveness for confined fires are needed to pursue this analysis further.
Occupants were not alerted by smoke alarms in only 3 percent of confined university housing fires.16 In 12 percent of these confined fires, the smoke alarm effectiveness was unknown.
TFRS Volume 12, Issue 9/University Housing Fires (2007-2009) Page 9
Table 8. NFIRS Smoke Alarm Data for Confined University Housing Fires (NFIRS, 2007-2009)
Smoke Alarm Effectiveness Count PercentDetector alerted occupants 5,713 85.3Detector did not alert them 186 2.8Unknown 796 11.9Total Incidents 6,695 100.0Source: NFIRS 5.0.Notes: The data presented in this table are raw data counts from the NFIRS data set. They do not represent national estimates of smoke alarms in confined university housing fires. They are presented for informational
purposes.
Automatic Extinguishing Systems in Nonconfined University Housing Fires
Automatic extinguishing system (AES) data are available for both confined and nonconfined fires, although for confined fires, the data are also very limited in scope. In confined university housing fires, an AES was present in only 2 per-cent of reported incidents.17 Note that the data presented in Table 9 are the raw counts from the NFIRS data set and are not scaled to national estimates of AESs in university hous-ing fires.
Full or partial AESs are reported as present in 43 percent of nonconfined university housing fire incidents (Table 9). The presence of suppression systems—sprinkler systems most likely—was higher in nonconfined university housing fires than in any other residential property type, possibly as a result of code requirements. Fifty-two percent of univer-sity housing fires had no AES present, and the presence of an AES was undetermined in 5 percent of the fires.
Table 9. NFIRS Automatic Extinguishing System (AES) Data for Nonconfined University Housing Fires (NFIRS, 2007-2009)
AES Presence Count PercentAES Present 401 41.6Partial System Present 9 0.9AES not present 505 52.4Unknown 49 5.1Total 964 100.0Source: NFIRS 5.0.Notes: The data presented in this table are raw data counts from the NFIRS data set. They do not represent national estimates of AES in nonconfined university housing fires. They are presented for informational
purposes.
ExamplesThe following are some recent examples of university hous-ing fires that were reported by the media:
• February 2011: Firefighters were called to a possible arson fire at a residence hall’s dining room on the campus of Rensselaer Polytechnic Institute in Troy, NY. Crews initially went to the wrong location, but soon after were directed by a college dispatcher to the correct location. A suspect intentionally lit three separate fires in the men’s bathroom of the dining hall. However, the fires were minor and no injuries were reported.18
• November 2010: Gainesville Fire and Rescue deter-mined that an early morning fraternity house fire at the University of Florida in Gainesville, FL, was started when a hookah pipe tipped over and lit a mattress on fire. The residents of the house first tried to put the fire
out by flipping the mattress. They then pulled the mat-tress out of the room and used a fire extinguisher to put out the fire. No one was injured in this incident.19
• July 2010: Firefighters responded to a fire at a frater-nity house at the University of Arkansas in Fayetteville, AR. Firefighters responded to the blaze at 3:45 a.m. on Saturday and quickly extinguished it, and no injuries were reported. The Fayetteville Fire Department, as well as the University of Arkansas Police Department, consid-ered the fire “suspicious” and declared it an arson.20
• June 2010: A 3-alarm fire was reported in the early morning hours at a residence hall at the University of California in Berkeley, CA. Many students had to be evacuated and no immediate injuries were reported from the incident. The fire was determined to have started in the garbage room of the dormitory. 21

TFRS Volume 12, Issue 9/University Housing Fires (2007-2009) Page 10
NFIRS Data Specifications for University Housing FiresData for this report were extracted from the NFIRS annual Public Data Release (PDR) files for 2007, 2008, and 2009. Only version 5.0 data were extracted.
University housing fires were defined as:
• Aid types 3 (mutual aid given) and 4 (automatic aid given) were excluded to avoid double counting of incidents.
• Incident types 111–123:
Incident Type Description
111 Building fire112 Fires in structure other than in a building113 Cooking fire, confined to container114 Chimney or flue fire, confined to chimney or flue115 Incinerator overload or malfunction, fire contained116 Fuel burner/boiler malfunction, fire contained117 Commercial compactor fire, confined to rubbish118 Trash or rubbish fire, contained120 Fire in mobile property used as a fixed structure, other121 Fire in mobile home used a fixed residence122 Fire in motor home, camper, recreational vehicle123 Fire in portable building, fixed location
Note that incident types 113–118 do not specify if the structure is a building. Incident type 112 is included prior to 2008 as previous analyses have shown that incident types 111 and 112 are used interchangeably. As of 2008, incident type 112 is excluded.
• Property use 400–464:
Property DescriptionUse460 Dormitory-type residence, other462 Sorority house, fraternity house464 Barracks, dormitory
• Structure type:
– For Incident Types 113–118:▪ 1–Enclosed building;▪ 2–Fixed portable or mobile structure; and▪ Structure type not specified (null entry).
– For Incident Types 111, 112, and 120–123:▪ 1–Enclosed building; and▪ 2–Fixed portable or mobile structure.
The analyses contained in this report reflect the current methodologies used by the USFA. The USFA is committed to providing the best information on the United States fire problem and continually examines its data and methodol-ogy to fulfill this goal. Because of this commitment, data collection strategies and methodological changes are pos-sible and do occur. As a result, analyses and estimates of the fire problem may change slightly over time. Previous analyses and estimates on specific issues (or similar issues) may have used different methodologies or data definitions and may not be directly comparable to the current ones.
To request additional information or to comment on this report, visit http://www.usfa.fema.gov/applications/
feedback/index.jsp
Notes: 1 National estimates are based on 2007–2009 native version 5.0 data from the National Fire Incident Reporting System (NFIRS), residential structure fire loss estimates from the National Fire Protection Association’s (NFPA’s) annual surveys of fire loss, and the U.S. Fire Administration’s (USFA’s) residential building fire loss estimates. Fires are rounded to the nearest 100, deaths to the nearest 5, injuries to the nearest 25, and loss to the nearest $million.
2 University housing consists of college and university residential buildings that include dormitories and barracks (a com-bined category), sorority houses, and fraternity houses.
3 In the National Fire Incident Reporting System (NFIRS), version 5.0, a structure is a constructed item of which a building is one type. In previous versions of NFIRS, the term “residential structure” commonly referred to buildings where people live. To coincide with this concept, the definition of a residential structure fire for NFIRS 5.0 has, therefore, changed to include only those fires where the NFIRS 5.0 structure type is 1 or 2 (enclosed building and fixed portable or mobile struc-ture) with a residential property use. Such fires are referred to as “residential buildings” to distinguish these buildings from other structures on residential properties that may include fences, sheds, and other uninhabitable buildings. In addition, confined fire incidents that have a residential property use, but do not have a structure type specified are presumed to be buildings. Nonconfined fire incidents that have a residential property use without a structure type specified are considered to be invalid incidents (structure type is a required field) and are not included.

TFRS Volume 12, Issue 9/University Housing Fires (2007-2009) Page 11
4 “News from CPSC, U.S. Consumer Product Safety Commission: Increase in College Dorm Fire Prompts Officials to Issue Warning,” cpsc.gov, August 21, 2007. http://www.cpsc.gov/cpscpub/prerel/prhtml07/07279.html (accessed April 7, 2011).
5 “News from CPSC, U.S. Consumer Product Safety Commission: Increase in College Dorm Fire Prompts Officials to Issue Warning,” cpsc.gov, August 21, 2007. http://www.cpsc.gov/cpscpub/prerel/prhtml07/07279.html (accessed April 7, 2011).
6 “News from CPSC, U.S. Consumer Product Safety Commission: Increase in College Dorm Fire Prompts Officials to Issue Warning,” cpsc.gov, August 21, 2007. http://www.cpsc.gov/cpscpub/prerel/prhtml07/07279.html (accessed April 7, 2011).
7 “Higher Education Opportunity Act – Fire Safety,” Harvard University, University Operations Services. http://www.uos.harvard.edu/ehs/fire_safety/heoa.shtml (accessed April 7, 2011).
8 In NFIRS, confined fires are defined by Incident Type codes 113–118.
9 NFIRS distinguishes between “content” and “property” loss. Content loss includes loss to the contents of a structure due to damage by fire, smoke, water, and overhaul. Property loss includes losses to the structure itself or to the property itself. Total loss is the sum of the content loss and property loss. For confined fires, the expectation is that the fire did not spread beyond the container (or rubbish for Incident Type 118) and hence, there was no property damage (damage to the structure itself) from the flames. There could be, however, property damage as a result of smoke, water, and overhaul.
10 The average fire death and fire injury loss rates computed from the national estimates will not agree with average fire death and fire injury loss rates computed from NFIRS data alone. The fire death rate computed from the national esti-mates would be (1,000*(0/3,800)) = 0.0 deaths per 1,000 university housing fires and the fire injury rate would be (1,000*(25/3,800)) = 6.6 injuries per 1,000 university housing fires.
11 For the purposes of this report, the time of the fire alarm is used as an approximation for the general time the fire started. However, in NFIRS, it is the time the fire was reported to the fire department.
12 The USFA cause hierarchy was used to determine the cause of university housing fire incidents. The cause hierarchy is designed for structure fires of which buildings are a subset. The cause definitions can be found at http: //www.usfa.fema.gov/fireservice/nfirs/tools/fire_cause_category_matrix.shtm.
13 These causes are: heating, cooking, electrical malfunction, appliances, other equipment, and equipment misoperation. Other causes may also have had equipment involved.
14 Percentages cited in the text may not add up due to rounding.
15 The discussion in the “Smoke Alarms in Nonconfined Fires” section of this report includes nonconfined fires that occur in both occupied and unoccupied university housing. There are two principal reasons for including both states of occupancy in the analysis. First, requirements that smoke alarms be interconnected in university housing are being included in an increasing number of local building codes. As result, interconnected alarms may be present in more recently constructed university residential buildings in many jurisdictions. Second, in all university housing, the proximity or closeness of the group quarters or occupants’ rooms to one another heightens the possibility that an occupant would hear an alarm, smell smoke, or see flames coming from a neighboring room. So, even though a fire may start in an unoccupied room, it is pos-sible that a fire department will be notified either automatically or by an occupant in a neighboring room, who may become alerted to the presence of a fire either by the sounding of an interconnected alarm or by other physical cues.
16 In confined fires, the entry “smoke alarm did not alert occupants” can mean: no smoke alarm was present, the smoke alarm was present but did not operate, the smoke alarm was present and operated but the occupant was already aware of the fire, or there were no occupants present at the time of the fire.
17 As confined fire codes are designed to capture fires contained to noncombustible containers, it is not recommended to code a fire incident as a small, low-, or no-loss confined fire incident if the automatic extinguishing system (AES) operated and contained the fire as a result. The preferred method is to code the fire as a standard fire incident with fire spread con-fined to the object of origin and provide the relevant information on AES presence and operation.
TFRS Volume 12, Issue 9/University Housing Fires (2007-2009) Page 12
18 James Franco, “Troy Police investigating arson at RPI’s Burdett Avenue Residence Hall,” troyrecord.com, February 8, 2011. http://www.troyrecord.com/articles/2011/02/08/news/doc4d51e305b011e211486901.txt (accessed April 8, 2011).
19 Karen Voyles, “Fire at fraternity house blamed on hookah pipe,” Gainesville.com, November 17, 2010. http://www.gainesville.com/article/20101117/ARTICLES/101119499/1118%3FTitle=Fire-at-fraternity-house-blamed-on-hookah (accessed April 8, 2011).
20 Todd Gill, “City and university looking for frat house arson suspect,” fayettevilleflyer.com, July 16, 2010. http://www.fayettevilleflyer.com/2010/07/16/city-and-university-looking-for-frat-house-arson-suspect/ (accessed April 8, 2011).
21 “UC Berkeley dorm evacuated after fire,” sfgate.com, June 26, 2010. http://www.sfgate.com/cgi-bin/article.cgi?f=/baycitynews/a/2010/06/26/dorm26.DTL (accessed April 8, 2011).