finite element simulation of the multi jet fusion (mjf ... · fusion (mjf™) process using abaqus...
TRANSCRIPT

Finite Element Simulation of the Multi Jet Fusion (MJF™) Process using Abaqus
Dan Fradl, Jay Panditaratne Advanced Technology & Platform Solutions Group, Imaging Printing &
Solutions, HP Inc.
Jing Bi, Rachel Fu, Victor Oancea Dassault Systèmes, SIMULIA
Keywords:
Finite Element Simulation, Additive Manufacturing, 3D Printing, Thermal Inkjet, Multi Jet Fusion (MJF™), Polymer.
Abstract:
Although additive manufacturing was first developed in the 1980’s, the technology is mainly applied for prototyping and tooling. The printing process is not well understood and controlled to be confidently used for printing of load bearing parts. Due to the complex geometry and the layer by layer printing process, parts as printed may show distortion, residual stress, delamination and failure that render the part unusable at the moment that it comes out of the machine. Finite element simulations of additive manufacturing can be very effective in understanding the cause of these defects and predicting the in-service performance of the printed parts. However, most finite element codes are not designed for simulating additive manufacturing processes. Due to large chunks of material that are progressively deposited to the part, moving heat sources and complex evolving heat transfer boundaries that comes with the progressive material addition makes this multi-physics problem intractable. Adding to the complexity is the different types of additive manufacturing processes in existence and the different types of materials being used. Lastly, finite element simulation of additive manufacturing processes has not been too
2017 Science in the Age of Experience 440

useful to date because of the long simulation times and the inexactitude nature of simulation results due to its difficulty in capturing all the physics of the process.
In this paper, we adopt some of the latest technologies developed in the commercial finite element software package - Abaqus - to effectively simulate the Multi Jet Fusion (MJF™) printing process. We first characterize the independent physical events using the event series data; including event time, event location, and material status information. These independent events could be powder material deposition, heating and cooling events or chemical agent deposition events. Abaqus solves for the dependent events such as the powder melting, evolution of cooling surfaces, and material temperature, stress and distortion. Materials and elements are progressively activated according to the powder deposition events. We then use a user defined moving distributed flux subroutine to model multiple moving heat sources. The Abaqus keyword interface and user subroutines are customized to account for different types of moving heating sources and different chemical agent additions. MJF™ uses two functional agents; a fusing agent and a detailing agent during the multi-pass print process. Once the keyword interface and user subroutines are defined, the cost for modeling different parts and geometries is significantly reduced. This results in significant simplification of modeling effort as well as much shorter simulation time as compared to actual printing time. This makes finite element simulations effective for print process development and functional part production.
1. Introduction
Additive Manufacturing (AM) is developing more rapidly than ever thanks partly to the progress in computer aided design (CAD) systems. Many different types of AM processes are available today. Popular types of printing processes include polymer extrusion processes like Fused Deposition Modeling (FDM) and powder bed fusion processes like Direct Metal Laser Sintering (DMLS), Electron Beam Melting (EBM), Selective
2017 Science in the Age of Experience 441
Heat Sintering (SHS), Selective Laser Melting (SLM) and Selective Laser Sintering (SLS). However, in each of these technologies the process by which the build quality is controlled is not well understood and parts as printed may show distortion, residual stresses, delamination and failure that render the part unusable the moment it comes out of the machine.
Finite Element (FE) simulations of AM can be very effective in understanding the cause of these defects and predicting the in-service performance of the printed parts. Many researchers have started to use FE process simulations to analyze the effect of process parameters such as print path and print speed on product analytics like material temperature, stress distribution and tolerance [1, 2, and 3]. However, most analyses in literatures are difficult to apply to different print processes and are mostly not suitable for complex geometries due to various simplifying assumptions. For example, Kim et al. [4] considered FE simulations to be too slow for simulating multiple layers of material in 3D printing because of its high computational complexity and instead used low-order process-level modeling to analyze MJF™. This is because most FE codes are not designed for simulating AM processes. Due to large chunks of material that are progressively added to form the part, various types of moving heat sources and complex evolving heat transfer boundaries that comes with the progressive material addition, FE simulation of AM processes has not become an efficient tool for 3D print product development.
In this paper, a new framework is developed and presented using the commercial FE software package Abaqus [5] to simulate different AM processes and is applied to the MJF™ process. A verification study using an energy balance approach is performed to prove that the methodology being used is adding the correct amount of heat into the system for different types of heating sources (lamps) and chemical agents. The Event Series transform feature for lamps and chemical agent deposition is also verified before the methodology is tested against a realistic multi-pass multi-fuse print process for both a simple (rectangular) part and a complex (Scoliosis Brace) part. Detailed printer hardware data and process
2017 Science in the Age of Experience 442

parameters are used to generate the Event Series input format in Abaqus. A pair of user defined material activation subroutines are used to handle the progressive material addition by progressively activating material and element properties in the analysis. We then use a pair of user defined moving distributed flux subroutines to model multiple different moving heat sources like the stationary (overhead) lamps and the translating (fusing) lamps, and chemical agent deposition. The Abaqus keyword interface and user subroutines are customized to read machine data of different types of moving heating sources and chemical agent addition such as fusing agent (FA) and detailing agent (DA) during the multi-pass print process. Abaqus then solves for the dependent events such as progressive element activation, heating from different lamp systems, evolution of heat transfer surfaces, material temperature profile, stress and distortion using sequentially coupled thermal-mechanical analysis. Once the keyword interface and user subroutines are defined, the cost for modeling different parts and geometries is significantly reduced, making FE simulations effective for process development and functional part production.
2. Multi Jet Fusion (MJF™) technology
MJF™ is a new 3D print technology that HP developed leveraging its strong portfolio of intellectual property (IP) assets in Thermal Inkjet (TIJ) hardware, IP assets in TIJ inks and jettable agents, innovative design of highly robust precision low-cost microelectromechanical (MEMS) devices, and in depth of knowledge of material science. HP MJF™ technology offers higher print speeds and more control over part and material properties as compared to other 3D print processes [6]. Figure 1 presents a schematic of the proprietary architecture used in HP MJF™
technology which takes advantage of HP’s page-wide TIJ arrays. The dual-carriage system shown here separates functions of powder deposition from that of energy and agent application.
2017 Science in the Age of Experience 443

By moving the recoater from top-to-bottom, HP MJF™ technology starts by laying down a thin layer of powder material in the working area. Next, the carriage containing the TIJ array passes from right-to-left pre-heating the powder, and then depositing chemical agents across the full working area. If needed, energy and chemical agent deposition processes are combined in a second continuous pass of the carriage from left-to-right. This process continues, layer-by-layer, until a complete part is formed. At each layer, the carriage changes its direction for optimum productivity. Using HP TIJ arrays with their high nozzle density, HP’s proprietary synchronous architecture is capable of printing over 30 million drops per second across each inch of the working area. [6]
Figure 1: Top view of HP’s proprietary synchronous architecture employed in MJF™. [6]
For highly functional parts to be built using this print process, it’s important to ensure that the powder material has been properly fused and that part edges are smooth and well-defined. HP invented a proprietary multi-agent printing process as shown in detail in Figure 2. The powder
2017 Science in the Age of Experience 444

material is recoated across the work area as shown schematically in Figure 2(a). In Figure 2(b), the FA is selectively applied where the particles are to fuse together, and in Figure 2(c) the DA is selectively applied where the fusing action needs to be mitigated or amplified. In this example, the DA reduces fusing at the boundary to produce a part with sharp and smooth edges. In Figure 2(d), the work area is exposed to energy from the fusing lamp, and Figure 2(e) shows the fused and unfused areas of the edge of a part in the work area. The process is then repeated until a complete part has been formed. [6]
Figure 2: Schematic of MJF™ multi-agent printing process (cross-section view). [6]
Figure 3 shows the typical part temperature for the build process as it was described above. Deposition of a fresh layer of powder results in a temperature to drop at the surface which is then warmed back up due to the movement of the dual-fuse lamp carriage over the build area. Thereafter, the build area surface temperature drops again to reflect the evaporative cooling of functional agents which are deposited during the print carriage motion. Second fusing lamp of the dual-lamp carriage brings the powder that contains the FA to its melt and assists in interlayer bonding and part build. The part cooldown and build bed retraction completes the single layer build cycle.
2017 Science in the Age of Experience 445

Figure 3: A representative surface temperature profile for a typical MJF™ build cycle.
3. Methodology
3.1 Additive manufacturing process modeling framework
A new framework was developed in Abaqus aimed to providing accurate and scalable predictions for AM processes at its part level. The framework is an open user customizable subroutine interface, including a pair of element activation subroutines, a pair of moving flux subroutines, and many built-in utility routines. Many existing AM processes like FDM, SLM and DLM, to name a few can be modelled using this framework. New 3D print process technologies can also be customized within this framework.
The AM framework in Abaqus contains technologies in the following categories to address many simulation challenges: supports FE mesh with varying mesh density as AM parts usually have complex shapes and using a uniform mesh is not practical, supports print process parameter inputs and specifics for different AM processes like print path,print speed, and stack direction; supports intersection of FE mesh with the tool path in a geometric sense and progressive element activation based on intersected elements computed; supports progressive heating computation taking into
2017 Science in the Age of Experience 446

account actual tool path data; supports different types of heating sources including point, line and box heating sources; supports progressive cooling computations taking account the evolving heat transfer surfaces during the print process. More detailed information about the new AM process modeling framework can be found in Das et al. [7].
In here, the AM simulation framework developed in Abaqus is applied to the HP MJF™ 3D print process. Detailed computational methodology for MJF™ process steps such as machine data conversion to Event Series data in Abaqus input format, process parameters and process specifics input data, characterization of stationary (overhead) lamp and transient (fuse) lamp heating events, characterization of chemical agent deposition events, and meshing options will all be discussed in this section.
The machine data is independent data that governs the salient physics happening during the print process. For the MJFTM process, machine data such as recoater moving direction and speed, printer carriage moving direction and speed, lamp type, status and power, chemical agent type, status and evaporative cooling power are all characterized and converted to the Abaqus Event Series format with a simple Python script. Multiple Event Series data are also supported by the process modeling framework in order to simulate multiple heating sources, cooling agents as well as different independent events. For the MJFTM process, we use one Event Series data for each of the independent events including powder recoating, heating by each lamp, and deposition of each chemical agent.
A typical section of the powder recoating Event Series data is given below, where each line represents a point in space and time, and two consecutive points represent a line segment. ON/OFF status of the first consecutive point is used for each segment.
<Time>, <X coordinate>, <Y coordinate>, <Z coordinate>, <ON/OFF status> 0.000000, 200.000000, 0.000000, 0.050000, 1.000000 1.000000, -200.000000, 0.000000, 0.050000, 0.000000 10.00000, 200.000000, 0.000000, 0.150000, 1.000000 11.00000, -200.000000, 0.000000, 0.150000, 0.000000
2017 Science in the Age of Experience 447

The powder recoating event happens at the beginning of each layer. We use the pair of user defined material activation subroutines to handle the progressive material addition by progressively activating material and element properties during the analysis. This does not require any model changes, instead, we start with a full model of the entire space which is recoated with powder including the part that is fused and built. Materials and elements are in a quiet state before the recoating of the layer, but activated according to the recoater movement. This removes the requirement for multi-step analysis for simulating the AM process. The material/element states are stored in the status variable EACTIVE. Inactive materials/elements are automatically removed from display during result visualization, or can be displayed optionally. The powder recoating event is characterized by powder recoating Event Series including the time, center position of the material recoater as well as by powder recoating Table Collection that includes process parameters such as width of the powder recoater and the height of the recoating layer. The pair of user defined material activation subroutine interfaces are developed so that Abaqus automatically calculates the evolving external surface of the active elements as the heat transfer surface for convection and radiation calculation proceeds.
A typical section of the lamp heating or chemical deposition Event Series data is given below, where each line represents a point in space and time, and two consecutive points represent a line segment. Power magnitude of the first consecutive point is used for each segment.
<Time>, <X coordinate>, <Y coordinate>, <Z coordinate>, <Power magnitude> 0.000000, 0.000000, -10.000000, 0.090000, 0.000000 1.000000, 280.000000, -10.000000, 0.090000, 50.000000 2.000000, -280.000000, -10.000000, 0.090000, 0.000000 11.00000, 280.000000, 0.0000000, 0.190000, 50.000000 12.00000, -280.000000, 0.0000000, 0.190000, 0.000000
2017 Science in the Age of Experience 448
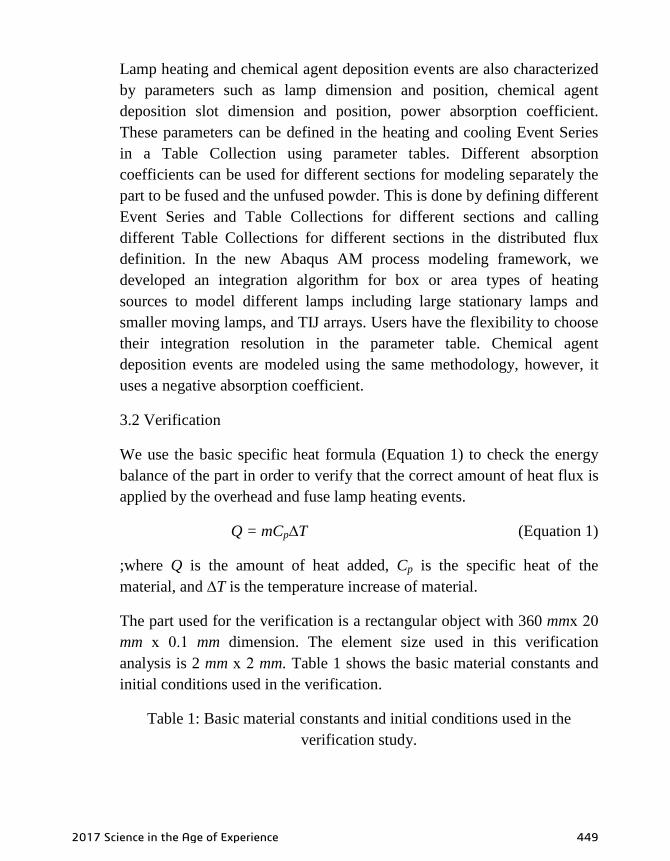
Lamp heating and chemical agent deposition events are also characterized by parameters such as lamp dimension and position, chemical agent deposition slot dimension and position, power absorption coefficient. These parameters can be defined in the heating and cooling Event Series in a Table Collection using parameter tables. Different absorption coefficients can be used for different sections for modeling separately the part to be fused and the unfused powder. This is done by defining different Event Series and Table Collections for different sections and calling different Table Collections for different sections in the distributed flux definition. In the new Abaqus AM process modeling framework, we developed an integration algorithm for box or area types of heating sources to model different lamps including large stationary lamps and smaller moving lamps, and TIJ arrays. Users have the flexibility to choose their integration resolution in the parameter table. Chemical agent deposition events are modeled using the same methodology, however, it uses a negative absorption coefficient.
3.2 Verification
We use the basic specific heat formula (Equation 1) to check the energy balance of the part in order to verify that the correct amount of heat flux is applied by the overhead and fuse lamp heating events.
Q = mCp∆T (Equation 1)
;where Q is the amount of heat added, Cp is the specific heat of the material, and ∆T is the temperature increase of material.
The part used for the verification is a rectangular object with 360 mmх 20 mm х 0.1 mm dimension. The element size used in this verification analysis is 2 mm х 2 mm. Table 1 shows the basic material constants and initial conditions used in the verification.
Table 1: Basic material constants and initial conditions used in the verification study.
2017 Science in the Age of Experience 449
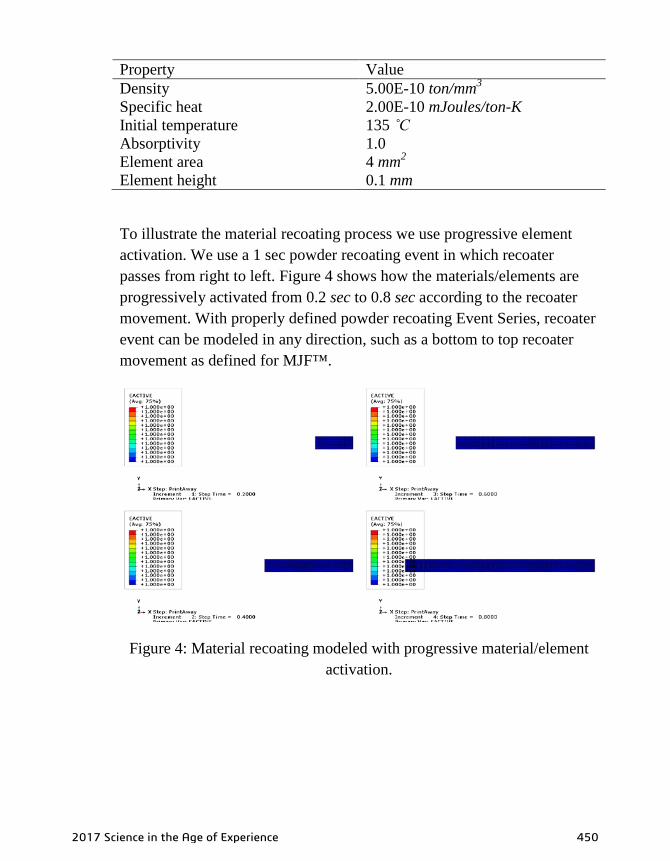
Property Value Density 5.00E-10 ton/mm3 Specific heat 2.00E-10 mJoules/ton-K Initial temperature 135 ˚C Absorptivity 1.0 Element area 4 mm2 Element height 0.1 mm
To illustrate the material recoating process we use progressive element activation. We use a 1 sec powder recoating event in which recoater passes from right to left. Figure 4 shows how the materials/elements are progressively activated from 0.2 sec to 0.8 sec according to the recoater movement. With properly defined powder recoating Event Series, recoater event can be modeled in any direction, such as a bottom to top recoater movement as defined for MJF™.
Figure 4: Material recoating modeled with progressive material/element activation.
2017 Science in the Age of Experience 450

3.2.1 Overhead lamp heating
We use an overhead lamp of 600 mm х 20 mm to heat the part for 1 sec after the powder recoating and let the part thermally conduct for 9 sec. No convection or radiation is applied so that we can compare the final temperature increase with a hand calculation. The power of the overhead lamp is set at 50 mW/mm2. With a simple hand calculation, we can obtain that the heat added is 50 mW/mm2 х 4 mm2 х 1 sec = 200 mJoules and that the temperature increase with the assumed density, element volume and specific heat would be 500˚C. Therefore, theoretically the part should be uniformly heated to 635˚C at the end of the simulation. Figure 5 and 6 show contour plots of the initial and final nodal temperature values from the simulation. The final temperature is at 635˚C everywhere in the part and perfectly correlates to the theoretical solution.
Figure 5: Contour plot of initial nodal temperature for an overhead lamp heating event.
2017 Science in the Age of Experience 451

Figure 6: Contour plot of final nodal temperature for an overhead lamp heating event.
3.2.2 Fuse lamp heating
We use a fuse lamp of 20 mm х 20 mm that passes from right to left in 1 sec to heat the part after the powder recoating event and let the part thermally conduct for 9 sec. Similar to earlier analysis, no convection or radiation is assumed so that we can compare the final temperature increase with a hand calculation. The power of the fusing lamp is set at 50 mW/mm2 and the moving speed of the fusing lamp is set at 560 mm/sec. With a simple hand calculation we can obtain the heating time for a single element of 2 mm х 2 mm is fuse lamp dimension 20 mm divided by lamp speed 560 mm/sec = 0.035 sec.
The heat added is 50 mW/mm2 х 4 mm2 х 0.035 sec = 7.142 mJoules. The temperature increase with the assumed density, element volume and specific heat would be 17.9˚C. Therefore, theoretically the part should be uniformly at 152.9˚C at the end of the simulation. Figure 7 shows contour plots of the final nodal temperature from the simulation. The final temperature is 152.9˚C everywhere in the part and therefore, perfectly correlates to the theoretical solution.
2017 Science in the Age of Experience 452

Figure 7: Contour plot of final nodal temperature for a fuse lamp heating event.
3.2.3 Offsets of lamps and chemical agents
It was described earlier that multiple lamps and multiple chemical agent deposition slots exist in the MJF™ process. Therefore, it is more convenient to only characterize and define the independent carriage movement and reuse the same Event Series time and spatial location data for different lamps and chemical agents. The transform feature is developed in the Abaqus AM process modeling framework to include easy transformation of multiple Event Series data. At the top of the Event Series data, two data lines can be optionally defined for time and special coordinate system transformation. Figure 8 shows an 8 mm х 8 mm fuse lamp with a 4 mm offset in Y-direction heating from right to left in 1 sec and thermally conducts for 9 sec. for a 600 mm х 20 mm model.
2017 Science in the Age of Experience 453

Figure 8: Contour plot of final nodal temperature for a fuse lamp of 8 mm х 8 mm with 4 mm offset in Y-direction.
3.2.4 Subsequent static stress analysis
Sequentially coupled thermal mechanical analysis is used in Abaqus to simulate the coupling between temperature and stress/displacement. We specify temperature as a pre-defined field. Nodal temperature results from the heat transfer analysis is read from the result file (in .ODB format) and become the driving input for the stress/distortion computation. Material data such as temperature dependent mechanical constants and coefficient of thermal expansion are needed for stress analysis.
4. Finite element simulation
4.1 Multi-pass multi-fuse process of a simple rectangular part
In this section, a more realistic multi-pass multi-fuse process of a simple rectangular part is simulated. Table 2 shows some representative phases/events for a single build layer. Powder recoating is a separate distinct Event Series. Other heating and agent deposition events are all characterized by the carriage movement with different power levels,
2017 Science in the Age of Experience 454
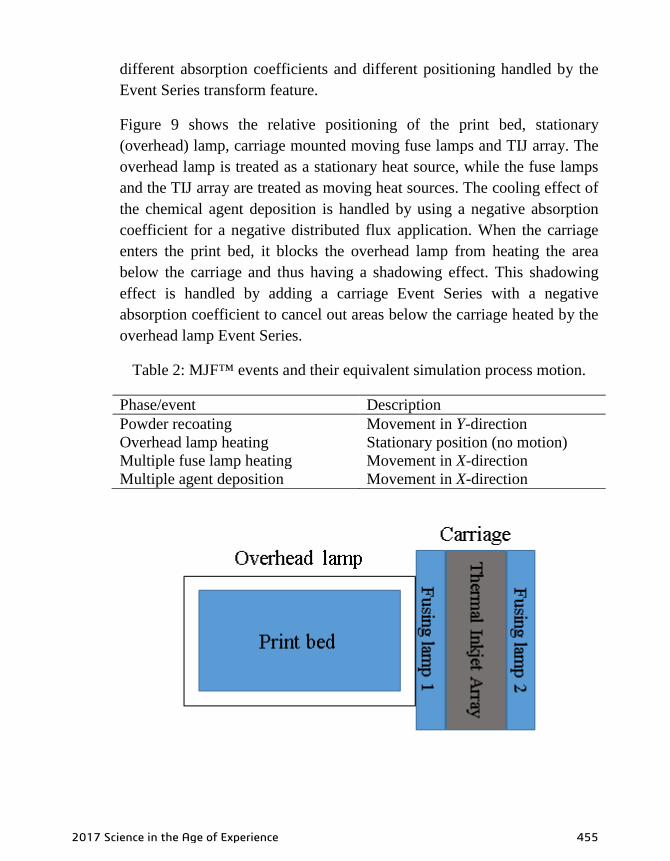
different absorption coefficients and different positioning handled by the Event Series transform feature.
Figure 9 shows the relative positioning of the print bed, stationary (overhead) lamp, carriage mounted moving fuse lamps and TIJ array. The overhead lamp is treated as a stationary heat source, while the fuse lamps and the TIJ array are treated as moving heat sources. The cooling effect of the chemical agent deposition is handled by using a negative absorption coefficient for a negative distributed flux application. When the carriage enters the print bed, it blocks the overhead lamp from heating the area below the carriage and thus having a shadowing effect. This shadowing effect is handled by adding a carriage Event Series with a negative absorption coefficient to cancel out areas below the carriage heated by the overhead lamp Event Series.
Table 2: MJF™ events and their equivalent simulation process motion.
Phase/event Description Powder recoating Movement in Y-direction Overhead lamp heating Stationary position (no motion) Multiple fuse lamp heating Movement in X-direction Multiple agent deposition Movement in X-direction
2017 Science in the Age of Experience 455

Figure 9: Relative positions of stationary (overhead) lamps and carriage mounted transient (fuse) lamps and thermal inkjet array.
Figure 10: The geometry and mesh of a simple rectangular part to be built by a representative multi-pass multi-fuse process.
4.1.1 Single-layer analysis
A single-layer analysis is performed first to make sure each of the independent events are captured correctly. A total of 11 Event Series were defined including 1 used for the powder recoating, 2 used for the overhead lamp, 4 used for the fusing lamps, 2 used for the carriage shadowing, and 2 used for the cooling agent deposition. The number of Event Series used for lamps/carriage shadowing is twice the number of the lamps/carriage. This is due to different absorption coefficients being applied to fuse powder regions. Cooling agent is only deposited to the fuse region. However, different chemical agents (FA and DA) are applied in two carriage passes forcing two Event Series to be used. Figure 11 shows the thermal contour results at different stages of the simulation.
2017 Science in the Age of Experience 456

(a) 0.2 sec
(b) 2.6 sec
2017 Science in the Age of Experience 457

(c) 3.4 sec
(d) 3.7 sec
2017 Science in the Age of Experience 458

(e) 3.9 sec
(f) 4.6 sec
Figure 11: Simulation results from a single-layer heat transfer analysis.
Top of each figure shows the applied distributed flux value for each element. Center of each figure shows the nodal temperature contour plot. Bottom of each figure shows the position of the fuse lamps (in orange and blue), inkjet array (in purple), overhead lamp (in green) as well as the part itself (smallest box in the center). The applied distributed flux and the
2017 Science in the Age of Experience 459

nodal temperature results match well with the instantaneous position of the lamps and inkjet array.
Figure 12 shows the history plot of nodal temperature at the center of the fused part (red curve) and the lower center of the powder (blue curve). It is shown in the history plot that material/elements are recoated at a lower temperature but heated due to conduction from the bottom nodes with slightly higher fixed temperature boundary condition. Overhead lamp heats both the fused part and the unfused powder. The leading fuse lamp in the dual lamp system pre-heats the powder deposited. Thereafter, the temperature of the agent deposited material cools down due to evaporative cooling of agents, but is reheated with the trailing fuse lamp to rise above it melt temperature. This completes the proper bonding of subjacent layers. This process then repeats until the build is completed. These simulation results correlate well with the print process and the nodal temperature values correspond well with the experimental measurements.
Figure 12: History plot of nodal temperature at the center of the fused part (red curve) and the lower center of the unfused powder (blue curve) from
a single-layer analysis.
2017 Science in the Age of Experience 460

4.1.2 Multi-layer analysis for the full part
The same simulation setup is applied to model multi-layer full part building process. Figure 13 shows the nodal temperature result at the end of the print. Temperature gradients can be seen from top layer to bottom layer due to cooling down effect after a layer is built.
Figure 13: Nodal temperature results from a multi-layer full part analysis.
(a) Center node of fused part.
2017 Science in the Age of Experience 461

(b) Lower center node of unfused powder.
Figure 14: Comparison of first layer nodal temperature history between a single-layer and a multi-layer analysis.
Due to the flexibility of the simulation framework, the only change to be made from simulating a single layer print to a full part print is the time increment size. We used a fixed time increment size of 0.5 sec that corresponds to 10 increments per pass (20 increments per layer) for the full part analysis. This enables the capture of temperature change due to different lamps/agents during a single pass. Figure 14 shows the temperature history of the center node of the section to fuse (a) and the lower center of the section to remain powder (b). The blue curve from the full part analysis is compared to the red curve from the single layer analysis. The temperature change (in blue) reflects the timing of different events such as conduction and different lamps/agents. Temperature peaks are not captured here due to the large fixed time increment size used. However, Abaqus allows user specified TIME POINTS with which smaller time increment size can be used for fusing lamp/agent deposition events and larger size can be used for the rest time in the layer, and data
2017 Science in the Age of Experience 462

will be written to output database at varying time intervals. Figure 15 shows (in green) the temperature history of the center node of the section to fuse using user specified time increment sizes (44 increments per layer) and the temperature peaks are captured more accurately.
Figure 15: Comparison of fixed and user specified time increment size of a single-layer analysis.
With full part analysis, we can obtain a complete temperature history at any location of the model. For example, Figure 16 shows the temperature history of the first layer middle of section to fuse (in red) and first layer lower middle of section to remain powder (in blue). We can see subsequent fluctuations in temperature due to the conduction effect from new layers above it being heated. Again, the temperature peaks could be captured better with user specified time increment sizes.
2017 Science in the Age of Experience 463
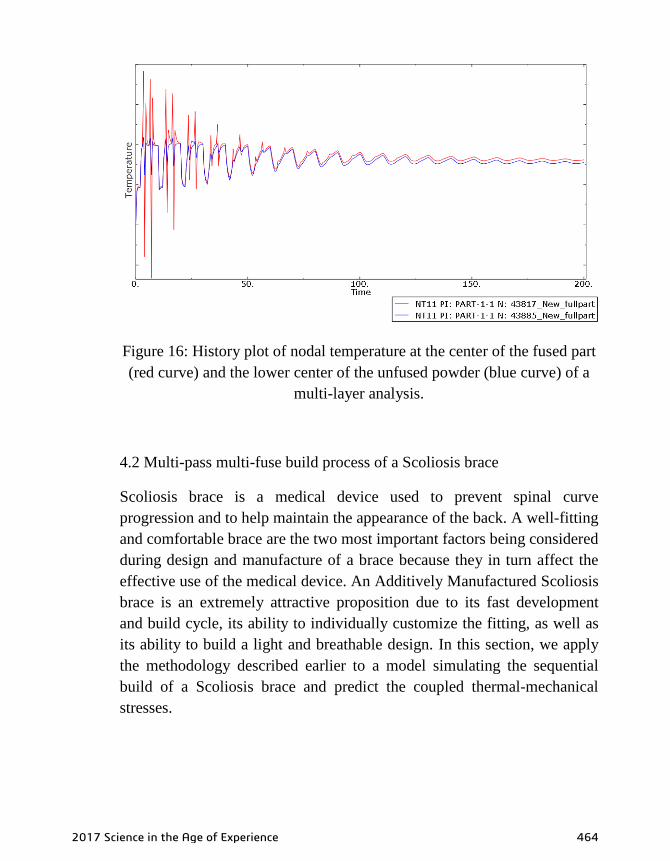
Figure 16: History plot of nodal temperature at the center of the fused part (red curve) and the lower center of the unfused powder (blue curve) of a
multi-layer analysis.
4.2 Multi-pass multi-fuse build process of a Scoliosis brace
Scoliosis brace is a medical device used to prevent spinal curve progression and to help maintain the appearance of the back. A well-fitting and comfortable brace are the two most important factors being considered during design and manufacture of a brace because they in turn affect the effective use of the medical device. An Additively Manufactured Scoliosis brace is an extremely attractive proposition due to its fast development and build cycle, its ability to individually customize the fitting, as well as its ability to build a light and breathable design. In this section, we apply the methodology described earlier to a model simulating the sequential build of a Scoliosis brace and predict the coupled thermal-mechanical stresses.
2017 Science in the Age of Experience 464

Figure 17 shows the as-designed geometry of the brace model, the voxel mesh and the intersection of the two. Since we model the part to fuse (brace) as well as the part to remain as powder (void), we can easily generate a block of voxel mesh and divide it into two sections by the volume fraction tool intersection of the Scoliosis brace and the voxel mesh.
Figure 17: Scoliosis brace model.
Figure 18 shows the nodal temperature result at the end of the print using a coarse voxel mesh model. Left hand side shows the brace part and right hand side shows the entire voxel mesh including all the remaining powder. For more accuracy, a finer voxel mesh model is also simulated (Figure 19). A sequentially coupled thermal-mechanical analysis is performed with subsequent static stress analysis driven by the temperature history from the heat transfer analysis. Figure 20 shows the final distortion and residual stress prediction from the static analysis.
2017 Science in the Age of Experience 465

Figure 18: Nodal temperature result at the end of the print using a coarse voxel mesh model.
Figure 19: Nodal temperature result at the end of the print using a fine voxel mesh model.
2017 Science in the Age of Experience 466

Figure 20: Displacement and residual stress result at the end of the print using a fine voxel mesh model.
5. Conclusion
This paper details the new Abaqus AM process modeling framework and its efficient and effective application to the HP MJF™ 3D printing process to predict the thermal behavior of its build parts. Verification of the methodology is shown by an energy balance check on a single stationary (overhead) lamp heating event and a moving single fuse lamp heating event. Subsequent static stress analysis is also presented where the thermal and mechanical problems are coupled to predict part distortions and residual stresses at the end of the print.
A more realistic and representative multi-pass multi-fuse process is illustrated with a simple rectangular part. A single-layer simulation is performed first to capture the temperature peaks and valleys. The temperature history of both the part and the powder obtained from the simulation match well with expected temperature changes caused by the independent print events. Full part multi-layer simulation for the simple rectangular part is also performed and is shown to capture the temperature gradients and conduction happening between consecutive build layers. With the new Abaqus AM process modeling framework, full part heat
2017 Science in the Age of Experience 467

transfer analysis is capable of capturing complex machine parameters and evolving boundaries in the printing process, and is proved to be efficient and effective.
Lastly, a detailed investigation is performed for a Scoliosis Brace with highly complex build geometry using sequentially coupled thermal mechanical analysis. It is shown that with the new Abaqus AM process modeling framework, complex geometry can also be handled with satisfactory numerical predictions at an acceptable computational efficiency.
5. Future work
Future work will include quantitative validation of the temperature history along with the amount of distortion of the printed parts so that this computational methodology can be efficiently used to provide accurate predictions of AM part builds and AM process designs.
6. Acknowledgement
The HP Inc. authors would like to acknowledge the support of the management team and the senior technologists of the 3D Materials & Advanced Applications Lab and the Engineering Modeling and Analysis Group for having shared their time and knowledge of the MJF™ 3D Print technology.
7. References
[1] Finnie, S., Cheng, W., Finnie, I., Drezet, J. M., and Gremaud, M.; The computation and measurement of residual stresses in laser deposited layers. Journal of Engineering Materials and Technology (2003), 125, 302–308.
[2] Beuth, J. L. and Narayan, S. H.; Residual stress-driven delamination in deposited multi-layers. International Journal of Solids and Structures (1996), 33(1), 65–78.
2017 Science in the Age of Experience 468

[3] Zhang, Y. and Chou, Y. K.; Three-dimensional finite element analysis simulations of the fused deposition modelling process. Proceedings of the Institution of Mechanical Engineers, Part B: Journal of Engineering Manufacture (2006), 220(10), 1663-1671.
[4] Kim, H., Zhao, Y., and Zhao, L; Process-Level Modeling and Simulation for HP’s Multi Jet Fusion™ 3D Printing Technology, Proceedings of the 1st International Workshop on Cyber-Physical Production Systems, Vienna, Austria, April 12, (2016).
[5] Abaqus Analysis User’s Guide, Abaqus, Dassault Systèmes Simulia Corp., (2017).
[6] Technical white paper, HP Multi Jet FusionTM technology: A disruptive 3D printing technology for a new era of manufacturing (2017).
[7] Das, K., Lapczyk, E., Bajer, A., Dan, N., Kulathu, S., Grimes, B., Engelmann, B., Wohlever, C., Oancea, V. and Hurtado, J.; Finite Element Process Simulation Technology for Additive Manufacturing, Proceedings of the NAFEMS World Congress 2017, Stockholm, Sweden, June 11-14, (2017).
2017 Science in the Age of Experience 469