finite element modeling of selective heat- …jpier.org/pierb/pierb56/01.13082502.pdf* corresponding...
TRANSCRIPT
Progress In Electromagnetics Research B, Vol. 56, 1–24, 2013
FINITE ELEMENT MODELING OF SELECTIVE HEAT-ING IN MICROWAVE PYROLYSIS OF LIGNOCELLU-LOSIC BIOMASS
Baishali Dutta1, *, Satyanarayan R. S. Dev2,and Vijaya G. S. Raghavan1
1Department of Bioresource Engineering, McGill University, 21111Lakeshore Road, Ste-Anne-de-Bellevue, QC, H9X 3V9, Canada2College of Applied Sciences, A’Sharqiyah University, P. O. Box 42,Postal Code 400, Ibra, Sultanate of Oman
Abstract—Microwave pyrolysis overcomes the disadvantages ofconventional pyrolysis methods by efficiently improving the qualityof final pyrolysis products. Biochar, one of the end products of thisprocess is considered an efficient vector for sequestering carbon to offsetatmospheric carbon dioxide. The dielectric properties of the dopingagents (i.e., char and graphite) were assessed over the range of 25◦–400◦C and used to develop a finite element model (FEM). This modelserved to couple electromagnetic heating, combustion, and heat andmass transfer phenomena and evaluated the advantages of selectiveheating of woody biomass during microwave pyrolysis. The dielectricproperties of the doping agents were a function of temperature anddecreased up to 100◦C and thereafter remained constant. Regressionanalysis indicated that char would be a better doping substancethan graphite. The simulation study found that doping helped toprovide a more efficient heat transfer within the biomass comparedto non-doped samples. Char doping yielded better heat transfercompared to graphite doping, as it resulted in optimal temperaturesfor maximization of biochar production. The model was then validatedthrough experimental trials in a custom-built microwave pyrolysisunit which confirmed that char doping would be better suited formaximization of biochar.
Received 25 August 2013, Accepted 16 October 2013, Scheduled 22 October 2013* Corresponding author: Baishali Dutta ([email protected]).

2 Dutta, Dev, and Raghavan
1. INTRODUCTION
Combating global climate change and meeting the world’s ever-risingenergy demands are twin concerns which challenge researchers allaround the world. Evidence strongly supports the occurrence ofclimate change, based on a wide range of indicators including increasesin global average air and ocean temperatures, widespread melting ofsnow and ice, and rising global sea levels. Carbon dioxide tends toaccumulate in the atmosphere for a long time and with continuedanthropogenic emissions, CO2 levels will only continue to build-upin the atmosphere. The Intergovernmental Panel on Climate Change(IPCC) Fourth Assessment Report suggests that even with significantreductions in anthropogenic CO2 emissions, atmospheric CO2 levelswould only very gradually decline as natural processes slowly removedCO2 from the atmosphere [1]. Therefore past anthropogenic CO2
emissions will continue to have a destabilizing impact on earth’s climatesystem for a very long time. Climate change has irreversible effects onour economy, infrastructure, and health, the landscapes around us, andthe wildlife that inhabit them.
Although climate change has been attributed to both naturalprocesses and human activities, a recent heightening of publicawareness regarding greenhouse gases’ role in global warming has led toa greater scrutiny of such contributory activities as CO2 emissions fromcarbon-based fossil fuel combustion, rising population and irresponsibleacts of deforestation and land use. In Canada, over 80% of totalnational greenhouse gas emissions are associated with the productionor consumption of fossil fuels for energy purposes [2].
Canada’s total GHG emissions for 2011 were estimated at 702Mtof CO2 equivalents (CO2e), of which nearly 8% was contributed bythe agricultural sector [3]. This sector generates roughly 300 Mt ofagricultural waste [4, 5]. Assuming 50% recovery of carbon from thisbiomass, one could sequester nearly 150 Mt of carbon dioxide from theatmosphere, in the form of biochar, or about 20% of Canada’s GHGemissions.
An increased need for technologies with long-term sustainabilityimplications for the bioenergy sector has been widely acknowledged.Biochar’s use as an energy source [6], as a fertilizer when mixed withsoil [7], and as a means of reducing greenhouse gas emissions throughthe soil-sequestration of carbon [8], have led to its gaining significantattention in recent years. Moreover, biochar can increase food securityby reducing the amount of food crops used for biofuel production [9].
One of the most important thermochemical biomass-conversiontechnologies, pyrolysis is a process of thermal decomposition of biomass

Progress In Electromagnetics Research B, Vol. 56, 2013 3
under conditions ranging from low oxygen (< 1% O2 v/v) to anoxia.It converts organics to solid (charcoal), liquid (organics) and gaseous(CO, CO2, CH4, H2) products. Their range and relative amountsdepend on process variables such as the nature of the feedstock and theheating rate [10, 11]. Biochar production through pyrolysis has becomean extremely efficient and popular technology in recent years [12].
Conventional pyrolysis techniques have a few inherent disadvan-tages such as poor heating characteristics in the core of the biomass aswell as being time consuming. One of the methods proven to have mea-sured up to good efficiency and potentially negate the disadvantagesof conventional methods is the use of microwave or microwave-assistedpyrolysis methods to generate biochar. The application of microwavesto produce biochar has been proven to enhanced biochar yield andquality, and, to a large extent, negate undesirable secondary reactionsamong volatile compounds. In addition it is a rapid and energy-efficienttechnology compared to conventional methods [11]. One of the driv-ing principles of microwave heating is based on ‘molecular friction’ (ordielectric loss) [13]. The principles of dielectric heating as opposed tothat of conventional heating can be best summarized through Figure 6below. Dielectric heating of a material causes thermal effects whichmay cause a different temperature regime within the material [14].The biomass is heated by conduction from the surface to its core inthe conventional method and by convective heat transfer from high-temperature gas. The temperature at the surface of the biomass isknown to be higher than that at the core because of the poor ther-mal conductivity of lignocellulosic biomass. Hence as the dielectricproperties govern the ability of materials to heat in microwave fields,the measurement of these properties as a function of other relevantparameters such as frequency, temperature, moisture content, etc. isimportant [15].
There is a growing interest in modeling and simulation studiesregarding the production of biochar as well other pyrolysis by-products.Numerical and modeling studies have been conducted which focuson estimation of optimum parameters in pyrolysis of biomass [16].Different approaches used in the transport models have also beenpresented at both the single particle and reactor levels, together withthe main achievements of numerical simulations [17].
There is poor understanding of the mechanisms involved inapplication of electromagnetic energy for the pyrolysis of biomassand the actual energy distribution inside the biomass when subjectedto electromagnetic fields [18]. The electromagnetic field distributioninside a microwave oven can be traced out by solving Maxwell’sequations. Finite Element Method (FEM) is commonly used for
4 Dutta, Dev, and Raghavan
solving Maxwell’s equations to obtain the energy distribution in acomplex object or within a multimode cavity. It is capable ofsimulating power density distribution in 3-D space [19].
FEM technique competes very favorably with the other numericalmethods, as it is based on reducing the Maxwell’s equations to a systemof simultaneous algebraic linear equations [20]. FEM can readily modelheterogeneous and anisotropic materials as well as arbitrarily-shapedgeometries. It can also provide both time and frequency domainanalyses which are important to microwave heating problems like fielddistribution, scattering parameters and dissipated power distributionfor various materials and geometries [21].
The addition of microwave receptors has been found to improveheat distribution in biological materials during microwave processing.Sanga et al. (2000) investigated microwave and hot air dryingcharacteristics of special cases of biological material (carrots) andcompared their drying rates, surface color, re-hydration capacity andshrinkage. The samples were inserted with teflon at core center ofcarrots were dried by microwave and hot air drying. It was foundthat microwave drying of the special case biological material (carrotembedded with teflon) had higher drying rates and less shrinkage. Re-hydration capacity of biological material dried as a special case wasalso found to higher than those dried as standalone under the samedrying conditions [22].
Many researchers have concluded that the optimum pyrolysisconditions for by product maximization cannot be attained withoutadding a microwave-susceptible doping agent which has been found tohave significant impact on the pyrolysis conditions and the productsformed [23, 24]. The goals of using a doping agent are to absorbmaximum microwave radiation in the initial phase and then to helpsustain the pyrolysis process and final temperatures [25]. The dielectricproperties of a microwave-susceptible doping agent are an importantfactor in its selection for microwave assisted pyrolysis as it determinesthe extent to which the doping agent will influence the heatingmechanism.
1.1. Previous Simulation Results
Dutta et al. [18] showed lignocellulosic biomass (wood) that the highestyield of biochar was found to be at 425◦C at a power density of 7.5 W/gand was found to be optimum for pyrolysis of lignocellulosic biomassfor maximization of biochar. An evidence of non uniform heatingresulting in the creation of hot spots in the biomass was observedthrough the experimental validation of the simulation of the microwavepyrolysis. Although the biochar yield was found to in agreement with
Progress In Electromagnetics Research B, Vol. 56, 2013 5
the simulation results, the pyrolysis process was hard to control dueto the non uniformity of heating and the generation of sparks in thecavity [18].
Taking these facts into account, the dielectric properties of charand graphite were determined in order to select the doping agentbest suited to maximize biochar yield of biochar through microwavepyrolysis. A Finite Element Model (FEM) of the microwave pyrolysisof lignocellulosic biomass was developed. Simulation studies wereconducted for biomass doped with char and graphite and subjectedto microwave pyrolysis at a frequency of 2.45GHz and slow heatingconditions as illustrated in Dutta et al. (2010) in order to visualize andinvestigate energy distribution within the biomass [18]. The simulationresults of the microwave heating mechanism and profile obtained forthe doped biomass was compared to that of the dope-free sample.
2. MATERIALS AND METHODS
2.1. Nomenclature
Symbol Propertyk Kinetic reaction constant (s−1)
Ax Arrhenius constant (s−1)Ea Activation energy of reaction (kJ mol−1)Pav Time average power dissipated (W)ρ Density of the material (kg m−3)
Cp Specific heat capacity of the material (kJ kg−1 ◦K−1)K Thermal conductivity (W m−2 ◦K−1)Q Power Source Term (W m−3)V Volume (m3)E Total Electric field intensity (V m−1)Ex Electric field intensity x component (V m−1)Ey Electric field intensity y component (V m−1)Ez Electric field intensity z component (V m−1)H Total Magnetic Field Intensity (A m−1)Hx Magnetic field intensity x component (A m−1)Hy Magnetic field intensity y component (A m−1)Hz Magnetic field intensity x component (A m−1)
6 Dutta, Dev, and Raghavan
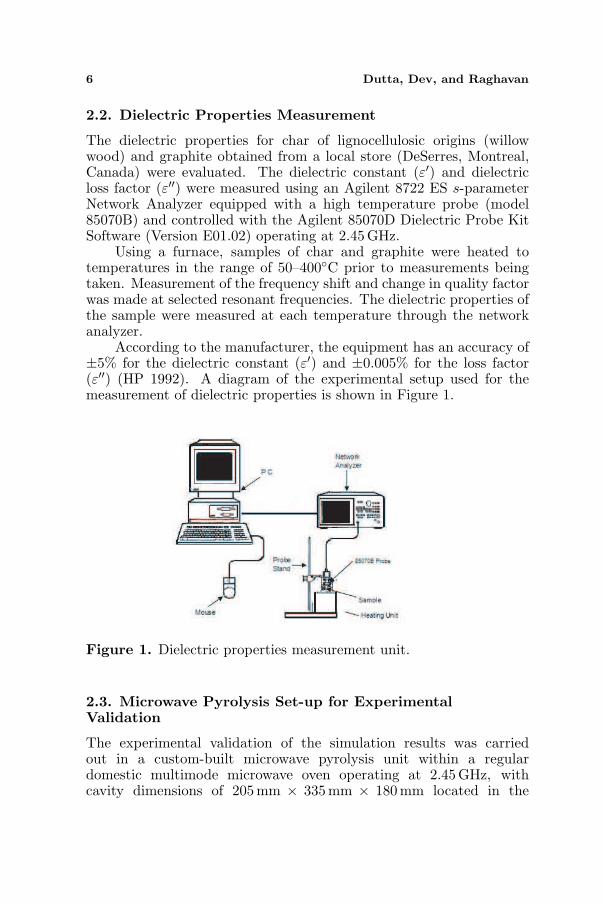
2.2. Dielectric Properties Measurement
The dielectric properties for char of lignocellulosic origins (willowwood) and graphite obtained from a local store (DeSerres, Montreal,Canada) were evaluated. The dielectric constant (ε′) and dielectricloss factor (ε′′) were measured using an Agilent 8722 ES s-parameterNetwork Analyzer equipped with a high temperature probe (model85070B) and controlled with the Agilent 85070D Dielectric Probe KitSoftware (Version E01.02) operating at 2.45GHz.
Using a furnace, samples of char and graphite were heated totemperatures in the range of 50–400◦C prior to measurements beingtaken. Measurement of the frequency shift and change in quality factorwas made at selected resonant frequencies. The dielectric properties ofthe sample were measured at each temperature through the networkanalyzer.
According to the manufacturer, the equipment has an accuracy of±5% for the dielectric constant (ε′) and ±0.005% for the loss factor(ε′′) (HP 1992). A diagram of the experimental setup used for themeasurement of dielectric properties is shown in Figure 1.
Figure 1. Dielectric properties measurement unit.
2.3. Microwave Pyrolysis Set-up for ExperimentalValidation
The experimental validation of the simulation results was carriedout in a custom-built microwave pyrolysis unit within a regulardomestic multimode microwave oven operating at 2.45 GHz, withcavity dimensions of 205mm × 335mm × 180 mm located in the

Progress In Electromagnetics Research B, Vol. 56, 2013 7
laboratories of the Department of Bioresource Engineering, McGillUniversity.
The quartz pyrolysis bioreactor system used for the simulation(Figure 2) consisted of three parts: an upper cylinder (40mm innerdiameter, 90 mm height), a lower cylinder (50 mm inner diameter,42mm height) and a sample stand (35 mm diameter, 25mm height).Through two quartz tubes, one inlet, one outlet (each 6.3 mm diameter,25.4mm length) air inside the reactor was purged with nitrogen at aflow rate of 0.003 L s−1 to create an oxygen-free inert atmosphere.
Figure 2. Microwave pyrolysis bioreactor setup.
The reactor was placed in the middle of the microwave chamberand the two quartz tubes connected to the nitrogen gas supply andgaseous product release. A K-type thermocouple was inserted intothe reactor through the gaseous product release tube to monitor thebiomass temperature continuously throughout the experiment. Thegaseous product release pipe was connected to a condensation unitcontinuously rotated in cooling water at 6 10◦C. In order to validatethe simulation model, an experimental design with temperature as thesingle factor and triplicate samples was chosen. Three temperaturesfor each of the experimental set up were selected as Table 1.
Each pyrolysis run ended 15min after the start of irradiation.After each run, the reactor was cooled to ambient temperature undera nitrogen atmosphere. The biochar remaining in the reactor wasweighed to compare yields.
8 Dutta, Dev, and Raghavan
Table 1. Experimental conditions for experimental validation.
Experimental set up Temperature
Doping type (Non doped,
Graphite, Char)
250
290
330
2.4. Sample Preparation
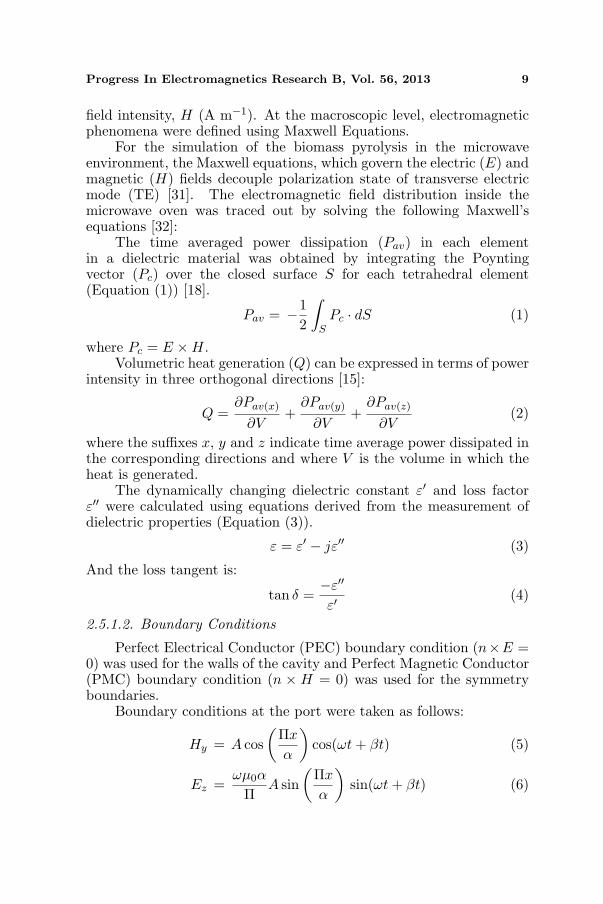
The biomass taken into consideration for simulation was maple wood(30mm diameter, 75 mm length) with a moisture content of ' 7%.This was mounted on the sample stand. It was theoretically assumedthat the biomass sample was doped with char or graphite of 30 mmdiameter and 75 mm length having the dielectric properties determinedin separate simulations in a prior experiment. The wood sample wasthen subjected to microwave heating at a 2.45 GHz frequency andpower density of 7.5 W g−1 for simulation purposes. The thermalproperties of the maple wood, char and graphite used for the simulationhave been provided in Table 2.
Table 2. Thermal properties of sample materials used for simulationpurpose.
Properties Wood Char GraphiteThermal conductivity
(W/mK) 0.8 [26] 150 [27]
Density (kg/m3) 640 [26] 280 [27] 1950 [27]Specific heat capacity
(constant pressure) (KJ/kg K) 1.63 [26] 1 [28] 0.71 [28]
Relative permittivity (εr) 1 [29] 1 [29] 10 – jRelative permeability (µr) 1 [30]
2.5. Development of the Mathematics and GoverningEquations for Microwave Assisted Pyrolysis
2.5.1. Formulation of the Equations for the Electromagnetic Field [11]
2.5.1.1. Electromagnetics
The Maxwell’s equations that govern the electromagneticphenomena evolving in a given configuration resolved in 3D spacewere solved for the electric field intensity, E (V m−1), and magnetic
Progress In Electromagnetics Research B, Vol. 56, 2013 9
field intensity, H (A m−1). At the macroscopic level, electromagneticphenomena were defined using Maxwell Equations.
For the simulation of the biomass pyrolysis in the microwaveenvironment, the Maxwell equations, which govern the electric (E) andmagnetic (H) fields decouple polarization state of transverse electricmode (TE) [31]. The electromagnetic field distribution inside themicrowave oven was traced out by solving the following Maxwell’sequations [32]:
The time averaged power dissipation (Pav) in each elementin a dielectric material was obtained by integrating the Poyntingvector (Pc) over the closed surface S for each tetrahedral element(Equation (1)) [18].
Pav = −12
∫
SPc · dS (1)
where Pc = E ×H.Volumetric heat generation (Q) can be expressed in terms of power
intensity in three orthogonal directions [15]:
Q =∂Pav(x)
∂V+
∂Pav(y)
∂V+
∂Pav(z)
∂V(2)
where the suffixes x, y and z indicate time average power dissipated inthe corresponding directions and where V is the volume in which theheat is generated.
The dynamically changing dielectric constant ε′ and loss factorε′′ were calculated using equations derived from the measurement ofdielectric properties (Equation (3)).
ε = ε′ − jε′′ (3)
And the loss tangent is:
tan δ =−ε′′
ε′(4)
2.5.1.2. Boundary Conditions
Perfect Electrical Conductor (PEC) boundary condition (n×E =0) was used for the walls of the cavity and Perfect Magnetic Conductor(PMC) boundary condition (n × H = 0) was used for the symmetryboundaries.
Boundary conditions at the port were taken as follows:
Hy = A cos(
Πx
α
)cos(ωt + βt) (5)
Ez =ωµ0α
ΠA sin
(Πx
α
)sin(ωt + βt) (6)

10 Dutta, Dev, and Raghavan
Hx =βα
ΠA sin
(Πx
α
)sin(ωt + βt) (7)
where the x, y and z coordinates indicate the corresponding axes, andA is the cross sectional area of the waveguide, ω is the phase angle andα and β are arbitrary constants.
Thermal boundary conditions: The surface of the cylindricalwood sample was used as the thermal boundary conditions for thesimulation. Surface to ambient boundary conditions were appliedfor the circumference of the sample in order to simulate the heatingmechanism inside the quartz reactor.
Heat transfer [11]
The thermal energy equation is given as [32]:
ρCp∂T
∂t= ∇ · (K∇T ) + Q (8)
∇×µ−1r (∇×E)=k2
0
(εr − jσ
ωε0
)E (9)
where, ρ is the density (kg m−3), Cp is the specific heat (kJ kg−1 ◦K−1),K is the thermal conductivity of the material (W m−2 ◦K−1), and T isthe absolute temperature (◦K).
Different mesh element sizes were used for different sub-domainsbased on the dielectric properties of the sub-domain and the precisionrequired in the sub-domain of interest.
Taking all the above into consideration, a Finite Element Model(FEM) of the microwave pyrolysis of lignocellulosic biomass is an
Figure 3. Finite element mesh structure of the microwave pyrolysisunit for simulation.
Progress In Electromagnetics Research B, Vol. 56, 2013 11
optimum numerical approximation technique for MWP [17]. Theresulting sets of partial differential equations were then simultaneouslysolved using the COMSOL Multiphisics software package (ver. 4.1a,COMSOL Inc., USA) [33].
With this software a 3D Finite Element Model was developedto simulate the microwave pyrolysis process for a regular domesticmultimode microwave oven configuration. The meshed structure ofthe microwave cavity along with the bioreactor and wood sample areshown in Figure 3. A custom-built computer with two AMD Opteronquadcore 2.4 GHz processors and 32 GB primary memory was used torun the simulations.
3. RESULTS AND DISCUSSION
3.1. Dielectric Properties
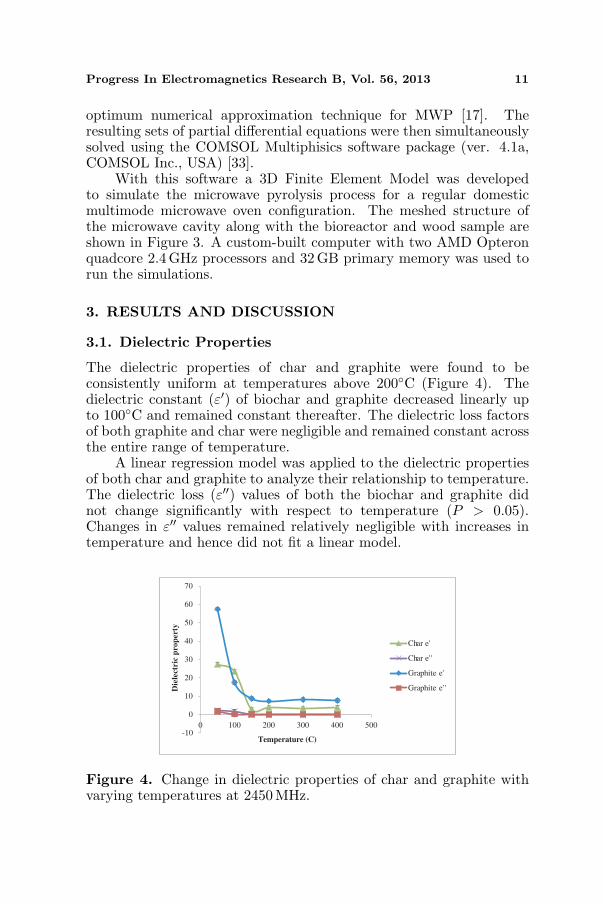
The dielectric properties of char and graphite were found to beconsistently uniform at temperatures above 200◦C (Figure 4). Thedielectric constant (ε′) of biochar and graphite decreased linearly upto 100◦C and remained constant thereafter. The dielectric loss factorsof both graphite and char were negligible and remained constant acrossthe entire range of temperature.
A linear regression model was applied to the dielectric propertiesof both char and graphite to analyze their relationship to temperature.The dielectric loss (ε′′) values of both the biochar and graphite didnot change significantly with respect to temperature (P > 0.05).Changes in ε′′ values remained relatively negligible with increases intemperature and hence did not fit a linear model.
-10
0
10
20
30
40
50
60
70
0 100 200 300 400 500
Die
lectr
ic p
ro
perty
Temperature (C)
Char e'
Char e' '
Graphite e'
Graphite e' '
Figure 4. Change in dielectric properties of char and graphite withvarying temperatures at 2450 MHz.
12 Dutta, Dev, and Raghavan
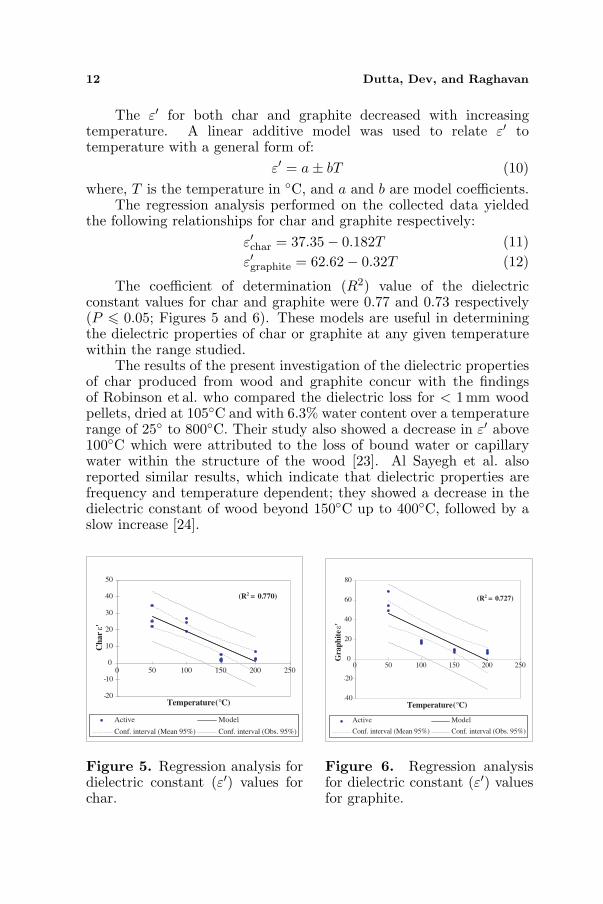
The ε′ for both char and graphite decreased with increasingtemperature. A linear additive model was used to relate ε′ totemperature with a general form of:
ε′ = a± bT (10)where, T is the temperature in ◦C, and a and b are model coefficients.
The regression analysis performed on the collected data yieldedthe following relationships for char and graphite respectively:
ε′char = 37.35− 0.182T (11)ε′graphite = 62.62− 0.32T (12)
The coefficient of determination (R2) value of the dielectricconstant values for char and graphite were 0.77 and 0.73 respectively(P 6 0.05; Figures 5 and 6). These models are useful in determiningthe dielectric properties of char or graphite at any given temperaturewithin the range studied.
The results of the present investigation of the dielectric propertiesof char produced from wood and graphite concur with the findingsof Robinson et al. who compared the dielectric loss for < 1mm woodpellets, dried at 105◦C and with 6.3% water content over a temperaturerange of 25◦ to 800◦C. Their study also showed a decrease in ε′ above100◦C which were attributed to the loss of bound water or capillarywater within the structure of the wood [23]. Al Sayegh et al. alsoreported similar results, which indicate that dielectric properties arefrequency and temperature dependent; they showed a decrease in thedielectric constant of wood beyond 150◦C up to 400◦C, followed by aslow increase [24].
-20
-10
0
10
20
30
40
50
0 50 100 150 200 250
Ch
ar ε
'
Temperature(°C)
(R = 0.770)
Active Model
Conf. interval (Mean 95%) Conf. interval (Obs. 95%)
2
Figure 5. Regression analysis fordielectric constant (ε′) values forchar.
-40
-20
0
20
40
60
80
0 50 100 150 200 250
(R = 0.727) 2
Gra
ph
ite ε'
Temperature(°C)
Active Model
Conf. interval (Mean 95%) Conf. interval (Obs. 95%)
Figure 6. Regression analysisfor dielectric constant (ε′) valuesfor graphite.

Progress In Electromagnetics Research B, Vol. 56, 2013 13
It has been previously shown that microwave heating is enhancedby the presence of a doping agent such as graphitic carbon, a verygood microwave absorber. When the free water is lost upon heating,a wood sample without any doping becomes essentially microwavetransparent [23, 34, 35]. The findings of the present study furthersupport this theory. The dielectric properties result indicates thatchar would be a better doping substance than graphite. In order toinvestigate this further, numerical modeling and a simulation study ofthe microwave pyrolysis process were carried out by using the char andgraphite dielectric properties models.
3.2. Numerical Modeling and Simulation
3.2.1. Meshing
In order to model the effects of doping material on microwave-assistedpyrolysis within the woody biomass, a symmetrical geometry of theentire system as shown in Figure 7 was assumed. The mesh structuresof the non-doped and doped systems are presented in Figures 8 and9. Different mesh element sizes were used for different sub-domainsbased on the dielectric properties of the sub-domain and the precisionrequired in the sub-domain of interest.
Previous simulation work carried out by the authors has shownthat a pyrolysis temperature of 425◦C is ideal in obtaining the optimumyield of biochar under microwave-assisted conditions for the givenrange of temperature [18]. The present objective was to investigateif doping of the wood sample would assist in it reaching desiredtemperatures in a more efficient manner than non-doped samples. Thegoverning physics for electromagnetic radiation and heat transfer were
Figure 7. Half sectional view of the reactor configuration with adoped region.

14 Dutta, Dev, and Raghavan
Figure 8. Finite element meshstructure for non-doped biomass(Half sectional view).
Figure 9. Finite element meshstructure for doped biomass (Halfsectional view).
applied for a time range of 15min (900 s) for each system to determinethe temperature distribution within the wood samples.
As seen in Figure 10, the highest temperatures attained for thenon-doped wood sample remained below 300◦C over the 15min andshowed a heat distribution of ∆T ◦ ≤ 1◦C within the system. Avertical increase in temperature was observed within the sample withthe highest temperature of 296◦C occurring at the upper end of thewood and the lowest (295◦C) at the bottom.
Figure 10. Temperature profile of non-doped biomass for microwavepyrolysis.
The ability of a material to absorb microwave energy is relatedto its dielectric properties and the average power absorbed by agiven volume of material when heated dielectrically is given byEquation (13) [36]:
Pav = ωε0ε′′eff EV (13)
Progress In Electromagnetics Research B, Vol. 56, 2013 15
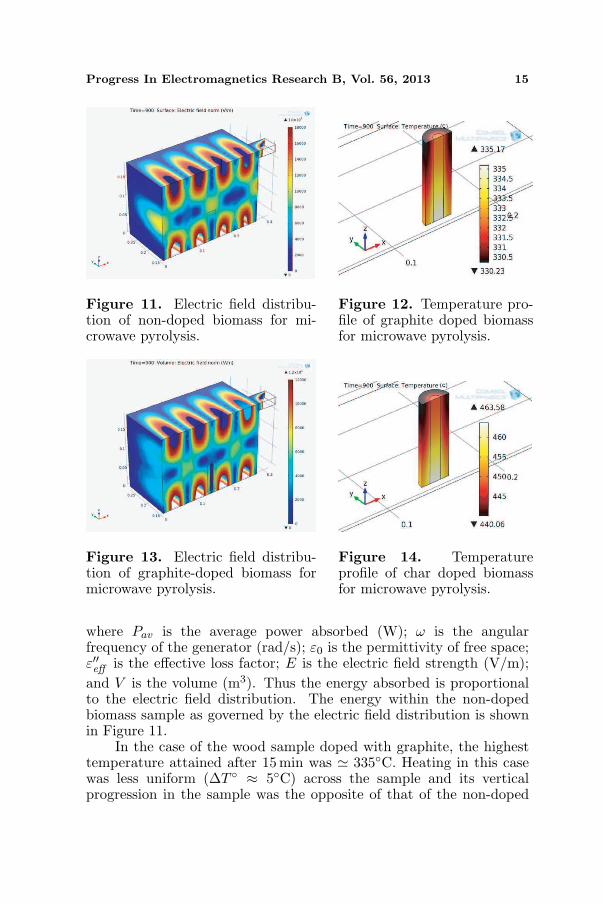
Figure 11. Electric field distribu-tion of non-doped biomass for mi-crowave pyrolysis.
Figure 12. Temperature pro-file of graphite doped biomassfor microwave pyrolysis.
Figure 13. Electric field distribu-tion of graphite-doped biomass formicrowave pyrolysis.
Figure 14. Temperatureprofile of char doped biomassfor microwave pyrolysis.
where Pav is the average power absorbed (W); ω is the angularfrequency of the generator (rad/s); ε0 is the permittivity of free space;ε′′eff is the effective loss factor; E is the electric field strength (V/m);and V is the volume (m3). Thus the energy absorbed is proportionalto the electric field distribution. The energy within the non-dopedbiomass sample as governed by the electric field distribution is shownin Figure 11.
In the case of the wood sample doped with graphite, the highesttemperature attained after 15 min was ' 335◦C. Heating in this casewas less uniform (∆T ◦ ≈ 5◦C) across the sample and its verticalprogression in the sample was the opposite of that of the non-doped

16 Dutta, Dev, and Raghavan
Figure 15. Temperature pro-file of char-doped biomass formicrowave pyrolysis at 13 min.
Figure 16. Electric field distribu-tion of char-doped biomass for mi-crowave pyrolysis.
sample (Figure 12). The electric field distribution for the graphitedoped sample is shown in Figure 13.
With char-doped biomass, the highest temperature reached after15min was 464◦C. The vertical heat distribution pattern was similar tothat of the graphite-doped biomass, but at overall higher temperatures.The heat distribution (∆T ◦ ≈ 20◦C) was less uniform than for thenon-doped and graphite-doped systems (Figure 14). The optimumbiochar production temperature of 425◦C, determined in a previoussimulation study conducted by the same authors [18], was attained bythe char-doped biomass within 13 min (Figure 15). The electric fielddistribution within the system of the char doped sample is shown inFigure 16.
The radiation energy was dissipated within the sample more orless uniformly, giving rise to much greater heating rates, althoughsignificant temperature gradients may be established between the hotinternal regions and the surface of the sample.
3.3. Experimental Validation
The simulation results indicated that the desired temperature of425◦C was reached within 12.5min of the onset of the reaction. Thechange in temperature over this time period was observed to be lessthan 50◦C. This led to the configuration of an experimental designfor the experiment. Based on the experimental results, the char-doped samples favored enhanced biochar formation than non-dopedor graphite-doped biomass samples. Regression models (P 6 0.05)for biochar yields vs. temperature under the three treatments (non-,

Progress In Electromagnetics Research B, Vol. 56, 2013 17
e
d
Figure 17. Regression analysis of Yield vs. Temperature (P ≤ 0.01)for different treatments of biomass sample.
graphite and char-doped) were derived for temperatures of 250◦C,290◦C and 330◦C (Figure 17). Due to the generation of sparks withinthe cavity due to microwave interaction with the thermocouple, it wasnot possible to evaluate the model for temperatures > 330◦C.
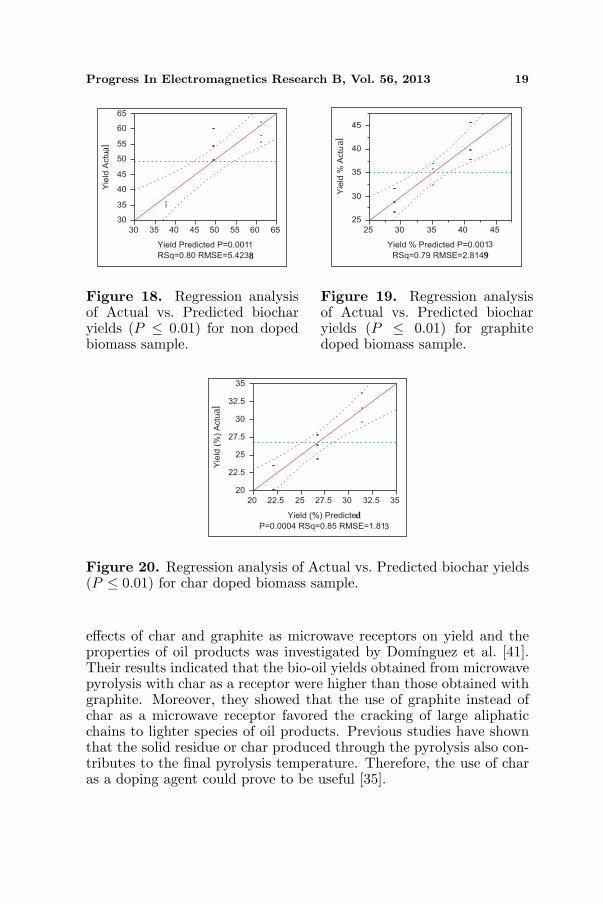
Figure 14 represents the linear relationship between yield%and temperature for each of the treatments. The correlation ofdetermination for each model indicated that the yield% of thechar-doped treatment had the best fit to the model as shownhere (Equations (14)–(16)) and illustrated in Figures 18–20. Theresults also indicated that both the treatment conditions as well astemperature had significant effects on the yields. The effect detailsthrough an analysis of variance (ANOVA) are as shown in Table 3.
Yieldchar = 60.27− 0.12T ◦ (R2 = 0.85) (14)Yieldgraphite = 78.25− 0.15T ◦ (R2 = 0.79) (15)
Yieldnon-doped = 134.49− 0.29T ◦ (R2 = 0.80) (16)
A multiple comparison of yields of the three types of woodsamples, treated at three different temperatures (250◦C, 290◦C and330◦C) was conducted through an ANOVA and Duncan’s MultipleRange test (P ≤ 0.05). The ANOVA results are presented in Table 4.Char-doping at 330◦C showed the lowest biochar yield than either ofthe other two doping treatments at that temperature (Figure 21) whiletreatments of 250◦C produced greatest yields. However, biochar yieldsof non-doped biomass treated at 330◦C and graphite-doped biomasstreated at 290◦C were not significantly different (P > 0.05).
The results of the present study prove the effect of pyrolysistemperatures on the final biochar yield. It can be seen from Figure 18that with increase in temperature, biochar yields decrease. Similarobservations have been reported by several research studies [37–40].

18 Dutta, Dev, and Raghavan
Table 3. Effect tests results for multiple comparison of yields of thethree types of wood samples.
Source Nparm DFSum ofsquares
F Pr >F
Temperature 1 1 622.2291 47.2854 < 0.0001Experimental
condition2 2 1525.2809 57.9558 < 0.0001
Table 4. Analysis of variance (ANOVA) results for multiplecomparison of yields of the three types of wood samples .
Source DFSum ofsquares
Meansquares
F Pr >F
Model 8 3221.882 402.735 55.595 <0.0001Error 18 130.393 7.244
CorrectedTotal
26 3352.275
Microwave pyrolysis of corn cob carried out at temperatures rangingfrom 300 to 600◦C indicated that the char yield decreased significantlyto 23% with an increase in temperature to 600◦C [37]. The effectof treatment conditions such as temperature, particle size, and ligninand inorganic matter contents on bio-char yield and reactivity wereinvestigated by Demirbas (2004) [38]. The results of the elementalanalysis show that high temperature and smaller particles led to anincrease in the heating rate resulting in a decreased bio-char yield. Onthe other hand, carbon contents in the biochar increase with pyrolysistemperature.
The present experimental results clearly corroborate the simula-tions, and confirm the hypothesis that as a microwave receptor dopingof biomass could have an influence on the pyrolysis products. Dop-ing of the wood was instrumental in sustaining greater temperatureuniformity and faster heating rates, thus improving the material’s py-rolysis rate. Previous studies have indicated that the incorporationof receptors in the material can also be used to modify the pyrolysisprocess for maximization of a particular pyrolysis product [35]. The
Progress In Electromagnetics Research B, Vol. 56, 2013 19
al
8
Figure 18. Regression analysisof Actual vs. Predicted biocharyields (P ≤ 0.01) for non dopedbiomass sample.
al
9
Figure 19. Regression analysisof Actual vs. Predicted biocharyields (P ≤ 0.01) for graphitedoped biomass sample.
al
d
Figure 20. Regression analysis of Actual vs. Predicted biochar yields(P ≤ 0.01) for char doped biomass sample.
effects of char and graphite as microwave receptors on yield and theproperties of oil products was investigated by Domınguez et al. [41].Their results indicated that the bio-oil yields obtained from microwavepyrolysis with char as a receptor were higher than those obtained withgraphite. Moreover, they showed that the use of graphite instead ofchar as a microwave receptor favored the cracking of large aliphaticchains to lighter species of oil products. Previous studies have shownthat the solid residue or char produced through the pyrolysis also con-tributes to the final pyrolysis temperature. Therefore, the use of charas a doping agent could prove to be useful [35].

20 Dutta, Dev, and Raghavan
58.5 a
50.3 b
35.0 d 40.3 c
35.6 d 29.0 e,f
31.6 d,e
25.9 f,g 22.7 g
0.000
10.000
20.000
30.000
40.000
50.000
60.000
70.000
250 290 330 250 290 330 250 290 330
Non
doped
Non
doped
Non
doped
G
doped
G
doped
G
doped
C
doped
C
doped
C
doped
Yie
ld %
(R
2 >
0.9
5)
Treatments
Figure 21. Duncan’s multiple range test comparative analysisof experimental microwave pyrolysis yields representing statisticalsignificance among the treatments. The means followed by the sameletter are not significant at P ≤ 0.05 level .
4. CONCLUSIONS
This study investigated the advantages of using doping agents suchas char and graphite to improve heat transfer during microwavepyrolysis of lignocellulosic biomass. A finite element model (FEM)was developed using the dielectric properties of the doping agents. Theregression models developed from the dielectric property measurementsindicated that char doping was better suited for microwave heatingthan graphite. The model developed during the simulation study foundthat doping helped to achieve a more efficient heat transfer withinthe biomass compared to non-doped samples. Char-doping resultedin rapidly reaching optimal temperatures, resulting in greater biocharyields. Laboratory-scale trials were conducted to test the validity andeffectiveness of the simulation results. Statistical analysis of the yieldsof the biochar indicated that char doping was very efficient in terms ofreducing heating time and raising temperature compared to graphitedoping. The numerical simulation model could be used to informthe design of a microwave-assisted bioreactor capable of achievingmaximum biochar formation.
ACKNOWLEDGMENT
The authors would like to gratefully acknowledge the financial supportof NSERC (Natural Sciences and Engineering Research Council),Canada, Le Fonds de recherche du Quebec — Nature et technologies(FQRNT) and Schulich Canada Graduate Scholarships.

Progress In Electromagnetics Research B, Vol. 56, 2013 21
REFERENCES
1. Intergovernmental Panel on Climate Change(IPCC), “IPCC fourth assessment report: Climatechange 2007,” 2007, accessed on June 28, 2013,http://www.ipcc.ch/publications and data/publications and datareports.shtml#1.
2. Climate Change, Government of Canada, “Canada’s ac-tion on climate change,” 2013, accessed on June 28, 2013,http://www.climatechange.gc.ca/default.asp?lang=En&n=72F16A84-1.
3. Environment Canada, “National inventory report 1990–2011:Greenhouse gas sources and sinks in Canada — Executive sum-mary,” 2013, accessed on June 28, 2013, http://www.ec.gc.ca/ges-ghg/default.asp?lang=En&n=68EE206C-1&offset=1&toc=show.
4. Agriculture and Agri Food Canada (AAFC), “Agri-culture residue,” 2008, accessed on June 28, 2013,http://www4.agr.gc.ca/AAFC-AAC/display-afficher.do?id=1226510406028&lang=eng.
5. Statistics Canada, “Human activity and the environment: Annualstatistics,” Catalogue No. 16-201-X, 2009, accessed on June 28,2013, http://www.statcan.gc.ca/pub/16-201-x/16-201-x2009000-eng.pdf.
6. Wu, H. and H. Abdullah, “Biochar as a fuel: 1. Properties andgrindability of biochars produced from the pyrolysis of Malleewood under slow-heating conditions,” Energy & Fuels, Vol. 23,No. 8, 4174–4181, 2009, DOI: 10.1021/ef900494t.
7. Lehmann, J., “Bio-energy in the black,” Frontiers in Ecologyand the Environment, Vol. 5, No. 7, 381–387, 2007, DOI:10.1890060133.
8. Joseph, S., C. Peacocke, J. Lehmann, and P. Munroe,“Developing a biochar classification and test methods,” Biocharfor Environmental Management, Science and Technology, J.Lehmann (ed.), 107–126, Earthscan, London, VA, 2009.
9. Kleiner, K., “The bright prospect of biochar,” Nature ReportsClimate Change, No. 3, 2009, DOI:10.1038/climate.2009.48.
10. International Biochar Initiative (IBI), “Biochar is a valuable soiladditive,” 2010, accessed on June 28, 2013, http://www.biochar-international.org/biochar.
11. Brownsort, P. A., “Biomass pyrolysis processes: Perfor-mance parameters and their influence on biochar system ben-efits,” M.Sc. thesis, School of Geosciences, University of Ed-
22 Dutta, Dev, and Raghavan
inburgh, Edinburgh, UK, 2009, accessed on June 28, 2013,http://hdl.handle.net/1842/3116.
12. Dutta, B., G. S. V. Raghavan, and M. Ngadi, “Surfacecharacterization and classification of slow and fast pyrolysedbiochar using novel methods of pycnometry and hyper-spectralimaging,” Journal of Wood Chemistry and Technology, Vol. 32,No. 2, 105–120, 2011, DOI: 10.1080/02773813.2011.607535.
13. Copson, D. A., Microwave Heating, 2nd Edition, xi-615, Avi Pub.Co., Westport, Conn., 1975.
14. Metaxas, A. C., Foundations of Electroheat. A Unified Approach,400, John Wiley & Sons, Baffins Lane, Chichester, West Sussex,1996.
15. Thostenson, E. T. and T. W. Chow, “Microwave processing:Fundamentals and applications,” Composites: Part A, Vol. 30,1055–1071, 1999.
16. Babu, B. V. and A. S. Chaurasia, “Pyrolysis of biomass:Improved models for simultaneous kinetics and transportof heat, mass and momentum,” Energy Conversion andManagement, Vol. 45, No. 9–10, 1297–1327, 2004, DOI:10.1016/j.enconman.2003.09.013.
17. Blasi, D., “Comparison of semi-global mechanisms for primarypyrolysis of lignocellulosic fuels,” Journal of Analytical and Ap-plied Pyrolysis, Vol. 47, No. 1, 43–64, 2008, DOI: 10.1016/S0165-2370(98)00079-5.
18. Dutta, B., S. R. S. Dev, Y. Gariepy, and G. S. V. Raghavan,“Finite element modelling of microwave pyrolysis of biomass,”Proceedings of 7th International Conference on Heat Transfer,Fluid Mechanics and Thermodynamics (HEFAT), Antalya,Turkey, July 19–21, 2010.
19. Dev, S. R. S., Y. Gariepy, and G. S. V. Raghavan, “Measurementof dielectric properties and finite element simulation of microwavepretreatment for convective drying of grapes,” PIERS Online,Vol. 5, No. 7, 690–695, 2009.
20. Delisle, G. Y., K. L. Wu, and J. Litva, “Couples finite elementand boundary element method in electromagnetics,” Comp. Phys.Commun., Vol. 68, No. 1–3, 255–278, 1991, DOI: 10.1016/0010-4655(91)90203-W.
21. Dev, S. R. S., Y. Gariepy, V. Orsat, and G. S. V. Raghavan,“FDTD modeling and simulation of microwave heating of in-shelleggs,” Progress In Electromagnetics Research M, Vol. 13, 229–243,2010.

Progress In Electromagnetics Research B, Vol. 56, 2013 23
22. Sanga, E. C. M., “Microwave assisted drying of compositematerials: Modelling and experimental validation,” Dissertation— Master’s Thesis, McGill University, 2002.
23. Robinson, J. P., S. W. Kingman, R. C. Barranco, E. Snape,and H. Al-Sayegh, “Microwave pyrolysis of wood pellets,”Ind. Eng. Chem. Res., Vol. 49, No. 2, 459–463, 2010, DOI:10.1021/ie901336k.
24. Al-Sayegh, H., J. Robinson, G. Dimitrakis, and S. Kingman,“Microwave processing of forestry waste,” IET RF and MicrowaveNetwork and National Centre for Industrial Microwave Processing(NCIMP), University of Nottingham, UK, December 2, 2010.
25. Domınguez, A., M. A. Menendez, et al., “Conventional andmicrowave induced pyrolysis of coffee hulls for the production of ahydrogen rich fuel gas,” J. Anal. Appl. Pyrolysis, Vol. 79, No. 1–2,128–135, 2007, DOI: 10.1016/j.jaap.2006.08.003.
26. Goss, W. P. and R. G. Miller, “Thermal properties ofwood and wood products,” Proceedings of the Thermal Per-formance of the Exterior Envelopes of Whole Buildings Inter-national Conference, Oak Ridge national Laboratory, Depart-ment of Energy, USA, 1992, accessed on September 25, 2013,http://web.ornl.gov/sci/buildings/2012/1992%20B5/028.pdf.
27. Center for Solid State Science, “Mass density in Engineered mate-rials,” Arizona State University, accessed on September 25, 2013,http://invsee.asu.edu/nmodules/engmod/propdensity.html.
28. Picard, S., D. T. Burns, and P. Roger, “Measurement of the spe-cific heat capacity of graphite,” Rapport BIPM-2006/01, Interna-tional Bureau of Weights and Measures, France, 2006. Availableat: www.bipm.org/utils/common/pdf/rapportBIPM/2006/01.pdf, accessed on October 11, 2013.
29. Clark, R. N., “Dielectric properties of materials,” Kaye and LabyOnline: Tables of Physical and Chemical Constants, NationalPhysical Laboratory, Middlesex, UK, 1995, accessed on Septem-ber 25, 2013, http://www.kayelaby.npl.co.uk/general physics/26/2 6 5.html.
30. Ida, N., “Magnetic properties of materials,” EngineeringElectromagnetics, Springer, USA, 2004.
31. Ayappa, K. G., H. T. Davis, E. A. Davis, and J. Gordon,“Two-dimensional finite element analysis of microwave heating,”AIChE Journal, Vol. 38, No. 10, 1577–1592, 1992, DOI:10.1002/aic.690381009.
32. Zheng, F., Z. Chen, and J. Zhang, “Toward the developmentof a three-dimensional unconditionally stable finite-difference
24 Dutta, Dev, and Raghavan
time-domain method,” IEEE Transactions on Microwave TheoryAnd Techniques, Vol. 48, No. 9, 1550–1558, 2000, DOI:10.1109/22.869007.
33. COMSOL Multiphysics, “Chemical reaction engineering module(Version 4.1a),” Burlington, MA, USA, 2012, available at:http://www.comsol.com/.
34. Zuo, W., Y. Tian, and R. Ren, “The important role of microwavereceptors in bio-fuel production by microwave-induced pyrolysisof sewage sludge,” Waste Management, Vol. 31, 1321–1326, 2011.
35. Fernandez, Y., A. Arenillas, and J. A. Menendez, “Microwaveheating applied to pyrolysis,” Advances in Induction andMicrowave Heating of Mineral and Organic Materials, 724–752,StanisÃlaw Grundas, Ed., Intech., Rijeka, Croatia, 2011, DOI:10.5772/13548.
36. Oloyede, A. and P. Groombridge, “The influence of microwaveheating on the mechanical properties of wood,” Journal ofMaterials Processing Technology, Vol. 100, 67–73, 2000.
37. Yu, F., P. H. Steele, and R. Ruan, “Microwave pyrolysis of corncob and characteristics of the pyrolytic chars,” Energy Sources,Part A, Vol. 32, 475–484, 2010.
38. Demirbas, A., “Effects of temperature and particle size on bio-char yield from pyrolysis of agricultural residues,” J. Anal. Appl.Pyrolysis, Vol. 72, 243–248, 2004.
39. Dutta, B., “Assessment of pyrolysis techniques of lignocellulosicbiomass for biochar production,” Dissertation — Master’s Thesis,McGill University, 2010.
40. Uemura, Y., W. N. Omar, S. Razlan, H. Mif, S. Yusup,and K. Onoe, “Mass and energy yields of bio-oil obtained bymicrowave-induced pyrolysis of oil palm kernel shell,” Journal ofthe Japan Insdture of Energy, Vol. 91, 954–959, 2012.
41. Domınguez, A., J. A. Menendez, M. Inguanzo, P. L. Bernad, andJ. J. Pis, “Gas chromatographic-mass spectrometric study of theoil fractions produced by microwave-assisted pyrolysis of differentsewage sludges,” Journal of Chromatography A, Vol. 1012, No. 2,193–206, 2003, DOI: 10.1016/S0021-9673(03)01176-2.