finite element analysis of jnes/nupec seismic … element analysis of jnes/nupec seismic shear wall...
TRANSCRIPT

BNL-NUREG-77880-2007-CP
Finite Element Analysis of JNES/NUPEC Seismic Shear Wall Cyclic and Shaking Table Test Data
Jim Xu1, Jinsuo Nie2, Charles Hofmayer3, Syed Ali4
1 Brookhaven National Laboratory, Upton, New York 11973-5000, USA Tel: 631-344-2183, Email: [email protected] 2 Brookhaven National Laboratory, Upton, New York 11973-5000, USA Tel: 631-344-2056, Email: [email protected] 3 Brookhaven National Laboratory, Upton, New York 11973-5000, USA Tel: 631-344-2317, Email: [email protected] 4 US Nuclear Regulatory Commission, Washington, D.C. 20555-0001, USA Tel: 301-415-5704, Email: [email protected]
Presented at the ASME PVP 2007/CREEP 8 Conference Hyatt Regency San Antonio, San Antonio, Texas
July 22-26, 2007
April 2007
Energy Sciences and Technology Department
Brookhaven National Laboratory P.O. Box 5000
Upton, NY 11973-5000 www.bnl.gov
Notice: This manuscript has been authored by employees of Brookhaven Science Associates, LLC under Contract No. DE-AC02-98CH10886 with the U.S. Department of Energy. The publisher by accepting the manuscript for publication acknowledges that the United States Government retains a non-exclusive, paid-up, irrevocable, world-wide license to publish or reproduce the published form of this manuscript, or allow others to do so, for United States Government purposes. This preprint is intended for publication in a journal or proceedings. Since changes may be made before publication, it may not be cited or reproduced without the author’s permission.
DISCLAIMER
This report was prepared as an account of work sponsored by an agency of the United States Government. Neither the United States Government nor any agency thereof, nor any of their employees, nor any of their contractors, subcontractors, or their employees, makes any warranty, express or implied, or assumes any legal liability or responsibility for the accuracy, completeness, or any third party’s use or the results of such use of any information, apparatus, product, or process disclosed, or represents that its use would not infringe privately owned rights. Reference herein to any specific commercial product, process, or service by trade name, trademark, manufacturer, or otherwise, does not necessarily constitute or imply its endorsement, recommendation, or favoring by the United States Government or any agency thereof or its contractors or subcontractors. The views and opinions of authors expressed herein do not necessarily state or reflect those of the United States Government or any agency thereof.
Proceedings of PVP2007 2007 ASME Pressure Vessels and Piping Division Conference
July 22-27, 2007, San Antonio, Texas, U.S. PVP2007-26340
1
FINITE ELEMENT ANALYSES OF JNES/NUPEC SEISMIC SHEAR WALL CYCLIC
AND SHAKING TABLE TEST DATA
Jim Xu Brookhaven National Laboratory
Upton, New York 11973-5000, USA Tel: 631-344-2183 Email: [email protected]
Jinsuo Nie
Brookhaven National Laboratory Upton, New York 11973-5000, USA
Tel: 631-344-2056 Email: [email protected]
Charles Hofmayer Brookhaven National Laboratory
Upton, New York 11973-5000, USA Tel: 631-344-2317
Email: [email protected]
Syed Ali US Nuclear Regulatory Commission Washington, D.C. 20555-0001, USA
Tel: 301-415-5704 Email: [email protected]
ABSTRACT
This paper describes a finite element analysis to predict the JNES/NUPEC cyclic and shaking table RC shear wall test data, as part of a collaborative agreement between the U.S. NRC and JNES to study seismic issues important to the safe operation of commercial nuclear power plant (NPP) structures, systems and components (SSC). The analyses described in this paper were performed using ANACAP reinforced concrete models. The paper describes the ANACAP analysis models and discusses the analysis comparisons with the test data.
The ANACAP capability for modeling nonlinear cyclic characteristics of reinforced concrete shear wall structures was confirmed by the close comparisons between the ANACAP analysis results and the JNES/NUPEC cyclic test data. Reasonable agreement between the analysis results and the test data was demonstrated for the hysteresis loops and the shear force orbits, in terms of both the overall shape and the cycle-to-cycle comparisons. The ANACAP simulation analysis of the JNES/NUPEC shaking table test was also performed, which demonstrated that the ANACAP dynamic analysis with concrete material model is able to capture the progressive degrading behavior of the shear wall as indicated from the test data. The ANACAP analysis also predicted the incipient failure of the shear wall, reasonably close to the actual failure declared for the test specimen.
In summary, the analyses of the JNES/NUPEC cyclic and shaking table RC shear wall tests presented in this paper have demonstrated the state-of-the-art analysis capability for determining the seismic capacity of RC shear wall structures. INTRODUCTION
Prior to the establishment of the Japan Nuclear Energy Safety Organization (JNES), the Nuclear Power Engineering
Corporation (NUPEC) of Japan performed multi-axis loading tests of reinforced concrete (RC) shear walls. This ten-year test program was completed in 2004 and included element tests, diagonal cyclic loading tests of box walls, multi-directional simultaneous cyclic loading tests of box and cylinder walls, and shaking table tests of box and cylinder walls [1-2].
As a result of the element tests, researchers in Japan developed a shear transfer constitutive model as a function of both shear and axial stresses. One of the major conclusions by JNES/NUPEC from all the box and cylinder wall tests was that for shear deformation angles smaller than 2x10⁻³ the effect of multi-axis loading is negligibly small and the methodology recommended in the Japanese guidelines for one directional loading can be applied [3-4]. For shear deformation angles greater than 2x10⁻³ the seismic capacity of the specimen decreased explicitly due the effect of simultaneous multi-axis loading and JNES/NUPEC concluded that this effect should be considered in the analysis. JNES/NUPEC also concluded that the non-linear response of an RC structure and its hysteretic curve for the restoring force can be evaluated satisfactorily if FEM analysis is applied with a four-way crack model.
Many of the analytical methods used by the nuclear industry in the U.S. have been primarily correlated with the results of single-element shear wall tests in which the walls were subjected to one-directional loading in the plane of the wall. The JNES/NUPEC test results provide unique information in that they tested box and cylindrical walls under the effect of multi-axis loading.
As part of collaborative efforts between the United States and Japan on seismic issues, the U.S. Nuclear Regulatory Commission (NRC) and Brookhaven National Laboratory
Proceedings of PVP2007 2007 ASME Pressure Vessels and Piping Division Conference
July 22-27, 2007, San Antonio, Texas, U.S. PVP2007-26340
2
(BNL) participated in the JNES/NUPEC shear wall test program. The specific objectives of this research activity were: (1) to assess analysis methods for seismic shear wall capacity using the JNES/NUPEC multi-axis cyclic loading and shaking table test data, (2) to determine the technical significance of the JNES/NUPEC data related to the effects of out of plane motions on the overall methodology used for assessing the seismic capacity of reinforced concrete shear walls, and (3) to analyze the Japanese test results and to provide insights that can be clearly understood and utilized by NRC staff and stakeholders.
This paper describes part of the BNL research activities, which utilizes the concrete finite element code ANACAP to predict the performance of a box-type shear wall under cyclic and shaking table loading conditions. The analytical predictions using ANACAP models are compared to the test results and the findings are summarized in this paper. Note that the BNL research activities included assessments of other simplified methods typically used by the industry for determining seismic strength of shear wall structures, which are not described in this paper. For complete information and associated data on the BNL research activities, the reader is referred to the recently published NUREG/CR-6925 report [5]. In addition, the results of additional analyses are discussed that considered three other scenarios: 1) an analysis using a high level test run without prior history of damage to the wall, 2) applying a uni-directional input to the shear wall model, which has been damaged from the previous test runs, and 3) same as case 2, except that the prior history of damage was not considered.
The paper is organized in four sections. Section 1 is the introduction and Section 2 provides a brief description of the JNES/NUPEC shear wall tests. The finite element models, analysis results, and their comparisons are discussed in Section 3 for static cyclic tests and in Section 4 for the shaking table tests, respectively. Finally, conclusions are provided in Section 5.
DESCRIPTION OF JNES/NUPEC CYCLIC AND SHAKING TABLE TESTS
The JNES/NUPEC shear wall tests were performed using both box-type and cylindrical shear wall configurations. Since the analysis described in this paper deals only with the box-type shear walls, the cylindrical configuration shear walls will not be described in this paper and the reader is referred to NUREG/CR-6925 [5] for detailed information.
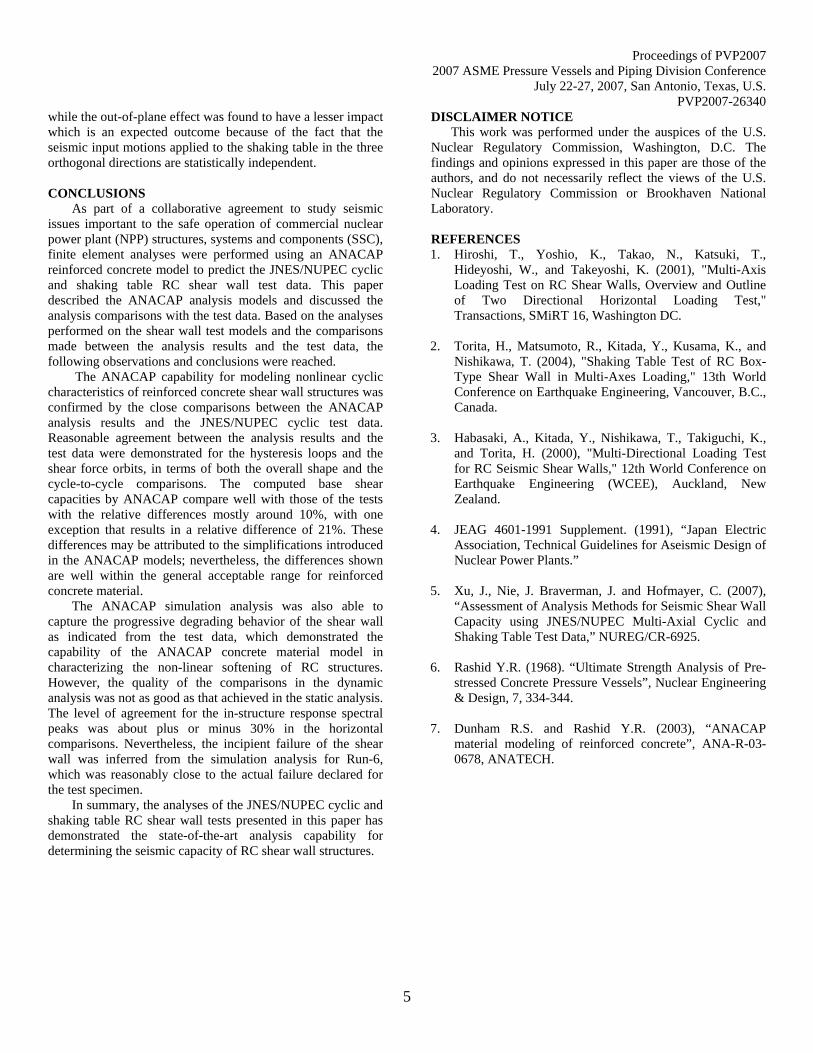
Two categories of cyclic tests were performed: uni-directional loading and multi-axis loading tests. Figure 1 (a) shows the box-type shear wall test configuration and the overall dimensions. The shear wall consists of a 1500 mm square box type RC structure, supported by a base slab. The shear wall has a reinforcement ratio of 1.2% in both horizontal and vertical directions. Horizontal loading to the shear wall is provided through the reinforced concrete top slab. In addition, the shear wall was also subjected to a vertical load which
resulted in an axial stress of 1.47 MPa. The slabs have a plan dimension of 2700 mm x 2700 mm. The base slab has a thickness of 500 mm, while the top loading slab is 400 mm thick. The material properties for concrete and rebars for the cyclic tests are provided in Table 1.
Three loading schemes were developed for the multi-axis loading tests, based on the observed response orbit of shear wall structures as recorded in actual earthquake events. The corresponding loading patterns were designated as: rectangular, cross and diagonal cross, as shown in Figure 2 (a)-(c). The loadings are accomplished by controlling the shear deformation angle R which is calculated from the lateral displacement δ measured at the bottom of the loading slab and dividing by the height of the shear wall (1000 mm: clear height of wall) as depicted in Figure 3. Each loading pattern was repeated with increasing deformation amplitude, until the failure of the shear wall had occurred. The number of cycles of incremental loadings for the three loading patterns are shown in Figure 4 (Solid lines represent the displacement sequences in X direction while dotted lines depict the displacement sequences in Y direction).
The shaking table tests were performed to study the dynamic response of RC shear walls subjected to repeated strong ground motions. Such tests would provide insights into the characteristics of the load-carrying capacity of RC shear walls in the elasto-plastic and ultimate failure states, and also provide the necessary response data to validate analytical models for RC shear wall seismic response analyses.
Two box-type shear wall specimens, designated as: DT-B-01 and DT-B-02, and one cylindrical type specimen assigned as DT-C-01, were fabricated for the shaking table tests. The details of the tests can be found in the paper by Torita, H., et al. [2]. The test designated as DT-B-02 was used in this study. The shear wall configuration and associated dimensions are shown in Figure 1 (b). The shaking table test specimen consists of four parts: shear walls, a base slab, an upper slab and an extra block weight on the top of the upper slab. The shear walls are the same as the ones used in the cyclic tests. The extra weight on the top provides the axial stress of 1.47 MPa to the shear walls.
The shear wall specimen DT-B-02 was subjected to three orthogonal seismic motions simultaneously, which are shown in Figure 5. There were a total of nine runs (designated as Run Nos. 1, 2, 2’, 3, 3’, 4, 5, 6, 7) of the shaking table test performed by calibrating the intensity of the input motions. The input motions were adjusted to induce only a small tremor for Run-1 (shear wall remains elastic), and to increase the shaking intensity in an incremental manner for each run thereafter until eventual failure of the specimen. The pre-test analysis estimated that the shear wall specimen could reach failure at the end of Run-6. However, the actual failure of the specimen was declared during the extra test run (Run-7). Therefore, the quality of the data collected from Run-7 is questionable. For this reason, the BNL simulation analysis described in this section does not include the data for Run-7.
Proceedings of PVP2007 2007 ASME Pressure Vessels and Piping Division Conference
July 22-27, 2007, San Antonio, Texas, U.S. PVP2007-26340
3
The next two sections will describe the ANACAP analysis models and the analysis results which are compared with the test data for the cyclic and shaking table tests.
ANACAP ANALYSIS OF CYCLIC TESTS
The ANACAP concrete constitutive model is a smeared-crack finite element model that was initially developed by Rashid Y.R. [6] and was further developed as a unique approach fostered by ANATECH, the company who develops the ANACAP software [7]. Among the four concrete material models provided in ANACAP, model 3 is the only ANACAP model suitable for this study because it allows full plasticity with strain softening capability in compression. The ANACAP model considers concrete tension stiffening and shear retention effects. The unrealistic buildup of shear stress across an open crack is limited by the so-called shear shedding model in ANACAP. Rebars are modeled as sub-elements embedded within concrete elements, which superimpose their strength and stiffness to the associated concrete elements. The constitutive model of rebars in ANACAP also considers the rebar plasticity, bond slip, and anchorage losses.
The ANACAP finite element (FE) model was developed for the cyclic test specimen, as shown in Figure 6. The concrete shear wall is modeled using a single brick element through the thickness of the wall. The element B203D provided in ANACAP is a 20-node brick element and is used for the shear wall modeling, because it allows a large element size. This modeling strategy should not affect the overall horizontal stiffness of the shear wall because the out-of-plane flexural stiffness of the walls is negligible for the box-shaped shear wall. In addition, a 3x3x3 Gauss integration scheme, which is used for these brick elements to prevent possible rigid body mode, can provide better out-of-plane bending capability than the standard 2x2x2 Gauss integration scheme.
The loading slab is modeled with one element through its thickness and has 144 elements in total. The displacement sequences are applied at the center of the bottom face of the loading slab, at which a single node resides. Because the loading slab is very thick (400 mm) compared to the thickness of the shear wall (75 mm), it can be idealized as a rigid slab. In the analyses, the material model of the loading slab is an elastic isotropic steel material that ensures its rigidity with respect to the concrete shear wall. Moreover, since the rebars in the shear wall have an anchorage of 300 mm in the loading slab, the bonding between the shear wall and the loading slab is assumed perfect for all the models by sharing interface nodes between these two parts. Similarly, the base slab is also assumed rigid and is represented by a fixed boundary condition applied at all nodes at the bottom of the shear wall.
Rebars are modeled as sub-elements in ANACAP, and can be generated using the preprocessor program ANAGEN that is bundled within the ANACAP package. All rebars have a diameter of 6 mm, and are modeled using a bilinear elastic-plastic material. The bond between a rebar and the concrete is assumed perfect (FULL in ANACAP terms).
The static stress analyses were performed by subjecting the FE model to the corresponding cyclic loading patterns as described in Section 2 above. Each analysis was done in two steps: (1) a pressure boundary of 1.47 MPa was applied at the top of the shear wall, and (2) The relevant displacement loading pattern was specified as the displacement boundary condition at the center of the bottom face of the loading slab.
The base shears were obtained by extracting the reaction forces from the ANACAP output file. The displacement histories at the top of the shear wall were obtained at the loading node for the two horizontal directions. The ANACAP analysis results were then compared with the test data for each of the loading scenarios. The comparisons were made using the relation of shear force vs. displacement, the shear force orbit curve, the cycle-by-cycle shear force – displacement relation, and the base shear force capacity. Due to the limited space, only selective comparison results are presented; the reader is referred to the NUREG/CR-6925 report [5] for the complete discussion and comparisons between test and analysis results.
Figure 7 presents the shear force - displacement hysteresis loops for the uni-directional loading case in a cycle-by-cycle manner. In this figure, the solid lines represent the ANACAP analysis and the dotted lines describe the test data. For the first 4 cycles that the maximum displacement demand is 1 mm, both the stiffness and the peak base shear force of the analytical result are very close to those of the test. Starting from the 5th cycle and until the 9th cycle, which represent a peak displacement demand ranging from 2 mm to 6 mm, the analytical model is slightly stiffer and has shear strength higher than the test specimen. At the 10th cycle, the second cycle that has a peak displacement of 6 mm and the behavior of the analytical model resembles very well that of the test specimen. The excursion on the test hysteresis curve is because the specimen failed prematurely in the 11th cycle. In contrast, the ANACAP analysis continues to the last cycle and completes all the displacement sequence. The ANACAP reinforced concrete model does not explicitly define a failure criterion to stop the analysis; rather, it continues the analysis with the model properties being degraded appropriately and substantially after “failure”. This is indeed the essential technique for ANACAP to capture the post-ultimate performance of the reinforced concrete material.
For the multi-axis cyclic analysis, Figures 8 through 10 present comparisons of hysteresis loops between the tests and the ANACAP analysis. As shown in these comparisons, the overall shapes of the analytical hysteresis loops follow the test result closely on loading and reach peaks that are close to the test data. To demonstrate the close prediction of the cyclic test data by the ANACAP model, the shear force orbits for the rectangular loading pattern were compared between the test and the analysis, and the resulting comparison is presented in Figure 11. The good agreement in the hysteresis loops and the shear force orbits, in terms of both the overall shape and the cycle-to-cycle comparisons, proves that ANACAP is capable
Proceedings of PVP2007 2007 ASME Pressure Vessels and Piping Division Conference
July 22-27, 2007, San Antonio, Texas, U.S. PVP2007-26340
4
of properly predicting the reinforced concrete behavior in stiffening and softening, loading and unloading, and rebar bond and anchorage.
Comparisons between the ANACAP analytical results and the test data were also made in terms of the base shear capacity. All predicted base shear capacities are higher than those of the tests; the relative errors are mostly around 10%, with one exception that results in a relative error of 21%. These errors are well within the general acceptable range for reinforced concrete material.
The good correlation between the analytical result and the test data for the static cyclic loading cases provides a foundation for this model to be used in the nonlinear dynamic time history analyses, which is the topic of the next section. With concrete and rebar material properties updated to values specific to the shaking table test, the same shear wall model will be used for the dynamic analyses. ANACAP ANALYSIS OF SHAKING TABLE TESTS
There were three specimens used in the JNES shaking table tests, in which the one designated as DT-B-02 in the test has been selected for the ANACAP simulation analysis. As described in Section 2, the shear wall of this specimen shares the same geometry and rebar configuration as those in the static cyclic loading tests described above. The constitutive models for the concrete and the rebars, the finite element mesh, and the rebar models are also the same as those in the static analyses. Therefore, this section will only describe those modeling features that are relevant in a dynamic loading situation.
The most noticeable difference between the specimen DT-B-02 and the specimens for static tests is that the vertical load was applied by adding extra weight above the loading slab rather than applying vertical force as in the static tests. The weight, the loading slab, and the upper half of the shear wall constitutes a mass compound that weights 67 metric ton, which results in a vertical stress level of 1.47 MPa at the bottom of the shear wall, which is the same as in the static tests. The loading slab and the base slab have slightly different dimensions than those for the static tests, which however can still be considered rigid in the dynamic simulation and thus do not represent a significant difference in modeling.
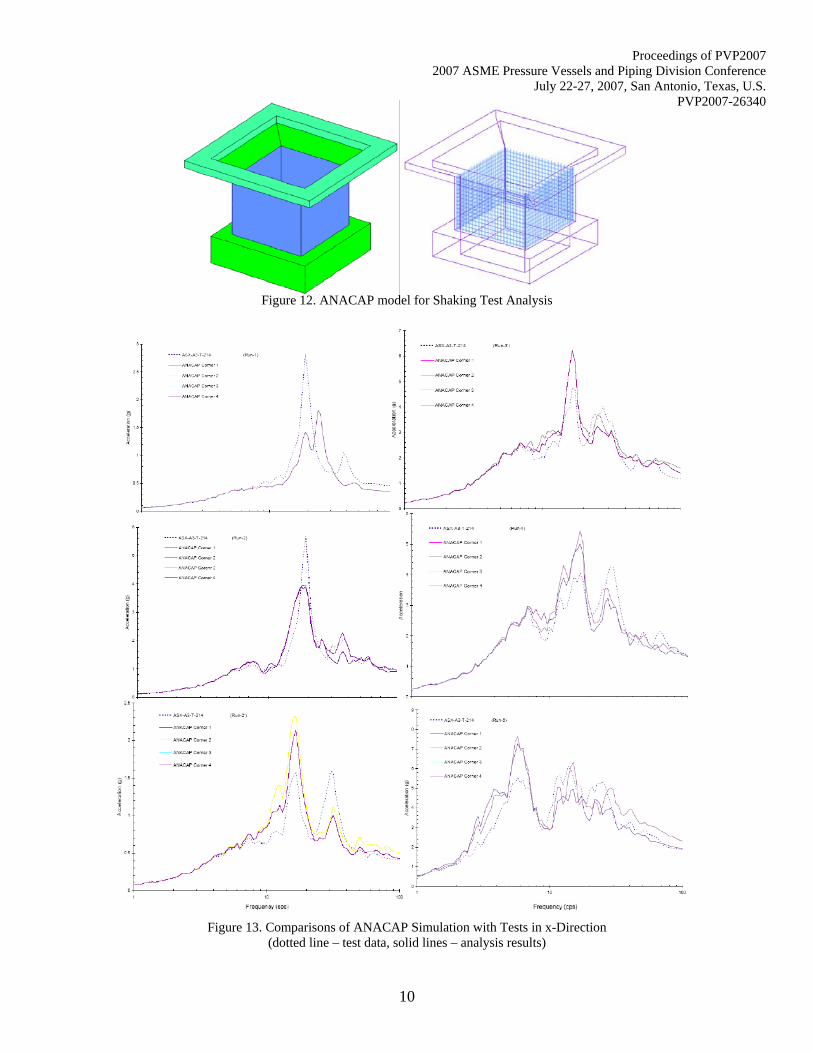
Figure 12 shows a schematic representation of the analytical model that consists of four parts, namely the rigid weight ring, rigid connection ring, the shear wall, and the base slab. The weight and the loading slab are modeled together as the combination of the rigid weight ring and the rigid connection ring. The model has 448 20-node brick elements (B203D) and the double-layered bi-directional rebar model embedded in the outline of the model, which is basically the same as in the static models. The material properties of the shear wall are provided as the last column of Table 1. In addition, a modified Raleigh damping that is compatible with the damage state of the concrete as implemented in ANACAP was applied in the dynamic analysis.
The shear wall specimen DT-B-02 was subjected to 3-D motions simultaneously in the shaking table test. Examination of the vertical motion recordings at the 4 locations on the top of the base slab has shown that the shear wall was subjected to both vertical translational motion and rolling and rocking motions. This precludes the simple application of three motions, namely two horizontal motions and a vertical motion, to the bottom of the shear wall in the analysis. Therefore, three recorded vertical base motions were applied to three non-aligned points on the base slab (necessary condition for defining a plane).
A shaking table simulation analysis was performed using the ANACAP model and the results in terms of response spectra at the upper corners of the shear wall were compared with the test data, as shown in Figure 13 for x direction and Figure 14 for y direction. As can be seen from these comparisons, the ANACAP simulation generally captured the progressive degrading behavior of the shear wall as indicated from the test data, which demonstrated the capability of the ANACAP concrete material model in characterizing the non-linear softening of RC structures. With the exception for Run-1, the simulation generally captured the frequency shifts in the response spectra comparisons with the test and the roof accelerations were reasonably matched to the test within about plus or minus 20%. The level of agreement for the in-structure response spectral peaks was about plus or minus 30% in the horizontal comparisons and about plus or minus 50% in the vertical comparisons. The largest discrepancy in the response spectra comparisons occurred in the simulation for Run-1, which has the smallest input level and the shear wall was expected to remain elastic. This discrepancy was believed to be possibly attributed to the prescribed damping for the ANACAP model. As the test runs progressed, the energy dissipation of the shear wall was gradually controlled by the hysteresis characteristics of the reinforced concrete material model; therefore, the prescribed damping became less important and the level of agreement between test and analysis results increased. Although the peaks of the calculated in-structure response spectra were not as closely matched to the test results as one might expect to achieve, the overall progressive failure behavior of the JNES/NUPEC shaking table test was reasonably captured by the simulation analysis of the ANACAP RC shear wall model.
Other response quantities such as hysteresis loops and base shears were also computed and compared with the test data, which were not included in this paper due to space limit. Reasonable comparisons of these response quantities between the analysis and the test were obtained, with the base shears matched between test and analysis within about plus or minus 20%.
Based on the test data, other response effects such as consideration of damage history and out-of-plane effect were also studied. Although the analysis results were not presented here, the general conclusions were that prior damage history is important to the determination of the shear wall capacity,
Proceedings of PVP2007 2007 ASME Pressure Vessels and Piping Division Conference
July 22-27, 2007, San Antonio, Texas, U.S. PVP2007-26340
5
while the out-of-plane effect was found to have a lesser impact which is an expected outcome because of the fact that the seismic input motions applied to the shaking table in the three orthogonal directions are statistically independent. CONCLUSIONS
As part of a collaborative agreement to study seismic issues important to the safe operation of commercial nuclear power plant (NPP) structures, systems and components (SSC), finite element analyses were performed using an ANACAP reinforced concrete model to predict the JNES/NUPEC cyclic and shaking table RC shear wall test data. This paper described the ANACAP analysis models and discussed the analysis comparisons with the test data. Based on the analyses performed on the shear wall test models and the comparisons made between the analysis results and the test data, the following observations and conclusions were reached.
The ANACAP capability for modeling nonlinear cyclic characteristics of reinforced concrete shear wall structures was confirmed by the close comparisons between the ANACAP analysis results and the JNES/NUPEC cyclic test data. Reasonable agreement between the analysis results and the test data were demonstrated for the hysteresis loops and the shear force orbits, in terms of both the overall shape and the cycle-to-cycle comparisons. The computed base shear capacities by ANACAP compare well with those of the tests with the relative differences mostly around 10%, with one exception that results in a relative difference of 21%. These differences may be attributed to the simplifications introduced in the ANACAP models; nevertheless, the differences shown are well within the general acceptable range for reinforced concrete material.
The ANACAP simulation analysis was also able to capture the progressive degrading behavior of the shear wall as indicated from the test data, which demonstrated the capability of the ANACAP concrete material model in characterizing the non-linear softening of RC structures. However, the quality of the comparisons in the dynamic analysis was not as good as that achieved in the static analysis. The level of agreement for the in-structure response spectral peaks was about plus or minus 30% in the horizontal comparisons. Nevertheless, the incipient failure of the shear wall was inferred from the simulation analysis for Run-6, which was reasonably close to the actual failure declared for the test specimen.
In summary, the analyses of the JNES/NUPEC cyclic and shaking table RC shear wall tests presented in this paper has demonstrated the state-of-the-art analysis capability for determining the seismic capacity of RC shear wall structures.
DISCLAIMER NOTICE This work was performed under the auspices of the U.S. Nuclear Regulatory Commission, Washington, D.C. The findings and opinions expressed in this paper are those of the authors, and do not necessarily reflect the views of the U.S. Nuclear Regulatory Commission or Brookhaven National Laboratory. REFERENCES 1. Hiroshi, T., Yoshio, K., Takao, N., Katsuki, T.,
Hideyoshi, W., and Takeyoshi, K. (2001), "Multi-Axis Loading Test on RC Shear Walls, Overview and Outline of Two Directional Horizontal Loading Test," Transactions, SMiRT 16, Washington DC.
2. Torita, H., Matsumoto, R., Kitada, Y., Kusama, K., and Nishikawa, T. (2004), "Shaking Table Test of RC Box-Type Shear Wall in Multi-Axes Loading," 13th World Conference on Earthquake Engineering, Vancouver, B.C., Canada.
3. Habasaki, A., Kitada, Y., Nishikawa, T., Takiguchi, K., and Torita, H. (2000), "Multi-Directional Loading Test for RC Seismic Shear Walls," 12th World Conference on Earthquake Engineering (WCEE), Auckland, New Zealand.
4. JEAG 4601-1991 Supplement. (1991), “Japan Electric Association, Technical Guidelines for Aseismic Design of Nuclear Power Plants.”
5. Xu, J., Nie, J. Braverman, J. and Hofmayer, C. (2007), “Assessment of Analysis Methods for Seismic Shear Wall Capacity using JNES/NUPEC Multi-Axial Cyclic and Shaking Table Test Data,” NUREG/CR-6925.
6. Rashid Y.R. (1968). “Ultimate Strength Analysis of Pre-stressed Concrete Pressure Vessels”, Nuclear Engineering & Design, 7, 334-344.
7. Dunham R.S. and Rashid Y.R. (2003), “ANACAP material modeling of reinforced concrete”, ANA-R-03-0678, ANATECH.
Proceedings of PVP2007 2007 ASME Pressure Vessels and Piping Division Conference
July 22-27, 2007, San Antonio, Texas, U.S. PVP2007-26340
6
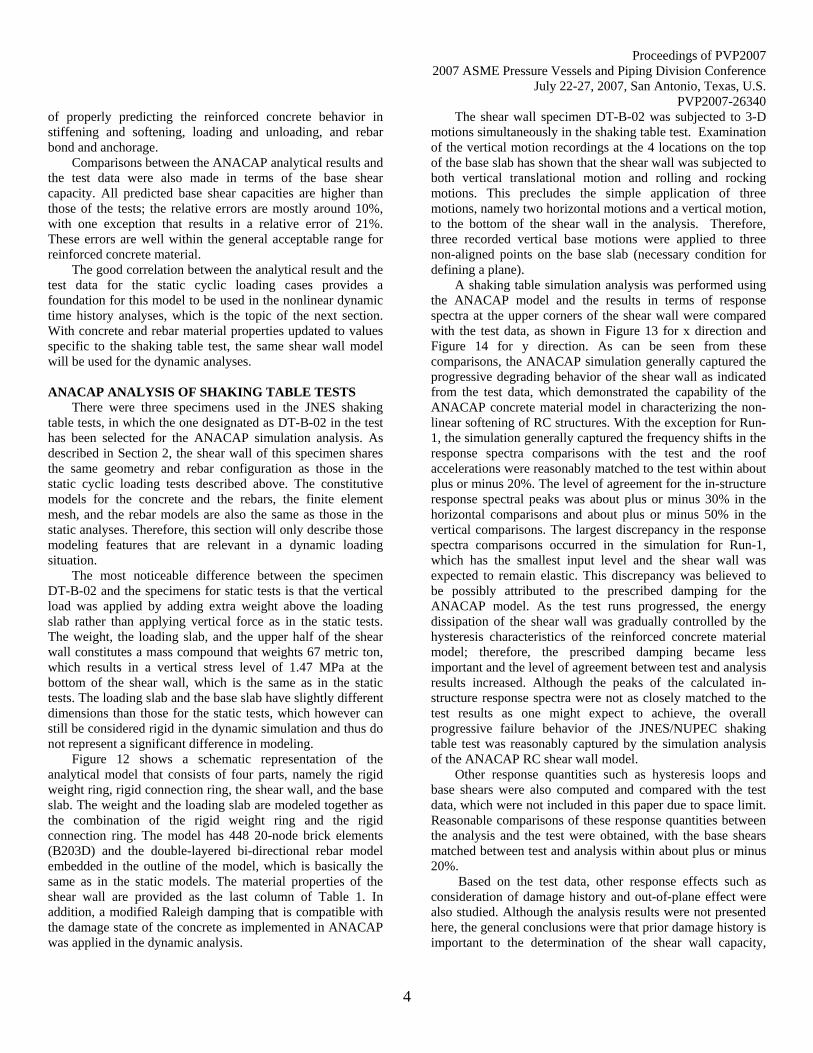
Table 1. Concrete and Rebar Properties for Test Specimens
SD-08-00 SB-B-01 SB-B-02 SB-B-03 DT-B-02 Description 1-D Cyclic 2-D Rectangular 2-D Cross 2-D Diagonal Shake Table
Concrete: Young’s Modulus (GPa) 26.3 30.7 30.7 32.0 26.6 Compression Strength (MPa) 34.9 41.3 39.7 34.9 34.4 Poisson Ratio 0.21 0.18 0.17 0.19 0.19 Rebars: Young’s Modulus (GPa) 175 200 200 200 180 Yield Strength (MPa) 345 375 375 375 376 Tensile Strength (MPa) 490 493 493 493 479 Tensile Strain At Fracture (%) 29.1 28.0 28.0 28.0 27.4
(a) Cyclic Test Specimen (b) Shaking Table Test Specimen
Figure 1. JNES/NUPEC Test Configurations
Rectangular pattern Cross Pattern Diagonal Cross Pattern
Figure 2. Cyclic Multi Axis Loading Schemes

Proceedings of PVP2007 2007 ASME Pressure Vessels and Piping Division Conference
July 22-27, 2007, San Antonio, Texas, U.S. PVP2007-26340
7
Figure 3. Shear Force and Deformation Schematics for Multi-axis Cyclic Tests
Figure 4. Loading Cycles Schematics for Multi-axis Cyclic Tests
x-direction y-direction z-direction Figure 5. Input Motion Sequences for Shaking Table Tests
Figure 6. ANACAP Model for Cyclic Analysis

Proceedings of PVP2007 2007 ASME Pressure Vessels and Piping Division Conference
July 22-27, 2007, San Antonio, Texas, U.S. PVP2007-26340
8
-200.00
0.00
200.00
400.00
600.00
800.00
1000.00
1200.00
-10 0 10 20 30 40 50 60
-200.00
0.00
200.00
400.00
600.00
800.00
1000.00
1200.00
-6 -4 -2 0 2 4 6 8 10
-1500.00
-1000.00
-500.00
0.00
500.00
1000.00
1500.00
-10 -5 0 5 10
-1500.00
-1000.00
-500.00
0.00
500.00
1000.00
1500.00
2000.00
-10 -5 0 5 10
-800.00
-600.00
-400.00
-200.00
0.00
200.00
400.00
600.00
800.00
-1 -0.5 0 0.5 1
-600.00
-400.00
-200.00
0.00
200.00
400.00
600.00
-0.6 -0.4 -0.2 0 0.2 0.4 0.6
-800.00
-600.00
-400.00
-200.00
0.00
200.00
400.00
600.00
800.00
-1.5 -1 -0.5 0 0.5 1 1.5
-800.00
-600.00
-400.00
-200.00
0.00
200.00
400.00
600.00
800.00
-1.5 -1 -0.5 0 0.5 1 1.5
-1500.00
-1000.00
-500.00
0.00
500.00
1000.00
1500.00
-3 -2 -1 0 1 2 3
-1500.00
-1000.00
-500.00
0.00
500.00
1000.00
1500.00
-3 -2 -1 0 1 2 3
-2000.00
-1500.00
-1000.00
-500.00
0.00
500.00
1000.00
1500.00
2000.00
-6 -4 -2 0 2 4 6
-2000.00
-1500.00
-1000.00
-500.00
0.00
500.00
1000.00
1500.00
2000.00
-6 -4 -2 0 2 4 6
-2000.00
-1500.00
-1000.00
-500.00
0.00
500.00
1000.00
1500.00
2000.00
-8 -6 -4 -2 0 2 4 6 8
-2000.00
-1500.00
-1000.00
-500.00
0.00
500.00
1000.00
1500.00
2000.00
-8 -6 -4 -2 0 2 4 6 8
Cycle 1 Cycle 2 Cycle 3 Cycle 4
Cycle 5 Cycle 6 Cycle 7 Cycle 8
Cycle 9 Cycle 10 Cycle 11 Cycle 12
Last Cycle Last Cycle
Figure 7 Cycle-By-Cycle Shear Force – Displacement Relation for 1-D Cyclic Loading
Shear Force - Deformation, SB-B-01
-2000
-1500
-1000
-500
0
500
1000
1500
2000
-20 -15 -10 -5 0 5 10 15 20
Dx (mm)
Qx
(kN
)
Figure 8. Hysteresis Comparison for Rectangular Loading Pattern

Proceedings of PVP2007 2007 ASME Pressure Vessels and Piping Division Conference
July 22-27, 2007, San Antonio, Texas, U.S. PVP2007-26340
9
Figure 9. Hysteresis Comparison for Cross Loading Pattern
Shear Force - Deformation,
-2000
-1500
-1000
-500
0
500
1000
1500
2000
-20 -15 -10 -5 0 5 10 15 20
Dx (mm)
Qx
(kN
)
SB-B-03
Figure 10. Hysteresis Comparison for Diagonal Cross Loading Pattern
Shear Force Orbits, SB-B-01
-2000
-1500
-1000
-500
0
500
1000
1500
2000
-2000 -1500 -1000 -500 0 500 1000 1500 2000
Qx (kN)
Qy
(kN
)
Figure 11. Shear Force Orbit Comparison for Rectangular Loading Pattern
Shear Force - Deformation,
-2000
-1500
-1000
-500
0
500
1000
1500
2000
-20 -15 -10 -5 0 5 10 15 20
Dx (mm)
Qx
(kN
)
SB-B-02
Proceedings of PVP2007 2007 ASME Pressure Vessels and Piping Division Conference
July 22-27, 2007, San Antonio, Texas, U.S. PVP2007-26340
10
Figure 12. ANACAP model for Shaking Test Analysis
Figure 13. Comparisons of ANACAP Simulation with Tests in x-Direction (dotted line – test data, solid lines – analysis results)

Proceedings of PVP2007 2007 ASME Pressure Vessels and Piping Division Conference
July 22-27, 2007, San Antonio, Texas, U.S. PVP2007-26340
11
Figure 14. Comparisons of ANACAP Simulation with Tests in y-Direction (dotted lines – test data, solid lines – analysis results)