finding hidden value in your energy efficiency...
TRANSCRIPT

Finding Hidden Value in Your Energy Efficiency Project
Christopher RussellEnergy PathFINDER.com(443) [email protected]

Outline for Today
2©2011 Energy PathFINDER.com
1:30 pm INTRODUCTION: Energy, Money, Business, and a New Facility Management Philosophy
2:15 pm REVIEW:Financial Metrics and Rates of Return
3:00 pm BREAK
3:15 pm ALTERNATIVE EVALUATION METHODSFrom “Projects” to “Investments”
4:30 pm INTERACTIVE CALULATOR DEMO
Q&A
5:00 pm ADJOURN

About Christopher Russell, C.E.M., C.R.M.
Independent consulting since 2006Principal, Energy Pathfinder
Energy Manager, Howard County, MD, 2010-2012
Director of Industrial Programs, Alliance to Save Energy, 1999-2006
Comm. & Indus. Program Manager, American Gas Association, 1995-1999
MBA, M.A., University of Maryland; B.A., McGill University
Published November 2009
Published June 2010
The Industrial Energy Harvest N.A. Energy Audit Program Best Practices
3©2011 Energy PathFINDER.com
Energy Manager, Author, Speaker, Coach,
Analyst, Consultant

Why This Workshop?
Markets, technologies, and practices… Organizational philosophies… Internal competition for capital budget resources 21st century opportunities… 1920s investment metrics
Keep pushing the same buttons?Expect the same results
4©2011 Energy PathFINDER.com

Energy Investment Calculator w w w .energypathfinder.com
Subject Activity: Prepared for: Prepared by:
Date:
ENERGY AT-RISK: CURRENTLY WASTED: 54,242 MMBtu @ $5.1860 per MMBtu POTENTIALLY AVOIDED: 54,242 MMBtu @ $2.3051 per MMBtu
MMBtu USED AS INTENDED:18,970,698 MMBt @ $5.1860 per MMBtu
OPERATING ECONOMIC FINANCIALPERFORMANCE PERFORMANCE PERFORMANCE
Before depreciation After depr. & taxes; Free cash f lowand taxes before f inance after f inance TARGET
SIMPLE PAYBACK (YEARS): 4.8 7.8 -- n.a.RETURN ON INVESTMENT: 27.3% 17.8% -- n.a.
PROFITABILITY INDEX: -- -- 1.8 --INTERNAL RATE OF RETURN THRU YR 25: 23.8% -- 98.8% --
LIFE-CYCLE COST (25 YEARS): $2,781,037,733 undiscounted value; includes costs of finance
PAGE 14ENERGY AT-RISK: WASTED OR AVOIDED?
YOU WILL PAY FOR IT EITHER WAY: CHOOSE YOUR PRICE.
Heavy Manufacturing Ltd.C. Russell10/19/2011
INVESTMENT METRICS
$5.1860 $5.1860
$5.1860 $2.3051
REJECT ACCEPT
5©2011 Energy PathFINDER.com
INVESTMENT CALCULATOR

Facility Manager?
Value of energy efficiency CAN be proven…
Project Engineer?
Machine Operator?
Corporate Officer?
But to Whom?
Each has a different definition of value.
©2011 Energy PathFINDER.com 6

Facilities Management 1.01999 and before
Fuels and power are plentiful and cheap Fuel bills: just pay them on time Equipment operators never see the bills Accountants don’t know how energy is used Energy costs are treated as overhead
…allocate energy per labor hour or square foot Stoke it up and leave it running
Energy is an uncontrollable cost of doing business.Let the pipefitters and electricians handle it.That’s the way we’ve always done it.If it ain’t broke, don’t fix it.
7©2011 Energy PathFINDER.com

Rethinking Energy’s Place in Business
Energy touches every square foot in the facility
Energy reflects choices by every employee
Current utility bill reflects choices made days, weeks, months, years ago
8©2011 Energy PathFINDER.com

Rethinking Energy’s Place in Business
Energy is wealth: it can be invested, preserved, and used to grow a business
If energy is wealth, fuels and electricity are like currency – the same financial management techniques apply
Energy choices will shape cash flow for years to come
9©2011 Energy PathFINDER.com
Who “owns” responsibility for these decisions?

The Energy Consuming Business’Misplaced PrioritiesTypical thinking: Energy is a small portion of costs Small portion = low importance Smaller value, lower delegation of
responsibility
Energy decisions wind up in the hands of low-level staff…Empowerment? Motivation? Business skills?
10©2011 Energy PathFINDER.com

Missing the Point…It’s more than utility bills!
Energy CHOICES impact: capital investment asset management maintenance protocol & agendas
11©2011 Energy PathFINDER.com
You cannot FUTUREPROOF an organizationwithout considering energy risks.
12©2011 Energy PathFINDER.com
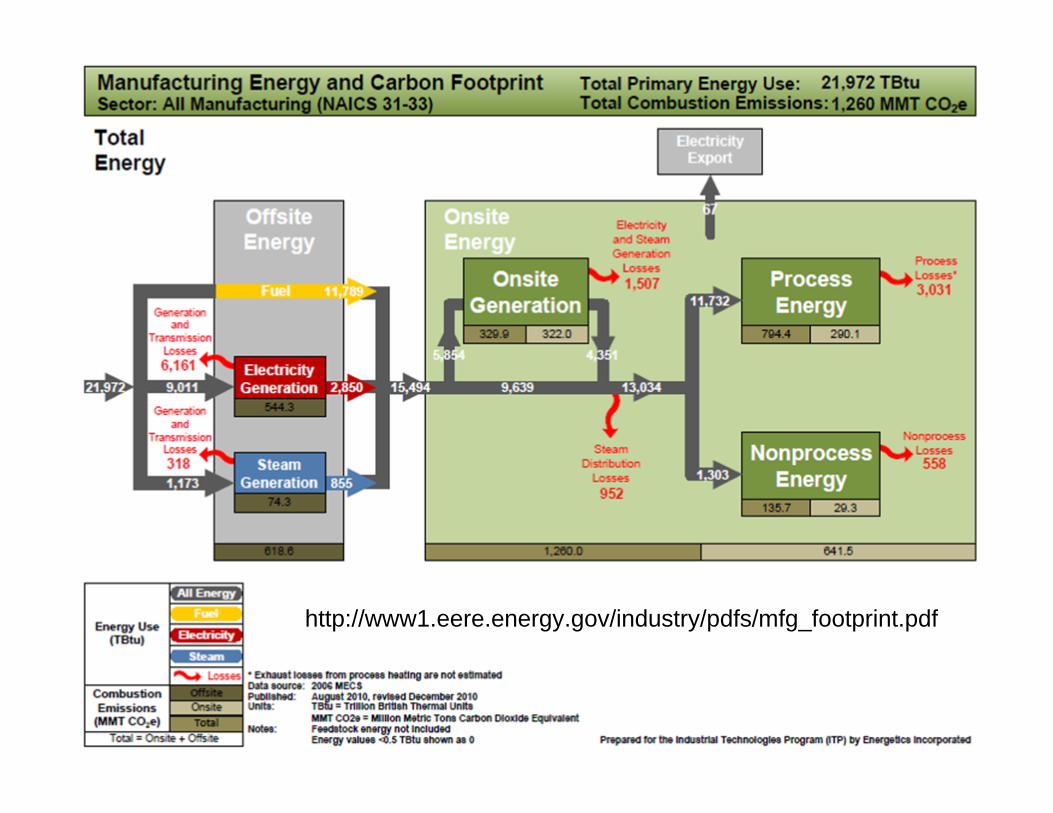
http://www1.eere.energy.gov/industry/pdfs/mfg_footprint.pdf

(c)2009 Energy Pathfinder Mangement Consulting, LLC www.energypathfinder.com 13
PLANT BOUNDARY
U.S. INDUSTRY AVERAGE ENERGY DOLLARBREAKDOWN OF PRIMARY ENERGY SUPPLY
SOURCE: http://www1.eere.energy.gov/industry/pdfs/mfg_footprint.pdf
NET APPLIED TO WORK
$0.40 – Process$0.03 – Non-Process$0.43 – Total
$0.17
CONVERSION LOSS
$0.04
ONSITE DISTRIBUTION LOSSCENTRAL PLANT LOSS
$0.07
$0.29GENERATION,
TRANSMISSION,DISTRIBUTION
LOSSESPRIOR TO DELIVERY
13
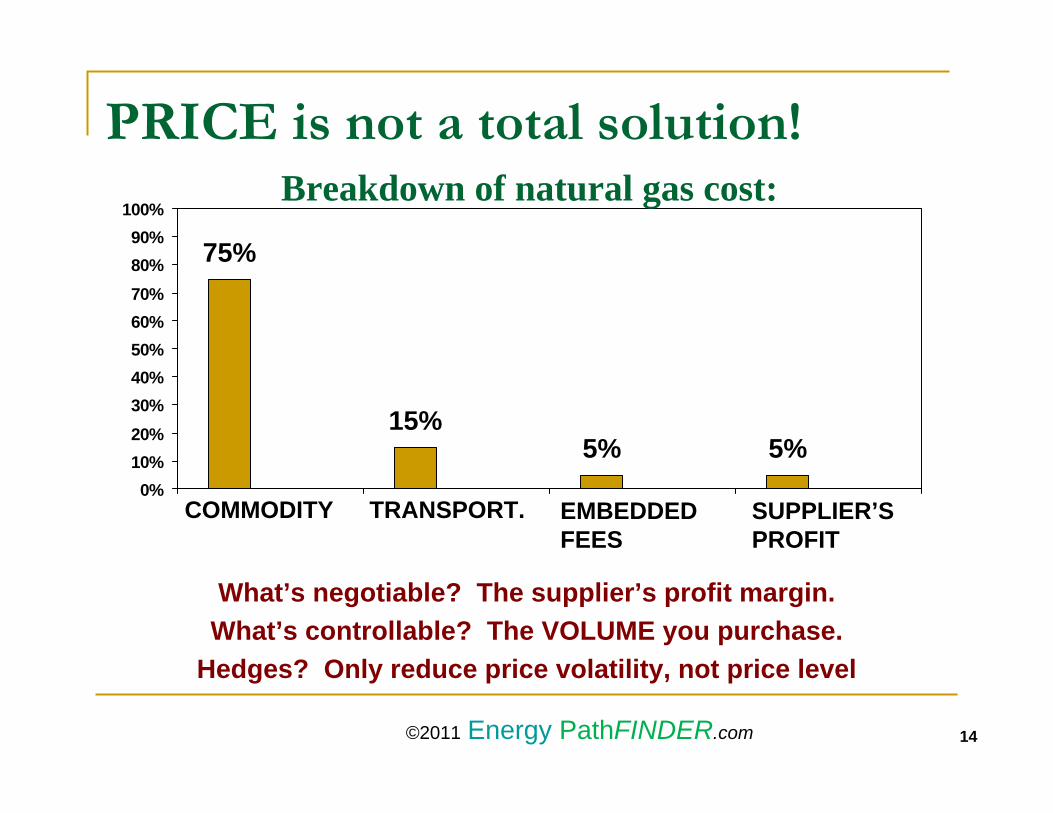
PRICE is not a total solution!
What’s negotiable? The supplier’s profit margin.What’s controllable? The VOLUME you purchase.
Hedges? Only reduce price volatility, not price level
75%
15%5% 5%
0%10%20%30%40%50%60%70%80%90%
100%Breakdown of natural gas cost:
COMMODITY TRANSPORT. EMBEDDED FEES
SUPPLIER’SPROFIT
14©2011 Energy PathFINDER.com

Waste Raises the “Price” of Fuel
SEQUENCE OF ACTIVITYQUANTITY
(MMBtu)INCREMENTAL
VALUE
EXPENDITUREPER MMBtu
“AVAILABLE”
Fuel delivered “to the fence”Losses from combustion = 10 percent*
100,000-10,000
$500,000-$50,000
$5.00
Example:Purchase 100,000 MMBtu@ $5.00 per MMBtu
Heat available for distributionLosses from distribution = 6 percent*
90,000-6,000
$450,000-$30,000
$5.56
Energy available to perform process workTotal energy losses = 39 percent*
61,000-39,000
$300,000-$200,000
$8.20
Heat available for conversion to workLosses from heat-to-work conversion = 24
percent*
84,000-24,000
$420,000-$120,000
$5.95
When natural gas costs $5.00/MMBTU, the average U.S. industrial facility experiences
waste that leads to an expenditure of $8.20 per “available” MMBtu!*SOURCE: http://www1.eere.energy.gov/industry/pdfs/mfg_footprint.pdf
15©2011 Energy PathFINDER.com
(c)2009 Energy Pathfinder Mangement Consulting, LLC www.energypathfinder.com 16
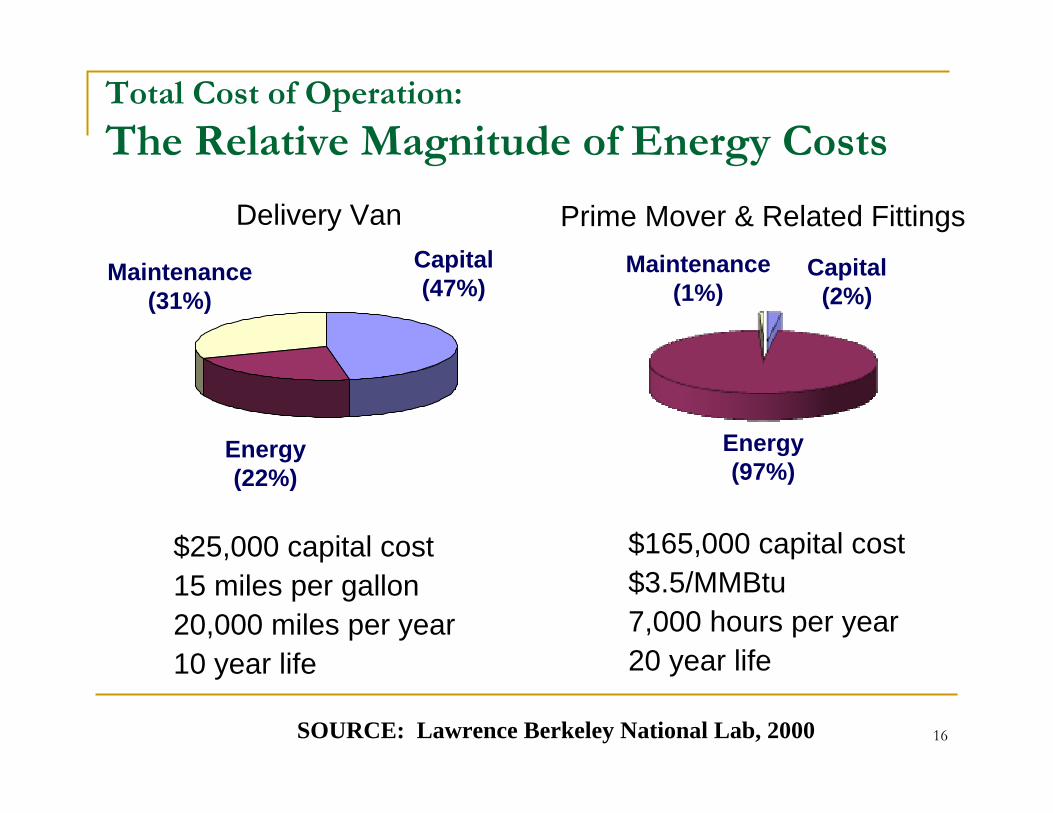
Total Cost of Operation:
The Relative Magnitude of Energy Costs
Capital (2%)
Energy (97%)
$25,000 capital cost15 miles per gallon20,000 miles per year10 year life
Capital (47%)
Energy (22%)
$165,000 capital cost$3.5/MMBtu7,000 hours per year20 year life
Delivery Van Prime Mover & Related Fittings
Maintenance(31%)
Maintenance(1%)
SOURCE: Lawrence Berkeley National Lab, 2000

One Asset, Two Price Tags
Capital (2%)
Energy (97%)
$165,000 capital cost$3.5/MMBtu7,000 hours per year20 year life
Prime Mover & Related Fittings*example*
Maintenance (1%)
FIRST PRICE TAG: $165,000Result of instantaneous decisions: - Capital budget process- Vendor negotiation- Decision makers:procurement director, finance director
SECOND PRICE TAG: $8,085,000Energy: $8,002,500 over 20 yrs.Maintenance: $82,500 over 20 yrsReflects many decisions over 20 yrs:- Maintenance personnel practices- Dozens of machine operators’ choices- Asset management choices- Generations of management changes
17©2011 Energy PathFINDER.com

(c)2009 Energy Pathfinder Mangement Consulting, LLC www.energypathfinder.com 18
MONEYMONEY FUEL &ELECTRICITY
HEAT, PRESSURE& MOTIVE POWER
PRODUCTS TO SELL
ACCOUNTS
PURCHASE ORDERS
INVOICES
BUDGETS
EXPENSE REPORTS
RECEIVABLES
RECEIPTS
DEPOSITS
DIVIDENDS
PAYABLES
KILOWATT-HRS.
THERMS
STEAM- LBS./HR
HORSEPOWER
CUBIC FEET/MIN.
DEGREES FARENHEIT
WE USE MONEY TOBUY ENERGY TO MAKE MONEY.
WE TRACK MONEY.WHY NOT ENERGY?
LABOR HRS & RATES
EPS
PSIG/PSIA
18

ENERGY IS ALWAYS WORKING.Energy that doesn’t create wealth destroys it.
WEALTHDESTROYED
HEAT, FRICTION, &CHEMICAL REACTIONS
DESTROY PLANT & EQUIPMENT,CREATE LIABILITIES
WEALTHCREATED
TRANSFORMATIONOF INPUTS INTO
FINAL PRODUCTSHEAT, PRESSURE,& MOTIVEPOWER
FUGITIVE ENERGY
COMMITTED ENERGY
FUEL &ELECTRICITY
Your Energy at Work: Create or Destroy?
19©2011 Energy PathFINDER.com

A FACILITY CAN BE…
AN ATM MACHINE!©2011 Energy PathFINDER 20

Facilities Management 2.0
Facilities = a profit center Monetize your energy position A compelling business case Success = show value created Contribution to cash flow and
growth
21©2011 Energy PathFINDER.com
FUTURE-PROOFYour facility AND your job

22
Business Proposition for Energy Projects
ACCEPT REJECT
GET Gross annual energy savings
Satisfaction of no capital expenditure?
GIVE UP Annualized project cost Annual cost of doing nothing
+FREE CASH FLOW
-ANNUAL PENALTY
©2011 Energy PathFINDER

“Well, gentlemen, there’s your problem.”
23

GRANVILLE STREET, VANCOUVER 1967
QUESTIONS?