financing an esop - vermont employee ownership center ... · term loan repayment xyz e esop bank. 7...
TRANSCRIPT
Vermont Employee Ownership CenterSixth Annual Employee Ownership Conference
Financing an ESOP
Burlington, VTJune 6, 2008
Copyright © 2008 by SES Advisors, Inc. All rights reserved.
1
Program Agenda
Basic Leveraged ESOP Structure
Types of Money
Financing a <100% ESOP
Financing a 100% ESOP
Second Stage ESOP Financing
Banking Market Today
Preparing For Your Bank Meeting
2
Basic Leveraged ESOP Structure
Leveraged ESOPs StructureOutside loan vs. inside loanLoan termsAnnual contribution limits
Differences Between Inside and Outside LoansRelease of sharesLoan “Sizing”
Credit and collateral capacities
3
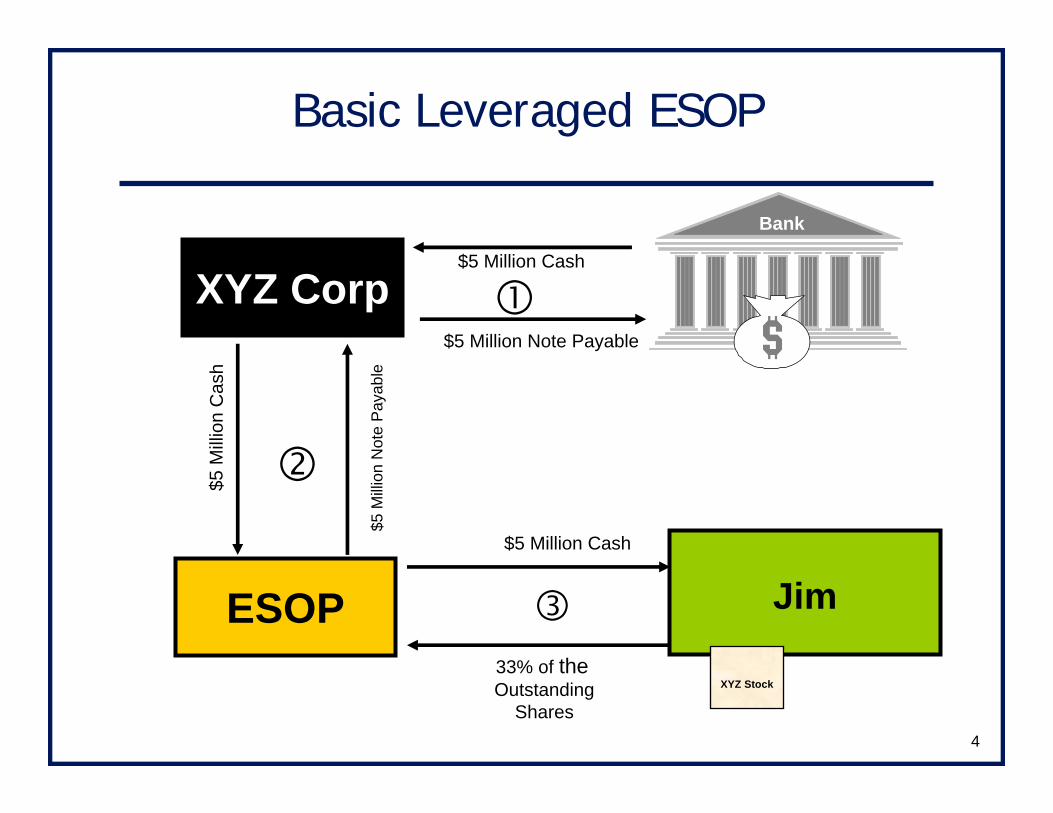
Basic Leveraged ESOP: Example
XYZ Company has been valued at $15 million on a minority, non-marketable basis
ESOP purchases 33% of XYZ’s stock from Jim for $5 million
The stock purchase is financed with a $5 million loan, which will be repaid over time
4
Bank
$5 Million Note Payable
$5 Million Cash
$5 M
illi o
n C
a sh
$5 M
illion
Not
e P
ayab
le
$5 Million Cash
33% of theOutstanding
Shares
Basic Leveraged ESOP
XYZ Corp
ESOP Jim
XYZ Stock

5
Repayments of Inside & Outside Loans
The company will make annual tax deductiblecontributions to the ESOP
Limitations exist for the maximum contribution each year; generally, think “25% of eligible payroll”
C-corporations may also deduct dividend paid on ESOP stock so long as it is used to repay debt or paid out to plan participants
The ESOP will use the contributions it receives to make P&I payments on the debt that it borrowed from the company
The company will make P&I payments to the financial institution (not necessarily the same as payment from the ESOP)

6
1. Company makes tax deductiblecontribution and dividends to the ESOP
2. ESOP uses the contribution to repay its loan from company
3. Company repays Financial Institution (not necessarily the same as payment from ESOP)
Paying Off The DebtAn
nual
ESO
P C
ontri
b uti o
n an
d D
ivi d
ends
Loan
Rep
aym
ent
Term Loan Repayment
XYZ
ESOP
Bank

7
PamSandy
ESOP uses 2007 contribution to pay its note ESOP uses 2007 contribution to pay its note –– this this ““releasesreleases”” shares from suspense accountshares from suspense account
Shares are allocated in proportion to compensationShares are allocated in proportion to compensation
During 2008, new employees enter ESOPDuring 2008, new employees enter ESOP
ESOP uses 2008 contributions and ESOP uses 2008 contributions and dividends/distributions from the company and then dividends/distributions from the company and then pays for more shares pays for more shares
Separated employees generally do not get allocation Separated employees generally do not get allocation of sharesof shares
Process repeats annually until all ESOP shares have Process repeats annually until all ESOP shares have been put into accountsbeen put into accounts
Hypothetical Allocation
Len Tom
Suspense Account

8
Pre-Transaction Balance Sheet
CURRENT ASSETS CURRENT LIABILITIES
Cash 1,346,890$ A/P 681,631$
A/R, net 4,119,018 Accrued expenses 1,819,033 Inventory 564,457 Current portion, LTD 471,286
WIP 2,459,163 Total Current Liabilities 2,971,950
Total Current Assets 8,489,528
PROPERTY AND EQUIPMENT
PP&E, cost 3,926,783 Long-term debt 488,410
Less: Accum Depr (2,574,892) Total Liabilities 3,460,359 1,351,891
OWNERS' EQUITY
CS, PIC & Ret Earnings 10,809,351 (Treasury stock) (4,134,563)
OTHER ASSETS 293,728 Owners' equity 6,674,788 Total Assets 10,135,147$ Total Liabs & OE 10,135,147$
Total Debt to Net Worth 14%

9
Post-ESOP Balance Sheet(GAAP Accounting, SOP 93-6)
CURRENT ASSETS CURRENT LIABILITIES
Cash 1,346,890$ A/P 681,631$
A/R, net 4,119,018 Accrued expenses 1,819,033 Inventory 564,457 Current portion, LTD 971,286
WIP 2,459,163 Total Current Liabilities 3,471,950
Total Current Assets 8,489,528
PROPERTY AND EQUIPMENT
PP&E, cost 3,926,783 Long-term debt 4,988,410
Less: Accum Depr (2,574,892) Total Liabilities 8,460,359 1,351,891
OWNERS' EQUITY
CS, PIC & Ret Earnings 10,809,351 Unearned ESOP Shares (5,000,000) (Treasury stock) (4,134,563)
OTHER ASSETS 293,728 Owners' equity 1,674,788 Total Assets 10,135,147$ Total Liabs & OE 10,135,147$
Total Debt to Net Worth 356%
10
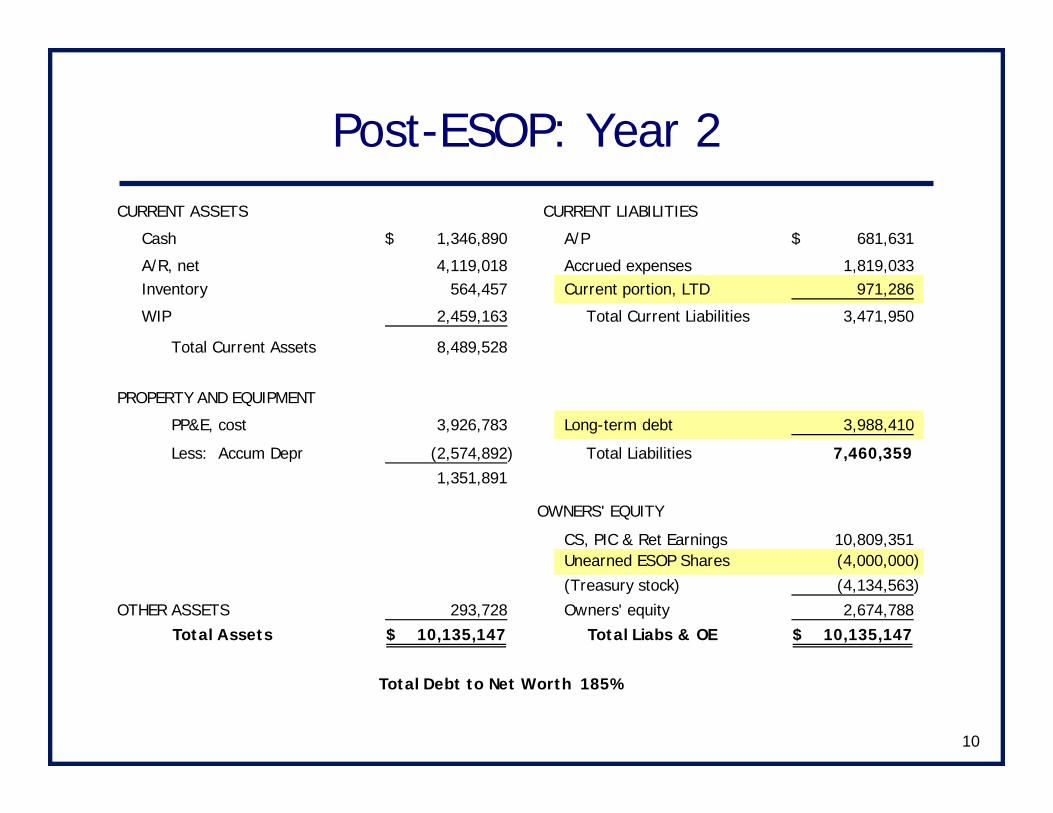
Post-ESOP: Year 2CURRENT ASSETS CURRENT LIABILITIES
Cash 1,346,890$ A/P 681,631$
A/R, net 4,119,018 Accrued expenses 1,819,033 Inventory 564,457 Current portion, LTD 971,286
WIP 2,459,163 Total Current Liabilities 3,471,950
Total Current Assets 8,489,528
PROPERTY AND EQUIPMENT
PP&E, cost 3,926,783 Long-term debt 3,988,410
Less: Accum Depr (2,574,892) Total Liabilities 7,460,359 1,351,891
OWNERS' EQUITY
CS, PIC & Ret Earnings 10,809,351 Unearned ESOP Shares (4,000,000) (Treasury stock) (4,134,563)
OTHER ASSETS 293,728 Owners' equity 2,674,788 Total Assets 10,135,147$ Total Liabs & OE 10,135,147$
Total Debt to Net Worth 185%

11
Bank Financing
Pre-tax financing
Loan sizing
Collateral capacity
Cash flow capacity
Typical terms and conditions
12
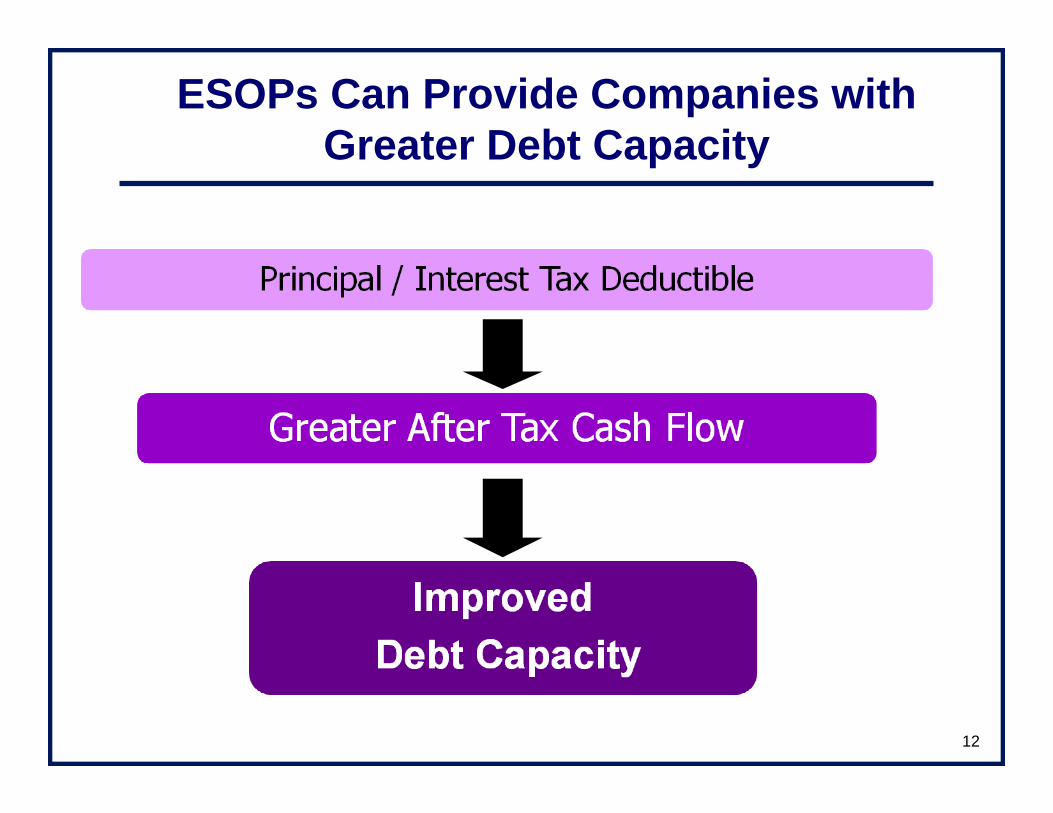
ESOPs Can Provide Companies with Greater Debt Capacity
13
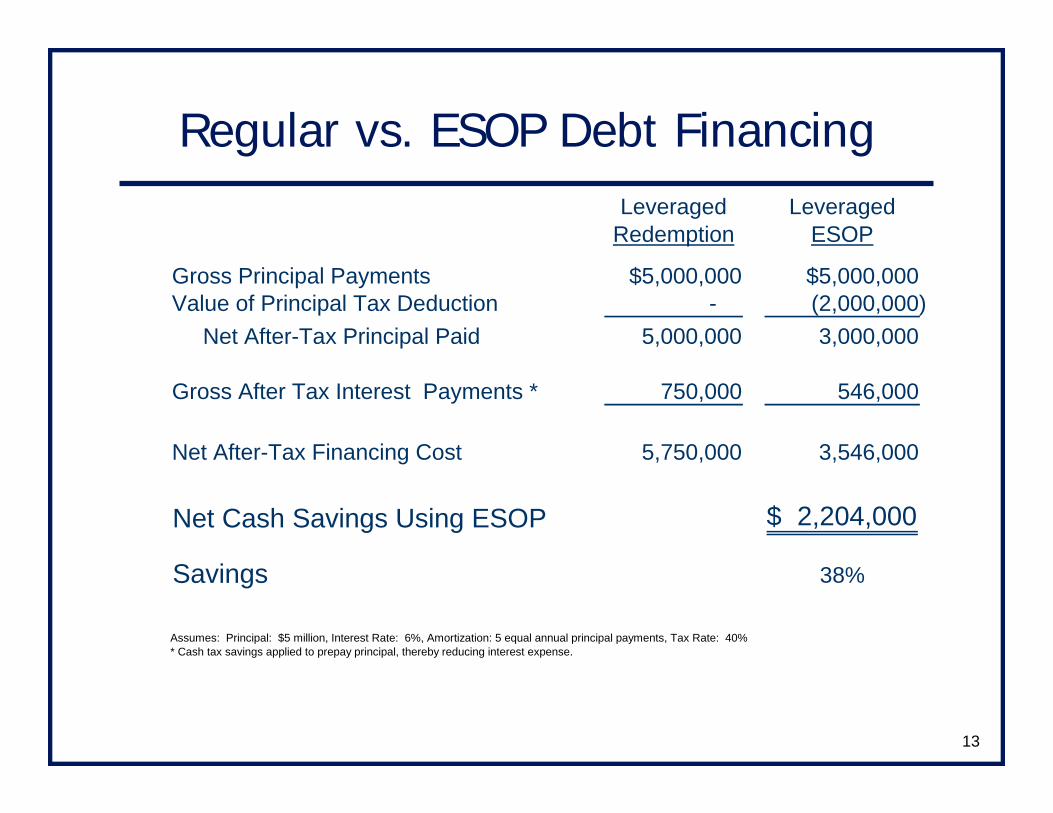
Regular vs. ESOP Debt FinancingLeveraged Leveraged
Redemption ESOP
Gross Principal Payments $5,000,000 $5,000,000Value of Principal Tax Deduction - (2,000,000) Net After-Tax Principal Paid 5,000,000 3,000,000
Gross After Tax Interest Payments * 750,000 546,000
Net After-Tax Financing Cost 5,750,000 3,546,000
Net Cash Savings Using ESOP 2,204,000$
Savings 38%
Assumes: Principal: $5 million, Interest Rate: 6%, Amortization: 5 equal annual principal payments, Tax Rate: 40%* Cash tax savings applied to prepay principal, thereby reducing interest expense.

14
Loan “Sizing”
How much will the lenders lend?Balance sheet debt capacity
Cash flow debt capacity
How much should the company borrow?Estimating marginal borrowing capacity
15
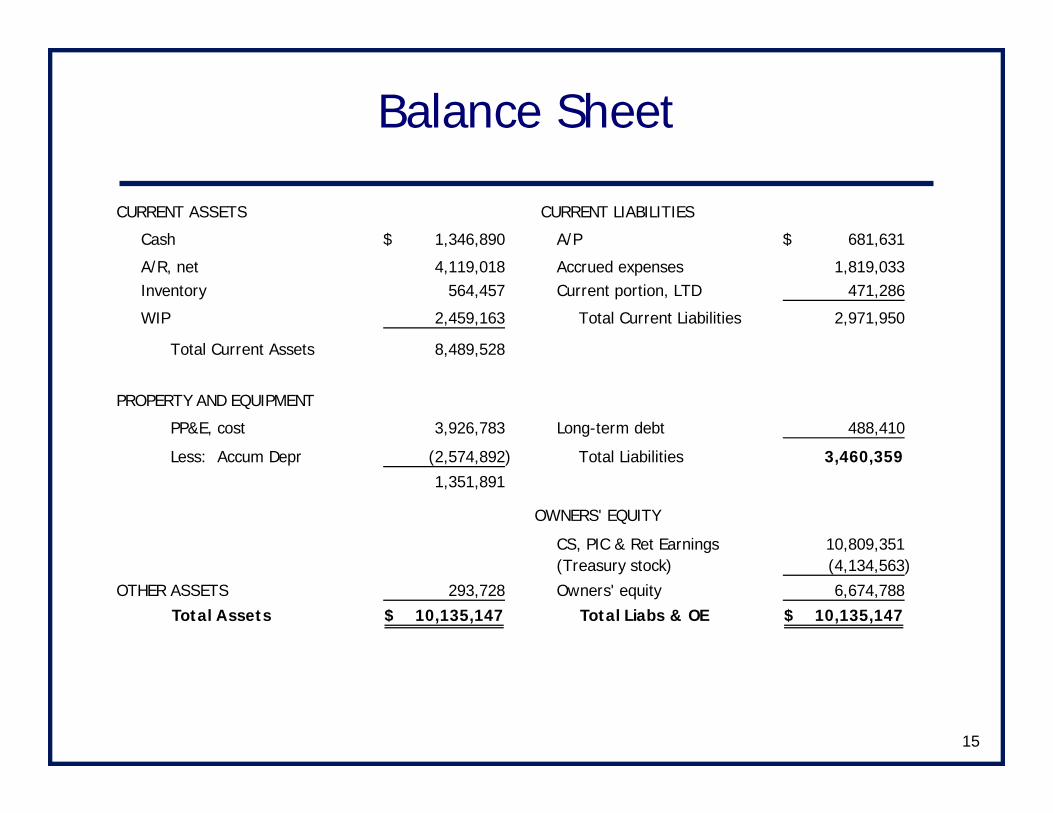
Balance Sheet
CURRENT ASSETS CURRENT LIABILITIES
Cash 1,346,890$ A/P 681,631$
A/R, net 4,119,018 Accrued expenses 1,819,033 Inventory 564,457 Current portion, LTD 471,286
WIP 2,459,163 Total Current Liabilities 2,971,950
Total Current Assets 8,489,528
PROPERTY AND EQUIPMENT
PP&E, cost 3,926,783 Long-term debt 488,410
Less: Accum Depr (2,574,892) Total Liabilities 3,460,359 1,351,891
OWNERS' EQUITY
CS, PIC & Ret Earnings 10,809,351 (Treasury stock) (4,134,563)
OTHER ASSETS 293,728 Owners' equity 6,674,788 Total Assets 10,135,147$ Total Liabs & OE 10,135,147$

16
Balance Sheet Collateral Capacity
Adjustment FMV Advance BorrowingAsset Cost to Cost Assets Rate Capacity
Cash 1,346,890$ -$ 1,346,890$ 0% -$
A/R, net 4,119,018 (163,937) 3,955,082 75% 2,966,311
Inventory 564,457 - 564,457 60% 338,674
WIP 2,459,163 - 2,459,163 0% -
PP&E, Net 1,351,891 250,000 1,601,891 60% 961,135 Other assets 293,728 - 293,728 0% -
10,135,147$ 86,063$ 10,221,210$ 4,266,120$
17
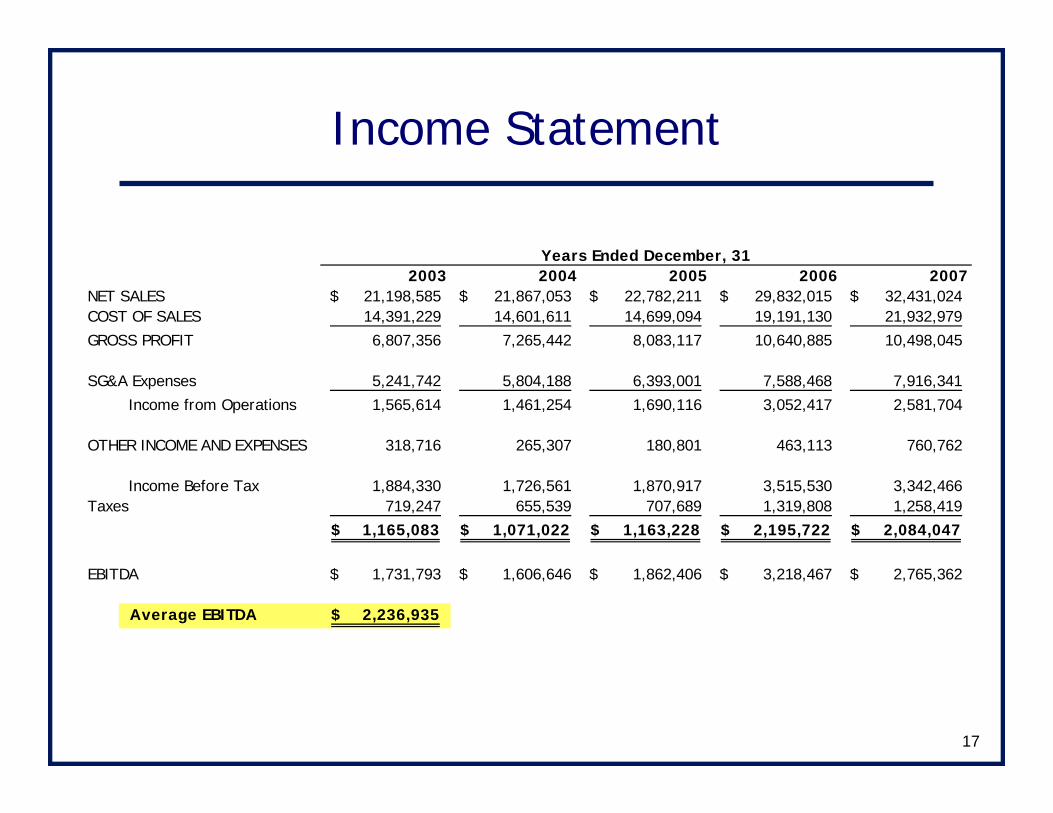
Income Statement
2003 2004 2005 2006 2007NET SALES 21,198,585$ 21,867,053$ 22,782,211$ 29,832,015$ 32,431,024$ COST OF SALES 14,391,229 14,601,611 14,699,094 19,191,130 21,932,979 GROSS PROFIT 6,807,356 7,265,442 8,083,117 10,640,885 10,498,045
SG&A Expenses 5,241,742 5,804,188 6,393,001 7,588,468 7,916,341 Income from Operations 1,565,614 1,461,254 1,690,116 3,052,417 2,581,704
OTHER INCOME AND EXPENSES 318,716 265,307 180,801 463,113 760,762
Income Before Tax 1,884,330 1,726,561 1,870,917 3,515,530 3,342,466 Taxes 719,247 655,539 707,689 1,319,808 1,258,419
1,165,083$ 1,071,022$ 1,163,228$ 2,195,722$ 2,084,047$
EBITDA 1,731,793$ 1,606,646$ 1,862,406$ 3,218,467$ 2,765,362$
Average EBITDA 2,236,935$
Years Ended December, 31
18
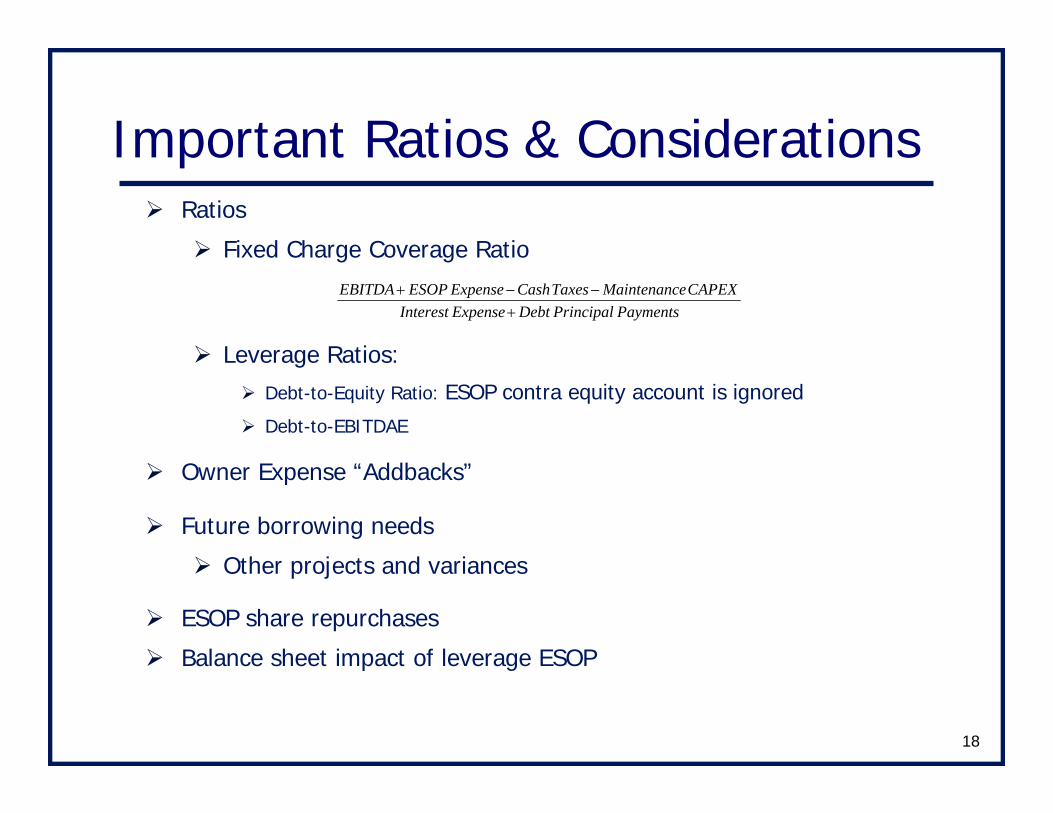
Important Ratios & ConsiderationsRatios
Fixed Charge Coverage Ratio
Leverage Ratios:Debt-to-Equity Ratio: ESOP contra equity account is ignored
Debt-to-EBITDAE
Owner Expense “Addbacks”
Future borrowing needs
Other projects and variances
ESOP share repurchases
Balance sheet impact of leverage ESOP
PaymentsncipalPriDebtExpenseInterestCAPEXenanceintMaTaxesCashExpenseESOPEBITDA
+−−+
19
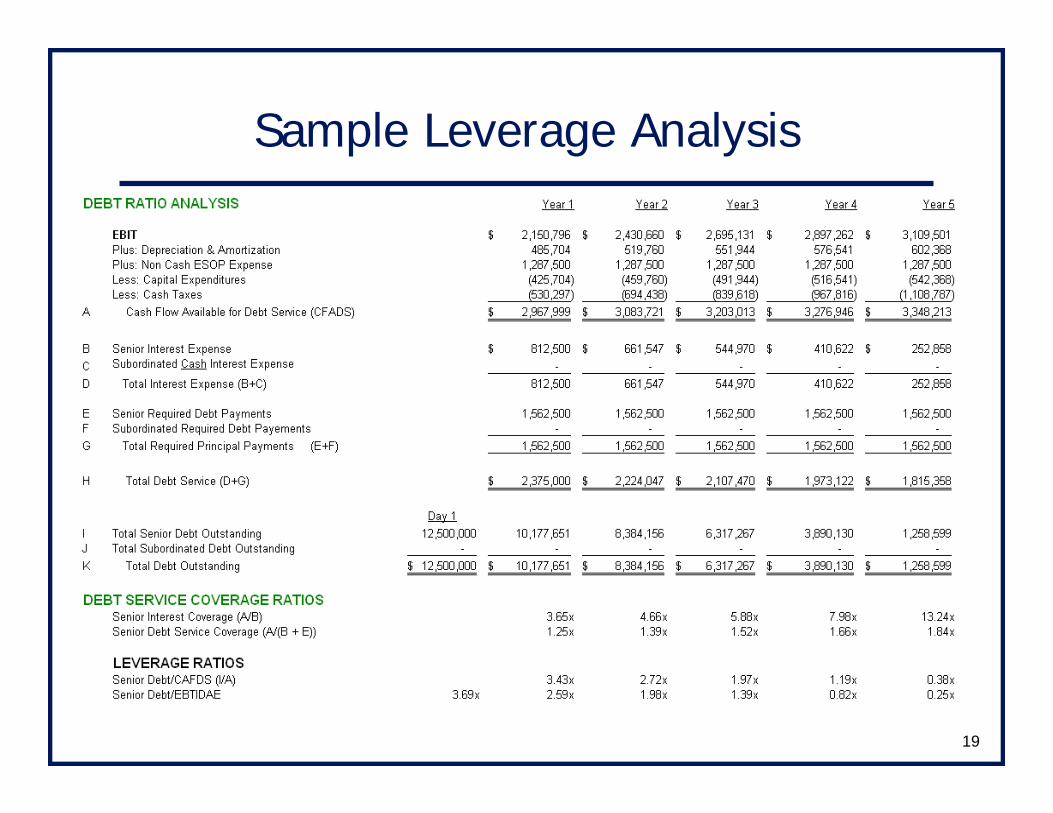
Sample Leverage Analysis
20
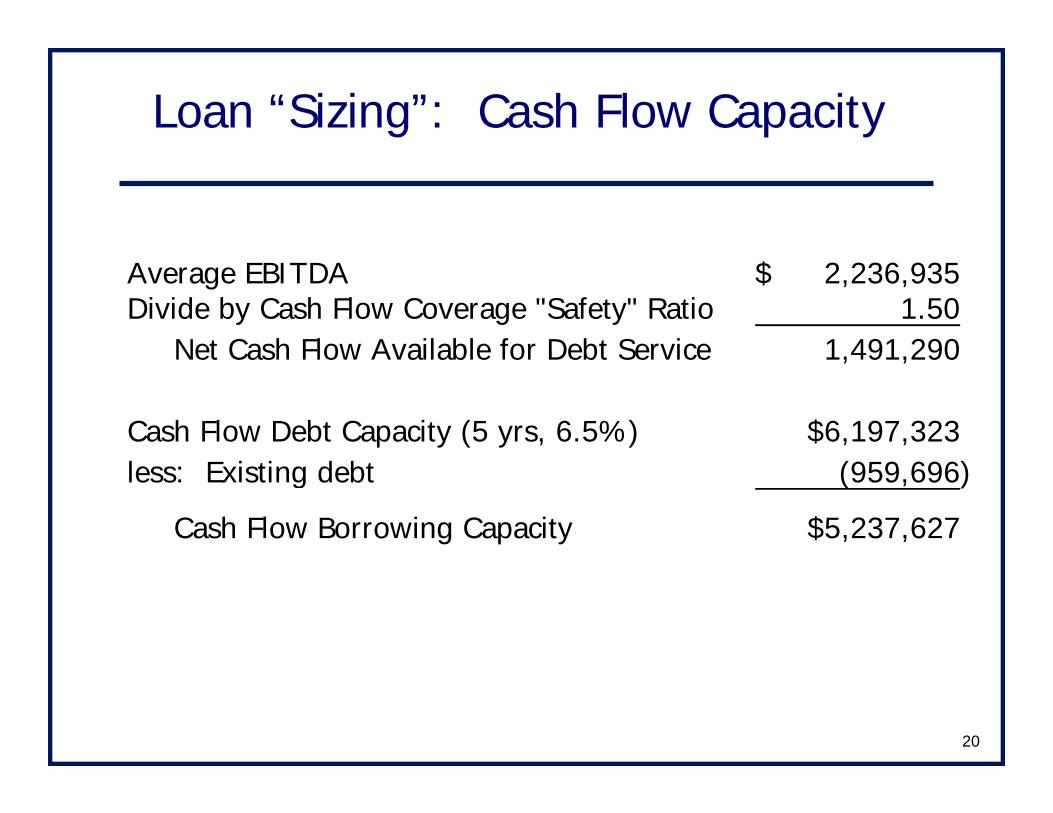
Loan “Sizing”: Cash Flow Capacity
Average EBITDA 2,236,935$ Divide by Cash Flow Coverage "Safety" Ratio 1.50 Net Cash Flow Available for Debt Service 1,491,290
Cash Flow Debt Capacity (5 yrs, 6.5%) $6,197,323less: Existing debt (959,696)
Cash Flow Borrowing Capacity $5,237,627
21
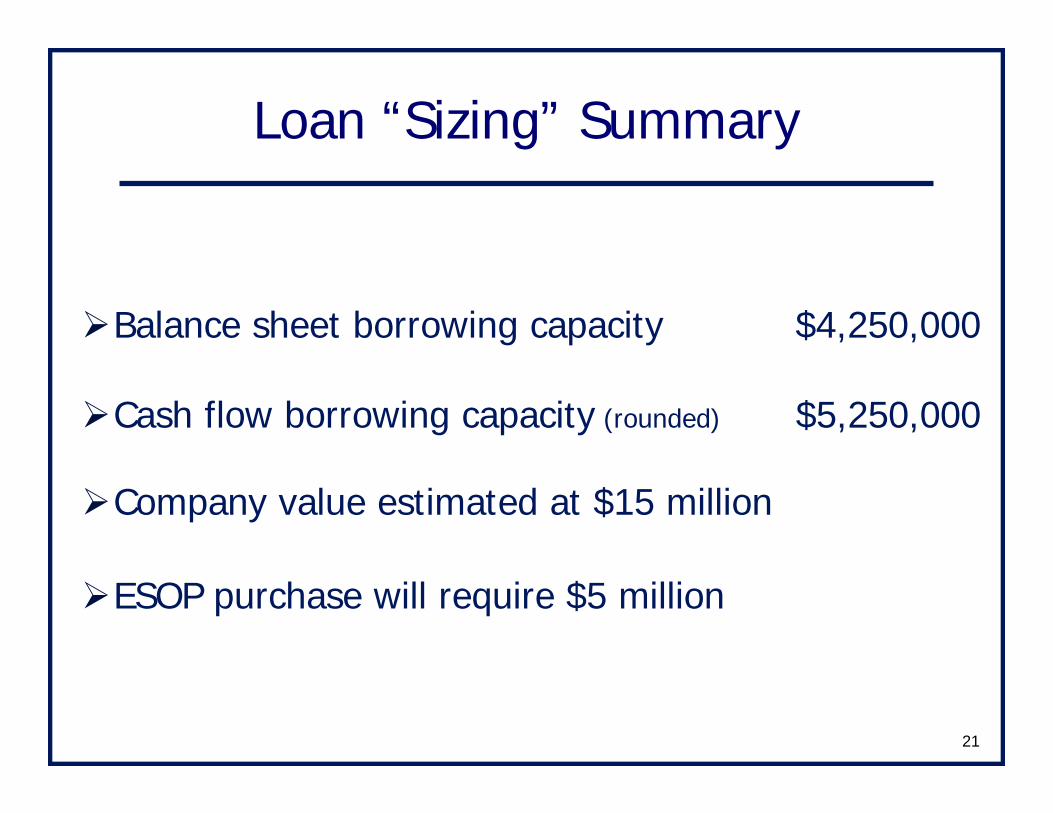
Loan “Sizing” Summary
Balance sheet borrowing capacity $4,250,000
Cash flow borrowing capacity (rounded) $5,250,000
Company value estimated at $15 million
ESOP purchase will require $5 million
22
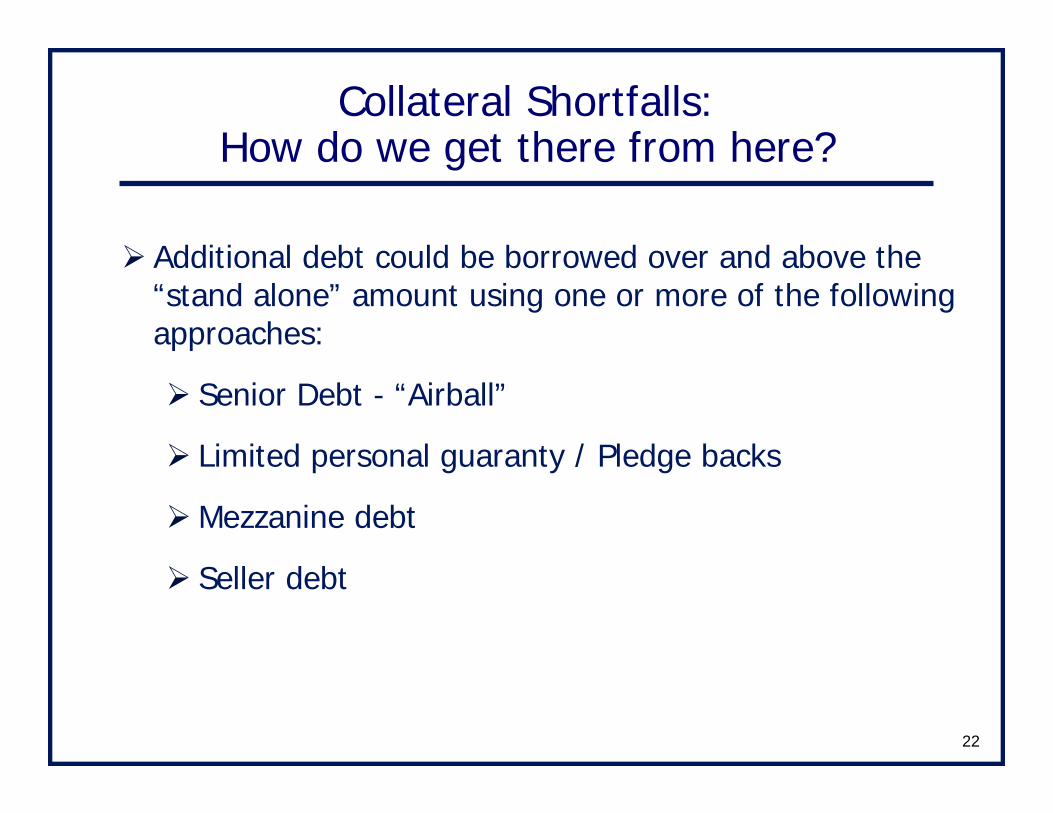
Collateral Shortfalls: How do we get there from here?
Additional debt could be borrowed over and above the “stand alone” amount using one or more of the following approaches:
Senior Debt - “Airball”
Limited personal guaranty / Pledge backs
Mezzanine debt
Seller debt
23
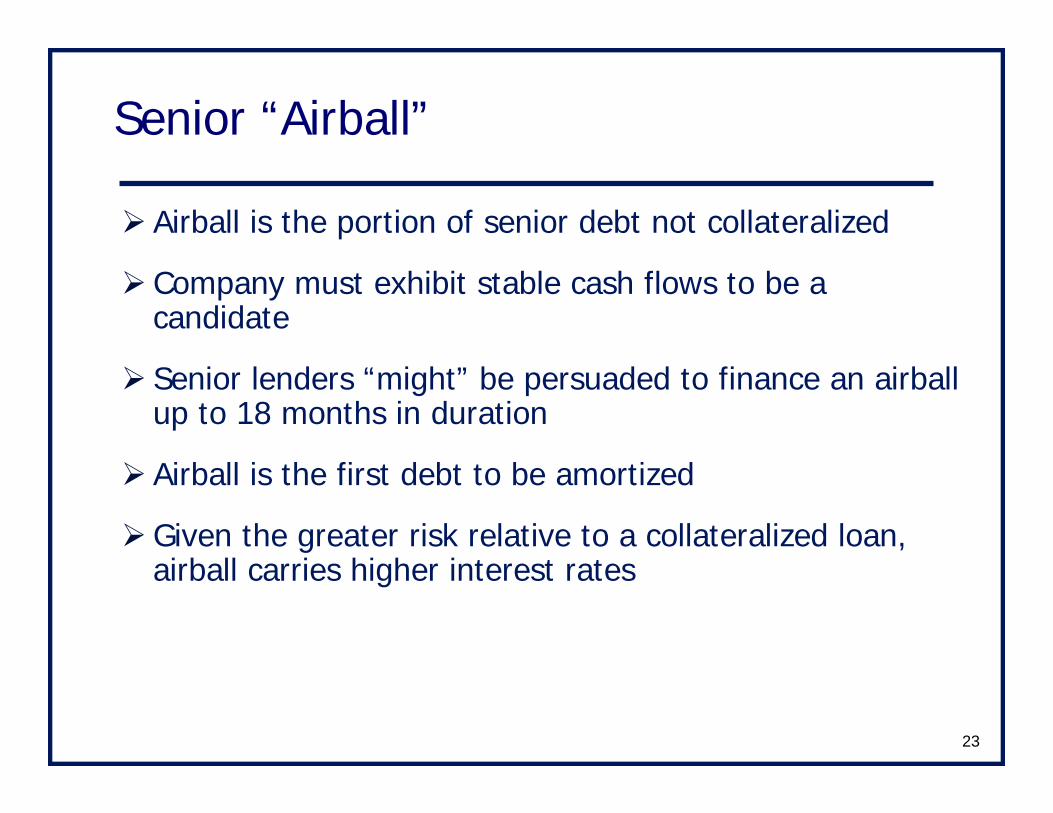
Senior “Airball”
Airball is the portion of senior debt not collateralized
Company must exhibit stable cash flows to be a candidate
Senior lenders “might” be persuaded to finance an airball up to 18 months in duration
Airball is the first debt to be amortized
Given the greater risk relative to a collateralized loan, airball carries higher interest rates

24
Limited Personal Guaranty
Selling shareholder makes a limited guaranty for the uncollateralized portion of the loan
Limited guarantee is secured by personal assets
Typically, sale proceeds are used as collateral to support limited guaranty
Limited guaranty typically “ratchets” down annually as company pays down principal and loan/value ratio decreases
25
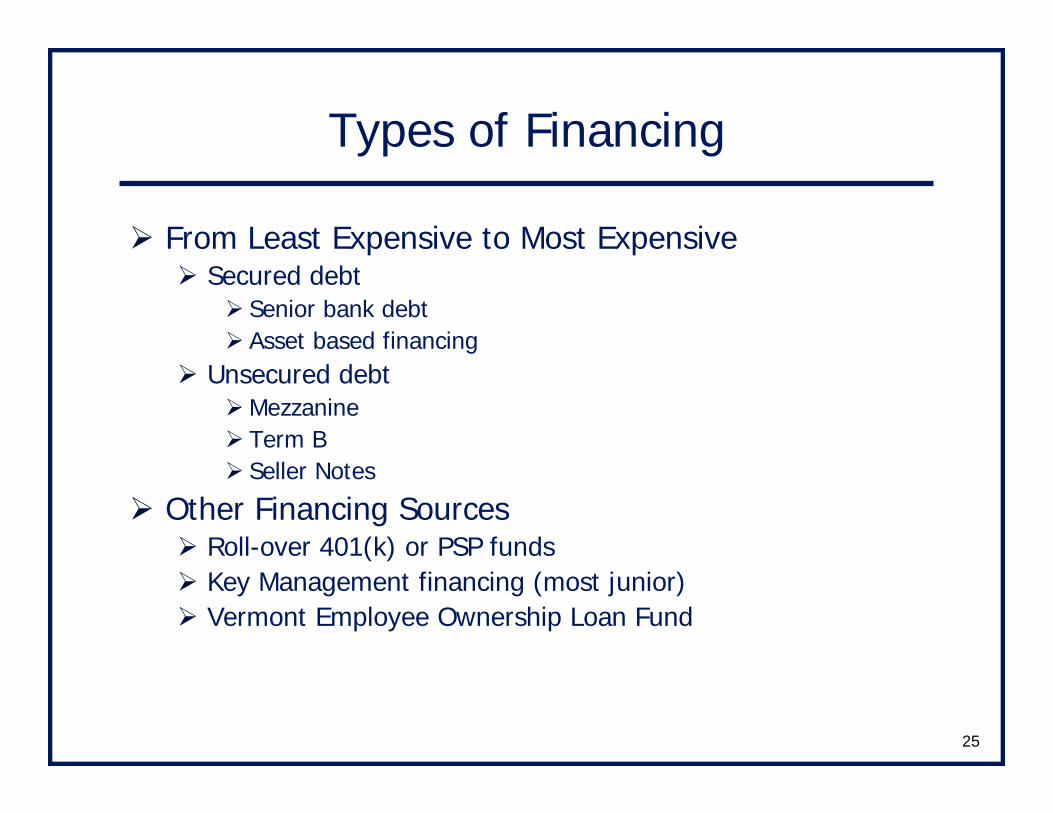
Types of Financing
From Least Expensive to Most ExpensiveSecured debt
Senior bank debtAsset based financing
Unsecured debtMezzanineTerm BSeller Notes
Other Financing SourcesRoll-over 401(k) or PSP fundsKey Management financing (most junior)Vermont Employee Ownership Loan Fund

26
Secured Debt
Commercial loan Most prevalent and least expensive form of secured debtThe low cost comes with more restrictive loan covenants and conditions than other forms of financingLoan terms do not typically exceed 7 yearsInterest rate pricing depends on total leverage, cash flow coverage and collateral quality
Asset based financing More monitoring and administration than commercial loanLoan amounts directly tied to value of the current asset base
27
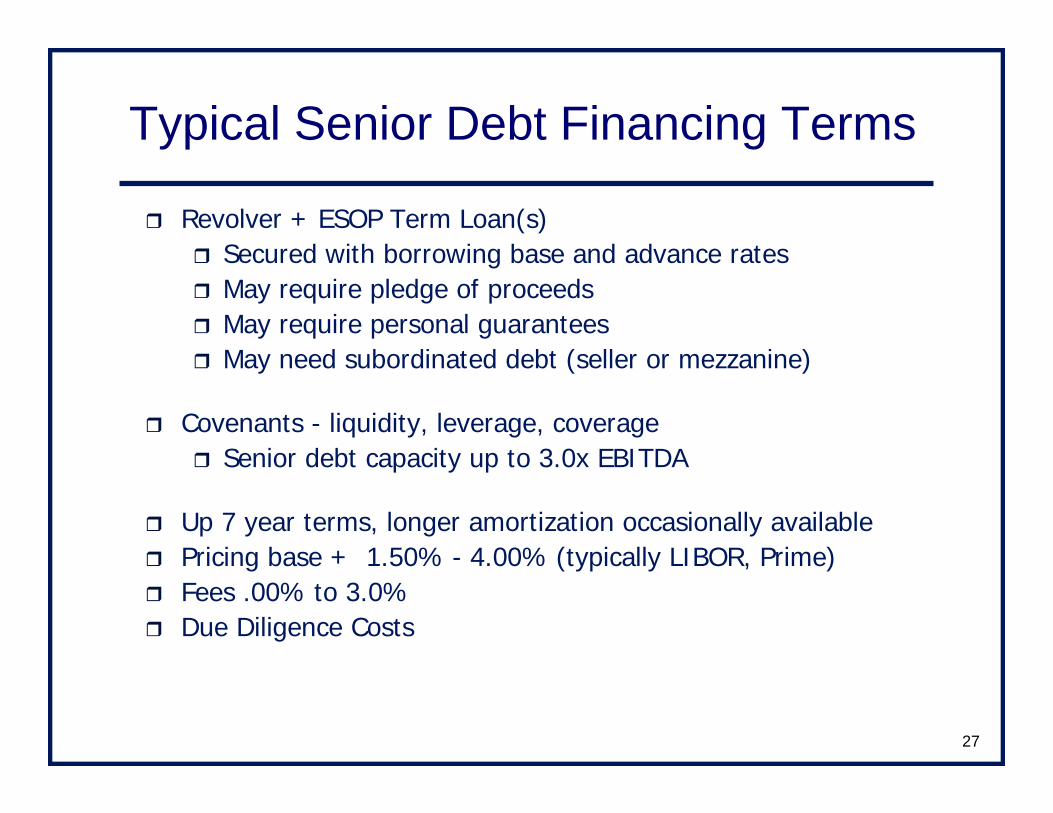
Revolver + ESOP Term Loan(s)Secured with borrowing base and advance ratesMay require pledge of proceedsMay require personal guaranteesMay need subordinated debt (seller or mezzanine)
Covenants - liquidity, leverage, coverageSenior debt capacity up to 3.0x EBITDA
Up 7 year terms, longer amortization occasionally availablePricing base + 1.50% - 4.00% (typically LIBOR, Prime)Fees .00% to 3.0%Due Diligence Costs
Typical Senior Debt Financing Terms
28
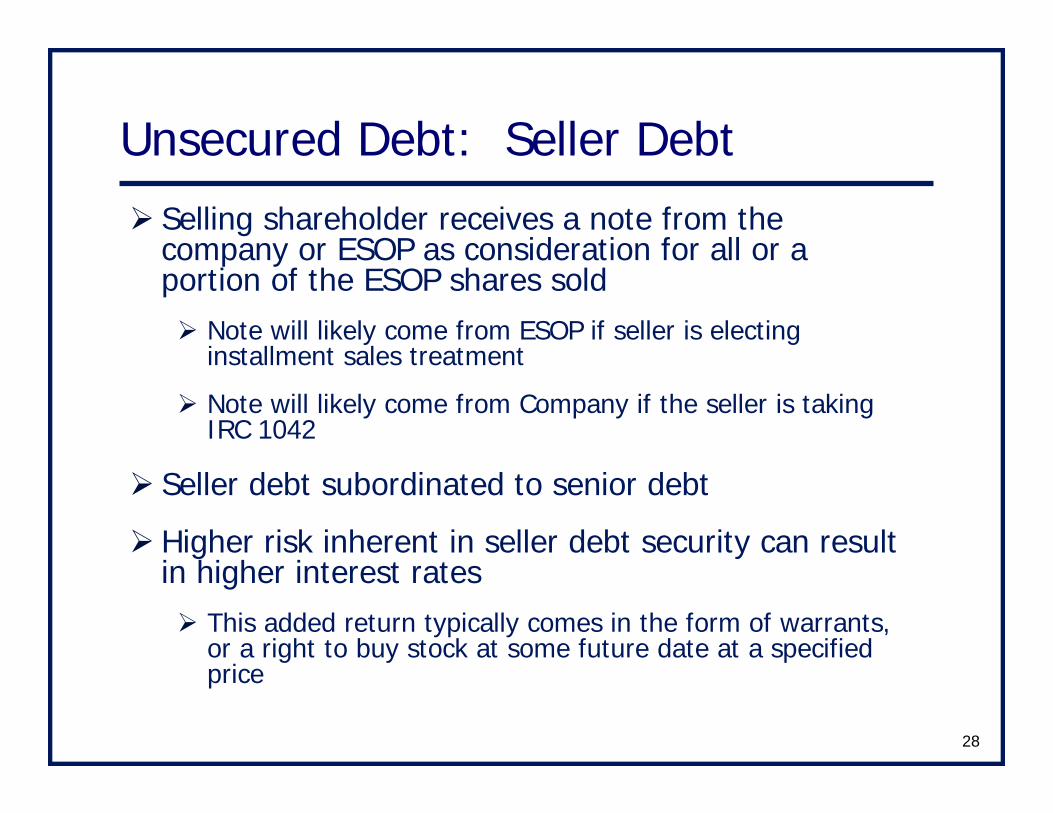
Unsecured Debt: Seller DebtSelling shareholder receives a note from the company or ESOP as consideration for all or a portion of the ESOP shares sold
Note will likely come from ESOP if seller is electing installment sales treatment
Note will likely come from Company if the seller is taking IRC 1042
Seller debt subordinated to senior debt
Higher risk inherent in seller debt security can result in higher interest rates
This added return typically comes in the form of warrants, or a right to buy stock at some future date at a specified price
29
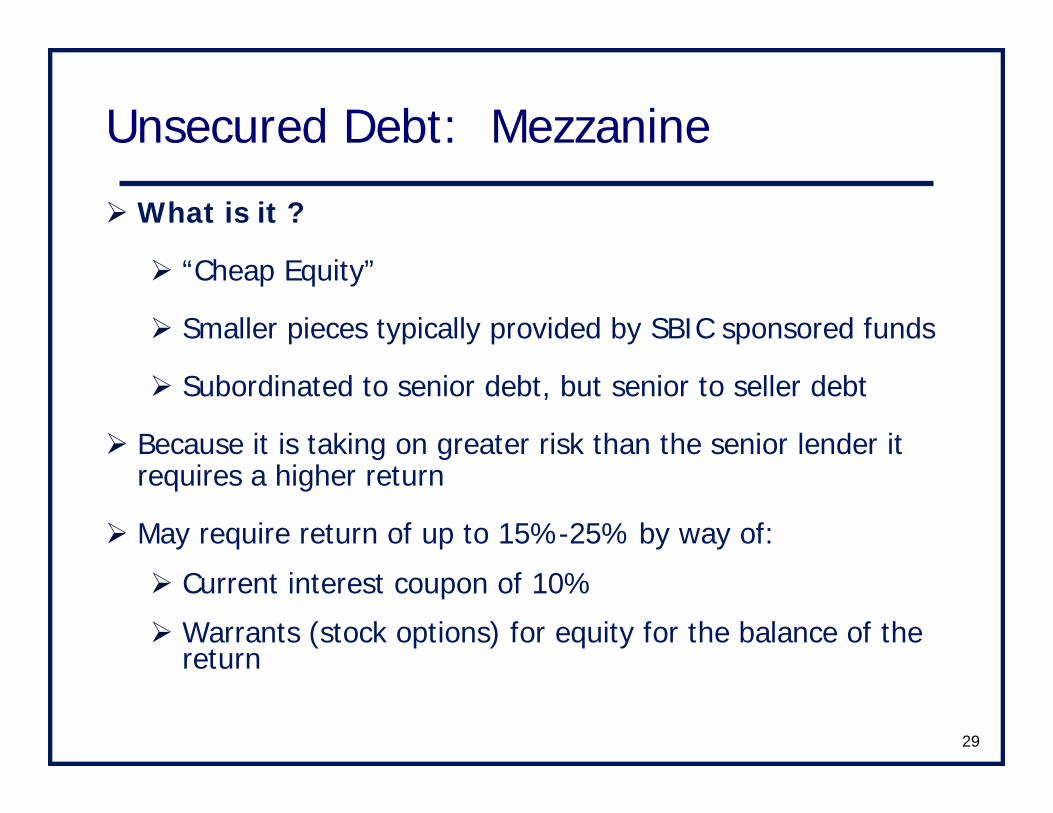
Unsecured Debt: Mezzanine
What is it ?
“Cheap Equity”
Smaller pieces typically provided by SBIC sponsored funds
Subordinated to senior debt, but senior to seller debt
Because it is taking on greater risk than the senior lender it requires a higher return
May require return of up to 15%-25% by way of:
Current interest coupon of 10%
Warrants (stock options) for equity for the balance of the return
30
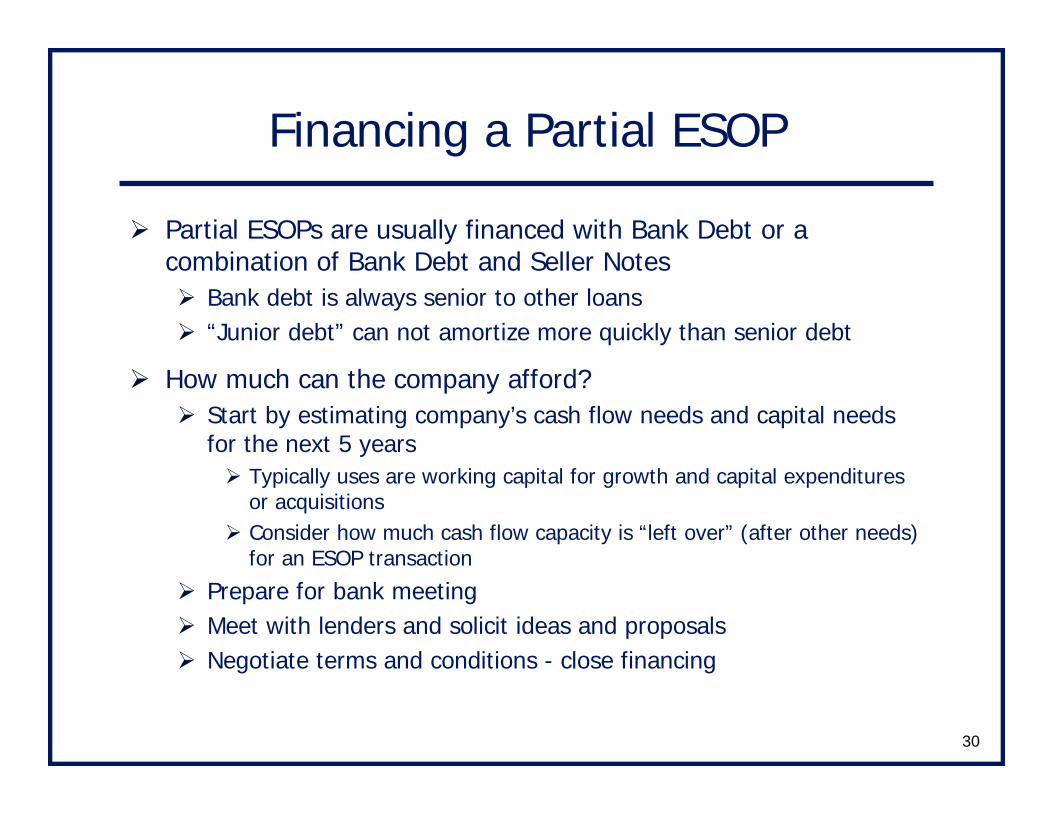
Financing a Partial ESOP
Partial ESOPs are usually financed with Bank Debt or a combination of Bank Debt and Seller Notes
Bank debt is always senior to other loans“Junior debt” can not amortize more quickly than senior debt
How much can the company afford?Start by estimating company’s cash flow needs and capital needs for the next 5 years
Typically uses are working capital for growth and capital expenditures or acquisitionsConsider how much cash flow capacity is “left over” (after other needs) for an ESOP transaction
Prepare for bank meetingMeet with lenders and solicit ideas and proposalsNegotiate terms and conditions - close financing
31
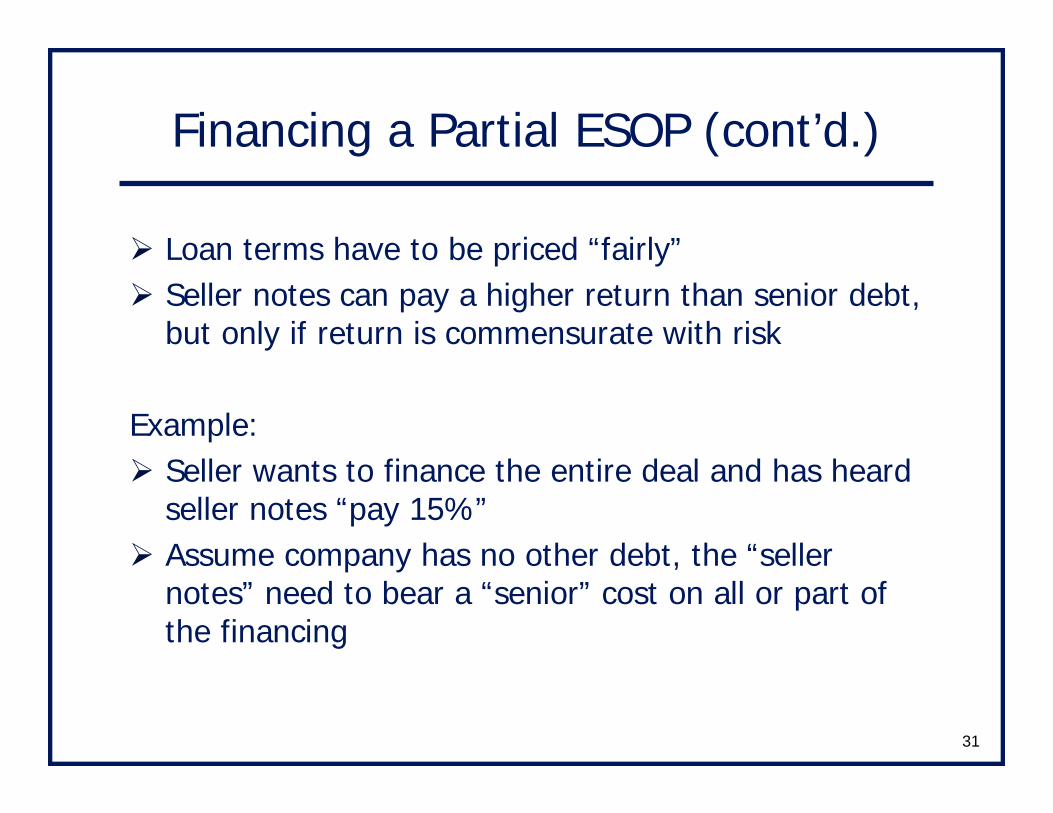
Financing a Partial ESOP (cont’d.)
Loan terms have to be priced “fairly”Seller notes can pay a higher return than senior debt, but only if return is commensurate with risk
Example:Seller wants to finance the entire deal and has heard seller notes “pay 15%”Assume company has no other debt, the “seller notes” need to bear a “senior” cost on all or part of the financing
32
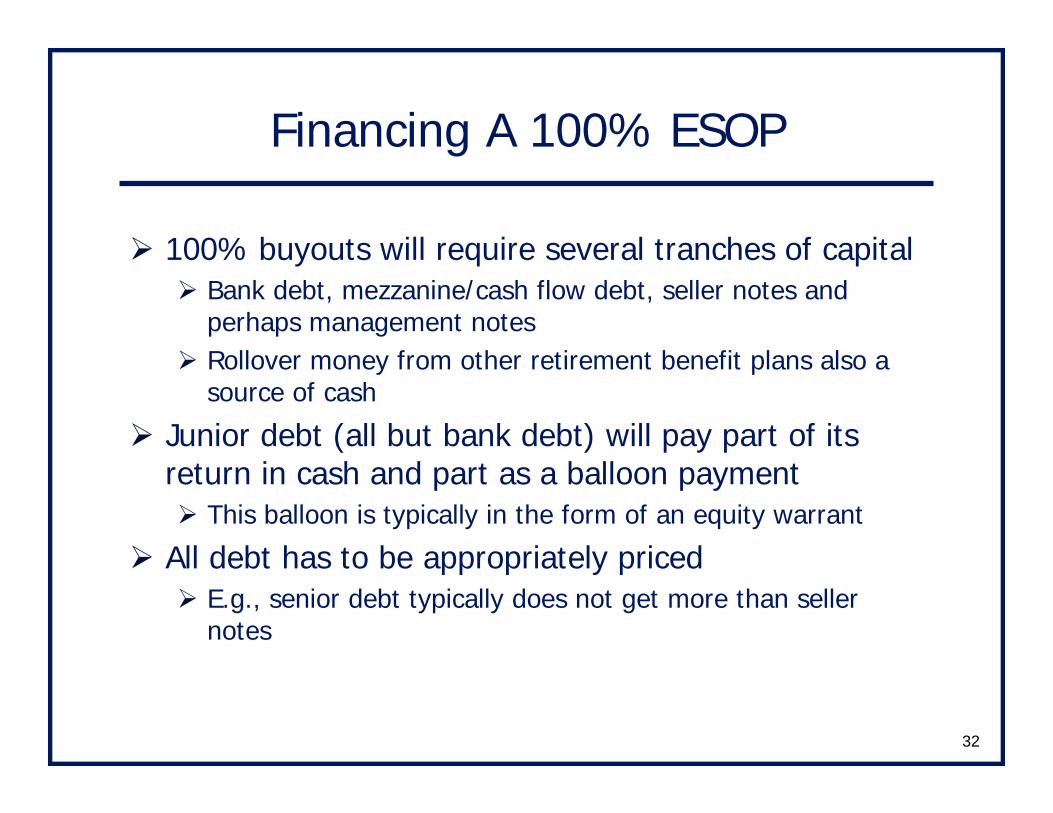
Financing A 100% ESOP
100% buyouts will require several tranches of capitalBank debt, mezzanine/cash flow debt, seller notes and perhaps management notesRollover money from other retirement benefit plans also a source of cash
Junior debt (all but bank debt) will pay part of its return in cash and part as a balloon payment
This balloon is typically in the form of an equity warrant
All debt has to be appropriately pricedE.g., senior debt typically does not get more than seller notes
33
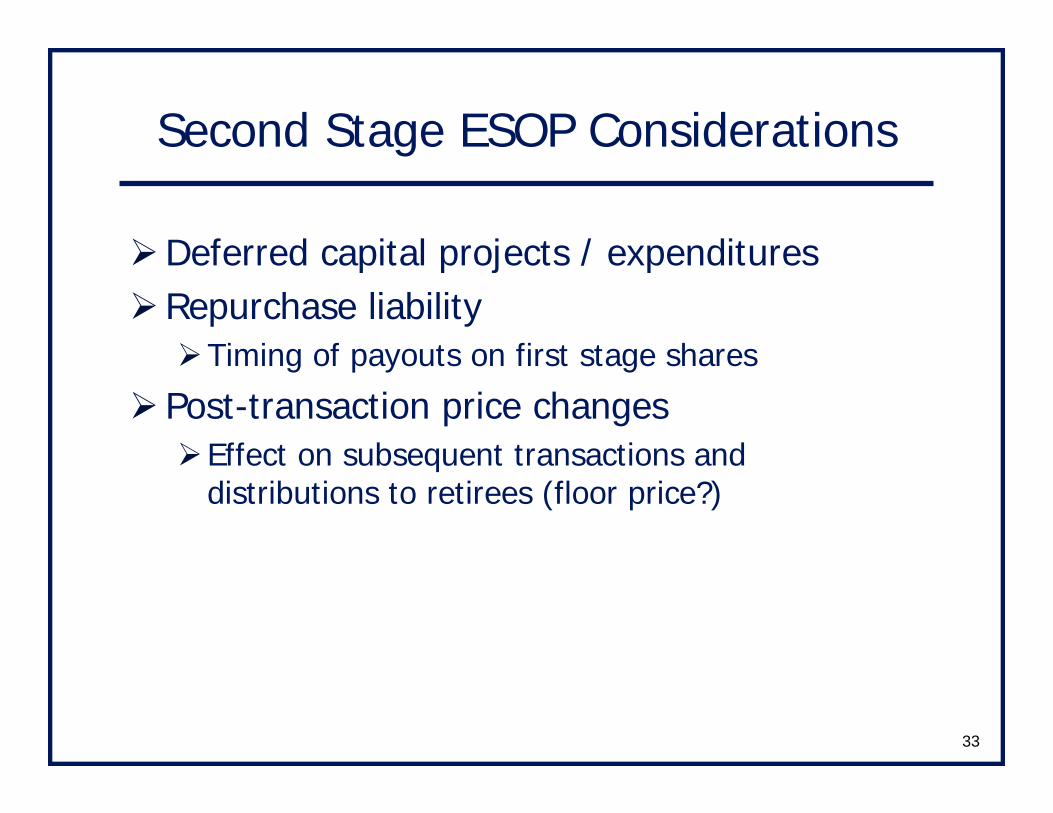
Second Stage ESOP Considerations
Deferred capital projects / expendituresRepurchase liability
Timing of payouts on first stage shares
Post-transaction price changesEffect on subsequent transactions and distributions to retirees (floor price?)
34
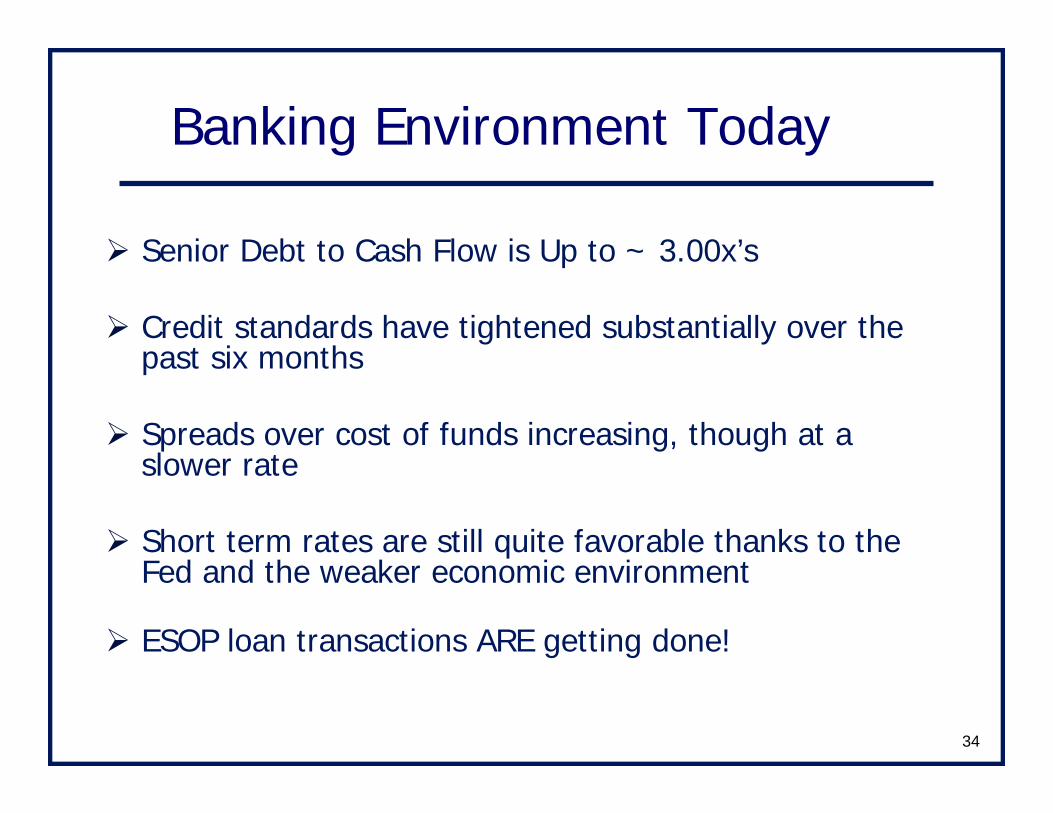
Banking Environment Today
Senior Debt to Cash Flow is Up to ~ 3.00x’s
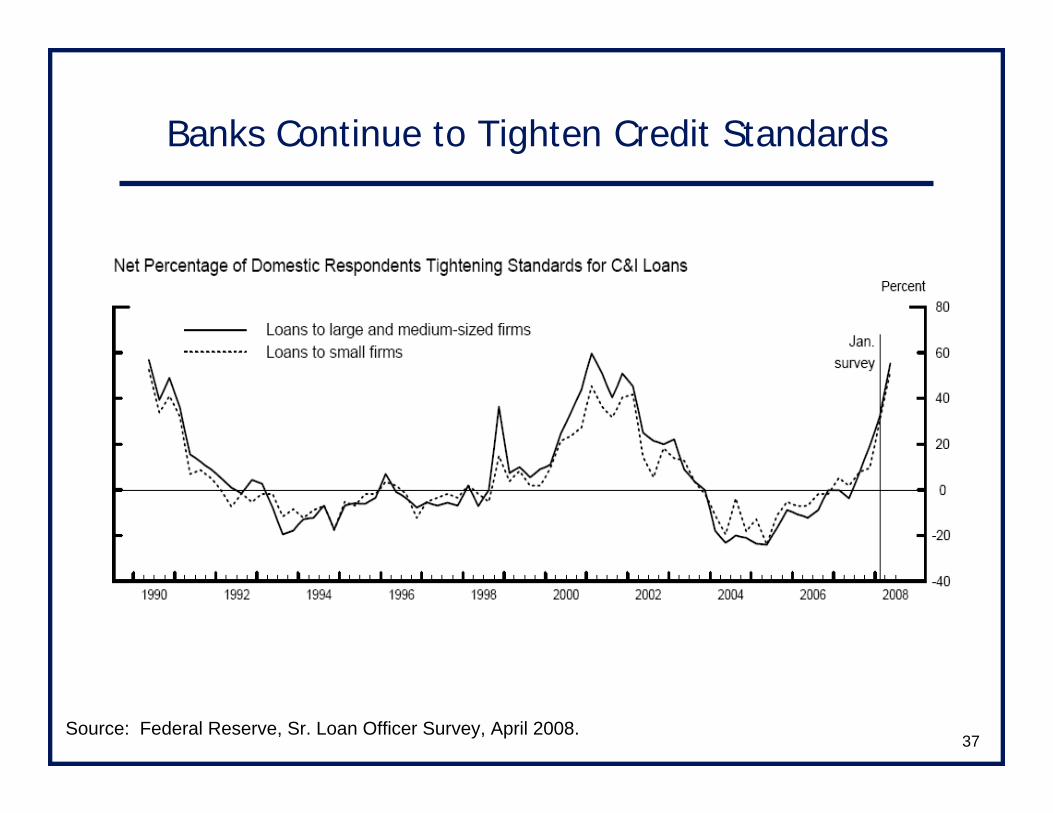
Credit standards have tightened substantially over the past six months
Spreads over cost of funds increasing, though at a slower rate
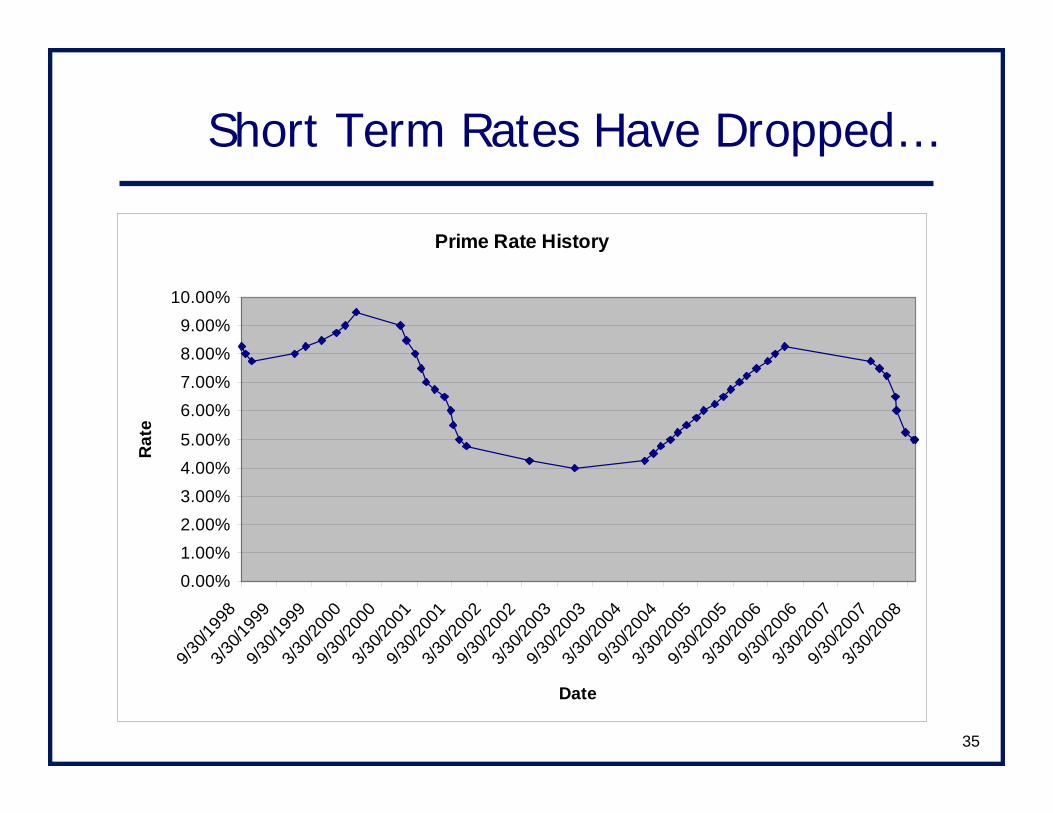
Short term rates are still quite favorable thanks to the Fed and the weaker economic environment
ESOP loan transactions ARE getting done!
35
Short Term Rates Have Dropped…
Prime Rate History
0.00%1.00%2.00%3.00%4.00%5.00%
6.00%7.00%8.00%9.00%
10.00%
9/30/1
998
3/30/1
999
9/30/1
999
3/30/2
000
9/30/2
000
3/30/2
001
9/30/2
001
3/30/2
002
9/30/2
002
3/30/2
003
9/30/2
003
3/30/2
004
9/30/2
004
3/30/2
005
9/30/2
005
3/30/2
006
9/30/2
006
3/30/2
007
9/30/2
007
3/30/2
008
Date
Rat
e
36
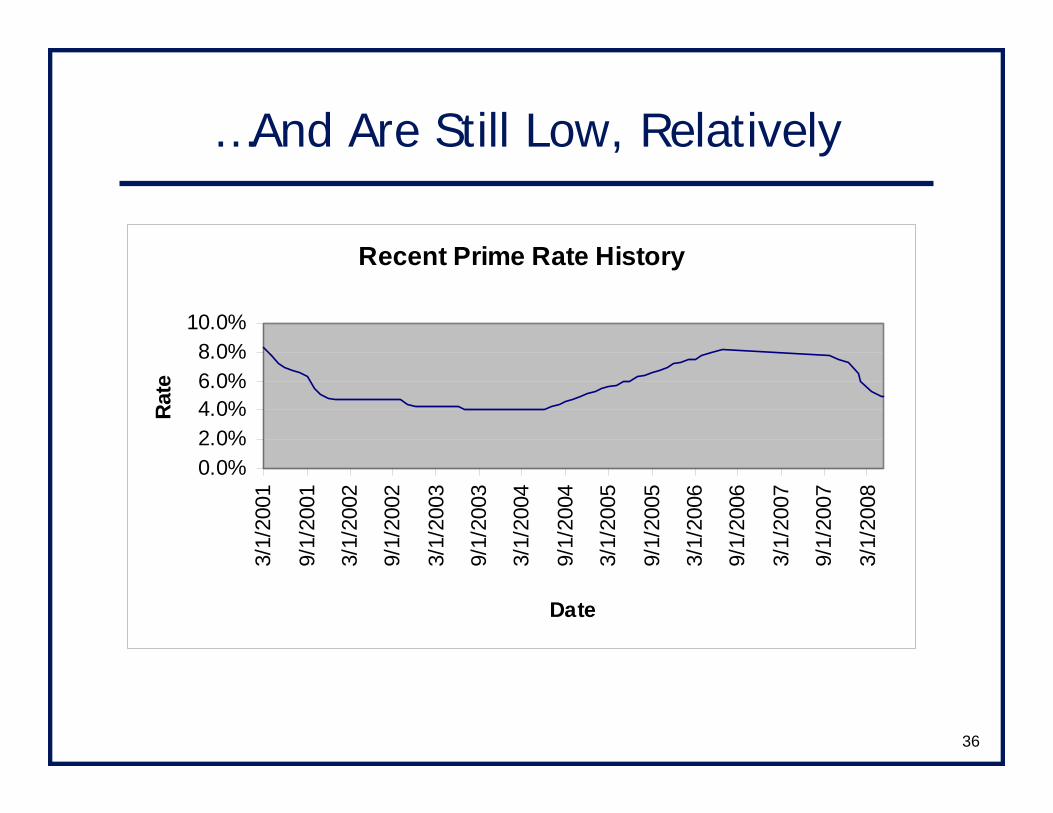
…And Are Still Low, Relatively
Recent Prime Rate History
0.0%2.0%4.0%6.0%8.0%
10.0%
3/1/
2001
9/1/
2001
3/1/
2002
9/1/
2002
3/1/
2003
9/1/
2003
3/1/
2004
9/1/
2004
3/1/
2005
9/1/
2005
3/1/
2006
9/1/
2006
3/1/
2007
9/1/
2007
3/1/
2008
Date
Rate
37
Banks Continue to Tighten Credit Standards
Source: Federal Reserve, Sr. Loan Officer Survey, April 2008.
38
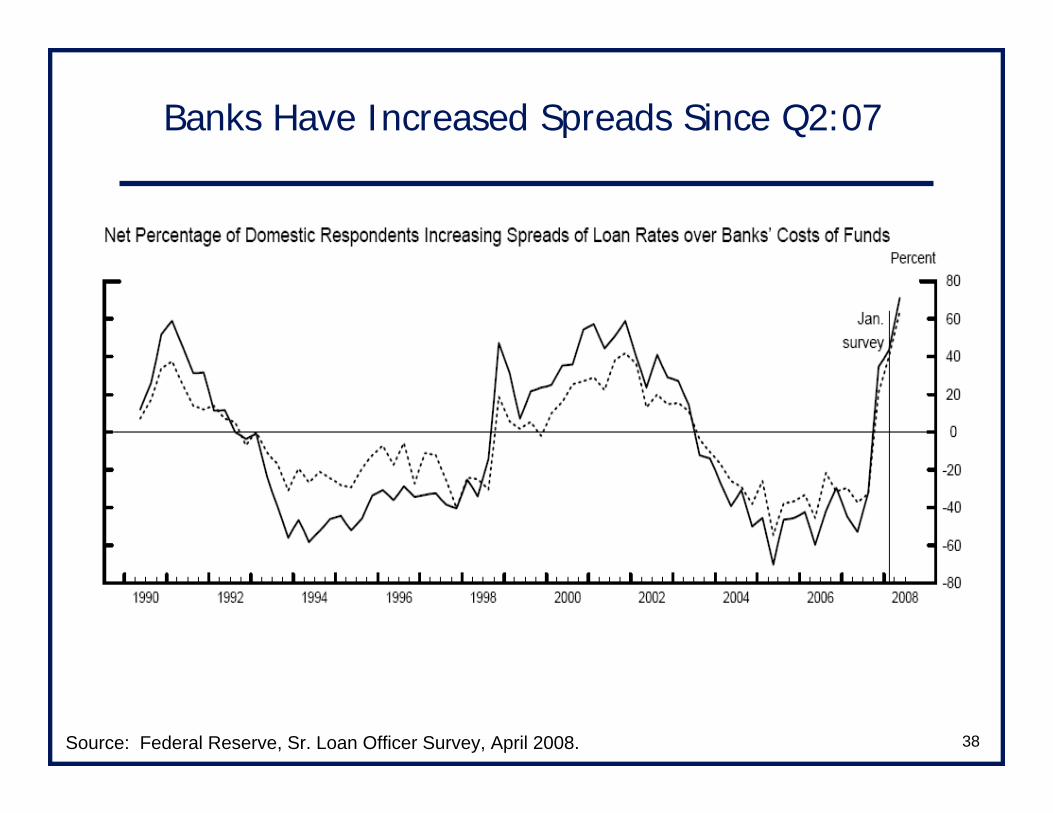
Banks Have Increased Spreads Since Q2:07
Source: Federal Reserve, Sr. Loan Officer Survey, April 2008.

39
Loan Demand Is Off Considerably…But may be rebounding?
Source: Federal Reserve, Sr. Loan Officer Survey, April 2008.
40
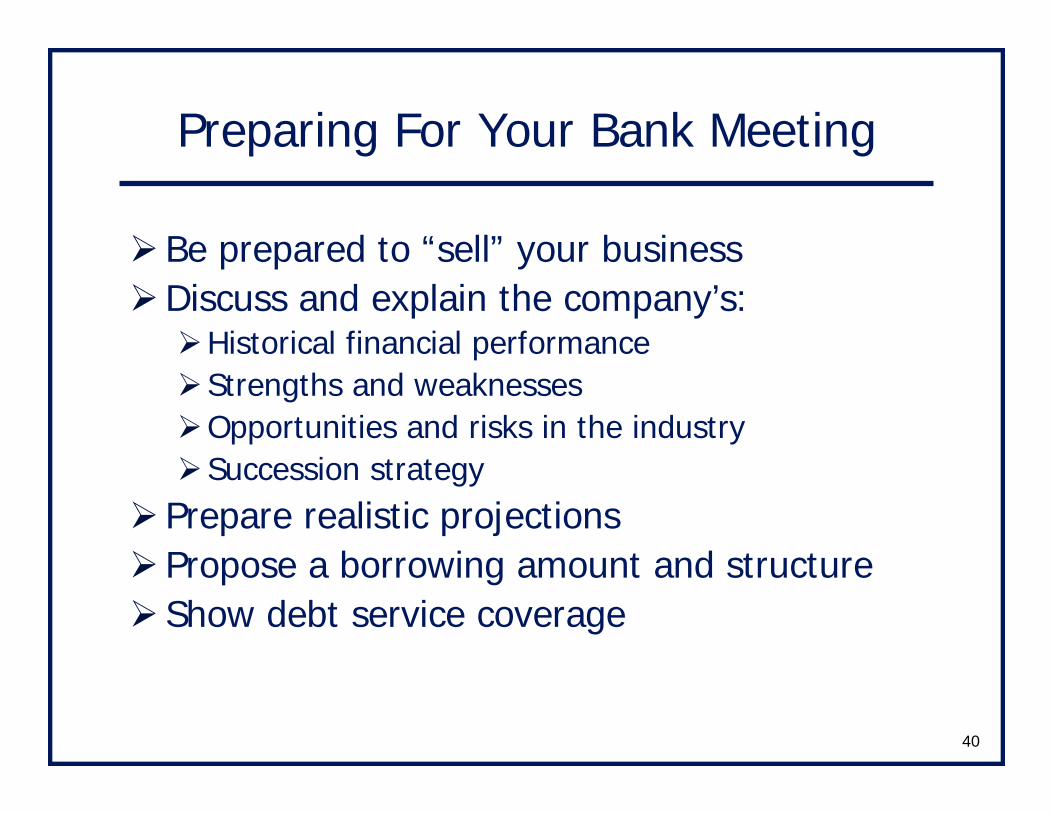
Preparing For Your Bank Meeting
Be prepared to “sell” your businessDiscuss and explain the company’s:
Historical financial performanceStrengths and weaknessesOpportunities and risks in the industrySuccession strategy
Prepare realistic projectionsPropose a borrowing amount and structureShow debt service coverage
41
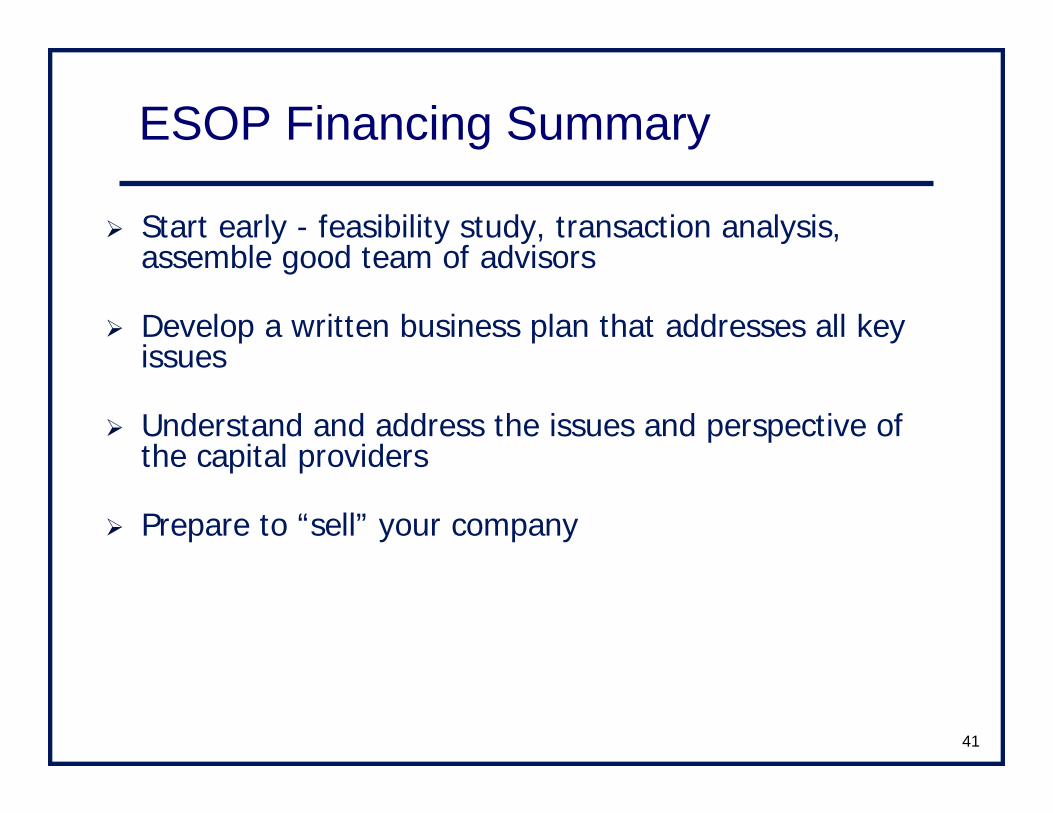
Start early - feasibility study, transaction analysis, assemble good team of advisors
Develop a written business plan that addresses all key issues
Understand and address the issues and perspective of the capital providers
Prepare to “sell” your company
ESOP Financing Summary

42
Thank You Audience and VEOC !
“Financing an ESOP”Presented by
Mary JosephsBank of America – Managing DirectorESOP Solutions Executive312-848-0849
Joe MarxPrincipal Financial Group716-631-3255 ext: 3034
Bob MassengillSES Advisors, Inc. - President973-540-9200