financial viability and performance evaluation of co-operative credit
TRANSCRIPT

International Journal of Computing and Business Research (IJCBR)
Volume 1, N. 1 December - 2010
FINANCIAL VIABILITY AND PERFORMANCE EVALUATION OF
CO-OPERATIVE CREDIT INSTITUTIONS IN HARYANA (INDIA)
Ramesh Chander
Associate Professor,
University School of Management,
Kurukshetra University, Kurukshetra. India
E-mail : [email protected]
Jai Kishan Chandel
Assistant Professor,
Institute of Management Studies,
Kurukshetra University, Kurukshetra. India
E-mail : [email protected], [email protected]
ABSTRACT
Co-operative Banks are organized and managed on the principals of co-operation, self-help,
and mutual help. These have been playing imperative role in Indian financial system with broad
network in both urban and rural areas. Around three hundred and seventy two District Central
Co-operative Banks (DCCBs) with large number of branches and extension counters cater to
the needs of nearly one lakh societies in rural India. In Haryana nineteen DCCBs with more than
two hundred branches have been facilitating self-sufficiency in food grain production, creation of

International Journal of Computing and Business Research (IJCBR)
Volume 1, N. 1 December - 2010
better employment opportunities and organizational strength to the rural people through banking
services. Recently, the scams in co-operative sector, failure and closure of unviable branches,
imposition of penalty by the regulators and payment of heavy money claims due to bankruptcy
of co-operative banks etc. are few significant reasons which persuade to inquire into the
financial affairs of these institutions. Many co-operative banks became insolvent and others are
on the brink of mergers or acquisition. The present study was conceptualized to examine the
financial viability, efficiency and performance of four DCCBs operating in Gurgaon division in
Haryana (India), viz. Gurgaon, Faridabad, Mahendergarh and Rewari for a period of twelve
years (1997-98 to 2008-09) by financial analysis and z-score analysis. The financial parameters
here taken are profitability, liquidity, efficiency, solvency, risk and bankruptcy. The results reveal
that four DCCBs with approximately fifty branches have not been performing well on all financial
parameters taken for study. The banks performed well on one parameter but deteriorated on
another and in different years as well. All the banks have been a part of bankruptcy zone (weak
performance zone) throughout the study period. The banks need to visualize their operations,
policies and strategies for effective utilization of available financial and human resources. The
banks should amend their vision and act accordingly for sustenance in fierce competitive
financial environment.
Keywords : Co-operative Credit Institutions, Profitability, Liquidity, Solvency, Efficiency, Risk,
Financial Viability, Bankruptcy
INTRODUCTION
Co-operative credit institutions are an important part of Indian financial system and are
engaged in different activities namely production, processing, marketing, distribution, servicing
and banking with vast and powerful superstructure. In three tier structure of working, District
Central Co-operative Banks (DCCBs) operate in the middle/district level by providing finance to
the primary credit societies, accepting of deposits, granting of loans/advances, fixed deposit

International Journal of Computing and Business Research (IJCBR)
Volume 1, N. 1 December - 2010
receipts, gold/bullion, goods and documents of title of goods, collection of bills, cheques, safe
custody of valuables and agency services. The financial situation of co-operative banks in India
cannot be claimed sound at present. Many banks became insolvent and others are on the verge
of mergers or acquisition. Various scams have been surfaced in 2001-02 in co-operative sector
which had given a big jolt to the banking sector. In 2005-06, the RBI cancelled licenses of 14
Urban Co-operative Banks and DICGC made a payment of Rs. 565 crore towards the
settlement of depositor’s claims. During 2006-07, as many as 25 co-operative banks closed
operations resulting into a payout of Rs. 438 crore by the insurer towards settlement of
depositors' claims. In the year 2007-08, failing co-operative banks have cost Reserve Bank's
credit insurance arm dearly as it had to shell out over Rs. 123.37 crore towards payment to
depositors of 17 insolvent banks. The Reserve Bank's credit insurance arm has paid over Rs.
142 crore to depositors of 19 co-operative banks that have gone bankrupt till March 2009. As 32
Co-operative Banks failed between January and December 2009, Rs. 482 crore has been paid
by DICGC to settle the dues of the depositors.
Keeping in mind the vulnerable situation of the co-operative banks, many committees
suggested for revitalization of co-operative banks and Government announced the financial
package of Rs. 14,839-crore as suggested by A.Vaidyanathan panel. NABARD has been the
implementing agency for the Revival package for the Short Term Co-operative Credit Structure.
As indicated in the annual policy statement of April 2008, the Government approved a package
and Rs 4,740 crore has been released by the NABARD.
However, co-operative banks have made a commendable progress in extending its
geographical spread and functional reach, yet huge decline in productivity and efficiency,
erosion of profitability, unrealizable debts and increase in unviable branches have been seen
inspite of Government help. Considering these facts, probing into the financial and operational
aspects of these institutions becomes significant. In the present study it is tried to investigate
into the financial and operational affairs of Four Central Co-operative Banks operating at district

International Journal of Computing and Business Research (IJCBR)
Volume 1, N. 1 December - 2010
level in Gurgaon division with focus on Profitability, Liquidity, Solvency, Efficiency, Risk and
Viability for twelve year period (1997-98 to 2008-09).
The present study has been divided into four sections. First section covers brief review
of the relevant literature. Objectives of the Study and Research Methodology are covered in
second section. Third section covers Results and Discussion part and in the fourth section
Conclusion and suggestions are made.
SECTION-I: REVIEW OF LITERATURE
Various studies conducted and numerous suggestions were sought to bring
effectiveness in the working and operations of financial institutions. Narsimham Committee
(1991) emphasized on capital adequacy and liquidity, Padamanabhan Committee (1995)
suggested CAMEL rating (in the form of ratios) to evaluate financial and operational efficiency,
Tarapore Committee (1997) talked about Non-performing assets and asset quality, Kannan
Committee (1998) opined about working capital and lending methods, Basel committee (1998
and revised in 2001) recommended capital adequacy norms and risk management measures,
Kapoor Committee (1998) recommended for credit delivery system and credit guarantee and
Verma Committee (1999) recommended seven parameters (ratios) to judge financial
performance and several other committees constituted by Reserve Bank of India to bring
reforms in the banking sector by emphasizing on the improvement in the financial health of the
banks.
Experts suggested various tools and techniques for effective analysis and interpretation
of the financial and operational aspects of the financial institutions specifically banks. These
have focus on the analysis of financial viability and credit worthiness of money lending
institutions with a view to predict corporate failures and incipient incidence of bankruptcy among
these institutions. Urs and Chitambaram (2000) studied performance of 14 District Central Co-
operative Banks (DCCBs) in Kerala on 23 parameters and found inefficiency in their operations
with lower capital and poor deployment of funds in the DCCBs. Bhaskaran and Josh (2000)
concluded that the recovery performance of co-operative credit institutions continues to be
International Journal of Computing and Business Research (IJCBR)
Volume 1, N. 1 December - 2010
unsatisfactory which contributes to the growth of NPA even after the introduction of prudential
regulations. They suggested legislative and policy prescriptions to make co-operative credit
institutions more efficient, productive and profitable organization in tune with competitive
commercial banking. Jain (2001) has done a comparative performance analysis of District
Central Co-operative Banks (DCCBs) of Western India, namely Maharashtra, Gujarat and
Rajasthan and found that DCCBs of Rajasthan have performed better in profitability and liquidity
as compared to Gujarat and Maharashtra. Singh and Singh (2006) studied the funds
management in the District Central Co-operative Banks (DCCBs) of Punjab with specific
reference to the analysis of financial margin. It noted that a higher proportion of own funds and
the recovery concerns have resulted in the increased margin of the Central Co-operative Banks
and thus had a larger provision for non-performing assets. Mavaluri, Boppana and Nagarjuna
(2006) suggested that performance of banking in terms of profitability, productivity, asset quality
and financial management has become important to stable the economy. They found that public
sector banks have been more efficient than other banks operating in India. Pal and Malik
(2007) investigated the differences in the financial characteristics of 74 (public, private and
foreign) banks in India based on factors, such as profitability, liquidity, risk and efficiency. It is
suggested that foreign banks were better performers, as compared to other two categories of
banks, in general and in terms of utilization of resources in particular. Campbell (2007) focused
on the relationship between nonperforming loans (NPLs) and bank failure and argued for an
effective bank insolvency law for the prevention and control of NPLs for developing and
transitional economies as these have been suffering severe problems due to NPLs. Singla
(2008) emphasized on financial management and examined the financial position of sixteen
banks by considering profitability, capital adequacy, debt-equity and NPA. Dutta and Basak
(2008) suggested that Co-operative banks should improve their recovery performance, adopt
new system of computerized monitoring of loans, implement proper prudential norms and
organize regular workshops to sustain in the competitive banking environment. Chander and
Chandel (2010) analyzed the financial efficiency and viability of HARCO Bank and found poor
performance of the bank on capital adequacy, liquidity, earning quality and the management
efficiency parameters.

International Journal of Computing and Business Research (IJCBR)
Volume 1, N. 1 December - 2010
Centric to the ratio analysis, these studies have customized and blended financial ratios
in a model form to examine and predict the financial health. Similarly, comparative performance,
recovery performance, cost reduction, productivity and efficiency are vital areas which have
been considered by various analysts. With inquisitiveness the present study has been
undertaken with specific objectives as envisaged in the next section.
SECTION-II: OBJECTIVES AND RESEARCH METHODOLOGY
The study under consideration proposes to achieve the following objectives:
1. To study and examine the financial performance and efficiency of District Central Co-
operative Banks operating in Gurgaon division in Haryana comprising of Gurgaon,
Faridabad, Mahendergarh and Rewari.
2. To study and examine the financial viability of these DCCBs.
3. To suggest measures for augmenting working and operations in these DCCBs.
RESEARCH METHODOLOGY
Haryana state has been divided into four divisions, A) Ambala division, which covers six
districts, B) Rohtak division, which covers five districts, C) Hisar division, which covers four
districts and D) Gurgaon division, which covers four districts. In the present study four districts
central co-operative banks (DCCBs) of Gurgaon division has been covered. The study
encompasses twelve year period, from financial year 1997-98 to 2008-09. The requisite data
has been obtained from the published financial statements of banks. An attempt is made to
analyze five key financial areas (profitability, liquidity, solvency, efficiency and risk) considering
the data from financial statements. Under each of these five categories of analysis four different
ratios are calculated and analyzed. After calculating the average of the ratio (Mean), Standard
Deviation, t-value and f-value have also been calculated to deepen the study.
Profitability Analysis- In the present study the profitability of DCCBs is tested with four
profitability ratios. These are I) Net worth ratio (Net Profit after Tax to Total Shareholders’

International Journal of Computing and Business Research (IJCBR)
Volume 1, N. 1 December - 2010
funds), II) Return on Capital Employed (Net Profit after Tax to Total Assets), III) Profit Margin
(Net Profit to Total Income) and IV) Net Interest Margin (Interest margin to Total Assets).
Liquidity Analysis- The liquidity of DCCBs is tested with four liquidity ratios. These are I) Cash-
Assets ratio (Cash plus bank balance to Total Assets), II) Cash-Deposit ratio (Cash to Total
Deposit), III) Cash-Demand ratio (Cash to Demand Deposit) and IV) Working funds to Assets
ratio (Net Working Capital to Total Assets).
Solvency Analysis- The solvency is tested with four solvency ratios. These are I) Debt-Equity
Ratio (Outsiders funds to shareholders funds), II) Capital Gearing Ratio (Owner’s funds to Total
fixed interest bearing liabilities), III) Outside Liabilities to Total Assets (Total Borrowings to Total
Assets), IV) Fixed Assets to Total Net worth ratio (Fixed Assets to Total Capital).
Efficiency Analysis- To measure the efficiency of DCCBs four ratios are calculated, viz. I)
Operating Efficiency (Total Operating Expenses to Total Assets), II) Cost of funds (Total Interest
Expenses to Total Borrowings), III) Income productivity per employee (Net Income after tax to
Total Employees) and IV) Overhead Efficiency (Burden) ratio (Non-Interest Income to Non-
Interest Expenses)
Risk Analysis- Four key ratios are applied to test risk level in DCCBs, these are- I) Equity Ratio
(Total Equity to Total Assets), II) NNPA to Sales (Net Non Performing Assets to Total
Advances), III) GNPA to Sales (Gross Non Performing Assets to Total Advances) and IV) GNPA
to Asset Ratio (Gross Non Performing Assets to Total Assets).
Bankruptcy and Financial Viability Analysis- After making above analysis, it has been tried
to evaluate the financial health and viability of these banks by using Altman Z-Score model.
Altman (1968) coined a multivariate Z-score analysis to assess financial health and to predict
bankruptcy. It has been considered a powerful diagnostic tool that forecasts the bankruptcy. The
model is defined as: (Z =1.2X1 + 1.4X2 + 3.3X3 +0.6X4 + 0.999X5) wherein, the variables X1 to
X4 are computed as percentage values while X5 variable is obtained in number of times and
signify as: X1 is the ratio of working capital to total assets, X2 is the ratio of retained earnings to
total assets, X3 is the ratio of earnings before interest and tax to total assets, X4 is the ratio of
market value of equity to book value of debt, X5 is the ratio of sales to total assets. The model
International Journal of Computing and Business Research (IJCBR)
Volume 1, N. 1 December - 2010
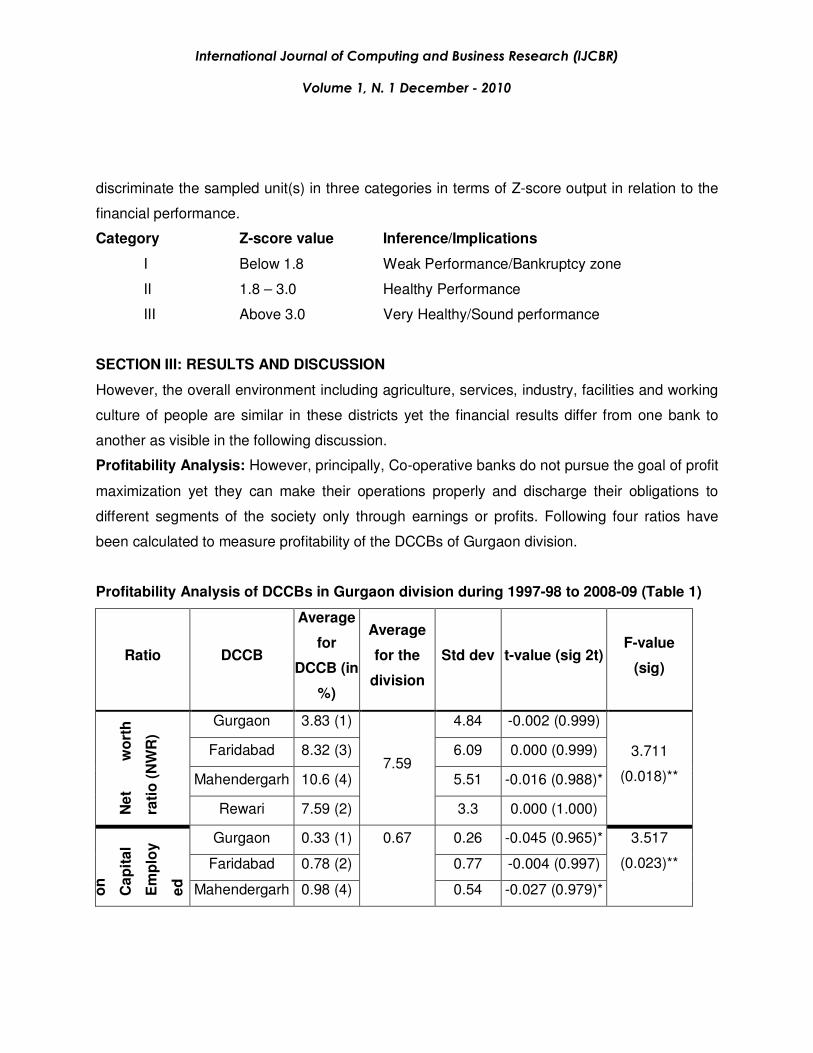
discriminate the sampled unit(s) in three categories in terms of Z-score output in relation to the
financial performance.
Category Z-score value Inference/Implications
I Below 1.8 Weak Performance/Bankruptcy zone
II 1.8 – 3.0 Healthy Performance
III Above 3.0 Very Healthy/Sound performance
SECTION III: RESULTS AND DISCUSSION
However, the overall environment including agriculture, services, industry, facilities and working
culture of people are similar in these districts yet the financial results differ from one bank to
another as visible in the following discussion.
Profitability Analysis: However, principally, Co-operative banks do not pursue the goal of profit
maximization yet they can make their operations properly and discharge their obligations to
different segments of the society only through earnings or profits. Following four ratios have
been calculated to measure profitability of the DCCBs of Gurgaon division.
Profitability Analysis of DCCBs in Gurgaon division during 1997-98 to 2008-09 (Table 1)
Ratio DCCB
Average
for
DCCB (in
%)
Average
for the
division
Std dev t-value (sig 2t) F-value
(sig)
Gurgaon 3.83 (1) 4.84 -0.002 (0.999)
Faridabad 8.32 (3) 6.09 0.000 (0.999)
Mahendergarh 10.6 (4) 5.51 -0.016 (0.988)*
Ne
t w
ort
h
rati
o (
NW
R)
Rewari 7.59 (2)
7.59
3.3 0.000 (1.000)
3.711
(0.018)**
Gurgaon 0.33 (1) 0.26 -0.045 (0.965)*
Faridabad 0.78 (2) 0.77 -0.004 (0.997)
on
Ca
pit
al
Em
plo
y
ed
Mahendergarh 0.98 (4)
0.67
0.54 -0.027 (0.979)*
3.517
(0.023)**

International Journal of Computing and Business Research (IJCBR)
Volume 1, N. 1 December - 2010
Rewari 0.60 (3) 0.29 0.039 (0.969)*
Gurgaon 4.33 (1) 5.86 0.001 (0.999)
Faridabad 9.44 (3) 8.46 0.001 (0.999)
Mahendergarh 11.3 (4) 5.72 -0.017 (0.987)*
Pro
fit
Ma
rgin
(P
M)
Rewari 8.1 (2)
8.29
4.22 -0.003 (0.997)
2.651
(0.060)**
Gurgaon 2.32 (2) 1.22 0.009 (0.993)
Faridabad 2.72 (3) 0.99 0.006 (0.995)
Mahendergarh 3.07 (4) 0.76 0.004 (0.997)
Ne
t In
tere
st
Ma
rgin
(NIM
)
Rewari 1.71 (1)
2.46
0.54 0.021(0.983)*
4.858
(0.005)**
(*significant at 0.01 level and **significant at 0.05 level, Numeric (1-4) in braces are ratings as
1=worst and 4=best)
As depicted in table 1 all the DCCBs have scored very low NWR except Mahendergarh
which scored highest 10.6%. The lower score reveal that the returns available to the
shareholders on the capital invested have been very less and banks could not make proper use
of capital. The dispersion in the ratios is highest in Faridabad (6.09) and Mahendergarh has
significant t-value at 0.01 level. The ROCE has been very low in all DCCBs being highest in
Mahendergarh (0.98) which signifies that all the banks are deficient in utilizing the total
investments made in fixed and current assets and leading to generation of lesser returns. The
variation in these ratios has been highest in Faridabad (0.77) and the t-values have been
significant at 0.01 level for all banks except Faridabad. The rate of profit margin has been very
less in Gurgaon (4.33) due to loss incurred in 2006-07 and lower returns in other years. It has
been highest in Mahendergarh (11.3). It discloses that very less part of the total income is
available to the owners in the form of profits and rest of the amount (more that 88%) has been
incurred in expenditure. The deviation in ratios is highest in Faridabad (8.46) and the t-value has
been significant in Mahendergarh at 0.01 level.
The average NIM has been highest in Mahendergarh (3.07) and lowest in Rewari (1.71) which
reflects that the ratio of core income (income from lending operations) to income producing

International Journal of Computing and Business Research (IJCBR)
Volume 1, N. 1 December - 2010
assets has been very less throughout the study period. Net interest margin is the difference
between total interest income and total interest expenses. It shows that the management of
these banks has been unable to control the spread between interest revenue and interest costs,
which lead to increase in interest costs. The variance is highest in Gurgaon (1.22) and t-value
has been significant at 0.01 level in Rewari only. The f-value for the division has been significant
at 0.05 level for all ratios. The profitability has been highest in Mahendergarh followed by
Faridabad but very critical in Gurgaon and Rewari.
Liquidity Analysis: Liquidity refers to the ability of a concern to meet its current obligations as
and when these become due. The short term obligations are met by realizing amount from
current, floating or circulating assets. The current assets should either be liquid or near liquidity.
Liquidity Analysis of DCCBs in Gurgaon division during 1997-98 to 2008-09 (Table 2)
Ratio DCCB
Average
for
DCCB (in
%)
Average
for the
division
Std dev t-value (sig 2t) F-value (sig)
Gurgaon 3.65 (3) 0.76 0.422 (0.681)**
Faridabad 1.18 (1) 0.33 0.044 (0.966)*
Mahendergarh 2.99 (2) 1.15 0.000 (1.000)
Ca
sh
A
sse
t
Ra
tio
(C
AR
)
Rewari 3.81 (4)
2.91
1.45 0.02 (0.998)*
16.868
(0.000)**
Gurgaon 5.83 (2) 1.04 0.003 (0.998)
Faridabad 2.51 (1) 0.56 -0.015 (0.988)*
Mahendergarh 7.32 (4) 2.17 0.000 (1.000)
Ca
sh
De
po
sit
Ra
tio
(C
DR
)
Rewari 6.97 (3)
5.66
2.68 -0.002 (0.998)
17.369
(0.000)**
Gurgaon 12.4 (3) 3.94 0.029 (0.978)*
Faridabad 3.21 (1) 0.84 0.007 (0.995)
Ca
sh
De
ma
nd
Ra
tio
(CD
D)
Mahendergarh 17 (4)
11.2
5.82 -0.001 (0.999)
22.048
(0.000)**

International Journal of Computing and Business Research (IJCBR)
Volume 1, N. 1 December - 2010
Rewari 12.2 (2) 4.74 0.005 (0.996)
Gurgaon 41.1 (4) 10.3 0.001 (1.000)
Faridabad 33.4 (1) 5.94 -0.016 (0.988)*
Mahendergarh 34.3 (2) 9.48 -0.002 (0.998)
Wo
rkin
g
Fu
nd
s
As
se
ts
Ra
tio
(WF
AR
)
Rewari 37 (3)
36.45
6.99 -0.007 (0.994)
2.059
(0.119)**
(*significant at 0.01 level and **significant at 0.05 level, Numeric (1-4) in braces are ratings as
1=worst and 4=best)
The higher Cash Asset Ratio reflects higher liquidity in the asset portfolio of a bank. It is
evident from table 2 that the average CAR for the division and individually for all banks has
been less than 4 percent which shows that liquidity position of these banks against assets has
been very poor and critical. Lower liquidity may impact the creditworthiness negatively. The
dispersion in the ratio is highest in Rewari (1.45). The t-values have been significant at 0.01
level in Faridabad and Rewari and at 0.05 level in Gurgaon. The cash deposit ratio (CDR)
denotes the liquidity and payment capacity of the banks and it has been highest in
Mahendergarh (7.32). The banks with lower ratio may face problem of timely payment to the
depositors due to shortage of cash and ultimately may adversely affect the creditworthiness and
profitability. The variance in the ratios is highest in Rewari (2.68) and the t-value has been
significant at 0.01 level only in Faridabad. The availability of cash in proportion to the demand
deposits is highest in Mahendergarh (17) and lowest in Faridabad (3.21) which reveals that
banks can pay cash in the tune of 3-17 percent at a time out of total demand deposits. The
situation should be improved in order to strengthen the liquidity position. The variance in the
ratio is highest in Mahendergarh (5.82) and the t-value has been significant at 0.01 level in
Gurgaon. Net working capital being the difference in current assets and current liabilities is a
measure of pure liquidity in bank. The average ratio of Working Funds to Assets for the division
has been 36.45. The higher ratio shows the better situation of working funds in the banks. The
variance in the ratio has been highest in Faridabad (10.3). The t-value of the banks has been
significant at 0.01 level in Faridabad and f-values of the division have been significant at 0.05

International Journal of Computing and Business Research (IJCBR)
Volume 1, N. 1 December - 2010
level for all ratios. However, liquidity position of all DCCBs needed to be improved yet it has
been critical in Faridabad which requires immediate cash for sustenance of routine operations.
Solvency Analysis: The term ‘solvency’ refers to the ability of a bank to meet its long term
obligations. The solvency ratios indicate a bank’s ability to meet the fixed interest, costs and
repayment schedules associated with its long term borrowings.
SOLVENCY ANALYSIS OF DCCBS IN GURGAON DIVISION DURING 1997-98 TO 2008-09
(TABLE 3)
Ratio DCCB
Average
for DCCB
(in %)
Average
for the
division
Std dev t-value (sig 2t) F-value (sig)
Gurgaon 245.9 (4) 100.5 -0.001 (0.999)
Faridabad 437.7 (2) 107.5 0.000 (1.000)
Mahendergarh 500 (1) 166.5 0.000 (0.999)
De
bt
Eq
uit
y
Ra
tio
(D
ER
)
Rewari 403.4 (3)
396.75
158.6 0.000 (0.999)
7.543
(0.000)**
Gurgaon 17.73 (4) 3.744 0.002 (0.999)
Faridabad 35.81 (2) 4.076 -0.001 (0.999)
Mahendergarh 44.8 (1) 8.512 -0.002 (0.998)
Ou
tsid
e
Lia
bilit
ies
to
As
se
ts
(OL
TA
)
Rewari 30.03 (3)
32.09
6.799 -0.001 (0.999)
43.328
(0.000)**
Gurgaon 521.8 (1) 313 0.000 (1.000)
Faridabad 310.7 (3) 94.98 0.000 (1.000)
Mahendergarh 222.4 (4) 45.55 0.000 (1.000)
As
se
ts
to
To
tal
Ca
pit
al
(FA
TC
)
Rewari 385.9 (2)
360.2
91.13 0.000 (1.000)
6.571
(0.001)**
Gurgaon 46.46 (1) 16.11 0.001 (0.999)
Faridabad 24.54 (3) 7.996 0.002 (0.999)
Ca
pit
al
Ge
ari
ng
Ra
tio
(CG
R)
Mahendergarh 21.79 (4)
30.32
6.028 0.000 (1.000)
12.439
(0.000)**
International Journal of Computing and Business Research (IJCBR)
Volume 1, N. 1 December - 2010
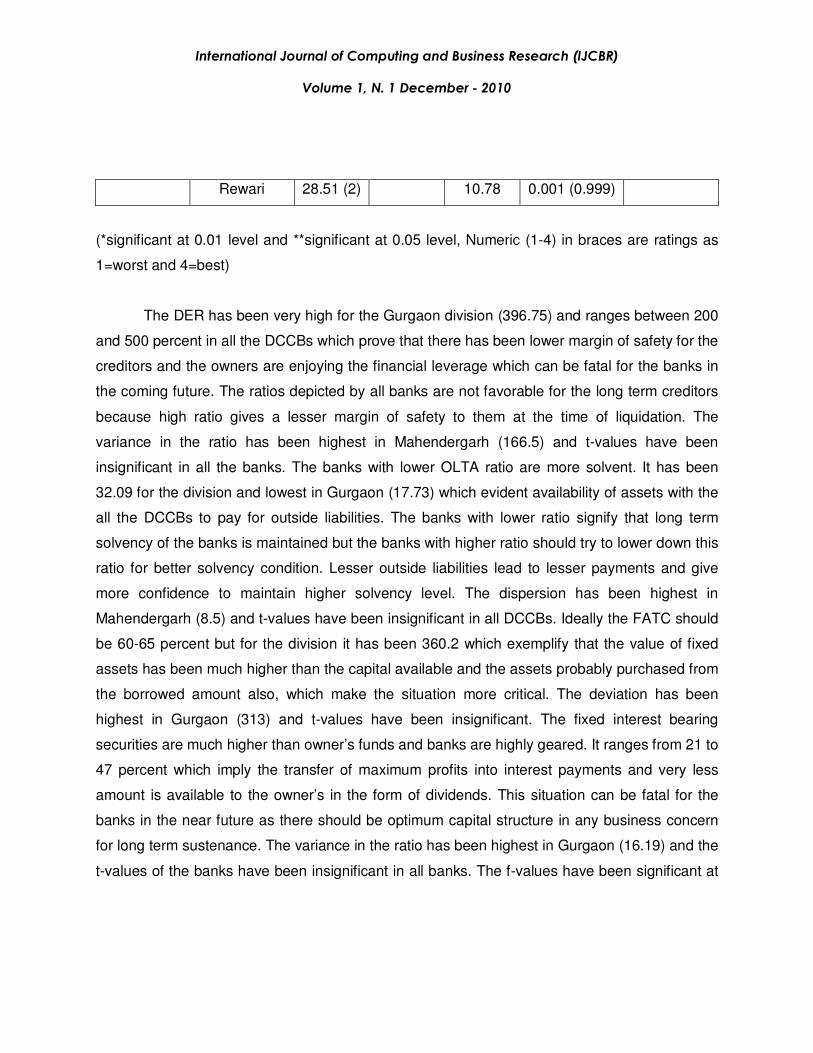
Rewari 28.51 (2) 10.78 0.001 (0.999)
(*significant at 0.01 level and **significant at 0.05 level, Numeric (1-4) in braces are ratings as
1=worst and 4=best)
The DER has been very high for the Gurgaon division (396.75) and ranges between 200
and 500 percent in all the DCCBs which prove that there has been lower margin of safety for the
creditors and the owners are enjoying the financial leverage which can be fatal for the banks in
the coming future. The ratios depicted by all banks are not favorable for the long term creditors
because high ratio gives a lesser margin of safety to them at the time of liquidation. The
variance in the ratio has been highest in Mahendergarh (166.5) and t-values have been
insignificant in all the banks. The banks with lower OLTA ratio are more solvent. It has been
32.09 for the division and lowest in Gurgaon (17.73) which evident availability of assets with the
all the DCCBs to pay for outside liabilities. The banks with lower ratio signify that long term
solvency of the banks is maintained but the banks with higher ratio should try to lower down this
ratio for better solvency condition. Lesser outside liabilities lead to lesser payments and give
more confidence to maintain higher solvency level. The dispersion has been highest in
Mahendergarh (8.5) and t-values have been insignificant in all DCCBs. Ideally the FATC should
be 60-65 percent but for the division it has been 360.2 which exemplify that the value of fixed
assets has been much higher than the capital available and the assets probably purchased from
the borrowed amount also, which make the situation more critical. The deviation has been
highest in Gurgaon (313) and t-values have been insignificant. The fixed interest bearing
securities are much higher than owner’s funds and banks are highly geared. It ranges from 21 to
47 percent which imply the transfer of maximum profits into interest payments and very less
amount is available to the owner’s in the form of dividends. This situation can be fatal for the
banks in the near future as there should be optimum capital structure in any business concern
for long term sustenance. The variance in the ratio has been highest in Gurgaon (16.19) and the
t-values of the banks have been insignificant in all banks. The f-values have been significant at

International Journal of Computing and Business Research (IJCBR)
Volume 1, N. 1 December - 2010
0.05 level in the division. All the DCCBs are required to make improvement in their solvency as
the situation is critical in all the banks.
Efficiency Analysis: The efficiency ratios are calculated to measure the effectiveness with
which funds are utilized in the business, how well the institution controls expenses relative to
producing revenues, and how productive employees are in terms of generating income,
managing assets and handling operations.
Efficiency Analysis of DCCBs in Gurgaon division during 1997-98 to 2008-09
(Table 4)
Ratio DCCB
Average
for
DCCB
(in %)
Average
for the
division
Std dev t-value (sig 2t) F-value (sig)
Gurgaon 2.15 (3) 1.15 -0.008 (0.994)
Faridabad 2.14 (4) 0.73 0.008 (0.994)
Mahendergarh 2.28 (2) 0.74 -0.008 (0.994)
Op
era
tin
g
Eff
icie
ncy
(OE
)
Rewari 2.54 (1)
2.28
0.37 -0.032 (0.975)*
0.649
(0.588)**
Gurgaon 6.19 (1) 9.08 0.000 (1.000)
Faridabad 9.63 (3) 12.6 0.000 (1.000)
Mahendergarh 7.93 (2) 9.78 0.001 (1.000)
Bu
rde
n
Ra
tio
(B
R)
Rewari 57.8 (4)
20.39
8.92 0.000 (1.000)
71.822
(0.000)**
Gurgaon 0.4 (2) 0.6 -0.014 (0.989)*
Faridabad 1.16 (4) 1.93 -0.004 (0.996)
Mahendergarh 0.61 (3) 0.37 0.016 (0.988)*
Inc
om
e
Pro
du
cti
vit
y
per
Em
plo
yee
(IP
PE
)
Rewari 0.25 (1)
0.61
0.12 0.000 (1.000)
1.797
(0.162)**
F u n d s Gurgaon 25.8 (1) 16.43 6.55 -0.019 (0.986)* 34.341

International Journal of Computing and Business Research (IJCBR)
Volume 1, N. 1 December - 2010
Faridabad 13.5 (3) 2.53 0.039 (0.970)*
Mahendergarh 11.6 (4) 2.38 0.104 (0.919)**
Rewari 14.8 (2) 1.34 -0.118 (0.908)**
(0.000)**
(*significant at 0.01 level and **significant at 0.05 level, Numeric (1-4) in braces are ratings as
1=worst and 4=best)
The lesser proportion of operating expenditure provides more profits to owners. It should
be in zero decimal points only. The Gurgaon division has not been efficient on this front as the
average ratio has been very high (2.28) being highest in Rewari (2.54). The variance in the ratio
has been highest in Gurgaon (1.15). The t-value has been significant at 0.01 level in Rewari
only. Burden Ratio reflects the efficiency of an institution to pay non-interest expenditure out of
non-interest income. Higher ratio means lesser burden on interest income and the bank is
earning more through fee based services as highest in Rewari (57.18). The burden of payment
of non-interest expenditure has been higher on interest income as non interest income has been
very less in other banks being lowest in Gurgaon (6.19). The variance has been highest in
Faridabad (12.6) with insignificant t-values. The negligible amount of IPPE is an evidence for
poor efficiency of the employees and management in all banks. The ratio being in the range of
0.4 to 1.16 percent connotes the poor efficiency to earn income in all DCCBs. The banks should
emphasize on increasing the income by utilizing their manpower effectively. The variance in the
ratio has been highest in Faridabad and the t-values have been significant at 0.01 level in
Gurgaon and Mahendergarh. However, cost of funds depends upon the interest rates prevailing
in the market, yet the banks can minimize it with efficient management and better predictions.
CF has been lowest in Mahendergarh which connotes better efficiency in funds management. In
all other banks it has been more than 12 percent. The variance has been highest in Gurgaon
and the t-values have been significant at 0.01 level in Gurgaon and Faridabad and at 0.05 in
rest. The f-values have been significant at 0.05 level. Faridabad and Mahendergarh have been
quite efficient but Gurgaon and Rewari have been very critical and inefficient.

International Journal of Computing and Business Research (IJCBR)
Volume 1, N. 1 December - 2010
Risk Analysis: Banks face many risks including losses on loans and losses on investments.
Financial managers must limit these risks in order to avoid failure of the banks (bankruptcy).
Basel Committee on Banking Supervision (BCBS) in both the accords (Basel accord I and II)
have given weight to capital adequacy and risk in banks.
Risk Analysis of DCCBs in Gurgaon division during 1997-98 to 2008-09 (Table 5)
Ratio DCCB
Average
for
DCCB (in
%)
Average
for the
division
Std dev t-value (sig 2t) F-value (sig)
Gurgaon 7.94 (1) 2.67 0.005 (0.996)
Faridabad 8.53 (3) 1.64 0.002 (0.999)
Mahendergarh 9.48 (4) 1.56 -0.011 (0.991)*
Eq
uit
y
Ra
tio
(ER
)
Rewari 7.97 (2)
8.48
1.71 0.002 (0.999)
1.621
(0.198)**
Gurgaon 6.64 (2) 3.44 0.003 (0.997)
Faridabad 6.83 (1) 3.56 0.002 (0.999)
Mahendergarh 3.75 (4) 2.25 -0.001 (0.999)
Gro
ss
N
PA
to
Sa
les
(GN
PS
)
Rewari 4.55 (3)
5.44
1.01 0.003 (0.998)
3.684
(0.019)**
Gurgaon 4.25 (2) 2.35 -0.007 (0.994)
Faridabad 5.11 (1) 2.57 -0.003 (0.997)
Mahendergarh 3.05 (4) 1.75 -0.005 (0.996)
Gro
ss
N
PA
to
As
se
ts
(GN
PA
)
Rewari 3.29 (3)
3.93
0.63 0.009 (0.993)
2.743
(0.054)**
Gurgaon 2.7 (3) 3.28 0.000 (0.999)
Faridabad 3.82 (1) 2.8 -0.006 (0.995)
Mahendergarh 2.25 (4) 1.83 0.000 (1.000)
Ne
t N
PA
to
Sa
les
(NN
PS
)
Rewari 3.15 (2)
2.98
1.02 -0.008 (0.993)
0.929
(0.435)**
(*significant at 0.01 level and **significant at 0.05 level, Numeric (1-4) in braces are ratings as
1=worst and 4=best)

International Journal of Computing and Business Research (IJCBR)
Volume 1, N. 1 December - 2010
Lesser equity ratio in the division (8.48) indicates lower capitalization in the banks in
comparison to the assets and has been a risky situation. Total assets being 10 times greater
than total capital, demonstrate that maximum amount invested in the assets has been the
borrowed one and can adversely affect the creditworthiness of the banks. A bank with
inadequate capital base remain in dwindling situation and face difficulty in making adequate use
of assets for earning. The dispersion in the ratio has been highest in Gurgaon (2.67) and the t-
value has been significant at 0.01 level in Mahendergarh only. The GNPS ratio has been a
measure of effective sales in a bank and it should be less than 5 percent as prescribed by the
RBI. However, it has been more than 5 % in Gurgaon and Faridabad, but the effective sales
have been more than 93 % in all DCCBs. Due to implementation of loan waiver scheme by the
Government in the year 2008, the NPA increased tremendously in 2008-09 and affected
adversely all the banks. The variance has been highest in Faridabad (3.56). The t-values have
been insignificant at 0.01 level in all DCCBs. The GNPA in total assets has been highest in
Faridabad (5.11) and lowest in Mahendergarh (3.05) which reveal lesser risk in all the banks,
however it can be further lower down. The dispersion in the ratio has been highest in Faridabad
and the t-values have been insignificant at 0.01 level in all DCCBs. The ratio of Net Non
Performing Assets (NNPA) to Total Advances should not be greater than 3 as per the RBI
guidelines. It has been more than prescribed limit in Faridabad (3.82) and Rewari (3.15) which
signals danger to the banks. The banks should emphasize more on better provisioning and
careful lending in order to decrease the loss assets. The dispersion in the ratio has been highest
in Gurgaon (3.28) and the t-values in all banks have been insignificant at 0.01 level but f-values
for the division have been significant at 0.05 level. The risk level has been very high in Gurgaon
and Faridabad, but quite well in Mahendergarh and Rewari.
It can be inferred from above discussion that banks in Gurgaon division have not
performed well on all the parameters. One bank performed best on one parameter but worst on
other which prove that the overall financial performance of the banks has not quite well and all

International Journal of Computing and Business Research (IJCBR)
Volume 1, N. 1 December - 2010
the banks have to make improvements on different fronts. In the following table total score and
position attained by the banks is depicted.
Aggregate Score and position of DCCBs on five financial parameters (Table 6)
DCCB
Profitability
Analysis
(out of 16 )
Liquidity
Analysis
(out of 16)
Solvency
Analysis
(out of 16)
Efficiency
Analysis
(out of
16)
Risk
Analysis
(out of 16)
Total
(out of 80
)
Position
Gurgaon 05 12 10 07 08 42 IV
Faridabad 11 04 10 14 06 45 III
Mahendergarh 16 12 10 11 16 65 I
Rewari 08 12 10 08 10 48 II
(One ratio carries maximum 4 points, 4 ratios = 16 points and 20 ratios = 80 points)
From table 6, it can be interpreted that in profitability analysis, the Mahendergarh has
been the best performer with highest rating (16) followed by Faridabad (11). Gurgaon and
Rewari have been the worst performers with lowest profitability ratios. The liquidity situation in
the Gurgaon division has been weak but it has been highest in Gurgaon, Mahendergarh and
Rewari with 12 points each and least in Faridabad. The solvency situation has been very weak
and all the DCCBs have attained 10 points each. Mahendergarh has been least risky bank but
the risk level has been very high in all other DCCBs. In overall rating, Mahendergarh scored the
first position and declared as the best bank but Gurgaon has been the worst performing bank in
the division. With above analysis the financial performance picture of the banks has been clear
without doubts and to validate the results by checking the bankruptcy level Altman’s Z-score
analysis has been applied. The ‘Z’ scores with respect to District Central Co-operative Banks
under study have been computed in following tables and are depicted in different performance
zones in graphs/figures.

International Journal of Computing and Business Research (IJCBR)
Volume 1, N. 1 December - 2010
Z-score analysis of DCCBs in Gurgaon division during 1997-98 to 2008-09 (Table 7)
Z-Score Values of Four DCCBs in Gurgaon division
DCCB 1997-
98
1998-
99
1999-
00
2000-
01
2001-
02
2002-
03
2003-
04
2004-
05
2005-
06
2006-
07
2007-
08
2008-
09 Mean
Gurgaon 1.63 1.76 1.98 1.99 1.79 1.72 1.77 1.93 1.61 1.04 1.05 1.13 1.62
Faridabad 1.6 1.53 1.68 1.53 1.64 1.57 1.61 1.68 1.84 1.37 1.33 1.31 1.56
Mahendergarh 1.53 1.55 1.51 1.51 1.66 1.64 1.74 1.6 1.6 1.66 1.71 1.6 1.61
Rewari 1.39 1.3 1.52 1.5 1.51 1.63 1.75 1.78 1.79 1.56 1.57 1.44 1.56
Graphical presentation of Z-score values of Gurgaon Division (Figure 1)
It is depicted in the table 7 and figure 1 that DCCBs Mahendergarh and Rewari however
being in weak performance zone were average performers and declined in the last couple of
years. Gurgaon which was the best performer from 1999 to 2005 became worst performer
afterwards. Similarly, Faridabad declined to be a part of bankruptcy zone after 2006. These
banks lack in maintaining proper level of working capital, shortage of retained earnings, lower
rate of returns and fewer business in terms of loans and advances.
SECTION IV: CONCLUSION AND SUGGESTIONS
However District Central Co-operative Banks (DCCBs) play pivotal role in the rural
banking system yet failure/bankruptcy of these banks raise many doubts about their viability and
sustenance. In the present study financial efficiency and performance of four DCCBs operating
in Gurgaon division have been identified and analyzed on five parameters viz. profitability,

International Journal of Computing and Business Research (IJCBR)
Volume 1, N. 1 December - 2010
liquidity, solvency, efficiency and risk. The results reveal that banks performed better on one
parameter but weaken on other which led to dwindling situation. Mahendergarh CCB has
performed well on profitability, liquidity and risk parameters but declined on efficiency and
solvency parameters. Rewari needs to make improvements on all parameters but it performed
well on liquidity. The profitability and efficiency have been quite better in Faridabad, but it should
improve on all other fronts. Except liquidity, the Gurgaon has to make improvements on all other
fronts. The derivation from the Z-score analysis reveal that all the banks have been declined to
become a part of weak performance or bankruptcy zone. Long term sustenance and efficient
operations have been big questions before these banks. Overall score depicts that
Mahendergarh CCB has been the best and Gurgaon the worst one. In fact all the banks have
been suffering from financial mismanagement and underutilization of resources, so these banks
should change their vision and bring competitiveness besides transparency in their working to
sustain and become vivacious co-operative credit institutions.
JOURNAL REFERENCES:
• Altman, E.I. 1968, "Financial Ratios, Discriminant Analysis and the Prediction of
Corporate Bankruptcy". Journal of Finance, 189-209.
• Andrew Campbell (2007), "Bank insolvency and the problem of non-performing loans",
Journal of Banking Regulation, 25-45.
• Beaver, W. H. (1966), "Financial ratios as predictor of failure-empirical research in
accounting", Journal of Accounting Research, No. 4, 71-111.
• Bhaskaran R and Praful Josh P (2000), “Non Performing Assets (NPAs) in Co-operative
Rural Financial System: A major challenge to rural development”, BIRD’s Eye View
Dec.2000.
• Chander Ramesh and Chandel Jai Kishan (2010), “Financial Viability of an Apex Co-
operative Credit Institution- A Case Study of the HARCO Bank”, Asia-Pacific Business
Review Vol. VI, No.2, April-June 2010, pp 61-70
• Chandra, Buddhadeb (2006), “Performance of Burdwan Central Co-operative Bank in
the Development of the District (1988-89 to 1998-99)”, Finance India, September, 2006.

International Journal of Computing and Business Research (IJCBR)
Volume 1, N. 1 December - 2010
• Dutta Uttam and Basak Amit (2008), “Appraisal of financial performance of urban co-
operative banks- a case study.” The Management Accountant, case study, March 2008,
170-174.
• Fulbag Singh and Balwinder Singh (2006), "Funds management in the central co-
operative banks of Punjab- an analysis of financial margin", The ICFAI Journal of
Management, Vol. 5, 74-80.
• Geeta Sharma and Ganesh Kawadia (2006), "Efficiency of urban co-operative banks of
Maharashtra: A DEA Analysis", The ICFAI Journal of Management, Vol. 5, Issue 4.
• Harish Kumar Singla (2008), "Financial performance of banks in India", The ICFAI
Journal of Management, Vol. 7, Issue 1.
• Jain (2001),“Comparative study of performance of District Central Co-operative Banks
(DCCBs) of Western India i.e. Maharashtra, Gujarat & Rajasthan for the year 1999-2000
from the point of view of net profit/loss”, NAFSCOB Bulletin, April-June 2001.
• Ohlson, J.A. (1980), "Financial Ratios and the Probabilistic Prediction of Bankruptcy,"
Journal of Accounting Research, No. 18, 109-131.
• Ramesha and Nagaraju (2007), "Prudential Standards and the performance of Urban
Co-operative Banks in India: An Empirical Investigation", The ICFAI Journal of Financial
Risk Management, June, 2007.
• Taffler R J (1982), “Forecasting company failure in the U.K. using discriminant analysis
and financial ratio data,” Journal of the Royal Statistical society, Vol. 145, 342-358
• Urs Niranjan Raj B and Chitambaram K (2000), “Measuring the performance of District
Co-operative Banks”, NAFSCOB Bulletin, October-December, 2000.
• Ved Pal & N S Malik (2007), "A multivariate analysis of the financial characteristics of
commercial banks in India", The ICFAI Journal of Management, Vol. 6, Issue 3.
TEXT AND BOOKS REFERENCES:

International Journal of Computing and Business Research (IJCBR)
Volume 1, N. 1 December - 2010
• Justin Paul and Padmalatha Suresh (2008),“Management of Banking and Financial
Services”, Second impression, Dorling Kindersley (India) Pvt. Ltd., PHI, Chapter: 6, 78-
116.
• Shiang-Tai Liu (2009), "Slacks-based efficiency measures for predicting bank
performance", Graduate School of Business and Management, Vanung University,
Chung-Li, Taiwan.
• Vijay Mavaluri, Pradeep Boppana and Nagarjuna (2006), "Measurement of efficiency of
banks in India" University Library of Munich, Germany, MPRA Paper 17350, Aug 2006.
• KC Shekhar and Lekshmy Shekhar (2007), ‘Banking theory and practice’, Nineteenth
edition, reprint 2007, Vikas publishing house Pvt. ltd. (India), Chapter: 16, pp. 356-374.
• Ajai S. Gaur (2008), ‘Statistical Methods for practice and research; A guide to data
analysis using SPSS’, Response Books, A division of SAGE Publications, New Delhi.
Chapters 4 and 5.
……………………………….*******************************…………………………….