financial technology sector review · financial technology sector review technology, media &...
TRANSCRIPT

Investment banking services are provided by Harris Williams LLC and Solebury Capital LLC, registered broker-dealers and members of FINRA and SIPC, and Harris Williams & Co. Ltd, which is a private limited company incorporated under English law with its registered office at 5th Floor, 6 St. Andrew Street, London EC4A 3AE, UK, registered with the Registrar of Companies for England and Wales (registration number 07078852). Harris Williams & Co. Ltd is authorized and regulated by the Financial Conduct Authority. Harris Williams & Co. is a trade name under which Harris Williams LLC and Harris Williams & Co. Ltd conduct business.
www.harriswilliams.com
FINANCIAL TECHNOLOGY SECTOR REVIEWTECHNOLOGY, MEDIA & TELECOM GROUP │ Q4 2017
PAGE |
FINANCIAL TECHNOLOGY SECTOR REVIEW
TECHNOLOGY, MEDIA & TELECOM GROUP │ Q4 2017
1
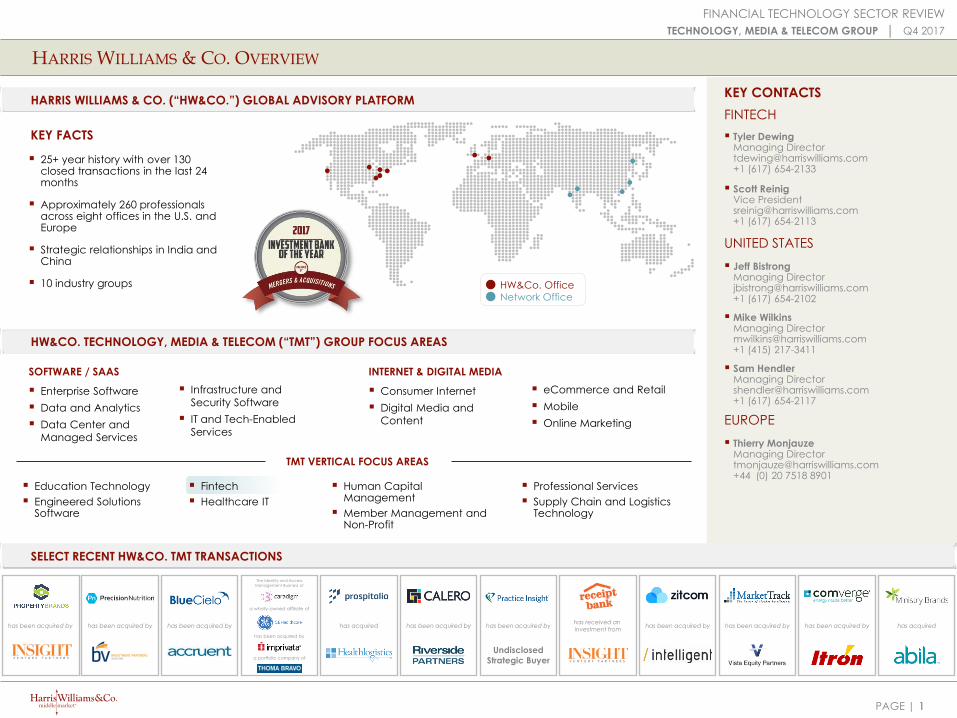
HARRIS WILLIAMS & CO. OVERVIEW
HARRIS WILLIAMS & CO. (“HW&CO.”) GLOBAL ADVISORY PLATFORM
SOFTWARE / SAAS
Enterprise Software
Data and Analytics
Data Center and
Managed Services
Infrastructure and
Security Software
IT and Tech-Enabled
Services
INTERNET & DIGITAL MEDIA
Consumer Internet
Digital Media and
Content
eCommerce and Retail
Mobile
Online Marketing
HW&CO. TECHNOLOGY, MEDIA & TELECOM (“TMT”) GROUP FOCUS AREAS
SELECT RECENT HW&CO. TMT TRANSACTIONS
TMT VERTICAL FOCUS AREAS
25+ year history with over 130closed transactions in the last 24months
Approximately 260 professionalsacross eight offices in the U.S. andEurope
Strategic relationships in India andChina
10 industry groups
KEY FACTS
1
HW&Co. Office
Network Office
Education Technology
Engineered SolutionsSoftware
Fintech
Healthcare IT
Professional Services
Supply Chain and LogisticsTechnology
Human CapitalManagement
Member Management andNon-Profit
has acquiredhas been acquired byhas been acquired by has been acquired byhas received an
investment fromhas been acquired by
Undisclosed
Strategic Buyer
has been acquired byhas acquiredhas been acquired by has been acquired by
The Identity and Access
Management Business of
a wholly-owned affiliate of
has been acquired by
a portfolio company of
KEY CONTACTS
FINTECH
Tyler DewingManaging [email protected]+1 (617) 654-2133
Scott ReinigVice [email protected]+1 (617) 654-2113
UNITED STATES
Jeff BistrongManaging [email protected]+1 (617) 654-2102
Mike WilkinsManaging [email protected]+1 (415) 217-3411
Sam HendlerManaging [email protected]+1 (617) 654-2117
EUROPE
Thierry MonjauzeManaging [email protected]+44 (0) 20 7518 8901
has been acquired by
PAGE | 2
FINANCIAL TECHNOLOGY SECTOR REVIEW
TECHNOLOGY, MEDIA & TELECOM GROUP │ Q4 2017
SaaS solutions that enable grants, giving, and financial management for the non-profit communityhas been
acquired by
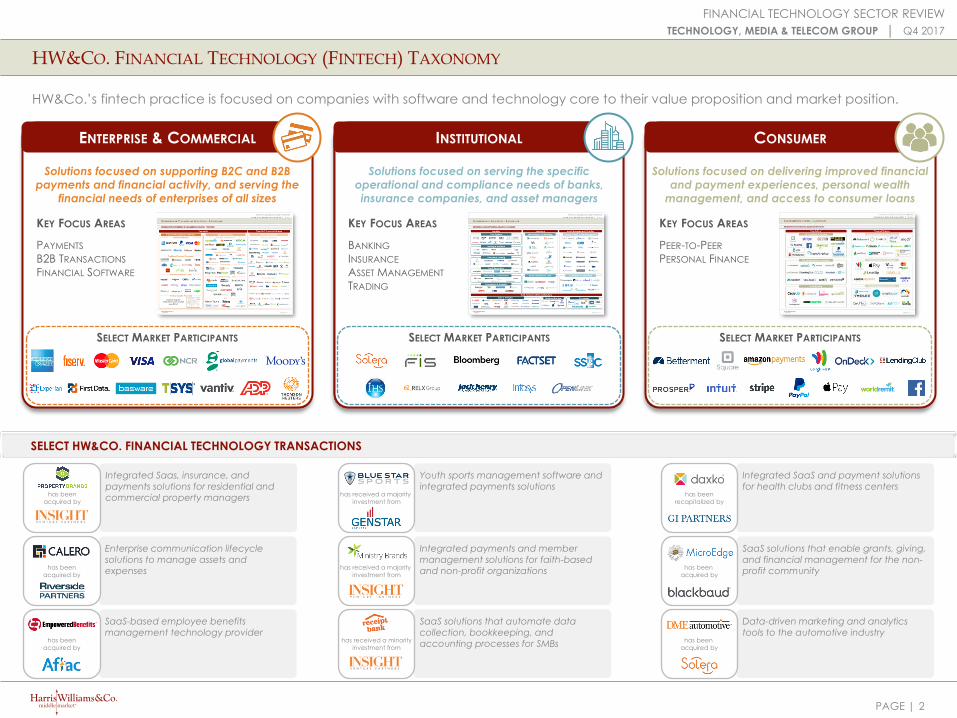
HW&CO. FINANCIAL TECHNOLOGY (FINTECH) TAXONOMY
HW&Co.’s fintech practice is focused on companies with software and technology core to their value proposition and market position.
SELECT HW&CO. FINANCIAL TECHNOLOGY TRANSACTIONS
ENTERPRISE & COMMERCIAL INSTITUTIONAL
SELECT MARKET PARTICIPANTS SELECT MARKET PARTICIPANTS SELECT MARKET PARTICIPANTS
KEY FOCUS AREAS
PAYMENTS
B2B TRANSACTIONS
FINANCIAL SOFTWARE
Solutions focused on supporting B2C and B2B payments and financial activity, and serving the
financial needs of enterprises of all sizes
KEY FOCUS AREAS
PEER-TO-PEER
PERSONAL FINANCE
Solutions focused on delivering improved financial and payment experiences, personal wealth
management, and access to consumer loans
Solutions focused on serving the specific operational and compliance needs of banks, insurance companies, and asset managers
KEY FOCUS AREAS
BANKING
INSURANCE
ASSET MANAGEMENT
TRADING
CONSUMER
SaaS-based employee benefits management technology provider
has been
acquired by
Youth sports management software and integrated payments solutions
has received a majority
investment from
SaaS solutions that automate data collection, bookkeeping, and accounting processes for SMBshas received a minority
investment from
Data-driven marketing and analytics tools to the automotive industry
has been
acquired by
Integrated payments and member management solutions for faith-based and non-profit organizationshas received a majority
investment from
Enterprise communication lifecycle solutions to manage assets and expenseshas been
acquired by
Integrated SaaS and payment solutions for health clubs and fitness centers
has been
recapitalized by
Integrated Saas, insurance, and payments solutions for residential and commercial property managershas been
acquired by
PAGE | 3
FINANCIAL TECHNOLOGY SECTOR REVIEW
TECHNOLOGY, MEDIA & TELECOM GROUP │ Q4 2017
RISK
MGMT
UNDER-
WRITING
CORE
SYSTEMS
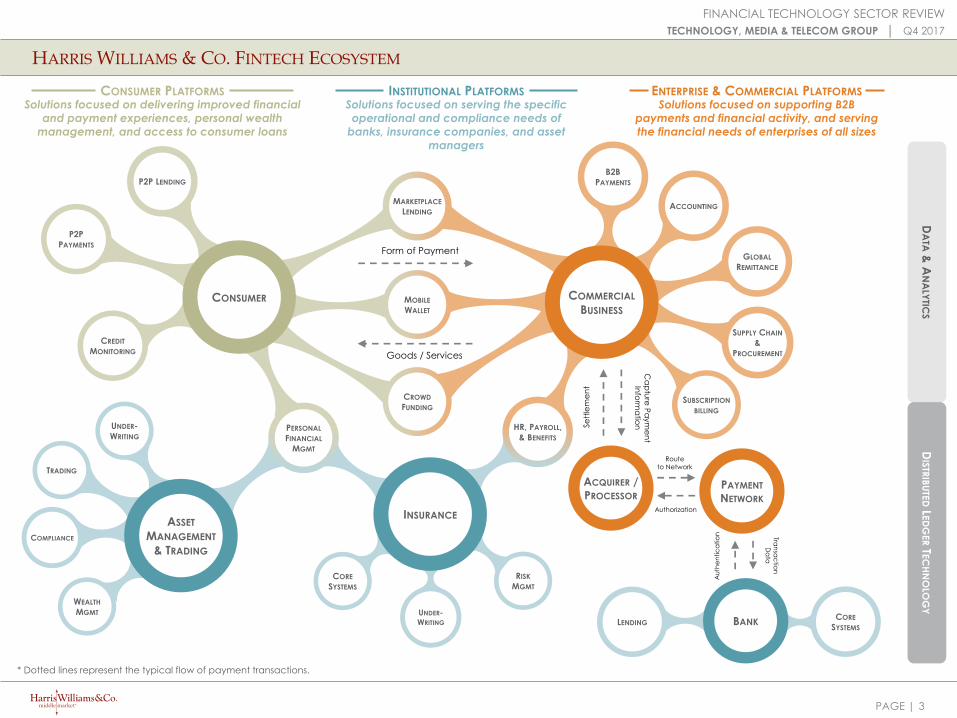
HARRIS WILLIAMS & CO. FINTECH ECOSYSTEM
P2P
PAYMENTS
ACQUIRER / PROCESSOR
PAYMENT
NETWORK
P2P LENDING
CREDIT
MONITORING
Form of Payment
Goods / Services
MOBILE
WALLETC
ap
ture
Pa
ym
en
t
Info
rma
tionS
ett
lem
en
t
ACCOUNTINGMARKETPLACE
LENDING
B2B
PAYMENTS
GLOBAL
REMITTANCE
SUPPLY CHAIN
&
PROCUREMENT
SUBSCRIPTION
BILLING
CROWD
FUNDING
Authorization
Tran
sac
tion
Da
ta
Route
to Network
CORE
SYSTEMSLENDING BANK
INSURANCE
COMPLIANCE
TRADING
UNDER-
WRITING
ASSET
MANAGEMENT
& TRADING
WEALTH
MGMT
HR, PAYROLL,
& BENEFITS
CONSUMER
Au
the
ntic
atio
n
PERSONAL
FINANCIAL
MGMT
DA
TA&
AN
ALY
TICS
DIS
TRIB
UTE
DLED
GER
TEC
HN
OLO
GY
COMMERCIAL
BUSINESS
* Dotted lines represent the typical flow of payment transactions.
Solutions focused on supporting B2B payments and financial activity, and serving the financial needs of enterprises of all sizes
Solutions focused on delivering improved financial and payment experiences, personal wealth
management, and access to consumer loans
Solutions focused on serving the specific operational and compliance needs of
banks, insurance companies, and asset managers
CONSUMER PLATFORMS INSTITUTIONAL PLATFORMS ENTERPRISE & COMMERCIAL PLATFORMS
PAGE | 4
FINANCIAL TECHNOLOGY SECTOR REVIEW
TECHNOLOGY, MEDIA & TELECOM GROUP │ Q4 2017
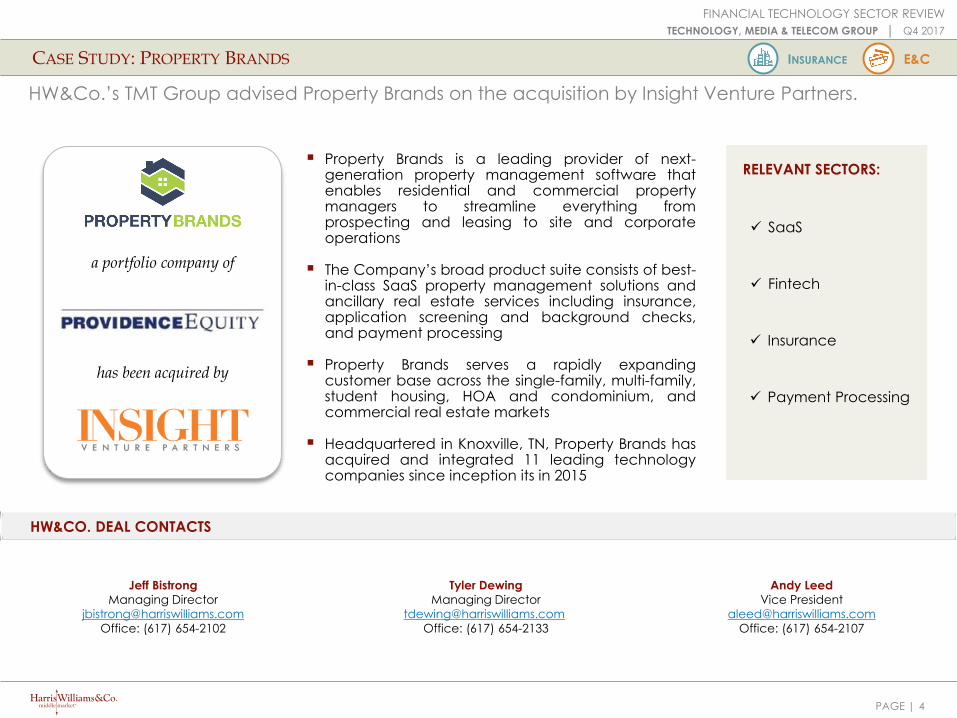
CASE STUDY: PROPERTY BRANDS
HW&CO. DEAL CONTACTS
HW&Co.’s TMT Group advised Property Brands on the acquisition by Insight Venture Partners.
E&C
RELEVANT SECTORS:
SaaS
Insurance
Payment Processing
Fintech
Property Brands is a leading provider of next-generation property management software thatenables residential and commercial propertymanagers to streamline everything fromprospecting and leasing to site and corporateoperations
The Company’s broad product suite consists of best-in-class SaaS property management solutions andancillary real estate services including insurance,application screening and background checks,and payment processing
Property Brands serves a rapidly expandingcustomer base across the single-family, multi-family,student housing, HOA and condominium, andcommercial real estate markets
Headquartered in Knoxville, TN, Property Brands hasacquired and integrated 11 leading technologycompanies since inception its in 2015
Jeff Bistrong
Managing Director
Office: (617) 654-2102
Andy Leed
Vice President
Office: (617) 654-2107
Tyler Dewing
Managing Director
Office: (617) 654-2133
a portfolio company of
has been acquired by
INSURANCE
PAGE | 5
FINANCIAL TECHNOLOGY SECTOR REVIEW
TECHNOLOGY, MEDIA & TELECOM GROUP │ Q4 2017
0.0x
10.0x
20.0x
30.0x
40.0x
50.0x
0.0x
5.0x
10.0x
15.0x
20.0x
0.0x
2.5x
5.0x
7.5x
10.0x
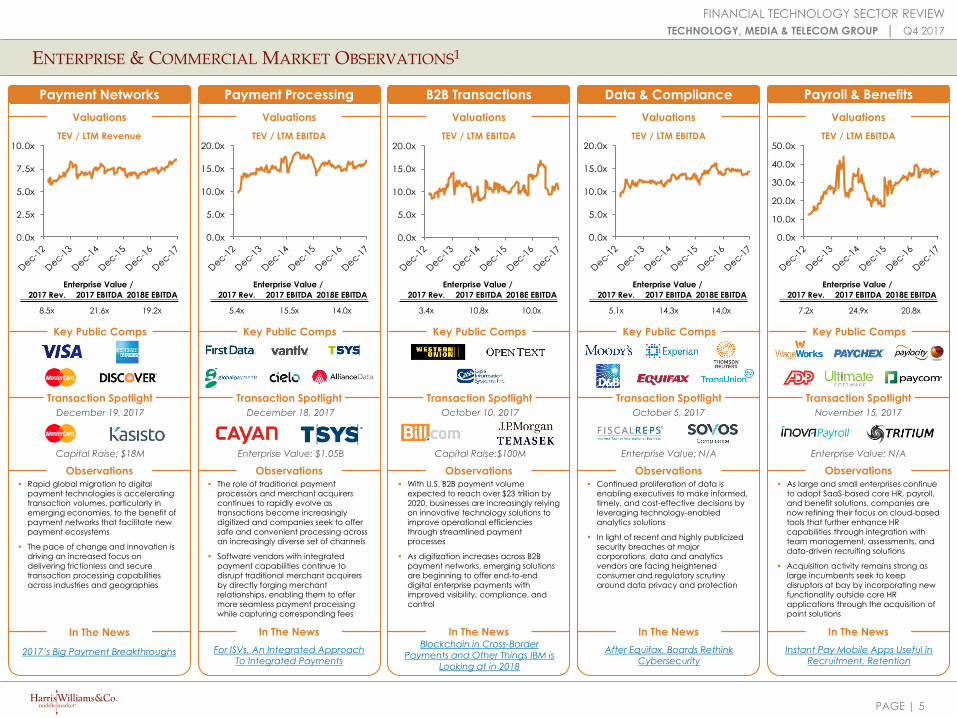
7.2x 24.9x 20.8x5.1x 14.3x 14.0x3.4x 10.8x 10.0x5.4x 15.5x 14.0x8.5x 21.6x 19.2x
Payroll & Benefits
Valuations
Observations
ENTERPRISE & COMMERCIAL MARKET OBSERVATIONS1
Payment Networks Payment Processing B2B Transactions
Valuations
Observations
Valuations
Observations
Valuations
Observations
Data & Compliance
Valuations
Observations
TEV / LTM Revenue TEV / LTM EBITDA TEV / LTM EBITDA TEV / LTM EBITDA TEV / LTM EBITDA
Transaction Spotlight
In The NewsIn The News In The News In The News In The News
December 18, 2017
Enterprise Value: $1.05B
Transaction Spotlight Transaction Spotlight Transaction Spotlight Transaction Spotlight
December 19, 2017
Capital Raise: $18M
October 10, 2017
Capital Raise:$100M
October 5, 2017
Enterprise Value: N/A
November 15, 2017
Enterprise Value: N/A
As large and small enterprises continue
to adopt SaaS-based core HR, payroll,
and benefit solutions, companies are
now refining their focus on cloud-based
tools that further enhance HR
capabilities through integration with
team management, assessments, and
data-driven recruiting solutions
Acquisition activity remains strong as
large incumbents seek to keep
disruptors at bay by incorporating new
functionality outside core HR
applications through the acquisition of
point solutions
Rapid global migration to digital
payment technologies is accelerating
transaction volumes, particularly in
emerging economies, to the benefit of
payment networks that facilitate new
payment ecosystems
The pace of change and innovation is
driving an increased focus on
delivering frictionless and secure
transaction processing capabilities
across industries and geographies
The role of traditional payment
processors and merchant acquirers
continues to rapidly evolve as
transactions become increasingly
digitized and companies seek to offer
safe and convenient processing across
an increasingly diverse set of channels
Software vendors with integrated
payment capabilities continue to
disrupt traditional merchant acquirers
by directly forging merchant
relationships, enabling them to offer
more seamless payment processing
while capturing corresponding fees
With U.S. B2B payment volume
expected to reach over $23 trillion by
2020, businesses are increasingly relying
on innovative technology solutions to
improve operational efficiencies
through streamlined payment
processes
As digitization increases across B2B
payment networks, emerging solutions
are beginning to offer end-to-end
digital enterprise payments with
improved visibility, compliance, and
control
Continued proliferation of data is
enabling executives to make informed,
timely, and cost-effective decisions by
leveraging technology-enabled
analytics solutions
In light of recent and highly publicized
security breaches at major
corporations, data and analytics
vendors are facing heightened
consumer and regulatory scrutiny
around data privacy and protection
2017’s Big Payment Breakthroughs After Equifax, Boards Rethink Cybersecurity
Instant Pay Mobile Apps Useful in Recruitment, Retention
Key Public CompsKey Public Comps Key Public Comps Key Public Comps Key Public Comps
Blockchain in Cross-Border Payments and Other Things IBM is
Looking at in 2018
For ISVs, An Integrated Approach To Integrated Payments
Enterprise Value /
2017 Rev. 2017 EBITDA 2018E EBITDA
Enterprise Value /
2017 Rev. 2017 EBITDA 2018E EBITDA
Enterprise Value /
2017 Rev. 2017 EBITDA 2018E EBITDA
Enterprise Value /
2017 Rev. 2017 EBITDA 2018E EBITDA
Enterprise Value /
2017 Rev. 2017 EBITDA 2018E EBITDA
0.0x
5.0x
10.0x
15.0x
20.0x
0.0x
5.0x
10.0x
15.0x
20.0x

PAGE | 6
FINANCIAL TECHNOLOGY SECTOR REVIEW
TECHNOLOGY, MEDIA & TELECOM GROUP │ Q4 2017
0.0x
5.0x
10.0x
15.0x
20.0x
0.0x
10.0x
20.0x
30.0x
40.0x
0.0x
5.0x
10.0x
15.0x
20.0x
25.0x
1.7x 1.5x4.3x 16.6x 14.7x4.8x 13.5x 12.5x7.8x 22.5x 18.9x6.2x 17.1x 15.6x
Price /
2017 Book Value 2018E Book Value
Observations Observations Observations Observations Observations
INSTITUTIONAL AND CONSUMER MARKET OBSERVATIONS1
Banking Insurance AMT P2P Transfers Marketplace Lending
Transaction Spotlight Transaction Spotlight Transaction Spotlight Transaction Spotlight Transaction Spotlight
In The News In The NewsIn The News In The News In The News
December 5, 2017
Enterprise Value: N/A
October 23, 2017
Capital Raise: $28M
September 7, 2017
Enterprise Value: $720M
December 7, 2017
Capital Raise: $40M
November 9, 2017
Capital Raise: $220M
Valuations
TEV / LTM EBITDA
Valuations
TEV / LTM EBITDA
Valuations
TEV / LTM EBITDA
Valuations
TEV / LTM Revenue
Valuations
Price / Book Value
Strong consumer appetite for
unbundled and digital-native banking
solutions and services continues to
force traditional financial institutions to
innovate or lose market share
Legacy banks are at a crossroads
where they must choose to either build
and launch digital solutions that may
cannibalize their traditional business
lines, acquire emerging challengers to
maintain a competitive advantage, or
partner to expand their product
offering
Insurers continue to increase
investment in data and analytics
offerings to better underwrite risk
through improved insight into customer
behavior, and automation to more
efficiently process claims
New technology platforms focused on
user experiences continue to drive
customer acquisition costs down and
disrupt broker-driven business models
Software has given rise to new vertical-
specific insurance models, putting
increased pressure on traditional
providers
Asset managers continue to adopt
software applications to modernize
service offerings, enhance client
engagement through better
communication tools, and attract
digitally-focused customers
Facing competition and fee
compression from digital-first robo-
advising platforms, traditional AMT
providers are now adopting hybrid
advisory models, or a combination of
automated and professional advice, to
attract and retain clients
Peer-to-peer payments, particularly
those facilitated through mobile
channels, have experienced
accelerating growth as consumer
preferences continue to shift toward
digital solutions
The growing demand for peer-to-peer
transfers has attracted a variety of new
entrants ranging from nimble startups to
large financial institutions, all in an effort
to monetize scaling volumes and
enhance user experience
Alternative lenders are increasingly
shifting away from high risk and
unprofitable marketplace funding
models toward more traditional
balance sheet lending approaches
P2P lending platforms continue to face
competition from traditional lenders
with low costs of capital and are
frequently turning to partnerships,
diversified funding sources, and adding
new products to fuel growth
Industry specific platforms continue to
garner interest from consumers, but are
still maturing
High-Tech Lenders Target the Decades-Old Store Credit Card
Fintech Startups Seek to Shake Up Money-Transfer Industry
The Top Tech Priorities for Banks in 2018
Amazon Considers Entering Insurtech Market
JPMorgan Chase Powers Up Robo-Adviser for Fintech Race
Key Public CompsKey Public Comps Key Public Comps Key Public Comps Key Public Comps
Enterprise Value /
2017 Rev. 2017 EBITDA 2018E EBITDA
Enterprise Value /
2017 Rev. 2017 EBITDA 2018E EBITDA
Enterprise Value /
2017 Rev. 2017 EBITDA 2018E EBITDA
Enterprise Value /
2017 Rev. 2017 EBITDA 2018E EBITDA
0.0x
1.0x
2.0x
3.0x
4.0x
5.0x
6.0x
0.0x
2.5x
5.0x
7.5x

PAGE |
FINANCIAL TECHNOLOGY SECTOR REVIEW
TECHNOLOGY, MEDIA & TELECOM GROUP │ Q4 2017
7
J.P. Morgan’s acquisition of WePay
WePay is a provider of integrated payments solutions for SaaS and crowdfunding platforms
The Company’s technology leverages APIs to deliver simplified customer onboarding and activation of
payments functionality
The acquisition represents J.P. Morgan’s first sizable acquisition of a financial-technology company with plans
to roll out WePay’s technology to J.P. Morgan’s 4 million small-business customers
Ent. Value: $220MRevenue: $57.8M
EV / Revenue: 3.8xEV / EBITDA: NA
Announced: October 17, 2017
PAYMENT
PROCESSING
SELECT FINTECH M&A TRANSACTIONS1
SUBSECTOR
PAYMENT
PROCESSING
TSYS’s acquisition of Cayan
Cayan is a payment processing company focused on integrated payment solutions and merchant acquiring
The Company provides technology-led acquiring services to over 70,000 merchants and 100+ integrated
partners primarily within the small and medium-sized merchant landscape
The acquisition of Cayan’s unified commerce solutions will strengthen TSYS’ competitive position by offering a
broader set of value-added merchant products and servicesEnt. Value: $1.1BRevenue: NA
EV / Revenue: NAEV / EBITDA: NA
Announced: December 18, 2017
First Data’s acquisition of BluePay
BluePay is a provider of technology-enabled payment processing solutions for merchants in the U.S. and Canada
The Company processes approximately $19 billion of annual volume for more than 77,000 merchants and is
integrated into more than 450 software platforms
Following First Data’s recent acquisition of CardConnect, First Data will be able to further enhance its service
offerings to joint venture and strategic alliances, and BluePay’s highly integrated solutions will complement and
benefit from CardConnect’s merchant and partner management tools
Announced: October 20, 2017
Ent. Value: $760MRevenue: NA
EV / Revenue: NAEV / EBITDA: NA
PAYMENT
PROCESSING
COMPLIANCE &
ANALYTICS
H.I.G. Capital’s acquisition of Velocity Solutions
Velocity Solutions offers software and technology-enabled solutions to banks, credit unions, and insurers to
drive revenue, ensure compliance, and manage risk
The Company’s solutions are centered around deposited account activity and transactional trends,
servicing over 25 million consumers and business owners
H.I.G. expects to bolster Velocity’s product offering by investing in product development and adding
solutions that meet the evolving needs of its clients
Ent. Value: NARevenue: NA
EV / Revenue: NAEV / EBITDA: NA
Announced: December 5, 2017
DATA &
ANALYTICS
ION Investment Group’s majority investment in Dealogic
Dealogic is a provider of a SaaS-based financial content and analytics platform connecting banks and
investors
The Company partners with hundreds of firms worldwide, including the top 50 investment banks, providing
integrated content, analytics, and technology that helps clients throughout all stages of the deal process
Ion’s investment is expected to accelerate the digitization and automation of capital markets workflows and
improve communications and interactions amongst financial institutions, investors, and issuer communities
Ent. Value: NARevenue: NA
EV / Revenue: NAEV / EBITDA: NA
Announced: November 22, 2017
PAGE |
FINANCIAL TECHNOLOGY SECTOR REVIEW
TECHNOLOGY, MEDIA & TELECOM GROUP │ Q4 2017
8
Q4-14 Q1-15 Q2-15 Q3-15 Q4-15 Q1-16 Q2-16 Q3-16 Q4-16 Q1-17 Q2-17 Q3-17 Q4-17
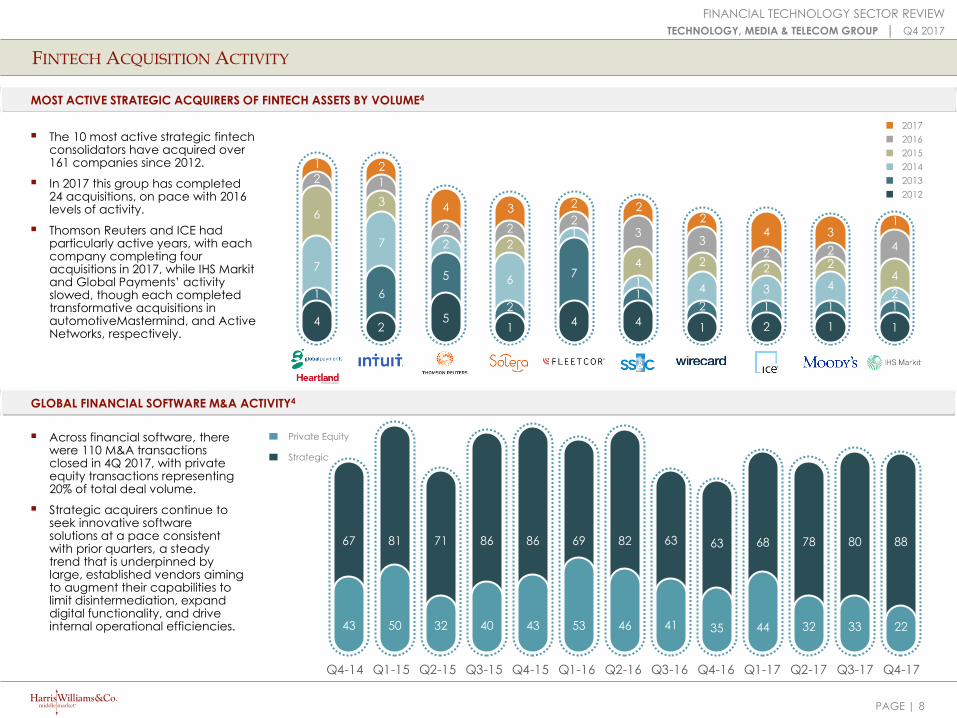
FINTECH ACQUISITION ACTIVITY
MOST ACTIVE STRATEGIC ACQUIRERS OF FINTECH ASSETS BY VOLUME4
The 10 most active strategic fintechconsolidators have acquired over161 companies since 2012.
In 2017 this group has completed24 acquisitions, on pace with 2016levels of activity.
Thomson Reuters and ICE hadparticularly active years, with eachcompany completing fouracquisitions in 2017, while IHS Markitand Global Payments’ activityslowed, though each completedtransformative acquisitions inautomotiveMastermind, and ActiveNetworks, respectively.
Across financial software, therewere 110 M&A transactionsclosed in 4Q 2017, with privateequity transactions representing20% of total deal volume.
Strategic acquirers continue toseek innovative softwaresolutions at a pace consistentwith prior quarters, a steadytrend that is underpinned bylarge, established vendors aimingto augment their capabilities tolimit disintermediation, expanddigital functionality, and driveinternal operational efficiencies.
1
4
1
7
6
2
6
7
3
1
2
5
2
2
4
5
2017
2016
2015
2014
2013
2012
Private Equity
Strategic
1
2
6
2
2
3
1
2
4
2
3
2 13
22
4
1
1 1
12
4
4
1
4
7
12
2
67
43
81
50
71
32
86
40
86
43
69
53
82
46
63
41
63
35
68
44
78
32
80
33
88
22
GLOBAL FINANCIAL SOFTWARE M&A ACTIVITY4
2
3
4
11
4
2
4
2
2
3
1
2
PAGE | 9
FINANCIAL TECHNOLOGY SECTOR REVIEW
TECHNOLOGY, MEDIA & TELECOM GROUP │ Q4 2017
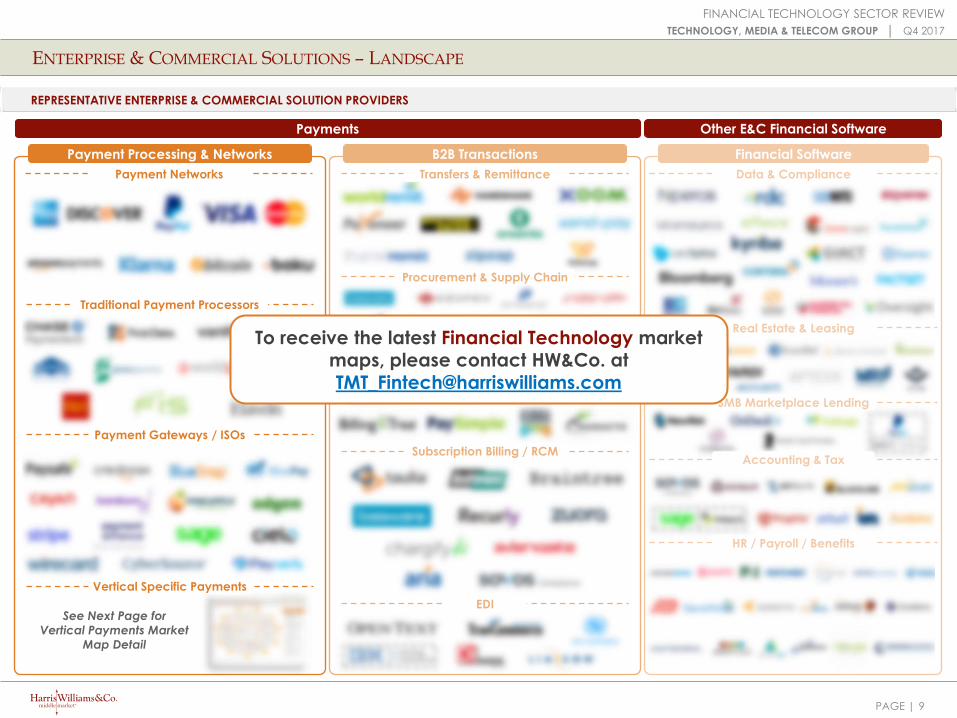
ENTERPRISE & COMMERCIAL SOLUTIONS – LANDSCAPE
REPRESENTATIVE ENTERPRISE & COMMERCIAL SOLUTION PROVIDERS
Payments Other E&C Financial Software
B2B TransactionsPayment Processing & Networks Financial Software
Traditional Payment Processors
Payment Networks
Vertical Specific Payments
Transfers & Remittance
Procurement & Supply Chain
EDI
Bill Payment
Subscription Billing / RCM
Data & Compliance
Real Estate & Leasing
SMB Marketplace Lending
Accounting & Tax
HR / Payroll / Benefits
Payment Gateways / ISOs
See Next Page for
Vertical Payments Market
Map Detail
To receive the latest Financial Technology market
maps, please contact HW&Co. at
PAGE | 10
FINANCIAL TECHNOLOGY SECTOR REVIEW
TECHNOLOGY, MEDIA & TELECOM GROUP │ Q4 2017
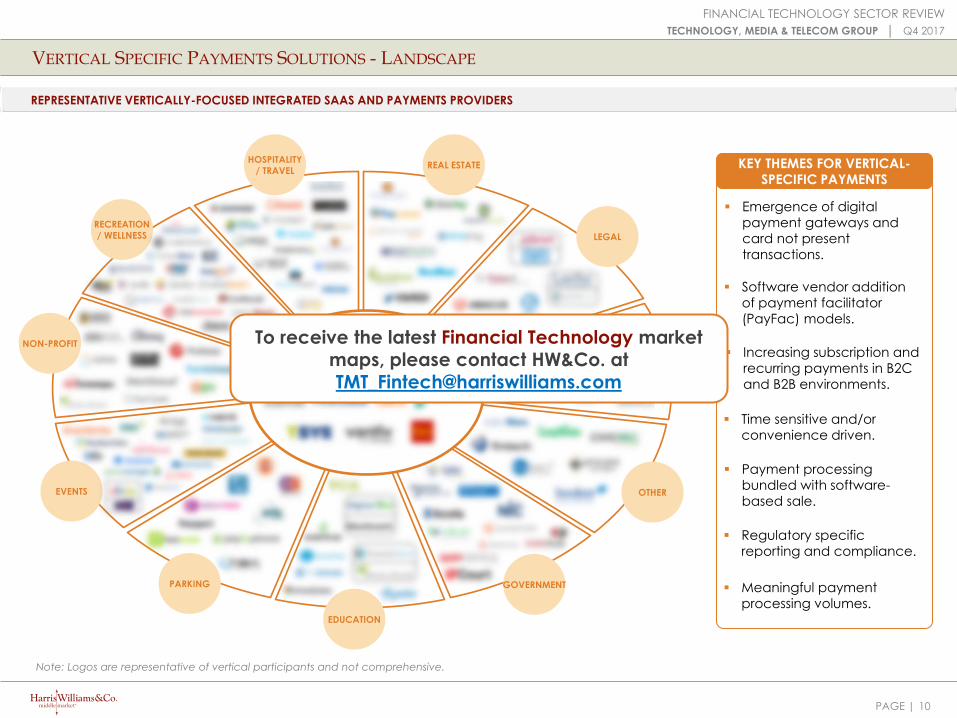
GOVERNMENT
HOSPITALITY / TRAVEL
REAL ESTATE
PARKING
LEGAL
OTHER
HEALTHCARE
RECREATION / WELLNESS
EDUCATION
EVENTS
NON-PROFIT
KEY THEMES FOR VERTICAL-
SPECIFIC PAYMENTS
Emergence of digital
payment gateways and
card not present
transactions.
Increasing subscription and
recurring payments in B2C
and B2B environments.
Time sensitive and/or
convenience driven.
Payment processing
bundled with software-
based sale.
Regulatory specific
reporting and compliance.
Meaningful payment
processing volumes.
Software vendor addition
of payment facilitator
(PayFac) models.
VERTICAL SPECIFIC PAYMENTS SOLUTIONS - LANDSCAPE
REPRESENTATIVE VERTICALLY-FOCUSED INTEGRATED SAAS AND PAYMENTS PROVIDERS
Note: Logos are representative of vertical participants and not comprehensive.
To receive the latest Financial Technology market
maps, please contact HW&Co. at
PAGE | 11
FINANCIAL TECHNOLOGY SECTOR REVIEW
TECHNOLOGY, MEDIA & TELECOM GROUP │ Q4 2017
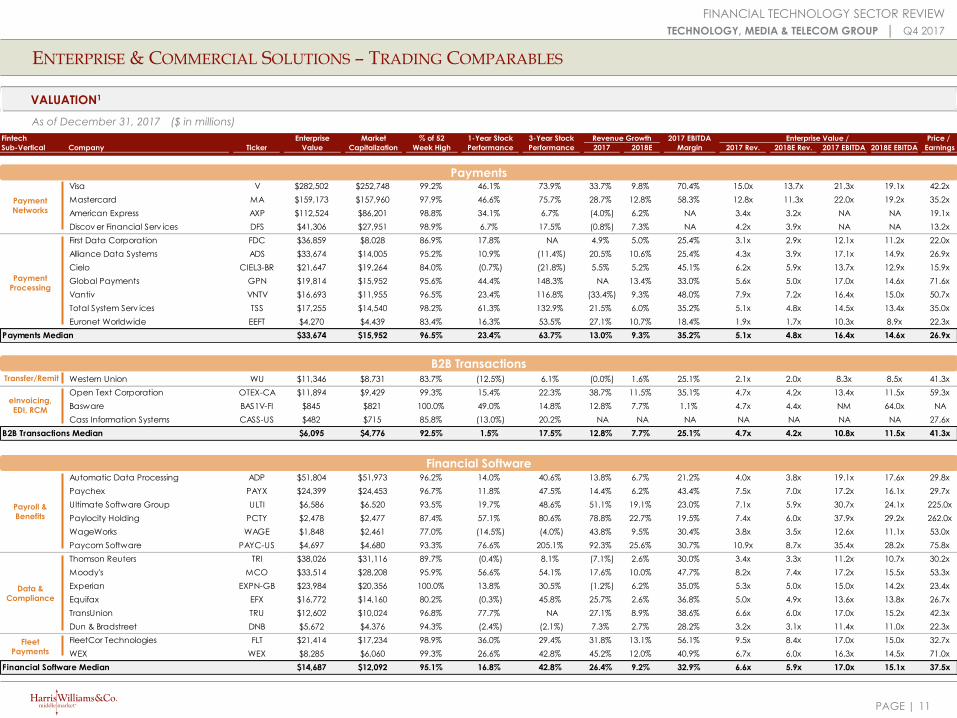
Automatic Data Processing ADP $51,804 $51,973 96.2% 14.0% 40.6% 13.8% 6.7% 21.2% 4.0x 3.8x 19.1x 17.6x 29.8x
Paychex PAYX $24,399 $24,453 96.7% 11.8% 47.5% 14.4% 6.2% 43.4% 7.5x 7.0x 17.2x 16.1x 29.7x
Ultimate Software Group ULTI $6,586 $6,520 93.5% 19.7% 48.6% 51.1% 19.1% 23.0% 7.1x 5.9x 30.7x 24.1x 225.0x
Paylocity Holding PCTY $2,478 $2,477 87.4% 57.1% 80.6% 78.8% 22.7% 19.5% 7.4x 6.0x 37.9x 29.2x 262.0x
WageWorks WAGE $1,848 $2,461 77.0% (14.5%) (4.0%) 43.8% 9.5% 30.4% 3.8x 3.5x 12.6x 11.1x 53.0x
Paycom Software PAYC-US $4,697 $4,680 93.3% 76.6% 205.1% 92.3% 25.6% 30.7% 10.9x 8.7x 35.4x 28.2x 75.8x
Thomson Reuters TRI $38,026 $31,116 89.7% (0.4%) 8.1% (7.1%) 2.6% 30.0% 3.4x 3.3x 11.2x 10.7x 30.2x
Moody's MCO $33,514 $28,208 95.9% 56.6% 54.1% 17.6% 10.0% 47.7% 8.2x 7.4x 17.2x 15.5x 53.3x
Experian EXPN-GB $23,984 $20,356 100.0% 13.8% 30.5% (1.2%) 6.2% 35.0% 5.3x 5.0x 15.0x 14.2x 23.4x
Equifax EFX $16,772 $14,160 80.2% (0.3%) 45.8% 25.7% 2.6% 36.8% 5.0x 4.9x 13.6x 13.8x 26.7x
TransUnion TRU $12,602 $10,024 96.8% 77.7% NA 27.1% 8.9% 38.6% 6.6x 6.0x 17.0x 15.2x 42.3x
Dun & Bradstreet DNB $5,672 $4,376 94.3% (2.4%) (2.1%) 7.3% 2.7% 28.2% 3.2x 3.1x 11.4x 11.0x 22.3x
FleetCor Technologies FLT $21,414 $17,234 98.9% 36.0% 29.4% 31.8% 13.1% 56.1% 9.5x 8.4x 17.0x 15.0x 32.7x
WEX WEX $8,285 $6,060 99.3% 26.6% 42.8% 45.2% 12.0% 40.9% 6.7x 6.0x 16.3x 14.5x 71.0x
Financial Software Median $14,687 $12,092 95.1% 16.8% 42.8% 26.4% 9.2% 32.9% 6.6x 5.9x 17.0x 15.1x 37.5x
Visa V $282,502 $252,748 99.2% 46.1% 73.9% 33.7% 9.8% 70.4% 15.0x 13.7x 21.3x 19.1x 42.2x
Mastercard MA $159,173 $157,960 97.9% 46.6% 75.7% 28.7% 12.8% 58.3% 12.8x 11.3x 22.0x 19.2x 35.2x
American Express AXP $112,524 $86,201 98.8% 34.1% 6.7% (4.0%) 6.2% NA 3.4x 3.2x NA NA 19.1x
Discov er Financial Serv ices DFS $41,306 $27,951 98.9% 6.7% 17.5% (0.8%) 7.3% NA 4.2x 3.9x NA NA 13.2x
First Data Corporation FDC $36,859 $8,028 86.9% 17.8% NA 4.9% 5.0% 25.4% 3.1x 2.9x 12.1x 11.2x 22.0x
Alliance Data Systems ADS $33,674 $14,005 95.2% 10.9% (11.4%) 20.5% 10.6% 25.4% 4.3x 3.9x 17.1x 14.9x 26.9x
Cielo CIEL3-BR $21,647 $19,264 84.0% (0.7%) (21.8%) 5.5% 5.2% 45.1% 6.2x 5.9x 13.7x 12.9x 15.9x
Global Payments GPN $19,814 $15,952 95.6% 44.4% 148.3% NA 13.4% 33.0% 5.6x 5.0x 17.0x 14.6x 71.6x
Vantiv VNTV $16,693 $11,955 96.5% 23.4% 116.8% (33.4%) 9.3% 48.0% 7.9x 7.2x 16.4x 15.0x 50.7x
Total System Serv ices TSS $17,255 $14,540 98.2% 61.3% 132.9% 21.5% 6.0% 35.2% 5.1x 4.8x 14.5x 13.4x 35.0x
Euronet Worldwide EEFT $4,270 $4,439 83.4% 16.3% 53.5% 27.1% 10.7% 18.4% 1.9x 1.7x 10.3x 8.9x 22.3x
Payments Median $33,674 $15,952 96.5% 23.4% 63.7% 13.0% 9.3% 35.2% 5.1x 4.8x 16.4x 14.6x 26.9x
Fintech Enterprise Market % of 52 1-Year Stock 3-Year Stock Revenue Growth 2017 EBITDA Enterprise Value / Price /
Sub-Vertical Company Ticker Value Capitalization Week High Performance Performance 2017 2018E Margin 2017 Rev. 2018E Rev. 2017 EBITDA 2018E EBITDA Earnings
ENTERPRISE & COMMERCIAL SOLUTIONS – TRADING COMPARABLES
VALUATION1
As of December 31, 2017
Payments
Financial Software
Payment
Networks
Payment
Processing
Payroll &
Benefits
Fleet
Payments
Transfer/Remit
eInvoicing,
EDI, RCM
Data &
Compliance
B2B Transactions
($ in millions)
Western Union WU $11,346 $8,731 83.7% (12.5%) 6.1% (0.0%) 1.6% 25.1% 2.1x 2.0x 8.3x 8.5x 41.3x
Open Text Corporation OTEX-CA $11,894 $9,429 99.3% 15.4% 22.3% 38.7% 11.5% 35.1% 4.7x 4.2x 13.4x 11.5x 59.3x
Basware BAS1V-FI $845 $821 100.0% 49.0% 14.8% 12.8% 7.7% 1.1% 4.7x 4.4x NM 64.0x NA
Cass Information Systems CASS-US $482 $715 85.8% (13.0%) 20.2% NA NA NA NA NA NA NA 27.6x
B2B Transactions Median $6,095 $4,776 92.5% 1.5% 17.5% 12.8% 7.7% 25.1% 4.7x 4.2x 10.8x 11.5x 41.3x
PAGE | 12
FINANCIAL TECHNOLOGY SECTOR REVIEW
TECHNOLOGY, MEDIA & TELECOM GROUP │ Q4 2017
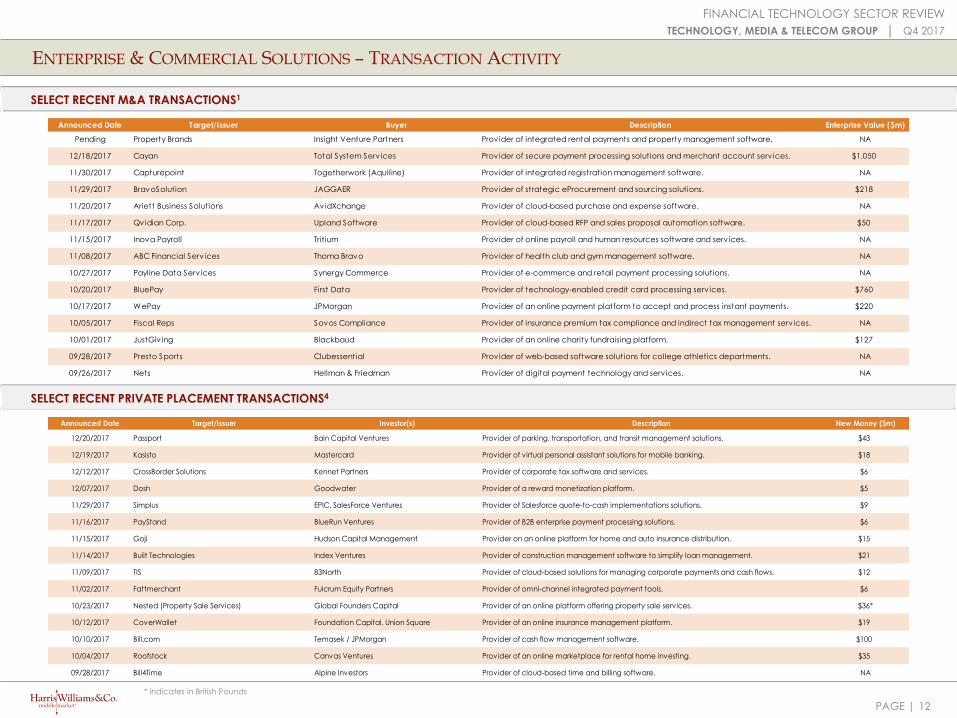
Announced Date Target/Issuer Investor(s) Description New Money ($m)
12/20/2017 Passport Bain Capital Ventures Provider of parking, transportation, and transit management solutions. $43
12/19/2017 Kasisto Mastercard Provider of virtual personal assistant solutions for mobile banking. $18
12/12/2017 CrossBorder Solutions Kennet Partners Provider of corporate tax software and services. $6
12/07/2017 Dosh Goodwater Provider of a reward monetization platform. $5
11/29/2017 Simplus EPIC, SalesForce Ventures Provider of Salesforce quote-to-cash implementations solutions. $9
11/16/2017 PayStand BlueRun Ventures Provider of B2B enterprise payment processing solutions. $6
11/15/2017 Goji Hudson Capital Management Provider on an online platform for home and auto insurance distribution. $15
11/14/2017 Built Technologies Index Ventures Provider of construction management software to simplify loan management. $21
11/09/2017 TIS 83North Provider of cloud-based solutions for managing corporate payments and cash flows. $12
11/02/2017 Fattmerchant Fulcrum Equity Partners Provider of omni-channel integrated payment tools. $6
10/23/2017 Nested (Property Sale Services) Global Founders Capital Provider of an online platform offering property sale services. $36*
10/12/2017 CoverWallet Foundation Capital, Union Square Provider of an online insurance management platform. $19
10/10/2017 Bill.com Temasek / JPMorgan Provider of cash flow management software. $100
10/04/2017 Roofstock Canvas Ventures Provider of an online marketplace for rental home investing. $35
09/28/2017 Bill4Time Alpine Investors Provider of cloud-based time and billing software. NA
Announced Date Target/Issuer Buyer Description Enterprise Value ($m)
Pending Property Brands Insight Venture Partners Provider of integrated rental payments and property management software. NA
12/18/2017 Cayan Total System Serv ices Provider of secure payment processing solutions and merchant account serv ices. $1,050
11/30/2017 Capturepoint Togetherwork (Aquiline) Provider of integrated registration management software. NA
11/29/2017 BravoSolution JAGGAER Provider of strategic eProcurement and sourcing solutions. $218
11/20/2017 Ariett Business Solutions AvidXchange Provider of cloud-based purchase and expense software. NA
11/17/2017 Qvidian Corp. Upland Software Provider of cloud-based RFP and sales proposal automation software. $50
11/15/2017 Inova Payroll Trit ium Provider of online payroll and human resources software and serv ices. NA
11/08/2017 ABC Financial Serv ices Thoma Bravo Provider of health club and gym management software. NA
10/27/2017 Payline Data Serv ices Synergy Commerce Provider of e-commerce and retail payment processing solutions. NA
10/20/2017 BluePay First Data Provider of technology-enabled credit card processing serv ices. $760
10/17/2017 WePay JPMorgan Provider of an online payment platform to accept and process instant payments. $220
10/05/2017 Fiscal Reps Sovos Compliance Provider of insurance premium tax compliance and indirect tax management serv ices. NA
10/01/2017 JustGiv ing Blackbaud Provider of an online charity fundraising platform. $127
09/28/2017 Presto Sports Clubessential Provider of web-based software solutions for college athletics departments. NA
09/26/2017 Nets Hellman & Friedman Provider of digital payment technology and serv ices. NA
ENTERPRISE & COMMERCIAL SOLUTIONS – TRANSACTION ACTIVITY
SELECT RECENT M&A TRANSACTIONS1
SELECT RECENT PRIVATE PLACEMENT TRANSACTIONS4
* indicates in British Pounds

PAGE | 13
FINANCIAL TECHNOLOGY SECTOR REVIEW
TECHNOLOGY, MEDIA & TELECOM GROUP │ Q4 2017
REPRESENTATIVE INSTITUTIONAL SOLUTION PROVIDERS
INSTITUTIONAL SOLUTIONS – LANDSCAPE
Trading, Wealth & Risk Management
Asset Management & Trading
Technology & Underwriting
InsuranceBanking
Lending & Workflow
Core Systems
Compliance & Analytics
Compliance & ReportingNetworking & Collaboration
Alternative Lending
Lead Generation
Multi-Vertical Institutional Solutions
Exchanges
Lead Generation & CRM
Data & Analytics Distributed Ledger
To receive the latest Financial Technology market
maps, please contact HW&Co. at
PAGE | 14
FINANCIAL TECHNOLOGY SECTOR REVIEW
TECHNOLOGY, MEDIA & TELECOM GROUP │ Q4 2017
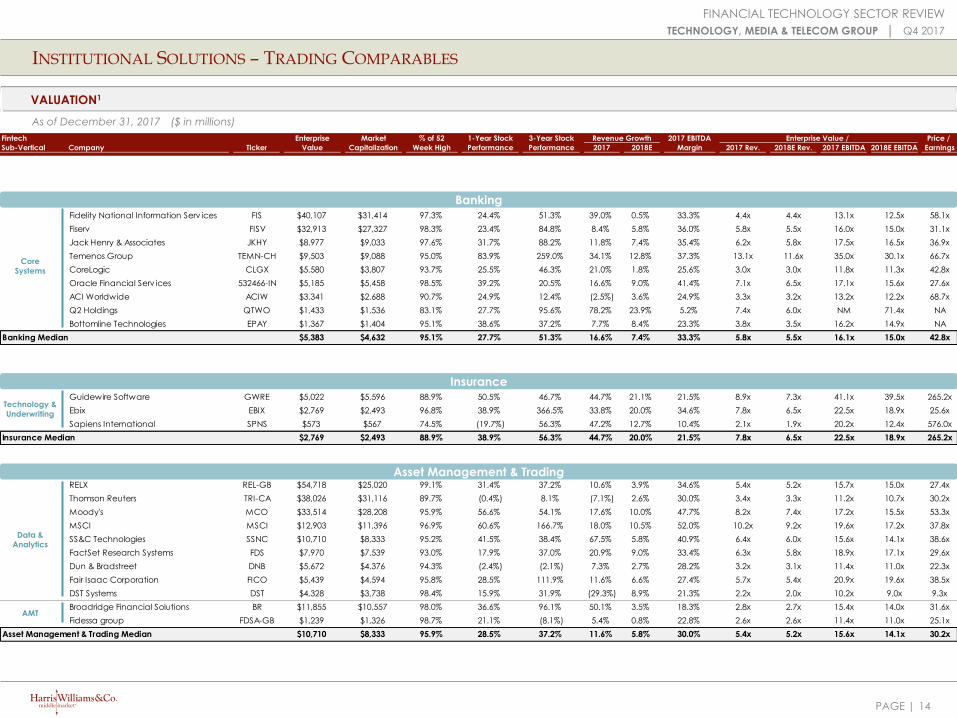
Fintech Enterprise Market % of 52 1-Year Stock 3-Year Stock Revenue Growth 2017 EBITDA Enterprise Value / Price /
Sub-Vertical Company Ticker Value Capitalization Week High Performance Performance 2017 2018E Margin 2017 Rev. 2018E Rev. 2017 EBITDA 2018E EBITDA Earnings
RELX REL-GB $54,718 $25,020 99.1% 31.4% 37.2% 10.6% 3.9% 34.6% 5.4x 5.2x 15.7x 15.0x 27.4x
Thomson Reuters TRI-CA $38,026 $31,116 89.7% (0.4%) 8.1% (7.1%) 2.6% 30.0% 3.4x 3.3x 11.2x 10.7x 30.2x
Moody's MCO $33,514 $28,208 95.9% 56.6% 54.1% 17.6% 10.0% 47.7% 8.2x 7.4x 17.2x 15.5x 53.3x
MSCI MSCI $12,903 $11,396 96.9% 60.6% 166.7% 18.0% 10.5% 52.0% 10.2x 9.2x 19.6x 17.2x 37.8x
SS&C Technologies SSNC $10,710 $8,333 95.2% 41.5% 38.4% 67.5% 5.8% 40.9% 6.4x 6.0x 15.6x 14.1x 38.6x
FactSet Research Systems FDS $7,970 $7,539 93.0% 17.9% 37.0% 20.9% 9.0% 33.4% 6.3x 5.8x 18.9x 17.1x 29.6x
Dun & Bradstreet DNB $5,672 $4,376 94.3% (2.4%) (2.1%) 7.3% 2.7% 28.2% 3.2x 3.1x 11.4x 11.0x 22.3x
Fair Isaac Corporation FICO $5,439 $4,594 95.8% 28.5% 111.9% 11.6% 6.6% 27.4% 5.7x 5.4x 20.9x 19.6x 38.5x
DST Systems DST $4,328 $3,738 98.4% 15.9% 31.9% (29.3%) 8.9% 21.3% 2.2x 2.0x 10.2x 9.0x 9.3x
Broadridge Financial Solutions BR $11,855 $10,557 98.0% 36.6% 96.1% 50.1% 3.5% 18.3% 2.8x 2.7x 15.4x 14.0x 31.6x
Fidessa group FDSA-GB $1,239 $1,326 98.7% 21.1% (8.1%) 5.4% 0.8% 22.8% 2.6x 2.6x 11.4x 11.0x 25.1x
Asset Management & Trading Median $10,710 $8,333 95.9% 28.5% 37.2% 11.6% 5.8% 30.0% 5.4x 5.2x 15.6x 14.1x 30.2x
Guidewire Software GWRE $5,022 $5,596 88.9% 50.5% 46.7% 44.7% 21.1% 21.5% 8.9x 7.3x 41.1x 39.5x 265.2x
Ebix EBIX $2,769 $2,493 96.8% 38.9% 366.5% 33.8% 20.0% 34.6% 7.8x 6.5x 22.5x 18.9x 25.6x
Sapiens International SPNS $573 $567 74.5% (19.7%) 56.3% 47.2% 12.7% 10.4% 2.1x 1.9x 20.2x 12.4x 576.0x
Insurance Median $2,769 $2,493 88.9% 38.9% 56.3% 44.7% 20.0% 21.5% 7.8x 6.5x 22.5x 18.9x 265.2x
Fidelity National Information Serv ices FIS $40,107 $31,414 97.3% 24.4% 51.3% 39.0% 0.5% 33.3% 4.4x 4.4x 13.1x 12.5x 58.1x
Fiserv FISV $32,913 $27,327 98.3% 23.4% 84.8% 8.4% 5.8% 36.0% 5.8x 5.5x 16.0x 15.0x 31.1x
Jack Henry & Associates JKHY $8,977 $9,033 97.6% 31.7% 88.2% 11.8% 7.4% 35.4% 6.2x 5.8x 17.5x 16.5x 36.9x
Temenos Group TEMN-CH $9,503 $9,088 95.0% 83.9% 259.0% 34.1% 12.8% 37.3% 13.1x 11.6x 35.0x 30.1x 66.7x
CoreLogic CLGX $5,580 $3,807 93.7% 25.5% 46.3% 21.0% 1.8% 25.6% 3.0x 3.0x 11.8x 11.3x 42.8x
Oracle Financial Serv ices 532466-IN $5,185 $5,458 98.5% 39.2% 20.5% 16.6% 9.0% 41.4% 7.1x 6.5x 17.1x 15.6x 27.6x
ACI Worldwide ACIW $3,341 $2,688 90.7% 24.9% 12.4% (2.5%) 3.6% 24.9% 3.3x 3.2x 13.2x 12.2x 68.7x
Q2 Holdings QTWO $1,433 $1,536 83.1% 27.7% 95.6% 78.2% 23.9% 5.2% 7.4x 6.0x NM 71.4x NA
Bottomline Technologies EPAY $1,367 $1,404 95.1% 38.6% 37.2% 7.7% 8.4% 23.3% 3.8x 3.5x 16.2x 14.9x NA
Banking Median $5,383 $4,632 95.1% 27.7% 51.3% 16.6% 7.4% 33.3% 5.8x 5.5x 16.1x 15.0x 42.8x
INSTITUTIONAL SOLUTIONS – TRADING COMPARABLES
VALUATION1
Asset Management & Trading
Insurance
Banking
Core
Systems
Technology &
Underwriting
AMT
Data &
Analytics
As of December 31, 2017 ($ in millions)
PAGE | 15
FINANCIAL TECHNOLOGY SECTOR REVIEW
TECHNOLOGY, MEDIA & TELECOM GROUP │ Q4 2017
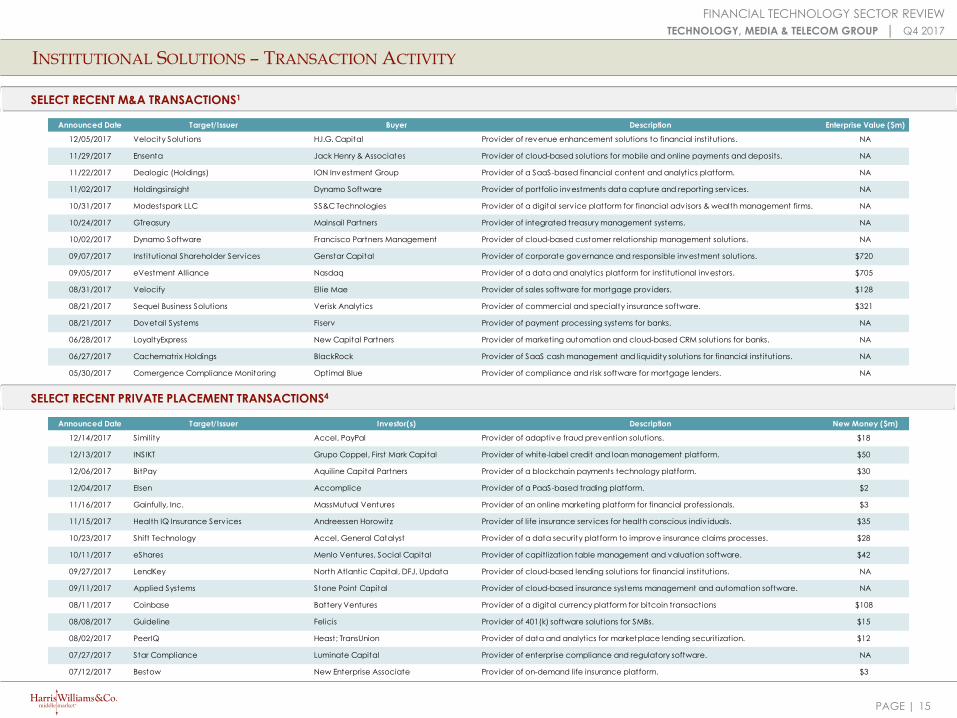
Announced Date Target/Issuer Investor(s) Description New Money ($m)
12/14/2017 Simility Accel, PayPal Provider of adaptive fraud prevention solutions. $18
12/13/2017 INSIKT Grupo Coppel, First Mark Capital Provider of white-label credit and loan management platform. $50
12/06/2017 BitPay Aquiline Capital Partners Provider of a blockchain payments technology platform. $30
12/04/2017 Elsen Accomplice Provider of a PaaS-based trading platform. $2
11/16/2017 Gainfully, Inc. MassMutual Ventures Provider of an online marketing platform for financial professionals. $3
11/15/2017 Health IQ Insurance Serv ices Andreessen Horowitz Provider of life insurance serv ices for health conscious indiv iduals. $35
10/23/2017 Shift Technology Accel, General Catalyst Provider of a data security platform to improve insurance claims processes. $28
10/11/2017 eShares Menlo Ventures, Social Capital Provider of capitlization table management and valuation software. $42
09/27/2017 LendKey North Atlantic Capital, DFJ, Updata Provider of cloud-based lending solutions for financial institutions. NA
09/11/2017 Applied Systems Stone Point Capital Provider of cloud-based insurance systems management and automation software. NA
08/11/2017 Coinbase Battery Ventures Provider of a digital currency platform for bitcoin transactions $108
08/08/2017 Guideline Felicis Provider of 401(k) software solutions for SMBs. $15
08/02/2017 PeerIQ Heast; TransUnion Provider of data and analytics for marketplace lending securitization. $12
07/27/2017 Star Compliance Luminate Capital Provider of enterprise compliance and regulatory software. NA
07/12/2017 Bestow New Enterprise Associate Provider of on-demand life insurance platform. $3
Announced Date Target/Issuer Buyer Description Enterprise Value ($m)
12/05/2017 Velocity Solutions H.I.G. Capital Provider of revenue enhancement solutions to financial institutions. NA
11/29/2017 Ensenta Jack Henry & Associates Provider of cloud-based solutions for mobile and online payments and deposits. NA
11/22/2017 Dealogic (Holdings) ION Investment Group Provider of a SaaS-based financial content and analytics platform. NA
11/02/2017 Holdingsinsight Dynamo Software Provider of portfolio investments data capture and reporting serv ices. NA
10/31/2017 Modestspark LLC SS&C Technologies Provider of a digital serv ice platform for financial advisors & wealth management firms. NA
10/24/2017 GTreasury Mainsail Partners Provider of integrated treasury management systems. NA
10/02/2017 Dynamo Software Francisco Partners Management Provider of cloud-based customer relationship management solutions. NA
09/07/2017 Institutional Shareholder Serv ices Genstar Capital Provider of corporate governance and responsible investment solutions. $720
09/05/2017 eVestment Alliance Nasdaq Provider of a data and analytics platform for institutional investors. $705
08/31/2017 Velocify Ellie Mae Provider of sales software for mortgage providers. $128
08/21/2017 Sequel Business Solutions Verisk Analytics Provider of commercial and specialty insurance software. $321
08/21/2017 Dovetail Systems Fiserv Provider of payment processing systems for banks. NA
06/28/2017 LoyaltyExpress New Capital Partners Provider of marketing automation and cloud-based CRM solutions for banks. NA
06/27/2017 Cachematrix Holdings BlackRock Provider of SaaS cash management and liquidity solutions for financial institutions. NA
05/30/2017 Comergence Compliance Monitoring Optimal Blue Provider of compliance and risk software for mortgage lenders. NA
INSTITUTIONAL SOLUTIONS – TRANSACTION ACTIVITY
SELECT RECENT M&A TRANSACTIONS1
SELECT RECENT PRIVATE PLACEMENT TRANSACTIONS4
PAGE | 16
FINANCIAL TECHNOLOGY SECTOR REVIEW
TECHNOLOGY, MEDIA & TELECOM GROUP │ Q4 2017
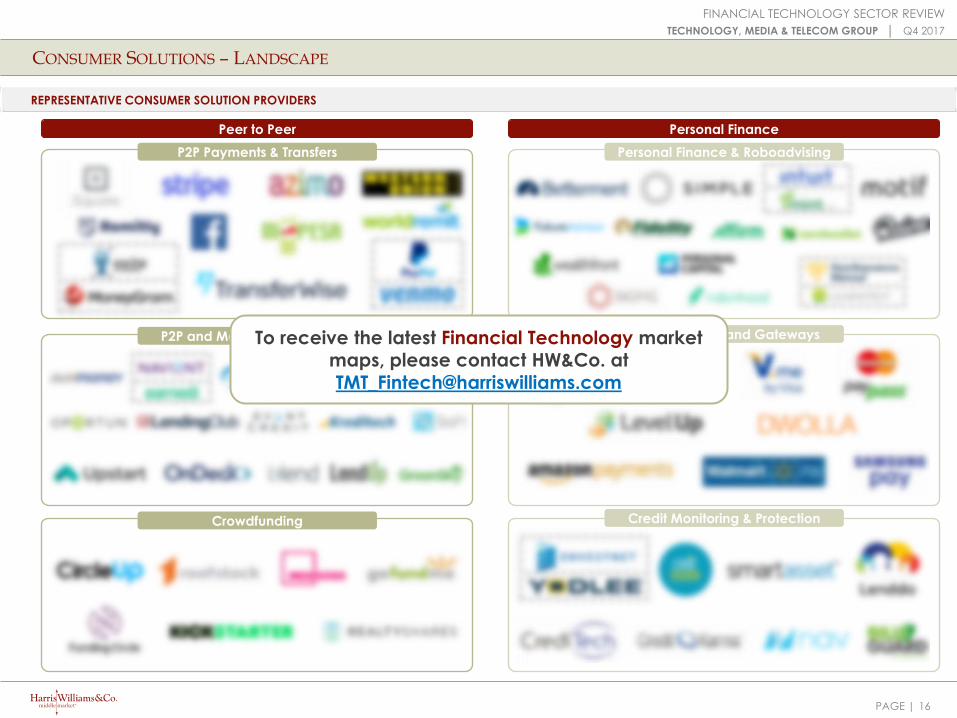
CONSUMER SOLUTIONS – LANDSCAPE
REPRESENTATIVE CONSUMER SOLUTION PROVIDERS
P2P Payments & Transfers
Peer to Peer Personal Finance
Mobile Wallets and GatewaysP2P and Marketplace Lending
Credit Monitoring & Protection
Personal Finance & Roboadvising
Crowdfunding
To receive the latest Financial Technology market
maps, please contact HW&Co. at
PAGE | 17
FINANCIAL TECHNOLOGY SECTOR REVIEW
TECHNOLOGY, MEDIA & TELECOM GROUP │ Q4 2017
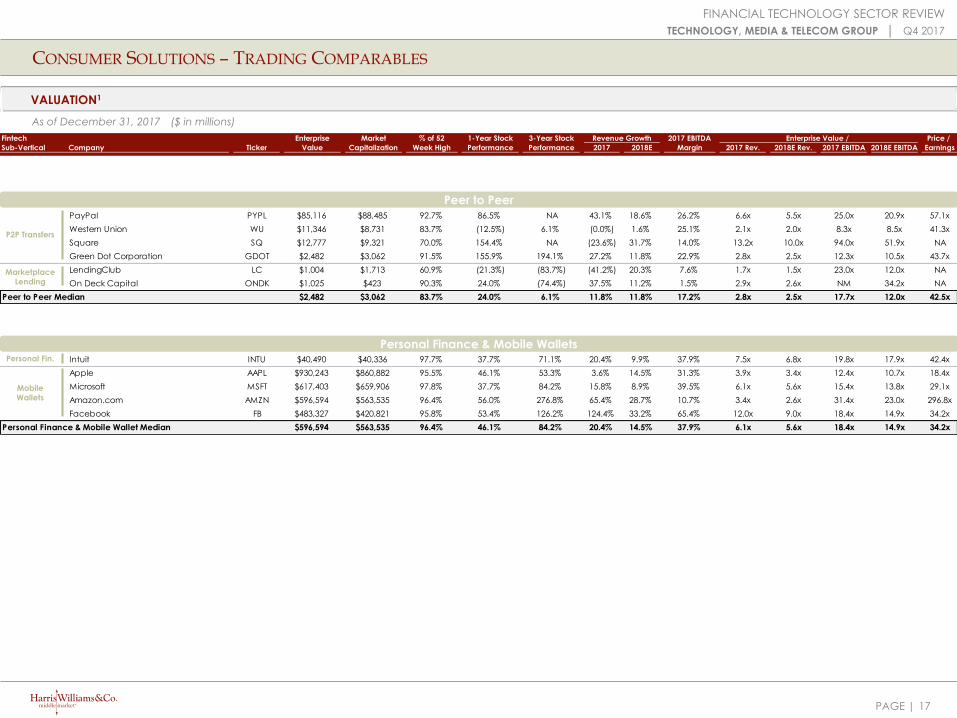
Intuit INTU $40,490 $40,336 97.7% 37.7% 71.1% 20.4% 9.9% 37.9% 7.5x 6.8x 19.8x 17.9x 42.4x
Apple AAPL $930,243 $860,882 95.5% 46.1% 53.3% 3.6% 14.5% 31.3% 3.9x 3.4x 12.4x 10.7x 18.4x
Microsoft MSFT $617,403 $659,906 97.8% 37.7% 84.2% 15.8% 8.9% 39.5% 6.1x 5.6x 15.4x 13.8x 29.1x
Amazon.com AMZN $596,594 $563,535 96.4% 56.0% 276.8% 65.4% 28.7% 10.7% 3.4x 2.6x 31.4x 23.0x 296.8x
Facebook FB $483,327 $420,821 95.8% 53.4% 126.2% 124.4% 33.2% 65.4% 12.0x 9.0x 18.4x 14.9x 34.2x
Personal Finance & Mobile Wallet Median $596,594 $563,535 96.4% 46.1% 84.2% 20.4% 14.5% 37.9% 6.1x 5.6x 18.4x 14.9x 34.2x
PayPal PYPL $85,116 $88,485 92.7% 86.5% NA 43.1% 18.6% 26.2% 6.6x 5.5x 25.0x 20.9x 57.1x
Western Union WU $11,346 $8,731 83.7% (12.5%) 6.1% (0.0%) 1.6% 25.1% 2.1x 2.0x 8.3x 8.5x 41.3x
Square SQ $12,777 $9,321 70.0% 154.4% NA (23.6%) 31.7% 14.0% 13.2x 10.0x 94.0x 51.9x NA
Green Dot Corporation GDOT $2,482 $3,062 91.5% 155.9% 194.1% 27.2% 11.8% 22.9% 2.8x 2.5x 12.3x 10.5x 43.7x
LendingClub LC $1,004 $1,713 60.9% (21.3%) (83.7%) (41.2%) 20.3% 7.6% 1.7x 1.5x 23.0x 12.0x NA
On Deck Capital ONDK $1,025 $423 90.3% 24.0% (74.4%) 37.5% 11.2% 1.5% 2.9x 2.6x NM 34.2x NA
Peer to Peer Median $2,482 $3,062 83.7% 24.0% 6.1% 11.8% 11.8% 17.2% 2.8x 2.5x 17.7x 12.0x 42.5x
CONSUMER SOLUTIONS – TRADING COMPARABLES
VALUATION1
Peer to Peer
Personal Finance & Mobile Wallets
P2P Transfers
Marketplace
Lending
Personal Fin.
Mobile
Wallets
As of December 31, 2017 ($ in millions)
Fintech Enterprise Market % of 52 1-Year Stock 3-Year Stock Revenue Growth 2017 EBITDA Enterprise Value / Price /
Sub-Vertical Company Ticker Value Capitalization Week High Performance Performance 2017 2018E Margin 2017 Rev. 2018E Rev. 2017 EBITDA 2018E EBITDA Earnings

PAGE | 18
FINANCIAL TECHNOLOGY SECTOR REVIEW
TECHNOLOGY, MEDIA & TELECOM GROUP │ Q4 2017
Announced Date Target/Issuer Investor(s) Description New Money ($m)
12/11/2017 BitGo Valor Equity Provider of a mulit-signature secure digital wallet. $43
12/11/2017 Affirm GIC, Khosla Ventures, Lightspeed Ventures Provider of instant loans for online purchases. $200
12/07/2017 WorldRemit LeapFrog, TCV, Accel Provider of an online digital money transfer platform. $40
12/05/2017 Earny Mayfield Provider of automated price drop protection and cash back solutions. $9
12/05/2017 Swift Prepaid Solutions Bain Capital Ventures, Silversmith Capital Provider of prepaid serv ices for global incentive and reward programs. NA
11/09/2017 WeLab Alibaba Provider of marketplace mobile lending serv ices. $220
11/09/2017 Broker Genius Volition Capital Provider of a dynamic pricing technology platform for the secondary ticket market. $15
11/06/2017 Monzo Goodwater Capital, Stripe Provider of mobile-only banking serv ices. $93
11/02/2017 TransferWise Old Mutual, IVP, Mitsui Provider of a money transferring platform to send money abroad. $280
10/31/2017 Remitly PayU, Stripes Group Provider of a mobile payment platform to send money to peers electronically. $115
10/25/2017 Credit Sesame Menlo Ventures Provider of an online credit and loan management platform. $42
10/24/2017 Jiko Upfront Ventures Provider of a private computational banking system. $8
10/10/2017 Visor Obvious Ventures, Social Capital Provider of an online tax filing and advisory serv ice. $7
09/28/2017 Feidee KKR Provider of mobile applications for personal financial management. $200
09/27/2017 Chime Cathay Capital Provider of mobile-first banking solutions. $18
Announced Date Target/Issuer Buyer Description Enterprise Value ($m)
11/14/2017 Jwaala Alogent Corp. Provider of online banking serv ices. NA
11/13/2017 Credit Shop Varde Partners Provider of personal loans to consumers. NA
11/07/2017 Vault Investments Acorns Grow Provider of a digital investing platform for small business retirement plans. NA
10/16/2017 Trigger Finance Circle Internet Financial Provider of a mobile investing platform. NA
10/05/2017 Wealthify Aviva Plc Provider of online investment advisory serv ices. NA
10/04/2017 Earnest Navient Corp. Provider of merit-based loan serv ices. $155
08/30/2017 CashStar Blackhawk Network Provider of a cloud-based digital gift card marketplace. $175
03/29/2017 GiveForward YouCaring Provider of an online fundraising platform. NA
03/27/2017 Fit Pay NXT-ID Provider of a contactless payments platform for wearables and IoT devices. NA
03/01/2017 OrderAhead Square Provider of a mobile application for on-demand delivery of food. NA
02/22/2017 Tilt.com Airbnb Provider of a social crowdfunding platform. $62
02/01/2017 ZenBanx Holding Social Finance Provider of an international, multi-currency mobile banking platform. $100
01/30/2017 UniRush Green Dot Provider of prepaid debit card solutions. $151
12/13/2016 AFJC Credit Karma Provider of online indiv idual tax filing serv ices. NA
11/20/2016 LifeLock Symantec Provider of theft identity protection serv ices. $2,096
CONSUMER SOLUTIONS – TRANSACTION ACTIVITY
SELECT RECENT M&A TRANSACTIONS1
SELECT RECENT PRIVATE PLACEMENT TRANSACTIONS4
PAGE | 19
FINANCIAL TECHNOLOGY SECTOR REVIEW
TECHNOLOGY, MEDIA & TELECOM GROUP │ Q4 2017
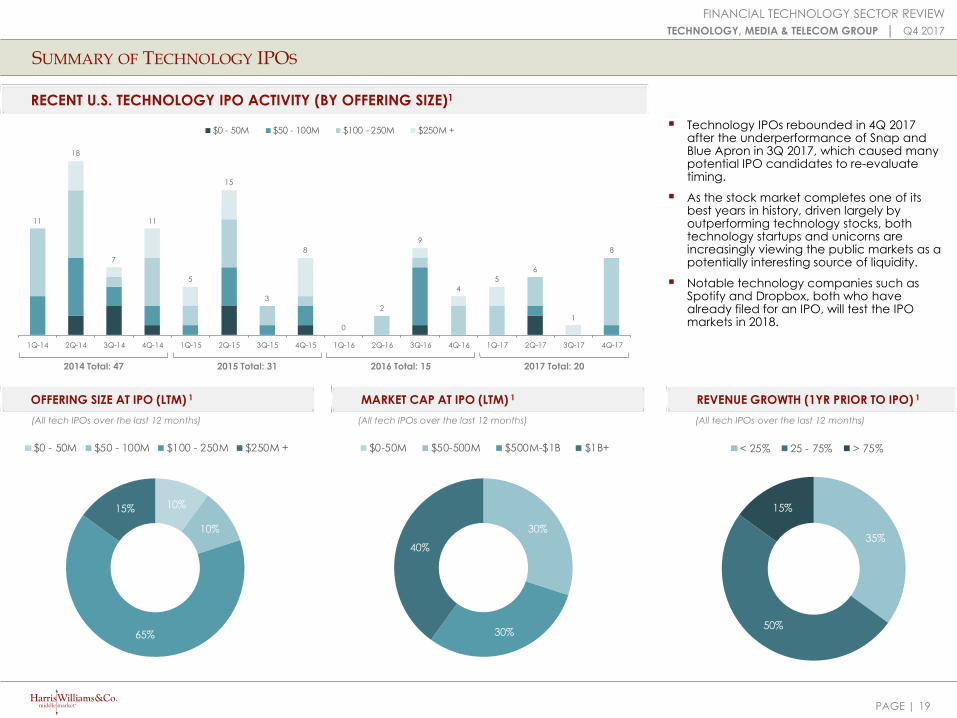
SUMMARY OF TECHNOLOGY IPOS
Technology IPOs rebounded in 4Q 2017after the underperformance of Snap andBlue Apron in 3Q 2017, which caused manypotential IPO candidates to re-evaluatetiming.
As the stock market completes one of itsbest years in history, driven largely byoutperforming technology stocks, bothtechnology startups and unicorns areincreasingly viewing the public markets as apotentially interesting source of liquidity.
Notable technology companies such asSpotify and Dropbox, both who havealready filed for an IPO, will test the IPOmarkets in 2018.
MARKET CAP AT IPO (LTM) 1 REVENUE GROWTH (1YR PRIOR TO IPO) 1OFFERING SIZE AT IPO (LTM) 1
RECENT U.S. TECHNOLOGY IPO ACTIVITY (BY OFFERING SIZE)1
35%
50%
15%
< 25% 25 - 75% > 75%
30%
30%
40%
$0-50M $50-500M $500M-$1B $1B+
10%
10%
65%
15%
$0 - 50M $50 - 100M $100 - 250M $250M +
(All tech IPOs over the last 12 months) (All tech IPOs over the last 12 months) (All tech IPOs over the last 12 months)
11
18
7
11
5
15
3
8
0
2
9
4
5
6
1
8
1Q-14 2Q-14 3Q-14 4Q-14 1Q-15 2Q-15 3Q-15 4Q-15 1Q-16 2Q-16 3Q-16 4Q-16 1Q-17 2Q-17 3Q-17 4Q-17
$0 - 50M $50 - 100M $100 - 250M $250M +
2014 Total: 47 2016 Total: 152015 Total: 31 2017 Total: 20
PAGE | 20
FINANCIAL TECHNOLOGY SECTOR REVIEW
TECHNOLOGY, MEDIA & TELECOM GROUP │ Q4 2017
(150.0%)
(125.0%)
(100.0%)
(75.0%)
(50.0%)
(25.0%)
0.0%
25.0%
50.0%
75.0%
100.0%
125.0%
150.0%
Circle Size Denotes Revenue ($)
% R
ev
en
ue
Gro
wth
Sto
ck
Pe
rfo
rma
nc
e (
Off
er
to C
urr
en
t)
KEY PERFORMANCE METRICS FOR RECENT SOFTWARE IPOS1
IPO DATE
OFFER PRICE
OFFERING SIZE ($M)
OFFER TO CURRENT
120.5%
73.4%
92.9%
(37.8%)
36.9% 36.8%
80.5%
50.6%
10.1%
162.3%
27.7%
9.5%
45.0%
84.0%
20.8%
84.3% 115.3%
49.3%
85.7%
17.7% 70.3%
59.4%
86.6%
57.2%
9.1% 31.5% 16.7% 32.5%
6.5%
70.6%
(150.0%)
(50.0%)
50.0%
150.0%
250.0%
9/29/16 10/5/16 10/27/16 12/15/16 3/9/17 3/16/17 3/24/17 4/6/17 4/27/17 5/25/17 6/7/17 10/5/17 10/26/17 10/31/17 11/17/17
$16.0 $18.0 $17.0 $11.0 $14.0 $17.0 $14.0 $17.0 $15.0 $12.0 $11.0 $17.0 $22.0 $13.0 $12.0
$1,958.5 $866.0 $838.6 $330.3 $1,240.6 $2,141.9 $662.5 $1,542.9 $1,921.0 $704.3 $100.2 $2,951.6 $814.3 $226.9 $1,026.6
$237.9 $133.2 $146.2 $287.2 $233.3 $221.0 $126.0 $187.0 $225.0 $75.0 $30.8 $531.3 $116.2 $156.0 $240.0
120.5% 73.4% 92.9% (37.8%) 36.9% 36.8% 80.5% 50.6% 10.1% 162.3% 27.7% 9.5% 45.0% 84.0% 20.8%
MARKET CAP AT OFFER ($M)
PAGE | 21
FINANCIAL TECHNOLOGY SECTOR REVIEW
TECHNOLOGY, MEDIA & TELECOM GROUP │ Q4 2017
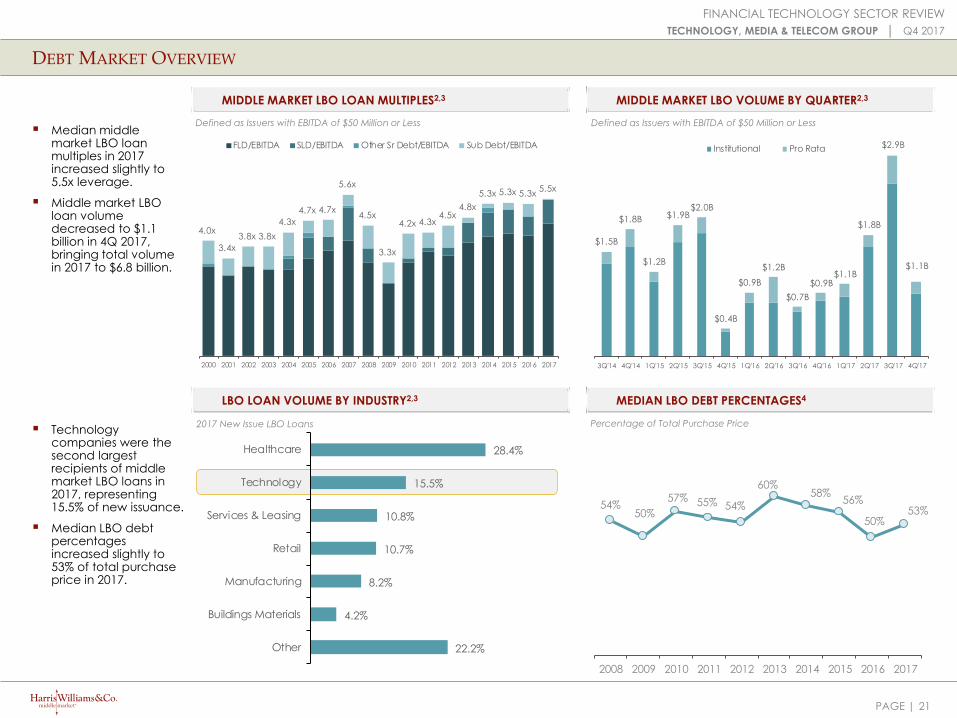
22.2%
4.2%
8.2%
10.7%
10.8%
15.5%
28.4%
Other
Buildings Materials
Manufacturing
Retail
Services & Leasing
Technology
Healthcare
54% 50%
57% 55% 54%
60% 58%
56%
50% 53%
2008 2009 2010 2011 2012 2013 2014 2015 2016 2017
4.0x
3.4x
3.8x 3.8x
4.3x
4.7x 4.7x
5.6x
4.5x
3.3x
4.2x 4.3x4.5x
4.8x
5.3x 5.3x 5.3x5.5x
2000 2001 2002 2003 2004 2005 2006 2007 2008 2009 2010 2011 2012 2013 2014 2015 2016 2017
FLD/EBITDA SLD/EBITDA Other Sr Debt/EBITDA Sub Debt/EBITDA
LBO LOAN VOLUME BY INDUSTRY2,3 MEDIAN LBO DEBT PERCENTAGES4
DEBT MARKET OVERVIEW
MIDDLE MARKET LBO LOAN MULTIPLES2,3 MIDDLE MARKET LBO VOLUME BY QUARTER2,3
2017 New Issue LBO Loans Percentage of Total Purchase Price
Median middlemarket LBO loanmultiples in 2017increased slightly to5.5x leverage.
Middle market LBOloan volumedecreased to $1.1billion in 4Q 2017,bringing total volumein 2017 to $6.8 billion.
Technologycompanies were thesecond largestrecipients of middlemarket LBO loans in2017, representing15.5% of new issuance.
Median LBO debtpercentagesincreased slightly to53% of total purchaseprice in 2017.
Defined as Issuers with EBITDA of $50 Million or LessDefined as Issuers with EBITDA of $50 Million or Less
$1.5B
$1.8B
$1.2B
$1.9B$2.0B
$0.4B
$0.9B
$1.2B
$0.7B
$0.9B$1.1B
$1.8B
$2.9B
$1.1B
3Q'14 4Q'14 1Q'15 2Q'15 3Q'15 4Q'15 1Q'16 2Q'16 3Q'16 4Q'16 1Q'17 2Q'17 3Q'17 4Q'17
Institutional Pro Rata
PAGE | 22
FINANCIAL TECHNOLOGY SECTOR REVIEW
TECHNOLOGY, MEDIA & TELECOM GROUP │ Q4 2017
acquired by
and
acquired by
acquired by
and
acquired by acquired byacquired byacquired byacquired by majority
recapitalization by
recapitalized byacquired by acquired byacquired byacquired byacquired byacquired by
a portfolio company of
recapitalized
by management
acquired by
acquired bystrategic investment
fromacquired by acquired by acquired by acquired byacquired by acquired by
acquired by
and
acquired byacquired byminority investment
fromacquired by
acquired bysignificant equity
investment fromacquired byacquired acquired by acquired by acquired byacquired by acquired byacquired byacquired by acquired by
GFI Energy Group
a division of
significant equity
investment from
minority investment
from
acquired by merged with acquired bystrategic investment
fromacquired by merged with
significant equity
investment fromacquired by acquired by acquired byacquired by
minority investment
fromacquired by
majority investment
frominvestment from
acquired by acquired by acquired by acquired byacquired byacquired a majority
stake inacquired byacquired byacquired byacquired byacquired byacquired byrecapitalized byacquired by
B2C
acquired by
acquired acquired by acquired by acquired by acquired byacquired byrecapitalized bymajority investment
fromacquired by
majority investment
fromacquired by
growth Investment
from
majority investment
fromacquiredacquired by
acquired by acquired byacquired byinvestment fromacquired by
Undisclosed Strategic Buyer
acquired byacquired acquired by
Company A
acquired by
a wholly-owned affiliate of
The Identity and Access Management Business of
acquired by
investment from acquired bymerged withacquiredmajority investment
from
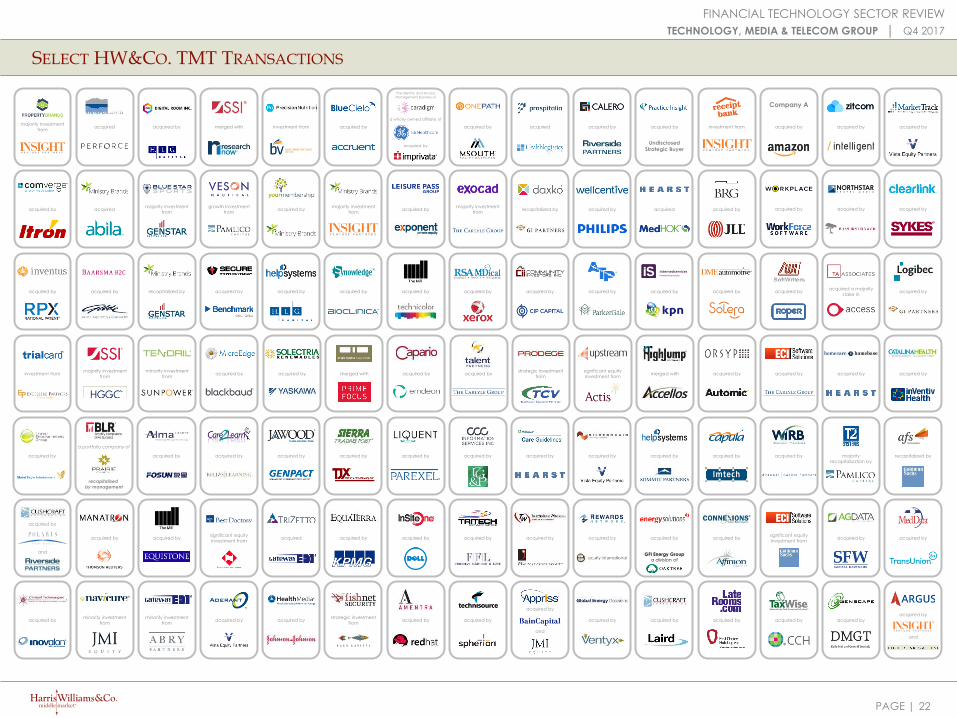
SELECT HW&CO. TMT TRANSACTIONS
Healthcare & Life Sciences
IndustrialsEnergy, Power & Infrastructure
Industrials
PAGE |
Harris Williams & Co. has a broad range of industry expertise, which create powerful opportunities. Our clients benefit form our deep-sector experience,integrated industry intelligence and collaboration across the firm, and our commitment to learning what makes them unique. For more information,visit our website at www.harriswilliams.com/industries.
HARRIS WILLIAMS & CO. OFFICE LOCATIONS
UNITED STATES EUROPE
NETWORK OFFICES
Beijing
Hong Kong
Mumbai
New Delhi
Shanghai
Aerospace, Defense & Government
Services
Building Products & Materials
Business Services
Consumer Specialty Distribution
Technology, Media & Telecom
Transportation & Logistics
BostonOne International PlaceSuite 2620Boston, Massachusetts 02110Phone: +1 (617) 482-7501
Cleveland1900 East 9th Street20th FloorCleveland, Ohio 44114Phone: +1 (216) 689-2400
Minneapolis222 South 9th StreetSuite 3350Minneapolis, Minnesota 55402Phone: +1 (612) 359-2700
Richmond (Headquarters)1001 Haxall Point9th FloorRichmond, Virginia 23219Phone: +1 (804) 648-0072
San Francisco575 Market Street31st FloorSan Francisco, California 94105Phone: +1 (415) 288-4260
Washington, D.C. 800 17th St. NW2nd FloorWashington, D.C. 20006Phone: +1 202-207-2300
FrankfurtBockenheimer Landstrasse 33-3560325 FrankfurtGermanyPhone: +49 069 3650638 00
London63 Brook StreetLondon W1K 4HS, EnglandPhone: +44 (0) 20 7518 8900
FINANCIAL TECHNOLOGY SECTOR REVIEW
TECHNOLOGY, MEDIA & TELECOM GROUP │ Q4 2017
Technology, Media & Telecom
OUR FIRM
23
PAGE | 24
FINANCIAL TECHNOLOGY SECTOR REVIEW
TECHNOLOGY, MEDIA & TELECOM GROUP │ Q4 2017
Harris Williams & Co. (www.harriswilliams.com) is a preeminent middle market investment bank focused on the advisory needs of clients worldwide. The firm has deep industry knowledge, global transaction expertise, and an unwavering commitment to excellence. Harris Williams & Co. provides sell-side and acquisition advisory, restructuring advisory, board advisory, private placements, and capital markets advisory services.
Investment banking services are provided by Harris Williams LLC and Solebury Capital LLC, registered broker-dealers and members of FINRA and SIPC, and Harris Williams & Co. Ltd, which is a private limited company incorporated under English law with its registered office at 5th Floor, 6 St. Andrew Street, London EC4A 3AE, UK, registered with the Registrar of Companies for England and Wales (registration number 07078852). Harris Williams & Co. Ltd is authorized and regulated by the Financial Conduct Authority. Harris Williams & Co. is a trade name under which Harris Williams LLC and Harris Williams & Co. Ltd conduct business.
THIS REPORT MAY CONTAIN REFERENCES TO REGISTERED TRADEMARKS, SERVICE MARKS AND COPYRIGHTS OWNED BY THIRD-PARTY INFORMATION PROVIDERS. NONE OF THE THIRD-PARTY INFORMATION PROVIDERS IS ENDORSING THE OFFERING OF, AND SHALL NOT IN ANY WAY BE DEEMED AN ISSUER OR UNDERWRITER OF, THE SECURITIES, FINANCIAL INSTRUMENTS OR OTHER INVESTMENTS DISCUSSED IN THIS REPORT, AND SHALL NOT HAVE ANY LIABILITY OR RESPONSIBILITY FOR ANY STATEMENTS MADE IN THE REPORT OR FOR ANY FINANCIAL STATEMENTS, FINANCIAL PROJECTIONS OR OTHER FINANCIAL INFORMATION CONTAINED OR ATTACHED AS AN EXHIBIT TO THE REPORT. FOR MORE INFORMATION ABOUT THE MATERIALS PROVIDED BY SUCH THIRD PARTIES, PLEASE CONTACT US AT THE ABOVE ADDRESSES OR NUMBERS.
The information and views contained in this report were prepared by Harris Williams & Co. (“Harris Williams”). It is not a research report, as such term is defined by applicable law and regulations, and is provided for informational purposes only. It is not to be construed as an offer to buy or sell or a solicitation of an offer to buy or sell any financial instruments or to participate in any particular trading strategy. The information contained herein is believed by Harris Williams to be reliable, but Harris Williams makes no representation as to the accuracy or completeness of such information. Harris Williams and/or its affiliates may be market makers or specialists in, act as advisers or lenders to, have positions in and effect transactions in securities of companies mentioned herein and also may provide, may have provided, or may seek to provide investment banking services for those companies. In addition, Harris Williams and/or its affiliates or their respective officers, directors and employees may hold long or short positions in the securities, options thereon or other related financial products of companies discussed herein. Opinions, estimates and projections in this report constitute Harris Williams’ judgment and are subject to change without notice. The financial instruments discussed in this report may not be suitable for all investors, and investors must make their own investment decisions using their own independent advisors as they believe necessary and based upon their specific financial situations and investment objectives. Also, past performance is not necessarily indicative of future results. No part of this material may be copied or duplicated in any form or by any means, or redistributed, without Harris Williams’ prior written consent.
Copyright© 2018 Harris Williams & Co., all rights reserved.
HARRIS WILLIAMS & CO.
1. FactSet.
2. PNC Capital Markets.
3. S&P LCD stats.
4. PitchBook.
SOURCES
DISCLOSURES