financial reports - official website | official website
TRANSCRIPT
Financial Reports (Unaudited)
March 31, 2021
Finance Department
Donna B. Williams, CGFM Timothy E. Schroer, CPA, CGMA
Director Deputy Director
535 Telfair Street, Suite 800, Augusta Georgia 30901 Office (706) 821-2429 Fax (706) 821-2520
WWW.AUGUSTAGA.GOV
April 27, 2021
The Honorable Hardie Davis, Mayor
Members of the Augusta Georgia Commission
Odie Donald, Jr., Administrator
535 Telfair Street
Augusta GA 30901
Dear Mayor Davis, Members of the Commission, and Mr. Donald:
This afternoon we are presenting for your information the financial reports of several major operational
funds for the period ended March 31, 2021. The quarterly reports are presented on a cash basis of
accounting, which differs from the basis used for the annual financial report. Additionally, information
on Local Sales Tax (LOST) collections and Special Purpose Local Sales Tax (SPLOST) collections
and projects are included.
What a difference a year makes! The recovery from the economic impact of the COVID 19 pandemic
continues to improve. Ongoing vaccinations and the relaxing of pandemic restrictions are encouraging
signs of an improving fiscal environment. We are awaiting guidance from the US Department of
Treasury regarding the $84 million in American Rescue Plan funds. As with all federally funded
projects, it is imperative to have a complete understanding of the requirements of the program before
starting to spend the funds. What we do know for certain is the funding is a onetime infusion and must
be spent by December 31, 2024.
Total revenues during the first quarter are not accurate indicators of Augusta’s financial position. This
is particularly true in the category of Taxes. The primary reason is that ad valorem tax revenue is not
booked until third quarter and other types of revenue follow cyclical patterns. Other categories such
as Licenses, Charges for Service and Fines are less seasonal. For this reason, we concentrate much of
our analysis on the expenditure side of the budget equation, which occurs at a more even pace.
Electric franchise fees are a revenue stream received as a single payment in the first quarter. Georgia
Power and Jefferson Electric pay 4% of their revenues from the customers in Richmond County to
Augusta. For the second year in a row, revenue from Georgia Power franchise fees had decreased.
The amount received, $9.98 million is a $1.5 million decrease from 2020. Other fluctuations, both
positive and negative, will occur in revenues and expenditures for the remainder of the fiscal year, our
goal is to manage those over which we have control so that year end results are as expected.
Sales tax is a revenue source that has a major impact on both Augusta’s operations and capital
expenditures. Collections for the last 5 months (October 2020-February 2021) have been higher than
the same period for the previous year. This trend is another indication of the recovery in our region.
Under the cash method of reporting, March revenue was not yet received and is not reported as of
March 31.

P a g e | 2
While we have good news to share this quarter, I must urge caution to avoid the impulse to make major
changes to our current year budget. The current trend toward recovery, while promising, is fragile
and it is difficult to project at what rate it will continue.
I hope this information along with the reports and narrative that follow are helpful. I will be happy to
answer any questions you might have.
Sincerely
Donna B. Williams, CGFM
Finance Director
Augusta Richmond County

Augusta Richmond County
Analysis of Operating Statements for
Major Fund Groups as of March 31, 2021
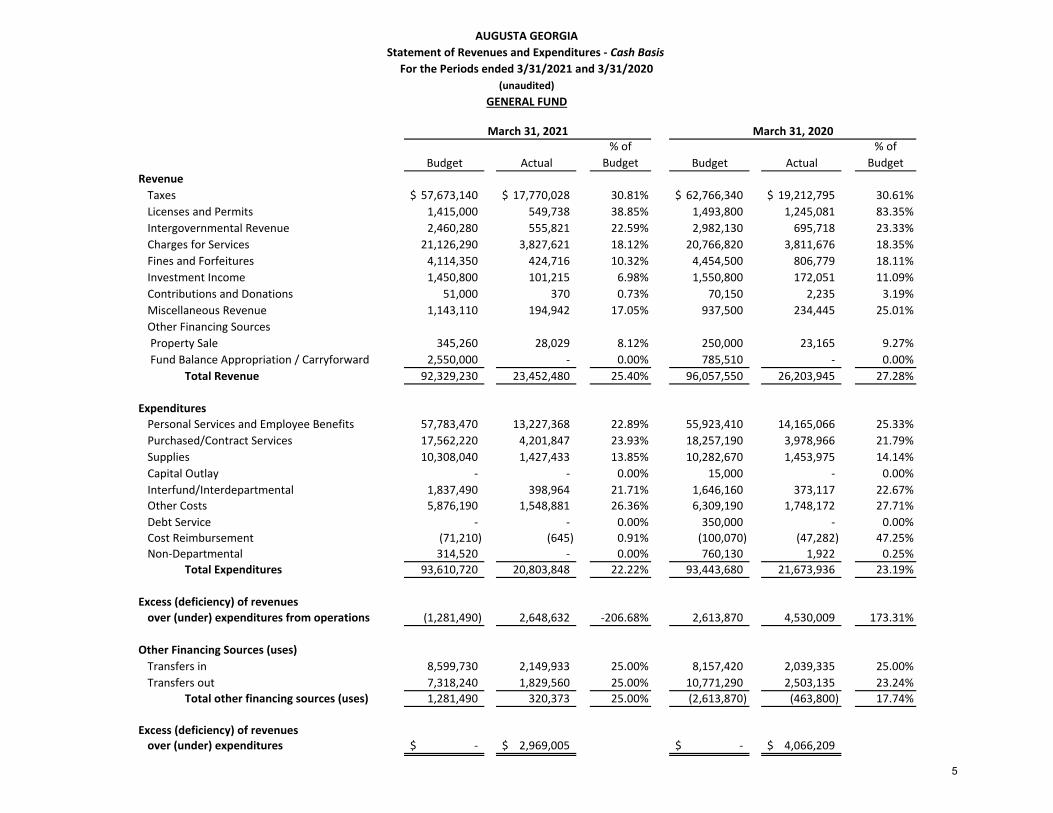
1. GENERAL FUND (101) (page 5)
Revenues:
Total revenue collections are 25.4% of the annual budget; this is on target for the first quarter
of the year. Ad valorem taxes represent $12.7 million or 13.8% of the total revenue budget of
the General Fund and will be billed in late third quarter. At the end of the first quarter, with
collections for January and February received, local sales tax revenue is 6.12% below budget.
Electric franchise fees are received in a single payment during the first quarter and are 12%
below budgeted amounts and $1.5 million lower than amounts received for 2020.
Expenditures:
Total expenditures are 22.2% of the annual budget. Budgets for fuel costs are closely
monitored and at the end of the first quarter, actual costs are below budget levels at 16.5%.
However, the first quarter is historically a low usage quarter. The 2nd and 3rd quarters have a
higher usage of fuel. Expenditures for salaries and employee benefits are slightly below the
target of 25% at 22.9%.
2. URBAN SERVICES (271) (page 6)
Revenues:
Total revenue is 8.70% of the annual budget as compared to 8.4 % for the same period last
year; ad valorem taxes are billed in third quarter. Ad valorem tax collections in the Urban
Service District are used to pay for services such as Fire Protection, Garbage Collection and
Street Lights. Streetlights are paid for separately as either mill rates or fees in the Suburban
district.
Expenditures:
Operating expenditure levels are below the target range of 25%, at 15.6% which is normal
for first quarter. Transfers out to other funds which are supported by tax collections, Fire
Protection, Garbage Collection and Street Lights, are posted to match the timing of
expenditures with the booking of tax revenue. No unusual variances were noted.
1

Augusta Richmond County
Analysis of Operating Statements for
Major Fund Groups as of March 31, 2021
3. LAW ENFORCEMENT (273) (page 7)
Revenues:
Major revenue sources supporting Law Enforcement are ad valorem taxes and local option sales tax. Total revenue is 7.2% of the annual budget as compared to 6.6% for the same period last year. Other revenues relating to inmate population such as inmate commissary sales and reimbursement from the state for prisoners are currently projected close to budgeted
levels.
Expenditures:
Total operating expenditures are slightly below the 25% budget target at 24.1%. Personnel cost is 22.8% of budget compared to 26% for the same period last year. Fuel costs are budgeted at $1.5 million and are below the targeted range at 17.9% for the first quarter. Expenditure items directly related to prisoner population are at 27.5% of budgeted levels. Medical costs for prisoners are at 30.2% of budget.
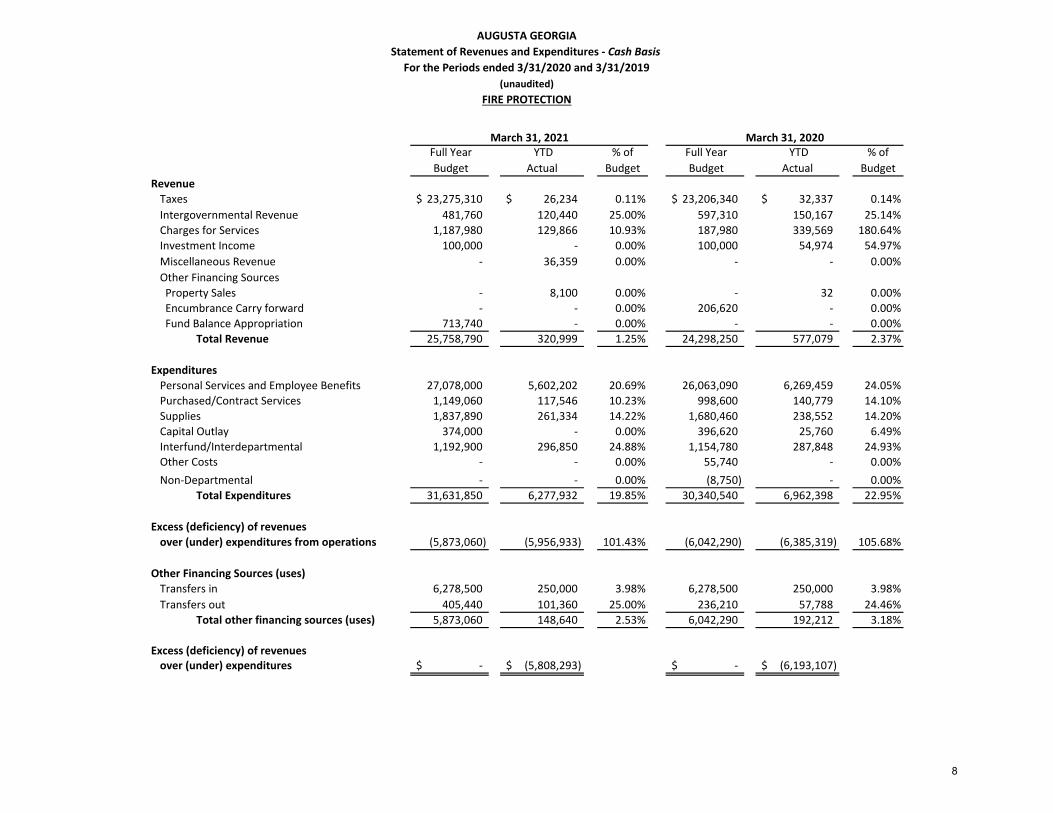
4. FIRE PROTECTION (274) (page 8)
Revenues:
Revenue for the first quarter is 1.2% as compared to 2.4% for the same period last year. Insurance premium tax revenue, which is 62.4% of the total revenue for this fund, is received from the state in mid-October. The other major source of funding for this fund come from ad valorem tax collections, billed in the third quarter.
Expenditures:
Total expenditures at the end of the first quarter are at 19.9%, slightly below the target range of 25%. Personnel related expenditures, which comprise 85.6% of the total budget are slightly below budget at 20.7%. Use of overtime is 26% of budget at the end of the first quarter compared to 48.2% for the same period in the prior year. There were 43 open positions at the end of the first quarter compared with 61 for the same period in the prior year. Six new employees were hired in the first quarter of 2021, compared to 13 for the first quarter of 2020.
5. WATER AND SEWERAGE (506-514) (page 9)
Revenues:
Revenues billed for services are at 21.3% of annual budget, or $19.3 million. During the same period in 2020, the percentage was 20.8% or $19.1 million.
2

Augusta Richmond County
Analysis of Operating Statements for
Major Fund Groups as of March 31, 2021
Expenditures:
Total expenditures are well within the targeted range of 25% at 12.8% of the annual budget,
compared to 15.6% of budget in the previous year. Personnel cost is at 18.8% of annual
budget. No other major variances were noted.
Capital Projects:
As construction typically occurs over several years, fund balance appropriation is used to
account for funds not provided by current year operations. The sources of revenues to fund
capital projects and debt service is net income from operations. Capital projects can also be
funded through the issuance of revenue bonds. In first quarter of 2021 a total of $3.4 million
was spent on capital outlay and a total of $6.8 million was required for debt service.
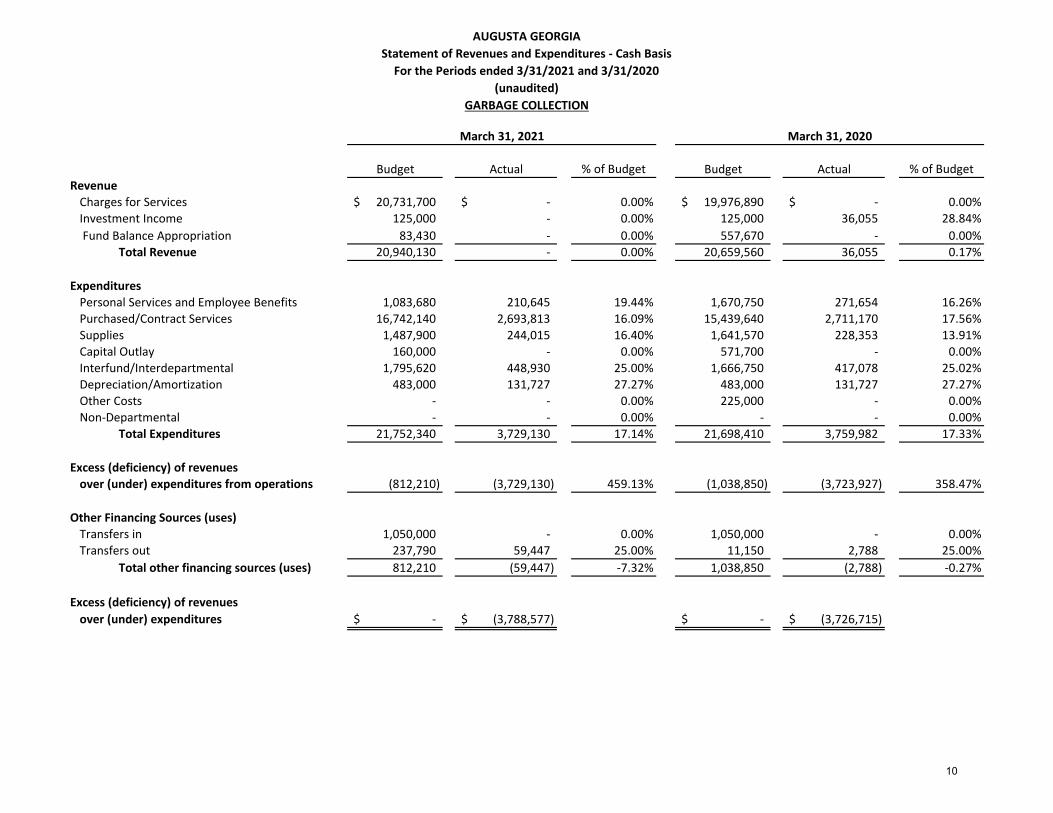
6. GARBAGE COLLECTION (542) (page 10)
Revenues:
Garbage collection services are billed with ad valorem taxes in late third or early fourth
quarter.
Expenditures:
Total expenditures are 17.1% of the annual budget. No other major variances were noted.
7. AUGUSTA REGIONAL AIRPORT (551) (page 11)
Revenues:
Revenues billed for services are 19.9% of annual budget, or $3.4 million. During the same
period in 2020, the percentage was 18.9% or $4.1 million. Passenger volume is seasonal,
with higher volumes in summer and during holidays and special events, although initially
will be lower due to pandemic travel restrictions.
Expenditures:
Total expenditures, excluding depreciation and capital spending, are at 9.0% of the annual
budget. Personnel cost is at 21.1% of annual budget. No other major variances were noted.
8. STORMWATER UTILITY (581) (page 12)
Revenues:
Revenues billed for services are 25.6% of annual budget or $3.6 million. During the same
period in 2020, the percentage was 24.8% or $3.4 million.
Expenditures:
Total expenditures are 16.8% of the annual budget. No other major variances were noted.
3

Augusta Richmond County
Analysis of Operating Statements for
Major Fund Groups as of March 31, 2021
Notes to the financial reports
First Quarter indicators: The first quarter report is not the most accurate indication of the
actual performance of the government because revenue percentages tend to be skewed due to
the billing of property taxes during the third quarter. As a result, expenditure levels against
budget are used as key indicators to monitor financial position.
Basis of Accounting: The attached financial reports are presented on the cash basis of
accounting which differs from the annual financial audit which is presented using the
modified accrual basis of accounting. The most significant difference between cash basis and
modified accrual basis of accounting is the recording of accrued expenditures and revenue.
We have determined that any potential benefit that may be derived from preparing the
financial reports on a modified accrual basis would be lost by the number of resources that
would be required to prepare the financial reports on this basis.
4
AUGUSTA GEORGIA
Statement of Revenues and Expenditures - Cash Basis
For the Periods ended 3/31/2021 and 3/31/2020
(unaudited)
GENERAL FUND
Budget Actual
% of
Budget Budget Actual
% of
Budget
Revenue
Taxes 57,673,140$ 17,770,028$ 30.81% 62,766,340$ 19,212,795$ 30.61%
Licenses and Permits 1,415,000 549,738 38.85% 1,493,800 1,245,081 83.35%
Intergovernmental Revenue 2,460,280 555,821 22.59% 2,982,130 695,718 23.33%
Charges for Services 21,126,290 3,827,621 18.12% 20,766,820 3,811,676 18.35%
Fines and Forfeitures 4,114,350 424,716 10.32% 4,454,500 806,779 18.11%
Investment Income 1,450,800 101,215 6.98% 1,550,800 172,051 11.09%
Contributions and Donations 51,000 370 0.73% 70,150 2,235 3.19%
Miscellaneous Revenue 1,143,110 194,942 17.05% 937,500 234,445 25.01%
Other Financing Sources
Property Sale 345,260 28,029 8.12% 250,000 23,165 9.27%
Fund Balance Appropriation / Carryforward 2,550,000 - 0.00% 785,510 - 0.00%
Total Revenue 92,329,230 23,452,480 25.40% 96,057,550 26,203,945 27.28%
Expenditures
Personal Services and Employee Benefits 57,783,470 13,227,368 22.89% 55,923,410 14,165,066 25.33%
Purchased/Contract Services 17,562,220 4,201,847 23.93% 18,257,190 3,978,966 21.79%
Supplies 10,308,040 1,427,433 13.85% 10,282,670 1,453,975 14.14%
Capital Outlay - - 0.00% 15,000 - 0.00%
Interfund/Interdepartmental 1,837,490 398,964 21.71% 1,646,160 373,117 22.67%
Other Costs 5,876,190 1,548,881 26.36% 6,309,190 1,748,172 27.71%
Debt Service - - 0.00% 350,000 - 0.00%
Cost Reimbursement (71,210) (645) 0.91% (100,070) (47,282) 47.25%
Non-Departmental 314,520 - 0.00% 760,130 1,922 0.25%
Total Expenditures 93,610,720 20,803,848 22.22% 93,443,680 21,673,936 23.19%
Excess (deficiency) of revenues
over (under) expenditures from operations (1,281,490) 2,648,632 -206.68% 2,613,870 4,530,009 173.31%
Other Financing Sources (uses)
Transfers in 8,599,730 2,149,933 25.00% 8,157,420 2,039,335 25.00%
Transfers out 7,318,240 1,829,560 25.00% 10,771,290 2,503,135 23.24%
Total other financing sources (uses) 1,281,490 320,373 25.00% (2,613,870) (463,800) 17.74%
Excess (deficiency) of revenuesover (under) expenditures -$ 2,969,005$ -$ 4,066,209$
March 31, 2020March 31, 2021
5

AUGUSTA GEORGIA
Statement of Revenues and Expenditures - Cash Basis
For the Periods ended 3/31/2021 and 3/31/2020
(unaudited)
URBAN SERVICE DISTRICT
Budget Actual
% of
Budget Budget Actual
% of
Budget
Revenue
Taxes 9,990,750$ 878,478$ 8.79% 10,398,730$ 860,710$ 8.28%
Investment Income 7,500 3,688 49.17% 7,500 13,663 182.17%
Other Financing Sources
Fund Balance Appropriation 142,290 - 0.00% - - 0.00%
Total Revenue 10,140,540 882,166 8.70% 10,406,230 874,373 8.40%
Expenditures
Personal Services and Employee Benefits 14,120 1,156 8.19% 11,890 1,156 9.72%
Interfund/Interdepartmental 11,070 2,768 25.00% 9,610 2,402 24.99%
Non-Departmental - - 0.00% 102,230 - 0.00%
Total Expenditures 25,190 3,924 15.58% 123,730 3,558 2.88%
Excess (deficiency) of revenues
over (under) expenditures from operations 10,115,350 878,242 8.68% 10,282,500 870,815 8.47%
Other Financing Sources (uses)
Transfers out 10,115,350 618,930 6.12% 10,282,500 599,173 5.83%
Total other financing sources (uses) (10,115,350) (618,930) 6.12% (10,282,500) (599,173) 5.83%
Excess (deficiency) of revenuesover (under) expenditures -$ 259,312$ -$ 271,642$
March 31, 2020March 31, 2021
6

AUGUSTA GEORGIA
Statement of Revenues and Expenditures - Cash Basis
For the Periods ended 3/31/2021 and 3/31/2020
(unaudited)
LAW ENFORCEMENT
Budget Actual
% of
Budget Budget Actual
% of
Budget
Revenue
Taxes 62,570,450$ 4,307,189$ 6.88% 60,453,740$ 3,853,402$ 6.37%
Licenses and Permits 2,000 1,200 60.00% 2,000 710 35.50%
Charges for Services 1,074,500 172,409 16.05% 1,068,500 187,126 17.51%
Fines and Forfeitures 322,500 16,606 5.15% 347,500 52,172 15.01%
Investment Income (200,000) - 0.00% (250,000) (35,601) 14.24%
Miscellaneous Revenue 220,000 61,125 27.78% 270,000 919 0.34%
Other Financing Sources
Property Sales 50,000 24,844 49.69% 100,000 1,660 1.66%
Total Revenue 64,039,450 4,583,373 7.16% 61,991,740 4,060,388 6.55%
Expenditures
Personal Services and Employee Benefits 44,800,280 10,207,458 22.78% 43,827,450 11,382,050 25.97%
Purchased/Contract Services 1,506,540 284,040 18.85% 1,506,540 245,472 16.29%
Supplies 11,036,400 2,645,634 23.97% 10,866,800 2,682,717 24.69%
Interfund/Interdepartmental 5,762,480 1,412,865 24.52% 5,573,520 1,326,547 23.80%
Non-Departmental (2,715,280) - 0.00% (2,673,660) - 0.00%
Total Expenditures 60,390,420 14,549,997 24.09% 59,100,650 15,636,786 26.46%
Excess (deficiency) of revenues
over (under) expenditures from operations 3,649,030 (9,966,624) -273.13% 2,891,090 (11,576,398) -400.42%
Other Financing Sources (uses)
Transfers in 2,895,940 723,985 25.00% 2,944,690 723,985 24.59%
Transfers out 6,544,970 1,636,243 25.00% 5,835,780 1,458,945 25.00%
Total other financing sources (uses) (3,649,030) (912,258) 25.00% (2,891,090) (734,960) 25.42%
Excess (deficiency) of revenuesover (under) expenditures -$ (10,878,882)$ -$ (12,311,358)$
March 31, 2021 March 31, 2020
7
AUGUSTA GEORGIA
Statement of Revenues and Expenditures - Cash Basis
For the Periods ended 3/31/2020 and 3/31/2019
(unaudited)
FIRE PROTECTION
Full Year
Budget
YTD
Actual
% of
Budget
Full Year
Budget
YTD
Actual
% of
Budget
Revenue
Taxes 23,275,310$ 26,234$ 0.11% 23,206,340$ 32,337$ 0.14%
Intergovernmental Revenue 481,760 120,440 25.00% 597,310 150,167 25.14%
Charges for Services 1,187,980 129,866 10.93% 187,980 339,569 180.64%
Investment Income 100,000 - 0.00% 100,000 54,974 54.97%
Miscellaneous Revenue - 36,359 0.00% - - 0.00%
Other Financing Sources
Property Sales - 8,100 0.00% - 32 0.00%
Encumbrance Carry forward - - 0.00% 206,620 - 0.00%
Fund Balance Appropriation 713,740 - 0.00% - - 0.00%
Total Revenue 25,758,790 320,999 1.25% 24,298,250 577,079 2.37%
Expenditures
Personal Services and Employee Benefits 27,078,000 5,602,202 20.69% 26,063,090 6,269,459 24.05%
Purchased/Contract Services 1,149,060 117,546 10.23% 998,600 140,779 14.10%
Supplies 1,837,890 261,334 14.22% 1,680,460 238,552 14.20%
Capital Outlay 374,000 - 0.00% 396,620 25,760 6.49%
Interfund/Interdepartmental 1,192,900 296,850 24.88% 1,154,780 287,848 24.93%Other Costs - - 0.00% 55,740 - 0.00%
Non-Departmental - - 0.00% (8,750) - 0.00%
Total Expenditures 31,631,850 6,277,932 19.85% 30,340,540 6,962,398 22.95%
Excess (deficiency) of revenues
over (under) expenditures from operations (5,873,060) (5,956,933) 101.43% (6,042,290) (6,385,319) 105.68%
Other Financing Sources (uses)
Transfers in 6,278,500 250,000 3.98% 6,278,500 250,000 3.98%
Transfers out 405,440 101,360 25.00% 236,210 57,788 24.46%
Total other financing sources (uses) 5,873,060 148,640 2.53% 6,042,290 192,212 3.18%
Excess (deficiency) of revenuesover (under) expenditures -$ (5,808,293)$ -$ (6,193,107)$
March 31, 2021 March 31, 2020
8

AUGUSTA GEORGIA
Statement of Revenues and Expenditures - Cash Basis
For the Periods ended 3/31/2021 and 3/31/2020
(unaudited)
WATER and SEWERAGE
Budget Actual
% of
Budget Budget Actual
% of
Budget
Revenue
Intergovernmental Revenue 9,939,880$ 2,353,522$ 23.68% 9,356,380$ 3,747,377$ 40.05%
Charges for Services 90,777,220 19,312,289 21.27% 91,970,720 19,144,999 20.82%
Investment Income 146,000 13,384 9.17% 39,000 59,739 153.18%
Contributions and Donations - - 0.00% - - 0.00%
Miscellaneous Revenue 469,200 420,977 89.72% 464,680 390,807 84.10%
Other Financing Sources: Property Sales 35,000 25,147 71.85% 35,000 2,900 8.29% Bond Premiums 1,531,240 - 0.00% 3,200,490 - 0.00% Encumbrance Carry forward 13,643,780 - 0.00% 834,860 - 0.00% Capital Project Carry forward 12,150,910 - 0.00% 10,347,530 - 0.00%
Fund Balance Appropriations - - 0.00% - 0.00%
Total Revenue 128,693,230 22,125,319 17.19% 116,248,660 23,345,822 20.08%
Expenditures
Personal Services and Employee Benefits 22,781,220 4,278,623 18.78% 22,136,470 5,030,431 22.72%
Purchased/Contract Services 20,768,910 2,805,771 13.51% 20,895,650 2,936,136 14.05%
Supplies 13,971,570 1,472,384 10.54% 13,055,440 1,837,766 14.08%
Interfund/Interdepartmental 11,145,510 2,717,226 24.38% 11,354,640 2,804,924 24.70%
Depreciation/Amortization 19,000,000 4,750,000 25.00% 19,000,000 4,750,000 25.00%
Other Costs 1,200,000 114,705 9.56% 1,210,000 207,430 17.14%
Debt Service 29,526,720 272,176 0.92% 23,844,090 449,225 1.88%
Non-Departmental 9,512,110 - 0.00% 3,995,460 - 0.00%
Total Expenditures 127,906,040 16,410,885 12.83% 115,491,750 18,015,912 15.60%
Excess (deficiency) of revenues
over (under) expenditures from operations 787,190 5,714,434 725.93% 756,910 5,329,910 704.17%
Other Financing Sources (uses)
Transfers in - - 0.00% - - 0.00%
Transfers out 787,190 84,613 10.75% 756,910 48,988 6.47%
Total other financing sources (uses) (787,190) (84,613) 10.75% (756,910) (48,988) 6.47%
Excess (deficiency) of revenues
over (under) expenditures -$ 5,629,821$ -$ 5,280,922$
March 31, 2020March 31, 2021
9
AUGUSTA GEORGIA
Statement of Revenues and Expenditures - Cash Basis
For the Periods ended 3/31/2021 and 3/31/2020
(unaudited)
GARBAGE COLLECTION
Budget Actual % of Budget Budget Actual % of Budget
Revenue
Charges for Services 20,731,700$ -$ 0.00% 19,976,890$ -$ 0.00%
Investment Income 125,000 - 0.00% 125,000 36,055 28.84%
Fund Balance Appropriation 83,430 - 0.00% 557,670 - 0.00%
Total Revenue 20,940,130 - 0.00% 20,659,560 36,055 0.17%
Expenditures
Personal Services and Employee Benefits 1,083,680 210,645 19.44% 1,670,750 271,654 16.26%
Purchased/Contract Services 16,742,140 2,693,813 16.09% 15,439,640 2,711,170 17.56%
Supplies 1,487,900 244,015 16.40% 1,641,570 228,353 13.91%
Capital Outlay 160,000 - 0.00% 571,700 - 0.00%
Interfund/Interdepartmental 1,795,620 448,930 25.00% 1,666,750 417,078 25.02%
Depreciation/Amortization 483,000 131,727 27.27% 483,000 131,727 27.27%
Other Costs - - 0.00% 225,000 - 0.00%
Non-Departmental - - 0.00% - - 0.00%
Total Expenditures 21,752,340 3,729,130 17.14% 21,698,410 3,759,982 17.33%
Excess (deficiency) of revenues
over (under) expenditures from operations (812,210) (3,729,130) 459.13% (1,038,850) (3,723,927) 358.47%
Other Financing Sources (uses)
Transfers in 1,050,000 - 0.00% 1,050,000 - 0.00%
Transfers out 237,790 59,447 25.00% 11,150 2,788 25.00%
Total other financing sources (uses) 812,210 (59,447) -7.32% 1,038,850 (2,788) -0.27%
Excess (deficiency) of revenues
over (under) expenditures -$ (3,788,577)$ -$ (3,726,715)$
March 31, 2021 March 31, 2020
10

AUGUSTA GEORGIA
Statement of Revenues and Expenditures - Cash Basis
For the Periods ended 3/31/2021 and 3/31/2020
(unaudited)
AUGUSTA REGIONAL AIRPORT
Budget Actual
% of
Budget Budget Actual
% of
Budget
Revenue
Intergovernmental Revenue 32,415,330$ 2,069,196$ 6.38% 39,672,830$ 95,519$ 0.24%
Charges for Services 17,154,510 3,413,871 19.90% 21,563,250 4,076,125 18.90%
Investment Income 178,400 (52,378) -29.36% 218,400 326,864 149.66%
Contributions and Donations 270,000 - 0.00% 273,000 1,000 0.37%
Miscellaneous Revenue - 24,322 0.00% 113,000 6,375 5.64%
Other Financing Sources
Property Sales 20,000 2,507 12.54% 25,000 - 0.00%
Fund Balance Appropriations 15,157,670 - 0.00% 12,897,110 - 0.00%
Total Revenue 65,195,910 5,457,518 8.37% 74,762,590 4,505,883 6.03%
Expenditures
Personal Services and Employee Benefits 7,008,180 1,475,938 21.06% 6,879,770 1,710,043 24.86%
Purchased/Contract Services 15,900,410 361,366 2.27% 16,665,468 319,846 1.92%
Supplies 4,143,000 609,440 14.71% 4,445,422 832,637 18.73%
Capital Outlay 32,723,320 - 0.00% 39,393,700 507,738 1.29%
Interfund/Interdepartmental 506,860 126,715 25.00% 463,440 115,860 25.00%
Depreciation/Amortization 3,700,000 925,000 25.00% 3,145,820 786,455 25.00%
Debt Service 952,890 - 0.00% 878,500 - 0.00%
Non-Departmental - - 0.00% 2,820,590 - 0.00%
Total Expenditures 64,934,660 3,498,459 5.39% 74,692,710 4,272,579 5.72%
Excess (deficiency) of revenues
over (under) expenditures from operations 261,250 1,959,059 749.88% 69,880 233,304 333.86%
Other Financing Sources (uses)
Transfers in - - 0.00% 150,000 - 0.00%
Transfers out 261,250 20,015 7.66% 219,880 11,915 5.42%
Total other financing sources (uses) (261,250) (20,015) 7.66% (69,880) (11,915) 17.05%
Excess (deficiency) of revenues
over (under) expenditures -$ 1,939,044$ -$ 221,389$
March 31, 2021 March 31, 2020
11
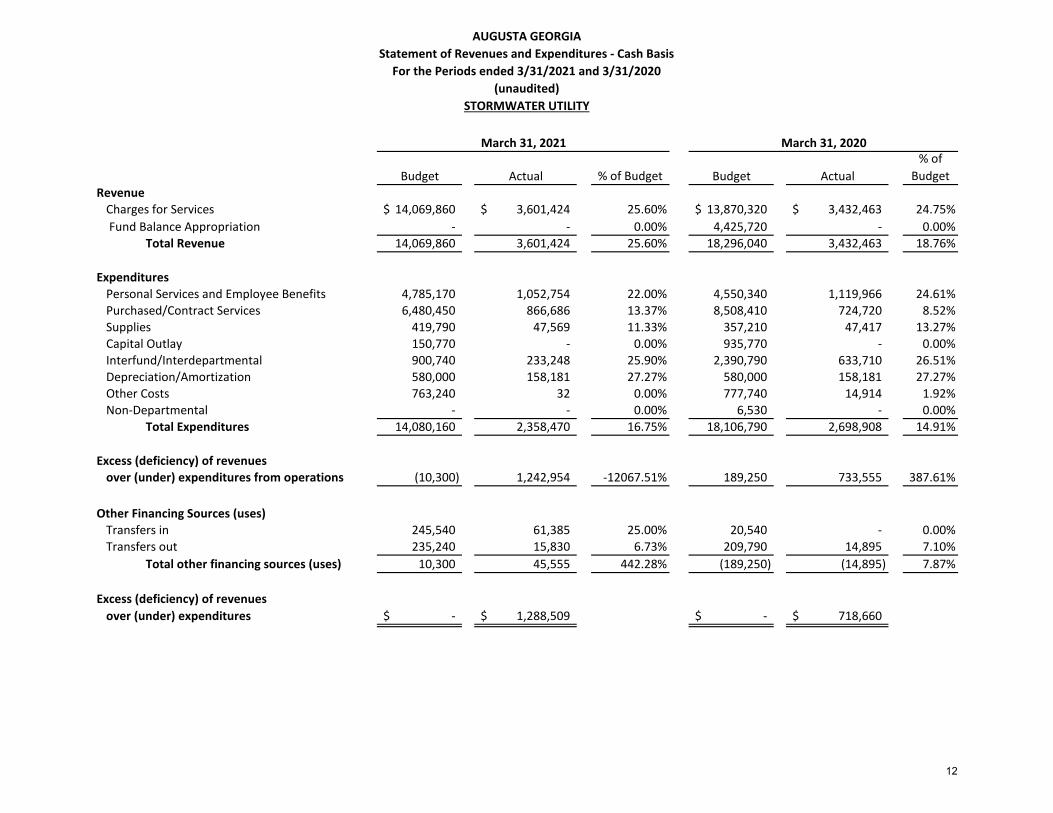
AUGUSTA GEORGIA
Statement of Revenues and Expenditures - Cash Basis
For the Periods ended 3/31/2021 and 3/31/2020
(unaudited)
STORMWATER UTILITY
Budget Actual % of Budget Budget Actual
% of
Budget
Revenue
Charges for Services 14,069,860$ 3,601,424$ 25.60% 13,870,320$ 3,432,463$ 24.75%
Fund Balance Appropriation - - 0.00% 4,425,720 - 0.00%
Total Revenue 14,069,860 3,601,424 25.60% 18,296,040 3,432,463 18.76%
Expenditures
Personal Services and Employee Benefits 4,785,170 1,052,754 22.00% 4,550,340 1,119,966 24.61%
Purchased/Contract Services 6,480,450 866,686 13.37% 8,508,410 724,720 8.52%
Supplies 419,790 47,569 11.33% 357,210 47,417 13.27%
Capital Outlay 150,770 - 0.00% 935,770 - 0.00%
Interfund/Interdepartmental 900,740 233,248 25.90% 2,390,790 633,710 26.51%
Depreciation/Amortization 580,000 158,181 27.27% 580,000 158,181 27.27%
Other Costs 763,240 32 0.00% 777,740 14,914 1.92%
Non-Departmental - - 0.00% 6,530 - 0.00%
Total Expenditures 14,080,160 2,358,470 16.75% 18,106,790 2,698,908 14.91%
Excess (deficiency) of revenues
over (under) expenditures from operations (10,300) 1,242,954 -12067.51% 189,250 733,555 387.61%
Other Financing Sources (uses)
Transfers in 245,540 61,385 25.00% 20,540 - 0.00%
Transfers out 235,240 15,830 6.73% 209,790 14,895 7.10%
Total other financing sources (uses) 10,300 45,555 442.28% (189,250) (14,895) 7.87%
Excess (deficiency) of revenues
over (under) expenditures -$ 1,288,509$ -$ 718,660$
March 31, 2021 March 31, 2020
12

Augusta Georgia
Sales Tax Receipts
as of February 28, 2021
Month Total
Actual 1/1/21 to
2/28/21 2021 Budget
YTD %
Change
from Prior
Year
% of
Budget
collected
Budgeted
Collection %
General Fund 522,873.48 1,081,893.76 6,914,870.00 3.97% 15.65% 16.67%
Law Enforcement 2,027,728.87 4,195,636.77 26,783,630.00 3.97% 15.66% 16.67%
Urban 424,648.71 878,478.21 5,489,100.00 3.97% 16.00% 16.67%
3,104,318.82 6,426,717.46 37,200,000.00 3.70% 17.28% 16.67%
CSRA Region 6,235,630.69 12,834,205.07 72,825,900.00 17.62% 16.67%
Augusta
Revenue Generated 2,857,716.09 5,921,714.16
Revenue Received 319,883.63 658,386.05 3,500,000.00 18.81% 16.67%
February 28, 2021 February 29, 2020 $ Change % Change
LOST 2,975,251.07 2,936,732.29 38,518.78 1.29%
SPLOST 3,104,318.82 3,058,761.04 45,557.78 1.47%
February 28, 2021 February 29, 2020 $ Change % Change
LOST 6,156,008.74 5,911,349.28 244,659.46 3.97%
SPLOST 6,426,717.46 6,188,859.86 237,857.60 3.70%
Year To Date
LOST
SPLOST
T - SPLOST
Comparative Revenue Collections
For The Month Ended
13

Augusta Georgia
Sales Tax Revenues - LOST
2021 and 2020
January February March April May June July August September October November December
2021 3,180,75 2,975,25 - - - - - - - - - -
2020 2,974,61 2,936,73 2,965,16 2,676,22 3,098,55 3,168,00 3,043,05 2,965,09 3,172,30 3,384,51 3,306,96 3,995,03
2.50
2.75
3.00
3.25
3.50
3.75
4.00
4.25
Mill
ion
s
2021
2020
The total received in August 2020 was $5,023,821. Included in total was an audit adjustment of $2,058,731 for the audit period 2015 thru 2018
14

Augusta Georgia
Sales Tax Revenue - LOST
2017 to 2021
January February March April May June July August September October November December
2021 3,180,758 2,975,251 - - - - - - - - - -
2020 2,974,617 2,936,732 2,965,160 2,676,220 3,098,553 3,168,006 3,043,057 2,965,090 3,172,302 3,384,519 3,306,965 3,995,034
2019 3,048,326 3,045,332 3,312,990 4,263,741 3,385,280 3,141,754 3,250,462 3,160,242 3,271,978 3,211,903 3,153,967 3,646,566
2018 2,717,479 2,622,349 3,432,190 3,924,368 2,995,352 3,090,231 3,082,912 2,999,331 3,016,864 3,264,989 3,189,311 3,672,612
2017 2,581,039 2,537,261 2,891,721 3,486,056 2,822,346 2,961,488 2,955,309 2,785,253 2,904,388 2,722,862 2,801,072 3,605,914
Average 2,815,414 2,804,703 3,092,933 3,556,045 2,973,138 2,998,676 2,991,708 2,903,267 3,003,030 3,016,785 2,975,138 3,239,953
2.00
2.50
3.00
3.50
4.00
4.50
Tax
Rev
enu
eM
illio
ns
the total received in August 2020 was $5,023,821. Included in total was an audit adjustment of $2,058,731, for the audit period 2015 to 2018.
15

Augusta Georgia
Electric Franchise Fees
2010 to 2021
2010 2011 2012 2013 2014 2015 2016 2017 2018 2019 2020 2021
Amount 14,290,523 15,688,252 16,773,835 15,095,713 14,328,192 15,227,379 14,593,560 13,474,551 12,388,048 12,948,914 12,693,099 11,185,786
8,000,000
9,000,000
10,000,000
11,000,000
12,000,000
13,000,000
14,000,000
15,000,000
16,000,000
17,000,000
16
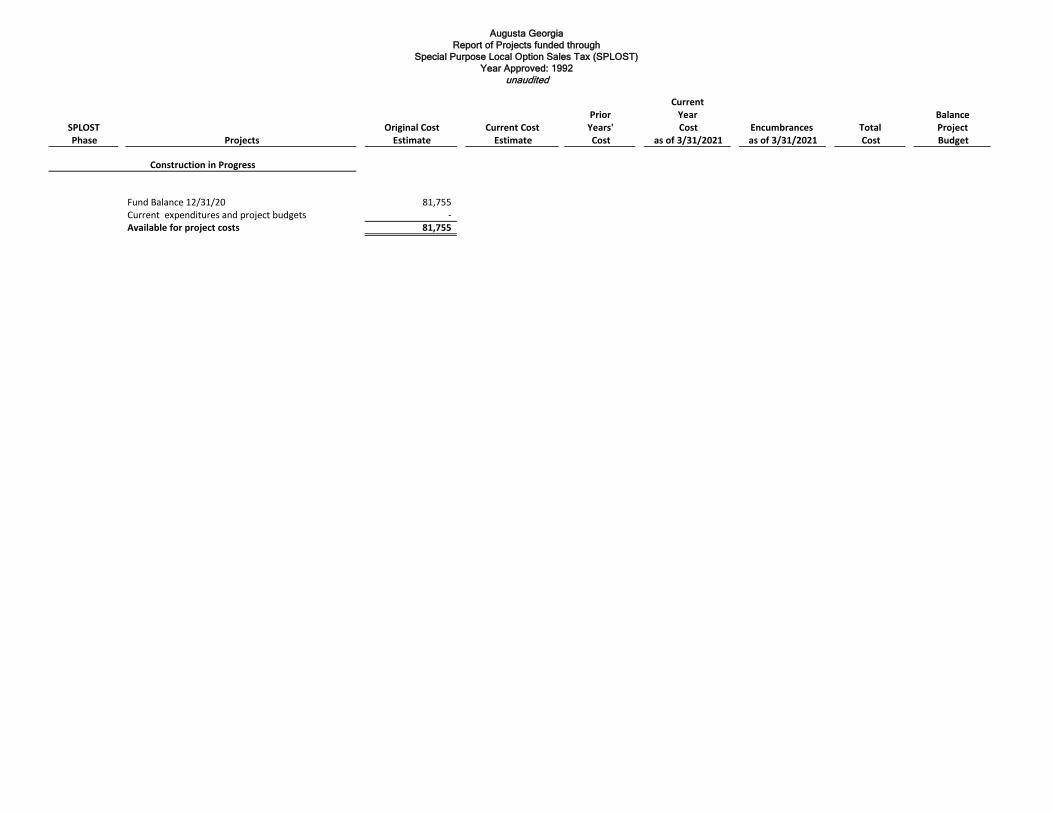
Augusta Georgia
Report of Projects funded through
Special Purpose Local Option Sales Tax (SPLOST)
Year Approved: 1992
unaudited
CurrentPrior Year Balance
SPLOST Original Cost Current Cost Years' Cost Encumbrances Total Project Phase Projects Estimate Estimate Cost as of 3/31/2021 as of 3/31/2021 Cost Budget
Fund Balance 12/31/20 81,755 Current expenditures and project budgets - Available for project costs 81,755
Construction in Progress

Augusta Georgia
Report of Projects funded through
Special Purpose Local Option Sales Tax (SPLOST)
Year Approved: 1996
unaudited
CurrentPrior Year Balance
SPLOST Original Cost Current Cost Years' Cost Encumbrances Total Project
Phase Projects Estimate Estimate Cost as of 3/31/2021 as of 3/31/2021 Cost Budget
Phase III Belair Road improvement $ 2,361,000 $ 2,361,000 $ 2,864,663 $ - $ - $ 2,864,663 $ (503,663) Phase III SR 4/15th @cr 2207(Central Ave) - 117,434 32,233 - - 32,233 85,201 Phase III Old Savannah Road/ Twigg Street 2,060,000 6,182,450 5,852,643 84,895 - 5,937,538 244,912 Phase III Bobby Jones Expressway 165,000 115,461 115,461 - - 115,461 (0) Phase III Wrightsboro Road 1,984,000 3,072,151 2,993,598 - - 2,993,598 78,554 Phase III Marvin Griffin Road 1,375,600 4,696,434 3,190,895 - 64,088 3,254,983 1,191,451 Phase III Wilkerson Garden - 697,555 535,677 9,582 7,314 552,572 144,983 Phase III Kimberly Clark Industrial Park 2,215,000 2,215,633 2,177,511 - - 2,177,511 38,122 Phase III Windsor Spring Rd Sec IV - 3,880,813 2,542,286 - - 2,542,286 1,338,527 Phase III Windsor Spring Rd Sec V - 1,854,298 1,863,766 - - 1,863,766 (9,468) Phase III Dover-Lyman Project - 2,000,016 1,801,137 - 193,640 1,994,777 5,239 Phase III Broad Street Sanitary Sewer - 240,447 144,004 - - 144,004 96,443 Phase III 6th Street handicap ramp 517,347 611,966 611,966 - - 611,966 0 Phase III Hyde Park Drainage Improvements - 1,207,619 1,206,516 - 88 1,206,604 1,015 Phase III Paving - Pats lane Projects - 167,200 146,881 - - 146,881 20,319 Phase III Frontage Road Resurfacing - 229,335 229,335 - - 229,335 -
Lake Olstead Dredging - 185,600 - - - - 185,600
Total Construction in Progress $ 10,677,947 $ 30,088,694 $ 26,308,572 $ 94,477 $ 265,129 $ 26,668,178 $2,917,235
Fund Balance 12/31/20 3,208,460 Current expenditures and project budgets 3,164,433 Available for project costs 44,027
Construction in Progress

Augusta Georgia
Report of Projects funded through
Special Purpose Local Option Sales Tax (SPLOST)
Year Approved: 2001
unaudited
CurrentPrior Year Balance
SPLOST Original Cost Current Cost Years' Cost Encumbrances Total Project Phase Projects Estimate Estimate Cost as of 3/31/2021 as of 3/31/2021 Cost Budget
Phase IV JLEC reroofing and improvements $ 395,500 $ 413,347 $ 204,666 $ - $ - $ 204,666 $ 208,681 Phase IV JLEC improvements 565,000 977,681 626,532 - - 626,532 351,149
Phase IV Downtown traffic signal & street light- upgrades-A (Broad Street
Area) 2,656,200 3,358,969 3,333,153 - - 3,333,153 25,816
Phase IV Downtown traffic signal & street light upgrades-B (Telfair Street
Area) 1,469,000 1,268,056 1,268,056 - - 1,268,056 - Phase IV Wrightsboro Road Widening Phase I 3,143,700 1,730,977 1,357,318 - - 1,357,318 373,659 Phase IV Walton Way Extension / Davis Road 350,000 1,208,854 1,208,584 - - 1,208,584 270 Phase IV Windsor Spring Road Section IV 1,250,000 1,469,258 1,469,258 - - 1,469,258 0 Phase IV St. Sebastian Way/Greene St/ 15th Street - 615,600 615,599 - - 615,599 1 Phase IV Berkmans Road Utilites Relocation - 767,500 586,948 4,275 176,224 767,447 53 Phase IV Recapture - Utilities Projects - 669,571 - - - - 669,571 Phase IV Traffic improvement 621,500 839,626 839,626 - - 839,626 - Phase IV ANIC/Hopkins Street Improvements 2,000,000 1,333,550 1,074,423 - - 1,074,423 259,127 Phase IV Windsor Spring Road Section IV (Willis Foreman to Tobacco 678,000 1,859,415 1,859,413 - - 1,859,413 2 Phase IV DDA - 859,248 791,157 - - 791,157 68,091 Phase IV St Sebastian Way/Greene St - 722,700 208,853 - - 208,853 513,847 Phase IV Lake Aumond Dam Improvements - 121,204 108,221 - - 108,221 12,983 Phase IV Belair Hills Estate 7,147,174 7,147,174 - - 7,147,174 (0) Phase IV Windsor Spring Rd Section V(SR88 Hepzibah - 1,102,789 1,093,365 - - 1,093,365 9,424 Phase IV Augusta Museum of History - 1,135,500 1,133,616 - - 1,133,616 1,884 Phase IV Willis Foreman Road Bridge Study - 155,773 157,708 - - 157,708 (1,935) Phase IV Augusta Levee Certification - 1,140,518 1,064,622 - - 1,064,622 75,896 Phase IV Rocky Creek Drainage Project - 3,857,295 1,075,590 - - 1,075,590 2,781,705 Phase IV Bus Barn - 4,397,356 4,397,357 - - 4,397,357 (1) Phase IV Industry Infrastructure - 822,627 785,408 - - 785,408 37,219 Phase IV On Call Construction Services 100,271 271,162 271,162 - - 271,162 (0) Phase IV Wrightsboro Road Drainage - 806,300 806,242 - - 806,242 58 Phase IV East Augusta - Marion Homes - 1,781,600 1,734,564 - 47,033 1,781,597 3 Phase IV Marvin Griffin Road - 952,600 375,088 - - 375,088 577,512 Phase IV Resurfacing Various Roads - 2,000,000 1,372,819 - 131,421 1,504,240 495,760 Phase IV Traffic improvements - 500,000 215,936 6,391 277,673 500,000 (0) Phase IV Tree Removal, Pruning & Repalcements - 241,650 193,751 - 17,011 210,762 30,888 Phase IV Lake Olmstead Dredgeing 376,200 - 348,347 - 348,347 27,853 Phase IV Frontage Road - 809,284 809,284 - - 809,284 -
Total Construction in Progress $ 37,242,871 $ 68,721,932 $ 61,194,040 $ 359,013 $ 649,363 $ 62,202,416 $6,519,516
Fund Balance 12/31/20 9,795,258 Current expenditures and project budgets 9,377,892 Available for project costs 417,366
Construction in Progress

Augusta Georgia
Report of Projects funded through
Special Purpose Local Option Sales Tax (SPLOST)
Year Approved: 2006
unaudited
Prior Year BalanceSPLOST Original Cost Current Cost Years' Cost Encumbrances Total Project
Phase Projects Estimate Estimate Cost
as of
3/31/2021 as of 3/31/2021 Cost Budget
Phase V Exhibit Hall $ 20,000,000 $ 29,708,450 $ 29,452,314 $ - $ - $ 29,452,314 $ 256,136 Phase V Redundant Fiber Ring 1,000,000 947,254 924,503 - - 924,503 22,751 Phase V Digital Othophotography 286,480 445,504 443,853 - - 443,853 1,651 Phase V Wireless Access Point 200,000 202,079 206,509 - - 206,509 (4,430) Phase V Software Application Consolidation 1,000,000 412,578 14,437 - 427,014 572,986 Phase V Disaster Recovery Plan 400,000 412,146 404,664 - - 404,664 7,482 Phase V Flood Land Acquisition 500,000 1,960,000 1,957,882 - - 1,957,882 2,118 Phase V Wrightsboro Road Project 4,000,000 6,900,000 5,692,640 - - 5,692,640 1,207,360 Phase V Marks Church Road Improvement 2,500,000 3,800,000 2,464,917 26,201 985,889 3,477,006 322,994 Phase V D'Antignac Street Flood Avoidance 1,000,000 4,837,815 4,835,602 - - 4,835,602 2,213
Lake Olstead Dredging - 2,207,300 - - - - 2,207,300 Phase V Augusta Soccer Park 180,000 180,077 165,629 - - 165,629 14,448 Phase V Apple Valley Park 315,000 300,554 300,554 - - 300,554 - Phase V WT Johnson Park 67,500 63,636 63,636 - - 63,636 - Phase V MM Scott Park 270,000 233,923 233,923 - - 233,923 - Phase V Valley Park 22,500 22,541 13,345 - - 13,345 9,196 Phase V Land Acquisition 180,000 230,194 230,194 - - 230,194 - Phase V Dyess Park 63,000 63,007 33,229 - - 33,229 29,778 Phase V Blythe Park 180,000 223,000 214,848 - - 214,848 8,152 Phase V Recreation recapture - 140,975 - - - - 140,975 Phase V Lucy Craft Laney Museum 200,000 203,036 184,734 - - 184,734 18,302
Phase V
Recreation, Historic, Cultural and Other
Buildings 400,000 405,010 200,298 - - 200,298 204,712
$ 32,984,480 $ 56,611,158 $ 50,061,108 $ 40,637 $ 985,889 $ 51,087,634 $5,523,524
Fund Balance 12/31/20 6,550,133 Current expenditures and project budgets 6,550,133 Available for project costs 0
Construction in Progress
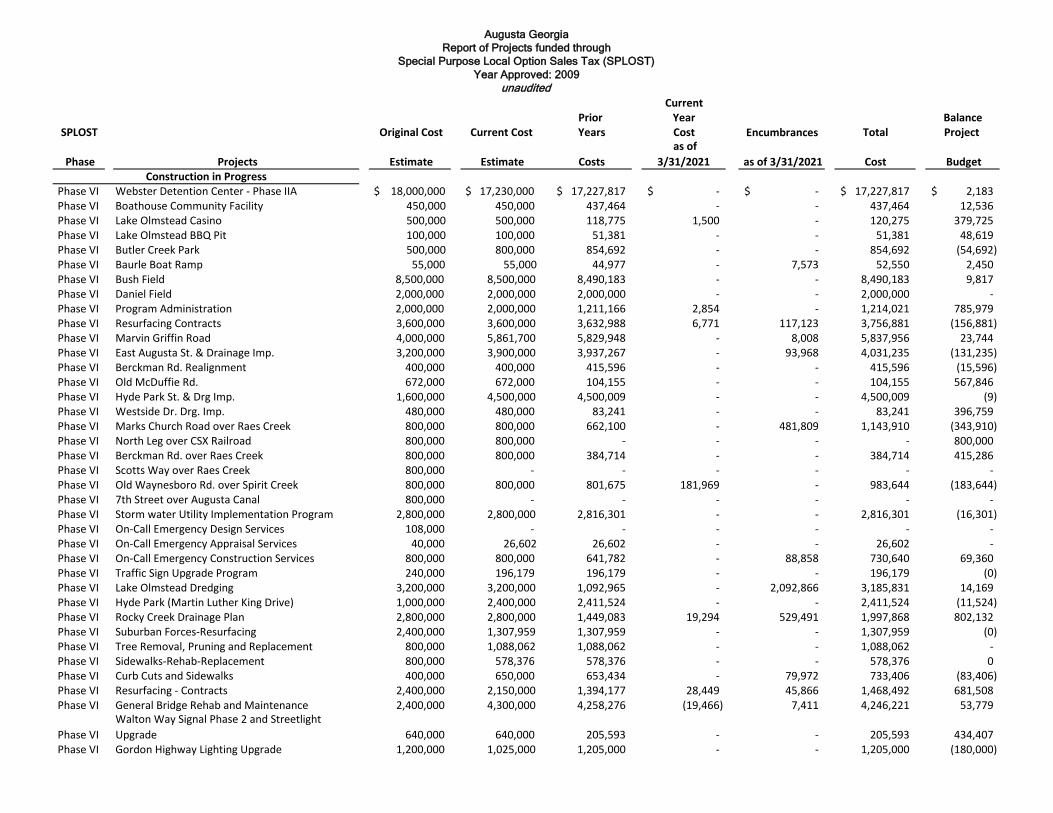
Augusta Georgia
Report of Projects funded through
Special Purpose Local Option Sales Tax (SPLOST)
Year Approved: 2009
unaudited
CurrentPrior Year Balance
SPLOST Original Cost Current Cost Years Cost Encumbrances Total Project
Phase Projects Estimate Estimate Costs
as of
3/31/2021 as of 3/31/2021 Cost Budget
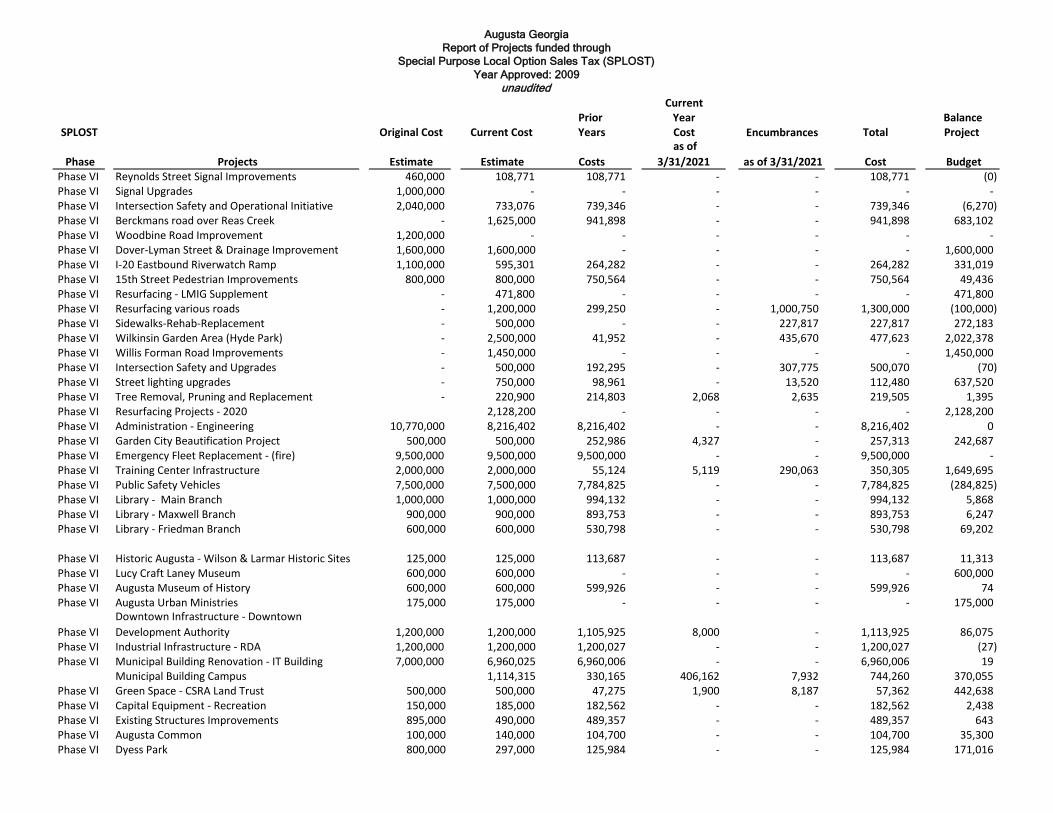
Phase VI Webster Detention Center - Phase IIA $ 18,000,000 $ 17,230,000 17,227,817$ -$ -$ 17,227,817$ 2,183$ Phase VI Boathouse Community Facility 450,000 450,000 437,464 - - 437,464 12,536 Phase VI Lake Olmstead Casino 500,000 500,000 118,775 1,500 - 120,275 379,725 Phase VI Lake Olmstead BBQ Pit 100,000 100,000 51,381 - - 51,381 48,619 Phase VI Butler Creek Park 500,000 800,000 854,692 - - 854,692 (54,692) Phase VI Baurle Boat Ramp 55,000 55,000 44,977 - 7,573 52,550 2,450 Phase VI Bush Field 8,500,000 8,500,000 8,490,183 - - 8,490,183 9,817 Phase VI Daniel Field 2,000,000 2,000,000 2,000,000 - - 2,000,000 - Phase VI Program Administration 2,000,000 2,000,000 1,211,166 2,854 - 1,214,021 785,979 Phase VI Resurfacing Contracts 3,600,000 3,600,000 3,632,988 6,771 117,123 3,756,881 (156,881) Phase VI Marvin Griffin Road 4,000,000 5,861,700 5,829,948 - 8,008 5,837,956 23,744 Phase VI East Augusta St. & Drainage Imp. 3,200,000 3,900,000 3,937,267 - 93,968 4,031,235 (131,235) Phase VI Berckman Rd. Realignment 400,000 400,000 415,596 - - 415,596 (15,596) Phase VI Old McDuffie Rd. 672,000 672,000 104,155 - - 104,155 567,846 Phase VI Hyde Park St. & Drg Imp. 1,600,000 4,500,000 4,500,009 - - 4,500,009 (9) Phase VI Westside Dr. Drg. Imp. 480,000 480,000 83,241 - - 83,241 396,759 Phase VI Marks Church Road over Raes Creek 800,000 800,000 662,100 - 481,809 1,143,910 (343,910) Phase VI North Leg over CSX Railroad 800,000 800,000 - - - - 800,000 Phase VI Berckman Rd. over Raes Creek 800,000 800,000 384,714 - - 384,714 415,286 Phase VI Scotts Way over Raes Creek 800,000 - - - - - - Phase VI Old Waynesboro Rd. over Spirit Creek 800,000 800,000 801,675 181,969 - 983,644 (183,644) Phase VI 7th Street over Augusta Canal 800,000 - - - - - - Phase VI Storm water Utility Implementation Program 2,800,000 2,800,000 2,816,301 - - 2,816,301 (16,301) Phase VI On-Call Emergency Design Services 108,000 - - - - - - Phase VI On-Call Emergency Appraisal Services 40,000 26,602 26,602 - - 26,602 - Phase VI On-Call Emergency Construction Services 800,000 800,000 641,782 - 88,858 730,640 69,360 Phase VI Traffic Sign Upgrade Program 240,000 196,179 196,179 - - 196,179 (0) Phase VI Lake Olmstead Dredging 3,200,000 3,200,000 1,092,965 - 2,092,866 3,185,831 14,169 Phase VI Hyde Park (Martin Luther King Drive) 1,000,000 2,400,000 2,411,524 - - 2,411,524 (11,524) Phase VI Rocky Creek Drainage Plan 2,800,000 2,800,000 1,449,083 19,294 529,491 1,997,868 802,132 Phase VI Suburban Forces-Resurfacing 2,400,000 1,307,959 1,307,959 - - 1,307,959 (0) Phase VI Tree Removal, Pruning and Replacement 800,000 1,088,062 1,088,062 - - 1,088,062 - Phase VI Sidewalks-Rehab-Replacement 800,000 578,376 578,376 - - 578,376 0 Phase VI Curb Cuts and Sidewalks 400,000 650,000 653,434 - 79,972 733,406 (83,406) Phase VI Resurfacing - Contracts 2,400,000 2,150,000 1,394,177 28,449 45,866 1,468,492 681,508 Phase VI General Bridge Rehab and Maintenance 2,400,000 4,300,000 4,258,276 (19,466) 7,411 4,246,221 53,779
Phase VI
Walton Way Signal Phase 2 and Streetlight
Upgrade 640,000 640,000 205,593 - - 205,593 434,407 Phase VI Gordon Highway Lighting Upgrade 1,200,000 1,025,000 1,205,000 - - 1,205,000 (180,000)
Construction in Progress
Augusta Georgia
Report of Projects funded through
Special Purpose Local Option Sales Tax (SPLOST)
Year Approved: 2009
unaudited
CurrentPrior Year Balance
SPLOST Original Cost Current Cost Years Cost Encumbrances Total Project
Phase Projects Estimate Estimate Costs
as of
3/31/2021 as of 3/31/2021 Cost Budget Phase VI Reynolds Street Signal Improvements 460,000 108,771 108,771 - - 108,771 (0) Phase VI Signal Upgrades 1,000,000 - - - - - - Phase VI Intersection Safety and Operational Initiative 2,040,000 733,076 739,346 - - 739,346 (6,270) Phase VI Berckmans road over Reas Creek - 1,625,000 941,898 - - 941,898 683,102 Phase VI Woodbine Road Improvement 1,200,000 - - - - - - Phase VI Dover-Lyman Street & Drainage Improvement 1,600,000 1,600,000 - - - - 1,600,000 Phase VI I-20 Eastbound Riverwatch Ramp 1,100,000 595,301 264,282 - - 264,282 331,019 Phase VI 15th Street Pedestrian Improvements 800,000 800,000 750,564 - - 750,564 49,436 Phase VI Resurfacing - LMIG Supplement - 471,800 - - - - 471,800 Phase VI Resurfacing various roads - 1,200,000 299,250 - 1,000,750 1,300,000 (100,000) Phase VI Sidewalks-Rehab-Replacement - 500,000 - - 227,817 227,817 272,183 Phase VI Wilkinsin Garden Area (Hyde Park) - 2,500,000 41,952 - 435,670 477,623 2,022,378 Phase VI Willis Forman Road Improvements - 1,450,000 - - - - 1,450,000 Phase VI Intersection Safety and Upgrades - 500,000 192,295 - 307,775 500,070 (70) Phase VI Street lighting upgrades - 750,000 98,961 - 13,520 112,480 637,520 Phase VI Tree Removal, Pruning and Replacement - 220,900 214,803 2,068 2,635 219,505 1,395 Phase VI Resurfacing Projects - 2020 2,128,200 - - - - 2,128,200 Phase VI Administration - Engineering 10,770,000 8,216,402 8,216,402 - - 8,216,402 0 Phase VI Garden City Beautification Project 500,000 500,000 252,986 4,327 - 257,313 242,687 Phase VI Emergency Fleet Replacement - (fire) 9,500,000 9,500,000 9,500,000 - - 9,500,000 - Phase VI Training Center Infrastructure 2,000,000 2,000,000 55,124 5,119 290,063 350,305 1,649,695 Phase VI Public Safety Vehicles 7,500,000 7,500,000 7,784,825 - - 7,784,825 (284,825) Phase VI Library - Main Branch 1,000,000 1,000,000 994,132 - - 994,132 5,868 Phase VI Library - Maxwell Branch 900,000 900,000 893,753 - - 893,753 6,247 Phase VI Library - Friedman Branch 600,000 600,000 530,798 - - 530,798 69,202
Phase VI Historic Augusta - Wilson & Larmar Historic Sites 125,000 125,000 113,687 - - 113,687 11,313 Phase VI Lucy Craft Laney Museum 600,000 600,000 - - - - 600,000 Phase VI Augusta Museum of History 600,000 600,000 599,926 - - 599,926 74 Phase VI Augusta Urban Ministries 175,000 175,000 - - - - 175,000
Phase VI
Downtown Infrastructure - Downtown
Development Authority 1,200,000 1,200,000 1,105,925 8,000 - 1,113,925 86,075 Phase VI Industrial Infrastructure - RDA 1,200,000 1,200,000 1,200,027 - - 1,200,027 (27) Phase VI Municipal Building Renovation - IT Building 7,000,000 6,960,025 6,960,006 - - 6,960,006 19
Municipal Building Campus 1,114,315 330,165 406,162 7,932 744,260 370,055 Phase VI Green Space - CSRA Land Trust 500,000 500,000 47,275 1,900 8,187 57,362 442,638 Phase VI Capital Equipment - Recreation 150,000 185,000 182,562 - - 182,562 2,438 Phase VI Existing Structures Improvements 895,000 490,000 489,357 - - 489,357 643 Phase VI Augusta Common 100,000 140,000 104,700 - - 104,700 35,300 Phase VI Dyess Park 800,000 297,000 125,984 - - 125,984 171,016

Augusta Georgia
Report of Projects funded through
Special Purpose Local Option Sales Tax (SPLOST)
Year Approved: 2009
unaudited
CurrentPrior Year Balance
SPLOST Original Cost Current Cost Years Cost Encumbrances Total Project
Phase Projects Estimate Estimate Costs
as of
3/31/2021 as of 3/31/2021 Cost Budget Phase VI May Park 150,000 150,000 148,620 - - 148,620 1,380 Phase VI Old Government House 200,000 200,000 34,087 - - 34,087 165,913 Phase VI Elliot Park 100,000 100,000 50,132 - - 50,132 49,869 Phase VI Fleming Park 250,000 620,000 617,232 - - 617,232 2,768 Phase VI Fleming Tennis Center 600,000 250,000 44,544 - - 44,544 205,456 Phase VI Augusta Soccer Complex 150,000 150,000 28,769 - 8,500 37,269 112,731 Phase VI Diamond Lakes Regional Park 1,350,000 1,350,000 1,295,647 1,500 34,759 1,331,907 18,093 Phase VI Mc Duffie Woods Park 200,000 200,000 103,625 - - 103,625 96,375 Phase VI Augusta Golf Course 300,000 300,000 271,861 1,500 3,085 276,446 23,554 Phase VI H.H. Brigham Park 250,000 775,000 752,095 - - 752,095 22,905 Phase VI Valley Park 250,000 250,000 288,254 - - 288,254 (38,254) Phase VI Wood Park 50,000 50,000 - - - - 50,000 Phase VI Brookfield Park 100,000 100,000 46,556 - - 46,556 53,444 Phase VI Eisenhower Park 100,000 100,000 44,080 - - 44,080 55,920 Phase VI Warren Road Park 150,000 150,000 150,257 - - 150,257 (257) Phase VI Blythe Community Center 500,000 500,000 249,108 - 11,037 260,145 239,855 Phase VI Jamestown Community Center 200,000 200,000 203,289 - - 203,289 (3,289) Phase VI Augusta Marina 50,000 50,000 50,708 - - 50,708 (708) Phase VI 4-H Camp 50,000 50,000 23,782 - - 23,782 26,218 Phase VI Tennis Courts Resurfacing 150,000 150,000 125,951 - 23,334 149,284 716 Phase VI Swimming Pool Renovations 900,000 575,000 320,920 1,500 1,500 323,920 251,080 Phase VI Recreation Master Plan 200,000 200,000 200,000 - - 200,000 - Phase VI Recreation Project Administration 1,000,000 1,100,000 1,091,121 - - 1,091,121 8,879 Phase VI Historic Structures - 503,000 485,651 - - 485,651 17,349 Phase VI South Augusta Transit Center 190,000 190,000 148,868 - - 148,868 41,132 Phase VI Augusta Public Transit Facilities - Renovations 125,000 1,125,000 76,656 - - 76,656 1,048,344 Phase VI Redundant Fiber Ring 250,000 250,000 - - - - 250,000 Phase VI Digital Orthophotography 500,000 500,000 408,781 - - 408,781 91,219 Phase VI Software Application Consolidation 1,000,000 1,000,000 917,000 - 78,677 995,677 4,323 Phase VI Carrie Mays Park CNG Remediation - 300,000 300,000 - - 300,000 -
TOTAL 167,150,000$ 190,955,518$ 167,001,661$ 653,446$ 6,008,186$ 173,663,293$ 20,242,225$
Fund Balance 12/31/20 27,363,961 Current expenditures and project budgets 26,903,857 Available for project costs 460,104
Augusta Georgia
Report of Projects funded through
Special Purpose Local Option Sales Tax (SPLOST)
Year Approved: 2016
unaudited
CurrentPrior Year Balance
SPLOST Original Cost Current Cost Years Cost Encumbrances Total Project
Phase Projects Estimate Estimate Costs
as of
3/31/2021 as of 3/31/2021 Cost Budget
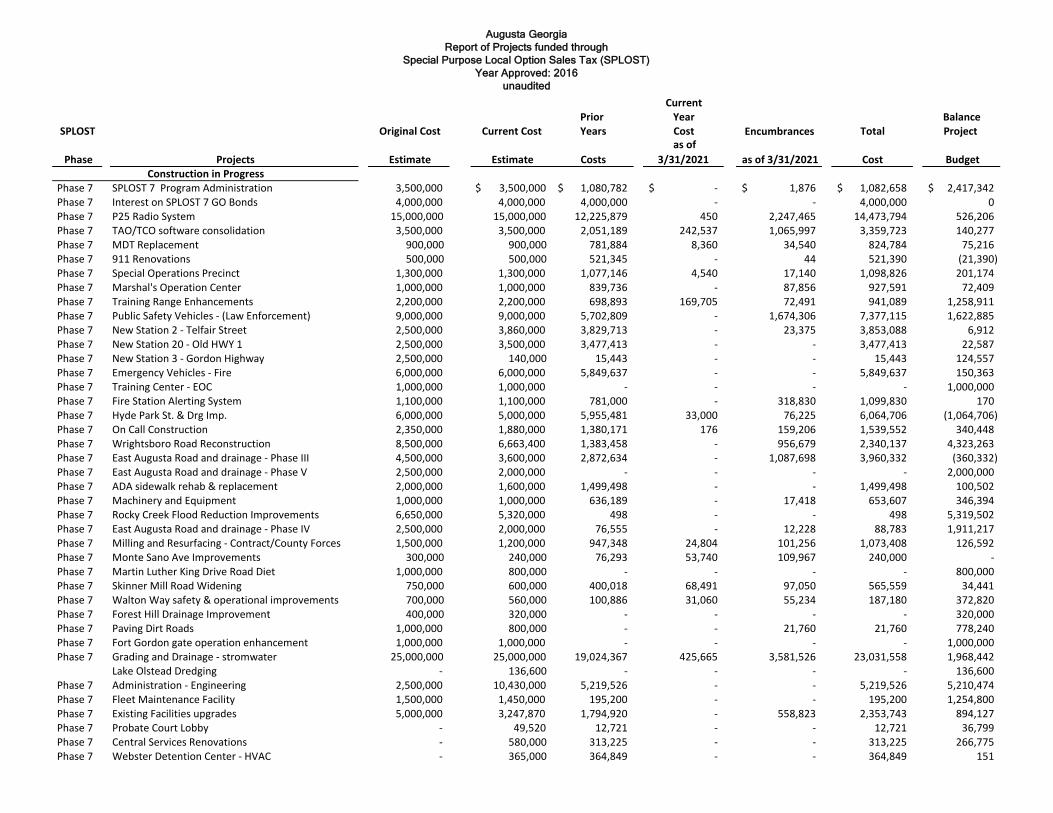
Phase 7 SPLOST 7 Program Administration 3,500,000 $ 3,500,000 1,080,782$ -$ 1,876$ 1,082,658$ 2,417,342$ Phase 7 Interest on SPLOST 7 GO Bonds 4,000,000 4,000,000 4,000,000 - - 4,000,000 0 Phase 7 P25 Radio System 15,000,000 15,000,000 12,225,879 450 2,247,465 14,473,794 526,206 Phase 7 TAO/TCO software consolidation 3,500,000 3,500,000 2,051,189 242,537 1,065,997 3,359,723 140,277 Phase 7 MDT Replacement 900,000 900,000 781,884 8,360 34,540 824,784 75,216 Phase 7 911 Renovations 500,000 500,000 521,345 - 44 521,390 (21,390) Phase 7 Special Operations Precinct 1,300,000 1,300,000 1,077,146 4,540 17,140 1,098,826 201,174 Phase 7 Marshal's Operation Center 1,000,000 1,000,000 839,736 - 87,856 927,591 72,409 Phase 7 Training Range Enhancements 2,200,000 2,200,000 698,893 169,705 72,491 941,089 1,258,911 Phase 7 Public Safety Vehicles - (Law Enforcement) 9,000,000 9,000,000 5,702,809 - 1,674,306 7,377,115 1,622,885 Phase 7 New Station 2 - Telfair Street 2,500,000 3,860,000 3,829,713 - 23,375 3,853,088 6,912 Phase 7 New Station 20 - Old HWY 1 2,500,000 3,500,000 3,477,413 - - 3,477,413 22,587 Phase 7 New Station 3 - Gordon Highway 2,500,000 140,000 15,443 - - 15,443 124,557 Phase 7 Emergency Vehicles - Fire 6,000,000 6,000,000 5,849,637 - - 5,849,637 150,363 Phase 7 Training Center - EOC 1,000,000 1,000,000 - - - - 1,000,000 Phase 7 Fire Station Alerting System 1,100,000 1,100,000 781,000 - 318,830 1,099,830 170 Phase 7 Hyde Park St. & Drg Imp. 6,000,000 5,000,000 5,955,481 33,000 76,225 6,064,706 (1,064,706) Phase 7 On Call Construction 2,350,000 1,880,000 1,380,171 176 159,206 1,539,552 340,448 Phase 7 Wrightsboro Road Reconstruction 8,500,000 6,663,400 1,383,458 - 956,679 2,340,137 4,323,263 Phase 7 East Augusta Road and drainage - Phase III 4,500,000 3,600,000 2,872,634 - 1,087,698 3,960,332 (360,332) Phase 7 East Augusta Road and drainage - Phase V 2,500,000 2,000,000 - - - - 2,000,000 Phase 7 ADA sidewalk rehab & replacement 2,000,000 1,600,000 1,499,498 - - 1,499,498 100,502 Phase 7 Machinery and Equipment 1,000,000 1,000,000 636,189 - 17,418 653,607 346,394 Phase 7 Rocky Creek Flood Reduction Improvements 6,650,000 5,320,000 498 - - 498 5,319,502 Phase 7 East Augusta Road and drainage - Phase IV 2,500,000 2,000,000 76,555 - 12,228 88,783 1,911,217 Phase 7 Milling and Resurfacing - Contract/County Forces 1,500,000 1,200,000 947,348 24,804 101,256 1,073,408 126,592 Phase 7 Monte Sano Ave Improvements 300,000 240,000 76,293 53,740 109,967 240,000 - Phase 7 Martin Luther King Drive Road Diet 1,000,000 800,000 - - - - 800,000 Phase 7 Skinner Mill Road Widening 750,000 600,000 400,018 68,491 97,050 565,559 34,441 Phase 7 Walton Way safety & operational improvements 700,000 560,000 100,886 31,060 55,234 187,180 372,820 Phase 7 Forest Hill Drainage Improvement 400,000 320,000 - - - - 320,000 Phase 7 Paving Dirt Roads 1,000,000 800,000 - - 21,760 21,760 778,240 Phase 7 Fort Gordon gate operation enhancement 1,000,000 1,000,000 - - - - 1,000,000 Phase 7 Grading and Drainage - stromwater 25,000,000 25,000,000 19,024,367 425,665 3,581,526 23,031,558 1,968,442
Lake Olstead Dredging - 136,600 - - - - 136,600 Phase 7 Administration - Engineering 2,500,000 10,430,000 5,219,526 - - 5,219,526 5,210,474 Phase 7 Fleet Maintenance Facility 1,500,000 1,450,000 195,200 - - 195,200 1,254,800 Phase 7 Existing Facilities upgrades 5,000,000 3,247,870 1,794,920 - 558,823 2,353,743 894,127 Phase 7 Probate Court Lobby - 49,520 12,721 - - 12,721 36,799 Phase 7 Central Services Renovations - 580,000 313,225 - - 313,225 266,775 Phase 7 Webster Detention Center - HVAC - 365,000 364,849 - - 364,849 151
Construction in Progress

Augusta Georgia
Report of Projects funded through
Special Purpose Local Option Sales Tax (SPLOST)
Year Approved: 2016
unaudited
CurrentPrior Year Balance
SPLOST Original Cost Current Cost Years Cost Encumbrances Total Project
Phase Projects Estimate Estimate Costs
as of
3/31/2021 as of 3/31/2021 Cost Budget Construction in Progress
Phase 7 RCCI Upgrades - 50,000 40,300 - - 40,300 9,700 Phase 7 Compliance Department Renovations - 40,000 36,864 - - 36,864 3,136 Phase 7 Judicial Center - HVAC - 145,000 142,973 - - 142,973 2,027 Phase 7 Tobacco Road - Pole Barn 147,610 205 - - 205 147,405 Phase 7 HCD Relocation - 183,000 999 - - 999 182,002 Phase 7 Animal Services 500,000 500,000 487,501 - - 487,501 12,499 Phase 7 Records Retention Center 2,500,000 2,500,000 1,680,968 - 45,895 1,726,862 773,138 Phase 7 JLEC Demolition 1,500,000 1,500,000 57,333 929 - 58,262 1,441,738 Phase 7 Public Defender Building 5,000,000 5,000,000 5,041,910 - 74,650 5,116,560 (116,560) Phase 7 Municipal Campus 35,000,000 35,000,000 1,862,000 - - 1,862,000 33,138,000 Phase 7 Museum Asset Management 1,000,000 1,000,000 - - - - 1,000,000 Phase 7 Library Facilities Renovations 500,000 190,000 157,269 - - 157,269 32,731 Phase 7 Maxwell Branch Library - 310,000 309,898 - - 309,898 102 Phase 7 Sports Facilities 1,750,000 - - - - - - Phase 7 Swimming Pools 2,000,000 53,098 53,098 - - 53,098 (0) Phase 7 ADA, Reforestation & Cemetery Improvements 1,000,000 - - - - - - Phase 7 Community Center Improvements 4,000,000 - - - - - - Phase 7 Hiking/Biking Trails & Riverwalk Enhancements 4,000,000 - - - - - - Phase 7 Neighborhood Parks/Urban Parks 4,000,000 - - - - - - Phase 7 May Park - 50,000 42,020 - - 42,020 7,980 Phase 7 Bernie Ward Community Center - 250,000 245,940 - - 245,940 4,060 Phase 7 Capital Equipment - Recreation - 50,000 24,550 - - 24,550 25,450 Phase 7 Dyess Park 1,000,000 - - 14,898 14,898 985,102 Phase 7 Lake Olmstead Park - 1,700,000 42,600 - 102,400 145,000 1,555,000 Phase 7 Fleming Park - 1,000,000 202,964 6,010 107,181 316,155 683,845 Phase 7 Diamond Lakes - 675,000 664,647 - - 664,647 10,354 Phase 7 Jamestown Park - 442,000 46,550 950 6,500 54,000 388,000 Phase 7 The Boathouse - 225,000 220,617 - 3,065 223,682 1,318 Phase 7 Hillside Park - 125,000 100,000 - - 100,000 25,000 Phase 7 Augusta Common - 125,000 110,420 - - 110,420 14,580 Phase 7 Minnick - 125,000 125,000 - - 125,000 - Phase 7 Wood Park - 350,000 324,919 - - 324,919 25,081 Phase 7 Hickman Park - 125,000 23,729 - 101,271 125,000 - Phase 7 Augusta Soccer Park - 109,000 94,000 - - 94,000 15,000 Phase 7 McDuffie Woods - 125,000 124,994 - - 124,994 6 Phase 7 Gracewood - 150,000 126,500 - - 126,500 23,500 Phase 7 Henry Brigham Center - 6,000,000 269,071 30,620 308,680 608,371 5,391,629 Phase 7 Warren Road - 225,000 209,060 - - 209,060 15,940 Phase 7 Augusta Aquatics Center - 2,043,330 2,043,330 - - 2,043,330 - Phase 7 Augusta Golf Course - 50,000 34,405 - - 34,405 15,595 Phase 7 Aquatic Center Pool - 39,750 4,000 - - 4,000 35,750

Augusta Georgia
Report of Projects funded through
Special Purpose Local Option Sales Tax (SPLOST)
Year Approved: 2016
unaudited
CurrentPrior Year Balance
SPLOST Original Cost Current Cost Years Cost Encumbrances Total Project
Phase Projects Estimate Estimate Costs
as of
3/31/2021 as of 3/31/2021 Cost Budget Construction in Progress
Phase 7 Brigham Pool - 39,750 - - - - 39,750 Phase 7 Lombard Mill 490,000 - - - - 490,000 Phase 7 McBean splash pad 125,000 - - - - 125,000 Phase 7 Fleming Complex - Safety Improvements 500,000 - - - - 500,000 Phase 7 Eastview - Safety Improvements 10,000 9,984 - - 9,984 16 Phase 7 McDuffie - Safety Improvements 4,200 4,193 - - 4,193 7 Phase 7 Gracwood Flooring 20,000 - - - - 20,000 Phase 7 Boathouse Deck renovations - 600,000 - 3,540 16,380 19,920 580,080 Phase 7 Security Cameras - 500,000 - - - 500,000 Phase 7 Recreation - Administration 750,000 750,000 460,901 - 119,587 580,488 169,512 Phase 7 Public Art Gateway Beautification 1,000,000 1,000,000 6,000 - - 6,000 994,000 Phase 7 Augusta Canal Authority 1,500,000 1,500,000 1,100,000 - - 1,100,000 400,000 Phase 7 Buses 1,350,000 1,350,000 - - - - 1,350,000 Phase 7 Bus Shelters 650,000 650,000 495,573 - - 495,573 154,427
TOTAL 215,550,000$ 215,550,000$ 116,613,989$ 1,104,577$ 13,279,495$ 130,998,061$ 84,886,067$
-