financial report at 31 december 2005 - saipem · financial report 2005. 2 saipem financial report /...
TRANSCRIPT

Financial Report at 31st December 2005

Saipem is present in the following countries
EUROPEItaly, France, Belgium, Croatia, Germany, Ireland,Luxembourg, Netherlands, Norway, Portugal, Spain,Switzerland, Turkey, United Kingdom
AMERICASArgentina, Brazil, Canada, Ecuador, Mexico, Peru, U.S.A., Venezuela
C.S.I.Astrakan, Azerbaijan, Georgia, Kazakhstan, Russia
AFRICAAlgeria, Angola, Cameroon, Congo, Egypt, Gabon, Libya, Morocco, Nigeria, Sudan
MIDDLE EASTAbu Dhabi, Dubai, Iran, Oman,Qatar, Saudi Arabia, Sharjah
FAR EAST and OCEANIAAustralia, China, India, Indonesia, Malaysia, Singapore, Thailand
Saipem is a subsidiary of Eni S.p.A.
MISSION STATEMENTPursuing the satisfaction of our clients in the
energy industry, we tackle each challenge with
safe, reliable and innovative solutions.
We entrust our competent and multi-local
teams to provide sustainable development for
our company and the communities in which we
operate.
OUR CORE VALUESCommitment to safety, integrity, openness,
flexibility, integration commitment, innovation,
quality, competitiveness, teamwork, humility,
internationalisation.

Financial Report 2005

Shareholders’ Meeeting held on 28th April 2006
Notice of the Shareholders’ Meeting was published in the newspapers: Il Sole 24 ore, Corriere della Sera and La Repubblica of 27th March 2006.

2 Letter to the Shareholders
4 Board of Directors and Auditors of Saipem SpA7 Saipem Group Structure9 Directors’ report
10 Saipem SpA share performance12 Glossary14 Operating review14 New contracts and backlog16 Capital expenditure17 Offshore Construction24 Offshore Drilling27 Leased FPSO29 Onshore Construction32 Onshore Drilling35 Liquefied Natural Gas (LNG)37 Maintenance Modification and Operation (MMO)39 Financial and economic results39 Results of operations44 Consolidated balance sheet and financial position47 Research and development49 Quality assurance, health & safety and the environment52 Human resources55 Information technology56 Corporate governance report66 Risk management67 Other information67 Buy-back of treasury shares67 Incentive schemes68 Events subsequent to year-end70 Management outlook for 200671 Reclassified balance sheet and income statement73 Consolidated financial statements at 31st December 200574 Effects of the adoption of IFRS83 Consolidated balance sheet and income statement89 Basis of presentation90 Principles of consolidation92 Accounting policies
100 Use of accounting estimates101 Recent accounting principles102 Consolidation area110 Notes to the consolidated financial statements146 Independent auditors’ report
Financial report 2005

2
S A I P E M F I N A N C I A L R E P O RT / L E T T E R TO T H E S H A R E H O L D E R S
Messrs. Shareholders,
In 2005 we achieved record income and results.
Operational activities focused on the execution of
several projects in the various market segments and
geographical areas; we achieved safety and efficiency
standards that have, once again, put your Company at
the top of its industry sector, particularly in the
execution of complex projects in frontier areas.
During the year, the new yard in Kuryk, Kazakhstan was
completed and commissioned; this gives Saipem strong
positioning and a competitive advantage in an area, the
north Caspian Sea, where the oil industry is expected to
invest heavily over the next decade.
Alongside operational successes, the company was
awarded new contracts totalling 4.7 billion euros (4.4
billion in 2004); the level of new contract acquisition
was positive across all business lines, including the
Leased FPSO sector, where Saipem, as a result of its
market penetration strategy, was awarded its first
standalone contract by Petrobras.
The backlog at the end of 2005 exceeded 5.5 billion
euros (5.3 billion at the end of 2004).
Revenues totalled 4.5 billion euros (4.3 billion in 2004),
operating income amounted to 365 million euros (328
million in 2004) and net income reached 255 million
euros (235 million in 2004).
Revenues and contribution from operations for each
business unit were as follows: the Offshore Construction
sector accounted for 58% of revenues and 61% of overall
contribution from operations (63% of revenues and 55%
of contribution in 2004), this underpins the competitive
positioning in terms of excellence and the efficiency
your Company has achieved in this sector; Onshore
Construction accounted for 16% of revenues and 11% of
contribution from operations (14% of revenues and 13%
of contribution in 2004); this reduction in volumes is
partly attributed to increased commercial costs; the
Drilling sectors generated 12% of revenues and 19% of
contribution from operations (10% of revenues and 19%
of contribution in 2004); Liquefied Natural Gas (LNG),
Maintenance Modification and Operation (MMO) and
Leased FPSO accounted for the remaining 14% of
revenues and 9% of contribution from operations (13%
Letter to the Shareholders
Pietro Franco TaliChairman & C.E.O.
Hugh James O’DonnellManaging Director
Jacques Yves LéostDirector of Saipem SpA andChairman of Saipem saN

3
of revenues and 13% of contribution in 2004).
Capital expenditure during the year went on
maintenance and upgrades of existing vessels and
equipment (122 million euros), the construction of
project-specific vessels and equipment (99 million
euros), the strengthening of operational bases/yards in
Kazakhstan and West Africa (41 million euros); the
acquisition of a tanker and the start of its conversion
into an FPSO unit, due to operate in Brazil on behalf of
Petrobras and the purchase of a second tanker also to
be converted into an FPSO unit (93 million euros).
The acquisition of Snamprogetti, finalised in February
2006, enables Saipem to take a leading role in the rapidly
growing sector for large-scale onshore turnkey projects.
Your Company is currently one of the largest and most
reliable global contractors both for the provision of
specialised services and the realisation of complex, highly
technological projects both offshore and onshore.
The acquisition of Snamprogetti will also afford Saipem
a broader client base, a superior balance in terms of
capital intensity, and increased resilience to the market
business cycles.
The consistently high price of oil and gas and the need
to replace oil reserves underpin expectations for 2006
of further growth in spending by the Oil Industry.
This spending is predicted to be mainly on offshore
projects in frontier areas and the monetization of
natural gas, sectors in which Your Company had and has
gained, through Snamprogetti’s acquisition, a good
competitive positioning.
The strong overall market performance and Saipem’s
track record and competitiveness offer great prospects
for the award of new contracts so as to maintain the
record level of backlog both at Saipem and
Snamprogetti.
In 2006, Saipem will continue strengthening its
presence in the strategic areas of West Africa and the
Caspian Sea, and pursue activities aimed at maintaining
and upgrading its fleet as well as constructing new
vessels and equipment in view of particularly
challenging projects.
Also in 2006, solutions will be identified and projects
launched to streamline the integration of competencies
at Saipem and Snamprogetti.
The substantial order backlog at the end of 2005 and
the positive overall market trend underpin expectations
S A I P E M F I N A N C I A L R E P O RT / L E T T E R TO T H E S H A R E H O L D E R S

4
BOARD OF DIRECTORS
Chairman and Chief Executive OfficerPietro Franco Tali
Managing DirectorHugh James O’Donnell
DirectorsFrancesco GattiRoberto JaquintoJacques Yves LéostMarco MangiagalliPierantonio NebuloniGesualdo PianciamoreIan Wybrew-Bond
BOARD OF STATUTORY AUDITORS
ChairmanPaolo Andrea Colombo
Statutory AuditorsFabrizio GardiFabio Venegoni
Alternate Statutory AuditorsLuca Giovanni CarettaGiulio Gamba
INDEPENDENT AUDITORSPricewaterhouseCoopers SpA
Saipem is a subsidiary of Eni SpA
for 2006 of achieving further growth in volumes versus
those recorded by Saipem and Snamprogetti in 2005 (a
total of 6.6 billion euros) and net income that, thanks to
the positive contribution estimated as a result of
Snamprogetti’s acquisition, is expected to be in excess
of 300 million euros.
The Board of Directors, bearing out the policy of
distributing approximately one third of the
consolidated net income, proposes to the Shareholders’
Meeting a dividend of 0.19 euro per ordinary share and
0.22 euro per savings share (2004: 0.15 euro and 0.18
euro respectively).
S A I P E M F I N A N C I A L R E P O RT / L E T T E R TO T H E S H A R E H O L D E R S
On behalf of the Board of Directors
The Chairman Pietro Franco Tali

Saipem Group structure
S A I P E M F I N A N C I A L R E P O RT
7 8
S A I P E M F I N A N C I A L R E P O RT / S A I P E M G R O U P S T R U C T U R E

9
Directors’ report

Stock Exchange data and indices 31.12.2001 31.12.2002 31.12.2003 31.12.2004 31.12.2005
Share capital (in euros) 440,270,300 440,697,000 440,713,700 441,177,500 441,410,900
Ordinary shares 440,056,032 440,482,732 440,499,432 440,987,734 441,239,414
Savings shares 214,268 214,268 214,268 189,766 171,486
Market capitalisation (million euros) 2,417 2,821 2,847 3,909 6,087
Gross dividend per share
Ordinary shares (euros) 0.127 0.144 0.148 0.150 (*) 0.190
Savings shares (euros) 0.157 0.174 0.178 0.180 (*) 0.220
Price/earning ratio per share (*)
Ordinary shares 14.39 14.88 14.68 19.84 23.87
Savings shares 13.94 16.72 15.86 19.57 25.97
Price/cash flow ratio per share (*)
Ordinary shares 6.74 6.34 6.27 8.94 13.41
Savings shares 6.53 7.12 6.77 8.82 14.58
(*) figures pertain to the consolidated financial statements.
S A I P E M F I N A N C I A L R E P O RT / S H A R E P E R F O R M A N C E
10
Saipem SpA share performance
On 31st December 2005, Saipem’s ordinary shareswere traded on the Milan Stock Exchange at 13.793euros. When comparing this value to the closingprice the previous year, the share increased by morethan 55%, strongly outperforming the SPMIB index,whose increase during the same period reached 15%.
Heavy energy demand from industrialised countrieslike the Unites States and rapidly developingcountries like China and India strongly affected oiland gas prices, the latter having already been underpressure throughout the year by the unstable geo-political scenario and adverse climate conditions,namely the series of hurricanes that hit the coast ofthe Gulf of Mexico. Shares in the oil sector benefitedfrom these circumstances, in particular the Saipemshare, which, thanks to a more than favourableeuro/dollar exchange rate, recorded almostuninterrupted growth throughout the year. The sharereached an all-time high of 14.34 euros in midSeptember and then fell slightly during the last
quarter to stabilise below 14 euros, with a marketcapitalization in excess of 6 billion euros.
Shares traded during the year exceeded 811 million,a slightly lower volume than in 2004 (882 million),with a total value of 9,300 million euros, versusalmost 7,000 million euros in 2004.
Savings shares, which represent a very limitednumber (171,486) and are convertible at par withordinary shares, closed the year at 15 euros, anincrease in excess of 70% versus the 2004 year-endquotation. Volumes traded were minimal.
On 23rd May 2005, a dividend of 0.15 euros per share(0.18 euros per savings share) was distributed toShareholders.

Share prices on the Milan Stock Exchange 2001 2002 2003 2004 2005(€)
Ordinary Shares- maximum 7.60 7.66 7.31 9.42 14.34- minimum 4.16 4.68 5.24 6.16 8.69- average 6.22 6.41 6.30 7.93 11.40- year end 5.49 6.40 6.46 8.86 13.79Savings Shares- maximum 7.49 13.71 7.48 9.45 15.52- minimum 5.32 5.05 5.80 6.60 8.74- average 6.51 7.38 6.71 8.14 11.95- year end 5.32 7.19 6.98 8.74 15.00
S A I P E M F I N A N C I A L R E P O RT / S H A R E P E R F O R M A N C E
11

S A I P E M F I N A N C I A L R E P O RT / G LO S S A R Y
12
Financial Terms
IFRS: International Financial Reporting Standards issued by IASB
(International Accounting Standards Board) and adopted by the
European Commission. They comprise of: International Financial
Reporting Standards (IFRS), International Accounting Standards
(IAS), interpretations issued by the International Financial
Reporting Interpretation Committee (IFRIC) and the Standing
Interpretations Committee (SIC) adopted by IASB. The
denomination International Financial Reporting Standards (IFRS)
has been adopted by IASB and applies to principles issued after
May 2003. Principles issued before May 2003 have maintained the
denomination IAS.
Leverage: the degree to which the company is utilising borrowed
money. It is the ratio between net financial debt and Shareholders’
equity inclusive of minority interest.
Contribution from operations: Operating Income before general
and administrative expenses.
ROACE: return on average capital employed. The ratio between
net income before minority interest plus after-tax net financial
expenses deriving from net financial debt, over average net capital
employed.
Operational Terms
Conventional waters: depth of up to 500 metres.
Deep waters: depths of over 500 metres.
Buckle detection: System that utilises electromagnetic waves
during pipelaying to signal collapse of or deformations to pipeline
laid.
Bundles: bundles of cables.
Commissioning: series of processes and procedures undertaken in
order to start operations of a gas pipeline, associated plants and
equipment.
Concrete coating: subsea pipelines are coated with reinforced
concrete so as to ballast and protect them from damage and
corrosion
Deck: area of a vessel or platform where work equipment is
located: process plant and equipment, accommodation modules
and drilling units.
Decommissioning: undertaken in order to end operations of a gas
pipeline, associated plants and equipment. It may occur at the end
of the life of the plant, following an accident, for technical or
financial reasons, and/or on environmental or safety grounds.
Dynamically Positioned Heavy Lift Vessel: Vessel equipped with a
heavy-lift crane, capable of holding a precise position through the
use of thrusters, thereby counteracting the force of the wind, sea,
current, etc.
EPC (Engineering, Procurement, and Construction): a type of
contract typical of the onshore construction sector, comprising
the provision of engineering services, procurement of materials
and construction. The term ‘turnkey’ indicates that the system is
delivered to the client ready for operations, i .e. already
commissioned.
EPIC (Engineering, Procurement, Installation, Construction): a type
of contract typical of the offshore construction sector, which
relates to the realisation of a complex project where the global or
main contractor (usually a construction company or a
consortium) provides the engineering services, procurement of
materials, construction of the system and its infrastructure,
transport to site, installation and commissioning/preparatory
activities to the start up of operations.
Facilities: auxiliary services, structures and installations required
to support the main systems.
Flare: tall metal structure used to burn off gas produced by the
oil/gas separation in oil fields, when it is not possible to utilise it
onsite or ship it elsewhere.
Floatover: type of module installation onto offshore platforms
that does not require lifting operations. A specialised vessel
transporting the module uses a ballast system to position itself
directly above the location where the module is to be installed; it
then proceeds to de-ballast and lower the module into place.
Once this has been completed the vessel backs off and the module
is secured to the support structure.
FPSO vessel: Floating Production, Storage and Offloading system
comprising a large tanker equipped with a high-capacit y
production facility. This system, moored at the bow to maintain a
geo-stationary position, is effectively a temporarily fixed platform
that uses risers to connect the subsea wellheads to the on-board
processing, storage and offloading systems.
Hydrocracking (plant): installation for process separation of large
oil molecules.
Hydrotesting: Operation involving high pressure (higher than
operational pressure) water being pumped into a pipeline to
ensure that it is devoid of defects.
Jacket: platform underside structure fixed to the seabed using
piles.
Jack-up: mobile self-lifting unit comprising a hull and retractable
legs, used for offshore drilling operations
J-laying: Method of pipelaying that utilises an almost vertical
launch ramp, making the pipe configuration resemble a ‘J’. This
configuration is suited to deep-water pipe laying.
LNG: liquefied natural gas is obtained by cooling down natural gas
to minus 160°C. at normal pressure. The gas is liquefied to make it
facilitate its transportation from the place of extraction to that of
processing and/or utilisation. A tonne of LNG equates to 1,400
cubic metres of gas.
Midstream: Sector comprising all those activities relating to the
construction and management of the oil transport infrastructure.
Glossary

S A I P E M F I N A N C I A L R E P O RT / G LO S S A R Y
13
Moon pool: opening in the hull of a drillship to allow for the
passage of operational equipment.
Mooring buoy: offshore mooring system.
Offshore/Onshore: The term offshore indicates a portion of open
sea and, by induction, the activities carried out in such area, while
onshore refers to land operations.
Pig: piece of equipment used to internally clean, scrape and survey
a pipeline.
Piggy-backed pipeline: small-diameter pipeline, fixed to a larger
pipeline, used to transport a product other than that of the main
line.
Pile: long and heavy steel pylon driven into the seabed; a system of
piles is used as foundation for anchoring a fixed platform or other
offshore structures.
Pipe-in-pipe: subsea pipeline system comprising two coaxial
pipes, used to transport hot fluids (oil & gas). The inner pipe
transports the fluid whereas the outer pipe carries the insulating
material necessary to reduce heat loss to the sea. The outer pipe
also protects the pipeline from the water pressure.
Pre-commissioning: comprises pipeline washing out and drying.
Pre-drilling template: support structure for a drilling platform.
Pulling: minor operations on oil wells due to maintenance or
marginal replacements.
Rig: drilling installation comprising the derrick, the drill deck,
which supports the derrick, and ancillary installations that enable
the descent, ascent and rotation of the drill unit as well as mud
extraction.
Riser: manifold connecting the subsea wellhead to the surface.
ROV (Remotely operated vehicle): unmanned vehicle, piloted and
powered via umbilical, used for subsea surveys and operations.
S-laying: Method of pipelaying that utilises the elastic properties
afforded by steel, making the pipe configuration resemble an ‘S’,
with one end on the seabed and the other under tension onboard
the ship. This configuration is suited to medium to shallow-water
laying.
Slug catcher: equipment for the purification of gas.
Spar: floating production system, anchored to the seabed through
a semi-rigid mooring system, comprising a vertical cylindrical hull
supporting the platform structure.
Spool: connection between a subsea pipeline and the platform
riser, or between the terminations of two pipelines.
SURF facilities: pipelines and equipment connecting the well or
subsea system to a floating unit.
Template: rigid and modular subsea structure where the oilfield
well-heads are located.
Tendons: pulling cables used on tension leg platforms used to
ensure platform stability during operations.
Tension leg platform (TLP): Fixed-type floating platform held in
position by a system of tendons and anchored to ballast caissons
located on the seabed. These platforms are used in ultra-deep
waters.
Tie-in: connection between a production line and a subsea
wellhead or simply a connection between two pipeline sections.
Topside: portion of platform above the jacket.
Trenching: burying of offshore or onshore pipelines.
Trunkline: oil pipeline connecting large storage facilities to the
production facilities, refineries and/or onshore terminals.
Umbilical: Flexible connecting sheath, containing flexible pipes
and cables.
Upstream/Downstream: the term upstream relates to
exploration and production operations. The term downstream
relates to all those operations that follow exploration and
production operations in the oil sector.
Wellhead: fixed structure separating the well from the outside
environment.
Workover: major maintenance operation on a well or
replacement of subsea equipment used to transport the oil to the
surface.

S A I P E M F I N A N C I A L R E P O RT / D I R E C TO R S ’ R E P O R T
14
Saipem Group – Contracts awarded to the Saipem Group in 2005 (million €)2004 2005
Amount % Amount %
Saipem S.p.A. 1,289 29 583 12
Group companies 3,098 71 4,152 88
Total 4,387 100 4,735 100
Offshore Construction 2,738 62 2,422 51
Offshore Drilling 107 2 367 8
Leased FPSO 22 1 499 11
Onshore Construction 596 14 540 11
Onshore Drilling 275 6 212 4
Liquefied Natural Gas 344 8 282 6
Maintenance Modification and Operation 305 7 413 9
Total 4,387 100 4,735 100
Italy 131 3 218 5
Abroad 4,256 97 4,517 95
Total 4,387 100 4,735 100
Eni Group 452 10 450 10
Third Parties 3,935 90 4,285 90
Total 4,387 100 4,735 100
New contracts and backlog
Operating review

S A I P E M F I N A N C I A L R E P O RT / D I R E C TO R S ’ R E P O R T
15
In 2005, the Saipem Group was awarded new contractstotalling 4,735 million euros (4,387 million euros in2004).51% of all contracts awarded are in the OffshoreConstruction sector, 11% in Onshore Construction andLeased FPSO, 9% in Maintenance, Modification &Operation, 8% in the in the Offshore Drilling sector, 6% inLiquefied Natural Gas and 4% in the Onshore Drillingsector.New contracts to be carried out outwith Italy make up95% and contracts awarded by Eni Group companiesrepresented 10% of the overall figure. Finally, ordersawarded to the parent company Saipem S.p.A .amounted to 12% of the overall total.
Saipem Group – Backlog at 31st December 2005 (million €)2004 2005
Amount % Amount %
Saipem S.p.A. 1,489 28 999 18
Group Companies 3,817 72 4,514 82
Total 5,306 100 5,513 100
Offshore Construction 3,303 62 3,104 56
Offshore Drilling 317 6 382 7
Leased FPSO 117 2 589 11
Onshore Construction 763 15 555 10
Onshore Drilling 296 6 298 5
Liquefied Natural Gas 447 8 430 8
Maintenance Modification and Operation 63 1 155 3
Total 5,306 100 5,513 100
Italy 1 – 21 –
Abroad 5,305 100 5,492 100
Total 5,306 100 5,513 100
Eni Group 298 6 217 4
Third Parties 5,008 94 5,296 96
Total 5,306 100 5,513 100
New contracts by geographical area
(*) Russia includes Kazakhstan and Azerbaijan
At year-end, the order backlog amounted to 5,513million euros, a 3.9% increase versus 2004. Breakdown of activities by sector is as follows: 56% inOffshore Construction, 11% in Leased FPSO, 10% inOnshore Construction, 8% in Liquefied Natural Gas, 7%in Offshore Drilling, 5% in Onshore Drilling and 3% inMaintenance, Modification and Operation.The parent company, Saipem S.p.A. accounts for 18% ofthe total order backlog. Almost all orders are on behalfof overseas clients, whilst orders from Eni Groupcompanies represent 4% of the overall figure.
Backlog by geographical area
(*) Russia includes Kazakhstan and Azerbaijan

S A I P E M F I N A N C I A L R E P O RT / D I R E C TO R S ’ R E P O R T
16
(million €)
BREAKDOWN BY COMPANY 2004 2005
Saipem S.p.A. 35 61
Other Group Companies 174 301
Total 209 362
BREAKDOWN BY BUSINESS UNIT
Offshore Construction 104 184
Offshore Drilling 52 46
Leased FPSO – 93
Onshore Construction 22 14
Onshore Drilling 11 13
Liquefied Natural Gas 6 2
Maintenance Modification and Operation 2 2
Other 12 8
Total 209 362
BREAKDOWN BY NATURE
Acquisition of company interests 12 7
Technical 197 262
FPSO – 93
Total 209 362
Capital expenditure on vessels and equipment duringthe year amounted to 355 million euros (197 million in2004), whilst the acquisition of company interestsamounted to 7 million euros. Investments in vessels and equipment consisted mainlyof the following: maintenance and upgrading of existingasset base for the Offshore and Onshore Constructionand Drilling, Liquefied Natural Gas and MaintenanceModification and Operation sectors (122 million euros);the construction and purchase of project-specific
equipment (99 million euros); capex to strengthen theoperating bases/yards in Kazakhstan and West Africa (41million euros); the purchase of a tanker and the start ofits conversion into an FPSO unit, due to operate onPetrobras’ Golfinho 2 field in Brazilian waters from thebeginning of 2007 and the purchase of another tankeralso to be converted into an FPSO unit (93 millioneuros).The following table provides a breakdown of capitalexpenditure:
Details of capital expenditure for the individual businessunits are provided in the paragraphs to follow.“Other” capital expenditure refers to investmentscarried out at Head office and other premises.
Capital expenditure

S A I P E M F I N A N C I A L R E P O RT / D I R E C TO R S ’ R E P O R T
17
Year 2004 Year 2005
Subsea pipelines laid (km)
- Italy 28 3
- Abroad 1,606 880
Total km 1,634 883
Structures installed (tons)
- Italy 1,082 –
- Abroad 171,582 134,602
Total tons 172,664 134,602
Offshore Construction
General overview
The Saipem Group possesses a strong, technologicallyadvanced and highly versatile fleet in addition to acomprehensive spread of sector-leading engineeringand project management expertise.These unique capabilities and competences, togetherwith a long-standing presence in strategic frontiermarkets comprise an industrial model that isparticularly well suited to EPIC (Engineering,Procurement, Installation and Construction) projects.
Amongst the semi-submersible fleet equipped with themost advanced state-of-the-art technologies, the vesselmost noteworthy is Saipem 7000 thanks to its dynamicpositioning system, 14,000-tonne lifting capacity and itscapability to lay subsea pipelines in ultra-deep watersusing the “J-lay” system, which can handle a suspendedload of up to 1,450 tons during pipelay operations.Other vessels include Castoro Sei, capable of layinglarge diameter subsea pipelines; the Field DevelopmentShip (FDS), a special purpose vessel used in thedevelopment of deep-water fields, equipped with adynamic positioning system and a 600-tonne lifting

S A I P E M F I N A N C I A L R E P O RT / D I R E C TO R S ’ R E P O R T
18
capacity crane, in addition to a vertical pipelayingsystem able to work in water depths of up to 2,000metres and the vessel Saipem 3000, capable of layingflexible pipelines and installing umbilicals and mooringsystems in deep waters and installing subsea structuresof up to 2,200 tons. Saipem also boasts a strong position in the subseamarket, operating highly sophisticated andtechnologically advanced vehicles, such as subsea ROVs(Remotely Operated Vehicles), i.e. purposely-equippedrobots, able to carry out complex deep-water pipelineinterventions.Group companies operating in the OffshoreConstruction sectors, in addition to the parentcompany, are: Saipem s.a., its direct subsidiaries SaibosConstruções Maritimas, Bos Congo, Petromar, PTSofresid Indonesia and its associated company OffshoreDesign Engineering. Also: Saipem UK, Saipem America,Saipem (Malaysia), Saipem Asia, PT Saipem Indonesia,Saipem Luxembourg, Saipem (Portugal) ComércioMarítimo, Sonsub, Intermare Sarda, Saipem Contracting(Nigeria), Saipem Energy International, Saipem FPSO,ERS Equipment Rental & Ser vices, SaipemMediterranean Services, StarGulf, ER SAI CaspianContractor, Bos Shelf and Moss Maritime.
Market conditions
The significant global spending increase in explorationand production recorded in 2004 was borne out in2005. The consolidation of short and medium termexpectations in the Offshore Construction sector hasled many operators to invest in new vessels and/or toupgrade existing ones, often with the aim of combininglifting power with deepwater pipelaying capabilities. Infact, the highest increases recorded in 2005 are in thosemarket segments associated with the development ofdeepwater oilfields, i.e. floating production and subseainstallations, and more importantly, these segments areexpected to remain buoyant for the next few years.The pipelaying sector, as a whole, showed an increase inactivities versus 2004, reaching record levels thankslargely to a recovery in operations in the North Sea, anarea that was positively affected by sustained level ofactivities in the small-diameter pipelay segment.Asia Pacific proved to be the most important area atglobal level in terms of volumes – unchanged versus2004 – followed by the North Sea and the Gulf ofMexico, where large-diameter pipes were laid in ultra-deep waters.Operations in the Middle East plateaued at high levels inthe large-diameter pipelay segment, whilst the small-
diameter segment experienced a contraction.The role played by the remaining areas, namely theMediterranean Sea, Africa and Latin America, wasaltogether minor; however, positive growth wasrecorded in the small-diameter pipelay segment inWest Africa.The mid-large fixed platform market experienced ageneral increase in activities, in particular in Asia Pacific,where approximately half of all global installations werein operation. However, this is to be considered as part ofa long-term declining trend in platform installation,especially the lightweight platforms, which in 2005registered a fall mainly in the Gulf of Mexico.In 2005, the floating production market (comprisingFPSO, TLP, Spar and semi-submersibles) went through apositive phase, due mainly to the high level ofoperations recorded in Latin America and West Africa.The subsea installation sector resumed growing in2005, after a temporary contraction. Specifically, thedeepwater installation segment experienced sustainedstrong growth, reaching record levels and bearing outthe trend of rapid development, deemed structural inview of the progressive increase of capital expenditurein deep waters versus overall offshore spending. Thehighest levels of growth versus 2004 were recorded inBrazil, West Africa and the Gulf of Mexico.With regard to shallow water activities, the subseainstallation sector is showing growth versus 2004,although still well below the record levels of the latenineties, the period of maximum expansion in theNorth Sea. This area, which despite the declining trendstill represents more than half of the global market, isexperiencing a recovery following the low point in2004.A substantial number of shallow-water subseainstallations were also operating in Asia Pacific and theMediterranean, an area relatively new to this type ofproduction.
New contracts
The most important contracts awarded to the SaipemGroup during 2005 were:- on behalf of Total Upstream Nigeria, the EPIC contract
AKPO in Nigeria, comprising engineering,procurement, construction, installation andcommissioning of subsea pipelines, umbilicals andrisers, in addition to the construction of an oiloffloading system, the installation of an FPSO mooringsystem and the laying of a gas pipeline between theFPSO and the Amenam AMP2 platform;
- on behalf of BP Berau Ltd, t wo EPIC contracts

S A I P E M F I N A N C I A L R E P O RT / D I R E C TO R S ’ R E P O R T
19
comprising engineering, procurement, constructionand installation of two platforms and two subseapipelines as part of the “Tangguh LNG Project” inIndonesia;
- on behalf of Esso Exploration Angola Ltd, the EPICcontract Marimba, for the development of theMarimba oil field in Block 15 off the coast of Angola.The contract comprises engineering, procurement,construction and installation of subsea pipelines atdepths of approximately 1,200 metres, linking theMarimba field to the existing facilities of the KizombaA field;
- on behalf of Thai Oil Public Company Ltd, the EPICcontract for the construction of oil offloading facilitiesfor the Sri Racha refinery in the Gulf of Siam. Thecontract comprises engineering, procurement,construction, installation and commissioning of abuoy tanker mooring system, a subsea pipeline andassociated onshore facilities;
- on behalf of Pemex Exploracion y Produccion, the Ku-Maloob-Zaap project, comprising the transport andinstallation of six plat forms as part of thedevelopment of the Ku-Maloob-Zaap oil field inCampeche Bay, Mexico;
- on behalf of Talisman Energy UK, the Tweedsmuirproject in the British sector of the North Sea,comprising the laying of a pipeline and a pipe-in-pipeflowline for a piggy-backed gas pipeline;
- on behalf of Statoil, the Skinfaks/Rimfaks project inNorway, comprising the transport and installation oftwo sealines, umbilicals, spools and other subseastructures;
- on behalf of Statoil, the Tampen Link project inNorway, comprising the laying of a pipeline linking theStatfjord B platform to an existing pipeline;
- on behalf of Raffineria di Gela S.p.A., a contract inSicily, comprising the design, procurement andinstallation for the replacement of an existingpipeline;
- on behalf of Offshore Oil Engineering Company Ltd,the Dong Fang and Lu Feng projects in China,comprising the installation of t wo jackets andassociated piles, two decks and a pipeline;
- on behalf of Canadian Natural Resources, theColumba E Water Injection project in the Britishsector of the North Sea, comprising installation,trenching and tie-in of an umbilical connecting theColumba E well to the topsides on the Ninian Southplatform.
Capital expenditure
The most significant investments in this sector include:- for the Kashagan project, all activities related to the
construction of new flat-keel vessels, suitable foroperations in shallow waters;
- the continuation of construction works for the newoperating base in Kuryk on the shores of the CaspianSea, in Kazakhstan, due to be used for the fabricationof offshore structures and as a logistical base foroperations in the area;
- the continuation of construction works on the newyard in Soyo, Angola, due to be used for thefabrication of structures and modules for ongoingprojects;
- upgrading and maintenance works to main fleet’svessels.
Work performed
Activities in 2005 consisted in the laying of 883 km ofpipelines and the installation of 134,602 tons of plantand equipment. Main projects are listed hereafter.
In Libya, Saipem carried out the following operations:- installation of deck structures was completed utilising
the vessel Saipem 7000; also completion works andcommissioning on the EPIC project NC41 Platform(Sabratha) on behalf of Eni Gas B.V. were successfullyperformed. The project comprised the followingactivities: project management, the fabrication of thejacket, accommodation deck and the flare stack,whose installation was carried out towards the end of2004 utilising Saipem 7000. The contract, executedby a consortium comprising Saipem S.p.A. (leader)and Hyundai Heavy Industries, includes assistancewith platform operations for the initial six months;
- tie-in operations of spools connecting the sealines tothe distribution points and the Sabratha platforms aspart of the EPIC project NC41 Sealines (Bahr Essalam)on behalf of Eni Gas B.V. were completed. The projectcomprised the following activities: detail engineering,procurement of materials, the pipelines and pre-fabrication of the subsea valves, the construction ofmooring facilities to the shore and laying of pipelinesutilising the semi-submersible pipelay vessel CastoroSei;
- testing operations and commissioning on the EPICproject NC41 Subsea on behalf of Eni Gas B.V. werecompleted. The project comprised the following:engineering, procurement, project management,construction, transport and installation, utilising thevessel Saipem 7000 and the derrick lay barge S355.
In the Mediterranean Sea, Saipem also carried out thefollowing works:

S A I P E M F I N A N C I A L R E P O RT / D I R E C TO R S ’ R E P O R T
20
- installation was completed as part of the Gela projectin Sicily on behalf of Raffineria di Gela S.p.A.: itcomprised the design, procurement and installationfor the replacement of an existing pipeline; trenchingoperations have started, whilst testing andcommissioning are due to reach completion by theend of June 2006;
- installation works continued on the Ika, Ida andIvana Gas Field project, on behalf of InAgip, inCroatian waters, comprising the installation of sixjackets and seven decks, in addition to transport andinstallation of various connecting spools andpipelines;
- project management activities are ongoing as part ofthe Temsah North West project in Egypt on behalf ofPetrobel, comprising transport and installation of onejacket, one deck and associated piles;
- the Aquaduct Palma de Mallorca project wascompleted in Spain on behalf of FCC Construccion: itcomprised engineering, procurement and installationof a subsea pipeline due to transport potable water.
In the Far East, the following works were carried out:- the Bayu-Darwin Pipeline project in Australia was
completed on behalf of ConocoPhillips PipelineAustralia Pty Ltd; the project comprised engineering,transport and installation of a subsea pipeline utilisingthe semi-submersible pipelay vessel Semac 1;
- pipelaying operations were completed on theBongkot Field Development Phase 3 project inThailand on behalf of PTT Exploration and ProductionPublic Company Ltd., comprising engineering,procurement, construction, transport and installationof a platform, various subsea pipelines and associatedfacilities;
- installation was completed, in record time versus thework schedule, and post trenching activities were alsosuccessfully accomplished for the EPIC-type Lammaproject on behalf of Hong Kong Electric Company Ltd,whilst hydrotesting operations are reachingcompletion. Offshore works were carried out by thetrench barge Castoro 10;
- operations are currently ongoing on the EPIC-typeSakhalin II Pipelines project, in Russia, on behalf ofSakhalin Energy Investment Company Ltd. (SEIC),comprising engineering, procurement, installationand construction of a pipeline system connecting theLunskoye and Pitun-Astkhskoye platforms to theisland of Sakhalin;
- project management, engineering and preparatorywork for installation are progressing for the Sakhalin IITopsides project, in Russia, on behalf of SamsungHeavy Industries, comprising the transport and
installation of topsides for the Lunskoye and Piltun-Astkhskoye B platforms, the latter being the largestplatform ever installed using the float-over method;
- the Dong Fang and Lu Feng projects in China werecompleted on behalf of Offshore Oil Engineering Co.;they comprised the installation of two jackets andassociated piles, two decks and a pipeline;
- installation of various structures was completedutilising the derrick pipelay vessel Castoro Otto, aspart of the Sarawak project in Malaysia on behalf ofTL Offshore;
- engineering and procurement activities are ongoingwhilst fabrication works have begun on two EPICcontracts as part of the Tangguh LNG Project inIndonesia on behalf of BP Berau Ltd, comprisingengineering, procurement, construction andinstallation of t wo plat forms and t wo subseapipelines;
- construction is continuing on structures for the EPICproject Third Transmission Pipeline in Thailand onbehalf of PT T Public Company Ltd, comprisingengineering, procurement, construction, transportand installation of production facilities (jacket,tripods, flare booms, topsides);
- preparatory activities have begun on the WeizhouPipeline project in China on behalf of Offshore OilEngineering Company, comprising installation ofthree subsea pipelines utilising the trench bargeCastoro 10;
- the mobilisation of the project team to Jakartamarked the start of activities on the Thai Oil projecton behalf of Thai Oil Public Company Ltd; this EPICcontract comprises the construction of oil offloadingfacilities for the Sri Racha refinery in the Gulf of Siam.The contract comprises engineering, procurement,construction, installation and commissioning of abuoy mooring system, a subsea pipeline andassociated shore facilities.
In West Africa, the following works were carried out:- installation activities for Part B have been completed
for the EPIC project Kizomba-A and B in Angola onbehalf of Exxon-Mobil. The scope of works comprisesthe development of two subsea fields by layingflowlines, installing risers, minor lines and umbilicalsat depths of up to 1,000/1,250 metres. For thisproject, newly-developed engineering conceptspatented by Saibos involving deepwater risers, havebeen utilised for the first time. The project is beingcarried out by the specialised FDS vessel;
- testing and commissioning are progressing as part ofthe EPIC project East Area EPC2 on behalf of ExxonMobil in Nigeria; the project comprised engineering,
S A I P E M F I N A N C I A L R E P O RT / D I R E C TO R S ’ R E P O R T
21
procurement, construction and installation of threeplat forms, in addition to the laying of subseapipelines. The project was carried out utilising thederrick pipelay vessel Saipem 3000 and the work laybarges Saibos 230 and S355;
- installation of the platform jacket was successfullycompleted and fabrication of the deck andpreparatory works for its installation are underway aspart of the EPIC project Amenam 2 in Nigeria onbehalf of Elf Petroleum Nigeria Ltd, comprisingengineering and construction of a platform and itsinstallation utilising the ‘float-over’ method. Thecontract is being performed in joint venture withTechnip-Coflexip ;
- operations are progressing on the EPIC project Erha,on behalf of Exxon Mobil, involving the engineering,procurement, construction, transport andcommissioning of an FPSO installation on the Erhafield in Nigeria; in December, the FPSO, built inSingapore, arrived at the offshore site in Nigeria. Thehook-up and commissioning operations are due tocomplete in the first half 2006;
- construction of the plat form module reachedcompletion and final hook-up and commissioningoperations have started on the EPIC project Yoho inNigeria, on behalf of Mobil Producing NigeriaUnlimited, involving project management,engineering, procurement, construction, transport,installation and commissioning of the Yoho platform;
- construction activities have been completed whilsttopside installation and commissioning are ongoingfor the EPIC Dalia project on behalf of TotalExploration & Production Angola, in Angola,comprising engineering, procurement, constructionand assembly of the topsides for the FPSO system dueto operate in the Dalia field. The contract wasawarded in joint venture with Technip-Coflexip, StoltOffshore and the Korean companies Samsung HI andDSME;
- fabrication and laying operations of the wellheadplatform and pipelines have been completed as partof the EPIC West Espoir project on behalf of CNRInternational (Cote d’Ivoire) s.a.r.l in the Ivory Coast;the project comprised engineering, procurement,construction, commissioning, transport andinstallation of a wellhead and associated facilities, inaddition to three flowlines and risers, connectingspools and trunklines; testing and commissioningactivities are currently ongoing;
- project management, engineering, procurement andconstruction activities have been completed on theEPIC Rosa Surf project on behalf of Total Exploration& Production Angola, in Angola, comprising
engineering, procurement, construction, installationand commissioning of subsea pipelines, umbilicalsand risers at water depths of approximately 1,400metres. These works will allow for the tie-back of theRosa field to the Girassol FPSO;
- preparatory activities have started and the projectteam is to be mobilised soon as part of the EPICcontract AKPO in Nigeria on behalf of Total UpstreamNigeria, comprising engineering, procurement,construction, installation and commissioning ofsubsea pipelines, umbilicals and risers, in addition tothe construction of an oil offloading system, theinstallation of an FPSO mooring system and the layingof a gas pipeline between the FPSO and the AmenamAMP2 platform.
In the North Sea, Saipem carried out the followingworks utilising the vessel Saipem 7000:
- installation of deck modules was completed on theDan Maersk project on behalf of Maersk Oil, in theDanish sector; the project comprises the transportand installation of a platform;
- three jackets and a wellhead deck have been installedas part of the Buzzard Platform project on behalf ofNexen in the British sector; the project comprises thetransport and installation of three jackets, two decks,a wellhead deck and two connecting gangways;
- a jacket and topsides have been removed as part ofthe Frigg and MCP-01 Decommissioning project onbehalf of AKOP (Aker Kvaerner Offshore Partners),comprising the removal and transport of a jacket andseven platforms on the Frigg and MCP-01 gas field, inthe North Sea;
- the removal of the flareboom and mooring blocks hasbeen completed for the Brent Decommissioningproject on behalf of Shell, in the British sector; theproject comprises the removal of the tower,flareboom and other structures from the Brentplatform.
In the North Sea, the following works were carried oututilising the vessel Castoro Sei:- the Rhum project was completed on behalf of BP
Exploration Operating Company, in the British sector,which comprised the laying of a subsea pipeline dueto transport gas from the Rhum field to the Bruceplatform;
- the Saturn Development project was completed onbehalf of ConocoPhillips Uk, in the British sector ofthe North Sea, which comprised the laying of a gaspipeline and a piggy-backed pipeline;
- the Horne and Wren project was completed onbehalf of Tullow Oil, in the British sector, which

S A I P E M F I N A N C I A L R E P O RT / D I R E C TO R S ’ R E P O R T
22
comprised engineering, procurement, installation andcommissioning of two subsea pipelines;
- project management, engineering, procurement andother installation preparatory activities have startedon the Ormen Lange project on behalf of NorskHydro in the Norwegian sector of the North Sea,comprising transport and installation of two subseapipelines at depths of approximately 900 metres;
- project management and engineering activities areongoing as part of the Tweedsmuir project on behalfof Talisman Energy UK, the in the British sector of theNorth Sea, comprising the laying of a pipeline and apipe-in-pipe flowline for a piggy-backed gas pipeline;
- project management, engineering and procurementactivities have started on the Gas Unie project onbehalf of BBL Company (a partnership betweenGasunie, E.ON Ruhrgas and Fluxys), in the North Sea,comprising the laying of a pipeline due to transportgas from Balgzand in Holland to Bacton in GreatBritain.
In the North Sea, utilising the vessels Saipem 7000 andCastoro Sei, Saipem also started the installation ofstructures as part of the Buzzard Sealine project onbehalf of Nexen, in the British sector, comprising theconstruction of subsea structures for a twin pipelinesystem.
On behalf of A .I .O.C. (Azerbaijan InternationalOperating Company), activities involving theconstruction, transport and installation of variousstructures were completed as part of the developmentof the Azeri-Chirag-Gunashli field, comprising threeseparate contracts and involving the construction of sixjackets, three templates and piles in addition totransport and installation of five drilling templates, fourdrilling platforms and two production platforms.
In Kazakhstan, on behalf of Agip KCO, as part of theprogramme for the development of the Kashagan fieldin the Kazakh waters of the Caspian Sea, the followingactivities were carried out:- engineering and procurement activities were
completed whilst onshore laying operations havestarted as part of the Kashagan Trunkline andProduction Flowlines project. Simultaneously,engineering and procurement activities haveprogressed as well as the preparation of vessels foroffshore pipelaying operations. The contractcomprises engineering, procurement of materials,coating, laying and commissioning of pipelines,fibreoptic cables and umbilicals. The pipe is to besupplied by the client;
- engineering, procurement and preparation of vesselsand equipment are ongoing as part of the KashaganPiles and Flares project. The contract comprisesconstruction, assembly, transport and installation ofpiles and flares in addition to sixteen barges toaccommodate plant modules; the scope of works alsoincludes the procurement, fabrication and installationof associated mooring and protection structures.
On behalf of OXY Qatar (Occidental Petroleum Qatar),installation of one jacket, one topside, two bridges andone flareboom were completed as part of theSembawang PS-1K project off the coast of Qatar.
On behalf of Dolphin Energy Ltd, activities are ongoingas part of the EPIC Dolphin project in Qatar, comprisingengineering, procurement, transport and installation ofa gas export pipeline linking Ras Laffan to the onshoreterminal of Taweelah (UAE), all associated facilities atTaweelah and two subsea pipelines connecting theplatform wellheads to the onshore terminal at RasLaffan.
On behalf of Exxon Mobil Canada, procurement,fabrication of the jacket and installation engineeringactivities are underway; these pertain to the EPIC SableCompression Platform project in Canada, comprisingengineering, procurement, construction andinstallation of a compression platform and associatedfacil ities. The contract is being carried out inpartnership with Daewoo Shipbuilding and MarineEngineering.

S A I P E M F I N A N C I A L R E P O RT / D I R E C TO R S ’ R E P O R T
23
Offshore Construction fleet at 31st December 2005
Saipem 7000 Semi-submersible Pipelay and D.P. Derrick vessel capable of lifting structures of up to 14,000 tonsand of “J-laying” pipelines at depths of up to 3,000 metres.
Saibos FDS Multi-purpose mono-hull dynamically positioned crane and pipelay (J-lay) vessel utilised for thedevelopment of deepwater fields at depths of up to 2,100 metres, capable of launching 22”diameter pipe in “J-lay” configuration and lifting structures of up to 600 tons.
Castoro Sei Semi-submersible pipelay vessel capable of laying large diameter pipe at depths of up to 1,000metres.
Castoro Otto Mono-hull derrick pipelay ship capable of laying pipes of up to 60” diameter and lifting structuresof up to 2,200 tons.
Saipem 3000 Mono-hull, self-propelled D.P. derrick crane ship, capable of laying flexible pipes and umbilicals indeep waters and lifting structures of up to 2,200 tons.
Bar Protector Dynamically positioned dive support vessel used for deep-water diving operations and works onplatforms.
Semac1 (Bar 420) Semi-submersible pipelay vessel capable of laying large diameter pipes in deep waters.Castoro II Derrick lay barge capable of laying pipe of up to 60” diameter and lifting structures of up to 1,000
tons.Castoro 10 Trench barge capable of burying pipes of up to 60” diameter and laying pipes in shallow waters.S355 Derrick lay barge capable of laying pipe up to 45” diameter and lifting structures of up to 600 tons.Crawler Derrick lay barge capable of laying pipe up to 60” diameter and lifting structures of up to 540 tons.Saibos 230 Work barge equipped with a mobile crane for piling, marine terminals and fixed platforms Castoro XI Heavy-duty cargo barge.Castoro 9 Cargo barge, for structures of up to 5,000 tons.S42 Cargo barge, for structures of up to 8,000 tons.S44 Launch cargo barge, for structures of up to 30,000 tons.S45 Launch cargo barge, for structures of up to 20,000 tons.S600 Launch cargo barge, for structures of up to 30,000 tons.SB 103 Lightweight cargo barge.

S A I P E M F I N A N C I A L R E P O RT / D I R E C TO R S ’ R E P O R T
24
Offshore Drilling
Year 2004 Year 2005
Metres drilled
- Abroad 130,420 113,786
Total 130,420 113,786
Wells drilled
- Abroad 59 67
Total 59 67
General overview
In 2005, the Group operated in the Offshore Drillingsector in West and North Africa, the Persian Gulf,Norway, Peru and India. Amongst the Group’s fleet, thefollowing vessels are of particular interest: Saipem10000, capable of working at depths of up to 3,000metres using its dynamic positioning system; Scarabeo7, a semi-submersible vessel capable of operating atdepths of up to 1,500 metres and Scarabeo 5, a fourthgeneration semi-submersible vessel, capable of workingat depths of over 1,800 metres and drilling to a depth of9,000 metres. Besides Saipem S.p.A., other Group
companies operating in this sector are: Saipem Nigeria,with headquarters in Lagos, presiding over the strategicarea of West Africa; Petrex SA, operating in SouthAmerica; Saudi Arabian Saipem Ltd., operating in thePersian Gulf; and Saipem (Portugal) Comércio MarítimoLda, which manages all drillships, apart from Scarabeo 5,managed directly by Saipem S.p.A. Also active in thissector is Sonsub Ltd, supporting operations byproviding its remotely operated vehicles (ROVs).
Market overview
The Offshore Drilling market is going through a phase of
S A I P E M F I N A N C I A L R E P O RT / D I R E C TO R S ’ R E P O R T
25
sustained growth. The strong rise in demand, spanningalmost all global markets in 2005, boosted utilisationrates and in some geographical areas demand could notbe fully met. The jack-up sector in particular was thefirst to reach full utilisation capacity, which then spreadto the other categories of drilling equipment. Severalcontractors have ordered the construction of new rigs.Day rates increased substantially due to the oilcompanies’ determination to adhere to pre-plannedexploration and development programmes, even atever increasing costs.All geographical markets experienced this positivetrend, with West Africa and Asia Pacific leading the field.Even the North Sea, an area that is considered “mature”,recorded sustained levels of operations, thanks to therenewed interest displayed by independent oilcompanies. Only in Latin America was the less buoyantmarket, as oil companies adopted a more cautiousapproach.
New contracts
The most significant contracts awarded during theperiod include:- on behalf of Burullus Gas Company, the two-year
extension of the lease for the semi-submersibleplatform Scarabeo 6 in Egypt;
- on behalf of Total Exploration and Production Angola,the two-year lease plus the option of a further twoyears of the deep-water drillship Saipem 10000.Drilling operations will be performed on the Rosafield, 200 km off the Angolan coast, at water depths ofapproximately 1,700 metres;
- on behalf of Gujarat State Petroleum Corporation Ltd,the eighteen-month extension of the lease for thejack-up Perro Negro 3 in India;
- on behalf of IEOC (International Egyptian OilCompany), the t wo -year lease of the semi-submersible platform Scarabeo 4 in Egypt;
- on behalf of BPZ Energy Inc, the eight-month lease ofa rig in Peru;
- on behalf of Eni Congo SA, the one-year contract formaintenance and workover services in Congo.
Capital expenditure
The most significant items of capital expenditure withinthe Offshore Drilling sector were:- works to the semi-submersible platform Scarabeo 4,
to enable it to execute a contract in Egypt on behalf ofIEOC;
- upgrade works to the jack-up Perro Negro 5 to enableit to carry out a project in Saudi Arabia on behalf ofSaudi Aramco;
- investments made on the fleet, to ensure compliancewith international regulations and to customisevessels to client-specific requirements.
Work performed
Activities in 2005 consisted of the drilling of 67 wells,totalling approximately 113,786 metres drilled.
The deep-water drillship Saipem 10000 completedoperations on behalf of Hunt Oil in Togo andsubsequently transferred to Nigeria, where it carried outdrilling operations on behalf of Total Upstream NigeriaLtd, and on the ABO field on behalf of NAE. In June, theship transferred to Angola, where, after carrying outpreparatory works, it started operations of behalf ofTotal Exploration & Production Angola, as part of a two-year contract.
The semi-submersible platform Scarabeo 3 performeddrilling operations off the Nigerian coast on behalf ofAddax, as part of an eighteen-month contract.
The semi-submersible platform Scarabeo 4, havingundergone preparatory works in view of a new contractin Cameroon, was transferred to Egypt where it startedoperations on behalf of IEOC, as part of a one-yearcontract, which in December was extended for a furthereighteen-month period.
The semi-submersible platform Scarabeo 5 continuedto carry out HP/HT (high pressure /high temperature)operations in Norwegian waters on behalf of Statoil, aspart of a three-year contract.
The semi-submersible platform Scarabeo 6 continueddrilling operations in Egypt as part of an eighteen-month contract on behalf of Burullus Gas Company,which in November was extended for a further twoyears.
The semi-submersible platform Scarabeo 7 continuedoperations on the Erha field in Nigeria, as part of athree-year contract on behalf of Exxon Mobil Nigeria.
The jack-up Perro Negro 2 continued drilling activitiesin the Persian Gulf on behalf of Saudi Aramco.
The jack-up Perro Negro 3 continued to perform

S A I P E M F I N A N C I A L R E P O RT / D I R E C TO R S ’ R E P O R T
26
drilling and workover operations on behalf of GSPC(Gujarat State Petroleum Company), as part of acontract due to end in June 2007.
The jack-up Perro Negro 4 continued to performworkover operations on behalf of Petrobel in the Gulf ofSuez, as part of a contract that is due to finish inNovember 2006. The jack-up has been undergoingrepair works since December, following an accident thatoccurred during operations.
The jack-up Perro Negro 5 was idle for the first sixmonths 2005, in order to undergo preparatory works toenable it to carry out a new three-year contract in SaudiArabia on behalf of Saudi Aramco, which started duringthe second half of the year.
The self-lift platform Shahid Rajaie, owned by NIDC(National Iranian Drilling Contractor) but managed bySaipem, continued drilling operations in Iranian waters
on behalf of Eni Iran B.V.
The package 5820 installation continued operations onbehalf of Compagnie des Pétroles Total sa, as part of aone-year contract, with two options for a further yeareach, in Libyan waters.
In Congo, workover and maintenance works continuedon the fixed platforms owned by Eni Congo S.A.
In Peru, two rigs were leased on behalf of Petrotech toperform 94 workover and pulling operations.
Utilisation of vessels
Utilisation of vessels was as follows:
Asset Day under contract
Semi-submersible platform Scarabeo 3 365
Semi-submersible platform Scarabeo 4 253 a
Semi-submersible platform Scarabeo 5 (*) 365
Semi-submersible platform Scarabeo 6 365
Semi-submersible platform Scarabeo 7 365
Drill-ship Saipem 10000 325 a
Jack-up Perro Negro 2 348 b
Jack-up Perro Negro 3 365
Jack-up Perro Negro 4 336 c
Jack-up Perro Negro 5 175 a
(*) Leased by Saipem S.p.A.
a = for the remaining days (to 365), the vessel underwent upgrading works in readiness for a new contract.b = for the remaining days (to 365), the vessel underwent class reinstatement works.c = for the remaining days (to 365), the vessel underwent repair works following an accident.

S A I P E M F I N A N C I A L R E P O RT / D I R E C TO R S ’ R E P O R T
27
Leased FPSO
General overview
Saipem’s strengthening of its design expertise in thefloating production sector and its ability to manageturnkey projects resulted in the award, during the year,of a large project to the Saipem Group standalone; thisis significant as it implies that Saipem can market itselfas a single contractor, without having to resort topartnerships. The fleet comprises FPSO Firenze and FPSO Mystras.All initiatives have being developed in joint venture withSingle Buoy Moorings. In addition to Saipem S.p.A.,companies operating in the Leased FPSO sector are:FPSO - Firenze Produção De Petróleo Lda., FPSO -Mystras Produção De Petróleo Lda. Furthermore, thefollowing companies provide support in respect ofengineering, procurement and project management:Moss Maritime, Saipem s.a., Saipem Energy InternationalS.p.A. Saipem Fpso S.p.A. and Saipem Luxembourg s.a.
Market overview
In 2005, the Leased FPSO market saw the award of alarge number of new contracts, which marks a recoveryfrom the weak volumes of 2004. The most significantaspect is the strong revival of operations in Braziliandeep waters, in particular the area of lease contracts,which although went through a difficult phase in recentyears, was brought to the foreground in terms ofcontract awards in 2005. Asia Pacific and West Africa,the two major global markets, have also recordedstrong trends. In the North Sea, renewed interest byindependent oil companies led to the award of the firstnew contract, after experiencing the total absence ofinstallations for a number of years.
New contracts
The most significant contracts won during the periodinclude:
- on behalf of Petrobras, the contract for the provision

S A I P E M F I N A N C I A L R E P O RT / D I R E C TO R S ’ R E P O R T
28
and management of an FPSO unit due to develop thesecond phase of the Golfinho field off the coast ofBrazil at water depths of 1,400 metres. The contractlease period is nine years and may be extended forthree further years with annual options. According tothe agreement, Saipem is to convert a tanker into anFPSO unit with a storage capacity of up to 1,600,000barrels and a production capacity of 100,000 barrels aday. The vessel shall start operations in early 2007,when the oil f ield will start production. 7% ofinvestment capital necessary for the conversion of thetanker into the FPSO unit and 85% of investmentsassociated with the operational management of thisproject will be made in Brazil. This is the first contractthat Saipem has won standalone in the Leased FPSOsector, a rapidly growing market;
- during Q4, Eni Exploration & Production exercised theoption of extending, for two years, the lease contractof the FPSO-Firenze concerning for operations in thesouthern part of the Adriatic Sea.
Capital expenditure
During the year, the following were purchased:- the tanker Margaux to be converted into an FPSO
unit, to be named Citade de Vitoria, which will
operate in Brazil on the Petrobras field Golfinho 2from early 2007 as part of the nine-year contract, withan option of a further 3 years on behalf of Petrobras;
- the tanker Magdaleine to be converted into an FPSOunit.
Work performed
FPSO - Firenze Produção De Petróleo Lda.The FPSO – Firenze suspended operations in the fourthquarter 2005 to undergo maintenance works; on 26th
December 2005 it resumed regular operations on theAquila 2 and 3 wells, in the southern part of the AdriaticSea (Italy).
FPSO - Mystras Produção De Petróleo Lda.The FPSO Mystras operated continuously throughoutthe year in Nigeria on the Okono/Okpoho fields, atdepths ranging from 60 to 130 metres.

S A I P E M F I N A N C I A L R E P O RT / D I R E C TO R S ’ R E P O R T
29
General overview
The Group’s strengths in the Onshore Constructionsector are its construction capabilities allied to itsengineering and project management competencies,which allow the Group to focus on challenging projectssuch as the laying of large diameter pipelines and theconstruction of upstream plants in diff icultenvironments.The regions in which the Group has a long-termpresence and operates consistently are the ArabianPeninsula, Nigeria, Russia and Algeria. The Group is also
still engaged in Kazakhstan, where it operates in jointventure with another international contractor.Moreover, the Group operates in Oman and France. Inaddition to the parent company (individually or inassociation with other international operators), thefollowing subsidiaries carry out onshore constructionactivities: Saipem s.a. and its direct subsidiaries SaipemContracting Algeria, Sofresid Engineering, SIPS andassociated companies Starstroi and Lipardiz Construçaode Estruturas Maritimas.Saipem Contracting Nigeria, Saudi Arabian Saipem andKatran-K also operate in this sector.
Onshore Construction
Year 2004 Year 2005
Pipeline laid (km)
- Abroad 465 1,005
Total km 465 1,005
Industrial plant (tons)
- Abroad 15,888 7,112
Total tons 15,888 7,112

S A I P E M F I N A N C I A L R E P O RT / D I R E C TO R S ’ R E P O R T
30
Market overview
The Onshore Construction sector is benefiting from thehigh global spending by the oil majors, often aimed atincreasing production in the “new energy provinces”,amongst which some remote areas of the Caspian Seaand the island of Sakhalin have been particularlyrelevant throughout 2005. Beside the oil majors,national oil companies are playing an ever increasinglystrategic role at global level.Upstream activities were buoyant not only in frontierareas but also in traditional oil production areas, such asNorth Africa, West Africa and the Middle East. TheMidstream sector experienced dynamism above all inthe Caspian Sea, with pipelines connecting Kazakhstanto China and other Asiatic regions, and the Black Sea.Other areas that proved important for the pipelayingsector in 2005 were West Africa and the island ofSakhalin, where Saipem continued the execution of avery important contract. The downstream sector is experiencing a positive phaseof the cycle, both in the refinery segment, where plantutilisation has increased at global level, and thepetrochemical segment.
New contracts
The most significant contracts awarded during the yearwere:- on behalf of Saudi Aramco, the EWG-1 contract in
Saudi Arabia, for the oil to gas conversion of the East-West pipeline which will service the industrial area ofYanbu. The project comprises operations to purge thepipeline of oil, and the construction, installation andcommissioning of new sections of pipeline andassociated infrastructure;
- on behalf of Sonatrach/Sonelgaz, the EPC projectBerrouaghia in Algeria for the construction of a gas-fired power station.
- on behalf of Nigerian Lng in Nigeria, the GTS 2/4 SlugCatcher project, comprising the construction of a slugcatcher and a pressure control unit, in addition toinspection and testing of the plant on Bonny Island.The contract was awarded in consortium with VallandInternational Nigeria Ltd.
Capital expenditure
Capital expenditure in the Onshore Construction sectorfocused mainly on the acquisition and upgrading ofplant and equipment necessary for the execution of the
Sakhalin II project in Russia and the purchase of a bargefor operations in the swampy regions of West Africa.
Work performed
Onshore Construction activities during the yearcomprised the laying of 1,005 km of pipe of variousdiameters and the installation of 7,112 tons ofequipment. The most important works are detailed below bygeographical area.
In Saudi Arabia, on behalf of Saudi Aramco:- construction activities have been completed for the
Rabigh project, which comprised engineering,procurement and construction of a pipeline;
- the engineering team was mobilised and preparatoryactivities started on the EWG-1 project, for the oil togas conversion of the East-West pipeline which willservice the industrial area of Yanbu. The projectcomprises operations to purge the pipeline of oil, andthe construction, installation and commissioning ofnew sections of pipeline and associatedinfrastructure.
Also in Saudi Arabia, on behalf of Jubail ChemicalIndustries, the Jana project is progressing. It comprisesengineering and project management activities for aplant.
In Oman, the EPC Mina Al Fahal project on behalf ofOman Refinery Company, is reaching completion. Itcomprises engineering, procurement, construction andcommissioning of a pipeline and associated facilities, inaddition to fibre optic cabling for the whole line. Thecontract was awarded in joint venture with CCC(Consolidated Contractors Company).
In Nigeria, on behalf of NAOC:- fabrication works have been completed at the Irri
Station and preparatory activities for the constructionof the flow station have started as part of the N-LNGPhase 3 Obiafu/Obrikon project. The scope of workscomprises the expansion of the existing gas plant andthe construction of a flow station;
- civil, mechanical and electro-instrumentation workshave been completed as well as the construction ofthe combined-cycle power generation plant as part ofthe Okpai Power Plant project; the plant is alreadyoperating and client support activities are currentlyongoing;
- testing and commissioning are progressing on theEPC-t ype GTS – 4 project, which comprised

S A I P E M F I N A N C I A L R E P O RT / D I R E C TO R S ’ R E P O R T
31
engineering, procurement and construction of apipeline linking Rumuji (30 km north-east of PortHarcourt) to the N-LNG terminal on Bonny island. Thepipeline crosses the Niger delta.
Also in Nigeria:- on behalf of Shell Petroleum Development Company
of Nigeria Ltd, engineering and procurement havebeen completed and the construction phase hasstarted on the Soku Debottlenecking project, whosescope of works comprises engineering, procurementand construction of a pipeline;
- on behalf of Nigerian Lng in Nigeria, the GTS 2/4 SlugCatcher project is progressing, comprising theconstruction of a slug catcher and a pressure controlunit, in addition to inspection and testing of the planton Bonny Island. The contract was awarded inconsortium with Valland International Nigeria Ltd.
In Algeria, as part of the OZ2 (Arzew Pump Stations)project on behalf of Sonatrach, in joint venture withAmec Spie Capag, and the ROD project on behalf ofSonatrach, pre-commissioning, commissioningoperations as well as client support activities have beencompleted.Also in Algeria, on behalf of Sonatrach/Sonelgaz, the EPC
project Berrouaghia for the construction of a gas-firedpower station is ongoing.
In Morocco, the Ammonia project on behalf of MarocPhosphore is progressing, which comprises theconstruction of two storage tanks.
In France, construction activities have begun as part ofthe OSBL project, on behalf of TotalFinaElf, comprisingengineering, procurement, construction andcommissioning of a refinery.
In Russia, installation activities for the Sakhalin IIproject on behalf of Sakhalin Energy Ltd are ongoing.The project comprises offshore and onshore pipelayoperations and installation of compression andpumping stations, in addition to a terminal.
Also in Russia, as part of the Blue Stream project onbehalf of Blue Stream Pipeline Company, the followingoperations have been completed: replacement of thejoints on high pressure lines, hydraulic tests, electricaland instrumentation works as well as civil andcompletion works at the Beregovaya compressionstation; the station competed commissioning and washanded over to the client.
Onshore Construction equipment at 31st December 2005
No.
Cranes from 10 to 150 tons 120
Backhoes 101
Sidebooms 167
Pay welders 63
Pay and wheeled loaders 39
Trenchers 2
Dozers – tracked loaders 52
Motor graders and compactor rollers 45
Rock drills 11
Various wheeled tractors 92
Pipe bending machinery 34
Cars – off road vehicles - trucks – buses 824
Trailers – semi-trailers – dollies 118
Pipe boring/pushing machines 3
Motorised and electric welding machines 1,167
Water pumps and air compressors 299
Power generators 304
Accommodation facilities (beds) (*) 4,600
(*) includes the camp in Kazakhstan

S A I P E M F I N A N C I A L R E P O RT / D I R E C TO R S ’ R E P O R T
32
General overview
In the Onshore Drilling sector, the Group operates inItaly, Algeria, Egypt, Nigeria, Saudi Arabia, Georgia,Kazakhstan, Peru and Venezuela through the parentcompany as well as Saipem Nigeria, Petrex S.A., SaudiArabian Saipem, Sadco (an Indian company jointlyowned and managed with the Indian company AbanDrilling Co.) and SaiPar (jointly owned and managedwith Parker Drilling Co. operating in Kazakhstan).
Market overview
In 2005, the Onshore Drilling sector continued toexpand, bearing out the strong annual growth rates ofprevious years. North Africa, Latin America and theMiddle East recorded the best trends. In particular,significant increases in drilling activities were recordedin Saudi Arabia, Egypt and Venezuela. The Asia Pacificmarket grew only moderately; the only geographicalarea experiencing a downturn was Europe, bearing outthe declining trend.
Onshore Drilling
Year 2004 Year 2005
Metres drilled
- Italy 8,851 4,671
- Abroad 446,562 543,282
Total mt 455,413 547,953
Wells drilled
- Italy 5 1
- Abroad 145 212
Total 150 213

S A I P E M F I N A N C I A L R E P O RT / D I R E C TO R S ’ R E P O R T
33
New contracts
The most significant contracts awarded to the Group ininclude:- on behalf of Pluspetrol, contractual extensions and
new contracts for the lease of 11 rigs in Peru forperiods ranging from two to three years;
- on behalf of KPO, the one-year lease of four rigs inKazakhstan;
- on behalf of Eni Exploration & Production, the one-year lease plus the option of a further year each, oftwo rigs in Italy;
- on behalf of Zhaikmunai LLP, the one-year lease of arig in Kazakhstan;
- on behalf of Repsol, the eighteen-month extensionfor the lease of a rig in Algeria;
- on behalf of Burren Petroleum, the one-year leaseplus the option of a further year, of a rig inTurkmenistan;
- on behalf of First Calgary, the one-year extension forthe lease of a rig in Algeria;
- on behalf of Burlington Resources, the one-year leaseof a rig in Algeria;
- on behalf of Sonatrach, the one-year lease of a rig inAlgeria;
- on behalf of PDVSA, the six-month lease plus theexercise of the option of a further six months for a rigin Venezuela;
- on behalf of Pluspetrol, the eight-month lease of a rigin Venezuela;
- on behalf of Repsol, the lease of two rigs, of two andfive months respectively, in Venezuela;
- on behalf of Ninotsminda Oil Company Georgia, thefour-month lease, plus the option of a further twomonths, of a rig in Georgia;
- on behalf of Repsol, the six-month lease of a rig inPeru;
- on behalf of Petrobras, the one-year lease of a rig inPeru.
Capital expenditure
Capital expenditure in the Onshore Drilling sectorrelated to upgrading and improvement works on rigsand installations, necessary to ensure continuousoperational efficiency.
Work performed
Activities in 2005 comprised the drilling of 213 wells,totalling approximately 547,953 metres drilled.
In Italy, onshore drilling operations were performed onbehalf of Eni Exploration & Production, utilising threedeep-reach drilling rigs. In particular:- one deep-reach drilling rig completed workover
operations in the Novara area and was subsequentlytransferred to another well in the same area;
- one deep-reach drilling rig has been operating in Vald’Agri;
- one medium/deep -reach dril l ing rig has beenoperating in the province of Cremona.
Eight rigs have been operating in Saudi Arabia as part ofa three-year contract with an option of an additionalyear on behalf of Saudi Aramco.
In Algeria, a medium-reach drilling rig completedoperations on behalf of Cepsa and subsequently startedoperating on behalf of First Calgary Petroleum as part ofa one-year contract; another medium-reach rigcontinued performing works on behalf of GroupementSonatrach-Agip. Two medium/deep-reach drilling rigshave respectively begun and continued operations aspart of one-year contracts on behalf of Gulf Keystoneand Repsol.
In Egypt, an innovative installation continued drillingoperations on behalf of Agiba, as part of an eighteen-month contract.
In South America, the following activities were carriedout:- a deep-reach drilling rig drilled five wells on behalf of
Pluspetrol in the area of Teniente Lopez (Peru);- a deep-reach drilling rig performed drilling of an
exploration well on behalf of Occidental in theSituche area (Peru);
- a drilling rig drilled three exploration wells on behalfof Pluspetrol in Block 8 (Peru) and subsequentlystarted drilling in the Tiznado&Barbacoas area(Venezuela) on behalf of the same client;
- a rig performed drilling operations on fifty wells onbehalf of Petrobras Peru in the Talara area (Peru);
- a drilling rig drilled an exploration well on behalf ofRepsol YPF in the Amazon Forest area (Peru);
- two rigs drilled twenty three exploration wells onbehalf of PDVSA in the Bare area (Venezuela);
- a rig drilled nine exploration wells on behalf of RepsolYPF in the Quiriquire area (Venezuela) and on behalfof Eni Dación BV in the Dación area (Venezuela);
- a rig drilled two exploration wells on behalf of RepsolYPF in the Barinas area (Venezuela);
- a newly developed hydraulic plant performed the

S A I P E M F I N A N C I A L R E P O RT / D I R E C TO R S ’ R E P O R T
34
drilling of twenty four wells on behalf of Eni DaciónB.V. in the area of Dación (Venezuela).
With regard to onshore workover and pullingoperations, the following activities were performed:- 67 pulling and workover operations were carried out
in the Trompetero area (Peru) on behalf of Pluspetrol;- a total of 81 pulling and workover operations were
carried out in the area of Teniente Lopez (Peru) onbehalf of Pluspetrol;
- 697 pulling and workover operations were carried outin the Talara area (Peru) on behalf of Petrobras Peru;
- 56 workover operations were carried out in the areaof Dación (Venezuela) on behalf of Eni Dación B.V.;
- 22 workover operations were carried out in the SanTome area (Venezuela) on behalf of PDVSA;
- one workover operation was carried out in the area ofMaturin (Venezuela) on behalf of Repsol YPF.
In Kazakhstan, workover operations continued onbehalf of Karachaganak Petroleum Operating (K.P.O.) inthe province of Uralsk. In 2005, two rigs were utilised:one chartered from the local company Kazburgas andone owned by the US company Parker. One medium/deep -reach rig completed dril l ingoperations on behalf of Emir Oil and was transferred tothe province of Uralsk where it started operations onbehalf of Zhaikmunai LLP as part of a one-year contract.A deep-reach rig completed operations on behalf ofKKM Operating Company and is currently transferring
to Turkmenistan where it will begin operations onbehalf of Burren Oil as part of a one-year contract.
Also, procurement and preparatory activities havebegun on the “D” Island project on behalf of Agip KCO,comprising drilling operations lasting approximatelyfive years in Block D of the Kashagan field, to be carriedout utilising two rigs owned by the client.
In Georgia, a medium/deep-reach rig started drillingoperations on behalf of Ninotsminda Oil CompanyGeorgia as part of a contract for the drilling of a well(estimated to take four months) plus the option of twofurther wells.
Utilisation of equipment
Onshore drilling activities resulted in an average rigutilisation of 90% (78% in 2004). The geographicalbreakdown is as follows: 12 rigs operated in Peru, 8 inSaudi Arabia, 7 in Venezuela, 3 in Italy, 5 in Algeria, 1 inEgypt, 2 in Kazakhstan and 1 in Georgia. Additionally, five third-party rigs have been operating inPeru and one third-party rig operated in joint venturewith SaiPar in Kazakhstan. Finally, 1 rig has been operated jointly with third partiesin Kazakhstan.

S A I P E M F I N A N C I A L R E P O RT / D I R E C TO R S ’ R E P O R T
35
General overview
Over the last few years, the Saipem Group hasstrengthened its presence in this sector. Operations aremostly carried out by Saipem s.a., which operatesthrough its controlled companies: Technigaz, worldleader in EPC projects, Guangdon Contractor, HaziraCryogenic Engineering and Construction Managementand Hazira Marine Engineering and ConstructionManagement; and through its associated companiesGTT (Gaz Transport et Technigaz), leader, with MossMaritime, in the LNG transport segment thanks toinnovative and highly-advanced technology, Societépour la realisation du Port de Tanger Méditerranée,Servicios De Construcciones Caucedo, Saimexicana andSaigut. Also operational in this sector are Saipem S.p.A.and Saipem America Inc.Operational activities are focused mainly in theMediterranean Sea, in addition to two particularlychallenging and demanding projects currentlyunderway in India and China.
Also, two new projects are starting in the United Statesand Mexico.
Market overview
The LNG sector grew strongly in 2005. Liquefactioncapacity increased by more than 10%, thanks to higherprofit levels on new projects, made possible by costreductions achieved through technological advances.Capacity increased during the year mainly in Qatar,Nigeria, Egypt and Trinidad; this eased demand, which atglobal level remains strong in the Pacific region. Qatar isemerging as one of the most important LNG producingcountries in the world – a real “capital” of LNG and GTL –whilst Nigeria is expected to continue leading thedevelopment in West Africa for the next few years.Capital expenditure in LNG tankers has resulted inexceptional increases in capacity during 2005, as it hadhappened in 2004, with more than 40 ships havingbeen handed over in the last two years, with a total
Liquefied Natural Gas (LNG)
S A I P E M F I N A N C I A L R E P O RT / D I R E C TO R S ’ R E P O R T
36
increase in capacity in the region of 30%.The regassification segment, whose capacity at globallevel is historically located mainly in Asia Pacific – Japanin particular – is growing; best prospects are expected,alongside the Asia Pacific region, in the Atlantic basinand North America in particular.
New contracts
The most significant contracts awarded to the Groupduring the period were:- on behalf of Freeport LNG Development L.P., the
Freeport project in the USA, comprising engineeringand procurement of tanks for an LNG regassificationterminal on the Quintana island in Texas; the projectis in association with Technip and Zachry;
- on behalf of BVT LNG, the Costa Azul project inMexico comprising the construction of infrastructurefor the mooring and dry-docking of tankers. Thecontract was awarded to a consortium formed bySaipem and the Mexican company Gutsa;
- on behalf of Travaux Public de Monaco, the MonacoPort project in the Principality of Monaco, entailingthe construction of various large structures to beused as foundations for the port’s waterworks. Thecontract was awarded to the consortium comprisingBouygues TP.
Capital expenditure
Investments in 2005 pertain to studies and patentsaimed at maintaining a competitive advantage as wellas identifying new technological solutions for theexecution of projects. Moreover, preparatory activitiesare underway on plant and equipment to enable themto carry out projects won during the year.
Work performed
In France, on behalf of Gaz de France, the constructionof storage tanks is progressing and the construction ofthe terminal has started as part of the Fos Cavaouproject, comprising engineering, procurement andconstruction of all facilities for a regassificationterminal, including three storage tanks and maritimeworks.
In Belgium, activities have continued on the Zeebruggeproject, comprising engineering, procurement andconstruction of facil ities for the extension of a
regassification terminal, including a storage tank andregassification structures.
In the Principalit y of Monaco, preparator y andengineering works were completed, whilst theinstallation phase has started for the Monaco Portproject entailing the construction of various largestructures to be installed in the port of Monaco.
In Spain, hand-over and testing activities respectivelyare ongoing on the following projects:- the Huelva project on behalf of Enagas, for the
construction and installation of two LNG storagetanks;
- the Cartagena project on behalf of Enagas comprisingthe construction and installation of an LNG storagetank.
In Italy, the Raffineria di Gela project is reachingcompletion on behalf of Raffineria di Gela SpA; thescope of this project comprises refinery maintenanceworks.
In Morocco, on behalf of ASTM (Agence Spéciale TangerMéditerranée), activities are ongoing on the TangerPort project, involving excavation and redevelopmentworks in the port of Tangiers. Works relating to phase 1of the project have almost reached completion andphase 2 has been started.
In India, the Hazira project on behalf of Shell GlobalSolutions for the engineering and construction of anLNG import terminal has been completed.
In China, on behalf of the joint venture CNOOC/BP andother Chinese partners, the construction of a re-gassification terminal has continued as part of theGuangdong project.
In the USA, operations relating to the Freeport projecthave got under way on behalf of Freeport LNGDevelopment L.P.; the project comprises engineeringand procurement of tanks for an LNG regassificationterminal on the Quintana island in Texas.
In Mexico, engineering and procurement activities havebeen completed, whilst installation has started on theCosta Azul project on behalf of BVT LNG, comprisingthe construction of infrastructure for the mooring anddry-docking of tankers.

S A I P E M F I N A N C I A L R E P O RT / D I R E C TO R S ’ R E P O R T
37
General overview
The Saipem Group has only recently started operatingin this sector, which completes the range of servicesoffered to oil companies. In this sector, Saipem s.a.currently provides services mainly in Western Europeand Russia, in petrochemical plants and refineries, andin West Africa in upstream oil infrastructure. Operationsare carried out through the companies Camom,Tecnoprojecto Internacional Projectos e RealizaçoesIndustriais and Petromar.Also operating in this sector is Energy MaintenanceServices S.p.A.; a company jointly owned and managedwith Eni Exploration & Production, which focuses onmaintenance activities for all Eni E&P’s industrial plantsin Italy.
Market overview
The best prospects for growth in this sector are in theupstream segment in overseas markets and in particularin the emerging oil districts, namely West Africa, theCaspian Sea and the Russian Far East, where extraction
of large quantities of oil and gas has createdinfrastructure requiring specialised maintenanceservices. However, traditional areas such as North Africaand the Middle East also have potential for growth,since national oil companies tend to increasingly resortto outsourcing their operations and maintenancerequirements. Within the downstream market, Europe is stable, withsome opportunities developing especially in Italy, whereEni looks likely to continue the outsourcing strategylaunched in recent years.
New contracts
The most important contracts awarded to the Groupduring the year include:- on behalf of Eni Congo S.A., the three-year contract
with an option of a further t wo years, for themaintenance of offshore platforms as well as onshorefacilities in Congo;
- on behalf of Eni Exploration & Production, themaintenance of upstream installations in Italy;
- on behalf of TotalFinaElf, the extension of contracts
Maintenance Modification and Operation (MMO)

S A I P E M F I N A N C I A L R E P O RT / D I R E C TO R S ’ R E P O R T
38
for maintenance activities in France.
Capital expenditure
Capital expenditure related to the purchase ofmachiner y and equipment required to carr y outoperational activities.
Work performed
In 2005, activities have progressed in Europe, inparticular in Italy in the oil & gas upstream sector on
behalf of Eni Exploration & Production and in France onbehalf of TotalFinaElf.In West Africa, major maintenance interventions havebeen carried out on behalf of TotalFinaElf Angola.In Russia and Kazakhstan, activities on behalf of CaspianPipeline Consortium are continuing and maintenanceactivities are also progressing on the Sakhalin project onbehalf of SEIC.

S A I P E M F I N A N C I A L R E P O RT / D I R E C TO R S ’ R E P O R T
39
Financial and economic results
As stated in the section “Basis of presentation”, theConsolidated Financial Statements at 31st December2005 were prepared by applying, for the first time, thenew International Financial Reporting Standards (IFRS).For ease of comparison, figures at 31st December 2004
have been restated under IFRS. Details of restatementscan be found under “Effects associated to theapplication of the IFRS”.
Revenues showed an increase of 5.2% versus 2004,mainly due to greater volumes generated in theOnshore Construction, Onshore Drilling and LNGsectors. Gross operating income amounted to 564 millioneuros, a 7% increase versus 2004. Profit levels increasedslightly (12.5% in 2005 versus 12.2% in 2004).Depreciation and amortisation of tangible andintangible assets amounted to 199 million euros, in linewith the previous year.
Operating income stood at 365 million euros, an 11.3%increase versus 2004, with profit levels amounting to8.1%, versus 7.6% the previous year.Net financial expenses increased by 12 million eurosversus 2004, due mainly to higher interest rates andgreater average debt.Income from investments amounted to 24 millioneuros, an increase of 5 million euros over the previousyear.Income before income taxes stood at 335 million
Saipem Group - Reclassified income statement (million €)Year 2004 Year 2005 Var. %
Revenues 4,306 4,528 5.2
Other revenues and income 10 11
Purchases, services and other costs (3,050) (3,156)
Payroll and related costs (739) (819)
Gross operating income 527 564 7.0
Amortisation, depreciation and impairments (199) (199)
Operating income 328 365 11.3
Financial expenses, net (42) (54)
Income from investments 19 24
Income before income taxes 305 335 9.8
Income taxes (67) (76)
Net income before minority interest 238 259 8.8
Minority interest (3) (4)
Net income 235 255 8.5
RESULTS OF OPERATIONS

S A I P E M F I N A N C I A L R E P O RT / D I R E C TO R S ’ R E P O R T
40
euros, a 9.8% increase versus 2004.Taxes amounted to 76 million euros, an increase of 9million euros versus the previous year, due to anincrease in taxable income and a tax rate rising from22% in 2004 to 23% in 2005.Net income reached 255 million euros, an increase of
8.5% versus 2004.
In 2005, the Saipem Group achieved operatingrevenues of 4,528 million euros, an increase of 222million euros versus the previous year.Production costs, which include direct costs of sales anddepreciation of vessels and equipment, amounted to3,914 million euros (3,706 million euros in 2004), anincrease of 5.6%, in line with the increase in operations.Idle/downtime costs fell by 24 million euros, mainly onaccount of the increased utilisation of the vessel Saipem7000.Selling expenses of 62 million euros show a 4 millioneuro decrease versus the previous year.
Research and development costs decreased by 2 millioneuros.Other operating expenses amounted to 3 million euros.Contribution from operations increased by 9.2%,reaching 485 million euros, with profit levels at 10.7%,versus 10.3% in 2004.General and administrative expenses amounted to 120million euros, an increase of 4 million euros versus2004, due mainly to consultancy expenses as well as theupdating of IT systems, made necessar y by theintroduction of new international financial reportingstandards.
Operating income and costs by destination (million €)Year 2004 Year 2005 Var. %
Operating revenues 4,306 4,528 5.2
Production costs (3,706) (3,914)
Idle/downtime costs (81) (57)
Selling expenses (66) (62)
Research and development costs (9) (7)
Other operating income (expenses) – (3)
Contribution from operations 444 485 9.2
General and administrative expenses (116) (120)
Operating income 328 365 11.3

S A I P E M F I N A N C I A L R E P O RT / D I R E C TO R S ’ R E P O R T
41
Analysis by business sector:
Offshore Construction
Operating revenues for 2005 amounted to 2,621million euros, a 3.2% decrease versus 2004. Thisdecrease was attributed to lower levels of activity inWest Africa, only partially offset by the recovery inoperations experienced in the North Sea.Selling expenses and cost of materials, amounting to2,242 million euros, decreased by 5.4% in line with thefall in volumes. Depreciation and amortisation decreased by 7 millioneuros versus 2004, following a reduction in
depreciation of project-specific equipment.Contribution from operations in 2005 amounted to 294million euros, equal to 11.2% of revenues, versus 244million euros, equal to 9% of revenues in 2004. Thisincrease in profit levels with respect to the previousyear is due to improved efficiency related to a numberof projects in their final stages of completion andgreater incidence of projects carried out in the NorthSea.
(million €)
Year 2004 Year 2005
Operating revenues 2,707 2,621
Selling expenses, net of cost of materials (1,878) (1,728)
Cost of materials (493) (514)
Depreciation and amortisation (92) (85)
Contribution from operations 244 294
Operating revenues for 2005 amounted to 302 millioneuros, a 4.5% increase versus 2004, due mainly to therenegotiation of the lease rate of the semi-submersibleplatform Scarabeo 6.Selling expenses increased by 5% versus 2004, in linewith the increase in volumes experienced during theyear. Depreciation and amortisation rose by 1 million eurosversus 2004.Contribution from operations in 2005 amounted to 65million euros, an increase of 4.8% when compared to
2004, whilst share of contribution on profit remainsalmost unchanged. Reduced utilisation of the drillshipSaipem 10000, which underwent upgrade works inpreparation for a new contract in Angola, has offset therise in profit levels arising from the almost full-scaleoperations in the second half 2005 of the semi-submersible platform Scarabeo 4 and the Jack-up PerroNegro 5, in addition to the renegotiation, in the last 2months of the year, of the lease rate for the semi-submersible platform Scarabeo 6.
(million €)
Year 2004 Year 2005
Operating revenues 289 302
Selling expenses (180) (189)
Depreciation and amortisation (47) (48)
Contribution from operations 62 65
Offshore Drilling

(million €)
Year 2004 Year 2005
Operating revenues 609 748
Selling expenses, net of cost of materials (387) (521)
Cost of materials (142) (145)
Depreciation and amortisation (21) (27)
Contribution from operations 59 55
S A I P E M F I N A N C I A L R E P O RT / D I R E C TO R S ’ R E P O R T
42
In 2005, operating revenues decreased by 20 millioneuros versus 2004. This fall in volumes and the 7 millioneuro reduction in contribution from operations whencompared to the previous year are mainly due to the
conclusion of the Prestige project, which was in fulloperation during 2004.
(million €)
Year 2004 Year 2005
Operating revenues 47 27
Selling expenses (26) (14)
Depreciation and amortisation (10) (9)
Contribution from operations 11 4
Leased FPSO
Operating revenues for 2005 recorded growth of 32.9%versus those for 2004, mainly attributable to increasedactivities in South America.
Contribution from operations increased by 7 millioneuros versus the previous year, due entirely to greatervolumes of operations.
(million €)
Year 2004 Year 2005
Operating revenues 158 210
Selling expenses (120) (163)
Depreciation and amortisation (17) (19)
Contribution from operations 21 28
Onshore Drilling
Operating revenues in 2005 amounted to 748 millioneuros, a 22.8% increase, versus 2004, due to higherlevels of activity on the Sakhalin project in Russia andthe full-scale operations of projects in Nigeria.The rise in volumes resulted in selling expensesincreasing by 34.6%, and cost of materials increasing by2.1%. Moreover, depreciation and amortisation grew by6 mill ion euros (28.6%) due to the increased
amortisation of equipment associated to ongoingprojects.
Contribution from operations in 2005 amounted to 55million euros, versus 59 million euros in 2004, withmargins declining from 9.7% to 7.4%. This fall in profitlevels is partially attributed to increased commercialcosts during the period.
Onshore Construction

S A I P E M F I N A N C I A L R E P O RT / D I R E C TO R S ’ R E P O R T
43
Operations carried out mainly in China, Morocco andBelgium allowed operating revenues to total 299million euros in 2005, a 43.8% increase versus theprevious year.
In 2005, contribution from operations amounted to 14million euros, or 4.7% of revenues (2004: 28 millioneuros, or 13.5% of revenues). This contraction in marginis mainly attributed to the significant increase in cost ofmaterials on projects under execution.
(million €)
Year 2004 Year 2005
Operating revenues 208 299
Selling expenses (178) (281)
Depreciation and amortisation (2) (4)
Contribution from operations 28 14
Liquefield Natural Gas (LNG)
Operational activities, carried out mainly in France, Italy,West Africa and Russia enabled operating revenues for2005 to reach 321 million euros, an 11.5% increaseversus 2004.
Contribution from operations in 2005 amounted to 25million euros, equal to 7.8% of revenues, versus 19million euros, equal to 6.6% of revenues in 2004, thanksto a recovery in efficiency on operations carried out inFrance and Russia.
(million €)
Year 2004 Year 2005
Operating revenues 288 321
Selling expenses (264) (294)
Depreciation and amortisation (5) (2)
Contribution from operations 19 25
Maintenance Modification and Operation (MMO)
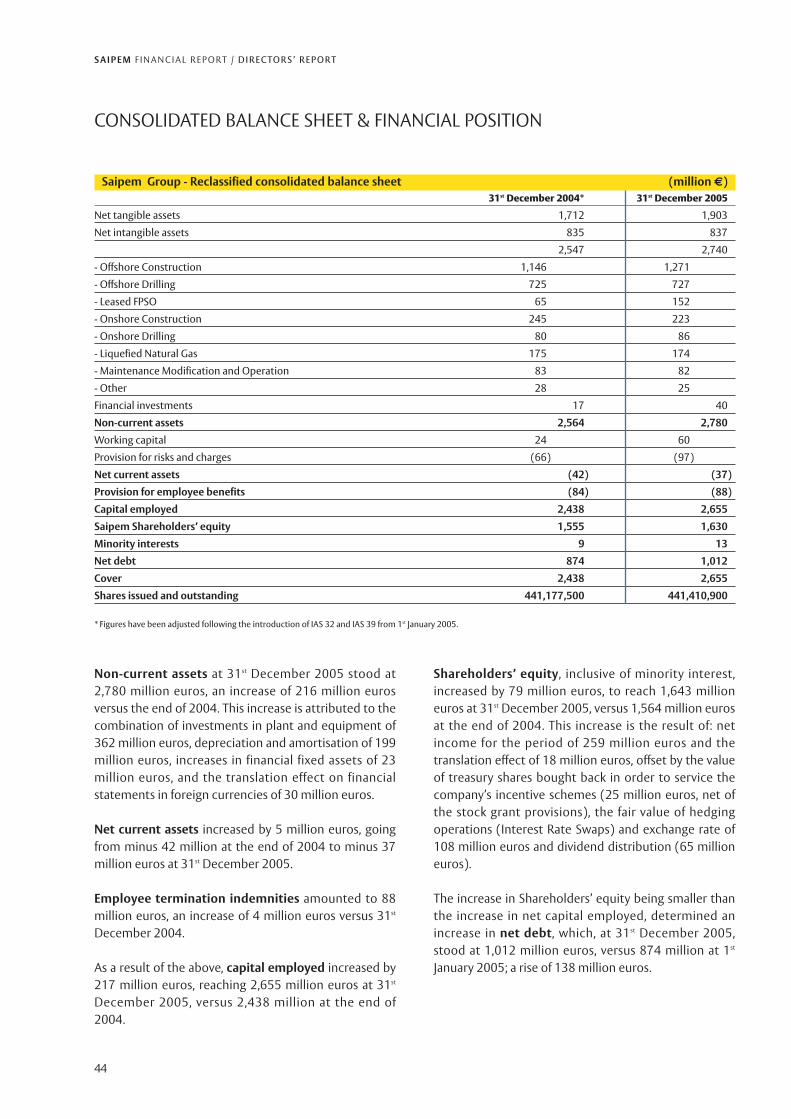
S A I P E M F I N A N C I A L R E P O RT / D I R E C TO R S ’ R E P O R T
44
Non-current assets at 31st December 2005 stood at2,780 million euros, an increase of 216 million eurosversus the end of 2004. This increase is attributed to thecombination of investments in plant and equipment of362 million euros, depreciation and amortisation of 199million euros, increases in financial fixed assets of 23million euros, and the translation effect on financialstatements in foreign currencies of 30 million euros.
Net current assets increased by 5 million euros, goingfrom minus 42 million at the end of 2004 to minus 37million euros at 31st December 2005.
Employee termination indemnities amounted to 88million euros, an increase of 4 million euros versus 31st
December 2004.
As a result of the above, capital employed increased by217 million euros, reaching 2,655 million euros at 31st
December 2005, versus 2,438 million at the end of2004.
Shareholders’ equity, inclusive of minority interest,increased by 79 million euros, to reach 1,643 millioneuros at 31st December 2005, versus 1,564 million eurosat the end of 2004. This increase is the result of: netincome for the period of 259 million euros and thetranslation effect of 18 million euros, offset by the valueof treasury shares bought back in order to service thecompany’s incentive schemes (25 million euros, net ofthe stock grant provisions), the fair value of hedgingoperations (Interest Rate Swaps) and exchange rate of108 million euros and dividend distribution (65 millioneuros).
The increase in Shareholders’ equity being smaller thanthe increase in net capital employed, determined anincrease in net debt, which, at 31st December 2005,stood at 1,012 million euros, versus 874 million at 1st
January 2005; a rise of 138 million euros.
CONSOLIDATED BALANCE SHEET & FINANCIAL POSITION
Saipem Group - Reclassified consolidated balance sheet (million €)31st December 2004* 31st December 2005
Net tangible assets 1,712 1,903
Net intangible assets 835 837
2,547 2,740
- Offshore Construction 1,146 1,271
- Offshore Drilling 725 727
- Leased FPSO 65 152
- Onshore Construction 245 223
- Onshore Drilling 80 86
- Liquefied Natural Gas 175 174
- Maintenance Modification and Operation 83 82
- Other 28 25
Financial investments 17 40
Non-current assets 2,564 2,780
Working capital 24 60
Provision for risks and charges (66) (97)
Net current assets (42) (37)
Provision for employee benefits (84) (88)
Capital employed 2,438 2,655
Saipem Shareholders’ equity 1,555 1,630
Minority interests 9 13
Net debt 874 1,012
Cover 2,438 2,655
Shares issued and outstanding 441,177,500 441,410,900
* Figures have been adjusted following the introduction of IAS 32 and IAS 39 from 1st January 2005.

S A I P E M F I N A N C I A L R E P O RT / D I R E C TO R S ’ R E P O R T
45
Breakdown of net financial debt (million €)31.12.2004 01.01.2005 31.12.2005
Payables to banks due after one year 282 282 299
Payables to other financial institutions due after one year 205 213 185
Net medium/long term financial debt 487 495 484
Accounts c/o bank, post and Eni Group finance companies (590) (590) (868)
Cash and cash equivalents (5) (5) (9)
Other receivables due within one year (5) (5) (17)
Payables to banks due within one year 101 101 125
Payables to other financial institutions due within one year 878 878 1,297
Net short term financial debt 379 379 528
Net financial debt 866 874 1,012
Liabilities associated to the fair value of derivatives are detailed under the Notes in item 6 “Other assets” and 16 “Other current liabilities”. Net financial debt includesliabilities relating to the fair value of IRS.
Saipem Group - Reclassified statement of cash flow and variation in net debt (million €)2004 2005
Group net income 235 255
Third party income 3 4
Adjustments to reconcile cash generated from operating income before changes in working capital:
Depreciation, amortisation and other non monetary items 187 204
Net gains (losses) on sales of assets (3) –
Dividends, interests, extraordinary income/expenses and income taxes 93 101
Cash generated from operating income before variation in working capital 515 564
Variation in working capital relating to operations (123) (178)
Dividends, interests, extraordinary income/expenses and income taxes received (paid) (22) (60)
Net cash flow provided by operating activities 370 326
Investments in tangible and intangible fixed assets (197) (355)
Investments in acquisitions of consolidated companies (12) (7)
Disposals 7 3
Other investments and disposals 4 –
Free cash flow 172 (33)
Net investments related to financing activities 4 (12)
Variation in financial debt (33) 408
Buy-back of treasury shares (10) (30)
Cash flow from share capital and reserves (65) (65)
Variations in scope of consolidation and exchange rate differentials on cash and equivalents (22) 14
Net Cash Flow 46 282
Free Cash Flow 172 (33)
Buy-back of treasury shares (10) (30)
Cash flow from share capital and reserves (65) (65)
Exchange rate differentials and other variation concerning net financial debt (10) (18)
Variation in net debt 87 (146)
A breakdown by currency of financial l iabilities,amounting to 1,906 million euros, is provided in note13 “Short-term financial liabilities” and note 17 “Long-
term financial liabilities and current portion of long-term debt”.

S A I P E M F I N A N C I A L R E P O RT / D I R E C TO R S ’ R E P O R T
46
Net cash flow from operations (326 million euros)partially financed net investments in tangible andintangible fixed assets and acquisition of companyinterests, generating a negative free cash flow of 33million euros.
Cash flow from share capital and reserves showed anegative balance of 65 million euros, as a result of thepayment of dividends; the buy-back of treasury sharesfor allocation to the stock grant and stock option plansgenerated a negative cash flow of 30 million euros, theeffect on net f inancial debt, deriving from thetranslation of financial statements in foreign currencies,and other variations amounted to -18 million eurosTherefore, net financial debt increased of 146 millioneuros.
In particular:Cash generated from operating income beforevariation in working capital (564 million euros)derives from:- net income of 259 million euros, inclusive of third
party income of 4 million euros; - depreciation and write-downs of tangible and
intangible fixed assets (+199 million euros), avariation in employee termination indemnities (+4million euros) and a variation in provisions for risksand charges (+25 million euros); conversely, netappreciations had a negative effect (-24 millioneuros);
- net financial expenses (+25 million euros); incometaxes (+76 million euros).
The increase in working capital related to operations(178 million euros) is attributed to greater volumesgenerated during the year.
Dividends, interest, extraordinary income/expenses andincome tax paid during the year (60 million euros)comprise payment of interests and financial expenses(13 million euros) and payment of tax (57 millioneuros).
Investments in tangible and intangible assets amountedto 362 million euros. Details of investments by sectorsare as follows: Offshore Construction (184 millioneuros), Leased FPSO (93 million euros), Offshore Drilling(46 million euros), Onshore Construction (14 millioneuros), Onshore Drilling (13 million euros), LNG andMMO (2 mill ion euros). Capital expenditure oninfrastructure, of both Head Office and Group premises,amounted to 8 million euros. Additional informationconcerning capital expenditure can be found in the‘Operating Review’ section at the beginning of thisreport.
Cash flow generated by disposals amounted to 3 millioneuros.

S A I P E M F I N A N C I A L R E P O RT / D I R E C TO R S ’ R E P O R T
47
In 2005, activities continued to focus on thedevelopment of distinctive solutions in the mosttechnologically-oriented market sectors, with particularemphasis on ‘frontier’ projects. Meanwhile, Saipem isstill pursuing projects aimed at optimising productionprocesses from its t wo main bases: Paris, whereresearch activities are focused towards projects withhigh engineering content aimed at meeting externalclients’ requirements; and Milan, which fulfils itscorporate role in addition to activities towards theinternal client.Projects carried out in the period involved a totalfinancial outlay amounting to 8 million euros, of which7 million were posted to the income statement and 1million was spent on prototypes and was posted to therelevant tangible fixed asset.Salient events occurring during the year involved thefollowing activities:
General activities
The Knowledge Management project focused on theevaluation of the new semantic search engine (to bealso used in Technology Monitoring), on the installationof a new version of the current engine with migration ofthe relevant data bank in addition to the definition ofKnow-How recovery activities through “communities ofpractice”.An “innovation forum” was held for the first time andwas attended by all Group departments dealing withtechnological development and innovation.Furthermore, the third edition of the Innovation Trophywas held, registering a strong level of participation.The Paris office lodged eight new patent applications(two on behalf of Sonsub Ltd.).
Technology involving assets,operations and integrated projects
Works are continuing on the prototype developmentphase of a conceptually innovative welding systembased on renewed hardware architecture.The construction and testing phases have started forthe optimisation of pipeline trenching and buryingtechniques as well as tie-in techniques in ultra-shallowwaters (a technological target of the Kashagan project).Tests have begun on the most critical solutions beforetheir application.The project focused on the review of S-laying processesis progressing with the aim of improving currentproduction output. Alongside the development oftechnological solutions for main sub -processes(welding, non-destructive tests and joint coating),which will be analysed in depth with a view toimplementation, this project aims at improving thewhole onboard production cycle for all vessels of thefleet.With regard to drilling, technical studies and supportactivities for operations and commercial tenders arecontinuing. Also, research is progressing on subsea supportactivities in challenging environments, utilising virtualreality and special sonar technology; moreover, anadvisory system for heavy lifting operations is underevaluation.
Technologies for oil fielddevelopment and LNG transport
The company continued to focus on advancing ultra-deep water technology aimed at improving deep waterfield development. Major projects include production
Research and development

S A I P E M F I N A N C I A L R E P O RT / D I R E C TO R S ’ R E P O R T
48
flowlines and associated thermal insulation technologyin addition to new riser systems. Particular emphasis isplaced on linking small oil fields to existing productionfacilities. Furthermore, research is progressing on thefeasibility of subsea installations in deep waters(exceeding 1,500 metres) for oil/water processseparation before pumping to the FPSO.Activities are also progressing on the development ofoffshore LNG systems, both in terms of production andterminal facilities. Two solutions are currently underconsideration: one relates to shallow water installationsand is based on concrete structures; the other targetsdeep waters and is based on an FSRU or LNG FPSO.Moreover, the company is currently pursuing thequalification of technological solutions related to thecryogenic field.
Saipem is also active in the sector of renewable energysources, with developments aimed at achieving costreductions for offshore wind farm installations, focusingspecifically on their support structures and installationmethods. Finally, studies are also ongoing to determinethe feasibility of harnessing wave energy and seacurrents.Saipem is also carrying out research studies in the fieldof CO2 management together with industrial andacademic partners.With regard to the technical feasibil it y of non-conventional energy sources, research centred on ultra-heavy and bituminous oils.

S A I P E M F I N A N C I A L R E P O RT / D I R E C TO R S ’ R E P O R T
49
Quality of service offered to the client, environmentalprotection in areas of operations, health and safety forall personnel and sustainable development of localcommunities are the main values of Saipem’s businessculture.
Quality assurance
In 2005, activities continued on client satisfactionmonitoring for major Clients; information was gatheredand evaluated.Important results were achieved regarding ISO9001:2000 certification, namely attainment of QAcompliance for five main group companies: Saibos SaS,Saudi Arabian Saipem Ltd, Saipem Contracting NigeriaLtd, ER SAI Caspian Contractor Llc and Global PetroProjects Services AG.In 2005, the following was achieved:- the consolidation of instruments and methods to
control and measure QA processes, and analysereference trends;
- the consolidation of instruments for design controland validation, aimed at sharing information onlessons learned in terms of engineering know-how;
- the implementation of web-based IT platforms ableto manage and store project documentation;
- the integration of the various document systems forall Group companies onto a single Knowledge Sharingplatform, called “Share Point”;
- first applications of suppliers and subcontractorsmonitoring systems with a view to segmenting andvetting suppliers and services;
- the conclusion of the test phase of the QA costmanagement project;
- an increase in the local content of QA personnel, inparticular in Nigeria, Azerbaijan, Croatia, Indonesia,Peru and Kazakhstan.
Health and safety
Alongside day-by-day activities aimed at prevention,safeguarding and promoting the health of its personnelaround the world, in 2005 Saipem had to face medicalemergencies in areas where it is currently operating.Multi-disciplinary teams were created to developcontrol and monitoring programmes, in cooperationwith local and international agencies, and set upemergency plans to manage and respond to epidemicoutbreaks.With regard to information and training provided toboth expatriates and local employees, leaflets weredistributed on the most frequent diseases encounteredin frontier areas and/or of major medical interest. Thisinitiative aims at raising the awareness of all employeeson the preventative measures to take in order to avoidconditions “common” to specific local communities.The Malaria Control programme is progressingsuccessfully. Analysis of new data enabled theimplementation of additional preventative measures,optimisation of medical programmes in areas at risk,decreasing the incidence of this disease and applyingthe mandatory treatment.In 2005, particular attention was paid to the fluvaccination, which was made available free of charge toall Saipem personnel and mandatory on offshorevessels.In March, Saipem took part in the Social Responsibilityseminar “European Market Place” in Brusselles andpresented the programme “Preventing the spread ofsexually transmitted diseases in the work place”.Also, the review of the Programme for the evaluation ofhealth risks at work was finalised and presented. Thissoftware will be used to identify biological, chemical,physical, ergonomic and psycho-social risks of the singleOperating Unit as well as the individual positions, of
Quality assurance, health & safety and the environment

S A I P E M F I N A N C I A L R E P O RT / D I R E C TO R S ’ R E P O R T
50
biological and environmental risks specific to certaingeographical areas.
Safety
Safety represents a distinguishing element in thecomplex oil & gas industry. The realisation of large-scaletransnational projects does not preclude the upkeep ofver y high safet y standards for the prevention ofaccidents at work. The workforce with the highestexposure to operational risks are locally employed staff,who must therefore be adequately trained before facingthe challenges posed by complex plant and equipmentand endangering their own safety and that of theircolleagues.Saipem dedicates substantial efforts and resources toinstilling concepts of accident prevention and training.Main initiatives include:- internal workshops organised with operational
personnel from the Drilling business unit; - the review of the HSE document system of Saipem
SpA and Group companies;- improvement of the SHOC reporting system in order
to promote proactivit y amongst personnel inassessing risks;
- monitoring in the workplace was further developedand disciplined;
- strong increase in safety training activities utilisinginternal resources, external consultants and trainingfacil ities to obtain certif ication for specificprofessional roles;
- safety audit activities on offshore vessels and atoperative yards;
- monitoring Saipem’s system compliance with theInternational Safety Management Code, throughperiodic assessments.
In 2005, efforts were intensified to obtain OHSAS(Occupation Health and Safety Assessment Series)18001 certification, in particular the work carried out bySaibos SaS.Despite the various initiatives undertaken in 2005,Saipem experienced serious accidents; the Group’smain target is still the non re-occurrence of saidaccidents through monitoring and improvement ofsafety standards.Conversely, minor accidents have decreased in number,which enabled the LTIFR to be as low as 1.21.
Environment
In 2005, Saipem intensified its commitment to
environment protection especially certain peculiaritiesrequired on projects in frontier areas, for whichparticular environmental studies and analyses werecommissioned.During the execution of the Sakhalin II Phase 2 project,modifications were made to offshore vessels in order tosuccessfully complete the works without anyenvironmental damage or significant disturbance toprotected species inhabiting the area, specifically thegrey whales.
On the Dolphin project, a marine biologist was broughtin to analyse and manage the possible environmentalimpact of operations on dugongs and turtles.With regard to environmental management systems,work was undertaken to maintain the ISO 14001:1996certification by PT Saipem Indonesia and EnergyMaintenance Services by means of audit inspections;positive results were recorded on the gap analysis fromSaipem Nigeria which aims at obtaining the samecertification.Several vessels operating in sensitive areas haveundergone the environmental audit programme.Further improvement in the management ofenvironmental data and resulting reporting wasachieved through the creation and roll-out of the newenvironmental web software, which simplifies theaccurate gathering of information and data fromoperative bases and projects.Saipem played an active part in the Eni oil -spil lemergency management system, both in terms ofemergency intervention and inter-company support aswell as in terms of information and training, taking partin seminars, conferences, workshops and trainingcourses on this specific subject.The Kashagan project, being carried out in a highlysensitive environment, required the construction ofnew offshore vessels designed specifically to operate inthe Caspian Sea.
Social responsibility
Saipem has been implementing a full sustainabilityprogramme: environmental protection, appropriateworking environment, management of local workers,entitlement to adequate remuneration, access toprofessional growth and training, contribution to localeconomy and social system; all these aspects arecarefully managed from the first phases of projects.In 2005, Saipem has f inalised activities on thesustainability approach in countries deemed critical bypublishing four case-studies on company’s operations in

S A I P E M F I N A N C I A L R E P O RT / D I R E C TO R S ’ R E P O R T
51
Kazakhstan, Peru, Nigeria and Azerbaijan. These reportswere largely circulated and particularly well received atlocal level.These positive results have encouraged work toprogress in this area and publication is due, in the firsthalf 2006, of two new case-studies on Angola and AsiaPacific; also, analysis and data gathering have started onspecific projects in Oman e Kazakhstan.Amongst activities carried out on local content, apartnership was sealed with the Don Bosco TrainingCenter in Nigeria, which enabled the training of 27young Nigerians in 2005, some of whom have beentaken on by Saipem.Furthermore, training sessions on sustainability wereprovided as part of the HSE training and internalinformation spread through the monthly newsletter.

S A I P E M F I N A N C I A L R E P O RT / D I R E C TO R S ’ R E P O R T
52
In 2005, Saipem’s HR policy focused on supporting thestrategic and operating development of its business atinternational level, through the optimisation of humanresources and ensuing costs, improving attraction andretention schemes for critical resources and ensuringthe growth of a motivating environment as well asproviding the conditions for the development ofprofessional skills required by the company’s business.This strategy, centred on the development of localresources, was implemented through recruitment andtraining programmes aimed at young resources both inKazakhstan and Nigeria.In Kazakhstan, in particular, a structured developmentplan for local resources was launched; this involves theadvancement and evolution of skills for young localengineers, through courses at the Engineering Faculty ofBologna University in addition to an intense operativeprogramme at Group companies; training of technicalpersonnel; investment in fast and intensive training forqualified and certified resources destined to workonboard Saipem’s vessels (officers and seamen);training and recruitment of personnel to be employedin project control activities.In Nigeria, a training and development plan was definedinvolving 60 resources selected based on their potentialand professional skills and 70 additional resourcescurrently being taken on.Compensation policies were linked to the company’sand Group’s results, thereby ensuring consistency andcoherence in terms of remuneration.Incentive schemes were implemented based on theperformance of the company and the individual; no.471,200 stock grants were allocated to 169 seniormanagers and no. 980,500 stock options were allocatedto managers responsible for Group results or holdingpositions of strategic interest.Application of methods and tools aimed at enhancingdistinguishing capabilities and identifying young talent
was extended at international level. Specific careerdevelopment programmes were launched in the UK,Croatia, France, India and Indonesia involving 54international resources.With regard to the new Professional Role system,professional skill evaluation and resources certificationprogrammes have been defined and implemented,resulting in the collation of more than 400 appraisals.Career paths for all professional areas deemed criticalby Saipem have been completed and for each area therelevant training courses are being drawn up.The new “E-Performance” module was implemented: itforms an integral part of the Group’s HR IT system andhas computerized the appraisal system. Finally, the first Key Performance Indicator was issued; itrepresents the culmination of the appraisal system andverifies the actual ability to reach strategic targets in HRmanagement and development as well as theeffectiveness and efficiency of ongoing initiatives.The recruitment of graduates, carried out with thesupport of Eni Corporate Universit y, has beenaccompanied by frequent and selective employerbranding initiatives towards major Italian Universities.During the second half of the year, recruitment focusedon skilled resources to support the growth in the FPSOsector and strengthen in-house offshore engineeringcompetencies.Human resources ethical and behavioural issues wereaddressed, in particular the principles contained in Law231/2001; the HR department contributed to theimplementation of the Managerial, organisational andcontrol model provided for by this law. To this effect, aweb-based training module was made available tosenior and middle managers with a certain level ofresponsibility, and a training and information campaignwas launched to make all employees aware of the basicelements of this law.Specific investment was channelled towards training
Human resources

S A I P E M F I N A N C I A L R E P O RT / D I R E C TO R S ’ R E P O R T
53
initiatives aimed at improving the health and safety ofemployees in Italy, at international sites and yards andonboard vessels; these included on the job training andpartnering.The overall workforce of the Saipem Group increased by1,680 employees versus 2004, mainly due to the start ofnew projects such as Kashagan in Kazakhstan andSakhalin in Russia.Italian personnel increased by 93 resources versus theprevious year, mainly due to the acquisition by EnergyMaintenance Services of 49 resources from Stogit in thesecond half 2005.With regard to the review of the Italian personnelqualitative mix, 114 graduates and 116 diploma-qualified personnel were taken on.
Saipem SpA (*) 3,432 3,303
Saipem sa (*) 8,135 8,145
Other Group companies (**) 10,108 11,907
Total 21,675 23,355
Offshore Construction 6,958 7,944
Offshore Drilling 1,042 1,055
Leased FPSO 94 118
Onshore Construction 7,531 7,526
Onshore Drilling 2,165 2,313
Liquefied Natural Gas 697 699
Maintenance Modification and Operation 1,613 1,711
Staff positions 1,575 1,989
Total 21,675 23,355
Italian personnel 2,443 2,536
French personnel 3,839 3,730
Other nationalities 15,393 17,089
Total 21,675 23,355
Italian personnel under open-ended contract 2,240 2,280
Italian personnel under fixed-term contract 203 256
Total 2,443 2,536
31st December 2004 31st December 2005
number of engineers 3,508 3,684
(*) includes personnel employed at joint venture companies for the proportion of the quota held.(**) includes all personnel of consolidated companies; for those companies consolidated using the proportional method, the personnel number included is equal to the
proportion of the consolidated quota.
Aver
age
Wor
kfor
cein
200
5
Aver
age
Wor
kfor
cein
200
4
Incidence of labour disputes in 2005 amounted to 4%,with a declining trend versus previous years.Lost cases in 2005 accounted for 2% of the total numberof active proceedings.
Sound practices of consolidated industrial relationsenabled Saipem to open and successfully complete thefollowing negotiations with national energy,engineering and maritime trade unions:

S A I P E M F I N A N C I A L R E P O RT / D I R E C TO R S ’ R E P O R T
54
- the renewal of the contract for maritime personnel,which formed the basis for a review of existingindemnities aimed at optimising the sector’sremuneration grid;
- the agreement for the drilling sector in Italy, whichenabled the reallocation of excess personnel resultingfrom the completion of operations by a rig;
- the Eni frame agreement for the 2004-2007“production bonus” to be allocated based onprofitability and productivity indicators for thevarious business sectors and Group companies;
- on 28/29th September 2005, an annual meeting ofCAE Eni (Comitato Aziendale Europeo) was held atSaipem s.a.; on that occasion a training programmewas launched in order to speed up integration withinthe Saipem Group.
In 2005, as a result of the increasingly complex andlarge-scale projects managed by Saipem, the corporateorganisation department focused its efforts on a reviewof the company’s organisational configuration in orderto ensure the efficient and profitable execution ofprojects and consequent client satisfaction. The workcentred on the redefinition of the company’smacrostructure and the role of corporate departmentsat Saipem SpA and Saipem sa. As part of this reorganisation, a new department namedRisk & Knowledge Management was set up at SaipemSpA; it aims to identify and manage risks as well aspromoting the development of the company’s bestpractices.At Group level, actions were taken to streamlineimplementation of change at peripheral offices andimprove the Group’s network structure. In particular,processes were analysed as well as costs in order toimprove efficiency, thanks also to the introduction ofstandards pertaining to authorisation matrix,organigrams and decision making powers.
In 2005, the project for the review of Professional RoleMapping system was completed to reflect the changesin business requirements; the various business units andsupport departments can now avail themselves of thisessential tool to manage HR planning and developmentprocesses and group competencies.Also during the year, all HR departments around theworld were identified with a view to improve, on onehand, effectiveness of coordination and control by theHR corporate department towards decentralised officesand efficiency of HR activities in peripheral offices onthe other.In 2005, initiatives for the continuous improvement ofthe IBIS IT system were implemented that aimed at theoptimisation of the system’s performance. Activitiescentred on the implementation of an organisationalmodel that would manage all IBIS continuousimprovement initiatives called “Change Network”,which shall perform knowledge management throughtraining initiatives and support at project start-up.With regard to internal communication, workprogressed on the expansion of Saipem’s intranet, withnew local sites having been linked to the corporatenetwork.Also, new applications went live which improved accessto several information and service sections.Editorial activities continued for the quarterly magazine“Orizzonti”; two special editions were published, whichcentred on the culture common to the whole Group.This was also the subject of the video entitled “A DayWith Us”, which showed a day’s work at several Saipemsites around the world in very different operational andgeographical environments. This video was presented atChristmas Lunches held in Milan and Paris.

S A I P E M F I N A N C I A L R E P O RT / D I R E C TO R S ’ R E P O R T
55
Information technology
In 2005, IT activities centred mainly on theconsolidation and roll-out of IBIS applications and thecompletion of the IT and communication systemsoverhaul, which enabled the implementation of newservices to support business development.During the year, main corporate applications wererolled out at group companies and new operationalsites. Specifically, the personnel management GHRSapplication was introduced at SIPS and in Kazakhstan,while the FLEXY application was implemented at theassociated companies Saipem America and SaipemFPSO. The integrated material procurement module MARIANwas implemented on two new projects “Tangguh” and“FPSO Cidade De Vitoria” and its integration withengineering applications was improved (“Soku”project).The project for the New Corporate System due toelectronically handle all project and assetdocumentation is reaching completion.In the Data Warehouse system, the most importantreports regarding Human Resources activities wereproduced and its roll-out is being implemented group-wide.Utilisation of the consolidation system SAP SEM-BCSand consolidated managerial models were extended toSaipem s.a. and its controlled companies. Moreover, theIFRS project started and the first phase was completed:it manages the implementation of the new
International Financial Reporting Standards in the SAPR/3 and SEM–BCS systems.With regard to our IT infrastructure, the newinternational network was completed during the yearcomprising 38 sites and new remote access facilitieswere provided to users, which allow connection to thecompany’s network over the internet. To ensure thesecurity of this type of access, highly reliable tokensystems are used. Electronic Mail is now posted on theinternet and is accessible through palmtops andsmartphones.Alongside the deployment of the new companynetwork at consolidated sites, new systems were testedand activated to enable connection to the intranet overthe internet.The introduction of quality of service (QOS) allowed forthe definition of net work-wide ser vice classes,prioritising voice/video, SAP and GHRS traffic, therebyimproving their performance on all live websites. All new servers were upgraded onto the Windows2000/2003 platform and the Storage Area Networkapplication system was developed to store data andimprove the performance of corporate applications.The project for the continuous improvement of safetypolicies and standards is ongoing and a pilot project isunder way to block e-mail spamming. The studyconcluded on the definition of the Disaster Recoverysolution for major critical applications like SAP R/3,GHRS and e-mail; implementation will begin in 2006.

S A I P E M F I N A N C I A L R E P O RT / D I R E C TO R S ’ R E P O R T
56
Corporate governance report
Corporate social responsibility
Saipem believes that the creation of value for itsShareholders, especially in the medium to long term,should be attained through fair practice towards all itsstakeholders, comprising, besides the Shareholders;employees, suppliers, clients, commercial and financialpartners as well as the communities the Group comesinto contact with.The Board of Directors deems it important to clearlydefine the values that Saipem recognises and accepts,to identify the responsibilities the company assumes
both internally and externally to ensure that all Groupactivities are carried out in compliance with the law, infairness, honesty, integrity, correctness and in goodfaith, respecting the legitimate interests ofShareholders, employees, suppliers, clients, commercialand financial partners as well as the communities ofthose countries in which Saipem operates.These values are stated in the Code of Practice, which allemployees are required to adhere to and whoseviolations are examined by the Board of Directors, uponnotification from the annual Report by the Guarantor ofthe Code of Practice.
Principle
All personnel working for Saipem, withoutdistinction and/or exceptions, arecommitted to observing and enforcing thefollowing principles, within their ownfunction and responsibilities.The belief of acting in Saipem’s interestcannot in any way justify the adoption ofpractices contravening these principles.
Business ethicsSaipem’s activities, anywhere in the world,are carried out in fairness, honesty and incompliance with the law.Specifically, Saipem applies the OECDguidelines for multinational companies.
StakeholdersSaipem is committed to respecting all thestakeholders with whom it interacts inbusiness, as it believes that they are animportant asset to the company.
Labour protection and equal opportunitiesSaipem respects the universally recognisedcore labour standards contained in theFundamental Conventions of ILO
(International Labour Organisation); itguarantees freedom to form a union and theright of collective bargaining; it repudiatesany form of forced or juvenile labour and/ordiscrimination. In addition, Saipem is anequal opportunity employer and guaranteesits employees equal treatment based onmerit.
Development of professional skillsSaipem values and promotes thedevelopment of skills and competencies ofeach employee in addition to team work, sothat energy and creativity of the individualcan realise its full potential.
DiversitySaipem’s business conduct is inspired by therespect it affords to cultures, religions,traditions, ethnic diversit y and thecommunities in which it operates, andstrives to preser ve their biological,environmental, social , cultural andeconomic identities.
Human rightsWorldwide, Saipem is committed tosupporting and respecting the principles
contained in the UN Universal Declarationof Human Rights.
CooperationSaipem is committed to promoting thequality of life and the social and economicdevelopment of the communities in whichthe Group operates.
Health and SafetySaipem ensures ever-improving health andsafety standards for its employees and thecommunities in all areas of the world whereit operates.
Environmental protectionSaipem is committed to protecting theenvironment and ecosystems involved in itsbusiness operations and strives to achievethe sustainabilit y goals set by theinternational conventions Italy endorses.

S A I P E M F I N A N C I A L R E P O RT / D I R E C TO R S ’ R E P O R T
57
Corporate governance
The Board of Directors of Saipem SpA, at their meetingof 9th November 2000, resolved to adopt the “SelfRegulatory Code of Listed Companies” (hereafter Code)and has updated its Corporate Governance to includethe amendments made to the Code in July 2002.In compliance with the guidelines and recentrecommendations issued by the Italian Stock Exchange,specifically the “annual Corporate Governance ReportGuidelines” of 12th February 2003, information onSaipem’s Corporate Governance system is providedhereafter.
Saipem’s structure
Saipem’s structure is based on the traditional modelwhere the Board of Directors is solely responsible for thecompany’s management, the Board of Statutory Auditorscarry out supervisory and control duties and the ExternalAuditors are responsible for auditing the accounts.The Board of Directors has vested the Managing Directorand the Chairman with the power to represent thecompany, pursuant to art. 21 of the company’s articles ofassociation.In compliance with the most widely internationallyadopted Governance principles, the Board of Directorshas set up internal corporate bodies, with consultativeand advisory functions.
The Board of Directors:responsibilities, powers andcomposition
The Board of Directors is the central body withinSaipem’s Corporate Governance system. Art. 20 ofArticles of Association states that the management ofthe Company is exclusively the responsibility of theBoard of Directors.Art. 2365 of the Italian Civil Code grants the Board thepower, normally granted to the ExtraordinaryShareholders’ Meeting, to resolve on motionsconcerning: - merger by incorporation of companies whose shares
or stakes are owned entirely by the Company,pursuant to art. 2505 of the Italian Civil Code;
- merger by incorporation of companies whose shares orstakes are at least 90% (ninety per cent) owned by theCompany, pursuant to art. 2505-bis of the Italian CivilCode;
- the proportional de-merger of companies whoseshares or stakes are entirely or at least 90% (ninety percent) owned by the Company, pursuant to art. 2506-ter of the Italian Civil Code;
- transfer of the Company’s Headquarters within Italy;- incorporation, transfer and closure of secondary
offices;- share capital decreases in case of Shareholder’s
withdrawals;- the issue of corporate bonds and other debentures,
barring the issue of bonds convertible into Company’sshares.
In addition to the powers granted by art. 2381 of theItalian Civil Code, the Board of Directors is responsiblefor reviewing and approving the company’s long-termstrategic plans; it resolves on the most significanteconomic and financial company operations, as well asthe most relevant Group industrial and financialoperations; it defines, based on indications provided bythe relevant Committee, guidelines for the internalcontrol system and ascertains the adequacy andmanagement of main business risks; it reviews andapproves the guidelines supporting the company andGroup structure ensuring they are adequate for thecompany’s business model; it evaluates the generalmanagement and performance of the company, payingparticular attention to situations of potential conflict ofinterests; it is promptly informed by the directors withexecutive powers regarding: activities within theirresponsibilities carried out during the year; majoroperations (having previously set down criteria for theiridentification); atypical and/or unusual operations oroperations with related parties. The Board of Directorsapproves all motions put forward for approval to theShareholders’ Meetings; vests Board Directors withparticular powers; appoints General Managers andgrants them powers; approves all operations involvingthe incorporation of directly owned companies andbranches, acquisitions, alienations, winding-up ofcompany holdings, transfer of companies, or branchesthereof, the purchase, sale or financial lease of land andbuildings in excess of 2,500,000 euros; appoints themembers of the Audit Committee, the CompensationCommittee and the Compliance Committee; approvesCorporate Governance procedures; approves thecompany’s stock grant and stock options plans;approves the remuneration of Directors vested withexecutive powers; approves the preliminary FinancialStatements, the budget, the Quarterly and Six-MonthlyReports, preliminary results; approves and enters intoagency agreements; approves all donations.Also are considered the exclusive competence of theBoard of Directors contracts for the purchase or sale or

S A I P E M F I N A N C I A L R E P O RT / D I R E C TO R S ’ R E P O R T
58
goods and/or services exceeding 1 billion euros andthose whose duration is over 20 years. The Board vested the Chairman with all ordinary andextraordinary powers to manage the Company, exceptfor the undelegable powers and those of the Boarditself, and granted the Managing Director the powers tomanage the company’s commercial and operationalactivities.The Board of Directors, comprising nine Directors, wasappointed by the Shareholders’ Meeting on 29th April2005 for three years, its mandate expiring at theShareholders’ Meeting called to approve the FinancialStatements at 31st December 2007. The appointment ofDirectors occurs pursuant to art. 19 of Articles ofAssociation, through voting from a list, so as to allowthe appointment of minority interest representatives.Lists are filed at the company’s registered headquartersat least 20 days prior to the Shareholders’ meeting (firstsummons) and are published in three nationalnewspapers. It is a matter of procedure for the votinglists to enclose a professional résumé for all candidates.Lists can be presented by Shareholders, who,individually or with others, hold voting sharesrepresenting at least 2% of the share capital. Directorsshall meet the honourability requirements prescribedby regulations, possess the professional expertise andexperience to carry out their mandate efficiently andeffectively and be able to dedicate sufficient time andresources to their offices. Pursuant to art. 1.3 of theCode, information regarding offices of Directors orAuditors held by members of the Board of listedcompanies, f inancial or insurance companies orcompanies of considerable size is provided below under“Offices held by Board Directors”.The Code recommends that public companies set up aCommittee for appointment proposals comprising amajority of non-executive directors, “specifically whenthe Board of Directors notices that Shareholders arefinding it diff icult to put for ward appointmentproposals”. This Committee has not been implementedsince, as previously stated, it is customary for lists toenclose a professional résumé for all candidates.The Board comprises the Chairman, Pietro Franco Tali,the Managing Director, Hugh James O’Donnell, and theDirectors Francesco Gatti, Roberto Jaquinto, JacquesYves Léost, Marco Mangiagalli, Pierantonio Nebuloni,Gesualdo Pianciamore and Ian Wybrew-Bond.The Board of Directors, pursuant to the provisions of theCode and the provisions of Law 262/2005, ascertainedthat the Directors comply with the independence andhonourability requirements. Specifically it identified asindependent four non-executive Directors (FrancescoGatti, Pierantonio Nebuloni, Gesualdo Pianciamore and
Ian Wybrew-Bond), based on information provided bythe interested parties. They are considered independentas they do not enjoy economic relations with thecompany, its controlled companies, its parent companyEni or Eni’s controlled companies of relevant proportionto influence their autonomy of judgement, they are notclose relatives of executive Directors, nor are theyemployed by the company, its controlled companies, itsparent company Eni or Eni’s controlled companies.Francesco Gatti, Pierantonio Nebuloni and GesualdoPianciamore featured on the l ist presented byinstitutional investors coordinated by ARCA SGR SpAThe company’s Articles of Association do not specifyhow often the Board should meet, although art. 21states it has to occur at least quarterly as follows: “TheDirectors inform the Board of Directors and the Boardof Statutory Auditors promptly or at least every quarteron company activities, major economic and financialtransactions involving the Company or its subsidiaries;in particular they report those operations in which theyhave an interest, on behalf of themselves or thirdparties, or those operations that are subject to theinfluence of the controlling party”.In 2005, the Board of Directors met on eight occasions;three meetings have been scheduled to take place inthe first half of 2006. The general public is informed ofthe dates of Board Meetings when periodicalstatements and reports, required by current legislation,are to be approved. The Board of Directors sets down the formalitiespertaining to the call ing of Board Meetings; inparticular, meetings are convened by the Chairman,who also prepares the agenda for the meeting, throughnotice sent by mail, fax or e-mail at least five days priorto the date of the meeting; in exceptionalcircumstances, notice is sent at least 24 hours prior tothe time of the meeting. The Articles of Associationallow for meetings to be held via video-conference link.Directors and Statutory Auditors are provided inadvance with documents pertaining to items to bediscussed and/or resolved on at the meeting.In 2005, 88% of Board Directors and 85% of independentDirectors on average attended Board Meetings.Director’s remuneration is approved by theShareholders’ Meeting; the remuneration of theChairman and the Managing Director is set by the Boardof Directors at the proposal of the CompensationCommittee, having previously conferred with theStatutory Auditors. Pursuant to Consob regulations, theDirectors’ Report in the Financial Statements, i.e. theNotes to the Financial Statements, contain thefollowing: (i) amounts paid to the Directors, StatutoryAuditors and General Managers; (ii) number of stock

S A I P E M F I N A N C I A L R E P O RT / D I R E C TO R S ’ R E P O R T
59
grants and stock options allocated to the Chairman andthe Managing Director as well as the General Managers;(iii) number of shares held by the Directors, StatutoryAuditors and General Managers of Saipem and itscontrolled companies.The Shareholders’ Meeting of 29th April 2005 set at25,000 euros the remuneration for each Director forevery year of office. Directors are also entitled to 1,000euros for attending each meeting of Statutory Boards,in addition to reimbursement of expenses incurred. TheDirectors do not receive additional compensation forserving on the committees.Based on the powers the Chairman and the ManagingDirector are vested with, the Board of Directors has settheir remuneration, comprising a fixed and a variablecomponent.The variable part of the Chairman’s and the ManagingDirector’s remuneration, as well as that of the topmanagement, is linked to the achievement of specificeconomic/operational objectives (profitabilit y,efficiency, strategic projects) and share objectives(share price). The variable part, in addition to apecuniary incentive, comprises Saipem stock grantsredeemable after three years from date of allocation.
Offices held by Board of Directors
Based on the information received, we list hereunderadditional directorships or auditor posts held bySaipem’s Board Directors in other listed companies,either in Italy or abroad, in financial companies, banks,insurance companies or companies of relevance (art.1.3 of the Code).
Roberto JaquintoBoard Director of Syndial SpA, Snam Rete Gas SpA
Marco MangiagalliChairman of the Board of Directors of Enifin SpA and EniCoordination Center sa.Board Director of Snamprogetti SpA, Oil InvestmentCorp. Ltd, Energy Asset Management Ltd, EniInternational Bank Ltd, Snam Rete Gas SpA, PolimeriEuropa SpA.
Gesualdo PianciamoreBoard Director of Sirefid SpA, Finanziaria FiduciariaMilano, ESG Compagnia di Riassicurazione Dublino,Assicurazioni Generali Amsterdam, Insurance CompanyAssicurativa La Estrella sa Madrid.
Pierantonio Nebuloni
Management Board Vice-chairman of Management &Capitali SpA.
Board Committees
In order to carry out its responsibilities more efficiently,the Board has set up two committees: the AuditCommittee, comprised exclusively of non-executiveindependent Board members, and the CompensationCommittee, comprising a majority of independentBoard members.The former comprises Francesco Gatti; PierantonioNebuloni and Gesualdo Pianciamore; the latter MarcoMangiagalli, Pierantonio Nebuloni and Francesco Gatti.
Audit Committee
The Audit Committee, in compliance with the Boardresolution of 9th November 2000, fulfils a preparatory,consultative and propositive role regarding the generalmanagement of the company. In compliance with theamendments made to the Code in July 2002, theCommittee approved the “Audit CommitteeRegulations” on 25th February 2003. In accordance withthe Regulations, the Chairman of the Board of Auditors,or an Auditor appointed by the Chairman takes part inthe Committee’s activities; meetings can be attendedby Saipem’s Chairman. The Internal Audit Manager(being the person in charge of the Internal ControlSystem, as per art. 9.4 of the Code, appointed at theaforementioned Board meeting) assists the AuditCommittee and carries out duties assigned as part ofhis/her role. The Internal Audit department, reporting tothe Chairman, is responsible for the following: (i) assessingthe conformity of accounting and non-accounting criteriaand principles, the efficiency of administrative proceduresand control systems; (ii) ensuring the implementation andupdating of the risk assessment, mapping and classificationsystems for auditing purposes.The Audit Committee’s responsibilities are: (i) assistingthe Board of Directors in the following areas: (a) settingguidelines for the internal control system; (b)periodically checking that it is adequate and operateseffectively; (c) ensuring that major risks facing thecompany are suitably identified and properly managed;(ii) evaluates together with the Administrative Directorand the external Auditors, the adequacy of accountingprinciples adopted and their consistency throughoutthe Financial Statements; (iii) assesses together with theexternal Auditors: (a) accounting principles considered‘critical ’ for the correct f inancial and economic

S A I P E M F I N A N C I A L R E P O RT / D I R E C TO R S ’ R E P O R T
60
representation of Saipem’s position; (b) alternativeaccounting standards provided for by the accountingprinciples and reviewed with the management, theconsequences of the application of said alternativestandards and related information in addition to themethods considered preferential by the externalauditors; (c) contents of ever y relevant writtenexchange between the external auditors and thecompany’s management; (d) issues relating to statutoryand consolidated financial statements of major GroupCompanies; (iv) evaluates the work programmeprepared by the Internal Audit Manager and receivesfrom the latter reports, al least quarterly, on opinionsissued by the auditors; (v) evaluates issues raisedthrough Internal Audit reports, communications fromthe Board of Auditors or individual Auditors, reportsand the management letter issued by the externalAuditors, the annual report issued by the Guarantor ofthe Internal Code of Practice, inquiries and studies bythird parties; (vi) assesses offers received from externalauditing firms for the award of the auditing contract,the work programmes put forward and works carriedout by the said auditing firms, also in terms of theirindependence; (vii) verifies independence of theexternal Auditors; (viii) evaluates requests advanced bydepartmental managers to utilise the auditing firmappointed to audit the financial statements for non-audit service and presents proposals to the Board ofDirectors.The Audit Committee convened three times during2005 and once in the period from 1st January to 22nd
March 2006. It examined the audit programmes issuedby the Internal Auditors; it examined and evaluatedinternal audit activities; met with the Director of thecompany’s Administrative Department, the Chairman ofthe Board of Statutory Auditors, the partners of theExternal Auditing firm to examine the main issuespertaining to the 2004 and 2005 Financial Statements;it monitored the development of the operating modelof the Internal Auditing Department; acknowledgedcompany activities relating to Law Decree 231/2001particularly those activities relating to compliance,training and the analysis of sensitive processes;acknowledged the company’s organisational structureand the power of attorney and proxy systems at thebasis of the Saipem Group decision making mechanism;monitored company activities related to theimplementation of accounting processes necessary toimplement the new International Financial ReportingStandards (IFRS).
Compensation Committee
The Compensation Committee is responsible forproposing to the Board of Directors incentive schemesfor the company’s top management, the annualremuneration of the Chairman and the ManagingDirector and reviewing the remuneration policy of theGroup top management.In 2005, the Compensation Committee convened onfour occasions and carried out the following: it reviewedthe 2005 Group performance and incentive schemes aswell as results of the 2004 schemes, in view of the stockgrant allocation to Group senior managers; it proposedthe remuneration of the Chairman and the ManagingDirector; it proposed the 2005 stock grant and stockoption allocations to managers holding positionsdirectly responsible for Group results or of strategicinterest to the Group, who have achieved their pre-settargets.
The Board of Statutory Auditors
The Board of Statutory Auditors, pursuant to art. 149 ofLaw Decree 58/1998, monitors: compliance to the Lawand the Articles of Association; that managementprinciples are correctly adhered to; the adequacy of thecompany organisational structure, the internal controlsystem and the administrative/accounting system, andthe reliability of the latter to clearly reflect the companyposition.The Board comprises three Statutory Auditors and twoalternate Auditors, appointed by the Shareholders on29th April 2005. The term of office for Statutory Auditorsis three years and will expire at the Shareholders’Meeting called to approve the Financial Statements at31st December 2007. The appointment of StatutoryAuditors occurs pursuant to art. 27 of Articles ofAssociation, through voting from a list, so as to allowthe appointment of minority interest representatives.The Auditors operate autonomously and independentlyfrom the Shareholders who appointed them (art. 14.1of the Code). It is procedural for the voting lists toenclose a professional résumé for all candidates. Listsare filed at the company’s registered headquarters atleast 20 days prior to the Shareholders’ meeting (firstsummons) and are published in three nationalnewspapers.The Board of Auditors comprises the Chairman PaoloAndrea Colombo, the Statutory Auditors Fabrizio Gardiand Fabio Venegoni and the alternate auditors GiulioGamba and Luca Giovanni Caretta. Art.27 of Articles of Association states that statutory

S A I P E M F I N A N C I A L R E P O RT / D I R E C TO R S ’ R E P O R T
61
auditors be in possession of the requisites as stated bythe current legislation, in particular Decree 162/2000;in compliance with the Decree, the Articles ofAssociation provide that the following fields arepertinent to the company’s activities: commercial law,business administration and management, theengineering and geology sectors. All Saipem’s StatutoryAuditors are members of the Register of CertifiedAuditors.Statutory Auditors are provided in advance withdocuments pertaining to items to be discussed and/orresolved on at Board meetings. Meetings of the Board of Statutory Auditors may beheld via video-conference link. The Shareholders’ Meeting of 29th April 2005 set at37,500 euros the annual remuneration of the Chairmanof Statutory Auditors and at 25,000 euros that of theAuditors. They are also entitled to 1,000 euros forattending each meeting of Statutory bodies, in additionto reimbursement of expenses incurred. In compliance with the law, Audit of accounts isentrusted to an external auditing company registered inthe Roll of Auditors, appointed by the Shareholders’meeting. The current auditing company isPricewaterhouseCoopers SpA, appointed by theShareholders’ meeting of 29th April 2004, whosemandate expires with the approval of the 2006 Financial
Statements.Pursuant to art. 27 of Articles of Association, candidatesalready holding the office of statutory auditors at fivelisted companies may not be appointed as auditors.
Saipem’s Shareholders
At 31st December 2005, the share capital of Saipem SpAamounted to 441,410,900 euros; it is fully paid up andcomprises no. 441,232,731 ordinary shares of thenominal value of 1 euro each and no. 178,169 savingsshares of the nominal value of 1 euro each. Sharescannot be divided and each share carries theentitlement to one vote. Saipem’s Shareholders enjoy,and are limited by, all relevant rights afforded by law.Savings shares are convertible at par with ordinaryshares; they enjoy a higher dividend than ordinaryshares equal to 3% of the share nominal value. TheSavings Shareholders’ meeting appointed Mr GianlucaOfficio as their collective representative.Based on information available and received, andpursuant to Consob resolution 11971/99, at 31st
December 2005 the Shareholders owning a stake inSaipem SpA in excess of 2% are:
Shareholders Number of shares % of capital
Eni SpA 189,423,307 42.93
Artisan Partners Ltd Partnership 12,278,944 2.78
Threadneedle Asset Management Ltd 9,028,861 2.04

S A I P E M F I N A N C I A L R E P O RT / D I R E C TO R S ’ R E P O R T
62
Based on information received from the banksresponsible for dividend payments in 2004, the
Shareholders’ breakdown by geographical area and sizeof holding is as follows:
Shareholders’ meetings
The Shareholders’ meeting represents the institutionalmeeting point of the company’s management and itsShareholders. At these meetings, Shareholders may askquestions on items on the agenda or on the company’smanagement at large. The information provided shallcomply with the provisions applicable to insideinformation.Ordinary Shareholders’ meetings are regulated by art.2364 of the Italian Civil Code, extraordinar yShareholders’ meetings by art. 2365. Notices of Shareholders’ meeting are published invarious national Italian newspapers, in order to promoteShareholders attendance. The Shareholders’ meeting of30th January 2001 approved the Shareholders’ meetingsregulations (available on Saipem’s website) to ensuresmooth and effective meetings proceedings and,specifically, to safeguard every Shareholders’ right tointervene on items under discussion.
Operations with Related Parties
Saipem, with regard to Art. 11 of the Self-RegulatoryCode, drafted a procedure named “Code of PracticeRegulating Operations with Related Parties”, which wasapproved by the Board of Directors on 7th July 2003. Thisprocedure identifies the related parties and details alloperations carried out amongst them; it lists criteria ofapplication, operations that require prior consent bythe Board of Directors and those that are to be notifiedto the Board of Statutory Auditors as well as the Boardof Directors.
Investor relations and data protection
Saipem has adopted a policy of information supportinga constant dialogue with the institutional investors, theShareholders and the market in order to guarantee thetimely disclosure of comprehensive information oncompany activities, and is l imited only by theconfidentiality requirements afforded to certaininformation. Information to investors, the market andthe press takes place through press releases, periodical
Shareholders breakdown by geographical area based on 2004 dividend payments
Shareholders No. of Shareholders No. of shares % of capital
Italy 16,703 (*) 290,261,455 65.75
Other EU countries 301 67,076,821 15.20
Americas 285 43,419,954 9.84
UK & Ireland 220 19,402,286 4.40
Other European countries 74 2,710,543 0.61
Rest of the world 116 18,539,841 4.20
Total 17,699 441,410,900 100
(*) Includes treasury shares with no dividend entitlement
Shareholders breakdown by size of holding
Shareholders No. of Shareholders No. of shares % of capital
> 10% 1 189,423,307 42.93
> 2% 2 21,307,805 4082
1% – 2% 5 32,468,088 7.35
0.5% – 1% 14 36,875,234 8.35
0.3% – 0.5% 17 28,647,249 6.49
0.1% – 0.3% 60 43,012,073 9.74
≤0.1% 17,600 89,677,144 20.32
Total 17,699 441,410,900 100

S A I P E M F I N A N C I A L R E P O RT / D I R E C TO R S ’ R E P O R T
63
meetings with institutional investors, the financialcommunit y and the press, in addition to thecomprehensive information made available andconstantly updated on the company website. Relations with investors and financial analysts are heldby the Head of the Investor Relations Department.Information of interest to them is made available onSaipem’s website or can be requested via email at:[email protected] with Shareholders are held by the Head of theSecretar y’s Office. Information of interest toShareholders is made available on Saipem’s website orcan be requested via email at:[email protected] pertaining to the periodical financialreports, relevant operations and newly-issued corporategovernance procedures, are communicatedimmediately to the public also via publication on thewebsite, where all press releases and Shareholders’notices are also posted.Saipem’s commitment to provide investors and marketswith financial information that is true, comprehensive,transparent, timely and non-selective is stated in theCode of Practice, which identifies the values it applies inits business operations and the relations with thirdparties: namely, disclosure of complete and clearinformation, the formal and essential legitimacy ofpractices by its employees at all levels, clarity andveracity of its accounting practices in compliance withcurrent legislation and internal procedures.On 12 th December 2002, the Board of Directorsapproved the “Procedure regulating Market notificationof documents and information pertaining to activitiesof the company and its controlled companies”. Thisprocedure implemented guidelines contained in the“Guide on Information to the Market” issued by “Forumref” in June 2002, and defined the requirements to beapplied to the disclosure of information to the market(materialit y, clarit y, homogeneit y, symmetr y,consistency and timeliness) and regulated the flow ofinformation from Group Companies necessary tocomply with the provisions of the Law.The Board of Directors will amend this procedure inlight of the modifications introduced by Law 62 dated18th April 2005, which supersedes Law 58/98, andimplements the 2004 EC directive on market abuse aswell as the modifications made by Consob to theregulations on disclosure of insider information to themarket, as defined in art. 181 of Law 58/98.In compliance with the provisions of art. 115 of Law58/98 and art. 152 bis of the current regulations, theBoard of Directors shall also draw up a “List of personshaving access to inside information within Saipem”,
identify persons to feature on the list and define itsupkeep and update procedures.The Code of Practice also defines the dut y ofconfidentiality that employees are required to adhereto.
Law Decree 231/2001
On 22nd March 2004, the Board of Directors approvedthe Organisational, managerial and control model,pursuant to Law 231/2001 and established aCompliance Committee. The Model comprises acomprehensive set of procedures and control processesaimed at preventing the offences detailed in theaforementioned Law Decree, as well as Law Decrees61/2002 and 7/2003. The Chairman is responsible fordevising and implementing initial activities, updatingand upgrading the Model.A plan was defined detailing activities aimed atimproving the control system based on the results ofthe gap analysis and mapping all organisationalrequirements necessary to implement the Model. Theintroduction of this plan entails the following: (i)update/upgrade of company regulations; (ii) definitionof organizational actions consistent with the findings ofthe gap analysis; (iii) alignment of power allocation incompliance with the model; (iv) planning training ofpersonnel and promoting the knowledge of the model;(v) alignment of the company’s IT systems to guaranteeflow of information towards the Public Administration.In 2005 the Compliance Committee convened on nineoccasions and has: monitored the dissemination of thedocument “Principles of the Model” to all Saipem SpAemployees to ensure the adequate knowledge of theModel; it drew up guidelines and t wo corporatestandards that implement the control standards set byModel 231 and monitored the Web Based Trainingprogramme to key officers; it identified the ComplianceProgramme for the year and ensured that it wasimplemented alongside the scheduled and ad-hoccontrol activities; set up communication channels toand from the Compliance Committee.
Internal dealing
The Internal Dealing Code, approved by the Board ofDirectors on 12th December 2002 and effective from 1st
January 2003, contained the regulations governingmandatory disclosures and restrictions concerningoperations involving financial instruments issued by thecompany carried out, on their own behalf, by relevant

S A I P E M F I N A N C I A L R E P O RT / D I R E C TO R S ’ R E P O R T
64
persons. The Internal Dealing Code set at 35,000 euros the valueof operations carried out in any three month period,which if exceeded, had to be notified to the market byrelevant persons and at 175,000 euros the value ofoperations carried out in any three month period,which if exceeded, must be notified immediately.The Board of Directors is currently reviewing theadoption of a new procedure aimed at identifying
relevant persons and regulating the disclosure ofoperations carried out by relevant persons incompliance with art. 114, comma 7 of Law 58/98.Relevant persons will be identified in accordance withthe provisions of art. 152-sexies, c1, c2, c3, c4, of theIssuers Regulations.Formats and time-scales for the disclosure of operationscarried out by relevant persons to Consob and thepublic are set forth in art. 152-octies.
The following tables are taken from the document“Guidelines for the compilation of the Corporate
Governance Report” issued by Assonime and EmittentiTitoli SpA in March 2004.
Board of Audit Compensation Directors Committee Committee
Chairman
Tali Pietro Franco X 100 -
Managing Director
Hugh James O’Donnell X 100 -
Directors -
Gatti Francesco (*) X X 75 - X 100 X 100
Jaquinto Roberto X 88 -
Leost Jacques X 88 -
Mangiagalli Marco X 75 - X 50
Nebuloni Pierantonio(*) X X 83 - X 100 X 100
Pianciamore Gesualdo(*) X X 100 - X 50
Wybrew–Bond Ian X X 75 -
No. of meetings held in 2005 8 3 4
(*) Appointed from the list of minority Shareholders.
Mem
bers
exec
utiv
e
non
exec
utiv
e
inde
pend
ent
atte
ndan
ce %
no. o
f oth
er o
ffice
s
mem
ber
atte
ndan
ce %
mem
ber
atte
ndan
ce %

S A I P E M F I N A N C I A L R E P O RT / D I R E C TO R S ’ R E P O R T
65
The requirement to put forward voting lists is to holdvoting shares representing at least 2% of the share
capital at the Ordinary Shareholders’ Meeting.
Board of Statutory Auditors
Members Attendance % No. of other offices (*)
Chairman
Colombo Paolo Andrea 100 5
Statutory Auditors
Gardi Fabrizio 100 1
Venegoni Fabio (**) 100 1
Alternate Auditors
Caretta Luca Giovanni (**) – 1
Gamba Giulio – 1
No. of meetings held in 2005 13
(*) Number of Directorships or Auditor’s posts at other listed companies. (**) Appointed from the list of minority Shareholders.
Other provisions of the Self-Regulatory Code
Yes No
Powers and operations with related parties
The BoD has allocated the following powers:
a) Thresholds X
b) Exercise of powers X
c) Disclosure of information X
Has the BoD the power to review and approve the most significant economic and financial operation
(including operations with related parties)? X
Has the BoD defined guidelines and criteria that identify operations as “significant”? X
Have the aforementioned guidelines and criteria been detailed in the report? X
Has the BoD set appropriate procedures for the review and approval of operations with related parties? X
Have the aforementioned procedures for the approval of operations with related parties been detailed in the report? X
Procedures pertaining to the most recent appointment of Directors and Statutory Auditors
Have candidacies to the offices of Directors been filed at least ten days prior to their appointment? X
Did the candidacies to the offices of Directors contain sufficient information? X
Did the candidacies to the offices of Directors enclose a statement indicating the requirement of independence? X
Have candidacies to the offices of Statutory Auditors been filed at least ten days prior to their appointment? X
Did the candidacies to the offices of Statutory Auditors contain sufficient information? X
Shareholders’ Meetings
Has the company approved Shareholders’ Meeting’s Regulations? X
Are these Regulations enclosed in the Report (or information as to where they can be obtained/downloaded)? X
Internal Audit
Has the company appointed internal auditors? X
Do these internal auditors not report to managers of operational areas? X
Internal Audit Department (pursuant to art. 9.3 of the Code) Internal Audit
Investor relations
Has the company appointed an investor relations manager? X
Investor Relations Department: contact details (address/fax/email) of the Manager Investor Relations (*)
(*) Saipem SpA – Via Martiri di Cefalonia, 67 - San Donato Milanese (Milan) 20097 Italy - Tel. +39 02 520 34653 - Fax +39 02 520 54295

S A I P E M F I N A N C I A L R E P O RT / D I R E C TO R S ’ R E P O R T
66
Risk management
Main risks identified and managed by Saipem are thefollowing:(i) market risks deriving from the exposure to fluctuations
of interest rates, of exchange rates between the euroand the other currencies used by the company, aswell as the volatility of commodity prices;
(ii) the credit risk deriving from the possible default of acounterparty;
(iii) the liquidity risk deriving from the lack of financialresources to face short-term commitments;
(iv) the operation risk deriving from the occurrence ofaccidents, malfunctioning, failures with injury topersons and damage to the environment affectingoperating and financial results;
(v) country risk of operations.Market riskSaipem operates worldwide in business sectors that areexposed to market risks resulting from changes in interestrates, exchange rates and price of materials. The risk offluctuations in prices and financial flows is strictly linkedto the nature of this business and can only be partiallyoffset through appropriate risk management policies.The market risk also includes exchange and interest raterisks.Risk of price variations and financial flowsSaipem’s results are influenced by variations in oil prices,insurance premia and price of raw materials. Furthermore,Saipem’s financial flows are exposed to fluctuations ininterest and exchange rates.Exchange rate riskExchange rate risk derives from the fact that Saipem’soperations are conducted in non-euro areas, revenuesfrom operational contracts are denominated or linked tothe US dollar and by the time lag existing between therecognition of revenues and costs denominated incurrencies other than the functional currency and theactual time of the relevant monetary transaction(transaction exchange rate risk). Saipem’s strategy toreduce the market risk exposure arising from exchangerate fluctuations by utilising derivatives. Planning andmanagement for this activity is the responsibility of theTreasury Department, which closely monitors thecorrelation between derivatives and their underlyingflows as well as ensuring their correct accountingrepresentation in compliance with the internationalfinancial reporting standards.Interest rate riskThe risk exposure arising from interest rate fluctuationswithin the Saipem Group is associated mainly with long-term financing with variable rates. To reduce this risk,
Interest rate swaps (I.R.S.) are entered into, as they alsoensure a balanced relation between debt at fixed andvariable interest rates.Credit riskCredit risk represents Saipem’s exposure to incur a loss inthe event of non-performance by a counterparty. Thecredit risk arising from the Group’s normal commercialoperations is managed by the business units and theadministration department on the basis of Group-approved guidelines and periodic reporting. As forfinancial investments and the utilization of financialinstruments, including derivatives, companies adopt theguidelines issued by the Treasury Department of SaipemSpA. At present, Saipem has no significant concentrationsat credit risk.Liquidity riskLiquidity risk is the risk that suitable sources of funding forbusiness activities may not be sufficient to covercommitments. At present, through the management offlexible credit lines suitable with business requirements,Saipem believes it has access to sufficient funding and hasalso both committed and uncommitted borrowingfacilities to meet currently foreseeable borrowingrequirements.Operation risksSaipem’s activities present industrial and environmentalrisks and are therefore subject to extensive governmentregulations concerning environmental protection andindustrial security in most countries. Saipem adopted the most stringent standards for theevaluation and management of industrial andenvironmental risks, complying with the industry bestpractices. Business units evaluate through specificprocedures the related industrial and environmental risksin addition to taking into account the regulatoryrequirements of the countries where these activities arelocated. In 2005, Saipem has further strengthened itscommitment to HSE activities, the prevention ofenvironmental risks, health and safety.Country riskSubstantial portions of Saipem’s operations areperformed in countries outside the EU and NorthAmerica, certain of which may be politically oreconomically less stable. Saipem constantly monitors thepolitical, social and economic risk of the approximately100 countries where it invested or intends to invest.Country risks are mitigated by means of appropriateguidelines for risk management that Saipem defined in itsprocedure for “Project Risk Assessment andManagement”.

S A I P E M F I N A N C I A L R E P O RT / D I R E C TO R S ’ R E P O R T
67
Other information
Buy-back of treasury shares
The Shareholders’ Meeting of 29th April 2005 authorisedthe Board of Directors to buy back up to 2,000,000treasury shares on the open market, for a total amountnot exceeding 24,000,000 euros, to be allocated asfollows:- 1,200,000 to the 2005 stock option plan;- 800,000 to the 2004 stock grant plan.
From 1st January to 31st December 2005, the number oftreasury shares purchased amounted to 3,284,589.On 1st April, 1st July, 14th-19th-26th September, 14th
November and 2nd December 2005, no. 49,800 treasuryshares were transferred to grantees of the 2003 and2004 stock grant plan.On 5th April, 1st-4th July, 21st-22nd-23rd-26th-29th September2005, 774,500 stock options were allocated as part ofthe stock option plan approved in 2002; 2003 and2004.As of 24th March 2006, the company holds no. 6,063,401treasury shares.
Incentive schemes
Stock grantsOn 13th July 2005, the Board of Directors of Saipem SpAapproved the assignement of a maximum of 474,400treasury shares to the 2004 stock grant plan. Said stock,
to be bought back on the open market as per OrdinaryShareholders’ Meeting resolution of 29th April 2005,shall be granted free of charge to executive managerswho, in 2004, achieved the objectives set by thecompany, within 45 days after three years from the dateof offer.
Stock optionsIn order to implement the 2005 stock option plan, on27th July 2005, the Board of Directors of Saipem SpAapproved the assignement of no. 980,500 stock optionsat the price of 11.881 euros per share (i.e. the greaterprice between the shares official price average recordedby the Telematic Stock Market over the monthpreceding the date of the grant and the average cost oftreasur y shares held by the company on the daypreceding stock options assignement) to be allocatedto Saipem Group Executive Managers directlyresponsible for Group results or holding strategicpositions.Options can be exercised after three years from the dateof assignement and no later than 28th July 2013 forgrantees resident in Italy; grantees resident in France, incompliance with local regulations, will be able toexercise the stock after four years from date ofassignement and no later than 28th July 2012.Shares for assignement to the stock option and stockgrant plans will be bought back on the open market, asper Ordinary Shareholders’ Meeting resolution of 29th
April 2005.

S A I P E M F I N A N C I A L R E P O RT / D I R E C TO R S ’ R E P O R T
68
Events subsequent to year-end
Acquisition of Snamprogetti
On 24th February 2006, Saipem purchased 100% of theequity in Snamprogetti from Eni for 680 million euros.The contract was finalised and payment was made on27th March 2006.Snamprogetti is one of the leading engineering andconstruction companies, active in the internationalmarket for the design and execution of large scaleonshore plants for the production and treatment ofhydrocarbons and the monetization of natural gas.As a consequence of the transaction, Saipem will have aposition of primacy at the high end of the market forthe provision of Engineering, Procurement, ProjectManagement and Construction services for the Oil &Gas Industry, with a strong bias towards especiallychallenging activities in deepwater and remote areas;with significant technological competence such as gasmonetization and heavy oil exploitation. The newGroup will operate globally but with a strong localpresence in the most strategic regions of West Africa,Middle East, Central Asia, and South East Asia.The business portfolio of the new Group allows a superiorbalance between capital intensive (offshore) and lesscapital intensive (onshore) activities, along withincreased resilience thanks to the intrinsicallycomplementary nature of Upstream and Downstreambusiness cycles. The range and nature of the clients’profile of the new Group is broader and deeper, servingboth the largest international oil companies that are thetraditional clients of Saipem, and the national oilcompanies with whom Snamprogetti generally contracts.The integration of Saipem and Snamprogetti will beuniquely facil itated by the strong industrialrelationships developed on many common endeavours,by a natural affinity and culture deriving from commonroots within the Eni Group, and the sharing of the sameinformation systems.
The capabilities of the two companies are both highlycomplementar y and strongly synergistic: theamplification of the technological content andengineering & project management competence willfacil itate new business, while the group -wideexploitation of the ability to operate in the toughestenvironments will increase efficiency.
New contracts
In the first two months of 2006, additional contractswere awarded to the Saipem Group amounting toapproximately 600 million euros.The most important contracts awarded to the SaipemGroup include:
Offshore Construction- on behalf of Total Exploration & Production Angola
Ltd, the EPIC project Block 17 Gas Gathering System,in Angola, comprising engineering, procurement,construction, transport and installation of a subseapipeline, umbilical and associated facilities;
- on behalf of Maersk Olie OG Gas as, the contractHalfdan Northeast Phase 3, in Denmark, comprisingconstruction engineering, procurement,construction, testing and commissioning of twojackets, one deck and an interconnecting gangway;
- on behalf of Talisman Energy UK, the TweedsmuirSubsea project, in the British sector of the North Sea,comprising engineering, procurement, installationand commissioning of various subsea structures(spools, umbilicals, etc.);
- on behalf of Maersk Olie OG Gas as, the contractHalfdan Northeast Phase 3, in Denmark, comprising thetransport and installation of three new platforms in theHalfdan field, in the Danish sector of the North Sea.

S A I P E M F I N A N C I A L R E P O RT / D I R E C TO R S ’ R E P O R T
69
Onshore Construction- on behalf of Shell Petroleum Development Company
of Nigeria, the EPC project Gbaran, in Nigeriacomprising engineering, procurement and laying ofpipelines, flowlines and composite fibre optic andhigh voltage electrical cables connecting the Gbaranoil and gas production fields in Bayelsa State in Nigerdelta, with the central processing facility in the area.The contract was awarded to the consortiumcomprising Desicon Engineering Ltd;
- on behalf of NAOC, in Nigeria, the EPC project OB/OBrevamping, comprising engineering, procurement,break-up, disassembly, construction andcommissioning of existing and new facilities at theObiafu/Obrikom gas treatment plant. The contract
was awarded to the consortium comprising DesiconEngineering Ltd.
Offshore Drilling- on behalf of Addax Petroleum Exploration, the fifteen-
month extension of the lease contract for the semi-submersible platform Scarabeo 3 in Nigeria.
Onshore Drilling- on behalf of ENIREPSA, the lease of a rig in Saudi
Arabia, due to perform the drilling of four wells, plusthe option of a further two wells; the duration of thiscontract is estimated at approximately two years.

S A I P E M F I N A N C I A L R E P O RT / D I R E C TO R S ’ R E P O R T
70
The consistently high price of oil and gas and the needto replace oil reserves have resulted in increasedspending by the Oil Industry in recent years. Thispositive trend is expected to continue in 2006.The strong overall market performance and Saipem’strack record and competitiveness, especially oncomplex projects in frontier areas, underpinexpectations for 2006 to achieve further revenuegrowth, improving on the 2005 record results, as well asthe award of new contracts to maintain the high level ofbacklog.The acquisition of Snamprogetti enables Saipem to takea leading role in the rapidly growing sector for large-scale onshore turnkey projects.Snamprogetti’s revenues for 2006 are expected to beapproximately 2,800 million euros, whilst the award ofnew contracts is set to maintain the high backlog levelrecorded in 2005 (4,400 million euros).Saipem’s results, before Snamprogetti’s acquisition, areset to benefit not only from the strong marketperformance but also from the stabilization of theeuro/US dollar exchange rate. This, at present, supportsthe expectation that, in 2006, the Group can better therecord 2005 results by approximately 15%.Snamprogetti’s operating income before G&A isexpected to be approximately 90 million euros, and netincome approximately 30 million euros. Financialexpenses (nine months) associated with the acquisitionare forecast at 20 million euros and cost synergies to beachieved in 2006 are set to total 5 million euros. Saipemexpects that the acquisition of Snamprogetti can have apositive effect on the 2006 net income ofapproximately 18 million euros.Capital expenditure for 2006 is estimated atapproximately 580 million euros, and will include thecontinuation of work on the conversion of a tanker intoan FPSO unit due to operate in the Petrobras’ Golfinho 2field in Brazil ian waters (191 mill ion euros),
maintenance and upgrading of the existing asset base(134 million euros), capex to further strengthen theoperating bases/yards in Kazakhstan and West Africa (58million euros) and the construction of new vessels andequipment for specific projects (197 million euros).Depreciation and amortisation for 2006 is expected tototal around 240 million euros.Snamprogetti ’s capital expenditure for 2006 isestimated at approximately 20 million euros, mainly bythe associated company Haldor Topsøe, with similardepreciation and amortisation.
Forward-looking statements are based on a number ofassumptions and expectations that could ultimately proveinaccurate, as they are subject to risks and variablesoutside the company’s control. These include: currencyfluctuations, interest rate fluctuations, the level of capitalexpenditure in the oil and gas industry, as well as otherindustries, political instability in the Persian Gulf and/orother regions, and actions by the competition. Moreover,contract execution is also subject to variables outwith thecompany’s control, such as weather conditions. Actualresults could therefore differ materially from the forward-looking statements.
Management outlook for 2006
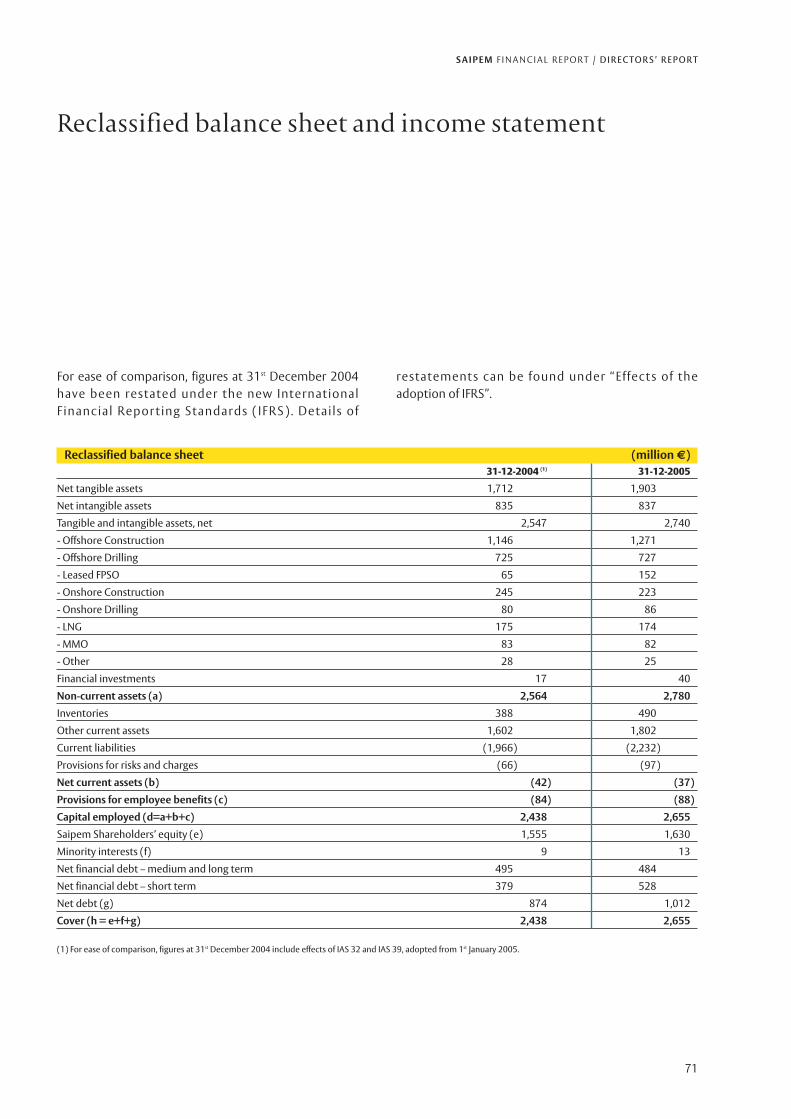
S A I P E M F I N A N C I A L R E P O RT / D I R E C TO R S ’ R E P O R T
71
For ease of comparison, figures at 31st December 2004have been restated under the new InternationalFinancial Reporting Standards (IFRS). Details of
restatements can be found under “Effects of theadoption of IFRS”.
Reclassified balance sheet (million €)31-12-2004 (1) 31-12-2005
Net tangible assets 1,712 1,903
Net intangible assets 835 837
Tangible and intangible assets, net 2,547 2,740
- Offshore Construction 1,146 1,271
- Offshore Drilling 725 727
- Leased FPSO 65 152
- Onshore Construction 245 223
- Onshore Drilling 80 86
- LNG 175 174
- MMO 83 82
- Other 28 25
Financial investments 17 40
Non-current assets (a) 2,564 2,780
Inventories 388 490
Other current assets 1,602 1,802
Current liabilities (1,966) (2,232)
Provisions for risks and charges (66) (97)
Net current assets (b) (42) (37)
Provisions for employee benefits (c) (84) (88)
Capital employed (d=a+b+c) 2,438 2,655
Saipem Shareholders’ equity (e) 1,555 1,630
Minority interests (f) 9 13
Net financial debt – medium and long term 495 484
Net financial debt – short term 379 528
Net debt (g) 874 1,012
Cover (h = e+f+g) 2,438 2,655
(1) For ease of comparison, figures at 31st December 2004 include effects of IAS 32 and IAS 39, adopted from 1st January 2005.
Reclassified balance sheet and income statement

S A I P E M F I N A N C I A L R E P O RT / D I R E C TO R S ’ R E P O R T
72
Reclassified income statement by nature of costs (million €)Year 2004 Year 2005
Operating revenues 4,306 4,528
Other income and revenues 10 11
Purchases, services and other costs (3,050) (3,156)
Payroll and related costs (739) (819)
Gross operating income (a) 527 564
Amortisation, depreciation and impairments (b) (199) (199)
Operating income (c=a-b) 328 365
Financial expenses, net (d) (42) (54)
Income from investments, net (e) 19 24
Income before income taxes (f=c-d+e) 305 335
Income taxes (g) (67) (76)
Income before minority interest (h=f-g) 238 259
Minority interest (i) (3) (4)
Net equity (l=h-i) 235 255
Reclassified income statement by destination of costs (million €)Year 2004 Year 2005
Operating revenues 4,306 4,528
Production costs (3,706) (3,914)
Idle costs (81) (57)
Selling expenses (66) (62)
Research and development expenses (9) (7)
Other operating income (expenses), net – (3)
Contribution from operations 444 485
General and administrative expenses (116) (120)
Operating income 328 365
Financial expenses, net (42) (54)
Income from investments, net 19 24
Income before income taxes 305 335
Income taxes (67) (76)
Income before minority interest 238 259
Minority interest (3) (4)
Net income 235 255

73
Saipem Group consolidated financial statementsat 31st December 2005

74
S A I P E M F I N A N C I A L R E P O RT / E F F E C T S O F T H E A D O P T I O N O F I F R S
Effects of the adoption of IFRS1
First application of the international financial reporting standards (IFRS)
Starting from 2005 companies with securities listed on a regulated stock market of a Member State of the EuropeanUnion are required to prepare their consolidated financial statements in accordance with the international accountingprinciples (IFRS) approved by the European Commission.At 1st January 2004, date of the first application of the new accounting principles, which corresponds with the firstperiod to be compared, Saipem must present a balance sheet which:- recognizes all and only the assets and liabilities accounted under the new accounting principles;- accounts the assets and liabilities as if the new accounting principles had always been applied (retrospective method);- reclassifies the items indicated under different principles instead of IFRS.The effect of the adjustments of the initial balance of assets and liabilities to the new accounting principles has beenaccounted with a corresponding entry to shareholders’ equity, taking into account the relevant fiscal effects recognizedas deferred tax liabilities or deferred tax assets.The International Accounting Principles are reported in the section “Basis of presentation”.
With regard to IAS 32 and IAS 39, pertaining to the evaluation and recognition of financial instruments includingderivatives hedging foreign currency risk, Saipem has adopted, as permitted by IFRS 1 “First introduction ofInternational Financial Reporting Standards”, to choose as transition date 1st January 2005 without restating thecomparative figures. Saipem has also opted , in compliance with IFRS 1, not to restate business combinations occurred before 1st January2004 and to set to zero the cumulated differences arising from the translation of financial statements in currenciesother than the euro of company shareholdings.
In compliance with the introduction of IFRS 1, the following are presented below: (i) the balance sheet at 31st
December 2003 restated under IFRS; (ii) the income statement as of December 2004 restated under IFRS; (iii) thebalance sheet at 31st December 2004 restated under IFRS; (iv) the reconciliations between Shareholders’ equity,inclusive of minority interest, at 31st December 2003 and 2004 reported under Italian GAAP and Shareholders’ equityunder IFRS; (v) the reconciliation between the Group’s net income as of December 2004 reported under Italian GAAPand net income under IFRS; (vi) the restatement of the cash flow statement at 31st December 2004.
1 Under the requirements of paragraph 5 of “Preface to International Financial Reporting Standards”, IFRS (International Financial Reporting Standards) represent theprinciples and the interpretations adopted by the International Accounting Standards Board (IASB), former International Accounting Standards Committee (IASC) andinclude: (i) International Financial Reporting Standards (IFRS); (ii) International Accounting Standards (IAS); (iii) the interpretations issued by International FinancialReporting Interpretation Committee (IFRIC) and by Standing Interpretation Committee (SIC) adopted by IASB. The name International Financial Reporting Standards(IFRS) has been adopted by IASB for the principles issued after May 2003.

75
S A I P E M F I N A N C I A L R E P O RT / E F F E C T S O F T H E A D O P T I O N O F I F R S
Reconciliations between IFRS and italian accounting principles
Balance sheet at 31st December 2003 and 2004
The tables below detail the restatement to IFRS of the various balance sheet captions at 31st December 2003 and 2004,determinated under Italian accounting principles (hereafter also referred to as Italian GAAP):
(million €) 31.12.2003 31.12.2004
ASSETSCURRENT ASSETSCash and cash equivalents 549 – 549 595 – 595Other financial assets for trading and available for sale 13 – 13 22 – 22Trade and other receivables 1,274 – 1,274 1,292 – 1,292Inventories 307 – 307 388 – 388Income tax receivables 43 – 43 102 – 102Other current assets 150 (1) 149 118 (3) 115Total current assets 2,336 (1) 2,335 2,517 (3) 2,514NON-CURRENT ASSETSProperty, plant and equipment 1,694 26 1,720 1,688 24 1,712Intangible assets 851 (23) 828 805 30 835Investments accounted for using the equity method 26 – 26 22 – 22Deferred tax assets 21 1 22 14 – 14Other non-current assets 37 – 37 40 – 40Total non-current assets 2,629 4 2,633 2,569 54 2,623TOTAL ASSETS 4,965 3 4,968 5,086 51 5,137LIABILITIES AND SHAREHOLDERS’ EQUITYCURRENT LIABILITIESCurrent financial liabilities 933 – 933 979 – 979Trade and other payables 1,838 – 1,838 1,836 – 1,836Tax liabilities 43 – 43 90 – 90Other current liabilities 31 – 31 36 – 36Total current liabilities 2,845 – 2,845 2,941 – 2,941NON-CURRENT LIABILITIESLong-term debt 578 – 578 487 – 487Provisions for risks and charges 83 (16) 67 73 (2) 71Provisions for employee benefits 65 13 78 79 5 84Deferred tax liabilities – – – 5 – 5Other non-current liabilities 3 – 3 4 – 4Total non-current liabilities 729 (3) 726 648 3 651TOTAL LIABILITIES 3,574 (3) 3,571 3,589 3 3,592SHAREHOLDERS’ EQUITYMinority interests 23 – 23 9 – 9Saipem Shareholders’ equity: 1,368 6 1,374 1,488 48 1,536-share capital 441 – 441 441 – 441-share premium reserve 62 – 62 62 – 62-other reserves 84 5 89 83 17 100-retained earnings (losses) 585 1 586 705 (7) 698-net income (loss) 196 – 196 197 38 235Total Shareholders’ equity 1,391 6 1,397 1,497 48 1,545TOTAL LIABILITIES AND SHAREHOLDERS’ EQUITY 4,965 3 4,968 5,086 51 5,137
IFRS
Effe
cts o
f IFR
Sad
opti
on
Prev
ious
ly u
sed
acco
unti
ngpr
inci
ples
IFRS
Effe
cts o
f IFR
Sad
opti
on
Prev
ious
ly u
sed
acco
unti
ngpr
inci
ples

S A I P E M F I N A N C I A L R E P O RT / E F F E C T S O F T H E A D O P T I O N O F I F R S
76
At 31st December 2004, the effects of IFRS adoption have resulted in a 48 million euros increase in Shareholders’ equity.
Reconciliation of Shareholders’ equity at 31st December 2003 and 2004
The following table details the reconciliation to IFRS of Shareholders’ equity at 31st December 2003 and 2004, inclusiveof minority interest, determinated under Italian GAAP:
(million €)
Ref. (*) 31.12.2003 31.12.2004
Shareholders’ equity under Italian GAAP 1,391 1,497
1 - Capitalisation of periodic maintenance 64 74
1 - Depreciation on periodic maintenance provision (38) (50)
1 - Write-off of periodic maintenance provision 16 2
2 - Research and Development costs that cannot be capitalised (1) (1)
3 - Losses on employees’ benefit plans (15) (11)
3 - Effect on taxation 1 –
3 - Evaluation of actualisation of employee termination indemnities – 1
4 - Impairment of Moss Maritime’s goodwill (22) (22)
4 - Reversal of goodwill amortization – 53
5 - Reclassified fair value of stock grant plans - future years (1) (3)
5 - Reclassified stock grant fund 2 5
Total effect of IFRS adoption: 6 48
Shareholders’ equity under IFRS 1,397 1,545
(*) The number refers to the caption in the section entitled “Nature of main adjustments”.
Income statement as of December 2004
The restatement of the various 2004 income statement captions under IFRS is as follows:
(million €) Year 2004
Revenues 4,306 – 4,306
Other revenues and income 10 – 10
Purchases, services and other costs (3,046) (4) (3,050)
Payroll and related costs (740) 1 (739)
Contribution from operations (a) 530 (3) 527
Amortization, depreciation and write-downs (b) (240) 41 (199)
Operating income (c=a-b) 290 38 328
Financial expenses, net (d) (42) – (42)
Income from investments, net (e) 19 – 19
Income before income taxes (f=c-d+e) 267 38 305
Income taxes (g) (67) – (67)
Income before minority interest (h=f-g) 200 38 238
Minority interest (i) (3) – (3)
Net income (l=h-i) 197 38 235
The effects of the introduction of the IFRS for the year 2004 have resulted in an increase in net income of 38 millioneuros.
IFRS
Effe
cts o
f IFR
Sad
opti
on
Prev
ious
ly u
sed
acco
unti
ngpr
inci
ples

S A I P E M F I N A N C I A L R E P O RT / E F F E C T S O F T H E A D O P T I O N O F I F R S
77
Reconciliation of the Group’s net income as of December 2004
The reconciliation of the Group’s net income as of December 2004 determinated under Italian GAAP to IFRS is asfollows:
(million €)
Ref. (*) Year 2004
Group’s net income under Italian GAAP 197
1 Reversal of periodic maintenance provision (14)
1 Write-off of periodic maintenance costs 10
1 Amortization of periodic maintenance (12)
3 Actuarial evaluations of employee termination indemnities (“TFR”) 1
4 Reversal of goodwill amortization 53
Total effect of IFRS adoption 38
Group’s net income under IFRS 235
(*) The number refers to the caption in the section entitled “Nature of main adjustments”.

S A I P E M F I N A N C I A L R E P O RT / E F F E C T S O F T H E A D O P T I O N O F I F R S
78
Reclassified cash flow statement at 31st December 2004
The following table details the restatement of the reclassified cash flow statement at 31st December 2004determinated under Italian accounting principles (hereafter Italian GAAP) to IFRS:
(million €) Year 2004Net income 200 38 238Depreciation and amortization 240 (41) 199Write-downs (appreciations) (17) – (17)Net change in provisions for risks and charges 2 – 2Net change in provisions for employee benefits 3 – 3Losses (gains) on disposals of assets (3) – (3)Interest income (8) – (8)Interest expense 24 – 24Unrealised (gains) losses on foreign currency exchange 10 – 10Current and deferred income taxes 67 – 67Cash generated from operating income before changes in working capital 518 (3) 515Changes:
Inventories (78) – (78)Trade and other receivables (95) – (95)Other assets 31 – 31Trade and other payables 6 – 6Other liabilities – 13 13
Cash flow from operations 382 10 392Dividends received 21 – 21Interest received 8 – 8Interest paid (20) – (20)Income taxes paid (31) – (31)Exchange rate differences gained on dividends – – –Net cash flow provided from operating activities 360 10 370Investments:
Intangible assets (11) – (11)Tangible assets (176) (10) (186)Consolidated company holdings (12) – (12)Financing receivables (1) – (1)
Cash flow from investments (200) (10) (210)Disposals:
Tangible assets 7 – 7Consolidated company holdings 4 – 4Financing receivables 5 – 5
Cash flow from disposals 16 – 16Net cash flow from investments (184) (10) (194)Proceeds from long term debt 2 – 2Repayment of long term debt (6) – (6)Increase (decrease) in short term debt (29) – (29)Capital contributions 16 – 16Capital payments by/to minority Shareholders’ (14) – (14)Dividends paid (65) – (65)Partial purchase of consolidated holdings (25) – (25)Net cash flow from financing (121) – (121)Buy-back of treasury shares (10) – (10)Effect of exchange rate gains and losses (3) – (3)Other changes 4 – 4Net cash flow for the year 46 – 46Cash and cash equivalent at the beginning of the year 549 – 549Cash and cash equivalent at the end of the year 595 – 595
IFRS
Effe
cts o
f IFR
Sad
opti
on
Prev
ious
ly u
sed
acco
unti
ngpr
inci
ples

79
Nature of main adjustments
The following is a description of the main changes introduced in the 2003 balance sheet, whose effects are reflected inthe 2004 income statement and balance sheet.
1) Different recognition criteria for provisions for risks and charges(ref. IAS 37 - Provisions, contingent liabilities and contingent assets; IAS 16 - Property, plant and equipment)
Under Italian GAAP, the provisions concern costs and charges of a determined nature, whose existence is certain orprobable, but whose amounts or occurrence are not determinable at the period-end. The provisions are stated on anundiscounted basis.Under IFRS, a provision is made only if there is a current obligation considered “probable” as a consequence of eventsoccurred before period-end deriving from legal or contractual obligations or from behaviors or announcements of thecompany that determine valid expectations in third parties (implicit obligations), provided that the amount of theliability can be reasonably determined. When the financial effect of time is significant and the date of the expense tosettle the relevant obligation can be reasonably determined, the estimated cost is discounted on the basis of the risk-free rate of interest and adjusted for the Company’s cost of borrowing.Under IFRS costs related to periodic maintenance, since they do not represent present obligations, are capitalized whenincurred as a separate component of the asset and are depreciated according to their useful lives.The application of IFRS determined the reversal of the periodic maintenance provision as well as the recognition of thenet value of regular major inspections costs within the caption “Tangible assets”, resulting in an increase inShareholders’ equity at 31st December 2003 of 42 million euros and a decrease in 2004 net income of 16 million euros.
2) Adjustments to intangible assets(ref. IAS 38 – Intangible assets)
Under Italian GAAP, costs for software development can be capitalized under certain circumstances. IFRS pose morestringent conditions for their capitalization.The application of IFRS determined a decrease in Shareholders’ equity at 31st December 2003 of 1 million euros.
3) Employee benefits(ref. IAS 19 – Employee benefits)
Under Italian GAAP, post-employment benefit plans are accrued during the period of employment of employees, inaccordance with the law and applicable collective labour contracts.Under IFRS, post-employment benefit plans (e.g. pension payments, life insurance payments, medical assistance afterretirement, etc.) according to their features may qualify as defined contributions plans or defined benefit plans. In thefirst case, the company’s obligation consists of making payments to the state or to a trust or a fund and it has no furtherpayment obligations once the contributions have been paid.Defined benefit plans are pension, insurance or healthcare plans which provide for the company’s obligation, also in theform of implicit obligation (see item 1), to provide non-formalized benefits to its former employees.2 . The relateddiscounted charges, determined with actuarial assumptions3, are accrued annually on the basis of the employmentperiods required to obtain such benefits.The application of this principle determined a decrease in Shareholders’ equity at 31st December 2003 of 14 millioneuros with a corresponding increase in provisions for employee benefits and an increase in 2004 net income of 1million euros.
S A I P E M F I N A N C I A L R E P O RT / E F F E C T S O F T H E A D O P T I O N O F I F R S
2 Given the uncertainties related to their payment date, employee termination indemnities are considered as a defined benefit plan.3 Actuarial assumptions concern, among other things, the following variables: (i) level of future salaries; (ii) employee mortality rate; (iii) employee turnover rate; (iv) share
of participants with successors entitled to benefits (e.g. spouses and children); (v) for medical assistance plans, frequency of reimbursement claims and future changes inmedical costs; (vi) interest rates.

S A I P E M F I N A N C I A L R E P O RT / E F F E C T S O F T H E A D O P T I O N O F I F R S
80
4) Goodwill amortization (ref. IAS 36 – Impairment of assets; IAS 38- Intangible assets)
Under Italian GAAP, goodwill is amortized on a straight-line basis in the periods of its expected utilization, provided thatit is no longer than five years; in case of specific conditions related to the type of business the goodwill refers to, it canbe amortized for a longer period not exceeding 20 years.Under IFRS, goodwill cannot be amortized, but it is subject to an annual impairment test in order to assess itsrecoverabilty.The application of IFRS determined a decrease in Shareholders’ equity at 31st December 2003 of 22 million euros andan increase in 2004 net income of 53 million euros.Impairment of goodwill The impairment test has been carried out to the goodwill and to consolidation differences at 1st January 2004,amounting to 828 million euros. The goodwill stems from the reorganisation of the Moss Maritime Group, whereas theconsolidation difference refers to the difference between the purchase price and the equity of Bouygues Offshore sa,Sofresid sa, Sonsub Inc. and Saipem Energy International SpA. The consolidation difference has been allocated to four ofthe six CGUs (Cash Generating Units) that make up the Group’s organisation: Offshore Construction, OnshoreConstruction, LNG and MMO. The goodwill has been partially allocated to CGU LNG and partially to another CGU calledOctabuoy, an autonomous entity within the greater CGU Offshore Construction; the goodwill is associated to the rightsrelated to a new patent.The criteria to determine the CGUs recoverable amount has been its value in use, which is based on the current value offuture cash flows, as estimated from the four-year Strategic Plan presented to the Board of Directors, properlydiscounted at rates that reflect current market valuation of the time value of money, business-specific risks, growthrates in line with the inflation inherent in discount rates. Finally, the current value of cash flows and the terminal value ofeach CGU was compared with their own capital employed. From this calculation, no impairment was required.The impairment applied to CGU Octabuoy, based on no expected future income, showed an impairment charge of 22million euros, equal to the goodwill residual value.
(million €)
Goodwill at 31st December 2003 pre IFRS 422 161 167 78 828
Goodwill at 31st December 2003 IFRS 400 161 167 78 806
Goodwill at 31st December 2004 IFRS 413 161 168 76 818
5) Stock grant plans (ref. IFRS 2 – Share-based payments)
Under Italian GAAP, the cost of stock-based compensation is recognized in the income statement at the stock grantsfair value determined pro rata temporis over the year and accrued in a specific provision.Under IFRS, for equity-settled share-based payment transactions ( that is the case of Saipem’s stock grant plans to theemployees), the company is to measure the goods or services received and the corresponding increase in equity,directly, at the fair value of the goods or services received.The application of IFRS determined an increase in Shareholders’ equity at 31st December 2003 of 1 million euros.
Tota
l
Mai
nten
ance
Mod
ifica
tion
and
Ope
rati
on
Liqu
efie
d N
atur
alG
as
Ons
hore
Cons
truc
tion
Offs
hore
Cons
truc
tion

S A I P E M F I N A N C I A L R E P O RT / E F F E C T S O F T H E A D O P T I O N O F I F R S
81
First adoption of IAS 32 and IAS 39
With regard to IAS 32 and IAS 39, pertaining to the evaluation and recognition of financial instruments includingderivatives hedging foreign currency risk, Saipem has opted, as permitted by IFRS 1 “First adoption of InternationalFinancial Reporting Standards”, to choose as transition date 1st January 2005 and without restating the comparitivefigures.The adoption of the two aforementioned principles has therefore modified the balance sheet at 1st January 2005 asfollows:
(million €)
Net tangible assets 1,712 – 1,712
Net intangible assets 835 – 835
Financial investments 17 – 17
Non-current assets 2,564 – 2,564
Working capital, net (3) 27 24
Provisions for risks and charges (66) – (66)
Net current assets (69) 27 (42)
Provisions for employee benefits (84) – (84)
Capital employed 2,411 27 2,438
Saipem Shareholders’ equity 1,536 19 1,555
Minority interests 9 – 9
Shareholders’ equity 1,545 19 1,564
Net debt 866 8 874
Cover 2,411 27 2,438
The nature of adjustments that affected equity at 1st January 2005 are as follows:
(million €)
1st January 2005
- Treasury shares reclassified against equity (22)
- Effects associated with the evaluation at fair value of foreign currency hedging contracts 49
- Effects associated with the evaluation at fair value of interest rate hedging contracts (8)
Total adjustments under IAS 32 and IAS 39 19
IFRS
1stJa
nuar
y 20
05
Effe
ct o
f the
IAS
32/3
9 ad
opti
on
IFRS
31st
Dec
embe
r 200
4

S A I P E M F I N A N C I A L R E P O RT
82

S A I P E M F I N A N C I A L R E P O RT
83
Consolidated balance sheetand income statement

S A I P E M F I N A N C I A L R E P O RT / S C H E M E S
84
Balance sheet
(million €) 31.12.2004 31.12.2005
ASSETS
CURRENT ASSETS
Cash and cash equivalents Note 1 595 877
Other financial assets for trading or available for sale Note 2 22 –
Trade and other receivables Note 3 1,292 1,523
Inventories Note 4 388 490
Income tax receivables Note 5 102 122
Other current assets Note 6 115 89
Total current assets 2,514 3,101
NON-CURRENT ASSETS
Property, plant and equipment Note 7 1,712 1,903
Intangible assets Note 8 835 837
Investments accounted for using the equity method Note 9 22 38
Other investments Note 10 – 4
Deferred tax assets Note 11 14 68
Other non-current assets Note 12 40 17
Total non-current assets 2,623 2,867
TOTAL ASSETS 5,137 5,968
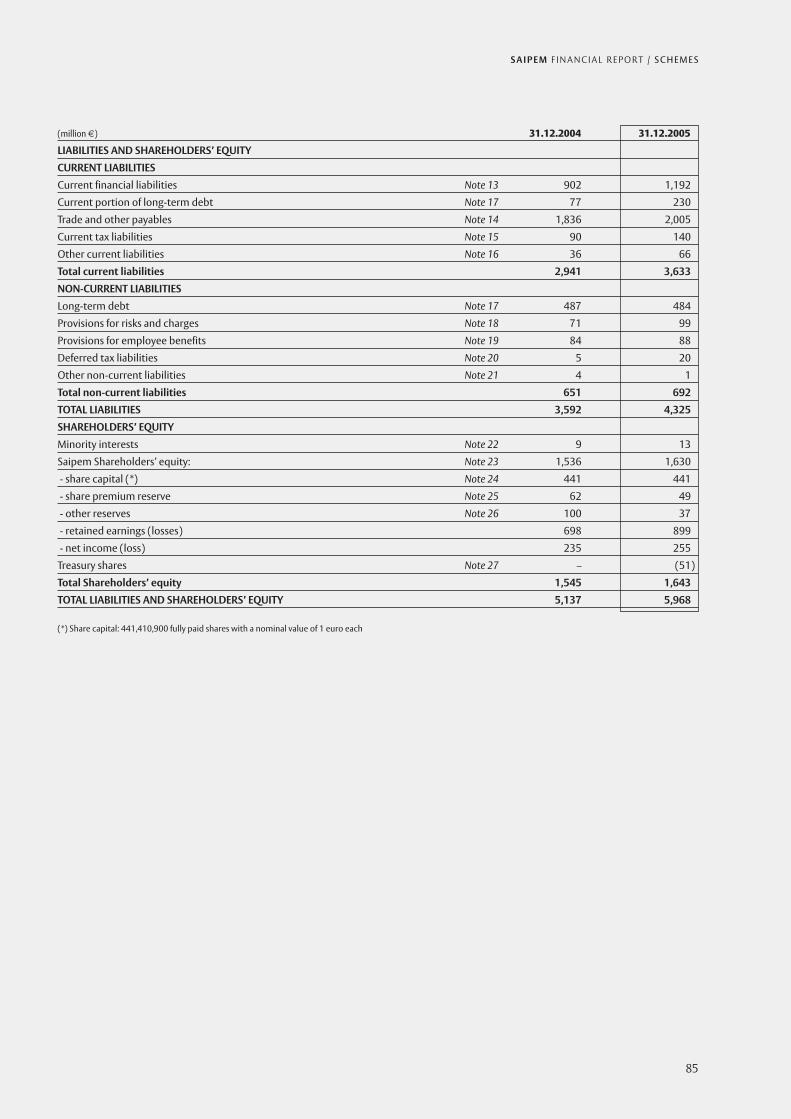
S A I P E M F I N A N C I A L R E P O RT / S C H E M E S
85
(million €) 31.12.2004 31.12.2005
LIABILITIES AND SHAREHOLDERS’ EQUITY
CURRENT LIABILITIES
Current financial liabilities Note 13 902 1,192
Current portion of long-term debt Note 17 77 230
Trade and other payables Note 14 1,836 2,005
Current tax liabilities Note 15 90 140
Other current liabilities Note 16 36 66
Total current liabilities 2,941 3,633
NON-CURRENT LIABILITIES
Long-term debt Note 17 487 484
Provisions for risks and charges Note 18 71 99
Provisions for employee benefits Note 19 84 88
Deferred tax liabilities Note 20 5 20
Other non-current liabilities Note 21 4 1
Total non-current liabilities 651 692
TOTAL LIABILITIES 3,592 4,325
SHAREHOLDERS’ EQUITY
Minority interests Note 22 9 13
Saipem Shareholders’ equity: Note 23 1,536 1,630
- share capital (*) Note 24 441 441
- share premium reserve Note 25 62 49
- other reserves Note 26 100 37
- retained earnings (losses) 698 899
- net income (loss) 235 255
Treasury shares Note 27 – (51)
Total Shareholders’ equity 1,545 1,643
TOTAL LIABILITIES AND SHAREHOLDERS’ EQUITY 5,137 5,968
(*) Share capital: 441,410,900 fully paid shares with a nominal value of 1 euro each

S A I P E M F I N A N C I A L R E P O RT / S C H E M E S
86
Income statement
(million €) Year 2004 Year 2005
REVENUES
Turnover Note 28 4,306 4,528
Other revenues and income Note 29 10 11
Total revenues 4,316 4,539
OPERATING EXPENSES
Purchases, services and other costs Note 30 (3,050) (3,156)
Payroll and related costs Note 31 (739) (819)
Amortization, depreciation and impairments Note 32 (199) (199)
Total operating expenses (3,988) (4,174)
OPERATING INCOME 328 365
FINANCIAL INCOME (EXPENSES) Note 33
Financial income 42 196
Financial expenses (84) (250)
Total financial income (expenses) (42) (54)
INCOME (EXPENSES) FROM INVESTMENTS Note 34
- Effect of investments accounted for using the equity method 18 2
- Other income (expenses) from investments 1 –
Total income (expenses) from investments 19 24
INCOME BEFORE INCOME TAXES 305 335
Income taxes Note 35 (67) (76)
Net income 238 259
Pertaining to:
- Saipem 235 255
- Minority interest Note 36 3 4
Earnings per share pertaining to Saipem (euro per share)
- basic Note 37 0.45 0.59
- diluted Note 37 0.45 0.59

S A I P E M F I N A N C I A L R E P O RT / S C H E M E S
87
Changes in Shareholders’ equity
(million €)
Balance at 31.12.2003 441 62 2 52 13 22 – (5) 585 196 – 1,368 23 1,391Effect of IAS application – – – – – – – – 6 – – 6 – 6Annulment of exchange differences – – – – – – – 5 (5) – – – – –Adjusted balance at 1.1.2004 441 62 2 52 13 22 – – 586 196 – 1,374 23 1,397Net income 2004 – – – – – – – – – 197 – 197 3 200Net income (expenses) recognizeddirectly in equityExchange differences fromtranslation of financial statementsin currencies other than euros – – – – – – – (12) – – – (12) – (12)Transactions with ShareholdersDistributed dividends – – – – – – – – – (65) – (65) – (65)2003 retained earnings andallocation to legal reserve – – – 3 – – – – 128 (131) – – – –Buy-back of treasury shares – – – – 9 (1) – – (8) – – – – –Other variations – – – – – – – – – – – – (17) (17)Balance at 31.12.2004 441 62 2 55 22 21 – (12) 706 197 – 1,494 9 1,503Effect of IAS application – – – – – – – – 4 38 – 42 – 42Annulment of exchange differences – – – – – – – 12 (12) – – – – –Adjusted balance at 31.12.2004 441 62 2 55 22 21 – – 698 235 – 1,536 9 1,545Effect of application of IAS 32and IAS 39 – – – – (22) – 58 – 5 – (22) 19 – 19Adjusted balance at 1.1.2005 441 62 2 55 – 21 58 – 703 235 (22) 1,555 9 1,564Net income 2005 – – – – – – – – – 255 – 255 4 259Net income (expenses) recognizeddirectly in equityVariation of the fair value of cash flowhedge derivatives, net of effectof taxation – – – – – – (109) – – – – (109) – (109)Exchange differences fromtranslation of financial statementsin currencies other than euros – – – – – – – 14 – – – 14 – 14Total – – – – – – (109) 14 – – – (95) – (95)Transactions with ShareholdersDistributed dividends – – – – – – – – – (65) – (65) – (65)2004 retained earnings andallocation to legal reserve – – – 3 – – – – 167 (170) – – – –Approval for buy-back of treasury shares – (13) – – – 24 – – (11) – – – – –Buy-back of treasury shares – – – – – (35) – – 35 – (35) (35) – (35)Treasury shares sold underincentive plans – – – – – – – – – – 6 6 – 6Other variations in Shareholders’ equityCost of stock options/stock grants – – – – – – – – 5 – – 5 – 5Exchange differences arising ondividends distribution – – – – – – – 4 – – – 4 – 4Total – (13) – 3 – (11) – 4 196 (235) (29) (85) – (85)Balance at 31.12.2005 441 49 2 58 – 10 (51) 18 899 255 (51) 1,630 13 1,643
Tota
l Sha
reho
ders
’eq
uity
Min
orit
yin
tere
sts
Tota
l
Trea
sury
shar
es
Net
inco
me
Reta
ined
earn
ings
Rese
rve
for
exch
ange
rate
diffe
renc
es
Rese
rve
for
cash
flow
hedg
e
Rese
rve
for
buy-
back
of
trea
sury
shar
es
Rese
rve
for
trea
sury
shar
es h
eld
Lega
l res
erve
Reva
luat
ion
rese
rve
Shar
epr
emiu
mre
serv
e
Shar
e ca
pita
l

S A I P E M F I N A N C I A L R E P O RT / S C H E M E S
88
(million €) Year 2004 Year 2005
Net income 238 259
Depreciation and amortization 199 196
Write-downs (appreciations) (17) (22)
Net change in provisions for risks and charges 2 25
Net change in provisions for employee benefits 3 5
Losses (gains) on disposals of assets (3) –
Interest income (8) (22)
Interest expense 24 35
Unrealised (gains) losses on foreign currency exchange 10 12
Current and deferred income taxes 67 76
Operating income before changes in working capital 515 564
Changes:
Inventories (78) (88)
Trade and other receivables (95) (233)
Other assets 31 14
Trade and other payables 6 83
Other liabilities 13 46
Cash flow from operating income 392 386
Dividends received 21 4
Interest received 8 22
Interest paid (20) (35)
Income taxes paid (31) (57)
Exchange rate differences gained on dividends – 6
Net cash flow provided from operating activities 370 326
Investments:
Intangible assets (11) (5)
Tangible assets (186) (350)
Consolidated company holdings (12) (7)
Financing receivables (1) (12)
Cash flow from investments (210) (374)
Disposals:
Tangible assets 7 3
Consolidated company holdings 4 –
Financing receivables 5 –
Cash flows from disposals 16 3
Net cash flow from investments (194) (371)
Proceeds from long term debt 2 –
Repayment of long term debt (6) 50
Increase (decrease) in short term debt (29) 358
Capital contribution 16 –
Capital paymaents by/to minority Shareholders’ (14) –
Dividends paid (65) (65)
Partial purchase of consolidated holdings (25) –
Net cash flow from financing (121) 343
Buy-back of treasury shares (10) (30)
Effect of exchange rate gains and losses (3) 10
Other changes 4 4
Net cash flow for the year 46 282
Cash and cash equivalent at the beginning of the year 549 595
Cash and cash equivalent at the end of the year 595 877
Cash flow statement

S A I P E M F I N A N C I A L R E P O RT / BA S I S O F P R E S E N TAT I O N
89
In application of EC Regulation 1606/2002 approved by the European Parliament and Council on 19th July 2002, startingfrom 2005 companies with securities listed on a regulated stock market of a Member State of the European Union arerequired to prepare their consolidated financial statements in accordance with International Financial ReportingStandards (IFRS), as approved by the European Commission.The consolidated financial statements of Saipem have been prepared in accordance with IFRS issued by theInternational Accouting Standards Board (IASB) and adopted by the European Commission following the procedurecontained in article 6 of the EC Regulation No. 1606/2002 of the European Parliament and Council of 19th July 2002. The consolidated financial statements include accounts of Saipem SpA and of all Italian and foreign companies onwhich Saipem SpA holds the right to directly or indirectly exercise control, determining financial and operating policies,and obtain economic and financial benefits. Insignificant subsidiaries are not included in the scope of consolidation. Asubsidiary is considered insignificant when it does not exceed two of these limits: (i) total assets or liabilities: 3,125 thousand euros; (ii) total revenues: 6,250 thousand euros; (iii) average number ofemployees: 50 units. Moreover, companies, for which the consolidation does not produce significant economic and financial effects, are notincluded in the scope of consolidation. The effects of these exclusions are not material4.Subsidiaries excluded from consolidation, joint ventures, associates and other interests are accounted for as describedbelow under the heading “Financial fixed assets”.Consolidated companies, non-consolidated susbsidiaries, associates and relevant investments as set forth in art. 126 ofConsob resolution 11971 of 14th May 1999 and subsequent addenda, are indicated under the section “Consolidationarea”.
Financial statements of consolidated companies are audited by auditing companies.Considering their materiality, amounts are stated in millions of euros.
Basis of presentation
4 According to the requirements of the Framework of international accounting standards, “Information is material if its omission or misstatement could influence theeconomic decisions that users make on the basis of the financial statements”.

S A I P E M F I N A N C I A L R E P O RT / P R I N C I P L E S O F C O N S O L I DAT I O N
90
Principles of consolidation
Interests in companies included in the consolidation area
Fully owned companies are consolidated using the full consolidation method; therefore assets and liabilities, expensesand income related to fully consolidated companies are wholly incorporated into the consolidated financial statement;the book value of these interests is eliminated against the corresponding portion of the Shareholders’ equity of thecompanies owned.
Jointly controlled entities are accounted for using the proportionate consolidation method; therefore the book value ofinterests in these companies is eliminated against the corresponding fraction of the Shareholders’ equity of thecompanies owned; assets and liabilities, expense and income related to consolidated companies are incorporated intothe consolidated financial statement proportionally to the interest held.
The Shareholders’ equity in owned companies is determined by attributing to each item of the balance sheet thecurrent value at the date of acquisition of control. Any positive residual difference is recognized as “Goodwill”. Negativeresidual differences are charged against the income statement.
Gains or losses deriving from the disposal of interests in consolidated companies are recorded in the statement, for theamount corresponding to the difference between proceeds from the sales and the divested portion of equity sold.
Fractions of Shareholders’ equity and of net income of minority interest are recognized under specific items of thefinancial statements. Minority interest is determined based on the fair value attributed to assets and liabilities at thedate of the acquisition of control, excluding any related goodwill.
Dividends, revaluations, write-downs and losses on interests in consolidated companies, as well as gains and lossesfrom inter-company disposals of shareholdings in consolidated companies are eliminated.
Inter-company transactions
Income deriving from inter-company transactions unrealized towards third parties is eliminated. Receivables, payables,revenues and costs, guarantees, commitments and risks among consolidated companies are also eliminated. Inter-company losses are not eliminated, since they reflect an actual decrease in the value of divested assets.
Foreign currency translation
Financial statements of consolidated companies denominated in currencies other than the euro are converted intoeuro applying exchange rates prevailing at year-end to assets and liabilities, the historical exchange rates to equityaccounts and the average rates for the period to profit and loss account (source: Ufficio Italiano Cambi).Exchange rate differences deriving from the application of different exchange rates for assets and liabilities,Shareholders’ equity and profit and loss account are recognized under the item “Reserve for exchange rate differences”within Shareholders’ equity for the portion relating to the Group and under the item “Minority interest” for the portionrelated to minority Shareholders.
Financial statements of foreign companies which have been translated into euros are denominated in the functionalcurrency, i.e. the local currency or the currency in which most of the financial transactions as well as assets and liabilitiesare denominated.

S A I P E M F I N A N C I A L R E P O RT / P R I N C I P L E S O F C O N S O L I DAT I O N
91
Exchange rates that have been applied for the translation of financial statements in foreign currencies are as follows:
US Dollar 1.3621 1.1797 1.2441
Pound Sterling 0.7050 0.6853 0.6838
Algerian Dinar 97.5743 86.038 90.7031
Angolan Kwanza 116.559 95.2956 108.441
Saudi Arabian Riyal 5.1010 4.4244 4.6642
Australian Dollar 1.7459 1.6109 1.6312
Azerbaijani Manat 6,689.2700 5,442.2300 5,898.0700
Brazilian Real 3.6143 2.7432 3.0344
Congo Franc cfa 655.9600 655.9500 655.9520
Croatian Kuna 7.6490 7.3715 7.3989
Indian Rupee 59.33358 53.1679 54.8289
Indonesian Rupee 12,626.6000 11,596.5000 12,071.2000
Kazakhstan Tenghè 177.0090 157.7980 165.2390
Malaysian Ringgit 5.1752 4.4584 4.7116
Nigerian Naira 177.7540 153.2750 164.7250
Norwegian Kroner 8.2365 7.9850 8.0092
Peruvian New Sol 4.4689 4.0558 4.0966
Russian Rouble 37.8425 33.9200 35.1860
Singaporean Dollar 2.2226 1.9628 2.07024
Swiss Franc 1.5429 1.5551 1.5483
UAE Dirham 5.0029 4.3331 4.5695
2005
ave
rage
exch
ange
rate
Exch
ange
at
31.1
2.20
05
Exch
ange
at
31.1
2.20
04
Curr
ency

S A I P E M F I N A N C I A L R E P O RT / AC C O U N T I N G P O L I C I E S
92
Accounting policies
The most significant accounting policies used for the preparation of the consolidated financial statements are shownbelow.
Non-current assets
Property, plant and equipmentTangible assets, including investment properties, are recognized using the cost model and stated at their purchase orproduction cost including ancillary costs directly attributable to them as incurred to make the asset ready for use. Inaddition, when a substantial amount of time is required to make the asset ready for use, the purchase price orproduction cost includes the financial expenses incurred that would have theoretically been saved had the investmentnot been made. The purchase or production costs is net of Government grants that are recorded in a contra assetaccount when authorized, if all the required conditions have been met.In the case of current obligations for the dismantling and removal of assets and the reclamation of sites, the carryingvalue includes, with a corresponding entry to a specific provision, the estimated (discounted) costs to be borne at themoment the asset is retired. Revisions of estimates for these provisions, for the passage of time and for changes in thediscount rate are recognized under “Provisions for risks and charges”.No revaluation is made even in application of specific laws. Assets carried under finance lease are included within the tangible assets, with a corresponding entry to the financialpayable to the lessor, and depreciated using the criteria detailed below. When there is not reasonable certainty topurchase the assets the depreciation is calculated over the period of the lease if shorter than the useful life of the asset.Tangible assets are systematically depreciated over the duration of their useful life taken as an estimate of the period forwhich the assets will be used by the company. When the tangible asset comprises more than one significant elementwith different useful lives, the depreciation is carried out for each component. The amount to be depreciated isrepresented by the book value reduced by the presumable net realizable value at the end of the useful life, if it issignificant and can be reasonably determined. Land is not depreciated, even if bought together with a building. Tangibleassets held for sale are not depreciated but are measured at the lower of the book value and fair value less costs ofdisposal.Assets to be returned for free are depreciated over the shorter of the duration of the concession and the useful life ofthe assets.Renewal, improvement and transformation costs which extend asset lives are capitalized.The costs for the substitution of identifiable components in complex assets are capitalized and depreciated over theiruseful life; the residual book value of the component that has been substituted is charged to the profit and lossaccount. Ordinary maintenance and repair costs are expensed when incurred.When events occur that lead to a presumable reduction in the book value of tangible assets, their recoverability istested by comparing their book value with the realizable value, represented by the greater of fair value less costs ofdisposal and its value in use. In the absence of a binding sales agreement, fair value is estimated on the basis of market values of recent transactions,or of the best available information that shows the proceeds that the company could reasonably expect to collect fromthe disposal of assets. Value in use is determined by discounting the expected cash flows deriving from the use of the asset and, if significantand reasonably determinable, the cash flows deriving from its disposal at the end of its useful life, net of disposal costs.Cash flows are determined on the basis of reasonable and documented assumptions that represent the best estimate ofthe future economic conditions during the remaining useful life of the asset, giving more importance to independentassumptions. The discounting is carried out at a rate that takes into account the implicit risk in the sectors where theentity operates. Valuation is carried out for each single asset or, if the realizable value of single assets cannot be determined, for thesmallest identifiable group of assets that generates independent cash inflows from their continuous use, so called cashgenerating unit. When the reasons for their impairment cease to exist, Saipem reverses previously recordedimpairment charges and records an income as asset revaluation in the profit and loss account. This asset revaluation isthe lower between the recoverable amount and the book value increased by the amount of previously incurred
S A I P E M F I N A N C I A L R E P O RT / AC C O U N T I N G P O L I C I E S
93
impairments net of related amortization that would have been calculated had the impairment not been recognized.Tangible assets destined for specific operating projects, for which no further future use is envisaged due to thepeculiarities of the asset itself or the high usage sustained during the execution of the project, are amortized over theduration of the project.
Intangible assetsIntangible assets include assets which lack of physical consistence that are identifiable, controlled by the company andable to produce future economic benefits, and goodwill acquired in business combinations. An asset is identifiablewhen it can be distinguished from goodwill. This condition is normally met when: (i) the intangible asset arise from alegal or contractual right, or (ii) the asset is separable, i.e. can be sold, transferred, licensed, rented or exchanged, eitherindividually or as an integral part of other assets. An entity controls an asset if it has the power to obtain the futureeconomic benefits deriving from the underlying resource and to restrict the access of others to those benefits.Intangible assets are stated at cost as determined with the criteria used for tangible assets. No revaluation is made evenin application of specific laws.Intangible assets with a defined useful life are amortized systematically over the duration of their useful life whichrepresents the period for which the assets will be used by the company; the recoverability of their book value ischecked using the criteria described in the section “Property, plant and equipment”.Goodwill and other intangible assets with an indefinite useful life are not amortized. The recoverability of their carryingvalue is tested at least annually and whenever events or changes in circumstances indicate that the carrying value maynot be recoverable. With reference to goodwill, this test is performed at the level of the smallest aggregate on whichthe company, directly or indirectly, evaluates the return on the capital expenditure that included said goodwill.Impairment charges related to goodwill cannot be reversed.
Costs of technological development activitiesCosts of technological development activities are capitalized when the company can demonstrate all of the following:a) there is the technical capacity to complete the asset and make it available for use or sale; b) there is the intention to complete the asset and make it available for use or sale;c) it is possible to make the asset available for use or sale;d) it can be shown that the asset is able to produce future economic benefits;e) technical, financial and other resources are available to complete development of the asset and make the asset
available for use or sale;f) the cost attributable to the intangible asset can be reasonably determined.
GrantsGrants are recognized when all the conditions attached to them have been met and are recorded by reducing thepurchase price or the production cost of the relevant assets. Grants related to income are recognized in the profit andloss account.
Financial fixed assets
InvestmentsInvestments in subsidiaries excluded from consolidation and associates are accounted for using the equity method. If itdoes not result in a misrepresentation of the company’s financial condition and consolidated results, subsidiariesexcluded from consolidation and associates are accounted for at cost, adjusted for impairment charges.When the reasons for their impairment cease to exist, investments accounted for at cost are revalued within the limit ofthe impairment charge recognized and their effects are charged to the profit and loss account item “Other income(expense) from investments”.Other investments are recognized at their fair value with changes in fair value recorded in Shareholders’ equity. Whenfair value cannot be reasonably determinated, investments are accounted for at cost, adjusted for impairment charges;impairment charges cannot be reversed.The risk deriving from losses exceeding Shareholders’ equity is recognized in a specific provision to the extent theparent company is required to fulfil legal or implicit obligations towards the subsidiary or to cover its losses.

S A I P E M F I N A N C I A L R E P O RT / AC C O U N T I N G P O L I C I E S
94
Receivables and financial assets to be held to maturityReceivables and financial assets to be held to maturity are stated at cost represented by the fair value of the initialexchanged amount adjusted to take into account direct external costs related to the transaction (e.g. fees of agents orconsultants, etc.). The initial carrying value is then adjusted to take into account capital repayments, impairmentcharges and amortization of the difference between the reimbursement value and the initial carrying value;amortization is carried out on the basis of the effective internal rate of return represented by the rate that equalizes, atthe moment of the initial recognition, the present value of expected cash flows to the initial carrying value (so-calledamortized cost method). The economic effects of the valuation according to the amortized cost method are charged as“Financial income (expenses)”.
Current assets
InventoriesInventories, with the exception of contract work-in-progress, are stated at the lower between the purchase orproduction cost and the market value.The cost for inventories is determined by applying the weighted-average cost method. As inventories mostly consist of spare parts, the market value thereof is represented by their replacement cost or bytheir net realisable value, if lower.Contract work-in-progress relating to long-term contracts is stated on the basis of contractual revenues, defined withcustomers with reasonable certainty, using the percentage of completion method and complying with the principle ofprudence.Given the nature of the contracts and the type of work, the percentage of completion is calculated on the basis of thework performed, being the percentage of costs incurred with respect to the total estimated costs (cost-to-costmethod).In order to consider the economic effects arising from the application of this method respect to the revenues alreadyinvoiced and recognized adjustments are included under “work-in-progress” caption if the difference respect to therevenues recognized is positive or under “trade payables” caption if negative.The agreed revenues, where expressed in a foreign currency, are calculated by taking into account the spot exchangerate fixed by the designated hedging instruments or otherwise the spot exchange rate of period’s end; the samemethod is used for any costs in a foreign currency.The valuation of work-in-progress considers all directly related costs, contractual risks and contractual price revisions,where they can be objectively determined.Additional revenues respect to original contracts are recognized only when probable and reasonably quantifiable.Contract losses are charged entirely to the year in which they become known.Bidding costs are expensed in the year in which they are incurred.
Current financial assetsFinancial assets held for trading and financial assets available for sale are stated at fair value and the economic effectsare charged, respectively, to the income statement item “Financial Income (Expenses)” and the balance sheet item“Other reserves”. The fair value of financial instruments is represented by market quotations or, in their absence, by thevalue resulting from the adoption of suitable financial valuation models which take into account all the factors adoptedby the market operators and the prices obtained in similar actual transactions in the market.When the conditions for the purchase or sale of financial assets provide for the settlement of the transaction and thedelivery of the assets within a given number of days determined by entities controlling the market or by agreements(e.g. purchase of securities on regulated markets), the transaction is recognized at the date of settlement.Receivables are stated at their amortized cost (see above “Financial fixed assets”).Transferred financial assets are eliminated when the transaction, together with the cash flows deriving from it, lead tothe substantial transfer of all risks and rewards associated to the ownership.

S A I P E M F I N A N C I A L R E P O RT / AC C O U N T I N G P O L I C I E S
95
Cash and cash equivalents
Cash and cash equivalents include cash in hand, deposit held at call with banks, other short-term highly liquidinvestments with original maturities of three months or less and bank overdrafts. Bank overdrafts are shown within borrowings on the balance sheet in the “Current liabilities” caption.
Treasury shares
Treasury shares are recorded at cost and as a reduction of Shareholders’ equity. Gains following subsequent sales arerecorded as an increase in Shareholders’ equity.
Financial liabilities
Debt is carried at the amortized cost (see above “Financial fixed assets”).
Provisions for risks and charges
Provisions for risks and charges concern risks and charges of a definite nature and whose existence is certain orprobable but for which at year-end the amount or date of occurrence remains uncertain. Provisions are made when: (i)there is a current obligation, either legal or implicit, deriving from a past event; (ii) it is more likely than not that anoutflow of resources will be required to settle the obligation; (iii) the amount of the obligation can be reliablyestimated. Provisions are stated at the value that represents the best estimate of the amount that the company wouldreasonably pay to settle the obligation or to transfer it to third parties at year-end.When the financial effect of time is significant and the payment date of the obligations can be reasonably estimated,the provisions are discounted; the increase in the provision related to the passing of time is charged to the incomestatement in the item “Financial Income (Expenses)”.When the liability refers to tangible asset (e.g. site restoration and abandonment), the provision is stated with acorresponding entry to the asset to which it refers; the income statement charge is made with the amortization process.The costs that the company expects to bear to carry out restructuring plans are recognized in the year in which thecompany formally defines the plan and the interested parties have developed a valid expectation that the restructuringwill occour.The provisions are periodically updated to show the variations of estimated costs, timing and interest rates; theestimate revisions of the provisions are recognized in the same income statement item previously used to accrue theprovision, or, when the liability regards tangible assets (i.e. site restoration and abandonment) with a correspondingentry to the assets to which they refer.When required, notes to the Financial Statements includes the following potential liabilities: (i) possible, but notprobable obligations deriving from past events, whose existence will be confirmed only when one or more futureevents beyond the company’s control occur; (ii) current obligations deriving from past events whose amount cannotbe reasonably estimated or whose fulfilment will probably be not expensive.
Employee post-employment benefits
Post-employment benefit plans, even if not formalized, according to their features, may qualify as defined contributionplans or defined benefit plans. In the first case, the company’s obligation, consisting of making payments to the State or toa trust or a fund, is determined on the basis of due contributions, minus any sums already paid.The liabilities related to defined benefit plan5, net of any plan assets, are determined on the basis of actuarialassumptions6 and charged to the relevant year consistently with the employment period required to obtain thebenefits; the evaluation of liabilities is made by independent actuaries.Actuarial gains and losses of defined benefit plans, deriving from a change in the actuarial assumptions used or from achange in the conditions of the plan, in excess of the greater of 10% of the value of the plan assets or 10% of the definedbenefit obligation, are charged or credited to income statement.

S A I P E M F I N A N C I A L R E P O RT / AC C O U N T I N G P O L I C I E S
96
Revenues
Revenues from sales of products and services rendered are recognized upon transfer of risks and rewards associated tothe ownership or upon the completion of the service rendered.The allowances of revenues related to partially rendered services are recognized with respect to the accruedconsiderations, if it is possible to reasonably determine the state of completion and there are no relevant uncertaintiesconcerning the amounts and the existence of the revenue and related costs; otherwise they are recognized within thelimits of the recoverable costs incurred.The revenues related to contract work-in-progress are recognized on the basis of contractual revenues by reference tothe stage of completion of a contract measured on the cost-to-cost basis. Revenues for contract work-in-progress in aforeign currency are recognized at the euro spot exchange rate of the date when the stage of completion of a contractis measured; such a value is adjusted to take into account the hedge accounting. Advances are recognized at the spot exchange rate of the date of payment.The requests for additional revenues, deriving from a change in the scope of the work, are included in the total amountof revenues when it is probable that the customer will approve the variation and the relevant amount; claims derivingfor instance from additional costs incurred for reasons attributable to the client are included in the total amount ofrevenues when it is probable that the counterpart will accept them. Works not yet agreed with customers arerecognized at the year-end exchange rate. Revenues are stated net of returns, discounts, rebates and bonuses, as well as directly related taxation.
Costs
Costs are recognized when the related goods and services are sold, consumed or allocated, or when their future usefullives cannot be determined.Operating lease payments are recognized in the income statement over the length of the contract.Labour costs comprise remuneration paid, provisions made to pension funds, accrued holidays, national insurance andsocial security contributions in compliance with national contracts and current legislation.Labour costs include stock grants and stock options granted to managers from 1st January 2003, consistently with theirremunerative nature. The cost is determined based on the fair value of the rights granted to the employee, plus anycharges borne by the employer (social contributions and employee termination indemnities); the portion relevant tothe year is calculated pro rata over the period to which the incentive refers (vesting period) 7 . The fair value of stockgrants is represented by the current value of the shares at the date of the award, reduced by the current value of theexpected dividends in the vesting period. The fair value of stock options is the value of the option calculated with theBlack-Scholes method that takes into account the exercise conditions, current price of the shares, expected volatilityand the risk-free rate. The fair value of stock grants and stock option plans for Saipem SpA employees is shown in the item “Labour costs –other costs” and as a contra to “Retained earnings”. The allowance for employee termination indemnities (“TFR”) andsocial contributions calculated on the fair value is recognized in a contra account in the item “Provision for employeebenefits”.The fair value of stock grant plans for employees of controlled companies is shown at the grant date in the item“Financial expenses” and as a contra to “Retained earnings” and is subsequently recharged to the various companies in acontra account in the item “Financial income - other”.The fair value of stock option plans is shown as a contra-entry in the item “Retained earnings”.Costs related to the acquisition of new knowledge or discoveries, the study of products or alternative processes, newtechniques or models, the planning and construction of prototypes or, in any case, costs borne for other scientificresearch activities or technological development, are generally considered current costs and expensed as incurred.These costs are capitalized when they meet the requirements listed under “Costs of technological development”(please refer to item described above).
5 Given the uncertainties related to their payment date, employee termination indemnities are considered as a defined benefit plan.6 Actuarial assumptions concern, among other things, the following variables: (i) level of future salaries; (ii) employee mortality rate; (iii) employee turnover rate; (iv) share
of participants with successors entitled to benefits (e.g. spouses and children); (v) for medical assistance plans, frequency of reimbursement claims and future changes inmedical costs; (vi) interest rates.
7 For stock grants, the period between the date of the award and the date of allocation of stock; for stock options, the period between the date of the award and the date onwhich the option can be exercised.

S A I P E M F I N A N C I A L R E P O RT / AC C O U N T I N G P O L I C I E S
97
Exchange rate differences
Revenues and costs concerning transactions in foreign currencies are stated at the spot exchange rate on the date thatthe transaction occurs.Monetary assets and liabilities denominated in foreign currency are converted into euros by applying the year-endexchange rate and the effect is recognized in the income statement.Non-monetary assets and liabilities denominated in foreign currency measured at cost are stated at the initialexchange rate; when they are measured at fair value, at recoverable value or realizable value, the exchange rate appliedis that of the day of recognition.
Dividends
Dividends are recognized at the date of the general Shareholders’ meeting in which they were declared,
Income taxes
Current income taxes are determined on the basis of the estimated taxable income; the estimated liability isrecognized in the item “Current tax liabilities”. Current tax liabilities and assets are measured at the amount expectedto be paid to (recovered from) the tax authorities, using the tax rates (and tax laws) that have been enacted orsubstantively enacted by the balance sheet date.Deferred tax assets or liabilities are provided on temporary differences arising between the carried amounts of the theassets and liabilities in the financial statements and their tax basis. Deferred tax assets are recognized when theirrealization is considered probable.Deferred tax assets and liabilities are recorded under non-current assets and liabilities and are offset at single entitylevel if referred to offsettable taxes. The balance of the offset, if positive is recognized in the item “Deferred tax assets”and if negative in the item “Deferred tax liabilities”. When the results of transactions are recognized directly in the Shareholders’ equity, current taxes, deferred tax assetsand liabilities are also charged to the Shareholders’ equity.
Derivatives
Derivatives are assets and liabilities recognized at their fair value.Consistently with its business requirements, Saipem classifies derivatives as hedging instruments, whenever possible.Derivatives are classified as hedging instruments when the relationship between the derivative and the hedged item isformally documented and the effectiveness of the hedge on an ongoing basis is high. When hedging instruments coverthe risk of variation of the fair value of the hedged item (fair value hedge; e.g. hedging of the variability on the fair valueof fixed interest rate assets/liabilities), the derivatives are stated at fair value and the effects charged to the incomestatement; consistently the hedged items are adjusted to reflect the variability of fair value associated with the hedgedrisk. Cash flow hedges cover the cash flow variation risks that may affect the income statement in the future; these risks areusually associated to a balance sheet asset or liability (such as future payables of debts at variable interest rates) orhighly probable forecast transactions, for instance construction costs/revenues.The effective portion of variations in fair value of derivatives, as defined as hedging contracts by IAS 39, are posted to ahedging reserve and are charged as income over the period in which the hedged item affects the income statement.The ineffective portion of changes in fair value of derivatives, as well as the entire changes in fair value of thosederivatives that have not been defined as hedging contracts by IAS 39, are charged directly to the income statement inthe item “Financial income (expenses)”.

S A I P E M F I N A N C I A L R E P O RT / AC C O U N T I N G P O L I C I E S
98
Risk management
Main risks identified and managed by Saipem are the following:(i) market risks deriving from the exposure to fluctuations of interest rates, of exchange rates between the euro and theother currencies used by the company, as well as the volatility of commodity prices;(ii) the credit risk deriving from the possible default of a counterparty;(iii) the liquidity risk deriving from the lack of financial resources to face short-term commitments;(iv) the operation risk deriving from the occurrence of accidents, malfunctioning, failures with injury to persons anddamage to the environment affecting operating and financial results;(v) country risk of operations.
Market riskSaipem operates worldwide in business sectors that are exposed to market risks resulting from changes in interestrates, exchange rates and price of materials. The risk of fluctuations in prices and financial flows is strictly linked to thenature of this business and can only be partially offset through appropriate risk management policies.The market risk also includes exchange and interest rate risks.
Risk of price variations and financial flowsSaipem’s results are influenced by variations in oil prices, insurance premia and price of raw materials. Furthermore,Saipem’s financial flows are exposed to fluctuations in interest and exchange rates.
Exchange rate riskExchange rate risk derives from the fact that Saipem’s operations are conducted in non-euro areas, revenues fromoperational contracts are denominated or linked to the US dollar and by the time lag existing between the recognitionof revenues and costs denominated in currencies other than the functional currency and the actual time of the relevantmonetary transaction (transaction exchange rate risk).Saipem’s strategy to reduce the market risk exposure arising from exchange rate fluctuations by utilising derivatives.Planning and management for this activity is the responsibility of the Treasury Department, which closely monitors thecorrelation between derivatives and their underlying flows as well as ensuring their correct accounting representationin compliance with the international financial reporting standards.
Interest rate riskThe risk exposure arising from interest rate fluctuations within the Saipem Group is associated mainly with long-termfinancing with variable rates. To reduce this risk, Interest rate swaps (I.R.S.) are entered into, as they also ensure abalanced relation between debt at fixed and variable interest rates.
Credit riskCredit risk represents Saipem’s exposure to incur a loss in the event of non-performance by a counterparty. The creditrisk arising from the Group’s normal commercial operations is managed by the business units and the administrationdepartment on the basis of Group-approved guidelines and periodic reporting. As for financial investments and theutilization of financial instruments, including derivatives, companies adopt the guidelines issued by the TreasuryDepartment of Saipem SpA. At present, Saipem has no significant concentrations at credit risk.
Liquidity riskLiquidity risk is the risk that suitable sources of funding for business activities may not be sufficient to covercommitments. At present, through the management of flexible credit lines suitable with business requirements,Saipem believes it has access to sufficient funding and has also both committed and uncommitted borrowing facilitiesto meet currently foreseeable borrowing requirements.
Operation risksSaipem’s activities present industrial and environmental risks and are therefore subject to extensive governmentregulations concerning environmental protection and industrial security in most countries. Saipem adopted the most stringent standards for the evaluation and management of industrial and environmental

S A I P E M F I N A N C I A L R E P O RT / AC C O U N T I N G P O L I C I E S
99
risks, complying with the industry best practices. Business units evaluate through specific procedures the relatedindustrial and environmental risks in addition to taking into account the regulatory requirements of the countrieswhere these activities are located. In 2005, Saipem has further strengthened its commitment to HSE activities, theprevention of environmental risks, health and safety.
Country riskSubstantial portions of Saipem’s operations are performed in countries outside the EU and North America, certain ofwhich may be politically or economically less stable. Saipem constantly monitors the political, social and economic risksof the approximately 100 countries where it invested or intends to invest. Country risks are mitigated by means ofappropriate guidelines for risk management that Saipem defined in its procedure for “Project Risk Assessment andManagement”.

S A I P E M F I N A N C I A L R E P O RT / U S E O F AC C O U N T I N G E S T I M AT E S
100
Use of accounting estimates
The application of generally accepted accounting standards in the preparation of consolidated financial statementsrequires Management to apply accounting methods and policies that are based on difficult or subjective judgments,estimates based on past experience and assumptions determined to be reasonable and realistic based on the relatedcircumstances. The application of these estimates and assumptions affects the reported amounts of assets andliabilities and the disclosure of contingent assets and liabilities at the balance sheet date and the reported amounts ofincome and expenses during the reporting period. Actual results may differ from these estimates given the uncertaintysurrounding the assumptions and conditions upon which the estimates are based. Summarized below are the accounting estimates that require the more subjective judgment of our management. Suchassumptions or estimates regard the effects of matters that are inherently uncertain and for which changes inconditions may significantly affect future results.
Contract work in progressWork in progress is based on the estimates of revenues and costs over the projects’ life that are influenced by severalitems subject to valuation criteria. Contract work in progress includes extra revenues from additional works following modifications to the originalcontracts where they can be reasonably undertaken. Owing to the ever-increasing volumes generated by EPIC(Engineering, Procurement, Installation and Construction) type projects, which are intrinsically highly complex, large-scale, long-term and involve a high level of unpredictability, the periodic statements necessarily include expectedadditional revenues even before a formal agreement with the counterpart is reached.
Impairment of assetsFixed assets and intangible assets are written down whenever events and changes in circumstances indicate that thecarrying amount may not be recoverable. The amount of an impairment charge is determined by comparing the bookvalue of an asset with its recoverable amount. The recoverable amount is the greater of fair value, net of disposal costsand value in use, net of disposal costs. The estimated fair value usually is based on the present values of expected futurecash flows using assumptions commensurate with the risks involved in the asset group. The expected future cash flowsused for impairment reviews are based on judgmental assessments of future production volumes, prices and costs,considering available information at the date of review and are discounted by using a rate related to the activityinvolved.
ContingenciesSaipem accrues for contingencies primarily related to employee benefits, litigation and tax issues. Determiningappropriate amounts for accrual is a complex estimation process that includes subjective judgements.

S A I P E M F I N A N C I A L R E P O RT / R E C E N T AC C O U N T I N G P R I N C I P L E S
101
Recent accounting principles
With the regulations No. 1910/2005, 2106/2005 and 108/2006 issued between November 2005 and January 2006, theEuropean Commission approved some modifications and integrations to the international accounting standards.In particular the main modifications/integrations concern the following standards:
IAS 19 “EMPLOYEE BENEFITS”Amendments to IAS 19 essentially concern the approval of the option related to the recognition in the period whenthey incur of the total amount of actuarial gains and losses with a corresponding entry to a specific reserve inShareholders’ equity.
IAS 39 “FINANCIAL INSTRUMENTS: RECOGNITION AND MEASUREMENT”In relation to cash flow hedge operations on exchange rate risk, IAS 39 has been integrated with the aim of qualifying ashedging instruments the intercompany transactions expected and with an high probability, on condition that: (i) thesetransactions are denominated in a functional currency other than the currency of the entity that carries out theoperation; (ii) the exposure to the exchange rate risk determines some effects in consolidated income statement.Amendments to IAS 39 also concerned the recognition and measurement of financial guarantees. In particular, financialguarantees are recorded when they are issued, as liability valued at the market value and, then, in relation to theexecution risk, at the greater between: (i) the best estimate of the charge to be sustained to fulfil the obligation; (ii) theinitial amount reduced of premiums collected.
IFRS 7 “FINANCIAL INSTRUMENTS: DISCLOSURES” AND IAS 1 “PRESENTATION OF FINANCIAL STATEMENTS”IFRS 7 establishes the disclosures to be given on financial instruments and the exposure and management of financialrisks. The requirements of IFRS 7 include some disclosures currently contained in IAS 32 “Financial instruments:exposures and additional disclosures”.Also by the amendment of IAS 1, it is requested to give disclosure of objectives, policies and processes for managingcapital.
IFRIC 4 “DETERMINING WHETHER AN ARRANGEMENT CONTAINS A LEASE”Requirements of IFRIC 4 provide guidance for determining whether arrangements that do not take the legal form of alease but which convey rights to use assets in return for a payment or series of payments.In particular, for determining whether an arrangement is, or contains a lease, an entity should consider the purposes ofthe operation and verify if the arrangement: (i) provides, explicitly or implicitly, the use of an asset (or a group of assets)and the fulfilment of the arrangement depends upon such specific assets; (ii) transfers the right to use such assets.
IFRIC 5 “RIGHTS TO INTERESTS ARISING FROM DECOMMISSIONING, RESTORATION AND ENVIRONMENTAL FUNDS”Requirements of IFRIC 5 provide guidance for determining the recognition and measurement for the contribution todecommissioning, restoration and environmental rehabilitation funds that have the following features: (i) the assetsare held or administered by a separate legal entity; (ii) contributor’s right to access the assets of the fund is restricted.The contributor recognises its obligation to pay decommissioning costs as a liability and its interest in the fundseparately. In the case that the interest means a control, a joint control or a significant influence over the fund, thecontributor must recognise the interest in the fund as an investment in a subsidiary, associate, or a joint venture.
Modifications and integrations to international accounting principles are effective starting from 1st January 2006 andfrom 31st January 2007 for IFRS 7.Saipem is currently analyzing these recent accounting principles and evaluating if their adoption will have a significanteffect on the consolidated financial statements.

S A I P E M F I N A N C I A L R E P O RT / C O N S O L I DAT I O N A R E A
102
Consolidation area
CONSOLIDATING COMPANYSaipem SpA S. Donato Mil.se (MI) EUR 441,410,900 Eni SpA 42.91
Saipem SpA 0.77Third parties 56.32
CONTROLLED COMPANIESItalyBos Italia Srl Milan EUR 10,000 Saipem sa 100.00 100.00 F.C.Consorzio SaiTre (**) S. Donato Mil.se (MI) EUR 51,646 Saipem SpA 51.00 Co.
Third parties 49.00Consorzio Sapro San Giovanni Teatino (CH) EUR 10,329 Saipem SpA 51.00 Co.
Third parties 49.00Energy Maintenance Services SpA S. Donato Mil.se (MI) EUR 9,020,216 Saipem SpA 50.00 50.00 F.C.
Eni SpA 50.00Intermare Sarda SpA Tortolì (NU) EUR 6,708,000 Saipem SpA 100.00 100.00 F.C.Saipem Energy International SpA S. Donato Mil.se (MI) EUR 2,550,000 Saipem SpA 100.00 100.00 F.C.Saipem FPSO SpA (ex Sonsub SpA) S. Donato Mil.se (MI) EUR 884,000 Saipem SpA 100.00 100.00 F.C.AbroadBoscongo sa Pointe Noire (Congo) XAF 200,000,000 Saipem sa 99.98 100.00 F.C.
Third parties 0.02Bos Investment Limited London (UK) GBP 5,000,000 Saipem sa 100.00 100.00 F.C.Bos-Uie Limited London (UK) GBP 3,300,000 Bos Investment Limited 100.00 100.00 F.C.Camom Gesellschaft fur Instandhaltung und Montagen Gmbh Frankfurt (Germany) EUR 25,565 Saipem sa 95.00 100.00 F.C.
Camom sa 5.00Camom Industrie Instandhaltung GmbH e CoKg (**) Spergau (Germany) EUR 25,565 Camom Gesellschaft fur Instandhaltung
und Montagen Gmbh 100.00 Co.Camom Industrie Instandhaltung Verwaltungs GmbH (**) Spergau (Germany) EUR 25,565 Camom Gesellschaft fur
Instandhaltung und Montagen Gmbh 100.00 Co.Camom sa Montigny le Bretonneux (France) EUR 2,897,500 Saipem sa 100.00 100.00 F.C.Camom Turbines Services sa (ex Canalisations, Tuyauteries Soudées sa) Montigny le Bretonneux (France) EUR 915,000 Camom sa 99.98 100.00 E.M.
Third parties 0.02Conception Maintenance Petrochimique de l’Ouest (***) S. Vigor d’ Ymonville (France) EUR 305,000 Camom sa 99.97 E.M.
Third parties 0.03Delong Hersent - Estudos, Construções Maritimas e Partecipações, Unipessoal Lda Funchal (Portugal) EUR 5,000 Saipem sa 100.00 100.00 F.C.Entreprise Nouvelle Marcellin sa Marseille (France) EUR 1,018,700 Saipem sa 100.00 100.00 F.C.ER SAI Caspian Contractor Llc Almaty (Kazakhstan) KZT 1,105,930,000 Saipem International BV 50.00 50.00 F.C.
Third parties 50.00ERS Equipment Rental & Services BV Amsterdam (Netherlands) EUR 90,760 Saipem International BV 100.00 100.00 F.C.European Marine Contractors Ltd London (UK) GBP 1,000,000 European Marine Investments Limited 50.00 100.00 F.C.
Saipem UK Ltd 50.00European Marine Investments Limited London (UK) USD 20,000,000 Saipem International BV 100.00 100.00 F.C.European Maritime Commerce BV Amsterdam (Netherlands) EUR 18,000 ERS Equipment Rental & Services BV 100.00 100.00 F.C.Global PetroProjects Services AG Zurich (Switzerland) CHF 5,000,000 Saipem International BV 100.00 100.00 F.C.Guangdong Contractor Snc Montigny le Bretonneux (France) EUR 1,000 Entreprise Nouvelle Marcellin sa 60.00 60.00 P.C.
Third parties 40.00Hazira Cryogenic Engineering & Construction Management Pvt Ltd Mumbai (India) INR 100,000 Services et Equipements Gaziers
et Petroliers sa 55.00 55.00 F.C.Third parties 45.00
Hazira Marine Engineering & Construction Management Pvt Ltd Mumbai (India) INR 100,000 Saipem sa 99.99 100.00 F.C.Sofresid sa 0.01
Katran-k Limited Liability Company Krasnodar (Russian Federation) RUB 1,603,800 Saipem International BV 100.00 100.00 F.C.Moss Maritime A/S Lysaker (Norway) NOK 110,000,000 Saipem International BV 100.00 100.00 F.C.Moss Maritime Inc Houston (USA) USD 145,000 Moss Maritime A/S 100.00 100.00 F.C.Moss Offshore A/S Lysaker (Norway) NOK 40,000,000 Moss Maritime A/S 100.00 100.00 F.C.
(*) M
etod
of
cons
olid
atio
n or
eval
uatio
n cr
iteria
Saip
em’s
’co
nsol
idat
ion
(%)
% he
ld
Shar
ehol
ders
Shar
e ca
pita
l
Curr
ency
Regi
ster
edof
fice
Com
pany

S A I P E M F I N A N C I A L R E P O RT / C O N S O L I DAT I O N A R E A
103
Moss Arctic Offshore A/S Lysaker (Norway) NOK 100,000 Moss Maritime A/S 100.00 100.00 F.C.Nigerian Services & Supply Company Limited Lagos (Nigeria) NGN 40,000,000 Saipem sa 100.00 100.00 F.C.Petrex SA Iquitos (Peru) PEN 37,319,045 Saipem International BV 100.00 100.00 F.C.Petromar Lda Luanda (Angola) USD 357,143 Delong Hersent - Estudos, Construcoes
Maritimas e Partecipacoes, Unipessoal Lda 70.00 70.00 F.C.Third parties 30.00
PT Saipem Indonesia Jakarta (Indonesia) USD 29,000,000 Saipem International BV 100.00 100.00 F.C.PT Sofresid Engineering (ex PT Sofresid Indonesia Ll) Jakarta (Indonesia) IDR 3,016,000,000 Sofresid sa 99.90 100.00 F.C.
Sofresid Engineering 0.10Saibos Akogep Snc Montigny le Bretonneux (France) EUR 39,000 Saibos sas 70.00 70.00 P.C.
Third parties 30.00Saibos Construções Maritimas Lda Funchal (Portugal) EUR 27,551,052 Saipem sa 100.00 100.00 F.C.Saibos FZE Dubai (United Arab Emirates) AED 1,000,000 Saibos Construções Maritimas Lda 100.00 100.00 F.C.Saibos sas Montigny le Bretonneux (France) EUR 5,038,173 Saipem sa 100.00 100.00 F.C.Saigut SA de Cv Ensenada (Mexico) MXN 50,000 Saimexicana SA de Cv 80.00 F.C.
Third parties 20.00Saimexicana SA de Cv Mexico City (Mexico) MXN 50,000 Saipem sa 100.00 100.00 F.C.Saipem (Malaysia) Sdn Bhd Kuala Lumpur (Malaysia) MYR 1,033,500 Saipem International BV 41.94 100.00 F.C.
Third parties 58.06Saipem (Nigeria) Ltd Lagos (Nigeria) NGN 259,200,000 Saipem International BV 89.41 89.41 F.C.
Third parties 10.59Saipem (Portugal) Comércio Marítimo Lda Funchal (Portugal) EUR 299,278,738 Saipem (Portugal) Gestão de
Participações SGPS SA 100.00 100.00 F.C.Saipem (Portugal) Gestão de Participações SGPS SA Funchal (Portugal) EUR 49,900,000 Saipem International BV 100.00 100.00 F.C.Saipem America Inc (ex Sonsub Inc) Wilmington (USA) USD 50,000,000 Saipem International BV 100.00 100.00 F.C.Saipem Argentina Samicy F (***) Buenos Aires (Argentina) ARS 150,000 Saipem International BV 98.77 E.M.
Third parties 1.23Saipem Asia Sdn Bhd Kuala Lumpur (Malaysia) MYR 8,116,500 Saipem International BV 100.00 100.00 F.C.Saipem Australia Pty Ltd (***) Sydney (Australia) AUD 10,661,000 Saipem International BV 100.00 E.M.Saipem Contracting (Nigeria) Ltd Lagos (Nigeria) NGN 827,000,000 Saipem International BV 97.94 97.94 F.C.
Third parties 2.06Saipem Contracting Algerie SpA Hassi Messaoud (Algeria) DZD 10,000,000 Sofresid sa 99.94 100.00 F.C.
Saipem sa 0.01Third parties 0.05
Saipem do Brasil Serviços de Petroleo Ltda Rio de Janeiro (Brazil) BRL 10,502,327 Saipem FPSO SpA (ex Sonsub SpA) 100.00 100.00 F.C.Saipem Energy International Ltd (**) New Malden (UK) GBP 6,000,000 Saipem UK Ltd 100.00 E.M.Saipem Holding France sas Montigny le Bretonneux (France) EUR 40,000 Saipem International BV 100.00 100.00 F.C.Saipem India Project Services Limited Chennai (India) INR 2,000,000 Saipem sa 100.00 100.00 F.C.Saipem International BV Amsterdam (Netherlands) EUR 172,444,000 Saipem SpA 100.00 100.00 F.C.Saipem Logistics Services Limited (***) Lagos (Nigeria) NGN 55,000,000 Saipem International BV 100.00 E.M.Saipem Luxembourg SA Luxembourg (Luxembourg) EUR 31,002 Saipem (Portugal) Gestão de
Participações SGPS SA 100.00 100.00 F.C.Saipem Mediterranean Services Llc Rijeka (Croatia) HRK 1,500,000 Saipem International BV 100.00 100.00 F.C.Saipem Perfurações e Construções Petrolíferas América do Sul Lda Funchal (Portugal) EUR 224,459 Saipem (Portugal) Gestão de
Participações SGPS SA 100.00 100.00 F.C.Saipem sa Montigny le Bretonneux (France) EUR 26,488,95 Saipem SpA 100.00 100.00 F.C.Saipem Services México SA de Cv Mexico City (Mexico) MXN 50,000 Saimexicana SA de Cv 100.00 100.00 F.C.Saipem Services sa Bruxelles (Belgium) EUR 61,500 Saipem International BV 99.98 100.00 F.C.
ERS Equipment Rental & Services BV 0.02Saipem Singapore Pte Ltd Singapore (Singapore) SGD 25,000 Saipem sa 100.00 100.00 F.C.
(*) M
etod
of
cons
olid
atio
n or
eval
uatio
n cr
iteria
Saip
em’s
’co
nsol
idat
ion
(%)
% he
ld
Shar
ehol
ders
Shar
e ca
pita
l
Curr
ency
Regi
ster
edof
fice
Com
pany

S A I P E M F I N A N C I A L R E P O RT / C O N S O L I DAT I O N A R E A
104
Saipem UK Ltd New Malden (UK) GBP 6,470,000 Saipem International BV 100.00 100.00 F.C.Saipem Venezuela sa Caracas (Venezuela) VEB 20,000,000 Saipem sa 99.95 Co.
Third parties 0.05SAIR Construções Mecanicas de Estruturas Maritimas Lda Funchal (Portugal) EUR 5,000 Saipem (Portugal) Gestão de
Participações SGPS SA 86.00 86.00 F.C.Third parties 14.00
SAS Port de Tanger Société par Actions Simplifiée Unipersonelle Montigny le Bretonneux (France) EUR 37,000 Saipem sa 100.00 100.00 F.C.SASP Offshore Engineering UK Ltd (**) New Malden (UK) GBP 500,000 Saipem Energy International Ltd 100.00 E.M.Saudi Arabian Saipem Ltd Al-Khobar (Saudi Arabia) SAR 5,000,000 Saipem International BV 60.00 100.00 F.C.
Third parties 40.00SB Construction and Maritime Services BV Amsterdam (Netherlands) EUR 18,152 ERS Equipment Rental & Services BV 50.00 100.00 F.C.
Entreprise Nouvelle Marcellin sa 50.00Services et Equipements Gaziers et Petroliers sa Donges (France) EUR 38,125 Saipem sa 99.76 100.00 F.C.
Third parties 0.24Shipping and Maritime Services Limited Lagos (Nigeria) NGN 13,000,000 ERS Equipment Rental & Services BV 100.00 E.M.SNC Saipem - Bouygues TP Monaco (Principality of Monaco) EUR 10,000 Saipem sa 70.00 70.00 P.C.
Third parties 30.00Société de Construction d’ Oleoducs Snc Donges (France EUR 39,000 Services et Equipements Gaziers
et Petroliers sa 99.90 100.00 F.C.Camom sa 0.10
Société Nouvelle Technigaz sa Montigny le Bretonneux (France) EUR 228,750 Saipem sa 99.96 100.00 F.C.Third parties 0.04
Sofresid Engineering Montigny le Bretonneux (France) EUR 1,267,142 Sofresid sa 99.99 100.00 F.C.Third parties 0.01
Sofresid sa Montigny le Bretonneux (France) EUR 8,253,840 Saipem sa 100.00 100.00 F.C.Sonsub A/S Randaberg (Norway) NOK 1,882,000 Saipem International BV 100.00 100.00 F.C.Sonsub Ltd Aberdeen (UK) GBP 5,901,028 Saipem International BV 100.00 100.00 F.C.Sonsub International Pty Ltd Sydney (Australia) AUD 13,157,570 Saipem International BV 100.00 100.00 F.C.Star Gulf Free Zone Company Dubai (United Arab Emirates) AED 500,000 Saipem International BV 80.00 100.00 F.C.
Saipem (Portugal) Gestão deParticipações SGPS SA 20.00
STTS Snc Montigny le Bretonneux (France) EUR 1,000 Saipem sa 57.00 60.00 P.C.Société Nouvelle Technigaz sa 3.00Third parties 40.00
Sud Est Cie Aix en Provence (France) EUR 152,704 Sofresid sa 99.62 Co.Third parties 0.38
TBE Ltd Damietta (Egypt) EGP 50,000 Société Nouvelle Technigaz sa 70.00 70.00 F.C.Third parties 30.00
(*) M
etod
of
cons
olid
atio
n or
eval
uatio
n cr
iteria
Saip
em’s
’co
nsol
idat
ion
(%)
% he
ld
Shar
ehol
ders
Shar
e ca
pita
l
Curr
ency
Regi
ster
edof
fice
Com
pany

S A I P E M F I N A N C I A L R E P O RT / C O N S O L I DAT I O N A R E A
105
ASSOCIATED COMPANIESItalyConsorzio Saipem Energy International – Tecnomare SpA S. Giuliano Mil.se (MI) EUR 10,000 Saipem Energy International SpA 50.00 50.00 P.C.
Tecnomare 50.00Consorzio USG (**) Parma EUR 25,823 Saipem SpA 40.00 Co.
Third parties 60.00Rosbos Scrl (**) Ravenna EUR 10,400 Saipem sa 50.00 E.M.
Third parties 50.00Rosfin Srl Ravenna EUR 9,649,200 Saipem sa 33.33 Co.
Third parties 66.67AbroadAfrica Oil Services sa Guyancourt (France) EUR 37,500 Services et Equipements Gaziers
et Petroliers sa 44.88 E.M.Third parties 55.12
Ateliers Ferroviaires D’artix sas Artix (France) EUR 80,000 Camon sa 49.48 Co.Third parties 50.52
Barber Moss Ship Management A/S Lysaker (Norway) NOK 1,000,000 Moss Maritime A/S 50.00 E.M.Third parties 50.00
Bos Shelf Limited Society Baku City (Azerbaijan) AZM 10,000,000 Star Gulf Free Zone Company 50.00 50.00 P.C.Third parties 50.00
Dalia Floater Angola Snc Coubervoie (France) EUR 0,1 Entreprise Nouvelle Marcellin sa 27.50 27.50 P.C.Third parties 72.50
Doris Development Canada Ltd St. John’s (Canada) CAD 10,000 Doris Engineering sa 100.00 Co.Doris Engineering sa Paris (France) EUR 3,571,440 Sofresid sa 40.00 E.M.
Third parties 60.00Doris Usa Inc Houston (USA) USD 1,500,000 Doris Engineering sa 100.00 E.M.FPSO Firenze Produção de Petroleo, Lda Funchal (Portugal) EUR 50,000 Saipem (Portugal) Gestão de
Participações SGPS SA 50.00 50.00 P.C.Third parties 50.00
FPSO Mystras (Nigeria) Ltd Lagos (Nigeria) NGN 15,000,000 FPSO Mystras Produçãode Petroleo Lda 100.00 50.00 P.C.
FPSO Mystras Produção de Petroleo, Lda Funchal (Portugal) EUR 50,000 Saipem (Portugal) Gestão deParticipações SGPS SA 50.00 50.00 P.C.Third parties 50.00
Gaztransport Et Technigaz sas Saint Remy Les Chevreuse (France) EUR 370,288 Société Nouvelle Technigaz sa 22.22 E.M.Saipem sa 7.78Third parties 70.00
Kazakhoil Bouygues Offshore Sarl Almaty (Kazakhstan) KZT 1,000,000 Saipem sa 50.00 Co.Third parties 50.00
Kwanda Suporto Logistico Lda Luanda (Angola) AOR 25,510,204 Delong Hersent - Estudos, ConstruçõesMaritimas e Participações, Unipessoal Lda 40.00 E.M.Third parties 60.00
Lipardiz – Construção de Estruturas Maritimas, Unipessoal Lda Funchal (Portugal) EUR 5,000 Saipem (Portugal) Gestão deParticipações SGPS SA 50.00 50.00 P.C.Third parties 50.00
Mipact - Consultores e Servicos Lda Funchal (Portugal) EUR 5,000 Saipem (Portugal) Gestão deParticipações SGPS SA 50.00 E.M.Third parties 50.00
Moss Krylov Maritime St. Petersburg (Russian Federation) RUB 98,000 Moss Maritime A/S 50.00 E.M.Third parties 50.00
Offshore Design Engineering Ltd London (UK) GBP 100,000 Saipem sa 50.00 50.00 P.C.Doris Engineering 50.00
(*) M
etod
of
cons
olid
atio
n or
eval
uatio
n cr
iteria
Saip
em’s
’co
nsol
idat
ion
(%)
% he
ld
Shar
ehol
ders
Shar
e ca
pita
l
Curr
ency
Regi
ster
edof
fice
Com
pany

S A I P E M F I N A N C I A L R E P O RT / C O N S O L I DAT I O N A R E A
106
PMS - Petrochemicals Maintenance Services Gmbh Leuna (Germany) EUR 200,000 Camom Gesellschaft fur Instandhaltungund Montagen Gmbh 25.00 E.M.Third parties 75.00
Saipar Drilling Company BV Amsterdam (Netherlands) EUR 20,000 Saipem International BV 50.00 50.00 P.C.Third parties 50.00
Saipem Aban Drilling Co Pvt Ltd Chennai (India) INR 50,000,000 Saipem International BV 50.00 50.00 P.C.Third parties 50.00
SEA Tank Co sa Paris (France) EUR 46,800 Doris Engineering sa 99.62 Co.Third parties 0.38
Servicios de Construçiones Caucedo sa Dominican Republic (Dominican Rep.) DOP 100,000 Saipem sa 49.70 49.70 P.C.Third parties 50.30
Société pour la Realisation du Port de Tanger Mediterranée Anjra (Morocco) EUR 33,000 SAS Port de Tanger Société par ActionsSimplifiée Unipersonelle 33.33 33.33 P.C.Third parties 66.67
SSS – Capital Limited Liability Company Moscow (Russian Federation) RUB 100,000 Starstroi – Security sarl 99.00 E.M.Third parties 1.00
Starstroi Limited Liability Company Krasnodar (Russian Federation) RUB 7,699,490 Saipem sa 50.00 50.00 P.C.Third parties 50.00
Starstroi – Security sarl Krasnodar (Russian Federation) RUB 300,000 Starstroi Limited Liability Company 100.00 E.M.Starstroi – Sakhalin – Bezopasnost sarl Yuzhno (Russian Federation) RUB 300,000 Starstroi – Security sarl 100.00 E.M.Tchad Cameroon Maintenance BV Schiedam (Netherlands) EUR 18,000 Saipem sa 40.00 E.M.
Third parties 60.00Technip - Zachry - Saipem LNG LP Houston (USA) USD 5,000 TZS, LLC (NV) 99.00 20.00 P.C.
5,000 TZS, LLC (TX) 1.00Tecnoprojecto Internacional Projectos e Realizações Industriais sa Linda a Velha Oeiras (Portugal) EUR 700,000 Saipem sa 42.50 E.M.
Third parties 57.50Tss Dalia Snc Courbervoie (France) EUR 0,1 Saipem sa 27.50 27.50 P.C.
Third parties 72.50TZS, LLC (NV) Rino (USA) USD 10,000 Saipem America Inc 20.00 20.00 P.C.
Third parties 80.00TZS, LLC (TX) San Antonio (USA) USD 5,000 Saipem America Inc 20.00 20.00 P.C.
Third parties 80.00Upstream Constructors International FZCO Jebel Ali (United Arab Emirates) AED 600,000 Saibos Construções Maritimas Lda 50.00 50.00 P.C.
Third parties 50.00
(*) F.C. = full consolidation, P.C. = proportionate consolidation; E.M.= equity method; Co. = cost method(**) in liquidation(***) inactive throughout the year
(*) M
etod
of
cons
olid
atio
n or
eval
uatio
n cr
iteria
Saip
em’s
’co
nsol
idat
ion
(%)
% he
ld
Shar
ehol
ders
Shar
e ca
pita
l
Curr
ency
Regi
ster
edof
fice
Com
pany
The Saipem Group comprises 126 companies: 69 are consolidated using the full consolidation method, 22 the proportionateconsolidation method; 23 the equity method and 12 the cost method.
S A I P E M F I N A N C I A L R E P O RT / C O N S O L I DAT I O N A R E A
107
Variations to the consolidation area
Variations to the consolidation area, with respect to the consolidated financial statements at 31st December 2004, aredetailed hereunder in date order:
New incorporations, disposals, liquidations and changes to the consolidation method:- on 25th January 2005 the company Sonsub Asia Sdn Bhd, consolidated using the equity method, was delisted from
the Register of Companies;- on 3rd February 2005, the company Société de Pose de Pipelines Snc consolidated using the cost method, was
delisted from the Register of Companies;- on 11th March 2005, the Russian company SSS – Capital Limited Liability Company was incorporated and is
consolidated using the equity method;- on 15th March 2005, the company Petrosupport sas consolidated using the cost method, was delisted from the
Register of Companies;- on 19th April 2005, the company Camom Industrie Instandhaltung GmbH e Co.Kg. consolidated using the cost
method, was put into liquidation;- on 10th May 2005, the company Camom Industrie Instandhaltung Verwaltungs GmbH consolidated using the cost
method, was put into liquidation;- on 30th June 2005, the Mexican company Saigut SA de Cv was incorporated and is consolidated using the full
consolidation method;- on 25th July 2005, the company Société d’Etudes d’Oleoducs Snc consolidated using the equity method, was
delisted from the Register of Companies;- on 3rd August 2005, 50% of the share capital in Mipact – Consultores e Servicos Lda was acquired from third parties;
the company is consolidated using the equity method;- on 29th August 2005, the Mexican company Saipem Services México SA de CV, 100% owned by Saimexicana SA de
CV is consolidated using the full consolidation method; - on 2nd September 2005, the Monaco based SNC Saipem – Bouygues TP, 70% of which is owned by, is consolidated
using the proportional method;- on 30th September 2005, the company Eurig GmbH, which had been put into liquidation, was sold to third parties;- on 30th September 2005, the company Eurig GmbH & Co Kg, which had been put into liquidation, was sold to third
parties;- on 19th October 2005, the company Saimexicana SA de CV previously consolidated using the cost method, is
consolidated using the full consolidation method, since it has reached relevant size;- on 7th November 2005, the Nigerian company Shipping and Maritime Services Limited, 100% owned by ERS
Equipment Rental & Services BV, is consolidated using the equity method;- on 1st December 2005, 20% of the share capital in the company TZS, LLC (NV) was acquired from third parties. The
company is consolidated using the proportional method;- on 1st December 2005, 20% of the share capital in the company TZS, LLC (TX) was acquired from third parties. The
company is consolidated using the proportional method;- on 7th December 2005, 100% of the share capital in the company Technip – Zachry – Saipem LNG LP was acquired
from TZS, LLC (NV) and TZS, (TX). The company is consolidated using the proportional method;- on 15th December 2005, the company Csmi Snc, consolidated using the bet equity method, was delisted from the
Register of Companies;- on 31st December 2005, the company Camom Turbines Services sa (ex Canalisations, Tuyauteries Soudées sa),
previously consolidated using the full consolidation method, was consolidated using the equity method andsimultaneously it was put into liquidation due to the cessation of operational activities;
- on 31st December 2005, the company Saipem Singapore Pte Ltd, previously consolidated using the equity method,was consolidated using the full consolidation method, since it has reached relevant size;
- on 31st December 2005, the company Rosfin Srl, previously consolidated using the equity method, was consolidatedusing the cost method.
Change of company names or transfer of holdings between group companies, not affecting the consolidation area: - on 4th February 2005, the company Sonsub SpA changed its name to Saipem FPSO SpA;

S A I P E M F I N A N C I A L R E P O RT / C O N S O L I DAT I O N A R E A
108
- on 25th February 2005, the company Pt Sofresid Indonesia LI changed its name to Pt Sofresid Engineering;- on 7th March 2005, the company Delong Corporation was merged into the company Saipem Inc;- on 11th March 2005, the company Saipem Inc was merged into the company Sonsub Inc and the latter,
simultaneously, changed its name to Saipem America Inc;- on 15th April 2005, the company Canalisation, Tuyauteries Soudees changed its name to Camom Turbines Services sa;- on 15th June 2005, the company Ateliers Ferroviaires D’artix changed its name to Ateliers Ferroviaires D’artix sas;- on 22nd June 2005, the company European Marine Investments Limited, consolidated using the full consolidation
method, sold 25% of its stake in Saipem U.K. to Saipem International BV, which, at 30th June 2005, owns it 100%.- on 4th July 2005, the company PT Bos Indonesia, owned by Saipem sa was acquired by Saipem International BV and,
on 27th October 2005, it was merged into PT Saipem Indonesia;- on 5th September 2005, the company Saipem do Brasil Serviços de Petroleo Ltda, owned by Saipem International
BV, was transferred to Saipem FPSO SpA;- on 23rd September 2005, the company Saibos Construções Maritimas Lda acquired 50% of its own shares from
Saipem sa and consequently reduced its share capital;- on 23rd December 2005, the company Star Gulf Free Zone Company, of which 60% is owned by Saipem sa and 40% by
Sofresid sa, was acquired by Saipem International BV (80%) and Saipem (Portugal) Gestão de Participações SGPS SA(20%).
Information required by IAS 31 relating to the financial data of jointly controlled entities consolidated using theproportional method is provided under note 39.
Reference dateThe reference date for the consolidated financial statements coincides with the closing date for the statutory financialstatements of Saipem SpA and companies included in the consolidation area, based on the financial statements thatconcur to the preparation of the Group consolidated financial statements.
Variation of functional currencyThe companies FPSO Firenze Producao de Petroleo Lda and Saibos Construcoes Maritimas Lda changed their functionalcurrency from US dollars to euros from 1st January 2005.

109
Notes to the consolidated financial statements
S A I P E M F I N A N C I A L R E P O RT

S A I P E M F I N A N C I A L R E P O RT / N O T E S TO T H E C O N S O L I DAT E D F I N A N C I A L S TAT E M E N T S
110
Notes to the consolidated financial statements
Current activities
Cash and cash equivalent
Cash and cash equivalent amounted to 877 million euros (595 million euros at 31st December 2004), an increase of 282million euros versus the previous year following amounts received towards the end of the year, which could not beutilised in repayment of related debts.Cash and equivalent at year-end, 69% of which are denominated in euros, 25% in US dollars and 6% in other currencies,received an average interest rate of 2.21%; 544 million euros thereof are on deposit at Eni Group financial companies.Cash and cash equivalent do not include financial receivables due within 90 days.The breakdown of cash and equivalents of Saipem and other Group companies at 31st December 2005 by geographicalarea (based on the country of domicile of the relevant company) is as follows:
(million €)
Italy 271
Rest of Europe 413
CSI 10
Rest of Asia 96
Africa 16
Americas 71
Total 877
Other financial assets for trading or available for sale
(million €)
Treasury shares 22 – – – – (22) –
This caption, which amounted to 22 million euros at 31st December 2004, refers to treasury shares bought back bySaipem SpA on the open market for allocation to the stock grant and stock option plans aimed at Saipem’s executivemanagers. At 1st January 2005, the total amount determined a decrease in the Shareholders’ equity in compliance with IAS 39. At31st December 2005, the sum determining a decrease in the Shareholders’ equity amounted to 51 million euros. Thevalue of other financial assets is immaterial.
Trade and other receivables
Trade and other receivables of 1,523 million euros (1,292 million at 31st December 2004) consist of the following:(million €)
31.12.2004 31.12.2005
Trade receivables 1,072 1,265
Financing receivables 5 17
Other receivables 215 241
Total 1,292 1,523
3
Valu
e at
31.1
2.20
05
Oth
erva
riat
ions
Exch
ange
rate
diffe
renc
es
Effe
ct o
f fai
rva
lue
valu
atio
n
Sale
s
Incr
ease
s
Valu
e at
31.1
2.20
04
2
1

S A I P E M F I N A N C I A L R E P O RT / N O T E S TO T H E C O N S O L I DAT E D F I N A N C I A L S TAT E M E N T S
111
Receivables are recorded net of the allowance for doubtful accounts of 56 million euros (60 million at 31st December2004):
(million €)
Trade receivables 48 1 (9) – 40
Other receivables 12 4 (1) 1 16
Total 60 5 (10) 1 56
Receivables amounted to 1,265 million euros, an increase of 193 million euros and comprise receivables of a tradingnature only. Trade receivables concern advances paid as a guarantee of contract work in progress for 4 million euros (at31st December 2004 these amounted to 20 million euros and were posted in non-current activities as they were to duebe received after one year).Receivables from Eni Corporate and Divisions amounted to 72 million euros (52 million euros at 31st December 2004),an increase of 20 million euros, due mostly to increased activities carried out on behalf of Eni Exploration & Production(16 million euros).
Receivables from other Eni Group companies amounted to 231 million euros (197 million euros at 31st December2004).Receivables from jointly controlled companies, with regard to the non-consolidated portion, are as follows:
(million €)
31.12.2004 31.12.2005
Lipardiz – Construção de Estruturas Maritimas, Unipessoal Lda 4 9
FPSO Mystras Produção de Petróleo Lda 1 –
Saipar Drilling Co. BV 1 –
Total 6 9
Financial receivables of 17 million euros (5 million euros at 31st December 2004) comprise mainly of receivables madefor non-operating purposes, of Saipem SpA towards the consortium Cepav Due (10 million euros) and financialreceivables of a foreign Group subsidiary.
Other receivables of 241 million euros (215 million euros at 31st December 2004) consist of the following:(million €)
31.12.2004 31.12.2005
Receivables from:
- insurance companies 19 28
- employees 12 16
- foreign financial management other than tax receivables 4 9
- national insurance/social security contributions 4 6
- Italian governmental entities 9 1
- consultants and professionals 5 –
- Italian financial management other than tax receivables 1 –
Pre-payments for services 85 84
Receivables from JVs 31 63
Guarantee deposits 4 4
Current bills – 8
Other receivables 41 22
Total 215 241
Other receivables include 2 million euros due from other Eni Group companies (17 million at 31st December 2004).
31.1
2.20
05
Oth
erva
riat
ions
Uti
lizat
ions
Incr
ease
s
31.1
2.20
04

S A I P E M F I N A N C I A L R E P O RT / N O T E S TO T H E C O N S O L I DAT E D F I N A N C I A L S TAT E M E N T S
112
Receivables in currencies other than euros amounted to 1,055 million euros and their breakdown per currency is asfollows:- US Dollars 67% - British Pounds Sterling 7% - Norwegian Kroner 3%- Other currencies 23%
Receivables from related parties are provided in note 39.
Inventories
Inventories of 490 million euros (388 million euros at 31st December 2004) consist of the following:
(million €)
31.12.2004 31.12.2005
Raw and auxiliary materials and consumables – 145 145 – 186 186
Work in progress on long term contracts 243 – 243 304 – 304
Total 243 145 388 304 186 490
Inventories are net of the valuation allowance of 3 million euros (10 million euros at 31st December 2004):
(million €)
Inventories valuation allowance 10 – (5) (2) 3
Total 10 – (5) (2) 3
Utilizations refer to the disposal of warehouse and are stated at their fair value.Work in progress on long term contracts, amounting to 304 million euros (243 million euros at 31st December 2004)includes sums associated with requests for payments not yet formally accepted by clients, but whose recovery isdeemed likely, and reasonably ascertained.Work in progress for Eni Group companies amounted to 43 million euros (73 million euros at 31st December 2004).
31.1
2.20
05
Oth
er v
aria
tion
s
Uti
lizat
ions
Incr
ease
s
31.1
2.20
04
Tota
l
Oth
er
Wor
k in
pro
gres
son
long
term
cont
ract
s
Tota
l
Oth
er
Wor
k in
pro
gres
son
long
term
cont
ract
s
4

S A I P E M F I N A N C I A L R E P O RT / N O T E S TO T H E C O N S O L I DAT E D F I N A N C I A L S TAT E M E N T S
113
Income tax receivables
Income tax receivables of 122 million euros (102 million euros at 31st December 2004) consist of the following:(million €)
31.12.2004 31.12.2005
- Italian tax authorities: 35 41
. VAT credits 33 36
. income tax credits 2 3
. other – 2
- Foreign tax authorities 67 81
. VAT credits 41 43
. income tax credits 25 32
. other 1 6
Total 102 122
The increase in income tax receivables of 20 million euros is mainly due to the rise in taxable income and associatedtaxation resulting from increased revenues achieved by the Saipem SpA and other Group companies.Taxes are analysed in note 35.
Other assets
Other assets of 89 million euros (115 million euros at 31st December 2004) consist of the following:(million €)
31.12.2004 31.12.2005
Fair value of non-hedging derivatives – 6
Fair value of cash flow hedge derivatives – 17
Other assets 115 66
Total 115 89
At 1st January 2005, date of the first application of IAS 32 and IAS 39, the fair value of derivatives amounted to 71 millioneuros . At 31st December 2005, the fair value evaluation of derivatives amounts to 23 million euros.In-depth analysis of the fair value evaluation of derivative contracts can be found in note 16 “Other current liabilities”.Other assets at 31st December 2005 amounted to 66 million euros (115 million euros at 31st December 2004) andcomprised: costs to be incurred in future periods of 41 million euros (71 million euros at 31st December 2004);insurance premia of 15 million euros (16 million euros at 31st December 2004), costs of office leases of 3 million eurosand other pre-payments of 7 million euros (3 million and 7 million euros respectively at 31st December 2004).
Current assets towards Eni Group companies amounted to 13 million euros (15 million euros at 31st December 2004)and pertain to relations with Padana Assicurazioni SpA.
6
5

S A I P E M F I N A N C I A L R E P O RT / N O T E S TO T H E C O N S O L I DAT E D F I N A N C I A L S TAT E M E N T S
114
Non-current assets
Property, plant and equipment
Property, plant and equipment amounting to 1,903 million euros (1,712 million euros at 31st December 2004) consistof the following:
(million €)
Land 4 – – – – – – 4 4 –
Buildings 59 17 (13) – – (3) 10 70 142 72
Plant and machinery 1,560 95 (145) (3) – 3 4 1,514 3,034 1,520
Industrial and commercial equipment 40 13 (13) (2) – (4) – 34 290 256
Other assets 27 8 (11) (1) – – 1 24 81 57
Assets in progress and advances 30 54 – – – (2) (16) 66 66 –
Total 31st December 2004 1,720 187 (182) (6) – (6) (1) 1,712 3,617 1,905
Land 4 – – – – 1 – 5 5 –
Buildings 70 8 (18) – – 5 17 82 179 97
Plant and machinery 1,514 111 (132) (3) – 21 11 1,522 3,133 1,611
Industrial and commercial equipment 34 15 (24) – – 2 – 27 316 289
Other assets 24 5 (12) – – 1 – 18 77 59
Assets in progress and advances 66 210 – – – 5 (32) 249 249 –
Total 31st December 2005 1,712 349 (186) (3) – 35 (4) 1,903 3,959 2,056
Vessels employed in Offshore Construction and Offshore Drilling activities are included under the caption “Plant andmachinery”. Capital expenditure made during the year, amounting to 349 million euros (187 million euros at 31st December 2004),was mainly in the Offshore Construction sector (184 million euros), Leased FPSO (93 million euros) and OffshoreDrilling (46 million euros).In particular, main items of capital expenditure included:- the purchase of the tanker Margaux and its conversion into an FPSO unit to be called Vitoria (76 million euros) due to
execute the Golfinho 2 project in Brazilian waters;- the purchase of plant and equipment required for the execution of the Kashagan project in Kazakh waters (71 million
euros);- works aimed at the realisation of the logistical base Kuryk in Kazakhstan (38 million euros);- upgrades to the semi-submersible platform Perro Negro 5 (21 million euros).
Finance expenses for the year, calculated using an average interest rate of 5.8%, amounted to 2 million euros.
Main depreciation rates used are within the following percentage bands:
%
Property 2.50 12.50
Plant and machinery 7.00 25.00
Industrial and commercial equipment 3.75 67.00
Other assets 12.00 20.00
Prov
isio
ns fo
ram
orti
zati
onan
d w
rite
-dow
ns
Gro
ss v
alue
at t
heen
d of
the
year
Net
val
ue a
t the
end
of th
e ye
ar
Oth
er v
aria
tion
s
Exch
ange
rate
diffe
renc
es
Vari
atio
n to
the
cons
olid
atio
n ar
ea
Dis
posa
ls
Dep
reci
atio
n
Inve
stm
ents
Net
val
ue a
t the
begi
nnin
g of
the
year
7

S A I P E M F I N A N C I A L R E P O RT / N O T E S TO T H E C O N S O L I DAT E D F I N A N C I A L S TAT E M E N T S
115
Exchange rate differences due to the translation of financial statements prepared in currencies other than euro of 35million euro mainly relate to companies whose functional currency is the US dollar.The gross carrying value of fully depreciated property, plant and equipment that is still in use amount to 130 millioneuros (159 million euros at 31st December 2004) and concern mainly project-specific equipment which has been fullyamortized over the life of the project.Government grants recorded as decrease of property, plant and machinery amounted to 3 million euros (3 millioneuros at 31st December 2004).The total commitment on current items of capital expenditure at 31st December 2005 amounted to 170 million euros.Fixed assets, plant and machinery are free from pledges, mortages and/or other obligations.
Finance lease International accounting standards provide that assets acquired under finance lease are recorded within the tangibleassets of the company utilising the asset at the value of the asset at the time of use, with a corresponding entry to thefinancial payable to the lessor, inclusive of the redemption price. Property, plant and equipment include assets carried under finance lease amounting to 43 million euros and refermainly to the finance lease contract for the utilisation of the semi-submersible platform Scarabeo 5.
At 31st December 2005, the value of assets carried under finance lease is as follows:(million €)
Asset under finance lease
Semi-submersible platform Scarabeo 5 44 40 9 10 3 7 3.125
Onshore drilling rigs 3 3 1 2 2 – 3.840
Total 47 43 10 12 5 7
(*) the net accounting value includes regular major inspection costs, which at 31st December 2005 amounted to 3 million euros (5 million euros at 31st December 2004),stated in compliance with the new international financial reporting standards and amortized over 5 years.
Fixed assets by business unit(million €)
31.12.2004 31.12.2005
Fixed assets, net :
- Offshore Construction 749 849
- Offshore Drilling 721 727
- Leased FPSO 65 152
- Onshore Construction 62 63
- Onshore Drilling 80 86
- LNG 7 4
- MMO 6 5
- Non Allocated 22 17
Total 1.712 1.903
Non-allocated value refers to fixed assets in use at Saipem’s offices.
Aver
age
rate
From
2 to
5ye
ars
From
1 to
2ye
ars
Resi
dual
leas
ing
char
ges a
t 31st
Dec
embe
r 200
5
Char
ges
Valu
e at
31st
Dec
embe
r 200
5 (*
)
Valu
e at
31st
Dec
embe
r 200
4 (*
)

S A I P E M F I N A N C I A L R E P O RT / N O T E S TO T H E C O N S O L I DAT E D F I N A N C I A L S TAT E M E N T S
116
Intangible assets
Intangible assets of 837 million euros (835 million euros at 31st December 2004) consist of the following:(million €)
Intangible assets with a definite life:
- Development costs 6 3 (2) – – – (1) 6 8 2
- Industrial patent rights and intellectual
property rights 12 2 (12) – – – 7 9 81 72
- Intangible assets in progress and advances 4 5 – – – – (7) 2 2 –
- Other intangible assets 1 – – – – – (1) – 19 19
Intangible assets with an indefinite life
- Goodwill 806 12 (2) – – – 2 818 818 –
Total at 31st December 2004 829 22 (16) – – – – 835 928 93
Intangible assets with a definite life:
- Development costs 6 – (1) – – – 1 6 9 3
- Industrial patent rights and intellectual
property rights 9 6 (9) – – – – 6 87 81
- Intangible assets in progress and advances 2 – – – – – – 2 2 –
- Other intangible assets – – – – – – – – 19 19
Intangible assets with an indefinite life
- Goodwill 818 7 – (3) – – 1 823 823 –
Total at 31st December 2005 835 13 (10) (3) – – 2 837 940 103
Development costs of 6 million euros pertain mainly to the implementation of software and equipment to improveultra-deep water operations (6 million euros in 2004).Industrial patent rights and intellectual property rights of 6 million euros consist mainly of costs for theimplementation and customization of SAP modules.
Main depreciation rates used are as follows:
%
- Development costs 20.00 20.00
- Industrial patent rights and intellectual property rights 6.66 7.50
- Concessions, licenses, trademarks and similar (included in “Industrial patent rights” caption) 20.00 20.00
- Other intangible assets 20.00 33.00
Goodwill of 823 million euros refers to the difference between the purchase price, inclusive of related charges, and theequity of Saipem sa (783 million euros), Sofresid sa (21 million euros), Saipem India Project System (2 million euros),the Moss Maritime Group (15 million euros) and Saipem Energy International SpA (2 million euros).
In order to determine the recoverable amount, goodwill has been allocated to the following cash generating units:(million €)
31.12.2005
- Offshore Construction 415
- Onshore Construction 162
- LNG 169
- MMO 77
Total 823
Prov
isio
n of
amor
tiza
tion
and
wri
te-d
own
Gro
ss v
alue
at
year
end
Net
val
ue a
t yea
ren
d
Oth
er v
aria
tion
s
Exch
ange
rate
diffe
renc
es
Vari
atio
n to
the
cons
olid
atio
n ar
ea
Wri
te-d
own
Dep
reci
atio
n
Inve
stm
ents
Net
val
ue a
t the
begi
nnin
g of
the
year
8
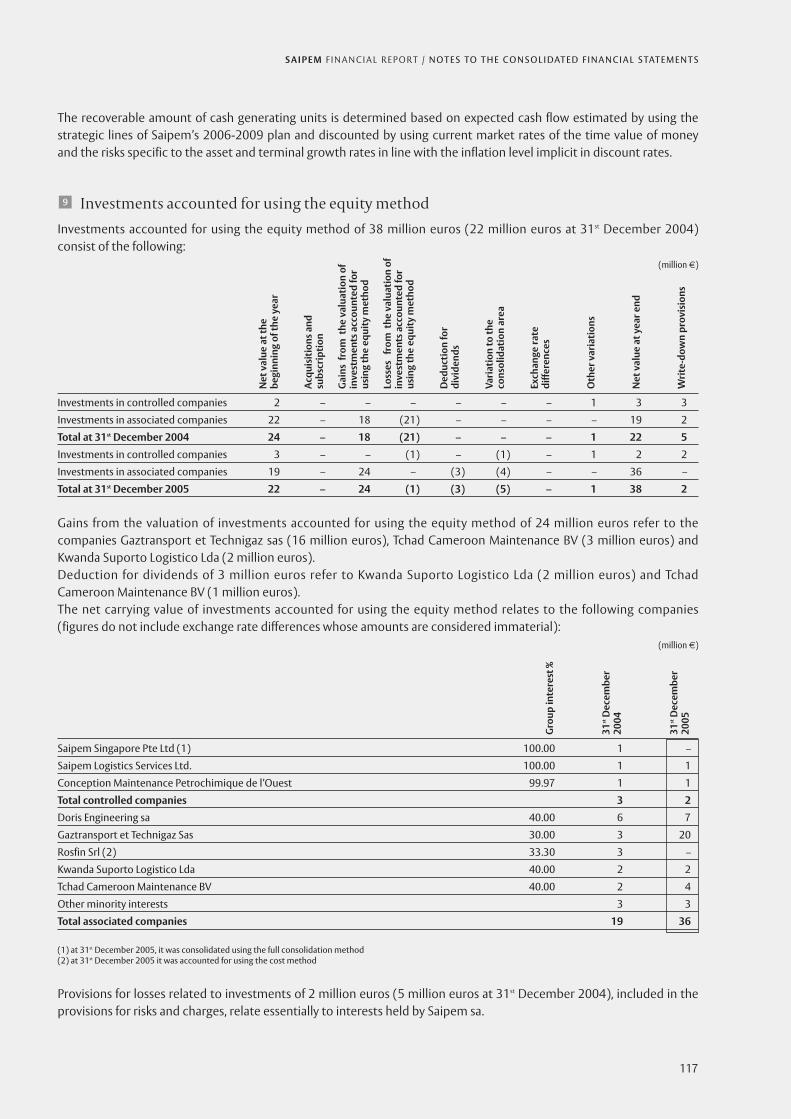
S A I P E M F I N A N C I A L R E P O RT / N O T E S TO T H E C O N S O L I DAT E D F I N A N C I A L S TAT E M E N T S
117
The recoverable amount of cash generating units is determined based on expected cash flow estimated by using thestrategic lines of Saipem’s 2006-2009 plan and discounted by using current market rates of the time value of moneyand the risks specific to the asset and terminal growth rates in line with the inflation level implicit in discount rates.
Investments accounted for using the equity method
Investments accounted for using the equity method of 38 million euros (22 million euros at 31st December 2004)consist of the following:
(million €)
Investments in controlled companies 2 – – – – – – 1 3 3
Investments in associated companies 22 – 18 (21) – – – – 19 2
Total at 31st December 2004 24 – 18 (21) – – – 1 22 5
Investments in controlled companies 3 – – (1) – (1) – 1 2 2
Investments in associated companies 19 – 24 – (3) (4) – – 36 –
Total at 31st December 2005 22 – 24 (1) (3) (5) – 1 38 2
Gains from the valuation of investments accounted for using the equity method of 24 million euros refer to thecompanies Gaztransport et Technigaz sas (16 million euros), Tchad Cameroon Maintenance BV (3 million euros) andKwanda Suporto Logistico Lda (2 million euros).Deduction for dividends of 3 million euros refer to Kwanda Suporto Logistico Lda (2 million euros) and TchadCameroon Maintenance BV (1 million euros).The net carrying value of investments accounted for using the equity method relates to the following companies(figures do not include exchange rate differences whose amounts are considered immaterial):
(million €)
Saipem Singapore Pte Ltd (1) 100.00 1 –
Saipem Logistics Services Ltd. 100.00 1 1
Conception Maintenance Petrochimique de l’Ouest 99.97 1 1
Total controlled companies 3 2
Doris Engineering sa 40.00 6 7
Gaztransport et Technigaz Sas 30.00 3 20
Rosfin Srl (2) 33.30 3 –
Kwanda Suporto Logistico Lda 40.00 2 2
Tchad Cameroon Maintenance BV 40.00 2 4
Other minority interests 3 3
Total associated companies 19 36
(1) at 31st December 2005, it was consolidated using the full consolidation method (2) at 31st December 2005 it was accounted for using the cost method
Provisions for losses related to investments of 2 million euros (5 million euros at 31st December 2004), included in theprovisions for risks and charges, relate essentially to interests held by Saipem sa.
31st
Dec
embe
r20
05
31st
Dec
embe
r20
04
Gro
up in
tere
st %
Wri
te-d
own
prov
isio
ns
Net
val
ue a
t yea
r end
Oth
er v
aria
tion
s
Exch
ange
rate
diffe
renc
es
Vari
atio
n to
the
cons
olid
atio
n ar
ea
Ded
ucti
on fo
rdi
vide
nds
Loss
es f
rom
the
val
uati
on o
fin
vest
men
ts a
ccou
nted
for
usin
g th
e eq
uity
met
hod
Gai
ns f
rom
the
val
uati
on o
fin
vest
men
ts a
ccou
nted
for
usin
g th
e eq
uity
met
hod
Acqu
isit
ions
and
subs
crip
tion
Net
val
ue a
t the
begi
nnin
g of
the
year
9
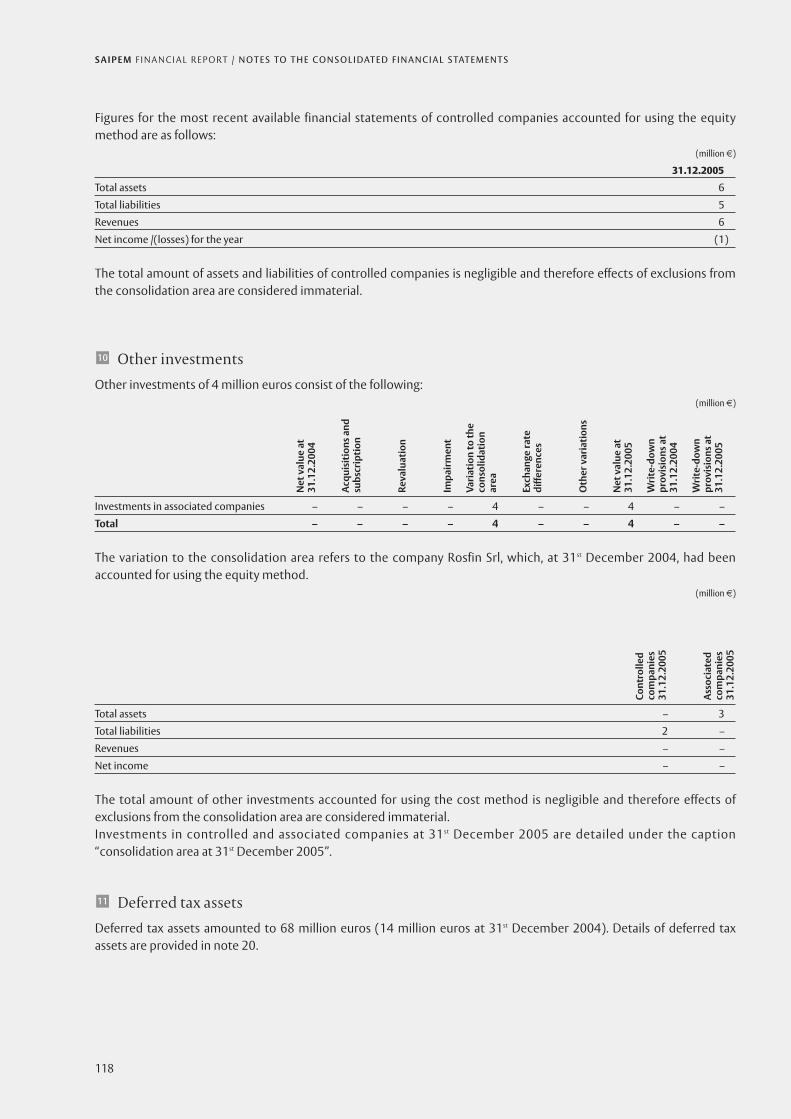
S A I P E M F I N A N C I A L R E P O RT / N O T E S TO T H E C O N S O L I DAT E D F I N A N C I A L S TAT E M E N T S
118
Figures for the most recent available financial statements of controlled companies accounted for using the equitymethod are as follows:
(million €)
31.12.2005
Total assets 6
Total liabilities 5
Revenues 6
Net income /(losses) for the year (1)
The total amount of assets and liabilities of controlled companies is negligible and therefore effects of exclusions fromthe consolidation area are considered immaterial.
Other investments
Other investments of 4 million euros consist of the following:(million €)
Investments in associated companies – – – – 4 – – 4 – –
Total – – – – 4 – – 4 – –
The variation to the consolidation area refers to the company Rosfin Srl, which, at 31st December 2004, had beenaccounted for using the equity method.
(million €)
Total assets – 3
Total liabilities 2 –
Revenues – –
Net income – –
The total amount of other investments accounted for using the cost method is negligible and therefore effects ofexclusions from the consolidation area are considered immaterial.Investments in controlled and associated companies at 31st December 2005 are detailed under the caption“consolidation area at 31st December 2005”.
Deferred tax assets
Deferred tax assets amounted to 68 million euros (14 million euros at 31st December 2004). Details of deferred taxassets are provided in note 20.
11
Asso
ciat
edco
mpa
nies
31.1
2.20
05
Cont
rolle
dco
mpa
nies
31.1
2.20
05
Wri
te-d
own
prov
isio
ns a
t31
.12.
2005
Wri
te-d
own
prov
isio
ns a
t31
.12.
2004
Net
val
ue a
t31
.12.
2005
Oth
er v
aria
tion
s
Exch
ange
rate
diffe
renc
es
Vari
atio
n to
the
cons
olid
atio
nar
ea
Impa
irm
ent
Reva
luat
ion
Acqu
isit
ions
and
subs
crip
tion
Net
val
ue a
t31
.12.
2004
10

S A I P E M F I N A N C I A L R E P O RT / N O T E S TO T H E C O N S O L I DAT E D F I N A N C I A L S TAT E M E N T S
119
Other non-current assets
Other non-current assets of 17 million euros (40 million euros at 31st December 2004) consist of the following:(million €)
31.12.2004 31.12.2005
Trade receivables 20 6
Other receivables 20 11
Total 40 17
Other non-current assets comprise trade receivables beyond the company’s normal business cycle of 6 million eurosand other receivables of 11 million euros. Trade receivables comprise advances paid as a guarantee for long-termcontracts.Other receivables refer mainly to amounts paid, in compliance with local regulations, to government bodies to be paidback after a set period (20 years) of 3 million euros; income tax credits to be received by a foreign subsidiary from thelocal tax authority of 2 million euros and receivables on bills of exchange which accrue interest at the weighted averagerate of 4.21% per annum (3 million euros).
Current liabilities
Current financial liabilities
Current financial liabilities of 1,192 million euros (902 million euros at 31st December 2004) consist of the following:(million €)
31.12.2004 31.12.2005
Banks 24 50
Other financing institutions 878 1,142
Total 902 1,192
The increase of 290 million euros is primarily due to increased financial requirements needed to implement theinvestment programme and payment of dividends by Saipem SpA. The breakdown of current financial liabilities by currency is as follows:
(million €)
31.12.2004 31.12.2005
Enifin SpA Euro 269 2.143 2.396 728 2.326 2.338
Enifin SpA US dollar 9 1.477 – 5 3.738
Serleasing SpA Euro 8 3.150 – – – –
Eni Coordination Center sa Euro 295 2.257 2.369 162 2.369 –
Eni Coordination Center sa US dollar 84 1.680 1.859 54 3.809 4.871
Eni Coordination Center sa Norwegian kroner 27 2.230 2.370 4 – 2.313
Eni Coordination Center sa Swiss franc 4 0.688 – 4 – 0.888
Eni Coordination Center sa Australian dollar 9 5.642 – 2 2.5688 –
Eni Coordination Center sa Pound sterling 15 4.568 – – – –
Eni International Bank US dollar 12 1.672 1.922 55 3.621 3.871
Eni International Bank Saudi Ryals 45 1.922 – 32 3.942 –
Third parties Euro 15 0.92 2.106 18 0.548 2.182
Third parties US dollar 72 1.912 2.672 70 3.854 4.621
Third parties Other 38 1.809 18.720 58 10.100 19.100
Total 902 1,192
Inte
rest
rate
%
to
Inte
rest
rate
%
from
Amou
nt
Inte
rest
rate
%
to
Inte
rest
rate
%
from
Amou
nt
Curr
ency
Issu
ing
enti
ty
13
12

S A I P E M F I N A N C I A L R E P O RT / N O T E S TO T H E C O N S O L I DAT E D F I N A N C I A L S TAT E M E N T S
120
At 31st December 2005, Saipem maintained unused lines of credit amounting to 720 million euros (670 million euros at31st December 2004). These agreements provide for interest charges based on prevailing market conditions.Commission fees on unused lines of credit are not significant.Current portions of long-term debt, amounting to 230 million euros (77 million euros at 31st December 2004) aredetailed in note 17 “Long-term debt and current portion of long-term debt”.
Trade and other payablesTrade and other payables of 2,005 million euros (1,836 million at 31st December 2004) consist of the following:
(million €)
31.12.2004 31.12.2005
Trade payables 1,046 1,129
Advances 626 659
Other payables 164 217
Total 1,836 2,005
Trade payables amounted to 1,129 million euros, an increase of 83 million euros, due to increased Group activities andexchange rate differences related to the translation of financial statements prepared in currencies other than euros (23million euros).Trade payables to the parent company (Eni Corporate and Divisions) amounted to 10 million euros (9 million euros at31st December 2004). Advances of 659 million euros (626 million euros at 31st December 2004) comprise mainly of adjustments to revenuesfrom long-term contracts in accordance with the accruals concept, made on the basis of the amounts contractuallymatured (402 million euros, 371 million euros at 31st December 2004) and advances received by Saipem SpA andforeign subsidiaries for contract work in progress (157 million euros).Trade payables to Eni Group companies amounted to 23 million euros (65 million euros at 31st December 2004).
Other payables of 217 million euros (164 million euros at 31st December 2004) consist of the following:(million €)
31.12.2004 31.12.2005
Payables due to:
- employees 60 73
- joint venture partners 22 38
- national insurance/social security contributions 37 42
- insurance companies 3 8
- consultants and professionals 3 2
- agents – 1
Cautionary deposits – 16
Other payables 39 37
Total 164 217
Other payables to Eni Group companies amounted to 5 million euros (13 million euros at 31st December 2004) andconsist of payables by Saipem SpA to insurance companies.Payables due to related parties are detailed in note 39.
14

S A I P E M F I N A N C I A L R E P O RT / N O T E S TO T H E C O N S O L I DAT E D F I N A N C I A L S TAT E M E N T S
121
Current tax liabilities
Current tax liabilities of 140 million euros million euros (90 million euros at 31st December 2004) consist of thefollowing:
(million €)
31.12.2004 31.12.2005
Income tax payables 33 71
Other tax liabilities 57 69
Total 90 140
Current tax liabilities amounted to 140 million euros, an increase of 50 million euros versus the previous year. Theymainly consist of amounts payable to local tax authorities for income taxes (71 million euros: 40 million to Italian taxauthorities and 31 million to foreign tax authorities), VAT (40 million euros), withholding taxes (22 million euros) andother payables (7 million euros).
Other current liabilities
Other current liabilities of 66 million euros (36 million euros at 31st December 2004) consist of the following:(million €)
31.12.2004 31.12.2005
Fair value of non-hedging derivatives – 22
Fair value of cash flow hedge derivatives – 38
Other liabilities 36 6
Total 36 66
The fair value of cash flow hedge derivatives amounted to 60 million euros and mainly related to derivatives enteredinto in order to minimize the market risk exposure arising from exchange rate fluctuations on trade transactions. At 1st
January 2005, the date of the first application of IAS 32 and IAS 39, liabilities relating to the fair value of hedgingderivatives amounted to 15 million euros.
(million €)
01.01.2005 31.12.2005
Fair value assets on derivatives 71 23
Fair value liabilities on derivatives (15) (60)
Write-down of accrued and deferred liabilities on hedges (7) (31)
Total 49 (68)
The fair value of Interest Rate Swaps is detailed in note 17 “Long-term debt and current portion of long-term debt”.Variations in the fair value of hedging contracts featured under the balance sheet item “Other reserves” amounted to(124) million euros. The fair value of hedging contracts relates mainly to future transactions due to occur within 12months. Commitments on derivatives amounted to 5,949 million euros (1,988 million euros at 31st December 2004)and concern commitments on exchange rates (5,540 million euros – fair value of -36 million euros), interest rates (400million euros – fair value of -7 million euros) and goods (9 million euros – fair value of -1 million euros).Other liabilities amounted to 6 million euros (36 million euros at 31st December 2004); and comprise mainly ofadvanced revenues of 3 million euros, grants received by Saipem SpA in the years 1999-2002 of 1 million euros andrent charges of 1 million euros (1 million euros at 31st December 2004).
16
15

S A I P E M F I N A N C I A L R E P O RT / N O T E S TO T H E C O N S O L I DAT E D F I N A N C I A L S TAT E M E N T S
122
Fair value of derivatives by type are provided in the following table:(million €)
1) Derivatives contracts not qualified for hedge accounting
Interest derivatives
- interest rate swap – 7
Currencies derivaties ( SPOT value)
- Purchase 9 6
- sell 8 32
Total 17 38
2) Derivatives contracts not qualified for hedge accounting (SPOT value)
Currencies derivaties
- Purchase 8 1
- sell 1 10
Total 9 11
3) Derivatives contracts ( FORWARD value)
Currencies derivaties
- Purchase – (2)
- sell (3) 12
Total (3) 10
4) Derivatives contracts not qualified for hedge accounting
Commodities – 1
Total 23 67
The table details the fair value of the spot and forward component of exchange rate hedging contracts, since theGroup‘s hedging policy consists in designating only the spot price of derivatives entered into (i.e. the spot to spotdifference), excluding the changes in its interest element.
Non-current liabilities
Long-term debt and current portion of long-term debt
long-term debt, inclusive of the current portion of long-term debt, amounted to 714 million euros (564 million eurosat 31st December 2004) and consist of the following:
(million €)
31.12.2004 31.12.2005
Banks 77 282 359 75 299 374
Other financing institutions – 205 205 155 185 340
Total 77 487 564 230 484 714
Tota
l
Long
-ter
mm
atur
ity
Shor
t-te
rmm
atur
ity
Tota
l
Long
-ter
mm
atur
ity
Shor
t-te
rmm
atur
ity
17Fa
ir v
alue
liab
ility
31.1
2.20
05
Fair
val
ue a
sset
s31
.12.
2005

S A I P E M F I N A N C I A L R E P O RT / N O T E S TO T H E C O N S O L I DAT E D F I N A N C I A L S TAT E M E N T S
123
Maturity dates are as follows:(million €)
Banks 2006 - 2010 359 374 75 193 31 – 75 –
Other lenders 2006 - 2011 205 340 155 47 – – – 138
Total 564 714 230 240 31 – 75 138
Long-term debt of 714 million euros, inclusive of the current portion of long-term debt, increased by 150 million euros,due mainly to the financing of the conversion of the new FPSO unit due to operate on the Golfinho project.Saipem entered into financing arrangements with San Paolo IMI SpA and Interbanca SpA amounting to 200 millioneuros (300 million euros at 31st December 2004) and 75 million euros respectively, which require to mantain certainfinancial ratios based on the Saipem’s Consolidated Financial Statements. Saipem is in compliance with the covenants contained in its financing arrangements. Breakdown of long-term debt, inclusive of the current portion of long-term debt by issuing entity, currency and averageinterest rate is as follows:
(million €)
31.12.2004 31.12.2005
Enifin SpA Euro 202 3,400 – 105 2,562 –
Serleasing SpA Euro 20 3,150 – 10 3,124 –
Eni Coordination Center sa US Dollar 8 2,046 – – – –
Eni Coordination Center sa Norwegian Kroner 3 2,370 – – – –
Third parties Euro 304 2,547 4,950 372 2,380 2,425
Third parties US Dollar 19 1,922 2,672 19 3,871 4,621
Third parties British Pound Sterling – – – 147 6,053 –
Third parties Ruble 8 10,500 – 9 10,500 –
Enifin SpA Euro – – – 7 – –
Total 564 714
There are no financial liabilities guaranteed by mortgages and liens on fixed assets of consolidated companies or bypledges on securities and fixed deposits.
The fair value of long-term debt, including the current portion of long-term debt, amounts to 651 million euros (536million euros at 31st December 2004) and was calculated by discounting future cash flows using the following rates:
% 2004 2005
Euro 2.10 – 2.59 2.49 – 3.20
US Dollar 2.58 – 3.22 4.48 – 4.87
Norwegian Kroner 1.96 – 2.50 –
British Pound Sterling – 4.57 – 4.62
Inte
rest
rate
%
to
Inte
rest
rate
%fr
om
Amou
nt
Inte
rest
rate
%
to
Inte
rest
rate
%fr
om
Amou
nt
Curr
ency
Issu
ing
enti
ty
Afte
r
2010
2009
2008
2007
2006
2005
2004
Mat
urit
y
Type

S A I P E M F I N A N C I A L R E P O RT / N O T E S TO T H E C O N S O L I DAT E D F I N A N C I A L S TAT E M E N T S
124
Detailed analysis of net financial debt as indicated under the caption “Financial and economic results” is as follows:(million €)
31.12.2004 31.12.2005
Short-term financial liabilities 979 – 979 1,420 – 1,420
Long-term financial liabilities – 487 487 – 479 479
Cash and cash equivalents (595) – (595) (877) – (877)
Non-operating financial receivables (5) – (5) (17) – (17)
Fair value of derivatives – – – 2 5 7
Total 379 487 866 528 484 1,012
Provisions for risks and charges
Provisions for risks and charges of 99 million euros (71 million euros at 31st December 2004) consist of the following:(million €)
31.12.2004
Income tax provisions 20 6 (6) 3 23
Provisions for contractual penalties and disputes – 2 (1) 7 8
Provisions for losses related to investments 1 2 – 2 5
Provisions for redundancy incentives 1 – – – 1
Other provisions 45 20 (22) (9) 34
Total 67 30 (29) 3 71
31.12.2005
Income tax provisions 23 3 (1) 2 27
Provisions for contractual penalties and disputes 8 3 (6) 3 8
Provisions for losses related to investments 5 – – (3) 2
Provisions for redundancy incentives 1 – (1) – –
Other provisions 34 59 (30) (1) 62
Total 71 65 (38) 1 99
Income tax provisions amounting to 27 million euros refer entirely to current disputes with fiscal authorities in foreigncountries and potential litigations that, based on recent assessments, are still pending.Provisions for contractual penalties and disputes amount to 8 million euros and comprise entirely of accruals by aforeign subsidiary to cover a conservative estimate of current disputes under definition.Provisions for losses on investments amount to 2 million euros and represent losses incurred to date in excess of thecarrying value of investments relating to investments held by Saipem sa (See note 9).Other provisions stand at 62 million euros and represent an estimate of expected losses on long-term contracts in theOffshore and Onshore Construction sectors (42 million euros). With respect of the foregoing liabilities, Saipem doesnot reasonably expect any material additional losses beyond those amounts accrued above.
Provisions for employee benefits
Provisions for employee benefits of the Saipem Group concern indemnities upon termination of employment, pensionplans with benefits measured in consideration of the employee’s annual compensation preceding retirement and otherlong-term benefits. Provisions for indemnities upon termination of employment essentially concern the provisions for
19
Clos
ing
bala
nce
Oth
erva
riat
ions
Uti
lizat
ion
Prov
isio
n
Ope
ning
bala
nce
18
Tota
l
Non
-cur
rent
Curr
ent
Tota
l
Non
-cur
rent
Curr
ent

S A I P E M F I N A N C I A L R E P O RT / N O T E S TO T H E C O N S O L I DAT E D F I N A N C I A L S TAT E M E N T S
125
employee termination indemnities (“TFR”), regulated by article 2120 of the Italian Civil Code. The indemnity is paid outas capital and is determined by the total of the provisions set aside, calculated in consideration of the employee’scompensation during the service period, and revalued until retirement. Pension funds concern:- defined benefit plans of foreign companies located, primarily, in France, the United Kingdom and Norway;- pension provisions and similar obligations for personnel employed abroad, for whom local legislation applies.Benefits consist of a return on capital determined on the basis of the length of service and the compensation paid inthe last year of service or an average annual compensation paid in a determined period preceding retirement. Other long-term benefits essentially concern the Supplementary medical reserve for managers of the Eni Group (FISDE)and jubilee awards. Liability and costs related to FISDE are calculated on the basis of the contributions paid by thecompany for the retired managers. Jubilee awards are benefits due following the attainment of a minimum period ofservice and, with regard to the Italian companies, they consist of remuneration in kind.
Current value of employee long-term benefits consist of the following:(million €)
Pension plans with plan assets
31.12.2004
Current value of benefit obligation at beginning of year 30 44 7 37 10 77
Current cost 3 3 – 3 1 7
Interest cost 2 2 – 2 – 4
Expected return on plan assets – – – – – –
Contributions paid – – 2 (2) – (2)
Actuarial gains /(losses) 2 3 – 3 – 5
Benefits paid (2) (2) (1) (1) – (3)
Amendments – 11 – 11 – 11
Exchange rate differences and other changes – – – – – –
Current value of benefit obligation at end of year 35 61 8 53 11 99
31.12.2005
Current value of benefit obligation at beginning of year 35 61 8 53 11 99
Current cost 4 4 – 4 – 8
Interest cost 1 – – – 2 3
Expected return on plan assets – – 1 (1) – (1)
Contributions paid – – 2 (2) – (2)
Actuarial gains /(losses) (2) – – – (1) (3)
Benefits paid (3) (8) (2) (6) – (9)
Amendments – 14 14 – – –
Exchange rate differences and other changes – 1 – 1 – 1
Current value of benefit obligation at end of year 35 72 23 49 12 96
Current value of the obligation relating other long-term benefits of 12 million euros (11 million euros at 31st December2004) concern FISDE - 5 million euros (5 million euros at 31st December 2004), jubilee awards - 6 million euros (5million euros at 31st December 2004) and other provisions - 1 million euros (1 million euros at 31st December 2004).
Tota
l
Oth
er lo
ng-
term
ben
efit
s
Net
liab
ility
Plan
ass
ets
Gro
ss li
abili
ty
TFR

S A I P E M F I N A N C I A L R E P O RT / N O T E S TO T H E C O N S O L I DAT E D F I N A N C I A L S TAT E M E N T S
126
Reconciliation of net liabilities for benefits recorded in the balance sheets is as follows:(million €)
Pension plans with plan assets
31.12.2004
Current value of the benefit obligation 35 53 – 53 11 99
Actuarial gains/losses not recognized (2) (2) – (2) – (4)
Past service cost not recognized – (11) – (11) – (11)
Provisions for employee benefits 33 40 – 40 11 84
31.12.2005
Current value of the benefit obligation 35 49 – 49 12 96
Actuarial gains/losses not recognized – – – – 1 1
Past service cost not recognized – (9) – (9) – (9)
Provisions for employee benefits 35 40 – 40 13 88
Fund for other long-term benefits of 13 million euros (11 million euros at 31st December 2004) concern FISDE - 5million euros and jubilee awards - 8 million euros (5 and 6 million euros at 31st December 2004, respectively).Costs for employee benefits recorded in the income statement consist of the following:
(million €)
Year 2004
Current cost 3 3 – 6
Interest cost 2 2 – 4
Expected return on plan assets – – – –
Amortization of past service cost – – 1 1
Amortization of actuarial gains/losses – – – –
Total cost 5 5 1 11
Year 2005
Current cost, 4 4 – 8
Interest cost 1 – 2 3
Expected return on plan assets – (1) – (1)
Amortization of past service cost – 1 – 1
Amortization of actuarial gains/losses – – 1 1
Plan extensions or curtailmens – (1) - (1)
Total cost 5 3 3 11
Costs for other long-term benefits of 3 million euros (1 million euros at 31st December 2004) concern jubilee awards.
Tota
l
Oth
er lo
ng-
term
ben
efit
s
Pens
ion
plan
sw
ith
plan
ass
ets
TFR
Tota
l
Oth
er lo
ng-
term
ben
efit
s
Net
liab
ility
Plan
ass
ets
Gro
ss li
abili
ty
TFR

S A I P E M F I N A N C I A L R E P O RT / N O T E S TO T H E C O N S O L I DAT E D F I N A N C I A L S TAT E M E N T S
127
Main actuarial assumptions used for the valuation of long-term employee benefits consist of the following:(%)
Year 2004
Main actuarial assumptions
Discount rates 5.1 5.0 – 8.0 4.0 – 6.0
Rate of compensation increase – 3.0 – 6.8 –
Expected return rate on plan assets – 7.0 –
Rate of inflation 2.1 2.0 – 4.6 2.0 – 2.3
Year 2005
Main actuarial assumptions
Discount rates 4.5 4.7 – 7.9 4.5 – 6.0
Rate of compensation increase – 3.0 – 6.8 –
Expected return rate on plan assets – 7.2 –
Rate of inflation 2.1 2.0 – 4.9 2.0 – 2.3
Plan assets consist of the following:(%)
31st December 2005
Securities 54.7 7.3
Bonds 28.5 5.4
Investment property 4.5 6.0
Other 12.3 5.6
Total 100.0
Deferred tax liabilities
Deferred tax liabilities of 20 million euros (5 million euros at 31st December 2004) are shown net of deferred tax assetsfor which offsetting is possible (10 million euros).
(million €)
Deferred tax liabilities 5 16 – (1) 20
Total 5 16 – (1) 20
31.1
2.20
05
Oth
erva
riat
ions
Uti
lizat
ions
Incr
ease
s
31.1
2.20
04
20
Expe
cted
retu
rn
Plan
ass
ets
Oth
er lo
ng-t
erm
bene
fits
Pens
ion
plan
sw
ith
plan
ass
ets
TFR

S A I P E M F I N A N C I A L R E P O RT / N O T E S TO T H E C O N S O L I DAT E D F I N A N C I A L S TAT E M E N T S
128
Deferred tax liabilities consist of the following:(million €)
31.12.2004 31.12.2005
Deferred income taxes (5) (30)
Deferred income taxes available to be offset – 10
(5) (20)
Deferred income taxes not available to be offset 14 68
Net deferred tax assets 9 48
The most significant temporary differences giving rise to net deferred tax assets are as follows:(million €)
Deferred tax liabilities:
- accelerated tax depreciation on fixed assets (5) (5) 3 (1) (8)
- non distributed reserves held by investments – (16) – – (16)
- other – (8) 2 – (6)
(5) (29) 5 (1) (30)
Deferred tax assets:
- accruals for doubtful accounts and provisions for risks and charges 8 2 – – 10
- tax loss carryforwards 64 35 (18) – 81
- write-downs of fixed assets and inventories non deductible 2 1 (2) – 1
- other 18 29 (12) 1 36
92 67 (32) 1 128
Less:
- write-down of deferred tax assets (78) 28 – – (50)
14 95 (32) 1 78
Net deferred tax assets 9 66 (27) – 48
Deferred tax assets were calculated on all temporary differences, which give rise to expected future fiscal profits.Write-down of deferred tax assets of 50 million euros (78 million euros at 31st December 2004) comprises mainly offiscal losses that are not likely to be offset against future income and of temporary differences giving rise to assetswhich are not likely to be recovered.
31.1
2.20
05
Exch
ange
rate
diffe
renc
es a
ndot
her v
aria
tion
s
Ded
ucti
ons
Addi
tion
s
31.1
2.20
04

S A I P E M F I N A N C I A L R E P O RT / N O T E S TO T H E C O N S O L I DAT E D F I N A N C I A L S TAT E M E N T S
129
Fiscal losses
Under Italian fiscal laws, tax losses can be carried forward for up to five subsequent periods, except for losses suffered inthe first three periods of life of the company that can be carried forward without time limit. Tax losses of foreigncompanies can be carried forward on average for more than five periods and for a considerable part can be carriedforward without limit. Tax recovery corresponds to a tax rate of 33% for Italian companies and to an average tax rate of28% for foreign companies.Tax losses amount to 281 million euros and can be used in the following periods:
(million €)
Italian companies Foreign companies
2006 – 10
2007 – 9
2008 – 12
2009 – 18
2010 – 84
Over 2010 – 21
Without limit – 127
Total – 281
Tax losses, for which utilization is expected, amount to 103 million and essentially concern foreign companies.
Other non current liabilities
Other non-current liabilities of 1 million euros (4 million euros at 31st December 2004) consist of the following:(million €)
31.12.2004 31.12.2005
Trade and other payables 4 1
Other liabilities – –
Total 4 1
Other non-current liabilities of 1 million euros consist of payables to suppliers due after one year relating to a Groupforeign subsidiary.
Shareholders’ equity
Minority interest
At 31st December 2005, minority interest amounted to 13 million euros, an increase of 4 million euros versus 31st
December 2004.Minority interest in profit and Shareholders’ equity relate to the following consolidated subsidiaries:
(million €)
Energy Maintenance Services SpA 2 4 7 11
ER SAI Caspian Contractor Llc – – 2 2
Other 1 – – –
Total 3 4 9 13
Shar
ehol
ders
’eq
uity
31.
12.2
005
Shar
ehol
ders
’eq
uity
31.
12.2
004
Net
inco
me
2005
Net
inco
me
2004
22
21

S A I P E M F I N A N C I A L R E P O RT / N O T E S TO T H E C O N S O L I DAT E D F I N A N C I A L S TAT E M E N T S
130
Saipem Shareholders’ equity
(million €)
31.12.2004 31.12.2005
Share capital 441 441
Share premium reserve 62 49
Legal reserve 55 58
Reserve for treasury shares held 22 –
Reserve for buy-back of treasury shares 21 10
Reserve for cash flow hedge – (51)
Reserve for exchange rate differences (17) 18
Other reserves 2 2
Retained earnings 715 899
Net income for the period 235 255
Treasury shares – (51)
Total 1,536 1,630
Share capital
At 31st December 2005, the share capital of Saipem SpA, fully paid-up, amounted to 441 million euros, correspondingto 441,410,900 shares with a nominal value of 1 euro each, of which 441,239,414 are ordinary shares and 171,486 aresavings shares.On 29th April 2005, Saipem’s Shareholders’ Meeting approved a dividend distribution of 0.15 euro per ordinary shareand 0.18 euro per savings share, with the exclusion of treasury shares. The cash dividend was made available forpayment from 26th May 2005 and the ex-dividend date was 23rd May 2005.
Share premium reserve
At 31st December 2005, this amounted to 49 million euros, a decrease of 13 million euros versus 31st December 2004,attributed to the allocation to the newly-created reserve for buy-back of treasury shares, as approved by theShareholders’ meeting on 29th April 2005.
Other reserves
Legal reserveThe legal reserve of Saipem SpA represents the portion of profits accrued as per art. 2430 of the Italian Civil Code thatcannot be distributed as dividends. The legal reserve increased by 3 million euros versus 31st December 2004, followingthe allocation to this reserve of 5% of the 2004 net income.
Reserve for buy-back of treasury sharesThis reserve amounted to 10 million euros, an 11 million euro decrease versus 31st December 2004, due to:- allocation of 24 million euros, by drawing from the “retained earnings” and the “share premium” reserves, as per
Shareholders’ meeting resolution of 29th April 2005;- decrease of 35 million euros following the buy back of 3,284,589 treasury shares during the year.
Reserve for cash flow hedgeThis reserve amounts to minus 51 million euros and relates to the fair value valuation of Interest Rate Swaps and thespot component of derivatives hedging foreign currency risk in place at 31st December 2005 (66 million euros), net ofdeferred tax assets (15 million euros).
26
25
24
23

S A I P E M F I N A N C I A L R E P O RT / N O T E S TO T H E C O N S O L I DAT E D F I N A N C I A L S TAT E M E N T S
131
Reserve for exchange rate differencesThe reserve for exchange rate differences arises from the translation into euros of those financial statements expressedin foreign currency.
Other reservesThis caption comprises the re-valuation reserve set up by the Saipem SpA pursuant to Law no. 413/91. If distributed,this reserve is to form part of the taxable income and is subject to taxation at 33%.
Treasury shares
Saipem SpA holds 5,854,546 treasury shares (3,394,257 at 31st December 2004), amounting to 51 million euros (22million euros at 1st January 2005). These are ordinary shares of Saipem SpA with a nominal value of 1 euro each.Treasury shares are for assignement to the 2002-2005 stock option plan (no. 4,265,546 shares) and stock grant plan(no. 1,589,000 shares). Operations involving treasury shares during the year were as follows:
Treasury shares at 31st December 2004 3,209,901 184,356 3,394,257
- rights purchased 1,830,145 1,454,444 3,284,589
- rights exercised (774,500) (49,800) (824,300)
Treasury shares at 31st December 2005 4,265,546 1,589,000 5,854,546
At 31st December 2005, no. 6,073,901 stock is to be allocated as follows: stock options (no. 4,265,546 shares) and stockgrants (no. 1,589,000 shares). The price for stock option exercise is set at 6.187 euros for assignements in 2002 (no.1,349,901), at 6.821 euros for assignements in 2003 (no. 1,114,000), at 7.594 euros for assignements in 2004 (no.1,050,000) and at 11,881 euros for assignements in 2005 (no. 971,000). Further information on stock option and stockgrant plans are provided in note 31.
Tota
l
Stoc
k gr
ant
Stoc
k op
tion
27

S A I P E M F I N A N C I A L R E P O RT / N O T E S TO T H E C O N S O L I DAT E D F I N A N C I A L S TAT E M E N T S
132
Movements in consolidated Shareholders’ equity for the years ended 31st December 2003, 2004 and 2005.(million €)
Balance at 31.12.2002 441 62 2 48 – – – 35 496 191 – 1,275 24 1,299Retained earnings 2002 andattribution to legal reserve – – – 4 – – – – 124 (128) – – – –Distributed dividends – – – – – – – – – (63) – (63) – (63)Exchange rate differences andother variations – – – – – – – (40) – – – (40) (1) (41)Group’s net income – – – – – – – – 196 – 196 – 196Buy-back of treasury shares – – – – 13 22 – – (35) – – – – –Balance at 31.12.2003 441 62 2 52 13 22 – (5) 585 196 – 1,368 23 1,391Effect of IAS application – – – – – – – – 6 – – 6 – 6Annulment of exchangerate differences – – – – – – – 5 (5) – – – – –Adjusted balance at 1.1.2004 441 62 2 52 13 22 – – 586 196 – 1,374 23 1,397Net income 2004 – – – – – – – – – 197 – 197 3 200Income and (expenses) charged directly in equityExchange differences fromthe translation of financialstatements in currenciesother than euros. – – – – – – – (12) – – – (12) – (12)Transactions with ShareholdersDistributed dividends – – – – – – – – – (65) – (65) – (65)Retained earnings 2003 andattribution to legal reserve – – – 3 – – – – 128 (131) – – – –Buy-back of treasury shares – – – – 9 (1) – – (8) – – – – –Other variations – – – – – – – – – – – – (17) (17)Balance at 31.12.2004 441 62 2 55 22 21 – (12) 706 197 – 1,494 9 1,503Effect of IAS application – – – – – – – – 4 38 – 42 – 42Annulment of exchangerate differences – – – – – – – 12 (12) – – – – –Adjusted balance at 31.12.2004 441 62 2 55 22 21 – – 698 235 – 1,536 9 1,545Effect of the application ofIAS 32 and 39 – – – – (22) – 58 – 5 – (22) 19 – 19Adjusted balance at 1.1.2005 441 62 2 55 – 21 58 – 703 235 (22) 1,555 9 1,564Net income 2005 – – – – – – – – – 255 – 255 4 259Income and (expenses) charged directly in equityVariation of the fair value of cash flowhedge derivatives, net of fiscal effects – – – – – – (109) – – – – (109) – (109)Exchange differences fromthe translation of financial statementsin currencies other than euros – – – – – – – 14 – – – 14 – 14Total – – – – – – (109) 14 – – – (95) – (95)Transactions with ShareholdersDistributed dividends – – – – – – – – – (65) – (65) – (65)Retained earnings 2004 andattribution to legal reserve – – – 3 – – – – 167 (170) – – – –Approval for buy-back of treasury shares – (13) – – – 24 – – (11) – – – – –Buy-back of treasury shares – – – – – (35) – – 35 – (35) (35) – (35)Treasury shares sold underincentive plans – – – – – – – – – – 6 6 – 6Other movements in Shareholders’ equityCost of stock options and stock grants – – – – – – – – 5 – – 5 – 5Exchange differences arising ontranslation of dividends distribution – – – – – – – 4 – – – 4 – 4Total – (13) – 3 – (11) – 4 196 (235) (29) (85) – (85)Balance at 31.12.2005 441 49 2 58 – 10 (51) 18 899 255 (51) 1,630 13 1,643
Tota
lSh
areh
olde
rs’
equi
ty
Min
orit
yin
tere
sts
Tota
l
Trea
sury
shar
es
Net
inco
me
for t
he p
erio
d
Reta
ined
earn
ings
Rese
rve
for
exch
ange
rate
diffe
renc
es
Rese
rve
for
cash
flow
hedg
e
Rese
rve
for b
uy-
back
of t
reas
ury
shar
es
Rese
rve
for
trea
sury
shar
es h
eld
Lega
l res
erve
Oth
er re
serv
es
Shar
e pr
emiu
mre
serv
e
Shar
e ca
pita
l

S A I P E M F I N A N C I A L R E P O RT / N O T E S TO T H E C O N S O L I DAT E D F I N A N C I A L S TAT E M E N T S
133
Reconciliation of statutory net income and Shareholders’ equity to consolidated net income and Shareholders’ equity.(million €)
31.12.2003 31.12.2004 31.12.2005
As reported in Saipem SpA’s financial statements 689 68 686 61 746 124
Difference between the equity value and result of consolidated
companies and the equity value and result of consolidated companies
as accounted for in Saipem SpA financial statements 902 59 1,097 225 1,266 166
Adjustment under IFRS: 6 – 48 38 (49) 5
Consolidation adjustments:
. elimination of unrealised intercompany profits (271) 32 (406) (150) (377) 32
. other adjustments 71 37 120 64 57 (68)
Total Shareholders’ equity 1,397 196 1,545 238 1,643 259
Minority interests in capital and reserves (23) – (9) (3) (13) (4)
As reported in the consolidated financial statements 1,374 196 1,536 235 1,630 255
Guarantees, commitments and risks
GuaranteesGuarantees of 2,194 million euros (1,847 million euros at 31st December 2004) consist of the following:
(million €)
31.12.2004 31.12.2005
Parent company – 1 1 – – –
Associated companies 37 36 73 43 16 59
Consolidated companies 267 957 1,224 379 1,264 1,643
Own – 542 542 – 486 486
Other 7 – 7 6 – 6
Total 311 1,536 1,847 428 1,766 2,194
They mainly comprise guarantees issued by banks for obligations arising from the participation in contract tenders, forthe proper execution of work, for liens and credit facilities.
Commitments and contingenciesSaipem SpA, for the benefit of its customers, is committed to fulfilling the contractual obligations entered into bysubsidiary or associated companies where they fail to fulfil the contractual obligations themselves, as well as to pay forany damages incurred as a result of any failure to meet those obligations.These commitments guarantee the cover for contracts whose overall value amounts to 6,310 million euros (5,004million euros at 31st December 2004), inclusive of the backlog quota at 31st December 2005 relating to Groupcompanies.
Tota
l
Oth
ergu
aran
tees
Uns
ecur
edgu
aran
tees
i
Tota
l
Oth
ergu
aran
tees
Uns
ecur
edgu
aran
tees
i
Net
inco
me
Shar
ehol
ders
’eq
uity
Net
inco
me
Shar
ehol
ders
’eq
uity
Net
inco
me
Shar
ehol
ders
’eq
uity

S A I P E M F I N A N C I A L R E P O RT / N O T E S TO T H E C O N S O L I DAT E D F I N A N C I A L S TAT E M E N T S
134
Revenues
The following is a summary of the main components of “Revenues”. Additional information about changes in revenuesis provided under the caption “Review of financial and economic results”.
Turnover
Turnover is broken down as follows:
(million €)
2004 2005
Net sales from operations 4,240 4,470
Variation in contract work in progress 66 58
Total 4,306 4,528
Net sales from operations by industry segment and geographical area are presented in note 38.Information required by IAS 11, paragraphs 39, 40 and 42, is provided by business segment in note 38.
Other revenues and income
Other revenues and income are as follows:
(million €)
2004 2005
Release of provisions for doubtful accounts 2 1
Gains on disposal of assets 4 1
Contract penalties and other trade revenues – 3
Other proceeds 4 6
Total 10 11
Operating expenses
The following is a summary of the main components of “Operating expenses”. Additional information about changes inrevenues is provided under the caption “Review of financial and economic results”.
Purchases, services and other costs
Purchases, services and other costs can be broken down as follows:(million €)
Year 2004 Year 2005
Raw materials, ancillary, consumables and supplies 858 830
Services 1,938 2,091
Use of third party assets 213 242
Net provisions for risks and charges 38 27
Other expenses 28 33
Less:
- capitalised direct costs associated with self-constructed assets (13) (32)
- variations in inventories (12) (35)
Total 3,050 3,156
Costs of services include agency fees of 17 million euros (18 million euros in 2004).
30
29
28

S A I P E M F I N A N C I A L R E P O RT / N O T E S TO T H E C O N S O L I DAT E D F I N A N C I A L S TAT E M E N T S
135
Costs for research and development that do not meet the requirements to be capitalized amount to 7 million euros (9million euros in 2004).Net provisions for risks and charges are detailed under note 17 “Provisions for risks and charges”.Other expenses of 33 million euros consist of provisions and expenses for income taxes (11 million euros), losses ondisposal of assets (2 million euros), losses on receivables (3 million euros) and write-downs of trade receivables (3million euros).
Payroll and related costs
Payroll and related costs are as follows:(million €)
Year 2004 Year 2005
Wages and salaries 582 631
Social security contributions 107 121
Contributions to defined benefit plans 11 11
Other costs 40 60
Less:
- capitalised direct costs associated with self-constructed assets (1) (4)
Total 739 819
Contributions to defined benefit plans are illustrated under note 19 “Provisions for employee benefits”.
Stock compensation
Stock grantsWith the aim of improving motivation and loyalty of the managers of Saipem SpA and its subsidiaries as defined inArticle 2359 of the Italian Civil Code through the linking of compensation to the attainment of preset individual andcorporate objectives, making management participate in corporate risk and motivating them towards the creation ofshareholder value and increasing at the same time their contribution to the management of the Company, Saipemoffers its own shares purchased along its buy-back program (treasury shares) for no consideration to those managers ofSaipem who have achieved corporate and individual objectives. Assignments vest within 45 days after the end of thethird year from the date of the offer.At 31st December 2005, 1,589,000 ordinary shares with nominal value of 1 euro each are outstanding and concern the2003 stock grant plan (523,600 shares with a fair value of 6.018 per share), the 2004 stock grant plan (594,200 shareswith a fair value of 7.225 euros per share) and the 2005 stock grant plan (471,200 shares with a fair value of 11.851euros per share).
Stock optionsWith the aim of improving motivation and loyalty of the managers of Saipem SpA and its subsidiaries as defined inArticle 2359 of the Italian Civil Code that hold significant positions of managerial responsibility or that are consideredas strategic managers for the Group, Saipem approved stock compensation plans that provide the assignment for noconsideration of purchase rights of Saipem treasury shares (options). Stock options provides the right for the purchase of treasury share in a 1 to 1 ratio after the end of the third year fromthe date of the grant, with a strike price calculated as arithmetic average of official prices registered on the MercatoTelematico Azionario in the month preceding assignment or (starting from 2003), if greater, as average cost of treasuryshares registered in the day preceding assignment. The strike price for 2005 stock option grant was 11.881 euros. Stockoption grantees can obtain advances by the Group financial company for the payment of shares acquired on conditionthat the grantees simultaneously underwrite an irrevocable warrant of sale to the above-mentioned financial company,regarding the shares acquired.
At 31st December 2005, no. 4,484,901 stock options have been allocated for the purchase of no. 4,484,901 shares ofSaipem SpA of the nominal value of 1 euro each.
31

S A I P E M F I N A N C I A L R E P O RT / N O T E S TO T H E C O N S O L I DAT E D F I N A N C I A L S TAT E M E N T S
136
2002 Plan 1,349,901 6.187 4 Not available Not available
2003 Plan 1,114,000 6.821 6 1.1928 1.1806
2004 Plan 1,050,000 7.594 7 2.0935 2.0085
2005 Plan 971,000 11.881 8 3.1029 2.9795
Total 4,484,901
The fair value of stock options granted during 2002 is not available, as it was not calculated at the time of assignment.The fair value valuation of options granted in 2003, 2004 and 2005 considers the stock options as European until30/9/2006, 23/8/2007 and 27/7/2008 respectively for grantees resident in Italy and until 30/9/2007, 23/8/2008 and27/7/2009 for those resident in France; subsequently they are considered American. The fair value was thereforecalculated using a combination of the Black, Scholes and Merton method for European options and the Roll, Geske andWhaley method for American options.The following parameters were used:
- for grantees resident in Italy:
2004 2005
Risk-free interest rate (%) 3.025 4.585 2.490 3.51
Expected life (years) 3 5 3 5
Expected volatility (%) 31.74 31.74 30.12 30.12
Expected dividends (%) 1.930 0.715 1.69 1.525
- for grantees resident in France:
2004 2005
Risk-free interest rate (%) 3.298 4.653 2.634 3.55
Expected life (years) 4 3 43 3
Expected volatility (%) 33.02 33.02 30.75 30.75
Expected dividends (%) 1.870 0.429 1.89 0.915
Amer
ican
por
tion
Euro
pean
por
tion
Amer
ican
por
tion
Euro
pean
por
tion
Amer
ican
por
tion
Euro
pean
por
tion
Amer
ican
por
tion
Euro
pean
por
tion
Fair
val
ue (€
)gr
ante
es re
side
nt in
Fran
ce
Fair
val
ue (€
)gr
ante
es re
side
nt in
Ital
y
Aver
age
resi
dual
life
(yea
rs)
Exer
cise
pri
ce (€
)
Num
ber o
f sh
ares

S A I P E M F I N A N C I A L R E P O RT / N O T E S TO T H E C O N S O L I DAT E D F I N A N C I A L S TAT E M E N T S
137
Compensation of key management personnel
Compensation due to senior managers responsible for Group results or holding positions of strategic interest (i.e. keymanagement personnel) amount to 19 million euros (17 million euros in 2004) and consist of the following:
(million €)
2004 2005
Wages and salaries 5 5
Indemnities due upon termination of employment 5 5
Stock grants/options 7 9
Total 17 19
Compensation of Board Directors and Statutory Auditors
Compensation of Board Directors amount to 1,261 thousand euros (1,089 thousand euros in 2004). Compensation ofStatutory Auditors amount to 144 thousand euros (128 thousand euros in 2004). Compensation of Board Directorsand Statutory Auditors include emoluments and all other retributive and social security compensations due for thefunctions of director or statutory auditor assumed in Saipem SpA or in companies included in the consolidation area,that are a cost for Saipem.
Average number of employees
The average number of employees , by category, for all the consolidated companies is as follows:(million €)
31.12.2004 31.12.2005
- Senior managers 300 291
- Managers 1,702 1,814
- White collar 8,152 8,640
- Blue collar 11,266 12,371
- Seamen 255 239
Total 21,675 23,355
Numbers for the average workforce are calculated using the half-sum of employees at the beginning and the end of theperiod. The average number of senior managers includes managers employed and operating in foreign countries,whose position is comparable to a senior manager status in Italy.
Depreciation, amortization and impairments
Depreciation, amortization and impairments consist of the following:
(million €)
31.12.2004 31.12.2005
Depreciation and amortization:
- tangible assets 182 186
- intangible assets 16 10
198 196
Impairments:
- tangible assets 1 –
- intangible assets – 3
Total 199 199
32

S A I P E M F I N A N C I A L R E P O RT / N O T E S TO T H E C O N S O L I DAT E D F I N A N C I A L S TAT E M E N T S
138
Financial income (expenses)
Financial income (expenses) comprise:(million €)
31.12.2004 31.12.2005
Exchange differences, net – (41)
Income (expenses) on derivatives (4) 17
Financial expenses (net) due to Group’s Financial Companies (18) (23)
Net interest due to/from banks (13) 1
Interest and other financial expenses on debt (1) (3)
Other financial expenses, net (6) (5)
Total (42) (54)
Income (expenses) from investments
Effects of investments accounted for using the equity method consist of the following:(million €)
31.12.2004 31.12.2005
Dividends - 1
Gains from the sale of investments 1 -
Gains from investments accounted for using the equity method 18 23
Total 19 24
Gains from investments accounted for using the equity method are analysed under note 9 “Investments accounted forusing the equity method”.
Income taxes
Income taxes consist of the following:(million €)
31.12.2004 31.12.2005
Current taxes:
- Italian subsidiaries 18 53
- foreign subsidiaries 40 52
Net deferred taxes:
- Italian subsidiaries (7) (6)
- foreign subsidiaries 16 (23)
Total 67 76
Current taxes relating to Italian companies amount to 53 million euros and concern IRES (27 million euros), IRAP (7million euros) and foreign taxes (19 million euros).The effective tax rate is 22.7% (22% in 2004) compared with a statutory tax rate of 48.0% (51.2% in 2004), calculated byapplying a 33% tax rate (Ires) to profit before income taxes and 4.25% tax rate (Irap) to the net value of production asprovided for by Italian laws.The difference between the statutory and effective tax rate is due to the following factors:
%
Year 2004 Year 2005
Statutory tax rate 51.2 48.0
Items increasing (decreasing) the statutory tax rate:
- net value of production abroad (Irap) (15.3) (11.1)
- lower tax rates for foreign subsidiaries (10.9) (14.2)
- other (26.2) (25.3)
Effective tax rate 25.0 22.7
35
34
33

S A I P E M F I N A N C I A L R E P O RT / N O T E S TO T H E C O N S O L I DAT E D F I N A N C I A L S TAT E M E N T S
139
Minority interest
Minority interest amounted to 4 million euros (3 million euros at 31st December 2004).
Earnings per share
Basic earnings per share is calculated by dividing the net income for the year by the weighted-average number of sharesissued and outstanding during the year, excluding treasury shares.The number of shares outstanding used for the calculation of the basic earnings per share was 437,847,448 and436,905,195 in 2004 and 2005, respectively.Diluted earnings per share is calculated by dividing the net income for the year by the weighted-average number ofshares issued and outstanding during the year, excluding treasury shares, including shares that could be potentiallyissued.At 31st December 2004 and 2005, shares that could be issued potentially concern essentially shares granted understock grant and stock option plans. The number of shares outstanding used for the calculation of the diluted earningsper share was 441,610,093 and 441,015,262 in 2004 and 2005, respectively.Reconciliation of the average number shares outstanding used for the calculation of the basic and diluted earning pershare is as follows:
31.12.2004 31.12.2005
Average number of shares used for the calculation of the basic earnings per share 437,847,448 436,905,196
Number of potential shares following stock grant plans 1,404,800 1,589,000
Number of potential shares following stock options plans 2,168,079 2,349,580
Number of savings shares convertible into ordinary shares 189,766 171,486
Average number of shares used for the calculation of the diluted earnings per share 441,610,093 441,015,262
Saipem’s net income (million euros) 235 255
Basic earning per share (€ per share) 0.45 0.59
Diluted earning per share (€ per share) 0.45 0.59
37
36

S A I P E M F I N A N C I A L R E P O RT / N O T E S TO T H E C O N S O L I DAT E D F I N A N C I A L S TAT E M E N T S
140
Information by business segment and geographical area
Information by business segment(million €)
Year 2004
Net sales from operations (a) 3,647 451 50 659 182 212 290 – 5,491
less: intercompany sales 940 162 3 50 24 4 2 – 1,185
Net sales to customers 2,707 289 47 609 158 208 288 – 4,306
Operating income 244 62 11 59 21 28 19 (116) 328
Net allocations to provisions for risks and charges 36 2 – 38
Depreciation, amortization and write-downs 92 47 10 21 17 2 5 5 199
Net income from investments 6 – – 3 – 10 – – 19
Capital expenditure 104 52 – 22 11 6 2 12 209
Identifiable assets (b) 1,095 172 21 260 75 79 87 725 2,514
Investments accounted for using the equity method 13 – – 4 – 3 2 – 22
Identifiable liabilities (c) 1,213 117 9 268 45 89 118 1,082 2,941
Provisions for risks and charges 44 – – 1 – – – 26 71
Year 2005
Net sales from operations (a) 3,630 447 34 848 232 303 327 – 5,821
less: intercompany sales 1,009 145 7 100 22 4 6 – 1,293
Net sales to customers 2,621 302 27 748 210 299 321 – 4,528
Operating income 294 65 4 55 28 14 25 (120) 365
Net allocations to provisions for risks and charges 27 – – - – – – - 27
Depreciation, amortization and write-downs 85 48 9 27 19 4 2 5 199
Net income from investments 3 – – 4 – 16 1 – 24
Capital expenditure 184 46 93 14 13 2 2 8 362
Identifiable assets (b) 1,224 181 33 369 107 83 100 1,019 3,116
Investments accounted for using the equity method 14 – – 6 – 20 2 – 42
Identifiable liabilities (c) 1,338 110 51 289 63 127 93 1,630 3,701
Provisions for risks and charges 43 – – 7 – 1 2 46 99
(a) Before elimination of intersector sales.(b) Includes assets directly related to the generation of operating income.(c) Includes liabilities directly related to the generation of operating income.
Intercompany sales are conducted on an arm’s length basis.
Tota
l
Non
allo
cate
d
Mai
nten
ance
Mod
ifica
tion
and
Ope
rati
on
Liqu
efie
dN
atur
al G
as
Ons
hore
Dri
lling
Ons
hore
Cons
truc
tion
Leas
ed F
PSO
Offs
hore
Dri
lling
Offs
hore
Cons
truc
tion
38

S A I P E M F I N A N C I A L R E P O RT / N O T E S TO T H E C O N S O L I DAT E D F I N A N C I A L S TAT E M E N T S
141
The following table contains information required by IAS 11, paragraphs 39, 40 and 42.(million €)
Year 2005
Net sales from operations (a) 2,621 302 27 748 210 299 321 4,528
Variation in provisions for future losses (b) 32 - - 1 - - - 33
Total (a-b) 2,589 302 27 747 210 288 321 4,495
Advances from clients 141 - - 16 - - - 157
Provisions for future losses (c) 41 - - 1 - - - 42
Contract work in progress (d) (247) - - (38) - (17) (2) (304)
Deferred income (e) 267 - 102 20 - 13 - 402
Total (c+d+e) 61 - 102 (17) - (4) (2) 140
Information by geographical area
Geographical allocation of operations is made difficult by Saipem’s specific business, entailing the deployment of a fleetwhich operates on several projects over a single period. Therefore, not all allocations have been covered.With regard to tangible and intangible assets as well as capital expenditure, vessels and their related equipment andgoodwill were not allocated.With regard to current assets, inventories related to vessels were not allocated.
(million €)
Year 2004
Capital expenditure 3 4 44 3 5 12 3 135 209
Tangible and intangible assets 14 79 19 65 – 93 40 2,237 2,547
Identifiable assets (a) 147 511 54 156 19 158 88 1,381 2,514
Year 2005
Capital expenditure 2 4 107 1 7 8 8 225 362
Tangible and intangible assets 12 110 62 66 – 93 49 2,348 2,740
Identifiable assets (a) 324 537 103 244 70 256 157 1,425 3,116
(a) Includes assets directly related to the generation of operating income.
Revenues by geographical area(million €)
2004 2005
Italy 151 198
Rest of Europe 542 774
C.S.I. 581 758
Rest of Asia 467 647
North Africa 676 482
West Africa 1,598 1,416
Americas 148 198
Australia, Oceania and rest of the world 143 55
Total 4,306 4,528
Tota
l
Not
allo
cate
d
Amer
icas
Wes
t Afr
ica
Nor
th A
fric
a
Rest
of A
sia
C.S.
I.
Rest
of E
urop
e
Ital
y
Tota
l
Mai
nten
ance
Mod
ifica
tion
and
Ope
rati
on
Liqu
efie
dN
atur
al G
as
Ons
hore
Dri
lling
Ons
hore
Cons
truc
tion
Leas
ed F
PSO
Offs
hore
Dri
lling
Offs
hore
Cons
truc
tion
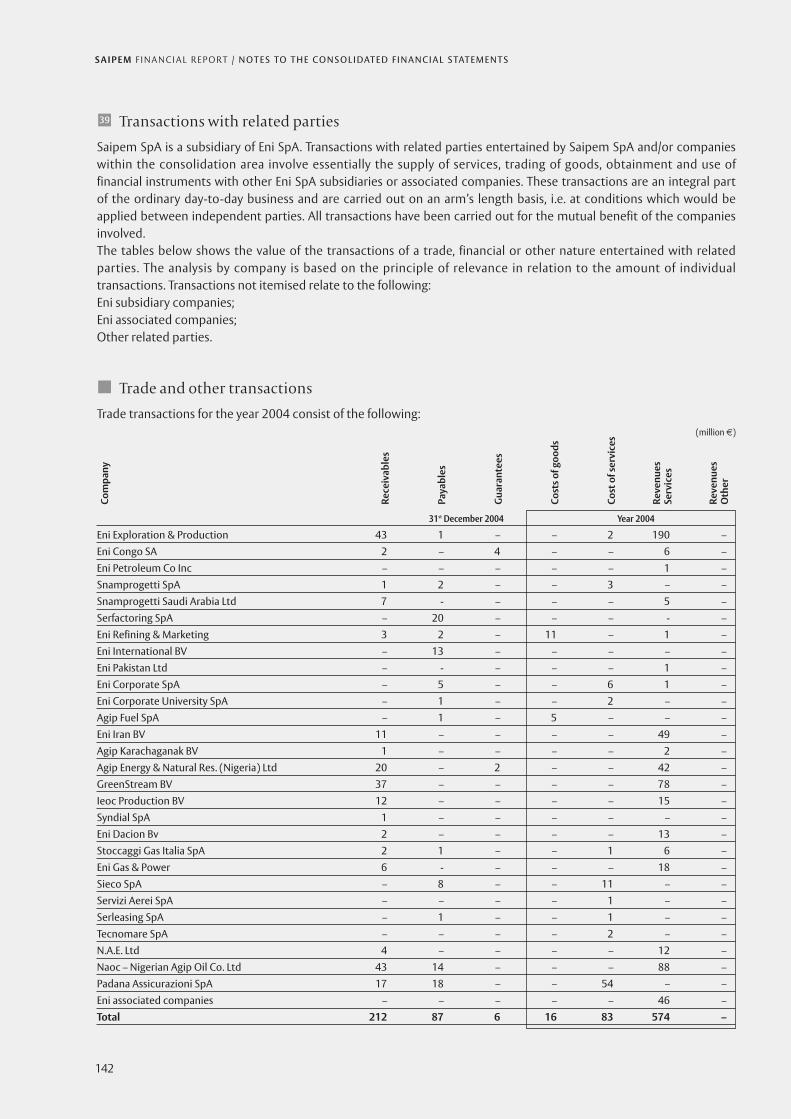
S A I P E M F I N A N C I A L R E P O RT / N O T E S TO T H E C O N S O L I DAT E D F I N A N C I A L S TAT E M E N T S
142
Transactions with related parties
Saipem SpA is a subsidiary of Eni SpA. Transactions with related parties entertained by Saipem SpA and/or companieswithin the consolidation area involve essentially the supply of services, trading of goods, obtainment and use offinancial instruments with other Eni SpA subsidiaries or associated companies. These transactions are an integral partof the ordinary day-to-day business and are carried out on an arm’s length basis, i.e. at conditions which would beapplied between independent parties. All transactions have been carried out for the mutual benefit of the companiesinvolved.The tables below shows the value of the transactions of a trade, financial or other nature entertained with relatedparties. The analysis by company is based on the principle of relevance in relation to the amount of individualtransactions. Transactions not itemised relate to the following:Eni subsidiary companies;Eni associated companies;Other related parties.
Trade and other transactions
Trade transactions for the year 2004 consist of the following:(million €)
31st December 2004 Year 2004
Eni Exploration & Production 43 1 – – 2 190 –Eni Congo SA 2 – 4 – – 6 –Eni Petroleum Co Inc – – – – – 1 –Snamprogetti SpA 1 2 – – 3 – –Snamprogetti Saudi Arabia Ltd 7 - – – – 5 –Serfactoring SpA – 20 – – – - –Eni Refining & Marketing 3 2 – 11 – 1 –Eni International BV – 13 – – – – –Eni Pakistan Ltd – - – – – 1 –Eni Corporate SpA – 5 – – 6 1 –Eni Corporate University SpA – 1 – – 2 – –Agip Fuel SpA – 1 – 5 – – –Eni Iran BV 11 – – – – 49 –Agip Karachaganak BV 1 – – – – 2 –Agip Energy & Natural Res. (Nigeria) Ltd 20 – 2 – – 42 –GreenStream BV 37 – – – – 78 –Ieoc Production BV 12 – – – – 15 –Syndial SpA 1 – – – – – –Eni Dacion Bv 2 – – – – 13 –Stoccaggi Gas Italia SpA 2 1 – – 1 6 –Eni Gas & Power 6 - – – – 18 –Sieco SpA – 8 – – 11 – –Servizi Aerei SpA – – – – 1 – –Serleasing SpA – 1 – – 1 – –Tecnomare SpA – – – – 2 – –N.A.E. Ltd 4 – – – – 12 –Naoc – Nigerian Agip Oil Co. Ltd 43 14 – – – 88 –Padana Assicurazioni SpA 17 18 – – 54 – –Eni associated companies – – – – – 46 –Total 212 87 6 16 83 574 –
Reve
nues
Oth
er
Reve
nues
Serv
ices
Cost
of s
ervi
ces
Cost
s of g
oods
Gua
rant
ees
Paya
bles
Rece
ivab
les
Com
pany
39

S A I P E M F I N A N C I A L R E P O RT / N O T E S TO T H E C O N S O L I DAT E D F I N A N C I A L S TAT E M E N T S
143
Trade transactions for the year 2005 consist of the following:(million €)
31st December 2005 Year 2005
Eni Exploration & Production 59 4 – 4 1 168 –Eni Corporate 1 4 – – 6 – –Eni Corporate University SpA – 1 – – 2 – –Eni Congo SA 5 – 4 – – 9 –Snamprogetti SpA 1 1 – – 4 – –Eni Refining & Marketing 3 1 – 9 1 – –Snamprogetti Saudi Arabia Ltd 3 – – – 1 1 –Eni Gas & Power 9 – – – – 8 –Ieoc Production BV 1 – – – – 14 –Ieoc Exploration BV 4 – – – 13 –Eni Mediterranea Idrocarburi SpA 2 – – – – 10 –Stoccaggi Gas Italia SpA 7 – – – – 20 –Agip Fuel SpA – – – 2 – – –Eni Iran BV 10 – – – – 20 –Agip Algeria Production BV 1 – – – – 4 –Agip Karachaganak BV 1 – – – – 3 –Agip Energy & Natural Res. Ltd (Nigeria) 9 – – – – 26 –GreenStream BV – – – – – 2 –Serfactoring SpA – 6 – – – – –Eni Dacion BV 2 – – – – 11 –Syndial SpA 1 – – – – – –Sofid SpA – – – – 2 – –Sieco SpA – 10 – – 11 – –Eni North Africa BV 3 – – – – 31 –Raffineria di Gela SpA 6 1 – 1 21 –N.A.E. Ltd 4 – – – – 7 –Naoc – Nigerian Agip Oil Co. Ltd 99 – – – – 205 –Padana Assicurazioni SpA 2 10 – – 49 2 –Eni associated companies – – – – – 110 –Total 233 38 4 15 78 685 –
Saipem SpA and the other companies included in the consolidation area provide services to Eni Group companies inthe Offshore and Onshore Construction sectors, in the Offshore and Onshore Drilling sectors both in Italy and abroadand in the MMO sector in Italy. Revenues from Eni associated companies amount to 110 million euros. These can bebroken down as follows: 50 million euros from Blue Stream Pipeline company BV with regard to the Blue Streamproject; 13 million euros from Agip Kazakhstan North Caspian Op. Co. Nv; and 47 million euros from Inagip Doo.Further details on operations carried out on behalf of Eni Group companies can be found in the Director’s Report.
Reve
nues
Oth
er
Reve
nues
Serv
ices
Cost
s of s
ervi
ces
Cost
s of g
oods
Gua
rant
ees
Paya
bles
Rece
ivab
les
Com
pany

S A I P E M F I N A N C I A L R E P O RT / N O T E S TO T H E C O N S O L I DAT E D F I N A N C I A L S TAT E M E N T S
144
Other transactions are as follows:(million €)
31st December 2004 31st December 2005
Eni Divisione Gas & Power – – 9 – – 6
GreenStream BV – – 11 – – 22
Enifin SpA 1 3 – – – –
Naoc – Nigerian Agip Oil Co. Ltd – – 53 – 11 13
Raffineria di Gela SpA – – – – 1 2
Padana Assicurazioni SpA 14 – – 13 – –
Total 15 3 73 13 12 43
Financial transactions
Financial transactions for the year 2004 consist of the following:(million €)
31st December 2004 Year 2004
Enifin SpA – 480 1,860 27 17
Enibank International Bank Ltd – 57 101 2 –
Sofid SpA – – – – –
Serleasing SpA – 28 – 1 –
Eni Coordination Center – 445 – 8 4
Total – 1,010 1,961 38 21
Financial transactions for the year 2005 consist of the following:(million €)
31st December 2005 Year 2005
Enifin SpA – 883 5,768 41 24
Sofid SpA – – – 1 –
Enibank International Bank Ltd – 87 138 3 1
Serleasing SpA – 10 – – –
Eni Coordination Center – 226 – 10 4
Total – 1,206 5,906 55 29
Enifin SpA, a wholly owned subsidiary of Eni SpA, provides financial services to Eni Group companies. A specificagreement between Saipem and Enifin provides that the latter supplies financial services to the Italian companies ofthe Saipem Group, consisting of loans, deposits and financial instruments for the hedging of foreign exchange andinterest rate risks.
Inco
me
Expe
nses
Gua
rant
ees
Paya
bles
Rece
ivab
les
Inco
me
Expe
nses
Gua
rant
ees
Paya
bles
Rece
ivab
les
Cont
ract
wor
kin
pro
gres
s
Oth
erpa
yabl
es
Oth
erre
ceiv
able
s
Cont
ract
wor
kin
pro
gres
s
Oth
erpa
yabl
es
Oth
erre
ceiv
able
s

S A I P E M F I N A N C I A L R E P O RT / N O T E S TO T H E C O N S O L I DAT E D F I N A N C I A L S TAT E M E N T S
145
Information on jointly controlled entities
Information relating to jointly controlled entities, consolidated using the proportionate consolidation method are asfollows:
(million €)
31.12.2005
Net working capital (13)
Revenues 492
Operating costs (432)
Operating income 60

S A I P E M F I N A N C I A L R E P O RT / I N D E P E N D E N T AU D I TO R S ’ R E P O R T
146
Independent auditors’ report

S A I P E M F I N A N C I A L R E P O RT / I N D E P E N D E N T AU D I TO R S ’ R E P O R T
147

S A I P E M F I N A N C I A L R E P O RT
148

A Joint Stock Company with Registered Office in San Donato Milanese (MI), ItalyFully paid-up Share Capital Euro 441,410,900Fiscal Code and Milan Companies’ Register No. 00825790157
Other offices:Cortemaggiore (PC) - Via Enrico Mattei, 20
Information for ShareholdersSaipem SpA, Via Martiri di Cefalonia, 67 - 20097 San Donato Milanese (MI)
Relations with istitutional investors and financial analystsFax: +39-0252054295e-mail: [email protected]
PubblicationsFinancial Report at 31st December 2005 (in English)Bilancio al 31 dicembre 2005(in Italian)Third quarter report at 30th September 2005 (in English)Relazione trimestrale al 30 settembre 2005 (in Italian)Six-monthly report at 30th June 2005 (in English)Relazione semestrale al 30 giugno 2005 (in Italian)Second quarter report at 30th June 2005 (in English)Relazione trimestrale al 30 giugno 2005 (in Italian)First quarter report at 31st March 2005 (in English)Relazione trimestrale al 31 marzo 2005 (in Italian)
Health, Safety Environment 2004 (in Italian and English)
Also available on Saipem’s website: www.saipem.eni.it
Website: www.saipem.eni.itOperator: +39-025201
Design: OperaPrinted by: Impronta Grafica - Cantù

Società per Azioni Via Martiri di Cefalonia, 67 - 20097 San Donato Milanese (MI) Tel. +39.02.5201 - Fax +39.02.52054295 www.saipem.eni.it