financial information and corporate...
TRANSCRIPT

ZETES ANNUAL REPORT 2016SECURELY CONNECTINGPEOPLE TO THEIR ENVIRONMENTFOR MORE THAN 30 YEARS
FINANCIAL INFORMATIONAND CORPORATE GOVERNANCE

FINANCIAL INFORMATIONAND CORPORATE GOVERNANCE
/ 2
03 CONSOLIDATED INCOME STATEMENT
04 CONSOLIDATED FINANCIAL POSITION
05 CONSOLIDATED CASH FLOW STATEMENT
06 CONSOLIDATED STATEMENT OF CHANGES IN EQUITY
07 SUMMARY OF PRINCIPAL ACCOUNTING POLICIES
12 NOTES TO THE CONSOLIDATED ACCOUNTS
18 SEGMENT INFORMATION
35 MANAGEMENT OF RISKS AND UNCERTAINTIES
37 AUDITOR’S REPORT
38 STATUTORY ACCOUNTS
42 CORPORATE GOVERNANCE
64 GLOSSARY OF FINANCIAL TERMS
CONTENT

FINANCIAL INFORMATIONAND CORPORATE GOVERNANCE
/ 3
The consolidated financial statements for the year ended December 31, 2016 as presented in this annual report were prepared under the responsibility of the Board of Directors and authorized for issue on March 31, 2017 subject to approval of the statutory non-consolidated accounts by the shareholders at the Ordinary General Meeting to be held on May 31, 2017,
Consolidated income statementIn '000 € NOTES 2014 2015 2016
Sales 245,270 258,225 253,401Cogs (141,690) (142,646) (138,557)Gross Margin 103,579 115,579 114,844
Employee expenses 2 (57,516) (61,732) (62,462)Other operating expenses (26,859) (27,156) (25,844)Current EBITDA (1) 19,205 26,691 26,538Non current costs 4 (1,015) (439) (746)EBITDA 18,190 26,252 25,792Provisions, depreciation, amortisation, impairment losses 6/7/9/10 (8,407) (9,586) (8,929)EBIT 9,783 16,666 16,864
Result from the disposal of fixed assets 30 2 16Financial charges 4 (1,199) (2,002) (1,707)Financial income 4 633 1,223 1,157Result before taxes 9,247 15,889 16,330Income tax 5 (3,051) (5,161) (4,858)PROFIT OF THE PERIOD 6,196 10,728 11,471
Non-controlling interests (41) (317) 56Net profit of the Group 6,237 11,045 11,415
Current EBIT (1) 10,798 17,105 17,610Net current result (1) (3) 6,917 11,342 11,990
Total comprehensive incomeIn '000 €Net profit of the Group 6,237 11,045 11,415Currency translation differences (P&L recyclable component) 142 240 141Net revaluation of hedging instruments (P&L recyclable component) 95 (49) (12)Other comprehensive income, net of related tax effects 237 191 129Total comprehensive income of the Group 6,474 11,236 11,544
The other elements of the comprehensive income for non-controlling interests are zero.
Earnings per share (€ per share)Number of shares outstanding (2) 12 5,162,665 5,175,140 5.233.337
Net result (3) 1.21 2.13 2.18Net current result (1) (3) 1.34 2.19 2.29
Number of shares fully diluted (2) 12 5,162,665 5,286,317 5.314.551Net diluted result (3) 1.21 2.09 2.15
(1) "Current" excludes restructuring expenses and non current income/costs (2) Weighted average number of outstanding shares (3) Attributable to equity holders of the parent company

/ 4FINANCIAL INFORMATIONAND CORPORATE GOVERNANCE
Consolidated financial position (before appropriation) In '000 € NOTES 2014 2015 2016
ASSETSTangible assets 6 16,386 19,716 19,910Intangible assets 7 6,489 6,354 6,621Goodwill 7 40,033 40,602 40,602Deferred tax assets 5 4,885 4,769 4,126Financial assets and other non current assets 8 2,066 548 405Non current assets 69,859 71,988 71,664Inventories 9 17,146 17,821 22,172Current trade and other receivables 10 67,623 62,260 71,459Current tax assets 440 601 516Current prepayments 13,116 13,743 13,376Cash and cash equivalents 13 16,290 22,267 19,909Current assets 114,614 116,692 127,431Total assets 184,474 188,680 199,095
EQUITY AND LIABILITIESEquity attributable to equity holders of the parent 78,731 89,038 92,661Non-controlling interests 808 635 675Total equity 12 79,539 89,673 93,336Non current borrowings 13 792 4,194 845Non current provisions 14 921 1,136 1,024Non current obligations 14 179 177 177Non current hedging instruments - 71 -Deferred tax liabilities 5 2,698 2,960 2,740Non current liabilities 4,590 8,538 4,787Current interests bearing borrowings 13 14,208 8,841 9,960Current obligations 14 26 27 26Current hedging instruments 10 - 125 106Current trade and other payables 15 81,346 75,053 86,332Current tax liabilities 3,727 5,274 3,649Other current liabilities 1,040 1,149 899Current liabilities 100,345 90,469 100,971Total equity and liabilities 184,474 188,680 199,095

FINANCIAL INFORMATIONAND CORPORATE GOVERNANCE
/ 5
Consolidated cash flow statementIn '000 € 2014 2015 2016
CASH AND CASH EQUIVALENTS, BEGINNING BALANCE (I) 10,585 16,290 22,267Cash flows from the P&L 14,369 20,180 21,362
Result before tax 9,247 15,889 16,330Depreciation on fixed assets 5,501 6,213 5,117Depreciation on development costs 2,324 2,378 2,647Write-downs on inventories & receivables 416 945 1,288Write-downs on financial assets 1 11 1Provisions 106 (19) (127)Net Financial charges (2) 177 256 478Income tax paid (3,429) (5,264) (4,342)Other increases (decreases) 27 (230) (29)
Working capital 2,701 (215) (4,895)Decrease (increase) in assets (1) (14,126) 5,219 (14,594)Increase (decrease) in liabilities 16,827 (5,433) 9,699
CASH FLOWS FROM THE OPERATIONS (II) 17,070 19,965 16,468Acquisitions (8,754) (8,273) (8,396)
Fixed assets (5,851) (4,558) (5,185)Subsidiaries (net of cash acquired) (322) (1,113) -Development expenses (2,582) (2,602) (3,211)
Disposals 158 261 212Fixed assets 158 261 212
Interests received (+) 100 62 34CASH FLOWS RELATING TO INVESTING ACTIVITIES (III) (8,497) (7,951) (8,150)Increase (decrease) of cash flows from financing 1,055 (5,258) (2,228)
Capital - 105 -Proceeds from finance lease/bank loans 3,160 2,250 1,557Repayments of finance lease liabilities/bank loans (2,186) (3,908) (1,943)Bank overdrafts increase (decrease) 116 (3,769) (1,857)Cash restricted or pledged (35) 65 15
Financial charges (277) (317) (512)Dividends Paid (2,857) (3,264) (8,398)Own shares (931) 2,336 363NET CASH FLOWS RELATING TO FIN. ACTIVITIES (IV) (3,009) (6,504) (10,775)NET INCREASE IN CASH AND CASH EQUIVALENTS (V) = (II) + (III) + (IV) 5,564 5,510 (2,458)Exchange rates impact (VI) 141 466 100CASH AND CASH EQUIVALENTS, CLOSING BALANCE (VII) = (I) + (V) + (VI) 16,290 22,267 19,909(1) Included the change in LT trade receivables (2) cf. Note 4: Financial result
Operating activities generated a cash flow of € 16.5 million over the year. This breaks down into a P&L cash flow of € 21.4 million and a rising working capital requirement (€ -4.9 million). Zetes expects an at least partial improvement of the working capital situation in 2017. € 5.2 million was invested in non-current assets, which is more than in 2015 (€ 4.6 million). These break down into € 3.2 million for the Goods ID Division and € 2.0 million for the People ID division. Specific efforts were made in IT and in buildings upgrading and security. Capitalized R&D expenses increased at € 3.2 million. These costs relate principally to the Goods ID division, divided as before between the development of the MCL software and that of the application solutions, which form the basis of the new strategy. The R&D effort in People ID focused on the development and certification of a certificate issuance infrastructure that enables Zetes to gain access to issuer status. Financing-wise, a net € 2.2 million could be repaid to banks (loans/leasing/overdrafts). Zetes also paid a dividend of € 4.2 million in June 2016 and an interim dividend of the same amount of € 4.2 million in December 2016. Together these movements decreased cash and equivalents by 2.5 million €.

/ 6FINANCIAL INFORMATIONAND CORPORATE GOVERNANCE
Consolidated statement of changes in equity
In '000 € Issued capital (3) Reserves (3) Own
shares (4)
Currency translation reserves (2)
Hedging reserves Total (1) Non-controlling
interestsTotal
equity
Balance at 31 December 2013 49,895 30,465 (3,502) (714) (35) 76,109 963 77,072
Net result of the period 6,237 6,237 (41) 6,196Result directly allocated to equity 142 95 237 237Total comprehensive income 6,237 142 95 6,474 (41) 6,433Share-based payment 34 34 34Dividends (2,857) (2,857) (2,857)Acquisitions/sales of own shares (931) (931) (931)Increase (decrease) through changes in ownership interests in subsidiaries that do not result in change of control
(99) (99) (103) (202)
Other variations (0) (0) (11) (11)
Balance at 31 December 2014 49,895 33,780 (4,433) (572) 60 78,731 808 79,539
Net result of the period 11,045 11,045 (317) 10,728Result directly allocated to equity 240 (49) 191 191Total comprehensive income 11,045 240 (49) 11,236 (317) 10,919Capital increase 0 105 105Dividends (3,264) (3,264) (3,264)Acquisitions/sales of own shares 864 1,471 2,336 2,336Other variations 45 (45) (0) 39 39
Balance at 31 December 2015 49,895 42,471 (3,007) (332) 12 89,038 635 89,673
Net result of the period 11,415 11,415 56 11,471Result directly allocated to OCI 141 (12) 129 129Total comprehensive income 11,415 141 (12) 11,544 56 11,601Dividends (8,398) (8,398) (8,398)Share-based payment/options 113 113 113Acquisitions/sales of own shares 1,268 (906) 363 363Other variations 1,820 (1,980) 160 0 (16) (16)
Balance at 31 December 2016 51,715 44,890 (3,913) (31) 0 92,661 675 93,336(1) Attributable to equity holders of the parent company (2) In 2015, the increase of the translation reserves for an amount of 240 thousand € is mainly explained by the swiss franc's increase against the euro and by the rand's
decrease against the euro(3) In 2016, the other variations (1,820 and (1,980)) involve mainly the reclassification of the expenses related to the IPO, initially deducted from capital in 2005.
These have been reclassified as a reduction in reserves in 2016 to ensure the consistency of the amounts of subscribed capital in the consolidated financial statements and the statutory financial statements
(4) The evolution of own shares in 2016 is set out in Note 12: Equity
FINANCIAL INFORMATIONAND CORPORATE GOVERNANCE
/ 7
Summary of principal accounting The principal accounting policies adopted when preparing these consolidated financial statements are set out below.
1. Declaration of conformity
The consolidated financial statements at 31 December 2016 have been prepared in accordance with the International Financial Reporting Standards (IFRS), as adopted in the European Union. The Zetes Group has not anticipated any standards or interpretations issued prior to the approval date of the financial statements, and which come into application later than 31 December 2016. The accounting standards applied to the financial statements for the financial year ending on 31 December 2016 are consistent with those used when drawing up the consolidated financial statements for the year ending on 31 December 2015.
2. Summary of changes in accounting principles
a. Standards and interpretations applicable from 2016
No new standard, interpretation or amendment which could potentially have a significant impact on the consolidated financial statements was applicable for the first time in 2016.
b. Standards and interpretations published by not yet in force at 31 December 2016
The new standards apply once they have been adopted by the European Union.
No new standard, interpretation or amendment which could potentially have a significant impact on the consolidated financial statements is applicable for the first time in 2017.
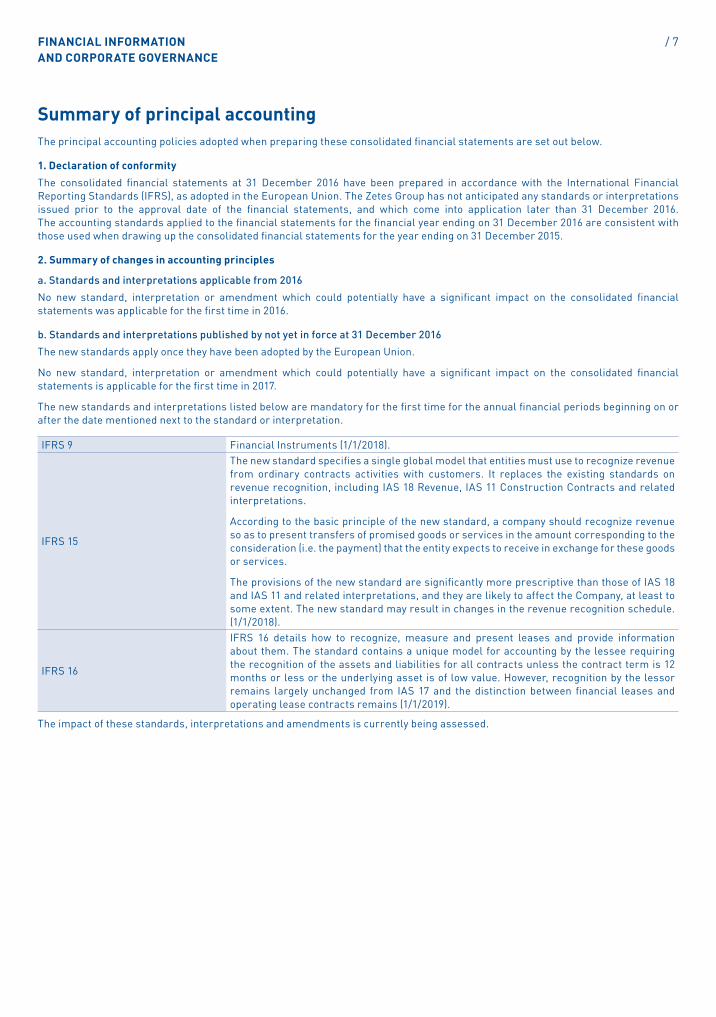
The new standards and interpretations listed below are mandatory for the first time for the annual financial periods beginning on or after the date mentioned next to the standard or interpretation.
IFRS 9 Financial Instruments (1/1/2018).
IFRS 15
The new standard specifies a single global model that entities must use to recognize revenue from ordinary contracts activities with customers. It replaces the existing standards on revenue recognition, including IAS 18 Revenue, IAS 11 Construction Contracts and related interpretations.
According to the basic principle of the new standard, a company should recognize revenue so as to present transfers of promised goods or services in the amount corresponding to the consideration (i.e. the payment) that the entity expects to receive in exchange for these goods or services.
The provisions of the new standard are significantly more prescriptive than those of IAS 18 and IAS 11 and related interpretations, and they are likely to affect the Company, at least to some extent. The new standard may result in changes in the revenue recognition schedule. (1/1/2018).
IFRS 16
IFRS 16 details how to recognize, measure and present leases and provide information about them. The standard contains a unique model for accounting by the lessee requiring the recognition of the assets and liabilities for all contracts unless the contract term is 12 months or less or the underlying asset is of low value. However, recognition by the lessor remains largely unchanged from IAS 17 and the distinction between financial leases and operating lease contracts remains (1/1/2019).
The impact of these standards, interpretations and amendments is currently being assessed.

/ 8FINANCIAL INFORMATIONAND CORPORATE GOVERNANCE
3. Preparation
The financial statements are prepared on a historical cost basis, except for the measurement at fair value of available-for-sale investments and derivative financial instruments. The consolidated financial statements are presented in euro, which is the company’s functional currency.
The preparation of these financial statements requires the use of estimates and assumptions in determining the value of assets and liabilities at the balance sheet date and income and expenses for the year. The Zetes Group revises its estimates at each closing date based on the best available information. The key estimates involve assessing:
• assets and liabilities in business combinations• the recoverable amount of goodwill and the intangible
assets (development costs)• the results of construction contracts• provisions, including for litigation• capitalized tax loss carry-forwards• where appropriate, the forecast evolution in results
4. Basis of consolidation
a. Subsidiaries
Subsidiaries are those entities controlled by the Company. Control exists when the Company has an interest of more than one half of the voting rights of an enterprise or otherwise has the power, directly or indirectly, to govern the financial and operating policies of an enterprise so as to obtain benefits from its activities. The financial statements of subsidiaries are included in the consolidated financial statements from the date that control commences (or a date nearby) until the date that control ceases. The acquisition of subsidiaries (business combination) is recorded in accordance with IFRS 3 revised, with identifiable assets acquired and liabilities assumed recorded at the time of takeover of control at fair value. Business combinations made before 1 January 2010 were accounted for under IFRS 3 (as applicable prior to revision) and have not been restated.
Intra-group balances and transactions, and unrealised gains arising from intra-group transactions, are eliminated in preparing the consolidated financial statements.
b. Joint ventures
Joint ventures are defined as any operations over which parties exert joint control (IFRS 11).
In 2009, Zetes concluded such an agreement with Pitkit Printing Entreprises. Based on an analysis of the contract, and consistent with the accounting of Pitkit Printing Entreprises, this partnership is treated in the consolidated financial statements as a joint venture.
5. Foreign currency translation
Transactions in foreign currencies are translated at an average rate that approximates the foreign exchange rate ruling at the time the transaction took place. Monetary assets and liabilities denominated in foreign currencies at the reporting date are translated to euro at the foreign exchange rate prevailing at that date. All foreign exchange gains and losses arising on this translation and from the settlement of the transactions are recognised in the income statement. Non-monetary assets and liabilities denominated in foreign currencies, which are stated at historical cost, are translated to euro at the foreign exchange rate prevailing at the date of the transaction.
Upon consolidation, the assets and liabilities of subsidiaries stated in foreign currencies are translated to euro at foreign exchange rates prevailing at the reporting date. Goodwill and fair value adjustments related to the acquisition of foreign subsidiaries are translated at the historical rate at the date of acquisition and therefore no exchange differences arise. Income and expenses are translated to euro at the average rate for the period. Foreign exchange differences arising on translation are recognised directly in equity. When a foreign entity is sold, such exchange differences are recognised in the income statement as part of the gain or loss on sale.
The main exchange rates used are:
Closing 2016
Closing 2015
Average2016
Average2015
1 Euro =Pound sterling 0.8562 0.734 0.8166 0.7257Swiss franc 1.0739 1.0835 1.0902 1.0672US dollar 1.0541 1.0887 1.1066 1.1096Rand 14.457 16.953 16.2140 14.0779
6. Revenue recognition
The Company does not specifically break out the sales of goods from the provision of services. In various cases, solutions are sold at an overall sales price with no distinction made between income from the provision of services and that from the sale of goods. The level of gross margin is the assessment criterion used by the Company as reflecting the value added by the Group.
Revenue is recognised to the extent that it is probable that the economic benefits will flow to Zetes and the revenue can be measured reliably. Additionally, the following criteria must be met:
a. Sale of products
Revenue from the sale of hardware products is recognised in the income statement when the significant risks and rewards of ownership have been transferred to the buyer.
Income from the sale of standard software is recognised at the time of physical delivery to the customer, to the extent that such sale is definitive. As a general rule, ownership of the software remains with the publisher, which grants only user rights to its customer.
b. Maintenance contracts
Revenue from maintenance contracts is recognised on a straight-line basis over the term of the service contract.
c. Integration services
Revenue from integration services, such as project management and installation of equipment, is recognised in the income statement according to the percentage of completion method. The degree of completion is measured by reference to the proportion of service costs incurred to date as a percentage of the estimated total service costs for each project.
d. Projects
Each project is broken down into its elementary components: hardware, software and services. Income is then recognised according to the rules which apply to each component. Where the individual components of a project cannot be broken out (sale of a total project), a global state of progress is determined and income from the project is determined as a function of this.

FINANCIAL INFORMATIONAND CORPORATE GOVERNANCE
/ 9
e. Construction contracts
A construction contract is a contract specifically negotiated for the construction of an asset or a combination of assets that are closely interrelated or interdependent in terms of their design, technology and functions or their ultimate purpose or use. In the Zetes People Authentication business, a construction contract typically involves the design and development of a card production pilot as well as the card production roll-out accompanied by project management and other value-added personalisation services.
When the outcome of a construction contract can be estimated reliably, contract revenue and contract costs are recognised using the percentage of completion method. The stage of completion is measured by reference to the number of cards produced in proportion of the total to be produced for each project. Contract cost includes all expenditure directly related to specific projects and an allocation of fixed and variable overheads incurred in connection with contract activities.
The aggregate of the contract costs incurred that relate to contract activity already performed, plus/minus the profit/loss recognised on each contract, is compared against the progress billings to date. Where costs plus/minus profit/loss exceed progress billings, the net balance is shown under trade and other receivables. Where progress billings exceed costs plus/less profit/loss, the net balance is shown under trade and other payables. Advance billings that relate to work to be performed in the future, are not considered in the above calculation and are included in advances received.
When it is appears probable that total contract costs will exceed total contract revenue, the expected loss is recognised in the income statement immediately. When the outcome of a construction contract cannot be estimated reliably, contract revenue is recognised to the extent of contract costs incurred where it is probable that those costs will be recovered.
f. Royalties, interest and dividends
Revenue from royalties is recognised on an accrual basis in accordance with the substance of the relevant agreements. Interest income is recognised on a time proportion basis, taking account of the principal outstanding and the effective rate over the period to maturity, when it is determined that such income will accrue to Zetes. Income from dividends receivable is recognised when the right to receive payment is established.
7. Government grants
A government grant is recognised when there is reasonable assurance that the grant will be received and all attaching conditions will be complied with.
Government grants related to development work done by Zetes are deducted from the related costs.
8. Property, plant and equipment
Property, plant and equipment are stated at cost less accumulated depreciation and any accumulated impairment losses.
Land is not depreciated while owned buildings are depreciated over 20 years or 25 years, depending on their nature, on a straight-line basis. Buildings are revalued by an outside valuer every three years, with recognition of any significant changes. Leasehold improvements are depreciated over the shorter of estimated useful life and lease term. Other items are depreciated on a straight-line basis over the estimated useful lives as follows:
Buildings structural works 20 – 25 years Building equipment and installations Maximum 10 years
Plant installations, machinery and equipment
3 - 5 years , or by the actual number of items produced vs. the total number of items expected to be produced on the machine
Goods ID equipment for commercial use (demo stock) 2 – 4 years
Computer and office equipment 3 – 5 years
Furniture 5 – 10 years Vehicles 4 – 5 years
9. Intangible assets
a. Research & development
Zetes does not perform any fundamental research activities. Development expenditure is recognised as an intangible asset, only when (among other criteria) it can be demonstrated that the product resulting from the development is likely to generate economic benefits and when the expenditure incurred on the development can be measured reliably. Capitalised development expenditure is measured at cost less accumulated amortisation and any accumulated impairment losses. Amortisation is charged on a straight-line basis over the estimated useful life of the related asset, which is expected to be 3 years.
b. Other intangible assets
Expenditure to acquire computer software and other licenses are stated at cost less accumulated amortisation and any accumulated impairment losses. Amortisation is charged on a straight-line basis over the estimated useful life, not exceeding 5 years.
c. Goodwill
Goodwill arising on acquisition of subsidiaries and joint ventures represents the excess of the cost of the acquisition over Zetes’ share in the net fair value of the identifiable assets liabilities and contingent liabilities recognised. Goodwill is recognised as an asset and is initially measured at cost. Subsequently its carrying value may be reduced by accumulated impairment losses (application of an impairment test).
10. Current assets and liabilities
a. Inventories
Inventories are stated at the lower of cost and net realisable value. In respect of raw materials and consumables, cost is accounted for according to the weighted average price. The cost of goods purchased for re-sale is the individual purchase price of each individual item or the weighted average price. Work in progress and finished goods are valued at manufacturing cost, which includes all direct production costs.
b. Inventory write-down
The amount of write-down is estimated by an analysis of stock rotation (sales/product), with a distinction made between finished goods and repair parts/equipment.
When inventories are sold, the carrying amount of those inventories is recognised as an expense in the period in which the related revenue is recognised.

/ 10FINANCIAL INFORMATIONAND CORPORATE GOVERNANCE
The amount of any reversal of inventory write-downs owing to an increase in the net realisable value is accounted for as a reduction in the amount of inventory charged to the period in which the reversal takes place.
c. Trade receivables
Trade receivables are recognised and carried at original invoice amount (nominal value). Allowances are recognised when collection of the full amount is no longer probable.
d. Trade payables
Trade payables are stated at their nominal value.
11. Cash and cash equivalents
Cash and cash equivalents are carried at nominal value in the balance sheet. They comprise cash at bank and in hand, as well as short-term deposits with banks and commercial paper with a term of three months or less, that are readily convertible to cash and that are not subject to significant risks of changes in value.
12. Leases
a. Financial leases
Leases, in which Zetes obtains the right to use assets, are classified as finance leases if substantially all the risks and rewards incident to ownership of the leased item are transferred to Zetes. Finance leases are capitalised at the fair value of the leased item at the inception of the lease or, if lower, at the present value of the minimum lease payments. Lease payments are apportioned between the finance charges and the reduction of the lease debt as to achieve a constant rate of interest on the remaining balance of the debt. Finance charges are charged directly against the income statement.
Depreciation
Assets held under financial leases are depreciated on a straight-line basis over the useful life of the asset. If there is no reasonable certainty that Zetes will be the owner of an asset at the end of a lease, the asset is 100% depreciated over the shorter of the length of the lease or the useful life of the asset.
b. Operating leases
Leases that do not meet the criteria of finance leases are classified as operating leases. Payments made under operating leases are charged to the income statement on a straight-line basis over the lease term.
13. Income taxes
Income tax expense is recognised in the income statement.
a. Current tax
Current tax is the estimated tax payable on the taxable income for the year, based on tax rates (and tax laws) that have been enacted or substantively enacted at the reporting date, and any adjustment to tax payable in respect of previous years.
b. Deferred tax
Deferred tax is provided using the balance sheet method in respect of temporary differences between the carrying amount of assets and liabilities for financial reporting purposes and the amounts used for taxation purposes.
Deferred tax liabilities are recognised for all taxable temporary differences, except where the deferred tax liability arises from goodwill amortisation.
Deferred tax assets are recognised for all deductible temporary differences, unused tax losses and unused tax credits, to the extent that it is probable that taxable profit will be available against which the deductible temporary differences, unused tax losses and unused tax credits can be utilised (selected horizon: 5 years).
In respect of tax losses acquired upon investments in subsidiaries and joint ventures, deferred tax assets are recognised only to the extent that it is probable that the taxable profit against which the tax loss can be utilised will be generated within five years after the acquisition.
The carrying amount of deferred income tax assets is reviewed at each reporting date and reduced to the extent that it is no longer probable that sufficient taxable profit will be available to allow all or part of the deferred income tax asset to be utilised. Deferred income tax assets and liabilities are measured at the tax rates that are expected to apply to the period when the asset is realized or the liability is settled, based on tax rates (and tax laws) that have been enacted or substantively enacted at the reporting date.
14. Equity – capital increase
The transaction costs linked to any capital increases are accounted for as a deduction from equity, net of any related income tax benefit.
15. Dividends payable
Dividends declared after the balance sheet date are not recognised as a liability at the reporting date but are directly deducted from equity when paid.
16. Provisions
A provision is recognised when (i) Zetes has a present obligation (legal or constructive) as a result of a past event, (ii) it is probable that an outflow of resources will be required to settle the obligation, and (iii) a reliable estimate of the amount can be made. Where Zetes expects an amount for which a provision has been charged to be reimbursed, for example under an insurance contract, the reimbursement is recognised as a separate asset but only when the reimbursement is virtually certain. If the effect of the time value of money is material, provisions are determined by discounting the expected future cash flows at a rate that reflects current market assessments of the time value of money and, where appropriate, the risks specific to the liability.
Commitments resulting from restructurings are recognised when announced to the persons concerned.
17. Pension benefit plans and other post-employment benefits
Zetes operates various post employment benefit plans in accordance with the local conditions and practices of the countries in which it operates.
Costs relating to defined contribution pension plans are recognised when due. There are currently no pension plans of the defined benefit type in place at Zetes. In Belgium, however, legislation requires that the employer to guarantee a return on employer and employee contributions, thereby creating a potential liability for the Group. Given this guaranteed return, Belgian defined contribution schemes could be viewed as defined benefit schemes.

FINANCIAL INFORMATIONAND CORPORATE GOVERNANCE
/ 11
Certain subsidiaries provide a post-employment benefit that is not a pension plan. The benefits are unfunded and represent a legal obligation consisting of defined payments when employees leave the Company. The related provision is determined separately for each employee (present value of the estimated future cash outflows).
18. Derivative financial instruments
Derivative financial instruments utilised by Zetes are principally forward exchange contracts and currency options for hedging purposes. Any changes in fair value linked to a hedging operation are taken directly to the Statement of Total Comprehensive Income
No derivative instrument is held or has been issued for trading purposes.
19. Borrowing costs
Borrowing costs, including interest on borrowings and bank overdrafts, as well as ancillary costs incurred in connection with the arrangement of borrowings, are recognised as an expense in the period in which they are incurred.

/ 12FINANCIAL INFORMATIONAND CORPORATE GOVERNANCE
Notes to the consolidated accounts
NOTE 1. CONSOLIDATED COMPANIES
SUBSIDIARY Country Ownership % Consolidation Method Change (1) Date of change
Accuscan International Ltd UK 100 GlobalBlackbird Data Systems Ltd Ireland 100 GlobalBurotica SA Portugal 100 GlobalId-All BV The Netherlands 100 GlobalIND Systeme GmbH Germany 100 GlobalJB BVBA Belgium 100 GlobalLogiscan SARL France 100 GlobalMetaform Ltd Israel 100 GlobalPowersys 2000 S.L. Spain 100 GlobalRASW Management Maarn BV The Netherlands 100 GlobalRFIDEA SA Belgium 100 GlobalRuisbroek BVBA Belgium 100 GlobalZetes Austria GmbH Austria 100 GlobalZetes Auto ID Systems AG Switzerland 100 GlobalZetes BV The Netherlands 100 GlobalZetes Côte d'Ivoire Ivory Coast 100 GlobalZetes Fastrace SA Belgium 75,9 GlobalZetes Gambia Ltd Gambia 100 GlobalZetes GmbH Germany 100 GlobalZetes Holding GmbH Germany 100 GlobalZetes Holding Ltd UK 100 GlobalZetes Industries (Israël) Ltd Israel 100 GlobalZetes International GmbH Germany 100 GlobalZetes Ireland Ltd Ireland 100 GlobalZetes Ltd UK 100 GlobalZetes Multicom SA Spain 100 GlobalZetes NetWave SA Information Systems and Telecommunications Greece 58,1 Global
Zetes Norway Norway 100 GlobalZetes Pty Ltd South Africa 90 GlobalZetes SA Belgium 100 GlobalZetes SAS France 100 GlobalZetes Senegal SARL Senegal 100 GlobalZETES Solutions CZ s.r.o. Czech Republic 100 GlobalZetes SRL Italy 100 GlobalZetes Technologies SA Belgium 50 GlobalZts Lda Portugal 100 Global
Number of consolidated subsidiaries: 36
Zetes Industries directly or indirectly owns 100% of the capital of the majority of the Group's operating companies;
Zetes Industries financially supports its subsidiaries through investmenst (capital) or loans. On 31/12/2016, Zetes Industries had non-trade receivables due by Group companies for an amount of 23.4 million €.
Zetes Industries guarantees on a case-by-case basis the commitments of its subsidiaries towards various banks, customers and suppliers (cf. note 14 - Contingent liabilities).
(1) % of shares acquired during the year

FINANCIAL INFORMATIONAND CORPORATE GOVERNANCE
/ 13
(*) Limited or no operations
01-Z
etes
Indu
strie
s SA
(Bel
gium
)D
ecem
ber 2
016
02-Z
etes
SA
B
elgi
um
25-Z
etes
Mul
ticom
S
pain
23-Z
etes
Hol
ding
s Ire
land
(*)
17-Z
etes
BV
N
ethe
rland
s
05-Z
TS P
ortu
gal (
*)
15
-Bur
otic
a P
ortu
gal
03-Z
etes
Te
chno
logi
es S
A (*
)
28-P
ower
sys
Spa
in (*
)
31-R
AS
W
Voc
ogni
tion
NL
(*)
07-Z
etes
Fas
trace
B
elgi
um
12-ID
-All
NL(
*)
100%
34%
41.9
%
100%
100%
100%
100%
100%
100%
100%
50%
50
%
81.4
%
100%
18.6
%
35-Z
etes
Sw
itzer
land
36-Z
etes
Hol
ding
s G
erm
any
(*)
34-Z
etes
Gm
bH
Ger
man
y 37
-IND
Sys
tem
e 37
-IND
Sys
tem
e G
mbH
Ger
man
y
21-Z
etes
Bla
ckbi
rd
Irela
nd
22-Z
etes
Hol
ding
s U
K (*
)
38-Z
etes
Acc
usca
n U
K (*
)
32-Z
etes
UK
100%
50.1
6%
49.8
4%
100%
100%
100%
100%
14-Z
etes
Inte
rnat
iona
l G
erm
any
(*)
30-Z
etes
Isra
el
04-Z
etes
Fra
nce
27-Z
etes
Ital
y 50
%
100%
100%
100%
10
%
90%
40-Z
etes
Log
isca
n Fr
ance
(*)
100%
41-Z
etes
Côt
e d'
Ivoi
re
90%
29-M
etaf
orm
Ltd
Is
rael
10
0%
43-Z
etes
Net
wav
e G
reec
e 58
.12%
10%
45-R
fidea
B
elgi
um
46-Z
etes
Sou
th
Afri
ca
100%
90%
100%
47-Z
etes
S
olut
ions
CZ
48-Z
etes
Sen
egal
S
N
49
-Zet
es G
ambi
a G
M
52-J
B B
VB
A (*
)
100%
90%
10%
10
0%
51
-Rui
sbro
ekB
VB
A (*
) 10
0%
10%
50-Z
etes
Aus
tria
100%
100%
54
-Zet
es ID
Col
ombi
a
100%
53
-Zet
esN
orw
ay
/ 14FINANCIAL INFORMATIONAND CORPORATE GOVERNANCE
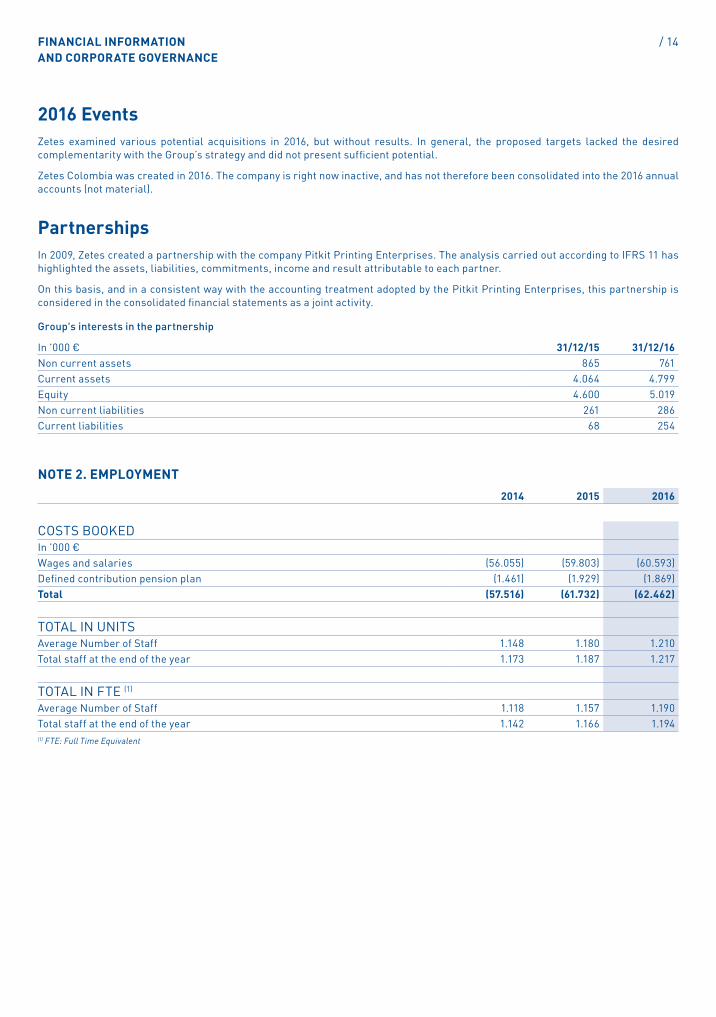
2016 EventsZetes examined various potential acquisitions in 2016, but without results. In general, the proposed targets lacked the desired complementarity with the Group’s strategy and did not present sufficient potential.
Zetes Colombia was created in 2016. The company is right now inactive, and has not therefore been consolidated into the 2016 annual accounts (not material).
PartnershipsIn 2009, Zetes created a partnership with the company Pitkit Printing Enterprises. The analysis carried out according to IFRS 11 has highlighted the assets, liabilities, commitments, income and result attributable to each partner.
On this basis, and in a consistent way with the accounting treatment adopted by the Pitkit Printing Enterprises, this partnership is considered in the consolidated financial statements as a joint activity.
Group's interests in the partnership
In '000 € 31/12/15 31/12/16Non current assets 865 761Current assets 4.064 4.799Equity 4.600 5.019Non current liabilities 261 286Current liabilities 68 254
NOTE 2. EMPLOYMENT2014 2015 2016
COSTS BOOKEDIn '000 €Wages and salaries (56.055) (59.803) (60.593)Defined contribution pension plan (1.461) (1.929) (1.869)Total (57.516) (61.732) (62.462)
TOTAL IN UNITSAverage Number of Staff 1.148 1.180 1.210Total staff at the end of the year 1.173 1.187 1.217
TOTAL IN FTE (1)
Average Number of Staff 1.118 1.157 1.190Total staff at the end of the year 1.142 1.166 1.194(1) FTE: Full Time Equivalent

FINANCIAL INFORMATIONAND CORPORATE GOVERNANCE
/ 15
NOTE 3. SEGMENT REPORTINGIn '000 € 2014 2015 2016
GOODS IDSales 190.639 204.306 205.030Gross margin 74.760 80.563 82.298In % of sales 39,2% 39,4% 40,1%
Operating expenses (62.613) (65.922) (66.377)Current EBITDA 12.147 14.641 15.920In % of sales 6,4% 7,2% 7,8%
Non current costs (961) (438) (102)EBITDA 11.186 14.203 15.818In % of sales 5,9% 7,0% 7,7%
Depreciation on fixed assets (3.347) (3.178) (2.448)Depreciation on development costs (2.145) (2.317) (2.566)Write-downs on stock/receivables/provisions and other (438) (914) (880)Provisions, depreciation, amortisation, impairment losses (5.930) (6.409) (5.894)
Current EBIT 6.217 8.232 10.026In % of sales 3,3% 4,0% 4,9%
EBIT 5.255 7.794 9.924In % of sales 2,8% 3,8% 4,8%
PEOPLE IDSales 54.630 53.919 48.371Gross margin 28.819 35.016 32.546In % of sales 52,8% 64,9% 67,3%
Operating expenses (18.265) (19.495) (18.329)Current EBITDA 10.554 15.521 14.217In % of sales 19,3% 28,8% 29,4%
Non current costs (3) (1) -EBITDA 10.552 15.520 14.217In % of sales 19,3% 28,8% 29,4%
Depreciation on fixed assets (2.031) (2.989) (2.645)Depreciation on development costs (179) (62) (81)Write-downs on stock/receivables/provisions and other (78) (80) (320)Provisions, depreciation, amortisation, impairment losses (2.288) (3.130) (3.046)
Current EBIT 8.266 12.391 11.171In % of sales 15,1% 23,0% 23,1%
EBIT 8.264 12.390 11.171In % of sales 15,1% 23,0% 23,1%

/ 16FINANCIAL INFORMATIONAND CORPORATE GOVERNANCE
NOTE 3. SEGMENT REPORTING (NEXT)In '000 € 2014 2015 2016
INCOME STATEMENT - RECONCILIATIONGoods ID 190,639 204,306 205,030People ID 54,630 53,919 48,371Corporate - (0) -Total sales 245,270 258,225 253,401
Goods ID 74,760 80,563 82,298In % of sales 39.2% 39.4% 40.1%People ID 28,819 35,016 32,546In % of sales 52.8% 64.9% 67.3%Corporate - - -Total gross margin 103,579 115,579 114,844Total gross margin in % of sales 42.2% 44.8% 45.3%
Goods ID (62,613) (65,922) (66,377)People ID (18,265) (19,495) (18,329)Corporate (3,496) (3,471) (3,599)Total operating expenses (84,374) (88,888) (88,306)
Goods ID 12,147 14,641 15,920In % of sales 6.4% 7.2% 7.8%People ID 10,554 15,521 14,217In % of sales 19.3% 28.8% 29.4%Corporate (3,496) (3,471) (3,599)Total current EBITDA 19,205 26,691 26,538Total current EBITDA in % of sales 7.8% 10.3% 10.5%
Goods ID 11,186 14,203 15,818People ID 10,552 15,520 14,217Corporate (3,547) (3,471) (4,243)Total EBITDA 18,190 26,252 25,792
Goods ID (5,930) (6,409) (5,894)People ID (2,288) (3,130) (3,046)Corporate (189) (47) 12Total provisions, depreciation and amortisation (8,407) (9,586) (8,929)
Goods ID 6,217 8,232 10,026In % of sales 3.3% 4.0% 4.9%People ID 8,266 12,391 11,171In % of sales 15.1% 23.0% 23.1%Corporate (3,686) (3,518) (3,587)Total current EBIT 10,798 17,105 17,610Total current EBIT in % of sales 4.4% 6.6% 6.9%
Goods ID 5,255 7,794 9,924People ID 8,264 12,390 11,171Corporate (3,736) (3,518) (4,231)Total EBIT 9,783 16,666 16,864
FINANCIAL INFORMATIONAND CORPORATE GOVERNANCE
/ 17
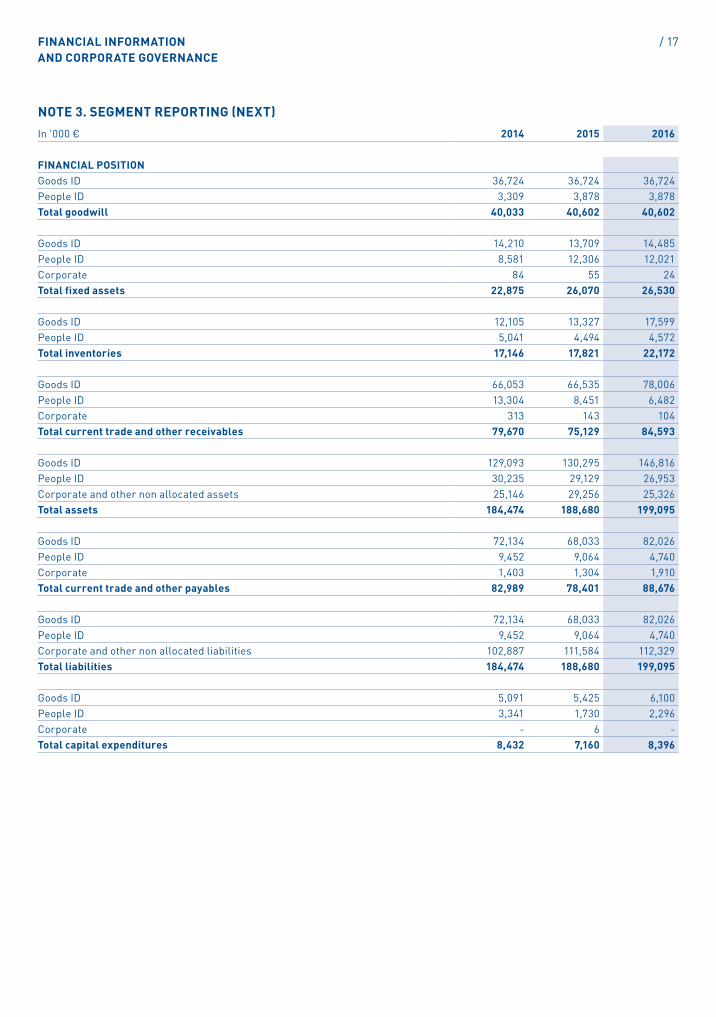
NOTE 3. SEGMENT REPORTING (NEXT)In '000 € 2014 2015 2016
FINANCIAL POSITIONGoods ID 36,724 36,724 36,724People ID 3,309 3,878 3,878Total goodwill 40,033 40,602 40,602
Goods ID 14,210 13,709 14,485People ID 8,581 12,306 12,021Corporate 84 55 24Total fixed assets 22,875 26,070 26,530
Goods ID 12,105 13,327 17,599People ID 5,041 4,494 4,572Total inventories 17,146 17,821 22,172
Goods ID 66,053 66,535 78,006People ID 13,304 8,451 6,482Corporate 313 143 104Total current trade and other receivables 79,670 75,129 84,593
Goods ID 129,093 130,295 146,816People ID 30,235 29,129 26,953Corporate and other non allocated assets 25,146 29,256 25,326Total assets 184,474 188,680 199,095
Goods ID 72,134 68,033 82,026People ID 9,452 9,064 4,740Corporate 1,403 1,304 1,910Total current trade and other payables 82,989 78,401 88,676
Goods ID 72,134 68,033 82,026People ID 9,452 9,064 4,740Corporate and other non allocated liabilities 102,887 111,584 112,329Total liabilities 184,474 188,680 199,095
Goods ID 5,091 5,425 6,100People ID 3,341 1,730 2,296Corporate - 6 -Total capital expenditures 8,432 7,160 8,396
/ 18FINANCIAL INFORMATIONAND CORPORATE GOVERNANCE
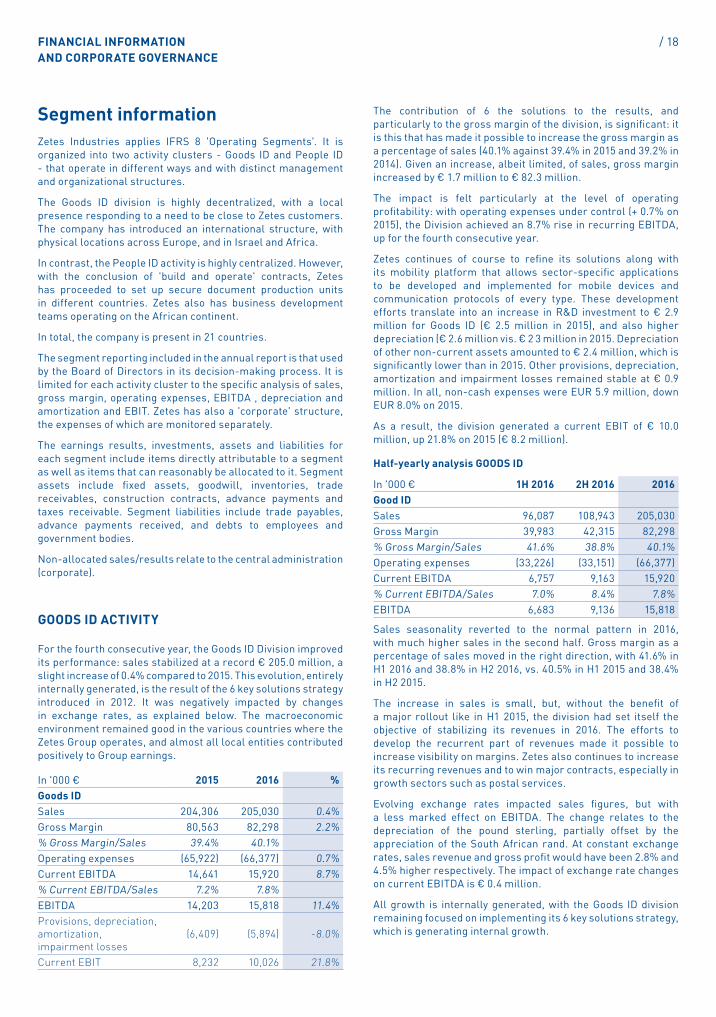
Segment information Zetes Industries applies IFRS 8 'Operating Segments'. It is organized into two activity clusters - Goods ID and People ID - that operate in different ways and with distinct management and organizational structures.
The Goods ID division is highly decentralized, with a local presence responding to a need to be close to Zetes customers. The company has introduced an international structure, with physical locations across Europe, and in Israel and Africa.
In contrast, the People ID activity is highly centralized. However, with the conclusion of 'build and operate' contracts, Zetes has proceeded to set up secure document production units in different countries. Zetes also has business development teams operating on the African continent.
In total, the company is present in 21 countries.
The segment reporting included in the annual report is that used by the Board of Directors in its decision-making process. It is limited for each activity cluster to the specific analysis of sales, gross margin, operating expenses, EBITDA , depreciation and amortization and EBIT. Zetes has also a 'corporate' structure, the expenses of which are monitored separately.
The earnings results, investments, assets and liabilities for each segment include items directly attributable to a segment as well as items that can reasonably be allocated to it. Segment assets include fixed assets, goodwill, inventories, trade receivables, construction contracts, advance payments and taxes receivable. Segment liabilities include trade payables, advance payments received, and debts to employees and government bodies.
Non-allocated sales/results relate to the central administration (corporate).
GOODS ID ACTIVITY
For the fourth consecutive year, the Goods ID Division improved its performance: sales stabilized at a record € 205.0 million, a slight increase of 0.4% compared to 2015. This evolution, entirely internally generated, is the result of the 6 key solutions strategy introduced in 2012. It was negatively impacted by changes in exchange rates, as explained below. The macroeconomic environment remained good in the various countries where the Zetes Group operates, and almost all local entities contributed positively to Group earnings.
In '000 € 2015 2016 %Goods ID Sales 204,306 205,030 0.4%Gross Margin 80,563 82,298 2.2%% Gross Margin/Sales 39.4% 40.1%Operating expenses (65,922) (66,377) 0.7%Current EBITDA 14,641 15,920 8.7%% Current EBITDA/Sales 7.2% 7.8%EBITDA 14,203 15,818 11.4%Provisions, depreciation, amortization, impairment losses
(6,409) (5,894) -8.0%
Current EBIT 8,232 10,026 21.8%
The contribution of 6 the solutions to the results, and particularly to the gross margin of the division, is significant: it is this that has made it possible to increase the gross margin as a percentage of sales (40.1% against 39.4% in 2015 and 39.2% in 2014). Given an increase, albeit limited, of sales, gross margin increased by € 1.7 million to € 82.3 million.
The impact is felt particularly at the level of operating profitability: with operating expenses under control (+ 0.7% on 2015), the Division achieved an 8.7% rise in recurring EBITDA, up for the fourth consecutive year.
Zetes continues of course to refine its solutions along with its mobility platform that allows sector-specific applications to be developed and implemented for mobile devices and communication protocols of every type. These development efforts translate into an increase in R&D investment to € 2.9 million for Goods ID (€ 2.5 million in 2015), and also higher depreciation (€ 2.6 million vis. € 2 3 million in 2015. Depreciation of other non-current assets amounted to € 2.4 million, which is significantly lower than in 2015. Other provisions, depreciation, amortization and impairment losses remained stable at € 0.9 million. In all, non-cash expenses were EUR 5.9 million, down EUR 8.0% on 2015.
As a result, the division generated a current EBIT of € 10.0 million, up 21.8% on 2015 (€ 8.2 million).
Half-yearly analysis GOODS ID
In '000 € 1H 2016 2H 2016 2016Good ID Sales 96,087 108,943 205,030Gross Margin 39,983 42,315 82,298% Gross Margin/Sales 41.6% 38.8% 40.1%Operating expenses (33,226) (33,151) (66,377)Current EBITDA 6,757 9,163 15,920% Current EBITDA/Sales 7.0% 8.4% 7.8%EBITDA 6,683 9,136 15,818
Sales seasonality reverted to the normal pattern in 2016, with much higher sales in the second half. Gross margin as a percentage of sales moved in the right direction, with 41.6% in H1 2016 and 38.8% in H2 2016, vs. 40.5% in H1 2015 and 38.4% in H2 2015.
The increase in sales is small, but, without the benefit of a major rollout like in H1 2015, the division had set itself the objective of stabilizing its revenues in 2016. The efforts to develop the recurrent part of revenues made it possible to increase visibility on margins. Zetes also continues to increase its recurring revenues and to win major contracts, especially in growth sectors such as postal services.
Evolving exchange rates impacted sales figures, but with a less marked effect on EBITDA. The change relates to the depreciation of the pound sterling, partially offset by the appreciation of the South African rand. At constant exchange rates, sales revenue and gross profit would have been 2.8% and 4.5% higher respectively. The impact of exchange rate changes on current EBITDA is € 0.4 million.
All growth is internally generated, with the Goods ID division remaining focused on implementing its 6 key solutions strategy, which is generating internal growth.
FINANCIAL INFORMATIONAND CORPORATE GOVERNANCE
/ 19
PEOPLE ID DIVISION
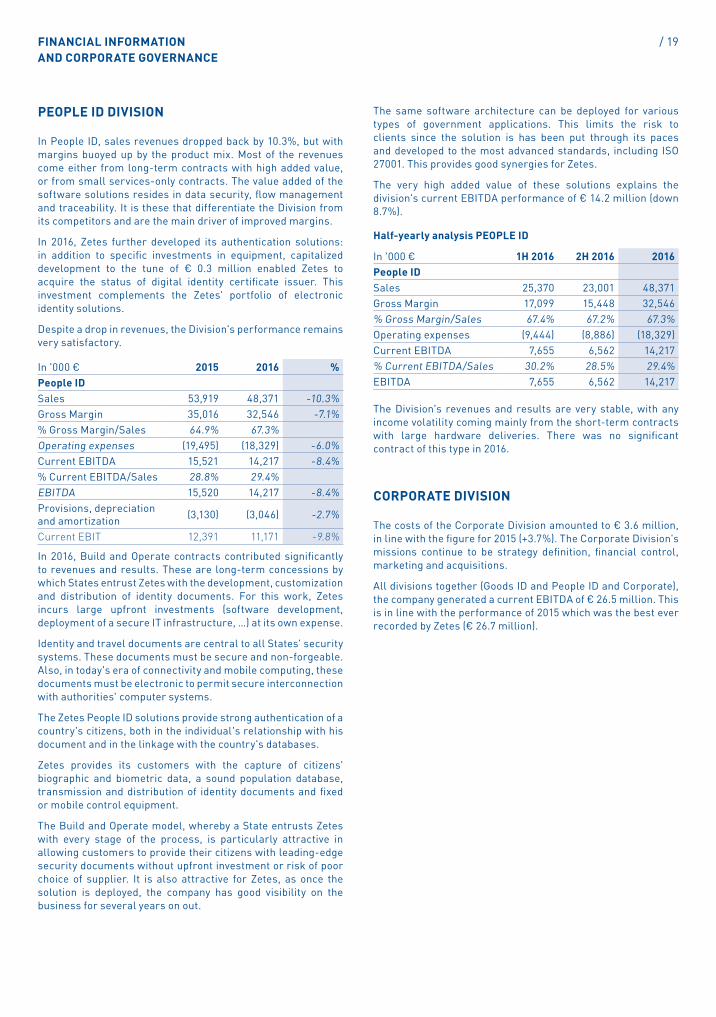
In People ID, sales revenues dropped back by 10.3%, but with margins buoyed up by the product mix. Most of the revenues come either from long-term contracts with high added value, or from small services-only contracts. The value added of the software solutions resides in data security, flow management and traceability. It is these that differentiate the Division from its competitors and are the main driver of improved margins.
In 2016, Zetes further developed its authentication solutions: in addition to specific investments in equipment, capitalized development to the tune of € 0.3 million enabled Zetes to acquire the status of digital identity certificate issuer. This investment complements the Zetes' portfolio of electronic identity solutions.
Despite a drop in revenues, the Division's performance remains very satisfactory.
In '000 € 2015 2016 %People IDSales 53,919 48,371 -10.3%Gross Margin 35,016 32,546 -7.1%% Gross Margin/Sales 64.9% 67.3%Operating expenses (19,495) (18,329) -6.0%Current EBITDA 15,521 14,217 -8.4%% Current EBITDA/Sales 28.8% 29.4%EBITDA 15,520 14,217 -8.4%Provisions, depreciation and amortization (3,130) (3,046) -2.7%
Current EBIT 12,391 11,171 -9.8%
In 2016, Build and Operate contracts contributed significantly to revenues and results. These are long-term concessions by which States entrust Zetes with the development, customization and distribution of identity documents. For this work, Zetes incurs large upfront investments (software development, deployment of a secure IT infrastructure, …) at its own expense.
Identity and travel documents are central to all States' security systems. These documents must be secure and non-forgeable. Also, in today's era of connectivity and mobile computing, these documents must be electronic to permit secure interconnection with authorities' computer systems.
The Zetes People ID solutions provide strong authentication of a country's citizens, both in the individual's relationship with his document and in the linkage with the country's databases.
Zetes provides its customers with the capture of citizens' biographic and biometric data, a sound population database, transmission and distribution of identity documents and fixed or mobile control equipment.
The Build and Operate model, whereby a State entrusts Zetes with every stage of the process, is particularly attractive in allowing customers to provide their citizens with leading-edge security documents without upfront investment or risk of poor choice of supplier. It is also attractive for Zetes, as once the solution is deployed, the company has good visibility on the business for several years on out.
The same software architecture can be deployed for various types of government applications. This limits the risk to clients since the solution is has been put through its paces and developed to the most advanced standards, including ISO 27001. This provides good synergies for Zetes.
The very high added value of these solutions explains the division's current EBITDA performance of € 14.2 million (down 8.7%).
Half-yearly analysis PEOPLE ID
In '000 € 1H 2016 2H 2016 2016People ID Sales 25,370 23,001 48,371Gross Margin 17,099 15,448 32,546% Gross Margin/Sales 67.4% 67.2% 67.3%Operating expenses (9,444) (8,886) (18,329)Current EBITDA 7,655 6,562 14,217% Current EBITDA/Sales 30.2% 28.5% 29.4%EBITDA 7,655 6,562 14,217
The Division's revenues and results are very stable, with any income volatility coming mainly from the short-term contracts with large hardware deliveries. There was no significant contract of this type in 2016.
CORPORATE DIVISION
The costs of the Corporate Division amounted to € 3.6 million, in line with the figure for 2015 (+3.7%). The Corporate Division's missions continue to be strategy definition, financial control, marketing and acquisitions.
All divisions together (Goods ID and People ID and Corporate), the company generated a current EBITDA of € 26.5 million. This is in line with the performance of 2015 which was the best ever recorded by Zetes (€ 26.7 million).
/ 20FINANCIAL INFORMATIONAND CORPORATE GOVERNANCE
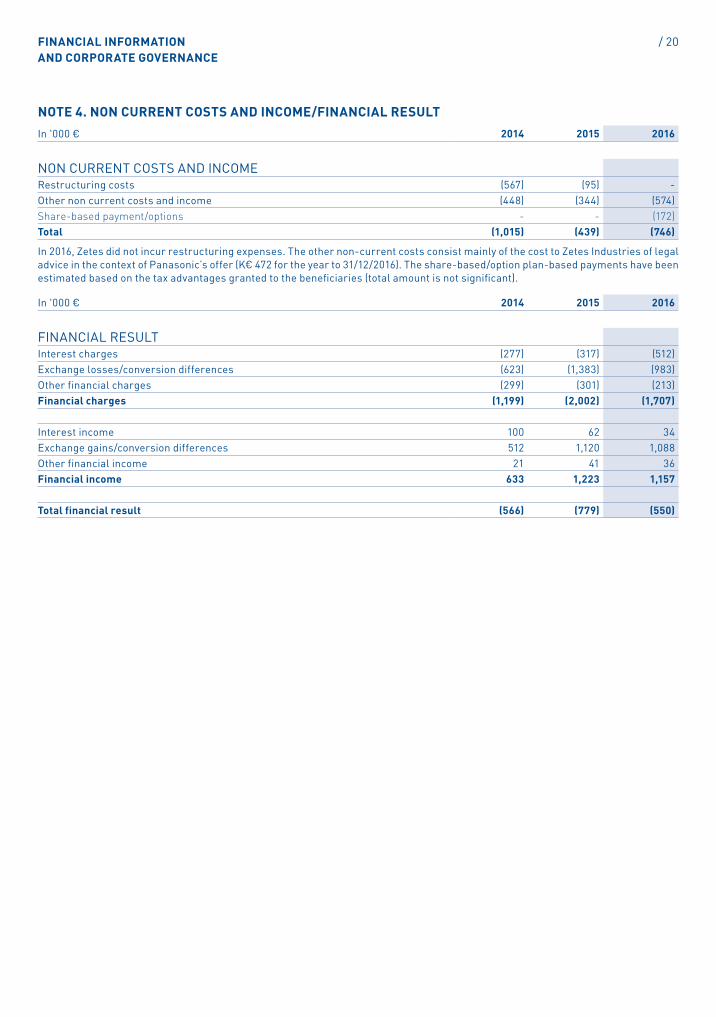
NOTE 4. NON CURRENT COSTS AND INCOME/FINANCIAL RESULTIn '000 € 2014 2015 2016
NON CURRENT COSTS AND INCOMERestructuring costs (567) (95) -Other non current costs and income (448) (344) (574)Share-based payment/options - - (172)Total (1,015) (439) (746)
In 2016, Zetes did not incur restructuring expenses. The other non-current costs consist mainly of the cost to Zetes Industries of legal advice in the context of Panasonic’s offer (K€ 472 for the year to 31/12/2016). The share-based/option plan-based payments have been estimated based on the tax advantages granted to the beneficiaries (total amount is not significant).
In '000 € 2014 2015 2016
FINANCIAL RESULTInterest charges (277) (317) (512)Exchange losses/conversion differences (623) (1,383) (983)Other financial charges (299) (301) (213)Financial charges (1,199) (2,002) (1,707)
Interest income 100 62 34Exchange gains/conversion differences 512 1,120 1,088Other financial income 21 41 36Financial income 633 1,223 1,157
Total financial result (566) (779) (550)
FINANCIAL INFORMATIONAND CORPORATE GOVERNANCE
/ 21
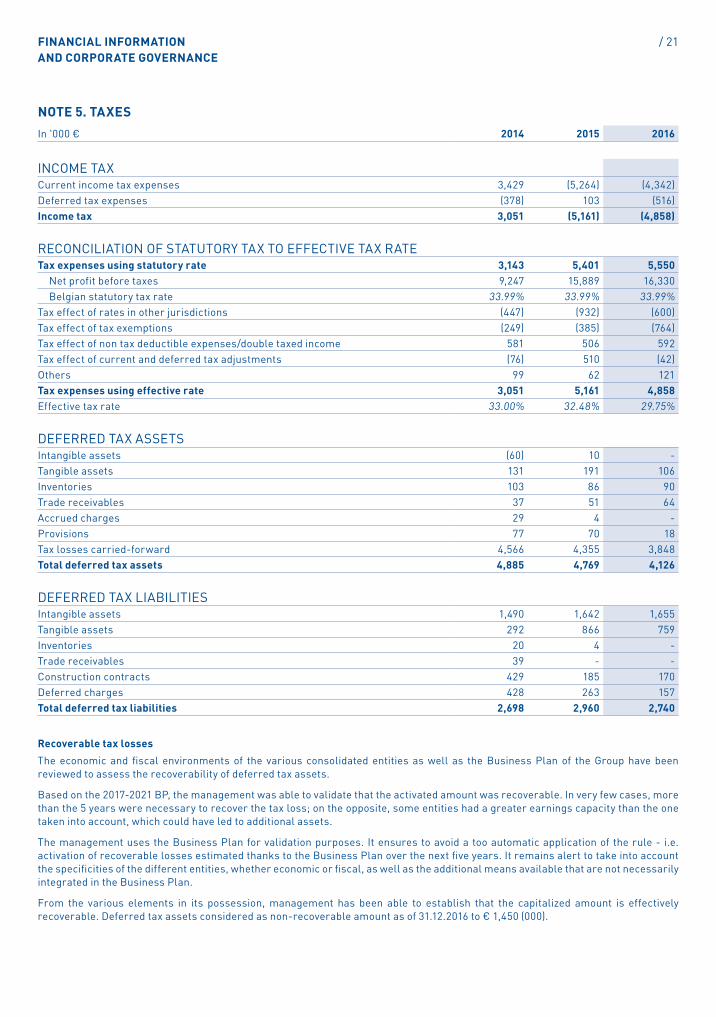
NOTE 5. TAXESIn '000 € 2014 2015 2016
INCOME TAXCurrent income tax expenses 3,429 (5,264) (4,342)Deferred tax expenses (378) 103 (516)Income tax 3,051 (5,161) (4,858)
RECONCILIATION OF STATUTORY TAX TO EFFECTIVE TAX RATETax expenses using statutory rate 3,143 5,401 5,550
Net profit before taxes 9,247 15,889 16,330Belgian statutory tax rate 33.99% 33.99% 33.99%
Tax effect of rates in other jurisdictions (447) (932) (600)Tax effect of tax exemptions (249) (385) (764)Tax effect of non tax deductible expenses/double taxed income 581 506 592Tax effect of current and deferred tax adjustments (76) 510 (42)Others 99 62 121Tax expenses using effective rate 3,051 5,161 4,858Effective tax rate 33.00% 32.48% 29.75%
DEFERRED TAX ASSETSIntangible assets (60) 10 -Tangible assets 131 191 106Inventories 103 86 90Trade receivables 37 51 64Accrued charges 29 4 -Provisions 77 70 18Tax losses carried-forward 4,566 4,355 3,848Total deferred tax assets 4,885 4,769 4,126
DEFERRED TAX LIABILITIESIntangible assets 1,490 1,642 1,655Tangible assets 292 866 759Inventories 20 4 -Trade receivables 39 - -Construction contracts 429 185 170Deferred charges 428 263 157Total deferred tax liabilities 2,698 2,960 2,740
Recoverable tax losses
The economic and fiscal environments of the various consolidated entities as well as the Business Plan of the Group have been reviewed to assess the recoverability of deferred tax assets.
Based on the 2017-2021 BP, the management was able to validate that the activated amount was recoverable. In very few cases, more than the 5 years were necessary to recover the tax loss; on the opposite, some entities had a greater earnings capacity than the one taken into account, which could have led to additional assets.
The management uses the Business Plan for validation purposes. It ensures to avoid a too automatic application of the rule - i.e. activation of recoverable losses estimated thanks to the Business Plan over the next five years. It remains alert to take into account the specificities of the different entities, whether economic or fiscal, as well as the additional means available that are not necessarily integrated in the Business Plan.
From the various elements in its possession, management has been able to establish that the capitalized amount is effectively recoverable. Deferred tax assets considered as non-recoverable amount as of 31.12.2016 to € 1,450 (000).

/ 22FINANCIAL INFORMATIONAND CORPORATE GOVERNANCE
NOTE 6. TANGIBLE ASSETS
In '000 € Buildings (1)
Plants and equip-ments
Motor vehicles
Fixtures and
fittings
Leasehold improve-
mentsOther
Assets leased
to third parties
Total
Balance at 31 December 2013Gross carrying amount 3,648 33,743 3,679 2,958 5,794 2,572 2,161 54,554Accumulated depreciation (760) (27,150) (1,765) (2,419) (3,819) (1,937) (832) (38,681)Closing balance 2013 2,888 6,593 1,914 539 1,974 636 1,329 15,873
Changes in 2014Additions 2 3,647 605 324 512 153 186 5,429Business combination - 5 3 1 - - - 8Disposals/cancellations - (208) (432) (1) - (26) (1) (668)Conversion differences - 70 6 13 35 17 30 172Reclassifications (to) from other items/other (207) (185) - (0) - - 185 (207)Depreciation charge (154) (2,168) (703) (195) (422) (287) (704) (4,632)Depreciation on business combination - - - - - - - -Depreciation on disposals/cancellations - 207 307 1 - 24 1 540Depreciation other 163 (109) (3) (10) (12) (12) (145) (128)
Balance at 31 December 2014Gross carrying amount 3,443 37,071 3,818 3,295 6,341 2,716 2,561 59,244Accumulated depreciation (752) (29,220) (2,119) (2,623) (4,253) (2,212) (1,679) (42,858)Closing balance 2014 2,691 7,852 1,699 672 2,088 504 882 16,386
Changes in 2015Additions 15 2,109 750 181 317 586 335 4,294Business combination 5,679 - - - - - - 5,679Disposals/cancellations - (325) (583) (37) (18) (146) (556) (1,665)Conversion differences - 224 2 10 80 (50) 154 421Reclassifications (to) from other items/other - 100 (39) (98) (1) - - (39)Depreciation charge (485) (2,931) (711) (223) (487) (186) (561) (5,585)Depreciation on business combination (679) - - - - - - (679)Depreciation on disposals/cancellations - 325 488 18 18 - 556 1,405Depreciation - conversion differences - (171) (4) (9) (43) 48 (74) (253)Depreciation other - (211) 32 134 1 (206) - (250)
Balance at 31 December 2015Gross carrying amount 9,137 39,179 3,948 3,351 6,719 3,107 2,494 67,934Accumulated depreciation (1,916) (32,207) (2,315) (2,702) (4,764) (2,556) (1,758) (48,218)Closing balance 2015 7,221 6,972 1,633 649 1,955 550 736 19,716
Changes in 2016Additions 52 1,664 304 294 1,451 543 674 4,982Impairment (194) - - - - - - (194)Disposals/cancellations - (654) (256) (124) (64) (163) (296) (1,557)Conversion differences - 108 18 5 (42) 54 (5) 139Reclassifications (to) from other items/other (110) 45 0 - - (320) - (386)Depreciation charge (250) (2,440) (650) (240) (459) 25 (408) (4,422)Depreciation on disposals/cancellations - 634 244 120 64 5 296 1,363Depreciation - conversion differences - (57) (11) (4) 9 (50) (7) (120)Depreciation other 254 (111) 0 - - 246 - 389

FINANCIAL INFORMATIONAND CORPORATE GOVERNANCE
/ 23
NOTE 6. TANGIBLE ASSETS (NEXT)
In '000 €
Buildings (1)
Plants and equip-ments
Motor vehicles
Fixtures and
fittings
Leasehold improve-
mentsOther
Assets leased
to third parties
Total
Balance at 31 December 2016Gross carrying amount 8,885 40,342 4,014 3,524 8,064 3,220 2,867 70,916Accumulated depreciation (1,912) (34,181) (2,732) (2,824) (5,149) (2,330) (1,877) (51,006)Closing balance 2016 6,973 6,160 1,282 700 2,915 890 990 19,910
Balance at 31 December 2016Net carrying amount of tangible assets under finance leases 1,090 86 1,176
Tangible assets acquired in 2016 under finance leases 184 - 184Amount of tangible assets pledged as security for liabilities 1,090 86 1,176
(1) The buildings were valued by an outside valuer during the last quarter of 2016
NOTE 7. INTANGIBLE ASSETS
In '000 €Goodwill Development
costs
Patents, trademarks and
other rights
Computer software Total
Balance at 31 December 2013Gross carrying amount 40,519 19,738 1,205 6,918 68,380Accumulated depreciation - (14,874) (1,043) (5,284) (21,202)Accumulated impairment losses (595) - - - (595)Closing balance 2013 39,924 4,864 161 1,633 46,583
Changes in 2014Additions 2,582 45 376 3,003Business combination 109 - - - 109Conversion differences - 11 6 73 90Other - - - (169) (169)Depreciation charge (2,319) (50) (824) (3,193)Depreciation other (11) (6) 116 99
Balance at 31 December 2014Gross carrying amount 40,628 22,331 1,256 7,198 71,413Accumulated depreciation - (17,204) (1,099) (5,992) (24,296)Accumulated impairment losses (595) - - - (595)Closing balance 2014 40,033 5,127 156 1,206 46,522
Changes in 2015Additions 2,602 49 215 2,866Business combination 569 - - - 569Conversion differences - 11 55 23 89Other - - - (596) (596)Depreciation charge (2,385) (60) (561) (3,007)Depreciation other (11) (55) 578 512
Balance at 31 December 2015Gross carrying amount 41,197 24,944 1,360 6,840 74,342Accumulated depreciation - (19,600) (1,215) (5,975) (26,791)Accumulated impairment losses (595) - - - (595)Closing balance 2015 40,602 5,344 145 865 46,956

/ 24FINANCIAL INFORMATIONAND CORPORATE GOVERNANCE
NOTE 7. INTANGIBLE ASSETS (NEXT)
In '000 €Goodwill Development
costs
Patents, trademarks and
other rights
Computer software Total
Changes in 2016Additions 3,211 15 188 3,414Conversion differences - (26) (0) (95) (122)Other - - (547) (240) (787)Depreciation charge (2,678) (56) (478) (3,212)Depreciation charge - conversion differences 26 0 85 112Depreciation other - 548 314 862
Balance at 31 December 2016Gross carrying amount 41,197 28,129 828 6,688 76,842Accumulated depreciation - (22,252) (723) (6,049) (29,024)Accumulated impairment losses (595) - - - (595)Closing balance 2016 40,602 5,877 105 639 47,223
Net internally generated intangible assets 5,877 5,877
Depreciation of capitalized development costs is calculated on a straight-line basis, in relation to the estimated useful life of the investment (3 years).
Breakdown of the goodwill by segment
The goodwill is allocated according to the segment where the acquisitions have been done: Goods ID or People ID. Zetes Group organizes its activity by businesses, each under the authority of a specific manager. It is at this level that strategy, resource allocation, solutions and priority markets are determined. It is also at this level that performance is analysed.
In '000 € 2014 2015 2016 Var.
By segmentGoods ID 36,724 36,724 36,724 -People ID 3,309 3,878 3,878 -Total goodwill 40,033 40,602 40,602 -

FINANCIAL INFORMATIONAND CORPORATE GOVERNANCE
/ 25
For each entity, the Group identifies whether it is a "mono-activity" or not. A "mono-activity" is considered to be a separate CGU. Those that are not mono-activity are organised in such a way as to be able to break down analytically their activities, including the assets and liabilities attached thereto. Each analytical unit then constitutes a CGU. CGUs are then grouped into groups of CGUs that make up the Goods ID and People ID divisions. The goodwill is allocated to these groups of CGUs.
Assets constituting a cash-generating unit are tested for impairment before undertaking an impairment test at the level of the group of CGUs to which the goodwill is allocated.
The Group examines the value of the goodwill shown in the statement of financial position at each annual closing date, or more often whether indications of impairment exists. The external impairment index used is the market capitalization of the company, while the internal impairment indexes are the variance against budget, the order intake and the change in EBITDA performance.
Apart from these indicators, the company remains attentive to other external indicators listed by IAS 36 §2, viz:
• the fact that, during the period, the market value of an asset reduced more significantly than could be explained by the passage of time and the normal use of the asset;
• the occurrence of major changes having a negative effect on the entity;
• the evolution of market interest rates and its impact on the discount rate used in calculating the value in use.
For Goods ID, the recoverable amount of the cash-generating units is determined by calculating both the fair value (less the sale costs estimated at 5% of the entity's value) and the value in use.
For People ID, the recoverable amount of the cash-generating units is determined based on the fair value less the sale costs, or, where this is insufficient, on the value in use.
The fair value is determined on the basis of the valuations used in the business segment, i.e. a multiple of EBITDA (average current EBITDA for the last two years) adjusted for the net cash position. This multiple is in line with the multiple used by Zetes for its most recent acquisitions.
The value in use is calculated based on projected cash flows derived from the annual budgets as adopted by the Board of Directors, as well as assumptions concerning the evolution of the business over a five-year period.
Cash flows beyond the range of the projections are extrapolated using estimated average growth rates, as indicated below.
Estimated cash flows do not include incoming and outgoing cash flows from financing activities or related to income taxes. Past flows are compared to estimated projections.
The key assumptions used in the tests are the same for all CGUs. The weighted average cost of capital before taxes applied by the Group to all CGUs is compared with different sources and is updated periodically, but not whenever an impairment test is carried out. Between each update, the Group verifies that the key variables used in determining the WACC (applied in its activity segment) have not changed significantly.
Key assumptions used in calculating value in use
2015 2016Discount rate 10% 10%Growth rate (1) 1% 1%Illiquidity discount 15% 15%(1) After the five-year period
GOODS ID
The recoverable value of Goods ID has been determined on the basis of value in use.
The value in use being greater than the fair value, the value in use represents the recoverable amount, both values being significantly higher than the carrying amount. The principal assumptions used on determining the recoverable amount are as described above.
PEOPLE ID
The recoverable value of People ID has been determined on the basis of the fair value.
The fair value being significantly higher than the carrying amount, the value in use was not calculated.
The sale costs are estimated at 5% of the value of the entity.
Sensitivity analysis
The Group undertakes sensitivity analysis, with particular focus on the EBITDA multiplier used in determining fair value, and on the assumptions used for the development of business over a 5-year period (evolution of sales, gross margin as percentage of sales, operating costs).
These cases correspond to reasonably possible changes in the key assumptions.
The analysis carried out in 2016 shows that the carrying values of the two divisions remain, in the various cases studied, below both their fair value and their value in use.

/ 26FINANCIAL INFORMATIONAND CORPORATE GOVERNANCE
NOTE 8. FINANCIAL ASSETS AND OTHER NON CURRENT ASSETS In '000 € 2014 2015 2016
ASSETSOther non current financial assets 117 105 81Non current cash restricted or pledged 390 321 319Long term trade receivables 1,559 122 6Total 2,066 548 405
NOTE 9. INVENTORIES In '000 € 2014 2015 2016
ASSETSTotal gross carrying amounts 22,022 22,689 27,147Goods 17,671 18,362 21,779Production supplies 4,091 3,899 4,418Stock in transit 260 428 950Accumulated write-downs (4,876) (4,867) (4,975)Goods (4,688) (4,592) (4,700)Production supplies (188) (275) (275)Total net 17,146 17,821 22,172
INCOME STATEMENTWrite-downs on inventories of the year (354) (523) (666)Reversal of inventory write-downs (1) 388 543 662
No inventory is pledged as security for liabilities.(1) Amount of any reversal of any write-down that is recognised as a reduction in the amount of inventories

FINANCIAL INFORMATIONAND CORPORATE GOVERNANCE
/ 27
NOTE 10. CURRENT TRADE AND OTHER RECEIVABLES In '000 € 2014 2015 2016
ASSETSTrade receivables 63,974 59,398 69,112
Gross trade receivables 65,115 60,710 70,939Accumulated write-downs (1,140) (1,311) (1,827)
Other current receivables 3,648 2,862 2,346Construction contracts 2,065 1,292 1,223Hedging instruments 81 - -Other 1,503 1,570 1,124
Total 67,623 62,260 71,459
The credit risk is not significant at the Group level. Transactions with the same external customer do not represent more than 10% of the revenues of the Group's activities. The risk is spread on lots of different customers and markets. It is partly covered by a credit insurance company. If not, a credit risk analysis is performed allowing to reduce the risk of the counterparty.
Construction contracts
In '000 € 2014 2015 2016Cumulative amount of contract costs incurred and recognized profits less losses 30,939 36,687 32,539
INCOME STATEMENTRevenue relating to the execution of construction contracts 5,717 5,748 4,375Write-downs on bad and doubtful customers (62) (423) (622)
Hedging instruments
Financial instruments are measured at fair value, broken down into current and non-current liabilities (see Statement of Financial Position). The fair value hierarchy level used is level 2, i.e. the use of valuation techniques using observable market data (IFRS 13).
In '000 € Sale EUR Purchase USD Expiring from Expiring to Contractaverage rate
Closing rate31/12
Forward contracts EUR/USD 1.743 1.939 Jan-17 Mar-17 1,113 1,054
The Group has hedging instruments to hedge identified foreign exchange risks; on 31/12/2016, there are hedging contracts for an amount of 1.9 million USD against EUR to be purchased at an average rate of 1.113. The net result on hedging instruments is 97 thousand € and is not taken into account in the 2016 F/S (not significant).
In '000 €Notional
amount EUR Fixed rate Floating rate Market value31/12
Interest rate wap 2,654 3.75% euribor 3 months (106)
The financing of a building is at floating rate. A swap contract (3-month euribor versus 3.75%, expiring in october 2017) applies, however, to the full amount of the debt (€ 2,654 thousand). This contract was concluded by a company when it was not yet controlled by Zetes. It was re-valued at market value at 31/12/2016.

/ 28FINANCIAL INFORMATIONAND CORPORATE GOVERNANCE
NOTE 11. PARTIES LIÉES In '000 € 2014 2015 2016
Assets with related parties (1) 50 50 50Liabilities with related parties (2) 570 331 414
Transactions within related partiesTotal Management Committee remunerations (1,521) (1,151) (1,316)
Basic compensation (781) (781) (855)Variable compensation (740) (370) (461)
Total non executive directors remunerations (74) (82) (90)Total others (3) (20) (10) (4)Total services received (1,615) (1,243) (1,410)(1) Current accounts of executive directors (2) Debts to executive directors (linked to services rendered) (3) Lawyers services
All transactions with companies related to directors have been made at arm's length. The remuneration report is available in the "Corporate Governance" section of the annual report.
NOTE 12. FONDS PROPRES Ordinary
shares
MOVEMENTS IN NUMBER OF SHARESNumber of shares on 31/12/2015 5,389,714Number of shares issued in 2016 0Number of shares on 31/12/2016 5,389,714
Number In '000 €
OWN SHARESOwn shares, opening balance 174,242 3,007Delivered upon exercice of options (84,497) (1,184)Employees benefit plan (34,017) (588)Purchase 69,216 2,678Own shares, closing balance 124,944 3,913
In 2016, the Board of Directors has used the authorization given by the Shareholders' General Meeting for the repurchase of own shares.
Other informations
All issued shares are fully paid. The Articles of Association authorize the Board of Directors to increase the subscribed share capital pursuant to articles 603 et seq. of the Companies Code, including in the event of a takeover bid, after the Company has received the communication referred to in Article 607 of the Companies Code, up to a maximum amount equal to the subscribed capital, i.e. € 51,676,218. This authorisation is granted for a period of 5 years, as from the publication of the minutes of the Extraordinary General Meeting of 8 June 2016 in the Annexes to the Belgian Official Gazette. All shares are without par-value.
Dividend
The Board of Directors will propose to the Ordinary General Assembly held on May 31, 2017 to pay a gross ordinary dividend of 0.80 € per share, identical to the one paid for the 2015 accounting year (and paid on 1 June 2016). This dividend was paid to shareholders on 21 December 2016 in the form of an interim dividend.
FINANCIAL INFORMATIONAND CORPORATE GOVERNANCE
/ 29
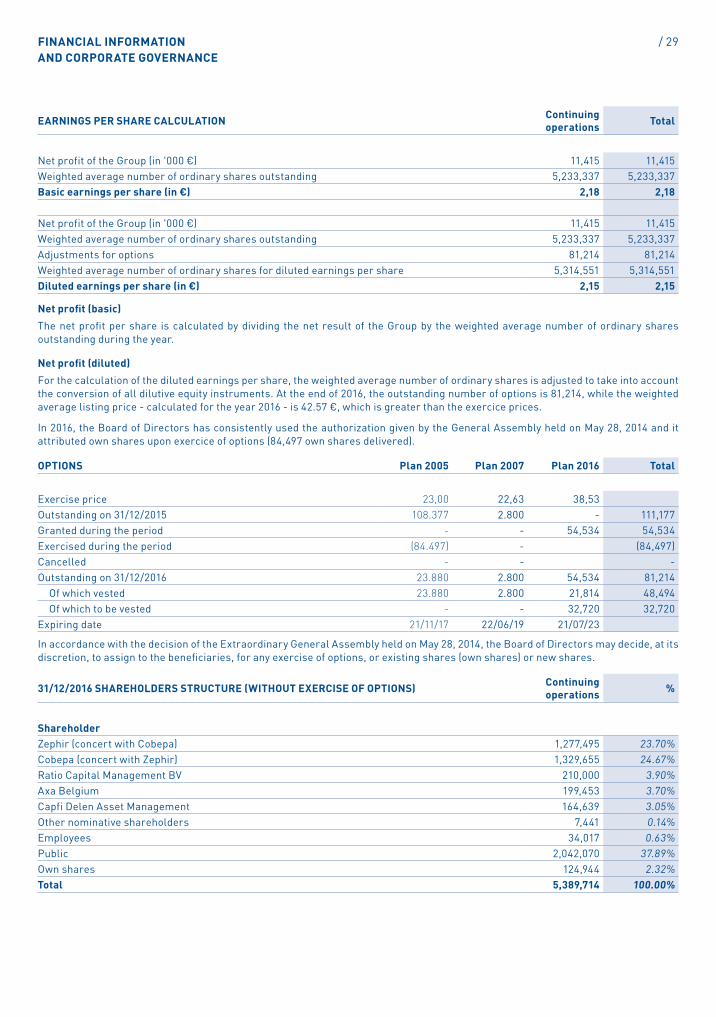
EARNINGS PER SHARE CALCULATION Continuing operations Total
Net profit of the Group (in '000 €) 11,415 11,415Weighted average number of ordinary shares outstanding 5,233,337 5,233,337Basic earnings per share (in €) 2,18 2,18
Net profit of the Group (in '000 €) 11,415 11,415Weighted average number of ordinary shares outstanding 5,233,337 5,233,337Adjustments for options 81,214 81,214Weighted average number of ordinary shares for diluted earnings per share 5,314,551 5,314,551Diluted earnings per share (in €) 2,15 2,15
Net profit (basic)
The net profit per share is calculated by dividing the net result of the Group by the weighted average number of ordinary shares outstanding during the year.
Net profit (diluted)
For the calculation of the diluted earnings per share, the weighted average number of ordinary shares is adjusted to take into account the conversion of all dilutive equity instruments. At the end of 2016, the outstanding number of options is 81,214, while the weighted average listing price - calculated for the year 2016 - is 42.57 €, which is greater than the exercice prices.
In 2016, the Board of Directors has consistently used the authorization given by the General Assembly held on May 28, 2014 and it attributed own shares upon exercice of options (84,497 own shares delivered).
OPTIONS Plan 2005 Plan 2007 Plan 2016 Total
Exercise price 23,00 22,63 38,53Outstanding on 31/12/2015 108.377 2.800 - 111,177Granted during the period - - 54,534 54,534Exercised during the period (84.497) - (84,497)Cancelled - - -Outstanding on 31/12/2016 23.880 2.800 54,534 81,214
Of which vested 23.880 2.800 21,814 48,494Of which to be vested - - 32,720 32,720
Expiring date 21/11/17 22/06/19 21/07/23
In accordance with the decision of the Extraordinary General Assembly held on May 28, 2014, the Board of Directors may decide, at its discretion, to assign to the beneficiaries, for any exercise of options, or existing shares (own shares) or new shares.
31/12/2016 SHAREHOLDERS STRUCTURE (WITHOUT EXERCISE OF OPTIONS) Continuing operations %
ShareholderZephir (concert with Cobepa) 1,277,495 23.70%Cobepa (concert with Zephir) 1,329,655 24.67%Ratio Capital Management BV 210,000 3.90%Axa Belgium 199,453 3.70%Capfi Delen Asset Management 164,639 3.05%Other nominative shareholders 7,441 0.14%Employees 34,017 0.63%Public 2,042,070 37.89%Own shares 124,944 2.32%Total 5,389,714 100.00%

/ 30FINANCIAL INFORMATIONAND CORPORATE GOVERNANCE
NOTE 13. FINANCIAL BORROWINGS In '000 € 2014 2015 2016
FINANCE LEASES, MINIMUM LEASE PAYMENT PAYABLE, PRESENT VALUE< 1 year 308 378 403Between 2 and 5 years 792 1,082 654Total 1,100 1,461 1,057
NON CANCELLABLE FUTURE MINIMUM OPERATING LEASE PAYMENTS< 1 year 4,982 4,043 4,855Between 2 and 5 years 5,472 3,673 8,116> 5 years - - 250Total 10,454 7,715 13,220
INTERESTS BEARING BORROWINGSBank borrowings 2,700 4,024 4,054Finance leases 1,100 1,461 1,057Bank overdrafts 11,199 7,551 5,694Total 15,000 13,036 10,805
AGING PROFILE< 1 year 14,208 8,841 9,960Between 2 and 5 years 792 4,194 845Total 15,000 13,036 10,805
FINANCIAL DEBTS BY CURRENCYEUR 14,963 11,779 9,363CHF - 1,250 1,442ZAR 36 7 -Total 15,000 13,036 10,805
NET CASHTotal financial debts 15,000 13,036 10,805Cash available (16,680) (22,587) (20,228)Net cash (-)/net financial debt (+) (1,680) (9,552) (9,423)
Current financial debts 14,208 8,841 9,960Cash and cash equivalents (16,290) (22,267) (19,909)Current net cash (-)/current net financial debt (+) (2,083) (13,426) (9,949)
CASH AVAILABLECurrent cash restricted or pledged 390 321 319Cash and cash equivalents 16,290 22,267 19,909Total cash available 16,680 22,587 20,228(1) The net cash is the difference between the total financial debts and the cash available (2) The current net cash is the difference between the current financial debts and the cash and cash equivalents
Fair value of financial debts
For financial debts to credit institutions, the fair value is equal to the face value. LT financial liabilities amounted to € 845 thousand at 31/12/2016 and are all at fixed rate. The impact of a mark-to-market revaluation of the fixed- rate LT debts is not material. The current portion of LT debts amounts to € 4,265 thousand at 31/12/2016 and breaks down into € 1,653 thousand of fixed-rate debt and € 2,612 thousand of floating-rate debt. The current portion of floating-rate LT debt (€ 2,612 thousand) relates to the financing of a building and is hedged with interest-rate swap contracts. This swap is measured separately at market value (see note 10 - Hedging instruments). The impact of a mark-to-market revaluation of the current portion of LT debts (fixed rate) is not material.

FINANCIAL INFORMATIONAND CORPORATE GOVERNANCE
/ 31
NOTE 14. PROVISIONS & OBLIGATIONS
In '000 € Warranty provisions
Restructuring provisions
Legal proceeding provisions
Onerous contract
provisionsOthers Total
PROVISIONSBalance at 31 December 2013 449 27 40 284 - 800Non current provisions 449 27 40 284 - 800
Additional provisions 28 1 180 100 - 308Amounts used - (23) (39) - - (62)Unused amounts reversed (128) - - - - (128)Other 3 - - - - 3Balance at 31 December 2014 351 6 181 383 - 921Non current provisions 351 6 181 383 - 921
Business combination - - - 178 - 178Additional provisions 9 - 67 99 - 176Amounts used - - (30) - - (30)Unused amounts reversed (111) (1) 0 (35) - (147)Other 25 (5) 5 12 - 37Balance at 31 December 2015 275 - 223 637 - 1,136Non current provisions 275 - 223 637 - 1,136
Provisions additionnelles 11 - 13 81 31 136Montants utilisés - - (12) (9) - (21)Montants non utilisés repris - - - (143) (97) (240)Autres 14 - - (504) 504 14Solde au 31 décembre 2016 300 - 224 63 438 1,024Provisions non courantes 300 - 224 63 438 1,024
The warranty provisions cover the company costs for the defective equipments not under the producer guarantee. The legal proceeding provisions mainly relate to disputes with former employees. The onerous contract provisions cover the not-normal costs related to agreements. The other provisions relate to probable additional costs related to buildings occupied by Zetes. It is planned to use these provisions in the medium term.

/ 32FINANCIAL INFORMATIONAND CORPORATE GOVERNANCE
In '000 €Avantages
postérieurs à l'emploi
OBLIGATIONSBalance at 31 December 2013 217Non current obligations 192Current obligations 24
Additional provisions 11Amounts used (24)Conversion differences 0Balance at 31 December 2014 204Non current obligations 179Current obligations 26
Additional provisions 17Amounts used (20)Conversion differences 2Balance at 31 December 2015 203Non current obligations 177Current obligations 27
Additional provisions 25Amounts used (27)Conversion differences 1Balance at 31 December 2016 203Non current obligations 177Current obligations 26
Contingent assets
From 1 May 2015, the Senegalese government removed the requirement for biometric visas in order to support the tourism industry, and therefore terminated Zetes' technical concession. This decision necessitated the accelerated charging of the capitalized start-up charges (IAS 11, non-cash expenses) offset by a first tranche of compensation. This tranche may possibly be followed by a second one in 2017.
Contingent liabilities
On 31/12/2016, the Group has contingent liabilities with uncertainty on timing and/or amount, arising in the course of the business. The contingent liabilities relate to possible obligations in respect of certain warranties given to bankers, customers, suppliers and partnerships. The possibility of an outflow of resources embodying economic benefits is remote.
Zetes Industries has also contracted with an external company to advise it on the ongoing transaction between its majority shareholders and Panasonic. Once the transaction is finalized, the total amount payable to this company in 2017 is estimated at € 2.1 million.
Defined contribution pension plan
Zetes manages various defined contribution pension plans in line with national legislation and the practices in the countries from which it operates. The very large majority of these plans are subscribed with external insurers. Contributions are paid by the employees and by the Group subsidiaries concerned. In Belgium, legislation requires employers to guarantee a return on the employee and employer contributions, thus creating a potential liability for the Group. By reason of this guaranteed return, Belgian defined contribution systems can be seen as defined benefit plans. In line with market practice, Zetes uses the ‘intrinsic value’ method for estimating its obligations here. These obligations correspond to the difference between the mathematical reserves (acquired) and the guaranteed amounts calculated on the basis of the legal minimum returns. On 31/12/2016, the acquired reserves cover the guaranteed amounts. During 2016, K€ 1 869 was paid into these pension plans by the various Group companies (2015: K€ 1,929).

FINANCIAL INFORMATIONAND CORPORATE GOVERNANCE
/ 33
NOTE 15. CURRENT TRADE AND OTHER CURRENT PAYABLES
In '000 € 2014 2015 2016
Trade payables 37,859 33,002 39,943Advances received 28,513 26,718 29,639Other current payables 14,973 15,332 16,749
Payables to employees 6,095 6,477 6,810Payables to public administrations 6,795 6,929 8,635Other 2,083 1,926 1,305
Current hedging instruments - - -Total 81,346 75,053 86,332
NOTE 16. DISCLOSURES ON ACQUISITIONS AND DISPOSALS OF SUBSIDIARIESIn '000 € 2014 2015 2016
IMPACT OF ACQUISITIONSNon current assets 8 5,067 -
Tangible assets 8 5,000 -Intangible assets - - -Deferred tax assets - 67 -
Current assets 3 69 -Inventories 3 - -Trade and other receivables - 0 -Cash and cash equivalents - 68 -
Non current liabilities - 4,106 -Interests bearing borrowings - 3,370 -Provisions - 178 -Hedging instruments - 71 -Deferred tax liabilities - 487 -
Current liabilities - 418 -Interests bearing borrowings - 120 -Hedging instruments - 153 -Trade and other current payables - 144 -
Net identifiable assets and liabilities 11 612 -
Goodwill on acquisitions and earnouts 109 569 -Goodwill on acquisitions 109 569 -
Cash (acquired)/disposed - (68) -
Net cash outflow/(inflow) 120 1,113 -Minority interests - - -
2016 & post closing transactions
Zetes did not male any acquisition in 2016. The files studied did not result in an acquisition. There are no post closing transactions in 2017.

/ 34FINANCIAL INFORMATIONAND CORPORATE GOVERNANCE
NOTE 17. INFORMATIONS SUR LES MISSIONS DE L'AUDITEUR
The auditor RSM Réviseurs d’Entreprises, represented by M. Gert Van Leemput and M. Thierry Dupont, has been appointed by the 2014 Shareholders Meeting. It will expire at the 2017 Shareholders Meeting held to approve the 2016 accounts. The mission and powers of the auditor are those granted by the law. The Auditor may not be revoked by the Shareholders' Meeting other than for good reason.
In '000 € 2014 2015 2016
Auditor's feesAudit of the financial statements 86 86 94Other missions - 3 3
Auditor's related parties' feesAudit of the financial statements - - -Fiscal advices 8 5 5Other missions - - -

FINANCIAL INFORMATIONAND CORPORATE GOVERNANCE
/ 35
Management of risks and uncertainties Introduction
Risk taking is inherent in any business enterprise. There is no growth or value creation in a company without taking risks. If not properly managed and controlled, these risks may affect the Company's ability to achieve its objectives. By continuing to foresee and manage risks, risk management and internal control systems play a key role in conducting and monitoring various business activities.
Risk is the possibility of an event occurring that will have consequences that may affect the company's employees, assets, environment, objectives or reputation.
Risk management is the responsibility of all players in the company. It aims to be comprehensive and cover all activities, processes and assets of the company.
Risk management is a dynamic system of the company, which it defines and implements under its responsibility.
Risk management comprises a set of tools, behaviours, procedures and actions adapted to the characteristics of each company, that allows senior management to keep the risks to an acceptable level.
Risk management helps to:
1. Create and preserve the value, assets and reputation of the company
2. Place the company's decision making and processes on a firmer basis and help it achieve its objectives
3. Promote coherence between a company's values and actions
4. Mobilize company employees around a common vision of the principal risks and sensitize them to the risks inherent in their business.
Description of the risks
The Board of Directors presents below its assessment of the risks to which the company is exposed
By the nature of its commercial activities, the company is exposed to the uncertainties attached to the development of the economy and to the situation of its customers and its competitors. Each of the risks listed below can have a negative impact on the overall condition of the company and its results. For this reason any forward-looking statements must be analysed in the light of this presentation. Besides the risks mentioned here, there may be other risks the company is not aware of, or which are not reported as such, but which could also have an adverse effect on the company.
Litigation risks
Zetes is, has already been, and could again be involved in legal action which is part of the normal course of business. Such legal action can relate to :
• warranty/product quality/installation issues• conflicts with employees• conflicts with the selling shareholders in the context
of business combinations• claims by Zetes against suppliers• third party claims for patent infringement:
The above list is not exhaustive. Where necessary, provisions are set up for such risks. Although these are estimated based on the company’s best understanding of the situation, court judgements could expose the company to unexpected costs.
Risks related to human resources
Zetes seeks to be at the sharp edge of technology. Finding the human resources with which to remain there is a major challenge. Zetes’ good name and its commercial and operational successes significantly reduce this risk.
Environmental risks
Zetes strictly respects all laws and regulations governing the protection of the environment. Even so, certain exceptional circumstances or accidents could potentially expose the company to litigation. The group is not involved in any environmental dispute at the present time.
Risks related to exceptional events
By its very nature the company is open to such risks. A fire or flood could always affect a production site, and with it the company’s financial situation. Although Zetes insures against risks, there is no such thing as “zero” risk. More generally, there are natural and political risks that could destabilize the economic system, and hence Zetes’ activity.
Risks attached to acquisitions
Zetes’ strategy involves acquiring other companies. Despite the care with which management goes about these acquisitions and, in particular, the due diligence audits that are made, specific risks always exist. The most serious are linked to the process of integrating newly acquired companies into the group, to their activities before joining Zetes, to their real growth potential (over-estimation) and to the value of the technological know-how acquired. In certain cases, these risks could engender a loss of goodwill value.
Risks attached to new products
Zetes specialises in identification. To maintain its competitive advantage, Zetes carries out specific development and places specialized software and hardware on the market. In 2016 the company invested € 3.2 million. A total of € 5.9 million of development expenses are capitalised on the balance sheet. The risks associated with these developments are:
• over-ambitious sales objectives, insufficient profitability, owing to unsuitable functionalities, or the existence of less expensive competing products
• the placing on the market of products that are not yet stabilized, bringing a loss of credibility and/or additional, unanticipated expenses to resolve the problem
• the use of external components of insufficient quality.
Zetes holds intellectual property rights. Some of these rights relate to know-how linked to particular employees or certain production processes and are not protected by patents.
The Company and certain of its subsidiaries have filed for patents but there is no guarantee that these patents will be sufficiently broad to protect the intellectual property rights of the company or its subsidiaries concerned and prevent access by the competition to similar technology.
/ 36FINANCIAL INFORMATIONAND CORPORATE GOVERNANCE
Technological risk
For Zetes, technological risk is linked to the time at which a new technology is adopted. This risk is managed by a specific team, which acts as a technology watch units. This team concentrates expertise and knowledge as long as the technology is not yet ready for market. It also helps disseminate know-how and competencies once a decision to go to market has been taken by Group management.
Risk of fraud
The risk of fraud is inherent in all human activity. The company is attentive to appoint people of trust to key positions. This trust is considered the cornerstone of the fight against fraud. The company seeks, where the size of the subsidiary permits, to establish a separation of duties. Thus, persons in charge of procurement will not be responsible for paying bills. Limits on signing authority are also set according to the activity level of the companies concerned. Finally, the group executive committee is careful to limit the representative powers of the executive committees of the subsidiaries to day-to-day operations. It is also careful to ensure an appropriate division of powers within their management structures. To this end, direct communication channels exist with the group executive committee, both for local financial managers, who report both to their Country Managers and CFO, and for country managers, who are responsible for their performance to both the Group CEO and the Group CFO.
Price risk
This risk is covered principally by agreements with our main suppliers; price reviews are built into our contracts with them.
Credit risk
This risk is covered by a credit insurance company (around 50% of sales). Otherwise, an internal analysis of the credit risk is carried out, which reduces the counterparty risk. The multiplicity of clients, both geographical and sectoral, and their general quality also significantly reduce the Group's credit risk.
Liquidity and treasury risk
Zetes’ liquidity and treasury risk is limited. In addition to a cash position of € 19.9 million (December 2016), the company retains a significant borrowing potential based on an agreement signed with its three main bankers to finance projects, additional working capital needs or, partially, acquisitions.
Foreign exchange risk
The consolidated accounts are in euros. This means that the accounts of those group entities whose reference currency is not the euro need to be converted into euros on consolidation. To the extent that currencies fluctuate against one another this can negatively impact the accounts. The greatest risks are those of the fluctuation of the euro against the pound sterling, the Swiss franc, the rand and the shekel. At the operating level, and insofar as the charges of these entities are incurred in their own reference currencies, the currency risk lies essentially in their contribution to Group results. A risk also exists on loans/borrowings (repayment or revaluation). A potential risk also exists in the parity between the CFA and the euro.
In terms of buying, procurement is essentially in euros. There does exist, however, a US dollar risk for certain specific equipment that is purchased in this currency. Significant sales/purchase contracts in foreign currencies are normally hedged specifically. Zetes’ financial department has a preference for
forward foreign exchange contracts and, to a lesser extent, currency options, for hedging foreign exchange risk.
In People ID, some of Zetes' competitors use other currencies than the euro as their reference currency. Currency fluctuations may either strengthen Zetes' competitive advantage or weaken it against those competitors whose revenues (and costs) are collected (and incurred) in other monetary areas
Interest rate risk
The interest rate risk is limited to the extent that the company has net positive treasury position. A rise in either short or long term rates would not significantly affect results. On top of this, bank debt serves mainly to fund short term working capital needs of subsidiaries. The occasional longer term debts for financing acquisitions or investments have a short average term which does not call for specific interest rate coverage.
Analysis grid
Zetes currently implements a risk approach based on a classification by theme (Strategic, Operational, Financial and Legal). Each risk has been assessed according to its importance, based on a combination of its potential impact and likelihood of occurrence. Existing controls are the subject of special attention. They may , if the risk is large, be the subject of additional measures.

FINANCIAL INFORMATIONAND CORPORATE GOVERNANCE
/ 37
Statutory auditor’s report to the general meeting of shareholders on the consolidated financial statements for the year ended december 31, 2016As required by law and the by-laws, we report to you on the performance of our mandate of statutory auditor. This report includes our opinion on the consolidated financial statements, as well as the required additional statement. The consolidate financial statements comprise the consolidated statement of financial position as at December 31, 2016, and the consolidated statement of comprehensive income, the consolidated statement of changes in equity and the consolidated statement of cash flows for the year ended December 21, 2016 and the explanatory notes.
REPORT ON THE CONSOLIDATED FINANCIAL STATEMENTS – UNQUALIFIED OPINION
We have audited the consolidated financial statements of the company for the year ended December 31, 2016, prepared in accordance with the International Financial Reporting Standards as adopted by the European Union, which show a consolidated statement of financial position total of 199.095 (000) EUR and a consolidated income statement showing a consolidated profit for the year of 11.471 (000) EUR.
Responsibility of the board of Directors for the preparation of the consolidated financial statements
The board of Directors is responsible for the preparation of consolidated financial statements that give a true and fair view in accordance with the International Financial Reporting Standards, and for such internal control as the board of Directors determines is necessary to enable the preparation of annual accounts that are free from material misstatement, whether due to fraud or error.
Responsibility of the statutory auditor
Our responsibility is to express an opinion on these consolidated financial statements based on our audit. We conducted our audit in accordance with International Standards on Auditing (ISAs) as adopted in Belgium. Those standards require that we comply with the ethical requirements and plan and perform the audit to obtain reasonable assurance about whether the consolidated financial statements are free from material misstatement.
An audit involves performing procedures to obtain audit evidence about the amounts and disclosures in the consolidated financial statements. The procedures selected depend on the statutory auditor’s judgment, including the assessment of the risks of material misstatement of the consolidated financial statements, whether due to fraud or error. In making those risk assessments, the statutory auditor considers the company’s internal control relevant to the preparation of consolidated financial statements that give a true and fair view, in order to design audit procedures that are appropriate in the circumstances, but not for the purpose of expressing an opinion on the effectiveness of the entity’s internal control. An audit also includes evaluating the appropriateness of accounting policies used and the reasonableness of accounting estimates made by the board of Directors, as well as evaluating the overall presentation of the consolidated financial statements.
We have obtained from the board of Directors and company officials the explanations and information necessary for performing our audit.
We believe that the audit evidence we have obtained is sufficient and appropriate to provide a basis for our opinion.
Unqualified opinion
In our opinion, the consolidated financial statements of the company give a true and fair view of the group’s equity and financial position as at December 31, 2016, and of its results and its cash flows for the year then ended, in accordance with the International Financial Reportind Standards as adopted by the European Union.
REPORT ON OTHER LEGAL AND REGULATORY REQUIREMENTS
The board of Directors is responsible for the preparation and the content of the Director’s report on the consolidated financial statements.
In the context of our mandate and in accordance with the Belgian standard which is complementary to the International Standards on Auditing (ISAs) as applicable in Belgium, our responsibility is to verify, in all material respects, compliance with certain legal and regulatory requirements. On this basis, we make the following additional statement, which do not modify the scope of our opinion on the consolidated financial statements:
• The Director’s report the consolidated financial statements includes the information required by law, is consistent with the consolidated financial statements and is free from material inconsistencies with the information that we became aware of during the performance of our mandate.
Zaventem, April 20, 2017 RSM réviseurs d'entreprises -Bedrijfsrevisoren SCRL-CVBA Statutory auditor Represented by
Gert Van Leemput Thierry Dupont

/ 38FINANCIAL INFORMATIONAND CORPORATE GOVERNANCE
Statutory AccountsIn accordance with article 105 of the Company Code, the current Annual Report offers an abbreviated version of the statutory annual accounts of Zetes Industries SA. Zetes Industries SA’s Annual Report and the annual accounts, together with the Auditor’s Report, will be deposited and will also be available at the Company’s registered office and on the Company Web site www.zetes.com.
The Company Auditor has signed a statement of unqualified approval of the statutory annual accounts of Zetes Industries SA for the years ended 2016, 2015 and 2014.
1. BALANCE SHEETIn '000 € 2014 2015 2016
ASSETSFixed assets 32,860 33,207 33,089
Formation expenses - - -Intangible fixed assets 273 198 134Tangible fixed assets 213 165 109Financial fixed assets 32,374 32,844 32,846
Current assets 35,737 33,984 34,640Amounts receivable after one year 1,173 1,193 1,204Stocks and contracts in progress 51 34 293Amounts receivable within one year 28,760 27,840 28,055Short term deposits and own shares 4,479 3,007 3,913Cash at bank and in hand 936 1,569 839Deferred charges and accrued income 339 341 337
TOTAL ASSETS 68,597 67,191 67,729
EQUITY AND LIABILITIESCapital and reserves 59,354 59,979 63,931
Capital 51,676 51,676 51,676Share premium account 38 38 38Reserves 3,027 4,741 7,787Unavailable reserves for own shares 4,479 3,007 3,913Profit carried forward 133 517 517
Provision for liabilities and charges - - -Debts 9,243 7,212 3,798
Amounts payable after one year - - -Amounts payable within one year 9,109 7,023 3,665
Current portion of amounts payable after more than one year falling due within one year falling due within one year - - -
Financial debts 3,025 - -Trade debts 1,372 1,193 1,264Amounts payable regarding taxes, remuneration and social security 1,317 1,409 2,346Other debts 3,395 4,420 56
Accrued charges and deferred income 134 189 132TOTAL EQUITY AND LIABILITIES 68,597 67,191 67,729

FINANCIAL INFORMATIONAND CORPORATE GOVERNANCE
/ 39
2. INCOME STATEMENTIn '000 € 2014 2015 2016
Operating income 7,713 7,798 7,707Turnover 7,100 7,422 7,278Other operating income 613 376 429
Operating charges (6,475) (6,057) (6,415)Raw materials, consumables and goods for resale (103) (298) (216)Services and other goods (4,030) (3,450) (3,951)Remuneration, social security and pensions (2,079) (2,122) (2,101)Depreciation and amounts written off (256) (178) (143)Other operating charges (7) (9) (3)
Operating profit or (loss) 1,238 1,740 1,292Financial income 3,821 4,002 7,545Financial charges (132) (147) (118)Profit on ordinary activities before taxation 4,927 5,595 8,719Extraordinary income - - -Extraordinary charges - (215)Profit for the period before taxation 4,927 5,380 8,719Income taxes (327) (547) (554)PROFIT OF THE YEAR 4,601 4,833 8,164
3. APPROPRIATION ACCOUNTIn '000 € 2014 2015 2016
Profit to be appropriated 4,606 4,966 8,681Profit for the year available for appropriation 4,601 4,833 8,164Profit brought forward 5 133 517
Drawdowns on reserves - - -Transfers to legal reserve 230 242 408Transfers to other reserves 1,000 0 3,544Result to be carried forward 133 517 517Dividends (1) 3,242 4,208 4,212(1) Amount determined on the basis of the treasury shares held at 31/12/2016

/ 40FINANCIAL INFORMATIONAND CORPORATE GOVERNANCE
4. INVESTMENTS AND SOCIAL RIGHTS HELD IN OTHER COMPANIES
Are to be mentioned hereafter, the companies in which the company holds a direct investment in the sense of the Royal Decree of October 8, 1976 as well as the other companies in which the company holds shares in case these shares represent at least 10% of the subscribed capital.
RIGHTS HELD BYName Address of the registered office Country Directly Indirectly
Number % %SA ZETES Rue de Strasbourg 3 - 1130 Bruxelles Belgium 170,827 100
SA ZETES France Bâtiment Einstein - 17/19 rue Georges Besse- 92160 Antony France 27,470 100
SA ZETES TECHNOLOGIES Rue de Strasbourg 3 - 1130 Bruxelles Belgium 1,249 49.96 0.04
ZTS Lda Alameda Antonio Sergio 7 - 2795023 Linda-A-Velha Portugal 2 100SA BUROTICA Alameda Antonio Sergio 7 - 2795023 Linda-A-Velha Portugal 10.millions 50 50SA ZETES FASTRACE Rue de Strasbourg 3 - 1130 Bruxelles Belgium 2,124 34.03 41.9ZETES INTERNATIONAL GmbH Flughafenstraße 52 b, 22335 Hamburg Germany 4 100
ZETES SRL Lungobisagno Dalmazia 71/16 - 16141 Genova Italy 10 10 90ZETES INDUSTRIES (Israel) Ltd 11 Haamal street - 11664 Rosh Haayin Israël 1,000 100
ZETES HOLDING GmbH Waldstrasse 23 - 63128 Dietzenbach Germany 2 100RFIdea SA Rue des Chasseurs Ardennais, 5 - 4031 Angleur Belgique 3 ns 100ZETES COTE IVOIRE Lot N° 124, Vridi Cité, Port-Bouët, Abidjan Ivory Coast 190 10 90ZETES GAMBIA Ecowas Ave P.O.Box 719, Banjul Gambia 10 10 90JB Belgium Rue de Strasbourg 3 - 1130 Bruxelles Belgium 100 100
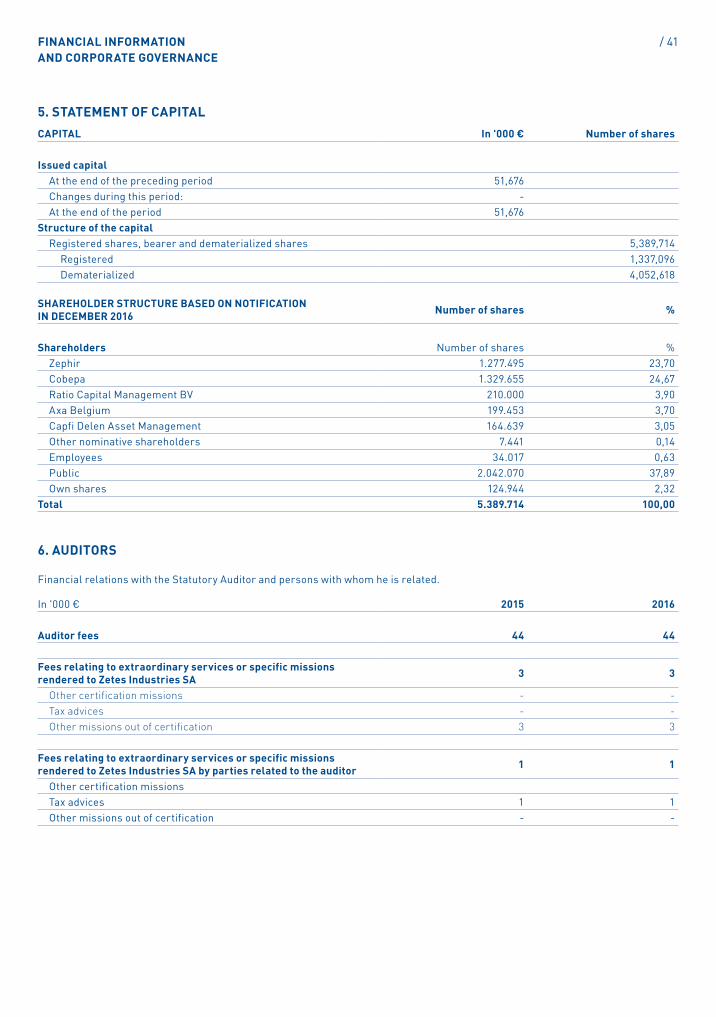
FINANCIAL INFORMATIONAND CORPORATE GOVERNANCE
/ 41
5. STATEMENT OF CAPITALCAPITAL In '000 € Number of shares
Issued capitalAt the end of the preceding period 51,676Changes during this period: -At the end of the period 51,676
Structure of the capitalRegistered shares, bearer and dematerialized shares 5,389,714
Registered 1,337,096Dematerialized 4,052,618
SHAREHOLDER STRUCTURE BASED ON NOTIFICATION IN DECEMBER 2016 Number of shares %
Shareholders Number of shares %Zephir 1.277.495 23,70Cobepa 1.329.655 24,67Ratio Capital Management BV 210.000 3,90Axa Belgium 199.453 3,70Capfi Delen Asset Management 164.639 3,05Other nominative shareholders 7.441 0,14Employees 34.017 0,63Public 2.042.070 37,89Own shares 124.944 2,32
Total 5.389.714 100,00
6. AUDITORS
Financial relations with the Statutory Auditor and persons with whom he is related.
In '000 € 2015 2016
Auditor fees 44 44
Fees relating to extraordinary services or specific missions rendered to Zetes Industries SA 3 3
Other certification missions - -Tax advices - -Other missions out of certification 3 3
Fees relating to extraordinary services or specific missions rendered to Zetes Industries SA by parties related to the auditor 1 1
Other certification missionsTax advices 1 1Other missions out of certification - -

/ 42FINANCIAL INFORMATIONAND CORPORATE GOVERNANCE
Statement on Corporate Governance
1. THE 2009 BELGIAN CODE ON CORPORATE GOVERNANCE
This section is based on the rules and principles which organize the corporate governance of Zetes Industries SA/NV (the Company). These are set out exhaustively in the Company's Corporate Governance Charter as approved by the Board of Directors of the Company. They are available, along with the Company's coordinated articles of association, on the Zetes Industries SA/NV website, http://investors.zetes.com/content/corporate-governance
The Company’s Board of Directors intends to comply with the 2009 Belgian Code on Corporate Governance, but believes that certain deviations from its provisions are justified in view of the Company’s particular situation.
Principle 2.9. Secretary of the Company
Given the size of the Company, the Board of Directors does not plan to appoint a Company secretary.
Principle 5.3. Appointments committee
None of the principles relating to an appointments committee are applicable.
Principle 5.2./17 Internal auditing function
The Company does not have an independent internal audit function. Taking into account the nature, size and complexity of the company, executive management has established rules and procedures and has divided up responsibilities between different people in order to ensure the proper functioning of the internal control and risk management system.
2. BOARD OF DIRECTORS2.1. Composition, appointment and termination
of the Board of Directors
In accordance with article 15 of the articles of association, the Company is managed by a six members minimum Board of Directors consisting of legal or physical persons, who do not have to be shareholders.
Pursuant to the articles of association, the Directors are appointed by the General Meeting of Shareholders for terms of no more than 6 years and are re-eligible. Their terms of office expire at the end of the Ordinary General Meeting following the last year of their term.
As of 31 December 2016, the Board of Directors of Zetes Industries SA/NV consisted of 10 persons.
NAME AND POSITION Term until (*) Professional AddressAlain Wirtz SARepresented by Mr Alain WirtzChief Executive Officer (CEO)(Nominated by Zephir Corporation)(Executive Director)
2019 Rue de Strasbourg 3 1130 Brussels
Jean-François Jacques SPRL Represented by Mr Jean-François Jacques (*)
Chairman of the Board(Nominated by Zephir Corporation)(Executive Director)
2019 Rue de Strasbourg 3 1130 Brussels
Pierre LambertChief Financial Officer (CFO)(Executive Director)
2019 Rue de Strasbourg 3 1130 Brussels
Jean-Marie Laurent Josi(Nominated by Cobepa)(Director)
2019 Rue de la Chancellerie 2 1000 Brussels
Hiram Claus(Nominated by Cobepa)(Director)
2019 Rue de la Chancellerie 2 1000 Brussels
Olivier Gernay(Nominated by Zephir Corporation)(Director)
2019 Avenue Brugmann 403 1180 Brussels
Floris Vansina BVBARepresented by Mr Floris Vansina(Director)
2019 Charles Woestelaan 1471090 Jette
Sophie de Roux (Independent Director) 2019 Rue de Strasbourg 3
1130 Brussels
Marianne Merchez(Independent Director) 2019 Rue de Strasbourg 3
1130 BrusselsGEMA SPRL Represented by Mr Michel Allé(Independent Director)
2019 Place Constantin Meunier 17 1190 Brussels
(*) Directors' terms of office end immediately after the Annual General Meeting of shareholders held in the year mentioned next to the director's name

FINANCIAL INFORMATIONAND CORPORATE GOVERNANCE
/ 43
The statutory auditor of the Company is RSM Réviseurs d’Entreprises - Bedrijfsrevisoren, having its registered office at Chaussée de Waterloo 1151, 1180 Uccle, represented by Mr Gert Van Leemput and Mr Thierry Dupont. This firm has audited the consolidated financial statements of the Company ever since it became a public interest entity, while introducing a rotation of its representatives. Mr Van Leemput and Mr Dupont are responsible for auditing the Company's statutory (unconsolidated) and consolidated accounts. The three-year mandate of the statutory auditor will expire at the General Shareholders’ meeting to be held on 31 May 2017. A request for the extension of its mandate for exceptional reasons has been introduced. This reason is essentially the acquisition of Zetes by Panasonic, which is still being finalized.
2.2. Role of the Board of Directors:
The Board of Directors is the decision-making body of Zetes Industries SA/NV, (i) with the exception of matters reserved to the shareholders by law or on the basis of the articles of association, and (ii) with the exception of the management powers delegated to the Managing Directors.
The Board of Directors' role is to pursue the long-term success of Zetes Industries SA/NV and the Zetes Group by providing entrepreneurial leadership and enabling risks to be assessed and managed. The Board of Directors decides on Zetes Industries’ SA/NV's values and strategy, its risk appetite and key policies. The Board of Directors ensures that the necessary financial and human resources are in place for Zetes Industries SA/NV to meet its objectives.
2.3. Responsibilities of the Board of Directors
The key responsibilities of the Board of Directors include:
Reviewing, evaluating and approving, on a regular basis, long range plans and strategy for Zetes Industries SA/NV and the Zetes Group:
• Reviewing periodically Zetes Industries SA/NV’s corporate objectives and policies;
• Monitoring and evaluating the performance of Zetes Industries SA/NV and the Zetes Group against strategic goals, plans and budgets;
• Reviewing, evaluating and approving the overall corporate organizational structure;
• Reviewing, evaluating and approving major resource allocations and capital investments (including acquisitions and divestments);
• Reviewing the financial and operating results;• Reviewing, evaluating and approving budgets and forecasts;• Taking all necessary measures to ensure the correctness
and the timely publication of financial reports and other significant financial and non-financial information;
• Supervising the performance of the external auditor;• Appointing the Managing Directors;• Determining the structure of the Executive Management;• Reviewing Executive Management's performance;• Maintaining continuing interaction and dialogue and a
climate of respect, trust and candour with the Executive Management;
• Reviewing, evaluating and approving the remuneration policy as it relates to the Executive Management of Zetes Industries SA/NV;
• Monitoring and reviewing the effectiveness of the Board committees.
2.4. Organization of the Board of Directors
2.4.1. Board Meetings
Regular Board meetings (around six a year) are held, with special meetings convened as necessary by the Chairman of the Board of Directors or two Directors.
Board meetings may also be organized by means of video- or teleconference. Each meeting is chaired by the Chairman of the Board and, in his absence, by the CEO or by an executive director. The Board may validly deliberate and take decisions only if half of its members are present or represented. Resolutions are passed by a simple majority of votes cast.
In 2016, the Board of Directors met 8 times. The attendance records of individual directors are as follows: all members were present at all meetings except for Mr Olivier Gernay (24 March 2016), Mr Jean-Marie Laurent Josi (24 March 2016 and 6 September 2016), Mr Hiram Claus (17 February 2016), Floris Vansina Bvba (11 November 2016), who were excused.
2.4.2. Agenda Items for Board Meetings
The Chairman of the Board of Directors establishes the agenda for each Board meeting. At the beginning of the year the Chairman of the Board of Directors establishes a schedule of the main topics to be discussed during the year. A detailed agenda and, to the extent feasible, supporting documents and proposed resolutions are provided to the Directors five calendar days prior to each Board meeting. The agenda lists the topics to be discussed and specifies whether they are for information, for deliberation or for decision-making purposes. Directors review these materials in advance of the meeting. Each Director is free to suggest and include items on the agenda. Subject to any applicable notice requirements, Directors who have suggestions for topics to be included in the agenda are required to advise the Chairman of the Board of Directors well in advance of such meetings.
2.4.3. Assessment
Under the leadership of its Chairman, the Board of Directors will conduct regular self-assessments to determine whether it and its committees are functioning effectively. The evaluation will have the following objectives:
• Evaluating how the Council operates;• Checking that important issues are adequately discussed
and prepared;• Evaluating the content of each Director's contributions, his
or her presence at Board and Committee meetings and the constructive nature of his or her involvement in discussions and decisions;
• Checking the actual composition of the Board against the desired composition; with the non-executive Directors regularly evaluating their interaction with the Executive Management;
At regular intervals the way each director has exercised his or her duties, as well as his or her role and responsibilities, will be reviewed with a view to adapting the composition of the Board to reflect intervening changes. Specific attention will be given to the evaluation of the Chairman of the Board of Directors and the Chairmen of the Committees. When a director's term of office comes up for renewal, that director's involvement and effectiveness will be evaluated using a transparent and pre-established procedure. The Chairman of the Board will receive comments from all Directors and will report to the Board of Directors. This report will include an assessment

/ 44FINANCIAL INFORMATIONAND CORPORATE GOVERNANCE
of the Board's performance. The evaluation will focus on the Board's contribution to the company Zetes Industries SA/NV, and specifically on those areas in which the Board considers that there is room for improvement.
The Board will react to the results of the performance analysis by recognizing its strengths and correcting weaknesses. When required, this will involve the appointment of new members, the non-reappointment of existing members or taking any action that seems appropriate for the effective functioning of the Board of Directors.
The Board will ensure that measures are taken for the orderly reappointment of Board members. It will ensure that any new appointment and any renewal, of both executive and non-executive directors, will maintain an appropriate balance of required skills within the Board of Directors.
3. INTERNAL CONTROL AND RISK MANAGEMENT AS REGARDS THE PREPARATION OF FINANCIAL INFORMATION
Internal control relevant to the preparation of financial reporting is a structural component of the Company, defined and implemented under its responsibility, which seeks to ensure the reliability of financial information and the compliance of the financial statements with IFRS (International Financial Reporting Standards).
The Board of Directors is responsible for defining the measures necessary to ensure the integrity and timely publication of the financial statements and of other significant financial information provided to shareholders.
Executive Management is responsible for establishing and monitoring internal controls based on the reference framework approved by the Board of Directors as well as for preparing the financial statements and other significant financial information of the Company.
Internal control of financial information includes more specifically rules and procedures that:
• relate to the detailed recording of transactions involving Company assets;
• provide reasonable assurance that transactions are recorded in such a way as to permit preparation of financial statements in conformity with IFRS;
• provide reasonable assurance that the company's sales are made in accordance with the conditions imposed by the Executive Management and Board of Directors of the Company, and that the expenditures of the company are incurred with their authorization;
• provide reasonable assurance regarding the prevention or timely detection or unauthorized acquisition, use, or unauthorized transfer of assets that could have a material effect on the consolidated financial statements.
Executive Management is responsible for the exercise of internal control over financial reporting. This control includes the evaluation of significant risks, identifying malfunctionings, shortcomings and difficulties of implementation, and monitoring of measures taken to correct deficiencies identified.
Given its limitations, internal control of financial information may be unable to prevent or detect false declarations. In addition, anticipation of the effectiveness of control over future periods is subject to the risk that controls may become inadequate because of changes in conditions or because of
a deterioration of their degree of compliance with existing policies or procedures.
It should be noted in this regard that in recent years, Executive Management has decided to initiate a process to bring the various Zetes Industries subsidiaries onto a common corporate management information and accounting system in order to harmonize procedures and allow better monitoring. This homogenization within the Zetes Group is strengthening over time the quality of internal control, which is an ongoing concern of Executive Management.
Executive Management evaluated the effectiveness of the internal control of financial reporting as of 31 December 2016. The evaluation focused on the design of the internal control of financial information and included tests of its operational efficiency.
On this basis, Executive Management was of the opinion that, as of 31 December 2016, the Company had adequate internal control over financial information.
4. MANAGING DIRECTORS AND EXECUTIVE MANAGEMENT
The Board of Directors has appointed the Managing Directors of Zetes Industries SA/NV. The Board of Directors has granted authority to the managing directors to enable them to fulfil their responsibilities and duties. Taking into account the Company’s values, its risk appetite and key policies, the Managing Directors shall have sufficient latitude to propose and implement a corporate strategy within the legal framework. To this end the Chief Executive Officer (CEO) (Alain Wirtz SA) and the Chairman of the Board (Jean-François Jacques SPRL) are both managing directors of Zetes Industries SA. The Managing Directors work together with the members of the Executive Management, which includes all Executive Directors of Zetes Industries SA, i.e. currently the two Managing Directors and the CFO. The Executive Management is therefore composed of three members: the two managing directors, Alain Wirtz SA and Jean-François Jacques SA, and the Company's CFO, Mr Pierre Lambert. The Executive Management does not constitute a management committee (comité de direction) within the meaning of Article 524bis of the Belgian Companies Code.
5. COMMITTEES OF THE BOARD OF DIRECTORS5.1. Role
A substantial portion of the preparatory analysis and work of the Board of Directors is done by standing Board Committees. The decision-making remains, however, the collegial responsibility of the Board, with the Committees having only an advisory function (but not excluding the possibility of ad hoc delegations). These Committees assist the Board in specific areas, which they cover in sufficient depth and upon which they make recommendations to the Board. The Board has an Audit Committee and a Remuneration Committee. The Board may, at any time, establish or maintain additional Committees as far as they are necessary or relevant. Given the size of the Company, there is no Appointments Committee.
FINANCIAL INFORMATIONAND CORPORATE GOVERNANCE
/ 45
5.2. Composition and appointment
Committee members are appointed by the Board of Directors. The Chair of the Board of Directors ensures that the Board of Directors appoints Committee members and a Chair for each of these Committees. Each Committee is composed of at least three members. Appointments shall be for terms not exceeding those of Board membership. The decision on the exact composition of a Committee reflects the needs and necessary qualifications for the optimal functioning of the Committee. The appointment of Committee members is based on (i) their specific skills and experience, in addition to the general competence requirements for all Board members, and (ii) the requirement that each Committee, as a group, possess the necessary skills and experience to perform its tasks.
5.3. Audit Committee
The Audit Committee assists the Board of Directors in its oversight of (i) the integrity of the Company’s financial statements, (ii) the Company’s compliance with legal and regulatory requirements, (iii) the external auditor’s qualifications and independence, and (iv) the performance of the Company’ internal controls and risk management and its external auditors' accomplishment of their mission.
The responsibilities of the Audit Committee are described in detail in the Corporate Governance Charter.
The Audit Committee is composed exclusively of non-executive Directors. At least one of them is an independent director. During 2016, the members of the Audit Committee were:
• Gema SPRL, represented by Mr Michel Allé (Chairman of the Audit Committee, independent director)
• Mr Hiram Claus (non-executive director)• Floris Vansina BVBA, represented by Mr Floris Vansina
(non-executive director)• Ms Sophie de Roux (independent director)• Mr Paul Jacques (independent director) until 25 May 2016
5.4. Remuneration Committee
The role of the Remuneration Committee is to assist the Board of Directors in all matters relating to the remuneration of Board members (executive and non-executive) and of those Zetes Industries SA/ NV’s employees that report directly to Executive Management, and in those matters regarding the governance of the group on which the Board of Directors or the Chairman of the Board of Directors wishes to receive the Committee’s advice.
The responsibilities of the Remuneration Committee are described in detail in the Corporate Governance Charter.
The Remuneration Committee should comprise not less than three Directors. All members should be non-executive Directors. The majority of Committee members should be Independent Directors. During 2016, the members of the Remuneration Committee were:
• Mr Jean-Marie Laurent-Josi (Chairman of the Remuneration Committee, non-executive director):
• Mr Paul Jacques (independent director) until May 25, 2016 • Ms Sophie de Roux (independent director) • Marianne Merchez (independent director) from 25 May 2016
6. REPORT ON THE REMUNERATION OF DIRECTORS AND THE EXECUTIVE MANAGEMENT
ZETES INDUSTRIES SA - Remuneration Report 2016
6.1. General Principles of the Remuneration Policy
This section describes the general principles of the remuneration policy of Zetes Industries.
The aimed of the remuneration policy is the Zetes Group is to recompense individual and collective performance, to align the interests of the senior managers, directors and shareholders of Zetes Industries, while taking due account of the differences between the Group's operating companies. This policy has been applied consistently for many years.
With respect for good corporate governance, compensation is consistent with the industry standard and a bonus system, directed at the performance and the values of the Company, exists to motivate the Executive Management of Zetes Industries and the managers of the Group to work towards the sustainable growth in the value of the Company.
The remuneration guidelines and the bonus systems of the Zetes Group aim to ensure that the Executive Management of Zetes Industries and Group executives receive an appropriate remuneration for their activities and their levels of responsibility, taking into account the economic situation, the success and the prospects of the Zetes Group.
In this way the total remuneration package of executive directors of Zetes Industries as well as the heads of the operational and functional units consists is made up as follows:
1. fixed components independent of the results,2. bonuses dependent on both the results for one financial
year and the respect of quality criteria directly related to an alignment between the long-term strategy of the Company and the interests of its shareholders
These general principles already applied in 2015 and continued to do so in 2016.
6.2. With regard to the market conformity of remuneration
In order to assess objectively the remuneration of the Executive Management, the Remuneration Committee has ad hoc studies enabling it to position this remuneration.
The surveys assess the amount and the structuring of the remuneration. This has enabled the Remuneration Committee to verify that the remuneration of Executive Management is in line with that practised by publicly traded Belgian and European companies of similar structures, size and activity.
6.3. Remuneration of the executive directors:
This section describes the remuneration programme for executive directors. It contains a description of the structure of their remuneration and also clarifies the relationship between performance and pay levels.
/ 46FINANCIAL INFORMATIONAND CORPORATE GOVERNANCE
6.3.1. Principles
The contractual arrangements and remuneration of members of the Executive Management are adopted and audited annually by the Remuneration Committee appointed by the Board. With respect to variable remuneration, the Remuneration Committee sets the objectives of the Executive Management and assesses how far these have been fulfilled.
6.3.2. Beneficiaries
The Executive Management of the Company is composed of the following companies and persons:
Alain Wirtz SA represented by Mr Alain Wirtz
CEO and Managing Director
Jean-François Jacques SPRL represented by Mr Jean-François Jacques
Chairman of the Board and Managing Director
Mr Pierre Lambert Chief Financial Officer and Director
6.3.3. Remuneration structure
In 2016, members of the Executive Management received remuneration consisting of a fixed salary and variable compensation dependent on both Zetes Group's consolidated financial results and the respect of qualitative targets including a concept of long-term growth in the enterprise value.
The criteria taken into account in determining variable compensation are:
• The achievement of the budget objectives of the reference year as adopted by the Board at the end of the previous year;
• The reactivity and adaptability of Executive Management to economic changes during the reference year;
• The ability to propose external growth operations and to integrate them successfully into the Group.
Moreover, taking into consideration the constant readiness of the Executive Management of Zetes Industries over the last twenty years to manage the business in a long-term perspective, the Compensation Committee intends to propose to the General Meeting that it waive, by specific approval, the requirements of Article 520ter of the Companies Act.
6.3.4. Summary of the total compensation paid in 2016
2016Remuneration of the CEOFixed remuneration € 305 000Variable remuneration € 193,486Total € 543,486
Remuneration of the other members of the Executive ManagementFixed remuneration € 505,179Variable remuneration € 267,761Total € 772,940
6.3.5. Stock Options and shares
A share plan and a stock option plan for the benefit of personnel were set up in 2016. The CEO did not benefit from this, unlike one member the Executive Management. In total, the latter acquired 3,798 shares in Zetes Industries at a discount of 16.67% from the market price; in return, these shares are blocked for a period of two years. He also received 7,596 options, the characteristics of which are described in Appendix 12 of the Annual Report (Financial Information Part).
6.3.6. Pension plan
No pension plan is established for the companies Alain Wirtz SA and Jean-François Jacques SPRL.
Pierre Lambert, in his capacity as Chief Financial Officer and director of Zetes Industries SA/NV, works under the self-employed mandated agent system. He enjoys an individual pension commitment, the amount of which is included in his fixed remuneration.
6.3.7. Severance indemnities
In the event of the revocation of their appointments, other than for serious misconduct, Alain Wirtz SA and Jean-François Jacques SPRL will each receive an indemnity equal to twelve months' compensation (annual base salary and variable pay). The indemnity of Mr Lambert, a self-employed mandated agent, will be equivalent to eighteen months.
In the event that Alain Wirtz SA and/or Jean-François Jacques SPRL resign from their directorships, they undertake, at the request of the Board, to provide, on an exclusive basis for a period of twelve months, various support, consultancy and transfer of know-how activities on the same financial terms (annual base salary and variable pay). Mr Lambert's equivalent undertaking is for a period of nine months.
There is no provision for a special severance payment in the event of takeover ("golden parachutes").
6.3.8. Right of recovery of variable compensation
Other than as provided by law, there is no specific contractual provision for the return of variable remuneration awarded on the basis of incorrect financial information.
6.4. Remuneration of non-executive directors and members of Board committees
The non-executive directors of the Company receive for their services a) a fixed annual amount, decided by the General Meeting of Shareholders and set at € 6,000 plus b) a fee of € 500 for each Board of Directors' meeting attended.
The non-executive members of the Audit Committee receive an amount of € 1,250 for each meeting of the Audit Committee in which they participate.
The Company does not provide non-executive directors with any remuneration, benefits or other incentives, other than the remuneration for their services as directors of the company. Non-executive directors do not receive any variable remuneration linked to results or other performance criteria. They are not entitled to stock options, to shares, or to any extra-legal pension scheme.

FINANCIAL INFORMATIONAND CORPORATE GOVERNANCE
/ 47
7. ELEMENTS FOR MANDATORY DISCLOSURE PURSUANT TO ARTICLE 34 OF THE BELGIAN ROYAL DECREE OF 14 NOVEMBER 2007
7.1. Capital structure
The capital of the Company is represented by 5,389,714 shares. All shares of Zetes Industries enjoy equal rights. There is only one class of shares.
Zetes Industries shares are registered or dematerialized, at the shareholder's choice, in accordance with the Belgian Company Code.
Under the Act of 14 December 2005 abolishing bearer securities and the implementing Royal Decree, the bearer shares still outstanding were sold by Zetes Industries on 15 October 2015, and the proceeds transferred to the Caisse des Dépôts et Consignations.
At 31 December 2016, Zetes Industries SA/NV held 124,944 own shares, leaving 5,264,770 shares outstanding at that date.
In 2005, the Board of Directors issued 191,894 warrants for the benefit of its employees, directors or persons having management assignments at Zetes Industries SA/ NV subsidiaries. Each warrant was granted free of charge and entitled its holder to one share, exercisable at € 23 per share. Under the conditions of the share option plans, these warrants became exercisable from June 2009. At 31 December 2016, 23,880 warrants remained in circulation.
In 2007, the Board of Directors issued 23,800 warrants for the benefit of certain employees, directors or persons with management assignments at Zetes Industries SA/ NV subsidiaries. The warrants, attributed free of charge, entitle their holders to one share, and are exercisable at € 22.63 per share. At 31 December 2016, 2,800 warrants remained in circulation.
In 2016, the Board of Directors also issued 54,534 warrants for the benefit of its employees, directors or persons having management assignments at Zetes Industries SA/ NV subsidiaries. Each warrant was granted free of charge and entitles its holder to one share, exercisable at € 38.53 after a three-year waiting period. At 31 December 2016, 54,534 warrants remained outstanding, 40% of which are definitively acquired by the beneficiaries.
7.2. Shareholding structure
Based on the notifications received and published up till 31 December 2016, the shareholding structure is as follows:
Without exercise of the warrants
Shareholder Number of shares %Zephir (in concert with Cobepa) 1,277,495 23.70%Cobepa (in concert with Zephir) 1,329,655 24.67%Ratio Capital Management BV 210,000 3.90%Axa Belgium 199,453 3.70%Capfi Delen Asset Management 164,639 3.05%Other registered shareholders 7,441 0.14%Employees (blocked until 2018) 34,017 0.63%Public 2,042,070 37.89%Own shares 124,944 2.32%TOTAL 5,389,714 100%
After exercise of the warrants and delivery of 81,214 existing own shares
Shareholder Number of shares %Zephir (in concert with Cobepa) 1,277,495 23.70%Cobepa (in concert with Zephir) 1,329,655 24.67%Ratio Capital Management BV 210,000 3.90%Axa Belgium 199,453 3.70%Capfi Delen Asset Management 164,639 3.05%Other registered shareholders 7,441 0.14%Employees (blocked until 2018) 34,017 0.63%Public 2,123,284 39.40%Own shares 43,730 0.81%TOTAL 5,389,714 100%
Pursuant to the decision of the Extraordinary General Meeting of 28 May 2014, the Board of Directors decided, on 18 March 2015, to assign treasury shares in the event of exercise of the options.
As of 31 December 2016, the Company has not received any other notification of any ownership of shares of more than 3%, as required by its articles of association.
At 31 December 2016, the remuneration of non-executive directors broke down as follows:
Board of Directors Audit Committee TotalJean-Marie Laurent Josi (*) € 9,000 € 9,000Floris Vansina BVBA € 9,500 € 3,750 € 13,250 Paul Jacques € 7,500 € 1,250 € 8,750 Marianne Merchez € 8,500 € 8,500 Sophie de Roux € 10,000 € 3,750 € 13,750 Olivier Gernay € 9,500 € 9,500 Gema Sprl € 10,000 € 3,750 € 13,750 Hiram Claus (*) € 9,500 € 3,750 € 13,250 Total € 73,500 € 16,250 € 89,750 (*) Mr Jean-Marie Laurent Josi and Hiram Claus surrender their directors' fees to Cobepa SA
/ 48FINANCIAL INFORMATIONAND CORPORATE GOVERNANCE
On 22 December 2016, Panasonic concluded agreements to acquire all the shares held by Zephir Corporation SA and SA Cobepa SA. The completion of this acquisition is still subject to approval by the competent merger authorities. Panasonic has announced its intention, once the acquisition has been realized, to launch a mandatory public tender offer via one of its Europe-based subsidiaries, followed, if the conditions are met, by a squeeze-out of the shares and share options issued by Zetes and not yet held by Panasonic at that time. The completion of the acquisition is planned for the beginning of the second quarter.
On 26 January 2017, Zetes Industries SA received a transparency notification, showing that, following an acquisition of shares carried out on 19 January 2017, Oddo Meriten Asset Management holds 4.04% of the voting rights of the company (217,500 shares). Meriten Oddo Asset Management has thus crossed the 3% shareholding threshold.
On 24 March 2017, Zetes Industries SA received a transparency notification, showing that, following an acquisition of shares carried out on 21 March 2017, MVN Asset Management Limited holds 3.18 % of the voting rights of the company (171,251 shares). MVN Asset Management has thus crossed the 3% shareholding threshold.
7.3. Powers of the Board of Directors, in particular to issue or buy back shares
The powers of the Board of Directors are those defined by Belgian law and the Articles of Association.
Zetes Industries may increase or reduce its share capital with the specific approval of the general meeting of shareholders. Shareholders may also authorize the Board to increase share capital.
On 8 June 2016, the shareholders explicitly authorized the Board of Directors to increase the share capital in one or more instalments, up to a maximum amount of € 51,676,218, in accordance with Article 603 of the Companies Code. Under the same conditions, the Board of Directors is authorized to issue convertible bonds or subscription rights. This authorization is granted for a period of 5 years, as from the publication of the minutes of the Extraordinary General Meeting of 8 June 2016 in the Annexes to the Belgian Official Gazette.
The Extraordinary General Meeting of 8 June 2016 also expressly authorized the Board of Directors, pursuant to Article 607 of the Companies Code, to proceed with one or more capital increases, including contributions in kind, in the event of a public takeover bid, after receipt by the company of the communication referred to in Article 607 of the Companies Code. This authorization does not restrict the powers of the Board to undertake operations utilizing authorized capital other than those covered by Article 607 of the Companies Code.
The Board of Directors is expressly authorized to limit or discontinue the preferential subscription right of shareholders on capital increases up to a maximum amount of € 51,676,218 decided by the Board of Directors, including capital increases for the benefit of specific individuals (whether or not employees of this company or its subsidiaries) and capital increases related to public takeover bids.
The company may acquire by purchase or take as security its own shares under the conditions provided by law. The Board of Directors is specially authorized, for a period of five years from the publication of the Extraordinary General Meeting of 8 June 2016 and under the conditions described in Article 7 of its Articles of Association, to (i) acquire shares issued by the company, on or off the stock exchange, (ii) dispose of shares acquired by the company on or off the stock exchange and (iii) sell shares or beneficial certificates (parts bénéficiaires) issued by the company.
The Council may use these mandates for the acquisition or sale of shares of the company through direct subsidiaries within the meaning of Article 627 of the Companies Code.
Finally, the Board of Directors is specially authorized, for a period of three years from the publication of the Extraordinary General Meeting of 8 June 2016, to acquire, accept as security and dispose of own shares of the company, on behalf of Zetes Industries, without prior decision of the General Meeting, where such acquisition or disposal is necessary to avoid serious and imminent harm.
7.4. Restrictions imposed by law or the Zetes Industries Articles of Association on the transfer of securities
The Articles of Association of Zetes Industries contain no restrictions on the transfer of shares.
7.5. Holders of any securities with special controlling rights and description of these rights
No such securities exist.
7.6. Control mechanism provided for in any employee shareholding scheme where the rights of control are not exercised directly by the employees
These is no such mechanism.
7.7. Restrictions on voting rights imposed by law or the Articles of Association
Zetes Industries shares entitle their holders to vote at the General Meeting.
Each share entitles its holder to one vote (Article 31 of the Articles of Association).
7.8. Rules governing the appointment and replacement of members of the Board of Directors
Article 15 of the Zetes Industries Articles of Association and the provisions of the Zetes Industries' Corporate Governance Charter describe those rules.
7.9. Rules governing amendments of the Zetes Industries' Articles of Association
The rules governing amendments of Zetes Industries' Articles of Association are defined by the Belgian Companies Code. A decision to amend the Articles of Association has to be taken by a 75% majority, with at least 50% of the capital of Zetes Industries present or represented at the General Meeting.
If the first Extraordinary General Meeting is not quorate, a second General Meeting may be convened, with no quorum requirement.
FINANCIAL INFORMATIONAND CORPORATE GOVERNANCE
/ 49
7.10. Agreements between shareholders, known to Zetes Industries, which may result in restrictions on the transfer of securities and/or the exercise of voting rights
The Belgian companies Zephir Corporation and Cobepa act in concert.
Pursuant to article 74 of the Law of 1 April 2007 on takeover bids, Zetes Industries SA /NV has received notifications from the following shareholders. These notifications contain all the legally required statements and mention in particular that, acting in concert with other people since 21 November 2005,
these shareholders held more than 30% of the voting securities issued by the company:
1. Zephir Corporation SA, a corporation organized under the laws of Belgium acting in concert with Cobepa SA;
2. Cobepa SA. a corporation organized under the laws of Belgium acting in concert with Zephir Corporation SA.
Under the terms of their agreement, Zephir Corporation and Cobepa have agreed (among other matters) the following :
1. Minimum number of directors - each party will vote in favour of a minimum number of candidates for directorships proposed by the other in accordance with the following rule: one candidate for every complete 7% of all the issued and outstanding shares of the Company held by Zephyr Corporation or Cobepa.
2. Pre-emption right: the parties have a pre-emption right on the shares the other party wishes to transfer according to defined rules. However, 25% of the shareholdings owned by both parties immediately after the IPO are free of this pre-emption right.
With the exception of this agreement between Zephir Corporation and Cobepa, Zetes Industries has no knowledge of any other agreement which could result in restrictions on the transfer of securities and/or the exercise of voting rights.
As mentioned above, on 22 December 2016, Panasonic concluded agreements to acquire all the shares held by Zephir Corporation SA and Cobepa SA. The completion of this acquisition is still subject to approval by the competent merger authorities.
7.11. Significant agreements that may be impacted by a change in the control of the company following a public takeover bid
Zetes Industries is, either directly or indirectly through its subsidiaries, a party to certain important agreements with government authorities, which could rescind these agreements in the event of a change of control of the company. Such clauses are absolutely normal in such contracts as government authorities always attach great importance to the composition of the shareholder base of their contracting partners, who must meet different criteria that are usual in public contracting. It should be noted that a change of control does not automatically affect ongoing contracts, but rather that government authorities insist on retaining a right of assessment in such situations.
Certain similar and absolutely usual clauses exist also in distribution or supply contracts in the event of a change of control in favour of a direct competitor of the producer or supplier in question.
7.12. Agreements between Zetes Industries and the members of its board or its employees, providing for compensation if board members resign or are required to cease their duties without valid reason or if the employment of employees ends because of a public takeover bid.
The reader is referred here to Section 6.3.7 'Severance indemnities'
Otherwise there are no agreements providing specific compensation for Board members who leave following a public takeover bid.
8. MEASURES TO AVOID INSIDER TRADINGThe Zetes Group’s code of conduct to prevent insider trading is included in the Corporate Governance Charter. This is published on the website (http://investors.zetes.com/content/corporate-governance).
9. POLICY FOR THE APPROPRIATION OF THE RESULTS
The intention of the Company is to dividend out around one third of its consolidated net profit before goodwill impairment. Any dividend proposal will also be based upon the Company’s financial situation, its capital requirements and other factors considered important by the Company.
Applying this this policy, the Board of Directors decided to pay, on 21 December 2016, an interim gross dividend of € 0.80 per share. No proposal is being made to the General Meeting of 31 May 2017 to proceed to an additional payment to this interim dividend. The payout ratio is 36.90% of consolidated net income, Group share. The final gross amount of the ordinary dividend per share is therefore equal to that paid in respect of the 2015 financial year (€ 0.80).

/ 50FINANCIAL INFORMATIONAND CORPORATE GOVERNANCE
FINANCIAL INFORMATIONAND CORPORATE GOVERNANCE
/ 51

/ 52FINANCIAL INFORMATIONAND CORPORATE GOVERNANCE
FINANCIAL INFORMATIONAND CORPORATE GOVERNANCE
/ 53

/ 54FINANCIAL INFORMATIONAND CORPORATE GOVERNANCE
FINANCIAL INFORMATIONAND CORPORATE GOVERNANCE
/ 55

/ 56FINANCIAL INFORMATIONAND CORPORATE GOVERNANCE

FINANCIAL INFORMATIONAND CORPORATE GOVERNANCE
/ 57

/ 58FINANCIAL INFORMATIONAND CORPORATE GOVERNANCE

FINANCIAL INFORMATIONAND CORPORATE GOVERNANCE
/ 59

/ 60FINANCIAL INFORMATIONAND CORPORATE GOVERNANCE

FINANCIAL INFORMATIONAND CORPORATE GOVERNANCE
/ 61

/ 62FINANCIAL INFORMATIONAND CORPORATE GOVERNANCE

FINANCIAL INFORMATIONAND CORPORATE GOVERNANCE
/ 63
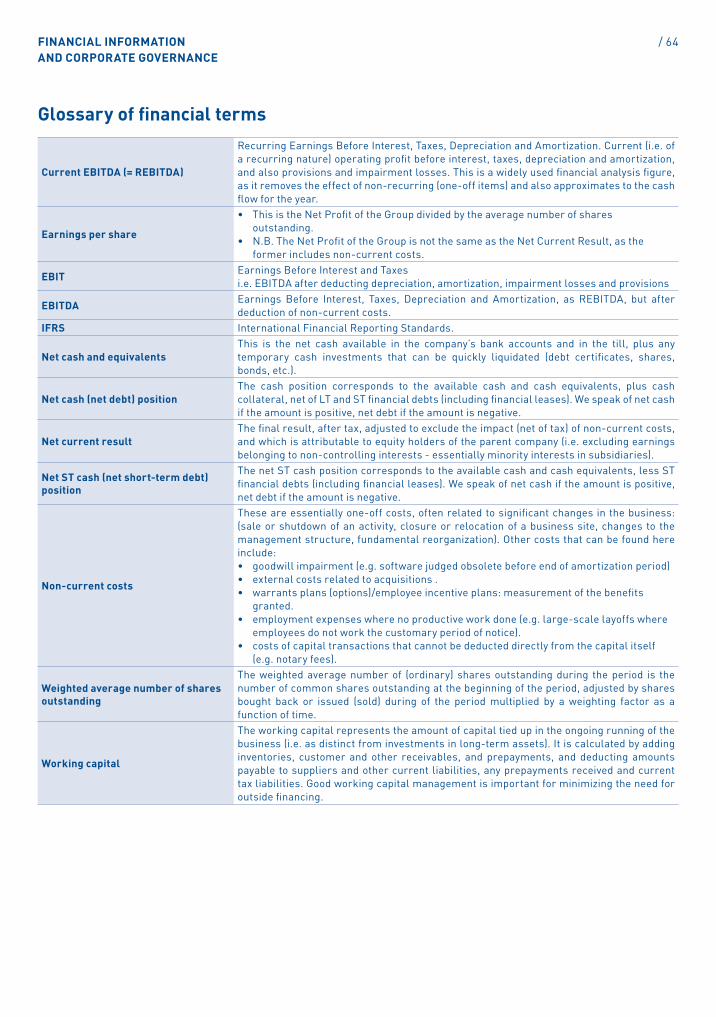
/ 64FINANCIAL INFORMATIONAND CORPORATE GOVERNANCE
Glossary of financial terms
Current EBITDA (= REBITDA)
Recurring Earnings Before Interest, Taxes, Depreciation and Amortization. Current (i.e. of a recurring nature) operating profit before interest, taxes, depreciation and amortization, and also provisions and impairment losses. This is a widely used financial analysis figure, as it removes the effect of non-recurring (one-off items) and also approximates to the cash flow for the year.
Earnings per share
• This is the Net Profit of the Group divided by the average number of shares outstanding.
• N.B. The Net Profit of the Group is not the same as the Net Current Result, as the former includes non-current costs.
EBIT Earnings Before Interest and Taxes i.e. EBITDA after deducting depreciation, amortization, impairment losses and provisions
EBITDA Earnings Before Interest, Taxes, Depreciation and Amortization, as REBITDA, but after deduction of non-current costs.
IFRS International Financial Reporting Standards.
Net cash and equivalentsThis is the net cash available in the company’s bank accounts and in the till, plus any temporary cash investments that can be quickly liquidated (debt certificates, shares, bonds, etc.).
Net cash (net debt) positionThe cash position corresponds to the available cash and cash equivalents, plus cash collateral, net of LT and ST financial debts (including financial leases). We speak of net cash if the amount is positive, net debt if the amount is negative.
Net current resultThe final result, after tax, adjusted to exclude the impact (net of tax) of non-current costs, and which is attributable to equity holders of the parent company (i.e. excluding earnings belonging to non-controlling interests - essentially minority interests in subsidiaries).
Net ST cash (net short-term debt) position
The net ST cash position corresponds to the available cash and cash equivalents, less ST financial debts (including financial leases). We speak of net cash if the amount is positive, net debt if the amount is negative.
Non-current costs
These are essentially one-off costs, often related to significant changes in the business: (sale or shutdown of an activity, closure or relocation of a business site, changes to the management structure, fundamental reorganization). Other costs that can be found here include: • goodwill impairment (e.g. software judged obsolete before end of amortization period)• external costs related to acquisitions .• warrants plans (options)/employee incentive plans: measurement of the benefits
granted.• employment expenses where no productive work done (e.g. large-scale layoffs where
employees do not work the customary period of notice).• costs of capital transactions that cannot be deducted directly from the capital itself
(e.g. notary fees).
Weighted average number of shares outstanding
The weighted average number of (ordinary) shares outstanding during the period is the number of common shares outstanding at the beginning of the period, adjusted by shares bought back or issued (sold) during of the period multiplied by a weighting factor as a function of time.
Working capital
The working capital represents the amount of capital tied up in the ongoing running of the business (i.e. as distinct from investments in long-term assets). It is calculated by adding inventories, customer and other receivables, and prepayments, and deducting amounts payable to suppliers and other current liabilities, any prepayments received and current tax liabilities. Good working capital management is important for minimizing the need for outside financing.

FINANCIAL INFORMATIONAND CORPORATE GOVERNANCE
/ 65

/ 66FINANCIAL INFORMATIONAND CORPORATE GOVERNANCE

FINANCIAL INFORMATIONAND CORPORATE GOVERNANCE
/ 67
Publication
Zetes Corporate Marketing & Communication
Executive Editor
Pierre Lambert, CFO Da Vinci Science Park Rue de Strasbourg 3 B-1130 Bruxelles
Design
Choco cvba www.chocoweb.be
Layout and production
www.visible.be
This report was written in French. The Dutch and English versions are provided for the convenience of the reader: only the French version is legally binding.
investors.zetes.com