financial development and growth in india: a … · financial development and growth in india: ......
TRANSCRIPT
Financial Development and Growth in India: A Growing Tiger in a Cage?
Hiroko Oura
WP/08/79

© 2008 International Monetary Fund WP/08/79 IMF Working Paper Asia and Pacific Department
Financial Development and Growth in India: A Growing Tiger in a Cage?
Prepared by Hiroko Oura1
Authorized for distribution by Charles Kramer
March 2008
Abstract
This Working Paper should not be reported as representing the views of the IMF. The views expressed in this Working Paper are those of the author(s) and do not necessarily represent those of the IMF or IMF policy. Working Papers describe research in progress by the author(s) and are published to elicit comments and to further debate.
This paper examines the efficiency of the different segments of India's financial system using firm-level data on corporate financing patterns. Firms are increasingly relying on external funds to finance their investment in most recent years. Empirical analyses indicate that (1) the financial system in India is not channeling funds into industries with higher external finance dependence; (2) the debt financing system does not allocate funds according to firms’ external finance dependence, while equity financing system does; and (3) firms in an industry that are more dependent on external finance grow more slowly. JEL Classification Numbers: O16, G18 Keywords: Financial development, growth, corporate finance, India Author’s E-Mail Address: [email protected]
1 This paper is an extended version of a chapter in the 2007 India: Selected Issues. The author thanks the 2007 India Article IV team, Jerald Schiff, and seminar participants at the Reserve Bank of India, India’s Ministry of Finance, and the IMF’s Asia and Pacific Department for their helpful comments; Renu Kohli and Andreas Jobst for their data inputs; and Lesa Yee for editorial help.

2
Contents Page
I. Introduction.........................................................................................................................3 II. Are Indian Firms Increasingly Relying on External Funds? ..............................................5 III. Are There Signs of Financing Constraints?........................................................................7 IV. Does Higher External Finance Dependence Imply Weaker Firm Growth? .....................11 V. Policy Implication: Why Does India Need a Corporate Bond Market? ...........................13 VI. Conclusion ........................................................................................................................15 References................................................................................................................................27 Figures 1. India: The Corporate Sector and Growth..........................................................................16 2. India: Sources of External Funds, Aggregate, Flow.........................................................16 Tables 1. Distributions of Firms in the Study: Number of Firms.....................................................17 2. Distributions of Firms in the Study: External Funds in Percent of Total Funds ..............18 3. Distributions of Firms in the Study: Equity-to-Asset and Debt-to-Asset Ratios..............19 4. Distributions of Firms in the Study: Foreign Borrowing to Asset Ratio and External Funds Relative to Capital Expenditure..........................................................20 5. Determinants of External Funds Use in India...................................................................21 6. Determinants of Leverage in India, Debt-to-Assets Ratio................................................22 7. Determinants of Foreign Borrowing Use in India ............................................................23 8. Determinants of External Funds Use in India...................................................................24 9. Determinants of Firm Growth ..........................................................................................25 Appendix Table Industries’ Dependence on External Finance (U.S.)................................................................26
3
I. INTRODUCTION
Establishing a clear-cut foundation for promoting certain financial sector development policies aiming at better financial stability and higher economic growth is not an easy task. On the one hand, a growing number of empirical papers find evidence that finance matters for growth. As overviewed by Levine (2004), King and Levine (1993), Levine and Zervos (1998), and Levine, et al (2000) provided pioneering works using macro-level data, and Rajan and Zingales (1998) have established microeconomic level evidence.2 In addition, a series of financial crises in the 1990s’ drew attention to the need for maintaining financial stability in order to achieve economic stability. These analyses provide a backbone for numerous policy recommendations to general financial systems in general. However, the foundation for promoting a particular set of policies to develop certain segments of the financial system is often vague. For instance, in India—one of the fastest growing economies in the world—the need for developing the embryonic corporate bond market is repeatedly emphasized (IMF (2008) and World Bank (2006)); yet building a strong case for it other than citing its small size and anecdotal evidences3 is difficult. While a large number of academic papers discuss the structure of financial systems and growth and stability,4 there seems to be a lack of a straightforward answer to the question of why India needs a corporate bond market, especially when there is well-developed equity market.
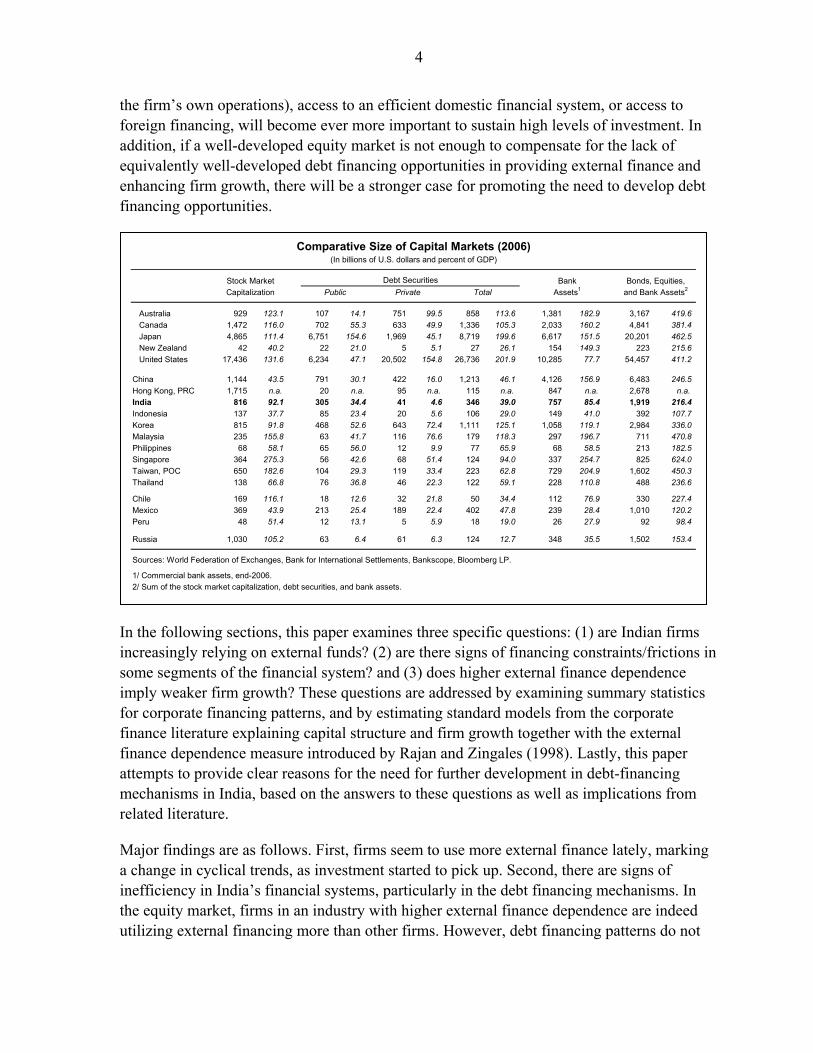
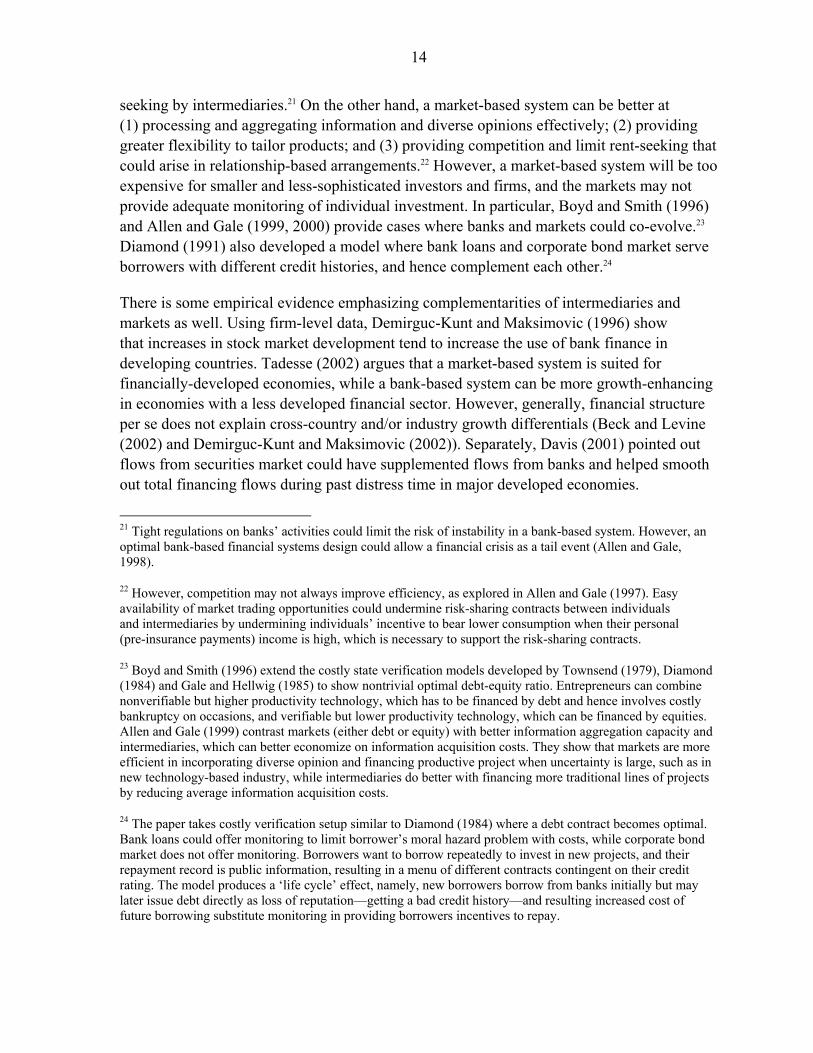
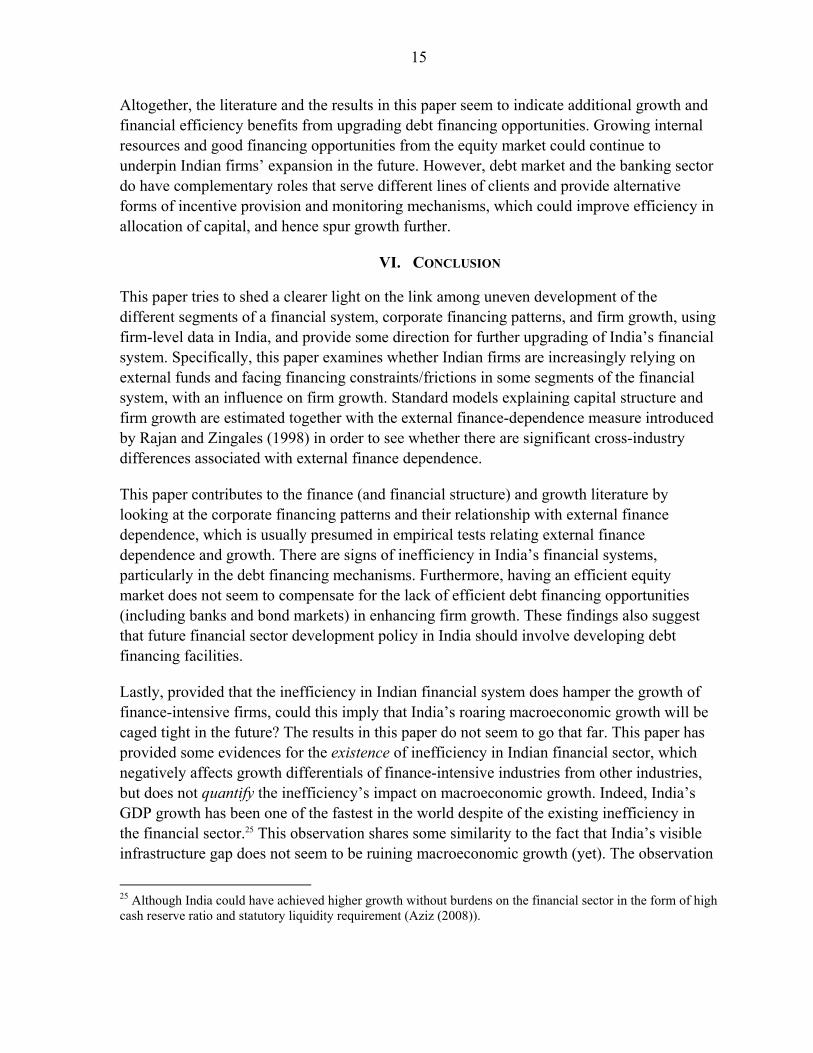
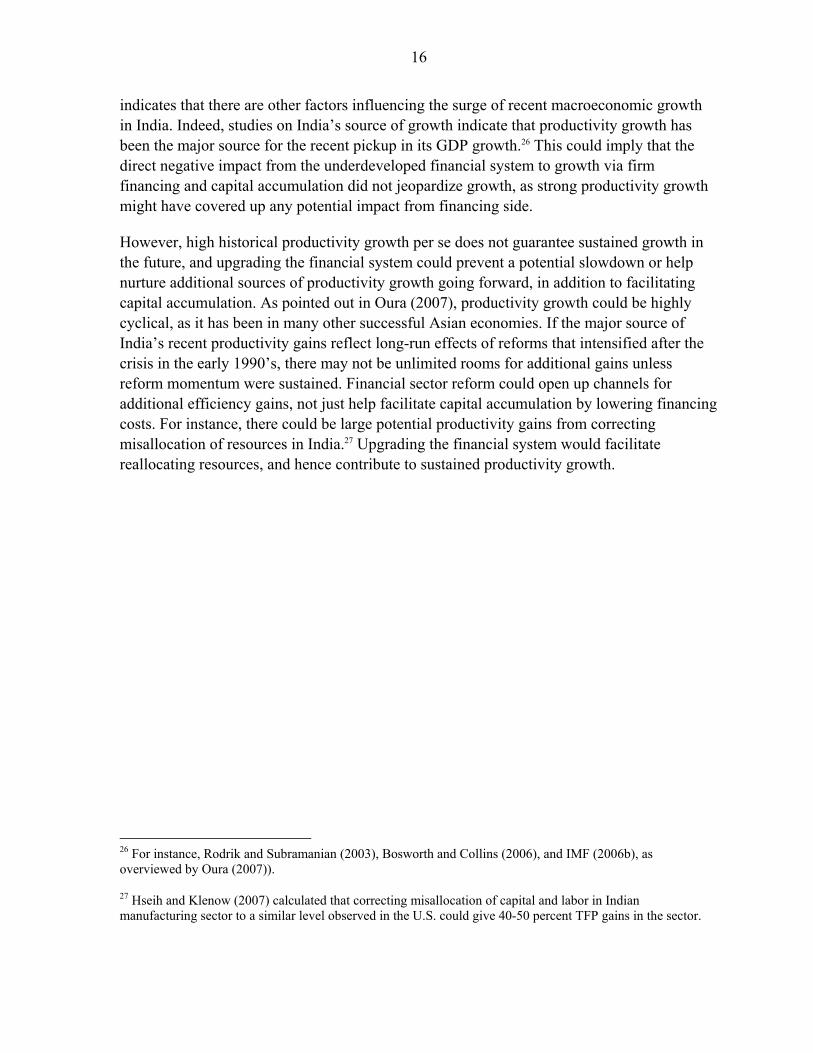
This paper attempts to establish a clearer link among uneven development of the different segments of a financial system, corporate financing patterns, and firm growth, using firm-level data in India. The corporate sector and its investment in India have been playing a key role driving the recent rise in India’s economic growth (Figure 1). The rapid pace of India’s corporate sector expansion will in turn continue to require very large amounts of funds. Furthermore, India’s financial system is known for its rather skewed development, equipped with world-class equity markets but much less developed debt financing opportunities (Table). Firms are also rapidly increasing foreign financing as well (Figure 2). Analyzing sources of corporate funds will shed light on this uneven development of the India’s financial system and the need and directions for further upgrading. If firms are increasingly using external funds (funds from outside of the firm)5 rather than internal funds (funds generated by 2 However, skepticism exists. Most famously, Lucas (1988) discussed that finance simply follows growth, not vice versa.
3 In World Bank (2006), authors emphasized the experiences during the Asian crisis where mal-functioning of the bank-based system caused the boom-bust cycle in the economy, and discussed the need for developing a more market-based system.
4 Levine (2004) provides a comprehensive survey of the finance and growth literature, including discussions on financial structure and growth. Demirgüç-Kunt and Levine (2001) survey empirical evidence on financial structure and growth, and Allen and Gale (2000) go through theoretical perspectives in depth.
5 Throughout this paper, the term “external finance” is used to indicate sources of funds outside of a firm, including both domestic and foreign finance. The term “foreign” is used to indicate funds from overseas.
4
the firm’s own operations), access to an efficient domestic financial system, or access to foreign financing, will become ever more important to sustain high levels of investment. In addition, if a well-developed equity market is not enough to compensate for the lack of equivalently well-developed debt financing opportunities in providing external finance and enhancing firm growth, there will be a stronger case for promoting the need to develop debt financing opportunities.
In the following sections, this paper examines three specific questions: (1) are Indian firms increasingly relying on external funds? (2) are there signs of financing constraints/frictions in some segments of the financial system? and (3) does higher external finance dependence imply weaker firm growth? These questions are addressed by examining summary statistics for corporate financing patterns, and by estimating standard models from the corporate finance literature explaining capital structure and firm growth together with the external finance dependence measure introduced by Rajan and Zingales (1998). Lastly, this paper attempts to provide clear reasons for the need for further development in debt-financing mechanisms in India, based on the answers to these questions as well as implications from related literature.
Major findings are as follows. First, firms seem to use more external finance lately, marking a change in cyclical trends, as investment started to pick up. Second, there are signs of inefficiency in India’s financial systems, particularly in the debt financing mechanisms. In the equity market, firms in an industry with higher external finance dependence are indeed utilizing external financing more than other firms. However, debt financing patterns do not
Australia 929 123.1 107 14.1 751 99.5 858 113.6 1,381 182.9 3,167 419.6 Canada 1,472 116.0 702 55.3 633 49.9 1,336 105.3 2,033 160.2 4,841 381.4 Japan 4,865 111.4 6,751 154.6 1,969 45.1 8,719 199.6 6,617 151.5 20,201 462.5 New Zealand 42 40.2 22 21.0 5 5.1 27 26.1 154 149.3 223 215.6 United States 17,436 131.6 6,234 47.1 20,502 154.8 26,736 201.9 10,285 77.7 54,457 411.2
China 1,144 43.5 791 30.1 422 16.0 1,213 46.1 4,126 156.9 6,483 246.5 Hong Kong, PRC 1,715 n.a. 20 n.a. 95 n.a. 115 n.a. 847 n.a. 2,678 n.a.India 816 92.1 305 34.4 41 4.6 346 39.0 757 85.4 1,919 216.4 Indonesia 137 37.7 85 23.4 20 5.6 106 29.0 149 41.0 392 107.7 Korea 815 91.8 468 52.6 643 72.4 1,111 125.1 1,058 119.1 2,984 336.0 Malaysia 235 155.8 63 41.7 116 76.6 179 118.3 297 196.7 711 470.8 Philippines 68 58.1 65 56.0 12 9.9 77 65.9 68 58.5 213 182.5 Singapore 364 275.3 56 42.6 68 51.4 124 94.0 337 254.7 825 624.0 Taiwan, POC 650 182.6 104 29.3 119 33.4 223 62.8 729 204.9 1,602 450.3 Thailand 138 66.8 76 36.8 46 22.3 122 59.1 228 110.8 488 236.6
Chile 169 116.1 18 12.6 32 21.8 50 34.4 112 76.9 330 227.4 Mexico 369 43.9 213 25.4 189 22.4 402 47.8 239 28.4 1,010 120.2 Peru 48 51.4 12 13.1 5 5.9 18 19.0 26 27.9 92 98.4
Russia 1,030 105.2 63 6.4 61 6.3 124 12.7 348 35.5 1,502 153.4
Sources: World Federation of Exchanges, Bank for International Settlements, Bankscope, Bloomberg LP.
1/ Commercial bank assets, end-2006.2/ Sum of the stock market capitalization, debt securities, and bank assets.
Assets1Public Private Total
Comparative Size of Capital Markets (2006)(In billions of U.S. dollars and percent of GDP)
Stock MarketCapitalization
Debt Securities Bonds, Equities,and Bank Assets2
Bank
5
correspond to external finance dependence; direct evidence that Indian banks and its corporate bond market are not efficient in allocating resources. Third, consistent with the financing patterns and existing studies on finance and growth, firms in an industry with higher external finance dependence, on average, grow more slowly than others.
In addition to highlighting specific efficiency issues in Indian financial systems, this paper contributes to the finance-growth literature by looking at the implicit assumptions not directly analyzed in the existing research. For instance, Rajan and Zingales (1998) analyzed the direct statistical relationship between industry growth and the financial development of a country weighted by external finance dependence of the industry, assuming that financial underdevelopment would influence firms’ funding patterns, and hence growth. The firm-level data in this paper allow one to test this assumption directly and strengthen the discussion connecting finance and firm growth.
The rest of the paper is organized around the three questions raised earlier. Before concluding, a final section discusses the policy implication of this paper’s results on financial sector development in India, especially for the corporate bond market.
II. ARE INDIAN FIRMS INCREASINGLY RELYING ON EXTERNAL FUNDS?
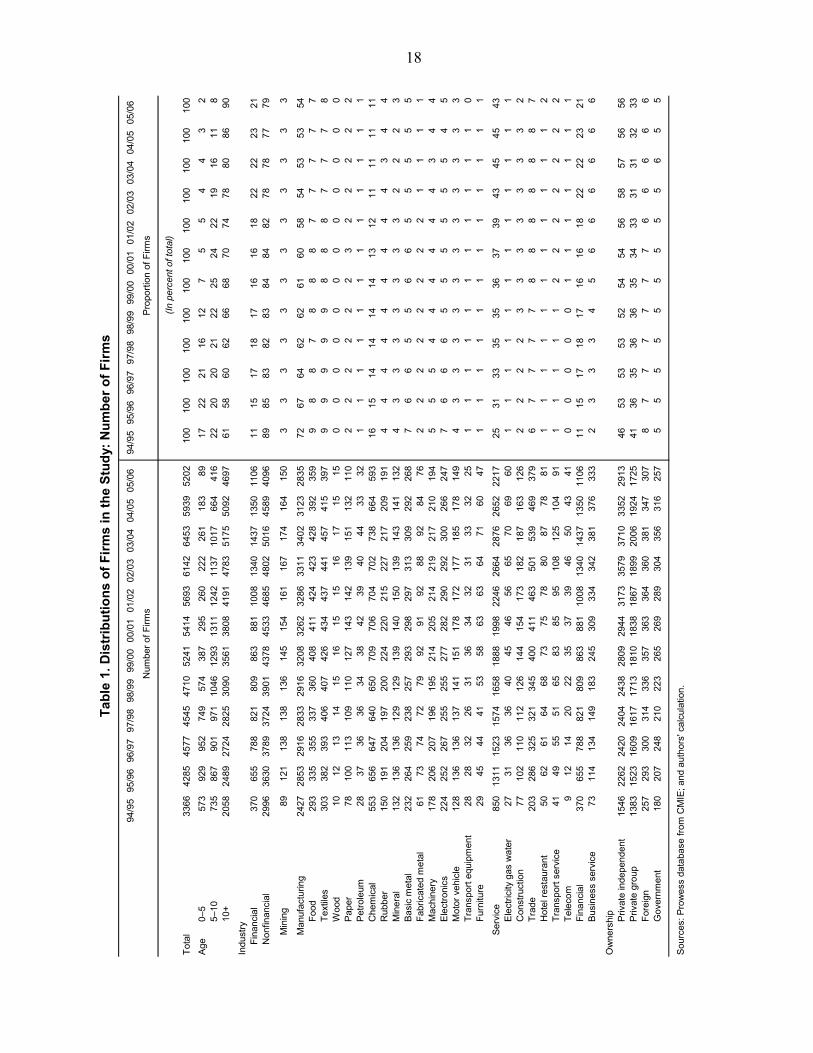
The patterns of corporate finance have changed dramatically since the end of the 1990’s. This paper uses the Prowess database from the Centre for Monitoring the Indian Economy (CMIE), a Mumbai-based economic think-tank, which includes detailed financial statement data for about 9,000 companies out of the approximately 10,000 listed companies in India.6 The data include from 3,300 to over 6,000 companies for fiscal years 1993/94 to 2005/06 after omitting errors and incomplete observations (Table 1). The majority of firms are over 10 years old (some are over 100 years old). By sector, manufacturing firms are the majority, and financial and chemical sectors are the two largest sub-sectors. The sample mostly represents domestic private sector companies (either independent or in a business group), although it also includes foreign and government owned companies, which are much larger on average than private sector companies by sales.
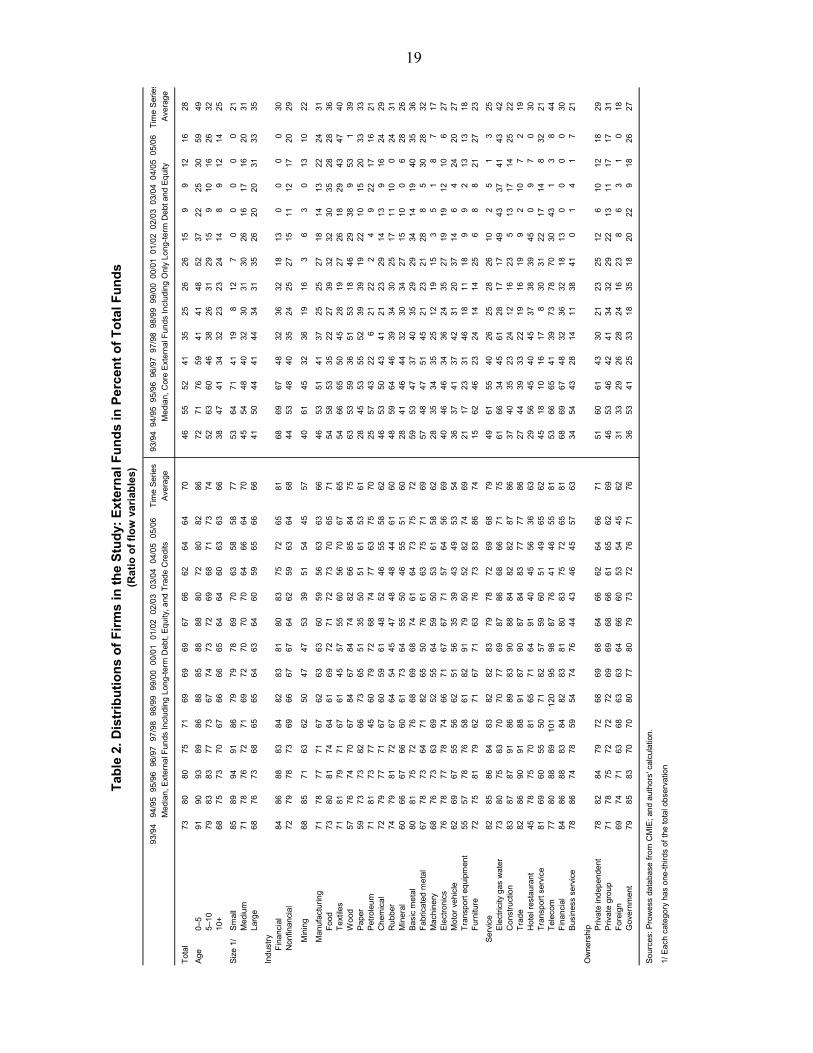
• The share of external funds in total funds gradually declined through 2003/04 (Table 2, left panel).7 In particular, there were large-scale repayments
6 The firms covered in the database account for 75 percent of corporate taxes and over 95 percent of excise duty collected by the Government of India. The database covers a much larger number of companies than the about 500 Indian firms included in the Corporate Vulnerability Utility (CVU) developed by the IMF, based on Worldscope and DataStream. In addition, Prowess has more detailed data fields, such as foreign borrowing, than CVU. Prowess is frequently used in existing studies on India’s financial system, including Topalova (2004), Love and Martinez Peria (2005), Allen, et al (2006), and Allen, et al (2007).
7 External funds are defined as long-term domestic and foreign debt, equity, and trade credit, while total funds are defined as external funds plus retained earnings and depreciation.
6
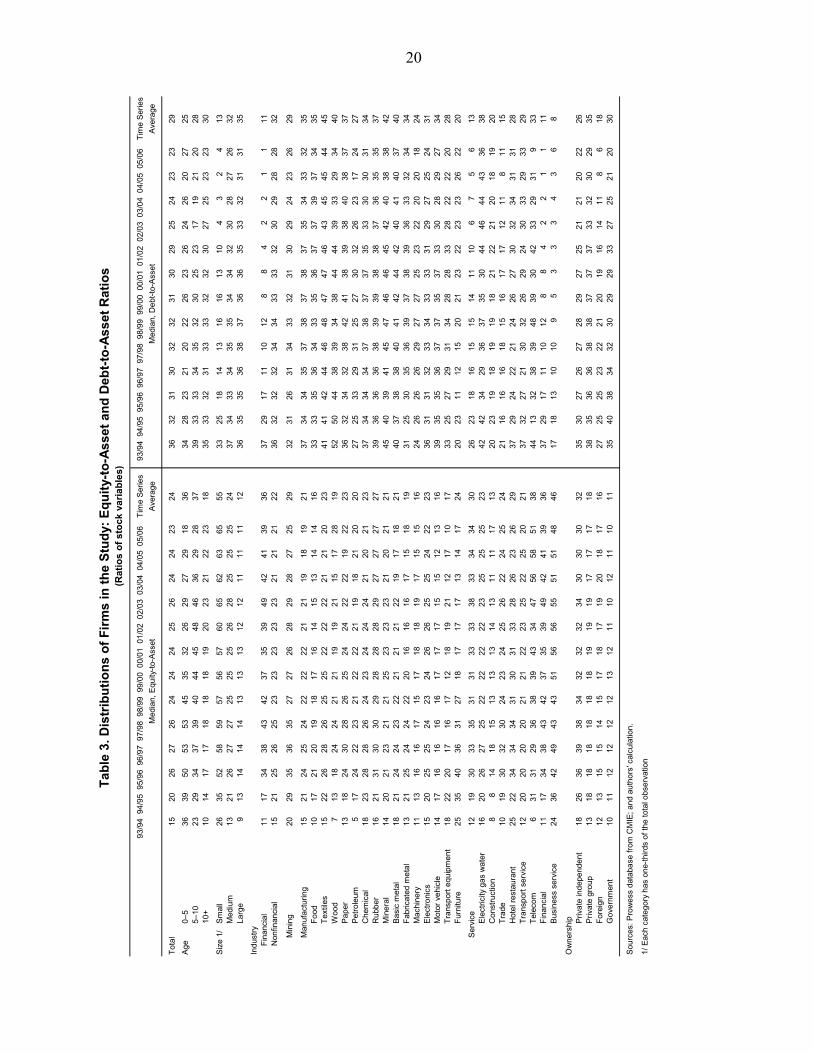
of debt since 2000/01, both domestic and external. These repayments reduced the median share of “core” external funds—defined as formal/active sources of funds including long-term debt and equity, and excluding passive/informal sources of funds such as trade credit—in total funds sharply from 26 percent of total funds in 2000/01 percent to 9 percent in 2002/03 and 2003/048 (Table 2, right panel). This de-leveraging reduced the debt-to-asset ratio, while more or less maintaining the equity-to-asset ratio (Table 3).
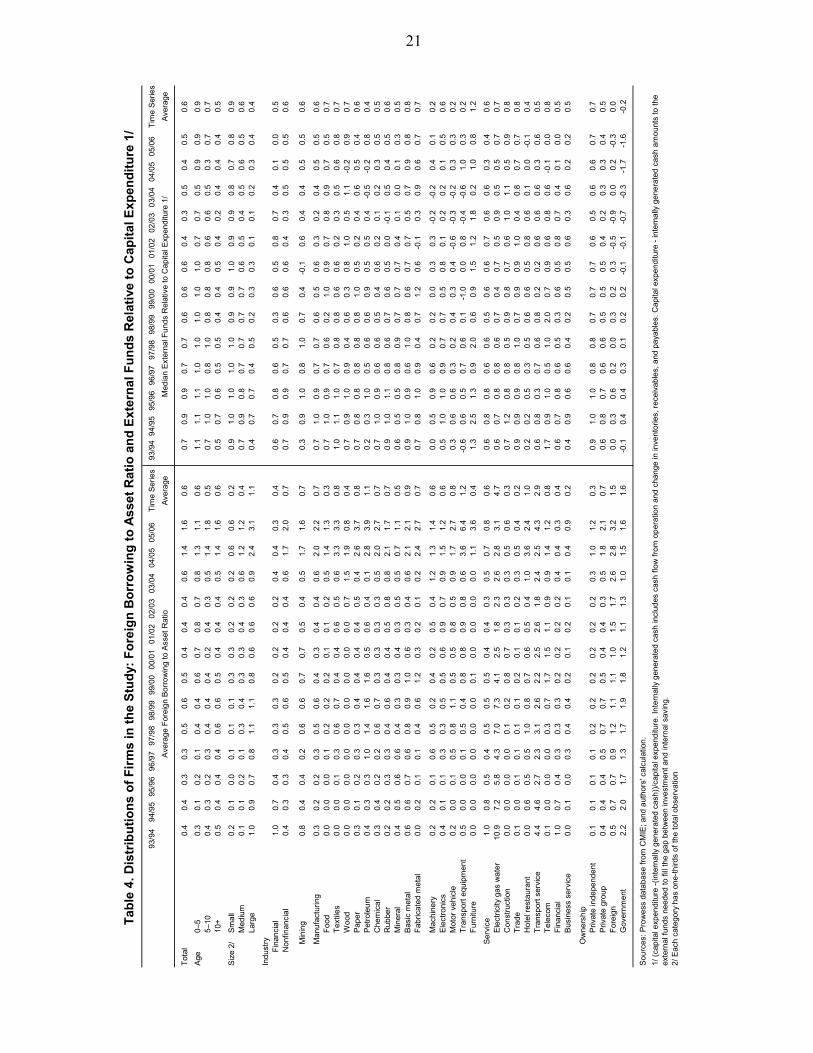
• However, the use of external funds seems to be picking up in the latest couple of years. The share of “core” external funds has come back up to about 16 percent in 2005/06 (Table 2, right panel). The use of foreign borrowing has increased and become more wide-spread across sectors (Table 4, left panel).
A combination of factors could have influenced these patterns:
• The domestic economic cycle. Corporate investment declined by about 5 percent of GDP from the mid-1990’s peak through 2001/02, in response to the unwinding of investments made during the early 1990’s boom. The recent pickup in the use of external funds coincides with the pickup in investment that started in 2002/03. Indeed, the growth of corporate investment is much faster than the growth of internal funds, and the share of external funds relative to capital expenditure has increased sharply for non-financial firms (Table 4, right panel).
• Corporate tax rate. The corporate tax rate has been reduced from 60–75 percent in the early 1990’s to 45 percent in 2005/06 (including surcharges).9 This could have contributed to the gradual decline in leverage as it reduced the tax benefits of debt.
• Global influences. Other economies in the world have shown similar corporate finance patterns (whether this reflects the transmission of global factors or coincidence is admittedly unclear). Major emerging markets turned into net capital exporters since 2000, as they de-leveraged after the 1990’s crises (IMF, 2004). The corporate sectors in G-7 countries turned into net savers starting around the turn of the century. IMF (2006a) discusses possible explanations for the G-7 experiences, including deleveraging of high debt accumulated during the 1990’s; high corporate profits owing to low interest rates and a generalized reduction in corporate tax rates; ongoing technological change that altered the relative price of capital; increased
8 As pointed out in Allen, et al (2006), Indian firms hold significantly large amounts of trade credit on their books, indicating a major role as a source of informal external funds.
9 Mohan (2007).
7
demand for purchasing overseas companies by corporations; and increased demand for cash owing to heightened uncertainty in the business environment.
In addition, there are some notable cross-section patterns:
• Age: Younger firms rely more on external finance, as shown in a high share of external funds in total funds (Table 1) and the large share of external funds relative to investment (Table 4). This might be because they need to invest in capacity and it may take several years before they become profitable.
• Size: Smaller firms have limited access to formal sources of external finance compared to larger firms, and rely relatively heavily on trade credit (as shown in a high share of overall external funds but a low share of core external funds; see Table 2). They also tend to rely on equity, most likely from owner-founders, rather than debt (Table 3). Despite limited access to core external finance, smaller firms rely on overall external funds to finance their investment more than larger firms (Table 4, right panel), indicating their extensive use of trade credits. However, larger firms are more likely to borrow from abroad than smaller firms (Table 4, left panel).
Overall, the Indian corporate sector’s use of external funds is rapidly increasing (although the share of external funds in total funds is still below the 1990’s peak). Sources of internal funds—corporate profit growth and gains in corporate saving—are strong, but not as strong as corporate investment. Thus, maintaining and improving access to external funds would be key to sustain healthy financing for strong corporate investment going forward.
III. ARE THERE SIGNS OF FINANCING CONSTRAINTS?
Economy-wide measures indicate rapid financial development in India in recent years. Between 2003/04 and 2006/07, the annual growth rate of bank credit to the corporate sector averaged 30 percent y/y, and its share in GDP increased by 5 percentage points to over 16 percent of GDP. Between 2002/03 and mid-2007, the market capitalization of the Bombay Stock Exchange in percent of GDP more than tripled to over 100 percent. Furthermore, capital inflows accelerated sharply from 2 percent of GDP in 2002/03 to 5 percent of GDP in 2006/07, with FDI inflows into Indian companies increasing by 1 percentage point of GDP and external commercial borrowing disbursements to corporations rising by 2.5 percentage points of GDP.
However, some segments of India’s financial system are less developed. Despite strong growth in recent years, the corporate debt (sum of bank credit to the corporate sector and corporate bonds) to GDP ratio remained below 20 percent in 2006/07, much lower than the average of 60 percent in emerging markets (near 80 percent in emerging Asia, 30 percent in emerging Latin America, and over 20 percent in emerging Europe (IMF, 2005)). Limited reliance on banks to fund corporate investment may reflect regulatory constraints, most notably the Statutory Liquidity Requirement that requires banks to invest a minimum of
8
25 percent of their deposits in government securities, and a priority sector lending requirement that mandates domestic banks to lend a minimum of 40 percent of their net credit to the priority sector.10 The corporate bond market is underdeveloped, amounting to less than 5 percent of GDP, compared with over 20 percent of GDP in Thailand, Chile, and Mexico, and 50–100 percent of GDP in more advanced economies. Impediments include fragmented tax structure, low transparency, restrictive issuance rules, lack of repo markets, and quantitative limits on the investor base (IMF, 2008).
Empirical Strategy
The empirical analyses in this paper indicate that corporate financing patterns reflect the uneven and still underdeveloped state of India’s financial systems. The financing patterns and capital structure of Indian firms have several notable features: (1) overall, there is a limited relationship between external finance dependence and actual use of such funds;11 (2) this is particularly true of debt financing, including foreign debt; and (3) equity markets, on the other hand, seem to be tapped by firms in more finance-intensive industries.
This paper employs an empirical strategy that properly instruments for external finance demand factors, and hence, can investigate the relationship between demand factors and financing patterns:12
)1(_ iii yusRZx εγβα +++=
The dependent variable ix is the period average of capital structure measures, including the share of external funds in total funds for firm i, and the share of debt, foreign debt, and equity over total assets. The independent variable iy is a standard set of firm characteristics known to have explanatory power for capital structure in the corporate finance literature. RZ_us is an instrument for inherent external finance demand introduced by Rajan and Zingales (1998) as an external finance dependence measure (henceforth, the RZ measure), and is calculated as the share of capital expenditure financed by external funds13 using U.S. data. The analysis 10 The priority sector includes agriculture, small business, small scale industries, retail trade, education, small housing, and consumption loans among other items.
11 Classification of external finance dependence is based on Rajan and Zingales (1998).
12 The empirical literature on capital structure often uses firm-level data and regresses capital structure measures on individual firm characteristics. In the finance-growth literature, such as Rajan and Zingales (1998) and de Serres, et al (2006), industry level cross country data are used, and industry growth in a country is regressed on an interaction term between RZ_us (RZ measure based on U.S. data) and a country specific financial development or financial regulation measure. Since our data are firm-level data for India only, the interaction term is reduced to the RZ_us variable.
13 Defined as (capital expenditure – (cash flow +decrease in inventory + decrease in receivables + increase in payables))/capital expenditure. Cash flow is adjusted for changes in inventory, receivables and payables
(continued…)
9
uses the calculation of de Serres, et al (2006) for ISIC 2-digit level industries, which includes a part of the services sector (but excludes the financial sector).
The RZ measure is widely used as an instrument for external funds demand, in spite of three strong assumptions. First, some industries are likely to have larger needs for external funds. For instance, the labor-intensive textile industry may not need much external finance compared with capital-intensive heavy industries such as chemicals and petroleum. Second, the cross-industry variation of the demand for external finance is likely to follow the same ordering across countries, implying that if in the United States, the petroleum sector needs more external finance than the textile sector, the same is true in India. Third, and most controversial, the U.S. financial system is assumed to have only limited frictions in supplying finance; therefore, the observed ordering of the RZ measure with the U.S. data14 should reflect demand factors applicable in other countries. While this last assumption is arguably strong, the measure produces consistently reasonable results in the growth-finance literature (including Rajan and Zingales (1998) and de Serres (2006) for instance).
Accepting these assumptions, if a financial system has minimal supply side constraints, it should provide more funds to sectors that inherently are more dependent on external funds (higher RZ measure). In the model (1), an efficient financial system should be represented by a positive, significant coefficient for the RZ_us. On the other hand, if a financial system is distorted, the industries with large external finance dependence may not necessarily receive larger external resources, resulting in an insignificant or even a negative coefficient for the RZ_us measure.15
The model includes a standard set of firm characteristics that are often used in empirical models to explain capital structure by controlling for other relevant factors.16 Debt
represents internal funds; therefore, the numerator represents external funds that fill the gap between financing needs for investment and internally generated resources.
14 After smoothing short-term cyclical fluctuations; indeed, Rajan and Zingales (1998) used the decade average data to calculate the RZ measure.
15 A negative correlation between demand intensity for credit and actual amount borrowed indicates a “backward bending” supply curve, which could exist if higher interest rates attract less creditworthy borrowers and lenders cannot observe the creditworthiness of a borrower.
16 Two relatively recent studies covering non-U.S. firms, Rajan and Zingales (1995, covering G7 countries) and Booth, et al. (2001, covering developing countries) find that despite substantial institutional differences across countries, firm debt ratios in developed and developing countries seem to be influenced by some similar factors. More generally, in a widely cited review of the theoretical literature, Harris and Raviv (1991) conclude that debt use is positively related to fixed assets, non-debt tax shields, investment levels, and firm size, and is negatively related to cash-flow volatility, growth opportunities, advertising expenditure, the probability of bankruptcy, profitability, and the uniqueness of product. Theoretical models are based on agency costs (costs due to conflicts of interest between shareholders and managers or between shareholders and debt holders), asymmetric information (insiders and managers tend to have private information and may undertake inefficient
(continued…)
10
ratios tend to be lower for firms that are more profitable (hence, cash rich) and have higher market-to-book ratios (the latter is usually considered as a proxy for growth opportunities or Tobin’s Q). On the other hand, debt ratios tend to be higher for firms that are larger and those that have more tangible assets that they can pledge as collateral. Therefore, the model includes firm size (using log of sales), profitability (return on asset (ROA)), asset tangibility (ratio of tangible assets to total assets), firm age (using log of years since incorporation at the beginning of the sample period), and dummy variables for ownership. Following Love and Peria (2005), the square of firm age is also included.17 Models are estimated with and without the market-to-book ratio, since only a limited number of firms have this data. For models explaining foreign borrowing, a dummy variable to distinguish exporters is added.
Models are estimated for three sets of cross section data: 1993/94–2005/06 (whole sample), 1993/94–1998/99 (first half), and 1999/00–2005/06 (second half). All the ratios were calculated by first summing the denominator and numerator across time with an aim to smooth annual volatility (similarly to Rajan and Zingales (1998)).
Tables 5–8 summarize the estimates. The two sub-samples include different numbers of observations, reflecting entry and exit of firms. Similar results are obtained even when focusing on a subset of companies that have data for the whole period.
Results: Share of core external funds (Table 5)
• The coefficient on the RZ_us measure is negative and significant for the whole sample and the sub-sample in the 1990’s, implying that India’s financial system is not allocating resources to firms that are the most finance-intensive, other things being equal.
• Coefficients for firm characteristics are generally as expected, although the different results for equity and debt have implications that are not clear cut. Larger firms seem to have better access to external funds, and more profitable firms with rich cash positions tend to rely less on external funds, as expected. The negative sign on age and asset tangibility seems to be picking up its impact on equity finance (younger firms receive equity finance from founding promoters) as shown in the regressions for equity-to-assets (Table 8). Foreign and government-owned firms use less external finance overall, especially debt (Table 6), but they use more equity (Table 8) than
investments), product/input market interaction (among competing producers, and/or between producers and consumers/suppliers), and corporate control considerations (related to takeover activities).
17 In their study, this variable often has negative and significant coefficients. One possible explanation is that some firms are extremely old (over 100 years in 1994), often in textile and food industries (tea), and they could survive owing to nonmarket factors. Another possibility is that many age and firm growth related dynamics could take place in a short horizon and then taper off. The squared term could capture these nonlinear effects.

11
private Indian firms. This apparently indicates a stronger preference for equity finance in foreign and government-owned firms, consistent with the findings by Love and Peria (2005). However, it should be noted that these firms, especially government-owned ones, are much larger than Indian independent companies on average, which explains the larger median use of external funds for these firms (Table 2).
Results: Debt to assets (Table 6)
• The coefficient on the RZ_us measure is not significantly different from zero for any of the three samples. All the coefficients for firm characteristics are consistent with the existing literature on leverage (debt-to-equity or debt-to-assets).
Results: Foreign debt to assets (Table 7)
• The coefficient on the RZ_us measure is either not significantly different from zero or is significantly negative for all the cases. This implies that, so far, evidence is lacking that firms that need more external finance are going abroad in order to avoid constraints in the domestic markets. This could reflect the fact that smaller firms are more likely than large ones to face difficulties borrowing domestically, while bigger firms have greater access to foreign borrowing.
• Foreign debt is mostly accessed by large firms. For each cross-section sample, a model is estimated with all firms and another that includes only the firms with access to foreign borrowing (firms with foreign debt stocks greater than zero). The size impact becomes significant only when estimation is limited to a subset of firms with access to foreign debt. Asset tangibility seems to be associated with increased foreign borrowing. Rather surprisingly, foreign-owned firms are not more likely to access foreign borrowing, but this could reflect a preference for equity finance.
Results: Equity to assets (Table 8)
• The coefficient on the RZ_us measure is generally positive and significant. In particular, the equity market seems to provide an important source of finance for young and small firms with high growth opportunities in recent years. The estimation also confirms the preference for equity finance by foreign and government owned firms.
IV. DOES HIGHER EXTERNAL FINANCE DEPENDENCE IMPLY WEAKER FIRM GROWTH?
Given the evidence above that Indian firms with higher external finance dependence do not tend to borrow as much as less-dependent firms, one would expect to see a negative relation between external finance dependence and firm growth. To the extent finance matters for
12
growth, such financing constraints are likely to reduce firm growth compared to its potential. Indeed, the studies by Rajan and Zingales (1998, which includes India in their cross-country sample) and de Serres, et al (2006, which covers European countries) find that financial underdevelopment reduces the growth rate of an industry that is more dependent on external finance.
Similar empirical models are employed to those for capital structure (equation (1)). The dependent variable ix is the annual average growth rate for firm gross value added.18 Once again, the RZ_us measure functions as an instrument for inherent demand for external funds.
A slightly different set of firm characteristic variables is used, reflecting the literature on firm growth, and include the initial share of a firm’s gross value added in percent of total gross value added for all the firms in the sample, age, a dummy variables for exporters, access to foreign finance, and ownership, and some financial ratios, including ROA, leverage, and market-to-book ratios. Empirical studies by Evans (1987) and Hall (1987) using U.S. data, find that the growth rate of manufacturing firms is negatively associated with firm size and age. ROA and market to book ratio are expected to be positively correlated with firm growth, as ROA could proxy for a firm’s efficiency as well as availability of internal funds, and the market-to-book ratio could proxy for growth opportunities.
Similar to the estimations for capital structure, three sets of cross section data are used, covering 1993/94–2005/06, 1993/94–1998/99, and 1999/00–2005/06. Table 9 summarizes the results.
• The coefficient for RZ_us is negative and significant, indicating that firms in an industry that tend to rely more on external funds are growing more slowly than others. That means that the observed efficiency in the equity market is not enough to compensate for the lack of efficient debt financing opportunities, indicating the need to upgrade this part of the financial system in India (this point is explored further in the next section). In addition, this growth-hampering effect seems to be stronger in more recent years. It is possible that the cyclical upturn of investment and increased need for external finance could have tightened the existing constraints in the financial system.
• Firm specific control variables generally have coefficients with expected signs. Age is mostly negatively related to firm growth, and high profitability is positively correlated with growth. Access to foreign finance seems to contribute positively to growth.
18 Estimation using other measures such as growth rate of sales, total assets, or gross fixed assets yielded results that were broadly similar to the results from the model with gross value added.
13
V. POLICY IMPLICATION: WHY DOES INDIA NEED A CORPORATE BOND MARKET?
Why would India need further development in bank credit and the corporate bond market? Wouldn’t a well-developed equity market compensate for the weak financing opportunities using other mechanisms? In an attempt to answer these questions, this section draws on implications from existing literature as well as the results in this paper.
The empirical evidence in this paper seems to indicate that having efficient equity markets is not enough to compensate for the lack of well-functioning debt financing opportunities. In India, the use of debt instruments among corporations is not in line with the external finance dependence of their industries. In addition, there are statistically significant negative relationships between firm growth and industries’ external finance dependence, despite the observed efficiency and activity levels in the equity market.
There are some theoretical analyses that emphasize the importance of debt instruments. For instance, Townsend (1979), Diamond (1984), and Gale and Hellwig (1985) show that an optimal contract when it is costly to prevent borrowers from retaining profits without compensating investors—namely, when output is costly to verify— is a simple debt contract that specifies fixed payment and forces borrowers to go into bankruptcy, which destroys the value of the borrower’s profit, if borrowers fail to repay the contracted amount.19 Furthermore, in the practice of financial engineering, debt instruments and their market help develop other types of derivatives, since their cash flows are relatively predictable and tractable to be structured. Developing debt instrument will help develop transactions of other types of financial claims.20
As for the relative benefit of bank/intermediary-based systems versus market-based systems, research indicates that one system does not necessarily dominate the other; rather they could serve different functions and range of clients. As extensively reviewed in Allen and Gale (2000) and Levine (2004), an intermediary-based system could be better at (1) providing a simple set of services at a low cost (such as simple debt and deposit contracts) for smaller investors and firms; (2) economizing information acquisition costs; and (3) monitoring and eliciting corporate governance, often based on (long-term) relationship with clients. However, a bank-based system could entail risks of bankruptcies and bank runs and rent-
19 However, these models predict that firms will be 100 percent debt financed, because equity claims, which promise payments based on firm performance, would require excessive verification cost. Boyd and Smith (1996) extend these costly state verification models to find a nontrivial capital structure (discussed later).
20 However, adding new instruments does not guarantee improved welfare. Incomplete market theory says that the welfare implication of adding new financial instruments to an incomplete market economy is notoriously ambiguous (Allen and Gale, 2000).
14
seeking by intermediaries.21 On the other hand, a market-based system can be better at (1) processing and aggregating information and diverse opinions effectively; (2) providing greater flexibility to tailor products; and (3) providing competition and limit rent-seeking that could arise in relationship-based arrangements.22 However, a market-based system will be too expensive for smaller and less-sophisticated investors and firms, and the markets may not provide adequate monitoring of individual investment. In particular, Boyd and Smith (1996) and Allen and Gale (1999, 2000) provide cases where banks and markets could co-evolve.23 Diamond (1991) also developed a model where bank loans and corporate bond market serve borrowers with different credit histories, and hence complement each other.24
There is some empirical evidence emphasizing complementarities of intermediaries and markets as well. Using firm-level data, Demirguc-Kunt and Maksimovic (1996) show that increases in stock market development tend to increase the use of bank finance in developing countries. Tadesse (2002) argues that a market-based system is suited for financially-developed economies, while a bank-based system can be more growth-enhancing in economies with a less developed financial sector. However, generally, financial structure per se does not explain cross-country and/or industry growth differentials (Beck and Levine (2002) and Demirguc-Kunt and Maksimovic (2002)). Separately, Davis (2001) pointed out flows from securities market could have supplemented flows from banks and helped smooth out total financing flows during past distress time in major developed economies.
21 Tight regulations on banks’ activities could limit the risk of instability in a bank-based system. However, an optimal bank-based financial systems design could allow a financial crisis as a tail event (Allen and Gale, 1998).
22 However, competition may not always improve efficiency, as explored in Allen and Gale (1997). Easy availability of market trading opportunities could undermine risk-sharing contracts between individuals and intermediaries by undermining individuals’ incentive to bear lower consumption when their personal (pre-insurance payments) income is high, which is necessary to support the risk-sharing contracts.
23 Boyd and Smith (1996) extend the costly state verification models developed by Townsend (1979), Diamond (1984) and Gale and Hellwig (1985) to show nontrivial optimal debt-equity ratio. Entrepreneurs can combine nonverifiable but higher productivity technology, which has to be financed by debt and hence involves costly bankruptcy on occasions, and verifiable but lower productivity technology, which can be financed by equities. Allen and Gale (1999) contrast markets (either debt or equity) with better information aggregation capacity and intermediaries, which can better economize on information acquisition costs. They show that markets are more efficient in incorporating diverse opinion and financing productive project when uncertainty is large, such as in new technology-based industry, while intermediaries do better with financing more traditional lines of projects by reducing average information acquisition costs.
24 The paper takes costly verification setup similar to Diamond (1984) where a debt contract becomes optimal. Bank loans could offer monitoring to limit borrower’s moral hazard problem with costs, while corporate bond market does not offer monitoring. Borrowers want to borrow repeatedly to invest in new projects, and their repayment record is public information, resulting in a menu of different contracts contingent on their credit rating. The model produces a ‘life cycle’ effect, namely, new borrowers borrow from banks initially but may later issue debt directly as loss of reputation—getting a bad credit history—and resulting increased cost of future borrowing substitute monitoring in providing borrowers incentives to repay.
15
Altogether, the literature and the results in this paper seem to indicate additional growth and financial efficiency benefits from upgrading debt financing opportunities. Growing internal resources and good financing opportunities from the equity market could continue to underpin Indian firms’ expansion in the future. However, debt market and the banking sector do have complementary roles that serve different lines of clients and provide alternative forms of incentive provision and monitoring mechanisms, which could improve efficiency in allocation of capital, and hence spur growth further.
VI. CONCLUSION
This paper tries to shed a clearer light on the link among uneven development of the different segments of a financial system, corporate financing patterns, and firm growth, using firm-level data in India, and provide some direction for further upgrading of India’s financial system. Specifically, this paper examines whether Indian firms are increasingly relying on external funds and facing financing constraints/frictions in some segments of the financial system, with an influence on firm growth. Standard models explaining capital structure and firm growth are estimated together with the external finance-dependence measure introduced by Rajan and Zingales (1998) in order to see whether there are significant cross-industry differences associated with external finance dependence.
This paper contributes to the finance (and financial structure) and growth literature by looking at the corporate financing patterns and their relationship with external finance dependence, which is usually presumed in empirical tests relating external finance dependence and growth. There are signs of inefficiency in India’s financial systems, particularly in the debt financing mechanisms. Furthermore, having an efficient equity market does not seem to compensate for the lack of efficient debt financing opportunities (including banks and bond markets) in enhancing firm growth. These findings also suggest that future financial sector development policy in India should involve developing debt financing facilities.
Lastly, provided that the inefficiency in Indian financial system does hamper the growth of finance-intensive firms, could this imply that India’s roaring macroeconomic growth will be caged tight in the future? The results in this paper do not seem to go that far. This paper has provided some evidences for the existence of inefficiency in Indian financial sector, which negatively affects growth differentials of finance-intensive industries from other industries, but does not quantify the inefficiency’s impact on macroeconomic growth. Indeed, India’s GDP growth has been one of the fastest in the world despite of the existing inefficiency in the financial sector.25 This observation shares some similarity to the fact that India’s visible infrastructure gap does not seem to be ruining macroeconomic growth (yet). The observation
25 Although India could have achieved higher growth without burdens on the financial sector in the form of high cash reserve ratio and statutory liquidity requirement (Aziz (2008)).
16
indicates that there are other factors influencing the surge of recent macroeconomic growth in India. Indeed, studies on India’s source of growth indicate that productivity growth has been the major source for the recent pickup in its GDP growth.26 This could imply that the direct negative impact from the underdeveloped financial system to growth via firm financing and capital accumulation did not jeopardize growth, as strong productivity growth might have covered up any potential impact from financing side.
However, high historical productivity growth per se does not guarantee sustained growth in the future, and upgrading the financial system could prevent a potential slowdown or help nurture additional sources of productivity growth going forward, in addition to facilitating capital accumulation. As pointed out in Oura (2007), productivity growth could be highly cyclical, as it has been in many other successful Asian economies. If the major source of India’s recent productivity gains reflect long-run effects of reforms that intensified after the crisis in the early 1990’s, there may not be unlimited rooms for additional gains unless reform momentum were sustained. Financial sector reform could open up channels for additional efficiency gains, not just help facilitate capital accumulation by lowering financing costs. For instance, there could be large potential productivity gains from correcting misallocation of resources in India.27 Upgrading the financial system would facilitate reallocating resources, and hence contribute to sustained productivity growth.
26 For instance, Rodrik and Subramanian (2003), Bosworth and Collins (2006), and IMF (2006b), as overviewed by Oura (2007)).
27 Hseih and Klenow (2007) calculated that correcting misallocation of capital and labor in Indian manufacturing sector to a similar level observed in the U.S. could give 40-50 percent TFP gains in the sector.
17
0
2
4
6
8
10
1219
80/8
119
81/8
219
82/8
319
83/8
419
84/8
519
85/8
619
86/8
719
87/8
819
88/8
919
89/9
019
90/9
119
91/9
219
92/9
319
93/9
419
94/9
519
95/9
619
96/9
719
97/9
819
98/9
919
99/0
020
00/0
120
01/0
220
02/0
320
03/0
420
04/0
520
05/0
6
0
2
4
6
8
10
12Real GDP Growth RateCorporate Investnment in % GDP Corporate Saving in % GDP
Figure 1. India: The Corporate Sector and Growth(In percent, in percent of GDP, 1990/81–2005/06)
-10123456789
10
1990
–91
1991
–92
1992
–93
1993
–94
1994
–95
1995
–96
1996
–97
1997
–98
1998
–99
1999
–00
2000
–01
2001
–02
2002
–03
2003
–04
2004
–05
2005
–06
2006
–07
-10
0
10
20
30
40
50
60
70Bank lendingEquity issuanceDRsECBsFDIShare of foreign financing/total right scale
Notes and sources: Internal funds are defined as corporate saving from national accounts. External funds are sum of bank lending to industry (banking statistics), new domestic equity issuance (SEBI), and foreign financing (sum of receipts from issuance of depository receipts, FDI inflows (balance of payments (BOP), and net external commercial borrowing inflows (BOP)).
Figure 2. India: Sources of External Funds, Macro-based Flow Data
(In percent of GDP)
18
94/9
595
/96
96/9
797
/98
98/9
999
/00
00/0
101
/02
02/0
303
/04
04/0
505
/06
94/9
595
/96
96/9
797
/98
98/9
999
/00
00/0
101
/02
02/0
303
/04
04/0
505
/06
Tota
l33
6642
8545
7745
4547
1052
4154
1456
9361
4264
5359
3952
0210
010
010
010
010
010
010
010
010
010
010
010
0Ag
e0–
557
392
995
274
957
438
729
526
022
226
118
389
1722
2116
127
55
44
32
5–10
735
867
901
971
1046
1293
1311
1242
1137
1017
664
416
2220
2021
2225
2422
1916
118
10+
2058
2489
2724
2825
3090
3561
3808
4191
4783
5175
5092
4697
6158
6062
6668
7074
7880
8690
Indu
stry
Fina
ncia
l37
065
578
882
180
986
388
110
0813
4014
3713
5011
0611
1517
1817
1616
1822
2223
21N
onfin
anci
al29
9636
3037
8937
2439
0143
7845
3346
8548
0250
1645
8940
9689
8583
8283
8484
8278
7877
79
Min
ing
8912
113
813
813
614
515
416
116
717
416
415
03
33
33
33
33
33
3
Man
ufac
turin
g24
2728
5329
1628
3329
1632
0832
6232
8633
1134
0231
2328
3572
6764
6262
6160
5854
5353
54Fo
od29
333
535
533
736
040
841
142
442
342
839
235
99
88
78
88
77
77
7Te
xtile
s30
338
239
340
640
742
643
443
744
145
741
539
79
99
99
88
87
77
8W
ood
1012
1314
1516
1515
1617
1515
00
00
00
00
00
00
Pape
r78
100
113
109
110
127
143
142
139
151
132
110
22
22
22
32
22
22
Petro
leum
2837
3636
3438
4239
4044
3332
11
11
11
11
11
11
Che
mic
al55
365
664
764
065
070
970
670
470
273
866
459
316
1514
1414
1413
1211
1111
11R
ubbe
r15
019
120
419
720
022
422
021
522
721
720
919
14
44
44
44
44
34
4M
iner
al13
213
613
612
912
913
914
015
013
914
314
113
24
33
33
33
32
22
3Ba
sic
met
al23
226
425
923
825
729
329
829
731
330
929
226
87
66
55
66
55
55
5Fa
bric
ated
met
al61
7374
7279
9291
9288
9284
762
22
22
22
21
11
1M
achi
nery
178
206
207
196
195
214
205
214
219
217
210
194
55
54
44
44
43
44
Elec
troni
cs22
425
226
725
525
527
728
229
029
230
026
624
77
66
65
55
55
54
5M
otor
veh
icle
128
136
136
137
141
151
178
172
177
185
178
149
43
33
33
33
33
33
Tran
spor
t equ
ipm
ent
2828
3226
3136
3432
3133
3225
11
11
11
11
11
10
Furn
iture
2945
4441
5358
6363
6471
6047
11
11
11
11
11
11
Serv
ice
850
1311
1523
1574
1658
1888
1998
2246
2664
2876
2652
2217
2531
3335
3536
3739
4345
4543
Elec
trici
ty g
as w
ater
2731
3636
4045
4656
6570
6960
11
11
11
11
11
11
Con
stru
ctio
n77
102
110
112
126
144
154
173
182
187
163
126
22
22
33
33
33
32
Trad
e20
328
632
532
134
540
041
146
350
153
946
937
96
77
77
88
88
88
7H
otel
rest
aura
nt50
6261
6468
7375
7880
8778
811
11
11
11
11
11
2Tr
ansp
ort s
ervi
ce41
4955
5165
8385
9510
812
510
491
11
11
12
22
22
22
Tele
com
912
1420
2235
3739
4650
4341
00
00
01
11
11
11
Fina
ncia
l37
065
578
882
180
986
388
110
0813
4014
3713
5011
0611
1517
1817
1616
1822
2223
21Bu
sine
ss s
ervi
ce73
114
134
149
183
245
309
334
342
381
376
333
23
33
45
66
66
66
Ow
ners
hip
Priv
ate
inde
pend
ent
1546
2262
2420
2404
2438
2809
2944
3173
3579
3710
3352
2913
4653
5353
5254
5456
5857
5656
Priv
ate
grou
p13
8315
2316
0916
1717
1318
1018
3818
6718
9920
0619
2417
2541
3635
3636
3534
3331
3132
33Fo
reig
n25
729
330
031
433
635
736
336
436
038
134
730
78
77
77
77
66
66
6G
over
nmen
t18
020
724
821
022
326
526
928
930
435
631
625
75
55
55
55
55
65
5
Sour
ces:
Pro
wes
s da
taba
se fr
om C
MIE
; and
aut
hors
' cal
cula
tion.
(In
perc
ent o
f tot
al)
Prop
ortio
n of
Firm
s
Tabl
e 1.
Dis
trib
utio
ns o
f Firm
s in
the
Stud
y: N
umbe
r of F
irms
Num
ber o
f Firm
s
19
93/9
494
/95
95/9
696
/97
97/9
898
/99
99/0
000
/01
01/0
202
/03
03/0
404
/05
05/0
6Ti
me
Serie
s93
/94
94/9
595
/96
96/9
797
/98
98/9
999
/00
00/0
101
/02
02/0
303
/04
04/0
505
/06
Tim
e S
erie
sA
vera
geAv
erag
e
Tota
l73
8080
7571
6969
6967
6662
6464
7046
5552
4135
2526
2615
99
1216
28Ag
e0–
591
9093
8986
8885
8888
8072
8082
8672
7176
5941
4148
5237
2225
3059
495–
1079
8383
7773
6774
7372
6968
7173
7452
6360
4638
2631
2915
910
1626
3210
+68
7573
7067
6666
6564
6460
6363
6638
4741
3432
2323
2414
89
1214
25
Size
1/
Sm
all
8589
9491
8679
7978
6970
6358
5877
5364
7141
198
127
00
00
021
Med
ium
7178
7672
7169
7270
7070
6466
6470
4554
4840
3230
3130
2616
1716
2031
Larg
e68
7673
6865
6564
6364
6059
6566
6641
5044
4144
3431
3526
2020
3133
35
Indu
stry
Fina
ncia
l84
8688
8384
8283
8180
8375
7265
8168
6967
4832
3632
1813
00
00
30N
onfin
anci
al72
7978
7369
6667
6764
6259
6364
6844
5348
4035
2425
2715
1112
1720
29
Min
ing
6885
7163
6250
4747
5339
5154
4557
4061
4532
3619
163
63
013
1022
Man
ufac
turin
g71
7877
7167
6263
6360
5956
6363
6646
5351
4137
2525
2718
1413
2224
31Fo
od73
8081
7464
6169
7271
7273
7065
7154
5853
3522
2739
3232
3035
2828
36Te
xtile
s71
8179
7167
6145
5755
6056
7067
6554
6665
5045
2819
2726
1829
4347
40W
ood
5776
7470
6784
6784
7482
6685
8475
6353
5936
5153
1846
2938
953
139
Pap
er59
7373
8266
7365
5135
5051
6153
6128
4553
5552
3939
1922
1015
2033
33P
etro
leum
7181
7377
4560
7972
6874
7763
7570
2557
4322
621
222
49
2217
1621
Che
mic
al72
7977
7167
6059
6148
5246
5558
6246
5350
4341
2123
2914
139
1624
29R
ubbe
r74
7981
7267
6454
4547
4848
4461
6048
5964
4639
3430
2517
1110
024
31M
iner
al60
6667
6660
6173
6455
5046
5551
6028
4146
4432
3034
2715
100
628
26B
asic
met
al80
8175
7276
6869
6874
6164
7375
7259
5347
3740
3529
2934
1419
4035
36Fa
bric
ated
met
al67
7873
6471
8265
5076
6163
7571
6957
4847
5145
2123
2128
85
3028
32M
achi
nery
6876
7363
6952
5564
5950
5361
5862
2835
3435
2512
1915
35
18
717
Ele
ctro
nics
7678
7778
7466
7167
6771
5764
5669
4046
4634
3624
3527
1919
1210
627
Mot
or v
ehic
le62
6967
5556
6251
5635
3943
4953
5436
3741
3742
3120
3714
64
2420
27Tr
ansp
ort e
quip
men
t55
5778
7658
6182
9179
5052
8274
6921
1723
3146
1811
189
92
1313
18Fu
rnitu
re72
7581
7962
7167
7163
7673
8386
7415
6246
2324
1414
256
88
2127
23
Ser
vice
8285
8684
8382
8283
7978
7269
6879
4961
5540
2625
2826
102
51
325
Ele
ctric
ity g
as w
ater
7380
7583
7070
7769
8786
6866
7175
6166
3445
6128
1717
4943
3741
4342
Con
stru
ctio
n83
8787
9186
8983
9088
8482
8287
8637
4035
2324
1216
235
1317
1425
22Tr
ade
8286
9091
8891
8790
8784
8377
7786
2744
3933
2219
1619
92
107
219
Hot
el re
stau
rant
4578
7570
8165
7164
9140
4556
3663
2956
4540
4537
3839
450
97
030
Tran
spor
t ser
vice
8169
6055
5071
8257
5960
5149
6562
4518
1016
178
3031
2217
148
3221
Tele
com
7780
8889
101
120
9598
8776
4146
5581
5366
6541
3973
7870
3043
13
844
Fina
ncia
l84
8688
8384
8283
8180
8375
7265
8168
6967
4832
3632
1813
00
00
30B
usin
ess
serv
ice
7886
7478
5954
7476
4443
4645
5763
3454
4328
1411
3841
01
41
721
Ow
ners
hip Priv
ate
inde
pend
ent
7882
8479
7268
6968
6466
6264
6671
5160
6143
3021
2325
126
1012
1829
Priv
ate
grou
p71
7875
7272
7269
6968
6661
6562
6946
5346
4241
3432
2922
1311
1717
31Fo
reig
n69
7471
6368
6363
6466
6053
5445
6231
3329
2628
2416
238
63
10
18G
over
nmen
t79
8583
7070
8077
8079
7372
7671
7636
5341
2533
1835
1820
229
1826
27
Sour
ces:
Pro
wes
s da
taba
se fr
om C
MIE
; and
aut
hors
' cal
cula
tion.
1/ E
ach
cate
gory
has
one
-third
s of
the
tota
l obs
erva
tion
Tabl
e 2.
Dis
trib
utio
ns o
f Firm
s in
the
Stud
y: E
xter
nal F
unds
in P
erce
nt o
f Tot
al F
unds
(R
atio
of f
low
var
iabl
es)
Med
ian,
Ext
erna
l Fun
ds In
clud
ing
Long
-term
Deb
t, Eq
uity
, and
Tra
de C
redi
tsM
edia
n, C
ore
Ext
erna
l Fun
ds In
clud
ing
Onl
y Lo
ng-te
rm D
ebt a
nd E
quity
20
93/9
494
/95
95/9
696
/97
97/9
898
/99
99/0
000
/01
01/0
202
/03
03/0
404
/05
05/0
6Ti
me
Ser
ies
93/9
494
/95
95/9
696
/97
97/9
898
/99
99/0
000
/01
01/0
202
/03
03/0
404
/05
05/0
6Ti
me
Ser
ies
Ave
rage
Ave
rage
Tota
l15
2026
2726
2424
2425
2624
2423
2436
3231
3032
3231
3029
2524
2323
29A
ge0–
536
3950
5353
4535
3226
2927
2918
3634
2823
2120
2226
2326
2426
2027
255–
1023
2934
3739
4044
4548
4636
2928
3739
3333
3435
3230
2523
1719
2120
2810
+10
1417
1718
1818
1920
2321
2223
1835
3332
3133
3332
3230
2725
2323
30
Siz
e 1/
Sm
all
2635
5258
5957
5657
6065
6263
6555
3325
1814
1316
1613
104
32
413
Med
ium
1321
2627
2725
2525
2628
2525
2524
3734
3334
3535
3434
3230
2827
2632
Larg
e9
1314
1414
1313
1312
1211
1111
1236
3535
3638
3736
3635
3332
3131
35
Indu
stry
Fina
ncia
l11
1734
3843
4237
3539
4942
4139
3637
2917
1110
128
84
22
11
11N
onfin
anci
al15
2125
2625
2323
2323
2321
2121
2236
3232
3234
3433
3332
3029
2828
32
Min
ing
2029
3536
3527
2726
2829
2827
2529
3231
2631
3433
3231
3029
2423
2629
Man
ufac
turin
g15
2124
2524
2222
2221
2119
1819
2137
3434
3537
3837
3837
3534
3332
35Fo
od10
1721
2019
1817
1614
1513
1414
1633
3335
3634
3335
3637
3739
3734
35Te
xtile
s15
2226
2826
2525
2222
2221
2120
2341
4142
4446
4847
4746
4345
4544
45W
ood
713
1824
2421
2119
1921
1517
2819
5250
4438
3934
3844
4439
3329
3440
Pape
r13
1824
3028
2625
2424
2222
1922
2336
3234
3238
4241
3839
3840
3837
37P
etro
leum
517
2422
2321
2222
2119
1821
2020
2725
3329
3125
2730
3226
2317
2427
Che
mic
al18
2328
2826
2423
2424
2421
2021
2337
3434
3437
3837
3735
3330
3031
34R
ubbe
r16
2131
3030
2928
2828
2927
2727
2739
3636
3638
3939
3838
3736
3535
37M
iner
al14
2021
2321
2125
2323
2321
2021
2145
4039
4145
4746
4645
4240
3838
42Ba
sic
met
al18
2124
2423
2221
2121
2219
1718
2140
3738
3840
4142
4442
4041
4037
40Fa
bric
ated
met
al13
2125
2424
2220
1616
1617
1518
1931
2530
3536
3937
3839
3633
3234
34M
achi
nery
1113
1616
1715
1718
1819
1715
1516
2426
2626
2927
2725
2322
2020
1824
Elec
troni
cs15
2025
2524
2324
2626
2525
2422
2336
3131
3233
3433
3331
2927
2524
31M
otor
veh
icle
1417
1616
1616
1717
1715
1512
1316
3935
3536
3737
3537
3330
2829
2734
Tran
spor
t equ
ipm
ent
1822
2017
1617
1218
1921
1217
1017
3325
2729
3134
2828
3328
2222
2028
Furn
iture
2535
4036
3127
1817
1717
1314
1724
2023
1112
1520
2123
2223
2326
2220
Ser
vice
1219
3033
3531
3133
3338
3334
3430
2623
1816
1515
1411
106
75
613
Elec
trici
ty g
as w
ater
1620
2627
2522
2222
2223
2525
2523
4242
3429
3637
3530
4446
4443
3638
Con
stru
ctio
n8
814
1815
1313
1314
1311
1117
1320
2319
1819
1918
2122
2120
1819
20Tr
ade
1019
3032
3024
2324
2526
2224
2524
2116
1616
1815
1617
1712
118
1115
Hot
el re
stau
rant
2522
3434
3431
3031
3328
2623
2629
3729
2422
2124
2627
3032
3431
3128
Tran
spor
t ser
vice
1220
2020
2021
2122
2325
2225
2021
3732
2721
3032
2629
2430
3329
3329
Tele
com
631
3129
3638
3943
3447
5658
5138
4413
3238
3948
3930
4233
2931
933
Fina
ncia
l11
1734
3843
4237
3539
4942
4139
3637
2917
1110
128
84
22
11
11B
usin
ess
serv
ice
2436
4249
4343
5156
5655
5151
4846
1718
1310
109
53
33
43
68
Ow
ners
hip Priv
ate
inde
pend
ent
1826
3639
3834
3232
3234
3030
3032
3530
2726
2728
2927
2521
2120
2226
Priv
ate
grou
p13
1818
1818
1818
1919
1917
1717
1838
3536
3638
3837
3737
3332
3029
35Fo
reig
n12
1315
1514
1517
1817
1920
1817
1627
2525
2322
2120
1916
1411
86
18G
over
nmen
t10
1112
1212
1213
1211
1012
1110
1135
4038
3432
3029
2933
2725
2120
30
Sou
rces
: Pro
wes
s da
taba
se fr
om C
MIE
; and
aut
hors
' cal
cula
tion.
1/ E
ach
cate
gory
has
one
-third
s of
the
tota
l obs
erva
tion
Tabl
e 3.
Dis
trib
utio
ns o
f Firm
s in
the
Stud
y: E
quity
-to-A
sset
and
Deb
t-to-
Asse
t Rat
ios
(Rat
ios
of s
tock
var
iabl
es)
Med
ian,
Equ
ity-to
-Ass
etM
edia
n, D
ebt-t
o-A
sset
21
93/9
494
/95
95/9
696
/97
97/9
898
/99
99/0
000
/01
01/0
202
/03
03/0
404
/05
05/0
6Ti
me
Serie
s93
/94
94/9
595
/96
96/9
797
/98
98/9
999
/00
00/0
101
/02
02/0
303
/04
04/0
505
/06
Tim
e Se
ries
Aver
age
Aver
age
Tota
l0.
40.
40.
30.
30.
50.
60.
50.
40.
40.
40.
61.
41.
60.
60.
70.
90.
90.
70.
70.
60.
60.
60.
40.
30.
50.
40.
50.
6Ag
e0–
50.
30.
10.
20.
10.
40.
40.
60.
70.
80.
70.
81.
31.
10.
61.
11.
11.
11.
01.
01.
01.
01.
00.
70.
70.
50.
90.
90.
95–
100.
40.
30.
20.
30.
40.
40.
40.
20.
40.
30.
51.
41.
80.
50.
71.
01.
00.
81.
00.
80.
80.
80.
60.
60.
50.
30.
70.
710
+0.
50.
40.
40.
40.
60.
60.
50.
40.
40.
40.
51.
41.
60.
60.
50.
70.
60.
50.
50.
40.
40.
50.
40.
20.
40.
40.
40.
5
Size
2/
Smal
l0.
20.
10.
00.
10.
10.
10.
30.
30.
20.
20.
20.
60.
60.
20.
91.
01.
01.
01.
00.
90.
91.
00.
90.
90.
80.
70.
80.
9M
ediu
m0.
10.
10.
20.
10.
30.
40.
30.
30.
40.
30.
61.
21.
20.
40.
70.
90.
80.
70.
70.
70.
70.
60.
50.
40.
50.
60.
50.
6La
rge
1.0
0.9
0.7
0.8
1.1
1.1
0.8
0.6
0.6
0.6
0.9
2.4
3.1
1.1
0.4
0.7
0.7
0.4
0.5
0.2
0.3
0.3
0.1
0.1
0.2
0.3
0.4
0.4
1.0
0.7
0.4
0.3
0.3
0.3
0.2
0.2
0.2
0.2
0.4
0.4
0.3
0.4
0.6
0.7
0.8
0.6
0.5
0.3
0.6
0.5
0.8
0.7
0.4
0.1
0.0
0.5
0.4
0.3
0.3
0.4
0.5
0.6
0.5
0.4
0.4
0.4
0.6
1.7
2.0
0.7
0.7
0.9
0.9
0.7
0.7
0.6
0.6
0.6
0.4
0.3
0.5
0.5
0.5
0.6
Min
ing
0.8
0.4
0.4
0.2
0.6
0.6
0.7
0.7
0.5
0.4
0.5
1.7
1.6
0.7
0.3
0.9
1.0
0.8
1.0
0.7
0.4
-0.1
0.6
0.4
0.4
0.5
0.5
0.6
Man
ufac
turin
g0.
30.
20.
20.
30.
50.
60.
40.
30.
40.
40.
62.
02.
20.
70.
71.
00.
90.
70.
70.
60.
50.
60.
30.
20.
40.
50.
50.
6Fo
od0.
00.
00.
00.
10.
20.
20.
20.
10.
10.
20.
51.
41.
30.
30.
71.
00.
90.
70.
60.
21.
00.
90.
70.
80.
90.
70.
50.
7Te
xtile
s0.
00.
00.
10.
30.
60.
70.
40.
40.
60.
50.
63.
33.
30.
81.
01.
11.
00.
70.
80.
80.
60.
60.
20.
30.
50.
60.
80.
7W
ood
0.0
0.0
0.0
0.0
0.0
0.0
0.0
0.0
0.0
0.7
1.5
1.9
0.8
0.4
0.7
0.9
1.0
0.9
0.4
0.6
0.3
0.8
1.0
0.5
1.1
-0.2
0.9
0.7
Pape
r0.
30.
10.
20.
30.
30.
40.
40.
40.
40.
50.
42.
63.
70.
80.
70.
80.
80.
80.
80.
81.
00.
50.
20.
40.
60.
50.
40.
6Pe
trole
um0.
40.
30.
31.
01.
41.
61.
60.
50.
60.
40.
12.
83.
91.
10.
20.
31.
00.
50.
60.
60.
90.
50.
50.
4-0
.5-0
.20.
80.
4C
hem
ical
0.3
0.4
0.2
0.2
0.6
0.7
0.3
0.3
0.3
0.3
0.5
2.0
2.7
0.7
0.7
1.0
0.9
0.6
0.6
0.5
0.4
0.6
0.2
0.1
0.2
0.3
0.5
0.5
Rub
ber
0.2
0.2
0.3
0.3
0.4
0.6
0.4
0.4
0.5
0.8
0.8
2.1
1.7
0.7
0.9
1.0
1.1
0.8
0.6
0.7
0.6
0.5
0.0
-0.1
0.5
0.4
0.5
0.6
Min
eral
0.4
0.5
0.6
0.6
0.4
0.3
0.3
0.4
0.3
0.5
0.5
0.7
1.1
0.5
0.6
0.5
0.5
0.8
0.9
0.7
0.7
0.7
0.4
0.1
0.0
0.1
0.3
0.5
Basi
c m
etal
0.6
0.6
0.7
0.6
0.8
0.9
1.0
0.6
0.3
0.4
0.6
2.1
2.1
0.9
0.9
1.0
0.9
0.6
1.0
0.8
0.6
0.7
0.7
0.5
0.7
0.9
0.8
0.8
Fabr
icat
ed m
etal
0.0
0.2
0.1
0.1
0.4
0.6
1.2
0.3
0.2
0.1
0.2
2.4
2.7
0.7
0.7
0.8
1.0
0.9
0.4
0.7
1.2
0.6
-0.1
0.3
0.9
0.6
0.7
0.7
Mac
hine
ry0.
20.
20.
10.
60.
50.
20.
40.
20.
50.
41.
21.
31.
40.
60.
00.
50.
90.
60.
20.
20.
00.
30.
3-0
.2-0
.20.
40.
10.
2El
ectro
nics
0.4
0.1
0.1
0.3
0.3
0.5
0.5
0.6
0.9
0.7
0.9
1.5
1.2
0.6
0.5
1.0
1.0
0.9
0.7
0.7
0.5
0.8
0.1
0.2
0.2
0.1
0.5
0.6
Mot
or v
ehic
le0.
20.
00.
10.
50.
81.
10.
50.
50.
80.
50.
91.
72.
70.
80.
30.
60.
60.
30.
20.
40.
30.
4-0
.6-0
.3-0
.20.
30.
30.
2Tr
ansp
ort e
quip
men
t0.
50.
00.
00.
10.
50.
40.
80.
80.
90.
80.
63.
66.
41.
2-0
.60.
60.
50.
70.
60.
1-1
.00.
00.
8-0
.4-0
.61.
00.
30.
2Fu
rnitu
re0.
00.
00.
00.
00.
00.
00.
10.
00.
00.
00.
01.
13.
60.
41.
32.
51.
30.
92.
00.
60.
91.
51.
21.
80.
21.
00.
81.
2
Serv
ice
1.0
0.8
0.5
0.4
0.5
0.5
0.5
0.4
0.4
0.3
0.5
0.7
0.8
0.6
0.6
0.8
0.8
0.6
0.6
0.5
0.6
0.6
0.7
0.6
0.6
0.3
0.4
0.6
Elec
trici
ty g
as w
ater
10.9
7.2
5.8
4.3
7.0
7.3
4.1
2.5
1.8
2.3
2.6
2.8
3.1
4.7
0.6
0.7
0.8
0.8
0.6
0.7
0.4
0.7
0.5
0.9
0.5
0.5
0.7
0.7
Con
stru
ctio
n0.
00.
00.
00.
00.
10.
20.
80.
70.
30.
30.
30.
50.
60.
30.
71.
20.
80.
80.
50.
90.
80.
70.
61.
01.
10.
50.
90.
8Tr
ade
0.1
0.0
0.1
0.1
0.1
0.1
0.2
0.1
0.1
0.2
0.3
0.5
0.4
0.2
0.9
0.9
0.9
0.8
1.0
0.7
0.9
0.9
1.0
0.4
0.8
0.7
0.7
0.8
Hot
el re
stau
rant
0.0
0.6
0.5
0.5
1.0
0.8
0.7
0.6
0.5
0.4
1.0
3.6
2.4
1.0
0.2
0.2
0.5
0.3
0.5
0.6
0.6
0.5
0.8
0.6
0.1
0.0
-0.1
0.4
Tran
spor
t ser
vice
4.4
4.6
2.7
2.3
3.1
2.6
2.2
2.5
2.6
1.8
2.4
2.5
4.3
2.9
0.6
0.8
0.3
0.7
0.6
0.8
0.2
0.2
0.6
0.6
0.6
0.3
0.6
0.5
Tele
com
0.1
0.0
0.0
0.0
0.3
0.7
1.7
1.5
1.1
0.9
0.9
1.4
1.2
0.8
1.7
0.9
1.0
0.5
1.0
2.0
0.7
0.9
0.6
0.8
0.6
-0.1
0.0
0.8
Fina
ncia
l1.
00.
70.
40.
30.
30.
30.
20.
20.
20.
20.
40.
40.
30.
40.
60.
70.
80.
60.
50.
30.
60.
50.
80.
70.
40.
10.
00.
5Bu
sine
ss s
ervi
ce0.
00.
10.
00.
30.
40.
40.
20.
10.
20.
10.
10.
40.
90.
20.
40.
90.
60.
60.
40.
20.
50.
50.
60.
30.
60.
20.
20.
5
Priv
ate
inde
pend
ent
0.1
0.1
0.1
0.1
0.2
0.2
0.2
0.2
0.2
0.2
0.3
1.0
1.2
0.3
0.9
1.0
1.0
0.8
0.8
0.7
0.7
0.7
0.6
0.5
0.6
0.6
0.7
0.7
Priv
ate
grou
p0.
40.
40.
40.
50.
70.
70.
50.
40.
40.
30.
51.
82.
10.
70.
60.
80.
70.
60.
60.
50.
50.
50.
40.
20.
30.
30.
40.
5Fo
reig
n0.
50.
70.
70.
91.
21.
11.
11.
01.
51.
72.
62.
83.
21.
50.
00.
30.
60.
20.
00.
30.
20.
3-0
.5-0
.90.
00.
2-0
.30.
0G
over
nmen
t2.
22.
01.
71.
31.
71.
91.
81.
21.
11.
31.
01.
51.
61.
6-0
.10.
40.
40.
30.
10.
20.
2-0
.1-0
.1-0
.7-0
.3-1
.7-1
.6-0
.2
Sour
ces:
Pro
wes
s da
taba
se fr
om C
MIE
; and
aut
hors
' cal
cula
tion.
2/ E
ach
cate
gory
has
one
-third
s of
the
tota
l obs
erva
tion
Tabl
e 4.
Dis
trib
utio
ns o
f Firm
s in
the
Stud
y: F
orei
gn B
orro
win
g to
Ass
et R
atio
and
Ext
erna
l Fun
ds R
elat
ive
to C
apita
l Exp
endi
ture
1/
Aver
age
Fore
ign
Borr
owin
g to
Ass
et R
atio
Med
ian
Exte
rnal
Fun
ds R
elat
ive
to C
apita
l Exp
endi
ture
1/
1/ (c
apita
l exp
endi
ture
-(in
tern
ally
gen
erat
ed c
ash)
)/cap
ital e
xpen
ditu
re. I
nter
nally
gen
erat
ed c
ash
incl
udes
cas
h flo
w fr
om o
pera
tion
and
chan
ge in
inve
ntor
ies,
rece
ivab
les,
and
pay
able
s. C
apita
l exp
endi
ture
- in
tern
ally
gen
erat
ed c
ash
amou
nts
to th
e ex
tern
al fu
nds
need
ed to
fill
the
gap
betw
een
inve
stm
ent a
nd in
tern
al s
avin
g.
Indu
stry
Fina
ncia
lN
onfin
anci
al
Ow
ners
hip
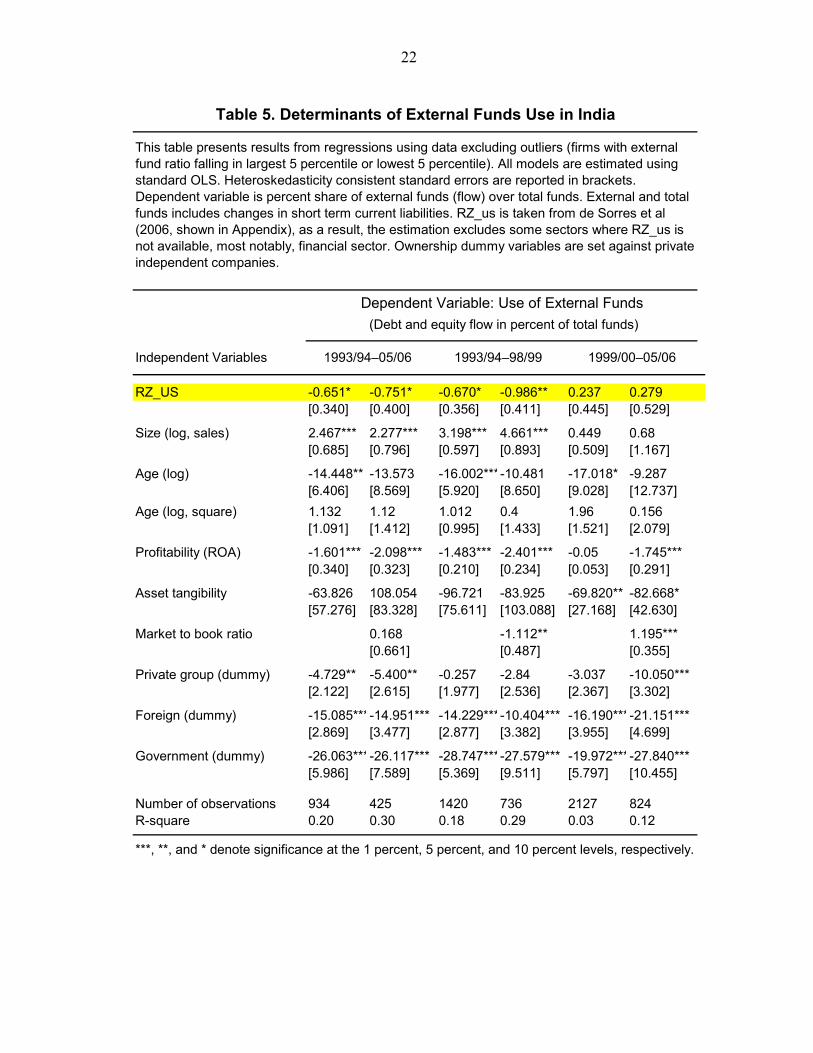
22
Independent Variables
RZ_US -0.651* -0.751* -0.670* -0.986** 0.237 0.279[0.340] [0.400] [0.356] [0.411] [0.445] [0.529]
Size (log, sales) 2.467*** 2.277*** 3.198*** 4.661*** 0.449 0.68[0.685] [0.796] [0.597] [0.893] [0.509] [1.167]
Age (log) -14.448** -13.573 -16.002***-10.481 -17.018* -9.287[6.406] [8.569] [5.920] [8.650] [9.028] [12.737]
Age (log, square) 1.132 1.12 1.012 0.4 1.96 0.156[1.091] [1.412] [0.995] [1.433] [1.521] [2.079]
Profitability (ROA) -1.601*** -2.098*** -1.483*** -2.401*** -0.05 -1.745***[0.340] [0.323] [0.210] [0.234] [0.053] [0.291]
Asset tangibility -63.826 108.054 -96.721 -83.925 -69.820** -82.668*[57.276] [83.328] [75.611] [103.088] [27.168] [42.630]
Market to book ratio 0.168 -1.112** 1.195***[0.661] [0.487] [0.355]
Private group (dummy) -4.729** -5.400** -0.257 -2.84 -3.037 -10.050***[2.122] [2.615] [1.977] [2.536] [2.367] [3.302]
Foreign (dummy) -15.085***-14.951*** -14.229***-10.404*** -16.190***-21.151***[2.869] [3.477] [2.877] [3.382] [3.955] [4.699]
Government (dummy) -26.063***-26.117*** -28.747***-27.579*** -19.972***-27.840***[5.986] [7.589] [5.369] [9.511] [5.797] [10.455]
Number of observations 934 425 1420 736 2127 824R-square 0.20 0.30 0.18 0.29 0.03 0.12
***, **, and * denote significance at the 1 percent, 5 percent, and 10 percent levels, respectively.
(Debt and equity flow in percent of total funds)
1993/94–05/06 1993/94–98/99 1999/00–05/06
Table 5. Determinants of External Funds Use in India
This table presents results from regressions using data excluding outliers (firms with external fund ratio falling in largest 5 percentile or lowest 5 percentile). All models are estimated using standard OLS. Heteroskedasticity consistent standard errors are reported in brackets. Dependent variable is percent share of external funds (flow) over total funds. External and total funds includes changes in short term current liabilities. RZ_us is taken from de Sorres et al (2006, shown in Appendix), as a result, the estimation excludes some sectors where RZ_us is not available, most notably, financial sector. Ownership dummy variables are set against private independent companies.
Dependent Variable: Use of External Funds
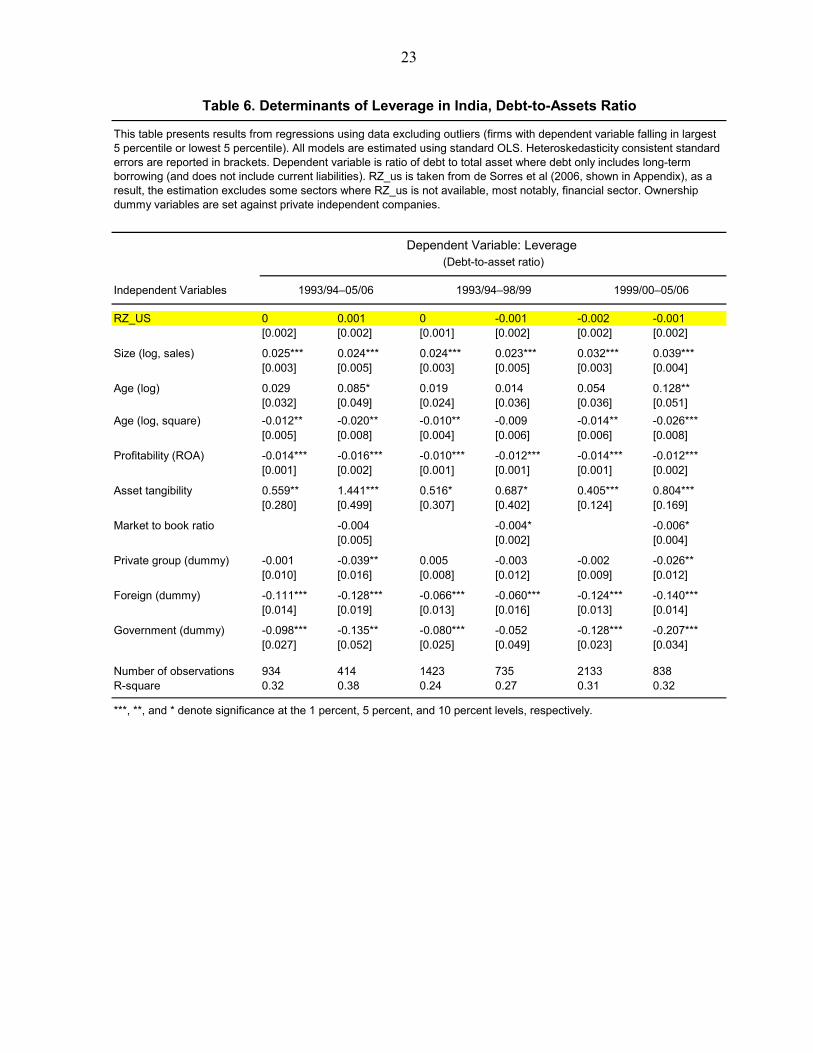
23
Independent Variables
RZ_US 0 0.001 0 -0.001 -0.002 -0.001[0.002] [0.002] [0.001] [0.002] [0.002] [0.002]
Size (log, sales) 0.025*** 0.024*** 0.024*** 0.023*** 0.032*** 0.039***[0.003] [0.005] [0.003] [0.005] [0.003] [0.004]
Age (log) 0.029 0.085* 0.019 0.014 0.054 0.128**[0.032] [0.049] [0.024] [0.036] [0.036] [0.051]
Age (log, square) -0.012** -0.020** -0.010** -0.009 -0.014** -0.026***[0.005] [0.008] [0.004] [0.006] [0.006] [0.008]
Profitability (ROA) -0.014*** -0.016*** -0.010*** -0.012*** -0.014*** -0.012***[0.001] [0.002] [0.001] [0.001] [0.001] [0.002]
Asset tangibility 0.559** 1.441*** 0.516* 0.687* 0.405*** 0.804***[0.280] [0.499] [0.307] [0.402] [0.124] [0.169]
Market to book ratio -0.004 -0.004* -0.006*[0.005] [0.002] [0.004]
Private group (dummy) -0.001 -0.039** 0.005 -0.003 -0.002 -0.026**[0.010] [0.016] [0.008] [0.012] [0.009] [0.012]
Foreign (dummy) -0.111*** -0.128*** -0.066*** -0.060*** -0.124*** -0.140***[0.014] [0.019] [0.013] [0.016] [0.013] [0.014]
Government (dummy) -0.098*** -0.135** -0.080*** -0.052 -0.128*** -0.207***[0.027] [0.052] [0.025] [0.049] [0.023] [0.034]
Number of observations 934 414 1423 735 2133 838R-square 0.32 0.38 0.24 0.27 0.31 0.32
Table 6. Determinants of Leverage in India, Debt-to-Assets Ratio
This table presents results from regressions using data excluding outliers (firms with dependent variable falling in largest 5 percentile or lowest 5 percentile). All models are estimated using standard OLS. Heteroskedasticity consistent standard errors are reported in brackets. Dependent variable is ratio of debt to total asset where debt only includes long-term borrowing (and does not include current liabilities). RZ_us is taken from de Sorres et al (2006, shown in Appendix), as a result, the estimation excludes some sectors where RZ_us is not available, most notably, financial sector. Ownership dummy variables are set against private independent companies.
Dependent Variable: Leverage
***, **, and * denote significance at the 1 percent, 5 percent, and 10 percent levels, respectively.
(Debt-to-asset ratio)
1993/94–05/06 1993/94–98/99 1999/00–05/06
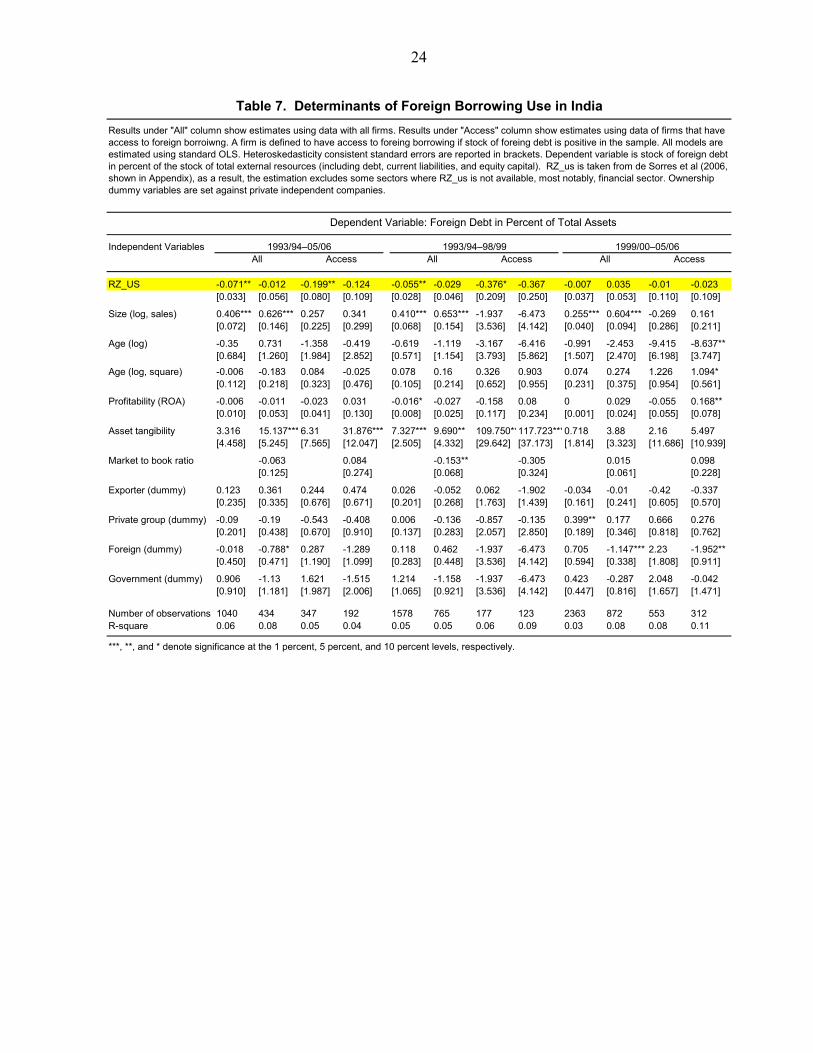
24
Independent Variables
RZ_US -0.071** -0.012 -0.199** -0.124 -0.055** -0.029 -0.376* -0.367 -0.007 0.035 -0.01 -0.023[0.033] [0.056] [0.080] [0.109] [0.028] [0.046] [0.209] [0.250] [0.037] [0.053] [0.110] [0.109]
Size (log, sales) 0.406*** 0.626*** 0.257 0.341 0.410*** 0.653*** -1.937 -6.473 0.255*** 0.604*** -0.269 0.161[0.072] [0.146] [0.225] [0.299] [0.068] [0.154] [3.536] [4.142] [0.040] [0.094] [0.286] [0.211]
Age (log) -0.35 0.731 -1.358 -0.419 -0.619 -1.119 -3.167 -6.416 -0.991 -2.453 -9.415 -8.637**[0.684] [1.260] [1.984] [2.852] [0.571] [1.154] [3.793] [5.862] [1.507] [2.470] [6.198] [3.747]
Age (log, square) -0.006 -0.183 0.084 -0.025 0.078 0.16 0.326 0.903 0.074 0.274 1.226 1.094*[0.112] [0.218] [0.323] [0.476] [0.105] [0.214] [0.652] [0.955] [0.231] [0.375] [0.954] [0.561]
Profitability (ROA) -0.006 -0.011 -0.023 0.031 -0.016* -0.027 -0.158 0.08 0 0.029 -0.055 0.168**[0.010] [0.053] [0.041] [0.130] [0.008] [0.025] [0.117] [0.234] [0.001] [0.024] [0.055] [0.078]
Asset tangibility 3.316 15.137*** 6.31 31.876*** 7.327*** 9.690** 109.750**117.723***0.718 3.88 2.16 5.497[4.458] [5.245] [7.565] [12.047] [2.505] [4.332] [29.642] [37.173] [1.814] [3.323] [11.686] [10.939]
Market to book ratio -0.063 0.084 -0.153** -0.305 0.015 0.098[0.125] [0.274] [0.068] [0.324] [0.061] [0.228]
Exporter (dummy) 0.123 0.361 0.244 0.474 0.026 -0.052 0.062 -1.902 -0.034 -0.01 -0.42 -0.337[0.235] [0.335] [0.676] [0.671] [0.201] [0.268] [1.763] [1.439] [0.161] [0.241] [0.605] [0.570]
Private group (dummy) -0.09 -0.19 -0.543 -0.408 0.006 -0.136 -0.857 -0.135 0.399** 0.177 0.666 0.276[0.201] [0.438] [0.670] [0.910] [0.137] [0.283] [2.057] [2.850] [0.189] [0.346] [0.818] [0.762]
Foreign (dummy) -0.018 -0.788* 0.287 -1.289 0.118 0.462 -1.937 -6.473 0.705 -1.147*** 2.23 -1.952**[0.450] [0.471] [1.190] [1.099] [0.283] [0.448] [3.536] [4.142] [0.594] [0.338] [1.808] [0.911]
Government (dummy) 0.906 -1.13 1.621 -1.515 1.214 -1.158 -1.937 -6.473 0.423 -0.287 2.048 -0.042[0.910] [1.181] [1.987] [2.006] [1.065] [0.921] [3.536] [4.142] [0.447] [0.816] [1.657] [1.471]
Number of observations 1040 434 347 192 1578 765 177 123 2363 872 553 312R-square 0.06 0.08 0.05 0.04 0.05 0.05 0.06 0.09 0.03 0.08 0.08 0.11
Table 7. Determinants of Foreign Borrowing Use in IndiaResults under "All" column show estimates using data with all firms. Results under "Access" column show estimates using data of firms that have access to foreign borroiwng. A firm is defined to have access to foreing borrowing if stock of foreing debt is positive in the sample. All models are estimated using standard OLS. Heteroskedasticity consistent standard errors are reported in brackets. Dependent variable is stock of foreign debt in percent of the stock of total external resources (including debt, current liabilities, and equity capital). RZ_us is taken from de Sorres et al (2006, shown in Appendix), as a result, the estimation excludes some sectors where RZ_us is not available, most notably, financial sector. Ownership dummy variables are set against private independent companies.
Dependent Variable: Foreign Debt in Percent of Total Assets
1993/94–05/06 1993/94–98/99 1999/00–05/06
***, **, and * denote significance at the 1 percent, 5 percent, and 10 percent levels, respectively.
All Access All Access All Access
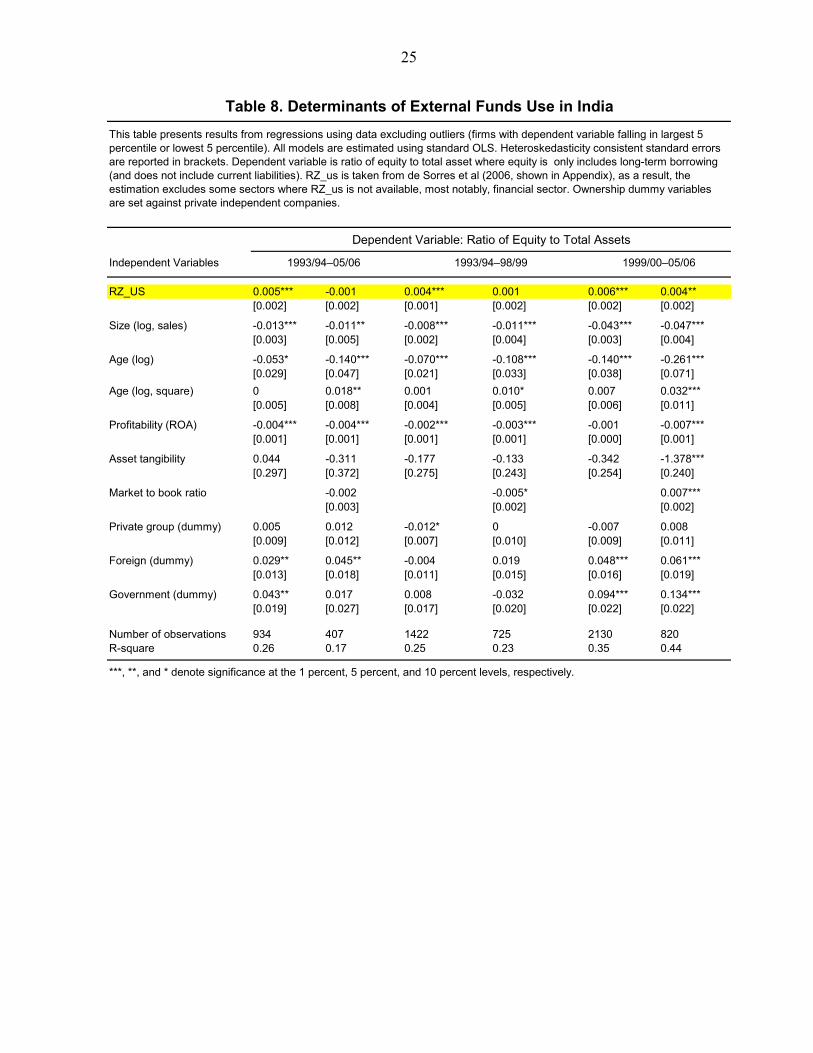
25
Independent Variables
RZ_US 0.005*** -0.001 0.004*** 0.001 0.006*** 0.004**[0.002] [0.002] [0.001] [0.002] [0.002] [0.002]
Size (log, sales) -0.013*** -0.011** -0.008*** -0.011*** -0.043*** -0.047***[0.003] [0.005] [0.002] [0.004] [0.003] [0.004]
Age (log) -0.053* -0.140*** -0.070*** -0.108*** -0.140*** -0.261***[0.029] [0.047] [0.021] [0.033] [0.038] [0.071]
Age (log, square) 0 0.018** 0.001 0.010* 0.007 0.032***[0.005] [0.008] [0.004] [0.005] [0.006] [0.011]
Profitability (ROA) -0.004*** -0.004*** -0.002*** -0.003*** -0.001 -0.007***[0.001] [0.001] [0.001] [0.001] [0.000] [0.001]
Asset tangibility 0.044 -0.311 -0.177 -0.133 -0.342 -1.378***[0.297] [0.372] [0.275] [0.243] [0.254] [0.240]
Market to book ratio -0.002 -0.005* 0.007***[0.003] [0.002] [0.002]
Private group (dummy) 0.005 0.012 -0.012* 0 -0.007 0.008[0.009] [0.012] [0.007] [0.010] [0.009] [0.011]
Foreign (dummy) 0.029** 0.045** -0.004 0.019 0.048*** 0.061***[0.013] [0.018] [0.011] [0.015] [0.016] [0.019]
Government (dummy) 0.043** 0.017 0.008 -0.032 0.094*** 0.134***[0.019] [0.027] [0.017] [0.020] [0.022] [0.022]
Number of observations 934 407 1422 725 2130 820R-square 0.26 0.17 0.25 0.23 0.35 0.44
Table 8. Determinants of External Funds Use in IndiaThis table presents results from regressions using data excluding outliers (firms with dependent variable falling in largest 5 percentile or lowest 5 percentile). All models are estimated using standard OLS. Heteroskedasticity consistent standard errors are reported in brackets. Dependent variable is ratio of equity to total asset where equity is only includes long-term borrowing (and does not include current liabilities). RZ_us is taken from de Sorres et al (2006, shown in Appendix), as a result, the estimation excludes some sectors where RZ_us is not available, most notably, financial sector. Ownership dummy variables are set against private independent companies.
Dependent Variable: Ratio of Equity to Total Assets
***, **, and * denote significance at the 1 percent, 5 percent, and 10 percent levels, respectively.
1993/94–05/06 1999/00–05/061993/94–98/99
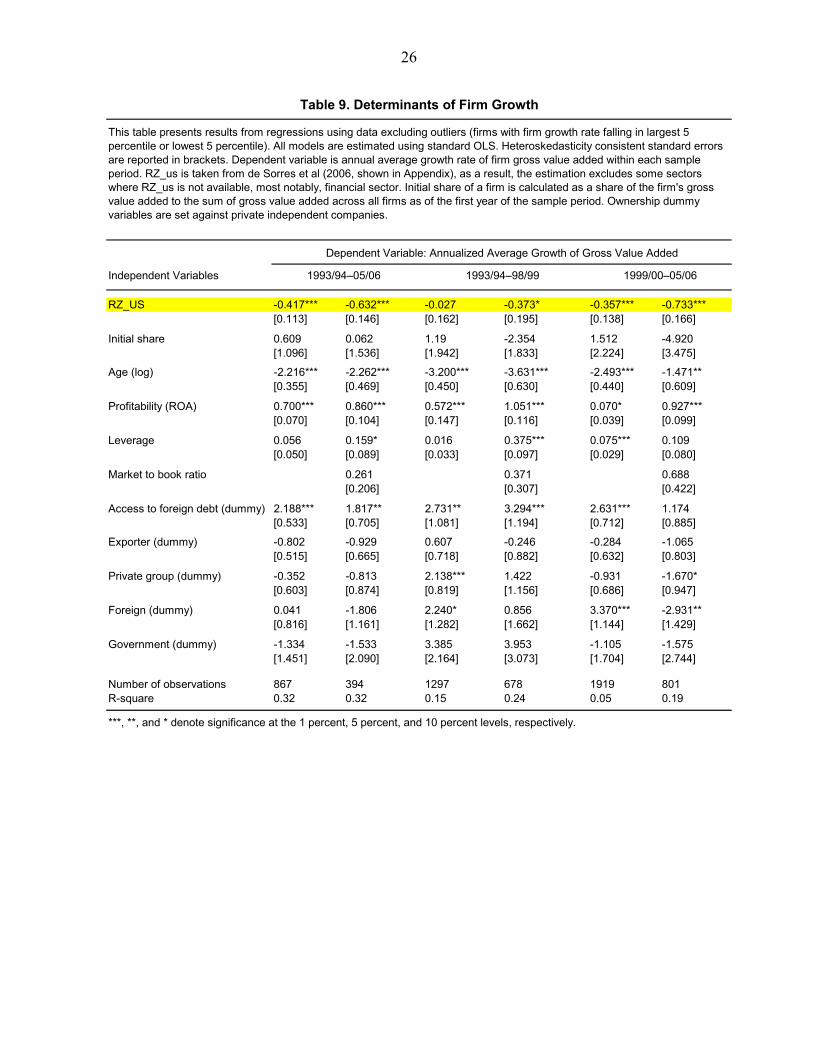
26
Independent Variables
RZ_US -0.417*** -0.632*** -0.027 -0.373* -0.357*** -0.733***[0.113] [0.146] [0.162] [0.195] [0.138] [0.166]
Initial share 0.609 0.062 1.19 -2.354 1.512 -4.920[1.096] [1.536] [1.942] [1.833] [2.224] [3.475]
Age (log) -2.216*** -2.262*** -3.200*** -3.631*** -2.493*** -1.471**[0.355] [0.469] [0.450] [0.630] [0.440] [0.609]
Profitability (ROA) 0.700*** 0.860*** 0.572*** 1.051*** 0.070* 0.927***[0.070] [0.104] [0.147] [0.116] [0.039] [0.099]
Leverage 0.056 0.159* 0.016 0.375*** 0.075*** 0.109[0.050] [0.089] [0.033] [0.097] [0.029] [0.080]
Market to book ratio 0.261 0.371 0.688[0.206] [0.307] [0.422]
Access to foreign debt (dummy) 2.188*** 1.817** 2.731** 3.294*** 2.631*** 1.174[0.533] [0.705] [1.081] [1.194] [0.712] [0.885]
Exporter (dummy) -0.802 -0.929 0.607 -0.246 -0.284 -1.065[0.515] [0.665] [0.718] [0.882] [0.632] [0.803]
Private group (dummy) -0.352 -0.813 2.138*** 1.422 -0.931 -1.670*[0.603] [0.874] [0.819] [1.156] [0.686] [0.947]
Foreign (dummy) 0.041 -1.806 2.240* 0.856 3.370*** -2.931**[0.816] [1.161] [1.282] [1.662] [1.144] [1.429]
Government (dummy) -1.334 -1.533 3.385 3.953 -1.105 -1.575[1.451] [2.090] [2.164] [3.073] [1.704] [2.744]
Number of observations 867 394 1297 678 1919 801R-square 0.32 0.32 0.15 0.24 0.05 0.19
***, **, and * denote significance at the 1 percent, 5 percent, and 10 percent levels, respectively.
Table 9. Determinants of Firm Growth
This table presents results from regressions using data excluding outliers (firms with firm growth rate falling in largest 5 percentile or lowest 5 percentile). All models are estimated using standard OLS. Heteroskedasticity consistent standard errors are reported in brackets. Dependent variable is annual average growth rate of firm gross value added within each sample period. RZ_us is taken from de Sorres et al (2006, shown in Appendix), as a result, the estimation excludes some sectors where RZ_us is not available, most notably, financial sector. Initial share of a firm is calculated as a share of the firm's gross value added to the sum of gross value added across all firms as of the first year of the sample period. Ownership dummy variables are set against private independent companies.
Dependent Variable: Annualized Average Growth of Gross Value Added
1993/94–05/06 1999/00–05/061993/94–98/99
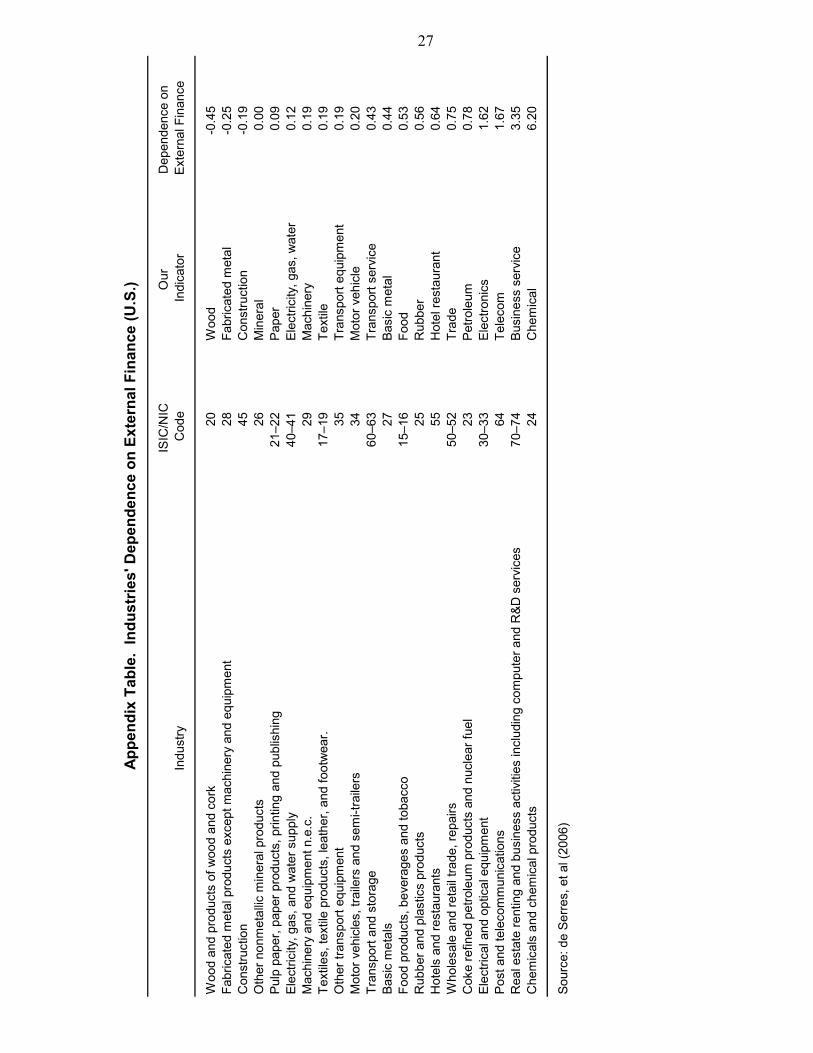
27
ISIC
/NIC
O
ur
Dep
ende
nce
onIn
dust
ryC
ode
Indi
cato
r E
xter
nal F
inan
ce
Woo
d an
d pr
oduc
ts o
f woo
d an
d co
rk20
Woo
d-0
.45
Fabr
icat
ed m
etal
pro
duct
s ex
cept
mac
hine
ry a
nd e
quip
men
t28
Fabr
icat
ed m
etal
-0.2
5C
onst
ruct
ion
45C
onst
ruct
ion
-0.1
9O
ther
non
met
allic
min
eral
pro
duct
s26
Min
eral
0.00
Pulp
pap
er, p
aper
pro
duct
s, p
rintin
g an
d pu
blis
hing
21–2
2Pa
per
0.09
Elec
trici
ty, g
as, a
nd w
ater
sup
ply
40–4
1El
ectri
city
, gas
, wat
er0.
12M
achi
nery
and
equ
ipm
ent n
.e.c
.29
Mac
hine
ry0.
19Te
xtile
s, te
xtile
pro
duct
s, le
athe
r, an
d fo
otw
ear.
17–1
9Te
xtile
0.19
Oth
er tr
ansp
ort e
quip
men
t35
Tran
spor
t equ
ipm
ent
0.19
Mot
or v
ehic
les,
trai
lers
and
sem
i-tra
ilers
34M
otor
veh
icle
0.20
Tran
spor
t and
sto
rage
60–6
3Tr
ansp
ort s
ervi
ce0.
43Ba
sic
met
als
27Ba
sic
met
al0.
44Fo
od p
rodu
cts,
bev
erag
es a
nd to
bacc
o15
–16
Food
0.53
Rub
ber a
nd p
last
ics
prod
ucts
25R
ubbe
r0.
56H
otel
s an
d re
stau
rant
s55
Hot
el re
stau
rant
0.64
Who
lesa
le a
nd re
tail
trade
, rep
airs
50–5
2Tr
ade
0.75
Cok
e re
fined
pet
role
um p
rodu
cts
and
nucl
ear f
uel
23Pe
trole
um0.
78El
ectri
cal a
nd o
ptic
al e
quip
men
t30
–33
Elec
troni
cs1.
62Po
st a
nd te
leco
mm
unic
atio
ns64
Tele
com
1.67
Rea
l est
ate
rent
ing
and
busi
ness
act
iviti
es in
clud
ing
com
pute
r and
R&D
ser
vice
s70
–74
Busi
ness
ser
vice
3.35
Che
mic
als
and
chem
ical
pro
duct
s24
Che
mic
al6.
20
Sour
ce: d
e Se
rres
, et a
l (20
06)
Appe
ndix
Tab
le.
Indu
strie
s' D
epen
denc
e on
Ext
erna
l Fin
ance
(U.S
.)
28
REFERENCES
Allen, F. and D. Gale, 1997, “Financial Markets, Intermediaries, and Intertemporal Smoothing,” Journal of Political Economy, Vol. 105 (3), pp. 523–546.
–––––––––––––––, 1998, “Optimal Financial Crises,” Journal of Finance, Vol. 53(4), pp. 1245–1284.
–––––––––––––––, 1999, “Diversity of Opinion and Financing of New Technologies,” Journal of Financial Intermediation, Vol. 8(1–2), pp. 68–89.
–––––––––––––––, 2000, Comparing Financial Systems, (Massachusetts: MIT Press).
Allen, F., R. Chakrabarti, S. De, J. “QJ” Qian, and M. Qian, 2006, “Financing Firms in India,” World Bank Policy Research Working Paper 3975.
Allen, F., R. Chakrabarti, and S. De, 2007, “India’s Financial System,” Wharton Financial Institutions Center Working Paper No. 07–36.
Aziz, J., 2008, “Deconstructing China’s and India’s Growth: The Role of Financial Policies,” IMF Working Paper (forthcoming) (Washington: International Monetary Fund).
Beck, T. and R. Levine, 2002, “Industry Growth and Capital Allocation: Does Having a Market-or Bank-Based System Matter?” Journal of Financial Economics, Vol. 64(2), pp. 147–180.
Booth, L., V. Aivazian, A. Demirguc-Kunt, and V. Maksimovic, 2001, “Capital Structures in Developing Countries,” The Journal of Finance, Vol. 56(1), pp. 87–130.
Bosworth, B. and S. Collins, 2006, “Accounting for Growth: Comparing China and India,” NBER Working Paper No. 12943 (Cambridge, Massachusetts: National Bureau of Economic Research).
Boyd, H. and B. Smith, 1996, “The Co-evolution of the Real and Financial Sectors in the
Growth Process’ World Bank Economic Review, Vol. 10(2), pp. 371–396.
Davis, P., 2001, “Multiple Avenues of Intermediation, Corporate Finance and Financial Stability,” IMF Working Paper 01/115 (Washington: International Monetary Fund).
De Serres, A., S. Kobayakawa, T. Slok, and L. Vartia, 2006, “Regulation of Financial Systems and Economic Growth,” OECD Economics Department Working Papers, No. 506.
Demirgüç-Kunt, A. and R. Levine, 2001, Financial Structure and Economic Growth, (Massachusetts: MIT Press).
29
–––––––––––– and V. Maksimovic, 1996, “Stock Market Development and Firm Financing Choices,” World Bank Economic Review, Vol. 10(2), pp. 341–369.
––––––––––––, 2002, “Funding Growth in Bank-Based and Market-Based Financial Systems: Evidence from Firm Level Data,” Journal of Financial Economics, Vol. 65(3), pp. 337–363.
Diamond, D., 1984, “Financial Intermediation and Delegated Monitoring,” Review of Economic Studies, Vol. 51(3), pp. 393–414.
––––––––––––, 1991, “Monitoring and Reputation: The Choice between Bank Loans and Directly Placed Debt,” Journal of Political Economy, Vol. 99(4), pp. 689–721.
Evans, D., 1987, “Tests of Alternative Theories of Firm Growth,” Journal of Political Economy, Vol. 95(4), pp. 657–74.
Gale, D. and M. Hellwig, 1985, “Incentive-Compatible Debt Contracts: The One-Period Problem,” Review of Economic Studies, Vol. 52(4), pp. 647–663.
Hall, B., 1987, “The Relationship between Firm Size and Firm Growth in the U.S. Manufacturing Sector,” Journal of Industrial Economics, 35(4), pp. 583–606.
Harris, M. and A. Raviv, 1991, “The Theory of Capital Structure,” Journal of Finance, Vol. 46 (1), pp. 297–355.
Hsieh, C. and P. Klenow, 2007, “Misallocation and Manufacturing TFP in China and India,” NBER Working Paper No. 13290 (Cambridge, Massachusetts: National Bureau of Economic Research).
International Monetary Fund, 2004, Global Financial Stability Report, September, “Emerging Markets as Net Capital Importers” (Washington).
–––––––––––––––, 2005, Global Financial Stability Report, April, “Corporate Finance in Emerging Markets” (Washington).
–––––––––––––––, 2006a, World Economic Outlook, April 2006: “Awash with Cash: Why are Corporate Savings So High?” (Washington).
–––––––––––––––, 2006b, World Economic Outlook, September 2006: “Asia Rising: Patterns of Economic Development and Growth,” (Washington).
–––––––––––––––, 2008, India: 2007 Article IV Consultation—Staff Report, February, IMF Staff Country Report No. 08/51 (Washington).
30
King, R. and R. Levine, 1993, “Finance and Growth: Schumpeter Might Be Right.” Quarterly Journal of Economics, Vol. 108(3), pp. 717–738.
Levine, R. and S. Zervos, 1998, “Stock Markets, Banks and Economic Growth,” American Economic Review, Vol. 88(3), pp. 537–558.
Levine, R. 2005, “Finance and Growth: Theory and Evidence,” in Handbook of Economic Growth, Vol. 1B, ed. by Phillipe Aghion and Steve Durlauf (Amsterdam: North-Holland).
–––––––––––, N. Loayza, and T. Beck, 2000, “Financial Intermediation and Growth: Causality and Causes,” Journal of Monetary Economics, Vol. 46(1), pp. 31–77.
Love, I. and M. Soledad Martinez Peria, 2005, “Firm Financing in India: Recent Trends and Patterns,” the World Bank Working Paper 3476. Available via Internet: http://econ.worldbank.org/files/41038_wps3476.pdf
Lucas, R., 1988, “On the Mechanics of Economic Development,” Journal of Monetary Economics, Vol. 22(1), pp. 3-42.
Mohan, R., 2007 “Economic Reforms and Corporate Performance in India,” Presentation at FICCI-IBA Conference on “Global Banking: Paradigm Shift.”
Oura, H., 2007, “Wild or Tamed? India’s Potential Growth,” IMF Working Paper 07/224 (Washington: International Monetary Fund).
Rajan, R. and L. Zingales, 1995, “What Do We Know About Capital Structure? Some Evidence from International Data,” Journal of Finance, Vol. 50(5), pp. 1421–1460.
––––––––––––, 1998, “Financial Dependence and Growth” American Economic Review, Vol. 88(3), pp. 559–586.
Rodrik, D. and A. Subramanian, 2004a, “Why India Can Grow at 7 Percent a Year or More: Projections and Reflections,” IMF Working Paper WP/04/118 (Washington: International Monetary Fund).
Tadesse, S., 2002, “Financial Architecture and Economic Performance: International Evidence,” Journal of Financial Intermediation, Vol. 11(4), pp. 429–454.
Topalova, P., 2004, “Overview of the Indian Corporate Sector: 1989–2002,” IMF Working Paper 04/64 (Washington: International Monetary Fund).
Townsend, R., 1979, “Optimal Contracts and Competitive Markets with Costly State Verification,” Journal of Economic Theory, Vol. 21, pp. 417–425.
World Bank, 2006, Developing India’s Corporate Bond Market. (Washington).