financial analysts meeting december 7, 2005
TRANSCRIPT

Lighting Strategy: Accelerating profitable growth
- Building on strength in existing businesses - Shaping the future in new business areas
Theo van Deursen, President & CEO Philips Lighting
Financial Analysts MeetingDecember 7, 2005

2
Forward Looking StatementsForward Looking StatementsThis document contains certain forward-looking statements with respect to the financial condition, results of operations and business of Philips and certain of the plans and objectives of Philips with respect to these items (including, but not limited to, cost savings) in particular the outlook paragraph in this report. By their nature, forward-looking statements involve risk and uncertainty because they relate to events and depend on circumstances that will occur in the future. There are a number of factors that could cause actual results and developments to differ materially from those expressed or implied by these forward-looking statements. These factors include, but are not limited to, levels of consumer and business spending in major economies, changes in consumer tastes and preferences, changes in law, the performance of the financial markets, pension costs, the levels of marketing and promotional expenditures by Philips and its competitors, raw materials and employee costs, changes in exchange and interest rates (in particular, changes in the euro and the US dollar can materially affect results), changes in tax rates and future business combinations, acquisitions or dispositions and the rate of technological changes. Statements regarding market share, including as to Philips’ competitive position, contained in this document are based on outside sources such as specialized research institutes, industry and dealer panels in combination with management estimates. Where information is not yet available to Philips, those statements may also be based on estimates and projections prepared by outside sources or management. Rankings are based on sales unless otherwise stated.
Use of non-GAAP InformationIn presenting and discussing the Philips Group’s financial position, operating results and cash flows, management uses certain non-GAAP financial measures. These non-GAAP financial measures should not be viewed in isolation as alternatives to the equivalent GAAP measure and should be used in conjunction with the most directly comparable US GAAP measure(s). A discussion of the non-GAAP measures included in this document and a reconciliation of such measures to the most directly comparable US GAAP measure(s) are contained in this document.

3
Agenda
• Philips Lighting
• Shaping the future
– LCD backlighting– Solid State Lighting
• Profitable growth via key business drivers
• Continuous improvement, control of costs and assets

4
Philips Lighting
Our Mission
We understand people…and improve their lives with lighting
Our Vision
The Clear Leader; Setting the pace in the lighting industry

5
Philips Lighting
2004
Sales EUR 4.6 billionComparable Sales growth +5%
EBIT EUR 591 millionor 13.1% of sales
Net Operating Capital EUR 1.5 billion
Return on NOC 37%
Employees 44,000
Capital expenditure EUR 189 millionDepreciation EUR 201 million
2005 Q3 YTD+ 5%
Excl. Lumileds

6
Philips Lighting: Key Product Areas
Lamps Lighting Electronics
LuminairesAutomotive, Special Lighting & UHP
Solid State LightingModules
7
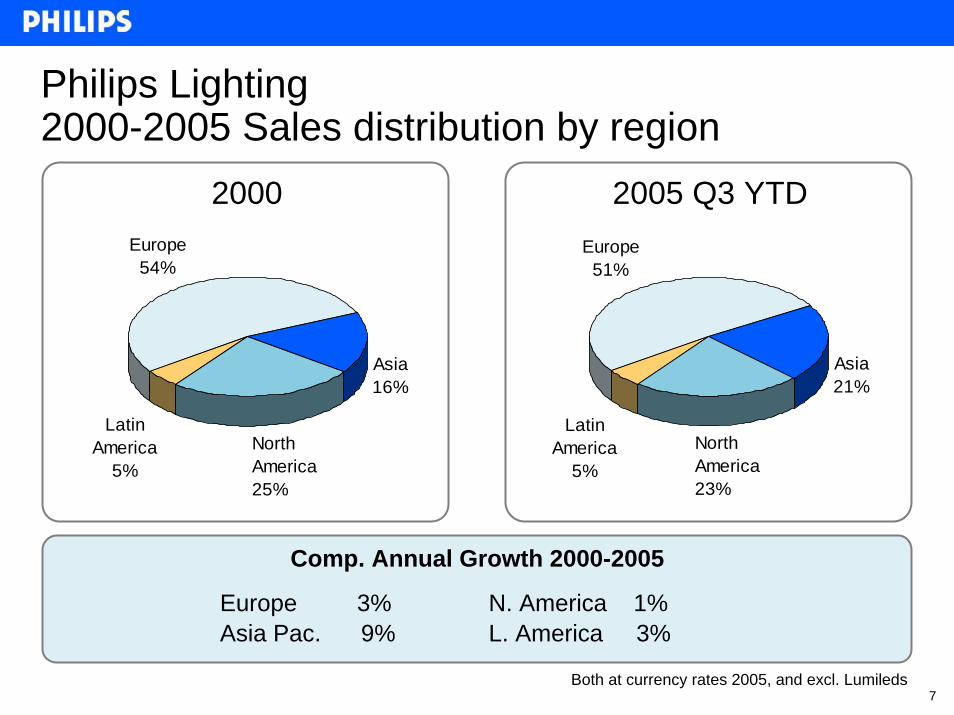
Asia21%
Latin America
5%North America23%
Europe51%
Asia16%
Latin America
5%North America25%
Europe54%
Philips Lighting 2000-2005 Sales distribution by region
2000 2005 Q3 YTD
Comp. Annual Growth 2000-2005
Europe 3%Asia Pac. 9%
N. America 1%L. America 3%
Both at currency rates 2005, and excl. Lumileds

8
Philips Lighting – Sales per Business Group
49%
15%
18%
18%
Lamps
AutomotiveSpecial Lighting
& UHP
Luminaires2005 Q3 YTD
Lamps 3%Luminaires 0%
ASU 9%Lighting Electronics 2%
Comp. Annual Growth 2000-2005
Lighting Electronics
Excl. Lumileds

9
Philips Lighting: leading around the worldValue market shares per business per region 2005
Not Applicable
Not Applicable
W. Europe L. America Japan
Lamps
Lumi-naires
LightingElec.
Auto-motive
Asia/PacificN. America TotalE. Europe
Not Applicable
number 1 not in top 3number 2 or 3
SpL.
UHP

10
Philips Lighting strategy
• Profitable growth via
• Building on strength– In emerging countries– With leading (global) accounts– In Business to Business
• Shaping the future– In (consumer) display applications– In Solid State Lighting (LEDs, OLEDs, lasers)

11
Philips Lighting strategy
• Building on strength, Shaping the future via
• Key business drivers– End user driven innovation, building on technology leadership– Marketing excellence– Supply excellence– Committed and competent people, living our values
• on basis of:– A learning organization (continuous improvement)– Control of costs and assets

12
Agenda
• Philips Lighting
• Shaping the future
– LCD backlighting– Solid State Lighting
• Profitable growth via key business drivers
• Continuous improvement, control of costs and assets

13
Growth in (consumer) display applicationsPhilips Aptura for LCD backlighting systems
• New fluorescent solution for LCD: Creating a new viewing experience
• Wider viewing angle• Better contrast• Less motion blur
• Launch Q1 2006

14
The LCD TV market is growing fast
0
5
10
15
20
25
30
2005 2006 2007 2008
Million units LCD TV (>=32”) market volume

15
Aptura creates clear market excitement
Aptura is awarded at the CES (Jan.’05), at the SID (May’05) and received the Eisa Innovation Award at the IFA Sept.’05.

16
Aptura LCD backlighting:Advanced manufacturing capabilities (China)

17
Agenda
• Philips Lighting
• Shaping the future
– LCD backlighting– Solid State Lighting
• Profitable growth via key business drivers
• Continuous improvement, control of costs and assets

18
A brief history of (white) light sources
Open wood fire Oil Filament Gas discharge
Solid State Laser
In-organic LED
Organic LED

19
Lumileds’ leadership in high power in-organic LEDs
• JV established in 1999
• Philips increased ownership to 96.5% in November 2005
• Industry leader in high power LED’s (LUXEON platform)

20
Lumileds Leadership
Luxeon High Power LED
• In all 3 colours and white
• Highest performance in – Lumens/Watt– Lumens/$– Lumens/cm2
• Longest life (50K hrs at 70%)
21
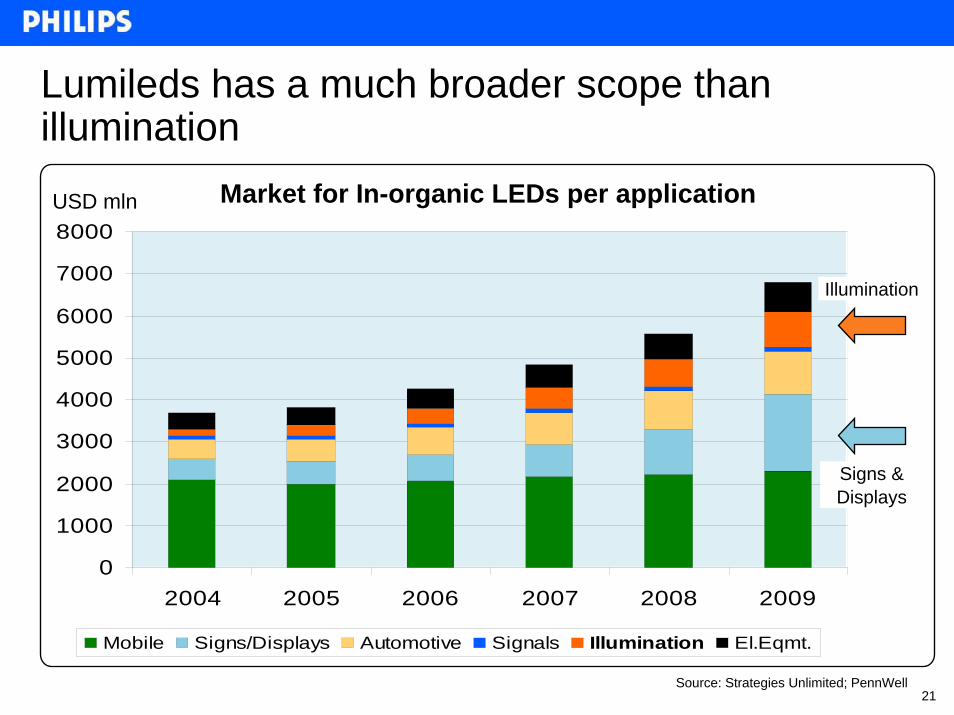
Lumileds has a much broader scope than illumination
Source: Strategies Unlimited; PennWell
0
1000
2000
3000
4000
5000
6000
7000
8000
2004 2005 2006 2007 2008 2009
Mobile Signs/Displays Automotive Signals Illumination El.Eqmt.
USD mln Market for In-organic LEDs per application
Illumination
Signs & Displays

22
Lumileds is well positioned to continue its past (above market average) growth
Illumination + automotive front lighting
LCD Backlighting
Mobile Flash
Automotive exterior
Automotive interior
Mobile displays
Signs
= Lumileds key player

23
Lumileds performance
August 04 / July 05
Sales: US$ 324 million
EBIT: US$ 83 million
Annual Growth: 28%
Operating margin: 25.6%
Employees: 1760

24
Lumileds: Increases Philips Lighting growth by 1%
46%
5%15%
17%
17%
Lamps
Lighting Electronics
AutomotiveSpec.Light.
& UHP
Luminaires
2005 Q3 YTD
Comp.An.Growth 2000-2005
Lamps 3%
Luminaires 0%
ASU 9%
L.Electr. 2%
Lighting 2,8%
Lumileds 27%
Together 3,8%Lumileds

25
Why acquire Agilent’s stake in Lumileds?
• Builds on Philips’ leading global position in lighting
• Gives Philips a controlling share in the leading LED company
• Extends Philips’ involvement to all segments of the LED value chain
• Gives Philips access to strong portfolio of over 200 LED patents
• Deepens Philips’ presence in the higher-growth, higher-margin segments of the LED market

26
We will continue the value creation
• Lumileds will continue with its success in value creation– High % of Lumileds activities are outside Lighting business scope– Lumileds will operate separately in these markets– They will drive the technology and learning curve
• Lumileds and existing Lighting Businesses will be aligned in addressing existing Lighting markets and customers
• In short: – Lumileds is now a separate unit in Lighting – Alignment with existing businesses where it makes business sense

27
Financial targets of Lumileds
• Philips will consolidate Lumileds as of November 28, 2005.
• We aim for Lumileds to achieve annual Sales growth of 25%, and 25% EBIT based on pre-acquisition accounting.
• The purchase price allocation will result in one-time charges for in process R&D assets and for continued amortization of other intangible assets.
• Impact on EBIT of Lighting will be known by year-end.

28
Philips Lighting operates in the In-organic LED system illumination market
0
0.5
1
1.5
2
2.5
3
2004 2005 2006 2007 2008 2009
USD billion World-wide: Business and residential
Estimated by Philips at 3 times the LED component market as stated by Strategies Unlimited; PennWell

29
Philips Lighting is with In-organic LEDsespecially active in decorative outdoor and shop lighting…

30
Creating atmosphere in cities
Demo Philips outdoor lighting application centre, France

31
Creating atmosphere in cities
Demo Philips outdoor lighting application centre, France

32
Creating atmosphere in cities
Demo Philips outdoor lighting application centre, France

33
Examples of projects installed in 2005
Palacio Diputación de Palencia, Spain

34
Examples of projects installed in 2005
Lagos Martianez, Spain
35
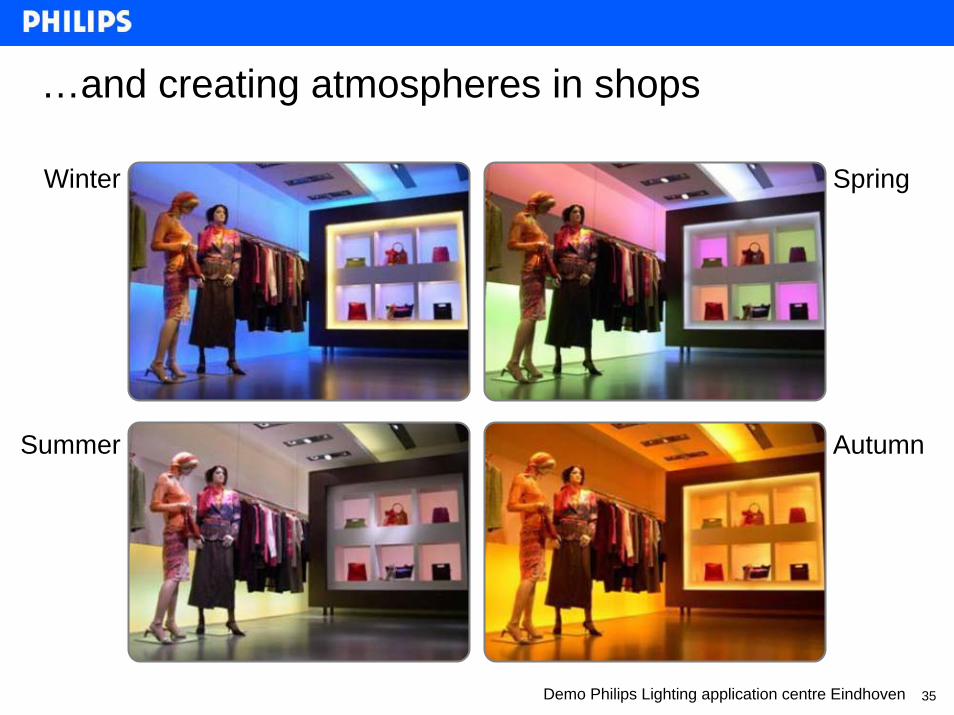
…and creating atmospheres in shops
Winter Spring
Summer Autumn
Demo Philips Lighting application centre Eindhoven

36
Product portfolio 2005LEDFloodEquinox Ledline2
Origami
Minicolour
LED uplighter / step
LEDAmazon
LEDspot & controllerRoadstud

37
Solid State Lighting modules ….……enabling OEM luminaires concepts

38
We explore new applications….e.g. with Philips Medical Systems creating an Ambient Experience during hospital diagnostics

39
We explore new applications…………or creating a Bathroom experience…..
Tiles Bath Shower
Demo in Philips Lighting Application Centre Eindhoven

40
We explore new applications…… light in textiles, controlled by SMS messages
IFA, Sept 2005

41
Agenda
• Philips Lighting
• Shaping the future
– LCD backlighting– Solid State Lighting: OLEDs
• Profitable growth via key business drivers
• Continuous improvement, control of costs and assets

42
Organic LEDs
• Organic LEDs are flat diffuse light sources
• Potential for large area light sources
• Many new design-options (thin, flat, transparent, tunable, flexible...)
• New business opportunities for the lighting world
+-
1.8m
m

43
OLED initially targeted lighting markets
• Automotive– Signaling– Interior
• Signage– Advertising– Emergency lighting
• Special Lighting– Decorative– Accent lighting

44
Some samples of Philips OLED solutions

45
Roadmap for OLED Lighting
Size, efficiency, lifetime
time2006 2008 2010 2015

46
Agenda
• Philips Lighting
• Shaping the future
– LCD backlighting– Solid State Lighting: Lasers
• Profitable growth via key business drivers
• Continuous improvement, control of costs and assets

47
Laser applications in Lighting
• Develop basic laser technology– We acquired 49% stake and obtained management control
in Cedova, a start-up venture for laser manufacturing
• First volume laser application: movement-sensor– Mouse launched with Logitech
• Monitor laser developments for projection systems

48
Agenda
• Philips Lighting
• Shaping the future
• Profitable growth via key business drivers
– End user driven innovation, building on technology leadership
– Marketing excellence– Supply excellence
• Continuous improvement, control of costs and assets

49
New market themes drive growth in Lighting
latentawareness
latentawareness
emergingawarenessemerging
awarenessincreasingawarenessincreasingawareness
highawareness
highawareness
decreasinginterest
decreasinginterest
End
use
r / M
arke
t Aw
aren
ess
See and be seen
Total costof ownership
Safety
Lifestylelighting
Maturity
Today
Tomorrow
Yesterday
Light &health

50
Market theme concept: Safety
The same street before and after
• The street with new solution– Uses less energy– Provides higher quality light– Provides greater safety

51
Market theme concept: Lifestyle lighting

52
Market theme concept: Light & Health
Water purification Infra red sauna

53
Also product-technology innovation willcontinue to drive growth in Lighting
Time
High
Low
End
use
r / M
arke
t Aw
aren
ess IncandescentFluorescent
Halogen
HID
UHP
CFL
Lasers
latentawareness
latentawareness
emergingawarenessemerging
awarenessincreasingawarenessincreasingawareness
highawareness
highawareness
decreasinginterest
decreasinginterest
EUVOLED
LED

54
Building on technology leadershipDevelopment R&D % and size patent portfolio
Patent portfolio increase 2000 – 2005: 68% *)
*) Excluding Lumileds
Increasing R&D effort
33.3
3.8
4.4
4.2
5.3
0
1
2
3
4
5
6
2002 2003 2004 E2005 2006
%
Lumileds
19461782
1604
1480
1303
1155
2158
0
200
400
600
800
1000
1200
1400
1600
1800
2000
2200
2000 2001 2002 2003 2004 2005E
# of Patent Families
*) Excluding Lumileds
*

55
Innovation drives investment for growth (2005)
0%10%20%30%40%50%60%70%80%90%
100%
R&D Capex Marcom Sales
MatureGrowthEmerging

56
Agenda
• Philips Lighting
• Shaping the future
• Profitable growth via key business drivers
– End user driven innovation, building on technology leadership– Marketing excellence– Supply excellence
• Continuous improvement, control of costs and assets

57
Marketing Excellence: building the Brand

58
Sense & Simplicity: Philips IMAGEO
• Candle-like ambience without flames
• Last for more than 24 hours, before recharging
• Rechargeable without taking the LED out of the glass
• Switch on/off by tilting the glass

59
Sense & Simplicity: Philips IMAGEO
The intimacy of realcandle-light, but morecolorful
• Real candle with battery operated LED inside
• Long lasting: 100 hours
60
Agenda
• Philips Lighting
• Shaping the future
• Profitable growth via key business drivers
– End user driven innovation, building on technology leadership– Marketing excellence– Supply excellence
• Continuous improvement, control of costs and assets

61
Supply excellence: delivery reliabilityTotal Philips Lighting
80
85
90
95
2001 2002 2003 2004 2005Q3YTD
%

62
Agenda
• Philips Lighting
• Shaping the future
• Profitable growth via key business drivers
• Continuous improvement, control of costs and assets
63
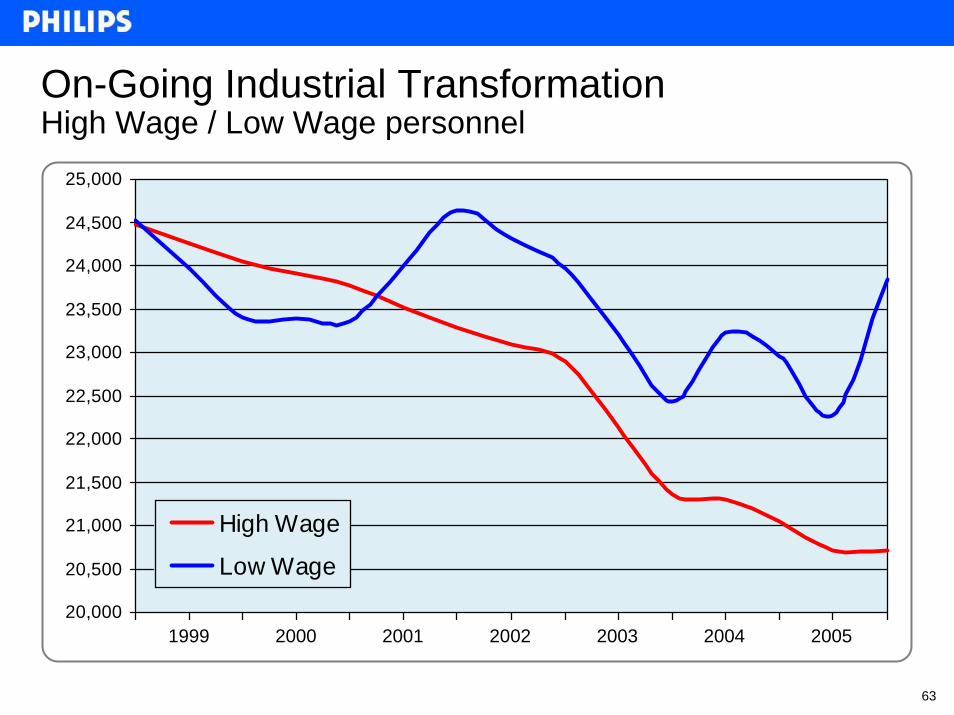
On-Going Industrial TransformationHigh Wage / Low Wage personnel
20,000
20,500
21,000
21,500
22,000
22,500
23,000
23,500
24,000
24,500
25,000
High Wage
Low Wage
1999 2000 2001 2002 2003 2004 2005

64
Net Operating Capital turns Continuous improvement
1.5
2
2.5
3
3.5
'96 '97 '98 '99 '00 '01 '02 '03 '04 '05 Q3YTD

65
Working Capital turns Continuous improvement
2
4
6
8
10
'96 '97 '98 '99 '00 '01 '02 '03 '04 '05 Q3YTD

66
Continuous Improvement:BEST in Philips LightingAll metrics show ample room for improvement
• Applying model from European Foundation for Quality Management: from 600 points today towards 700 in coming years
• Business Balanced Scorecards: focus on essentials
• Improve business processes– Systematic deployment of business targets into concrete action
plans on all levels– Cycle time reduction– Black belts: growing population of process champions– Process survey tools: from 5 towards 7 level
• Quality improvement competition: 40 % participation of all employees

67