final usgaap accoutnsformated15may 2003 6.45pmrajesh hukku y m kale chairman director & managing...
TRANSCRIPT
March 2003 March 2003 March 2002
Thousands of US dollars
(Translated)ASSETS
Current assets
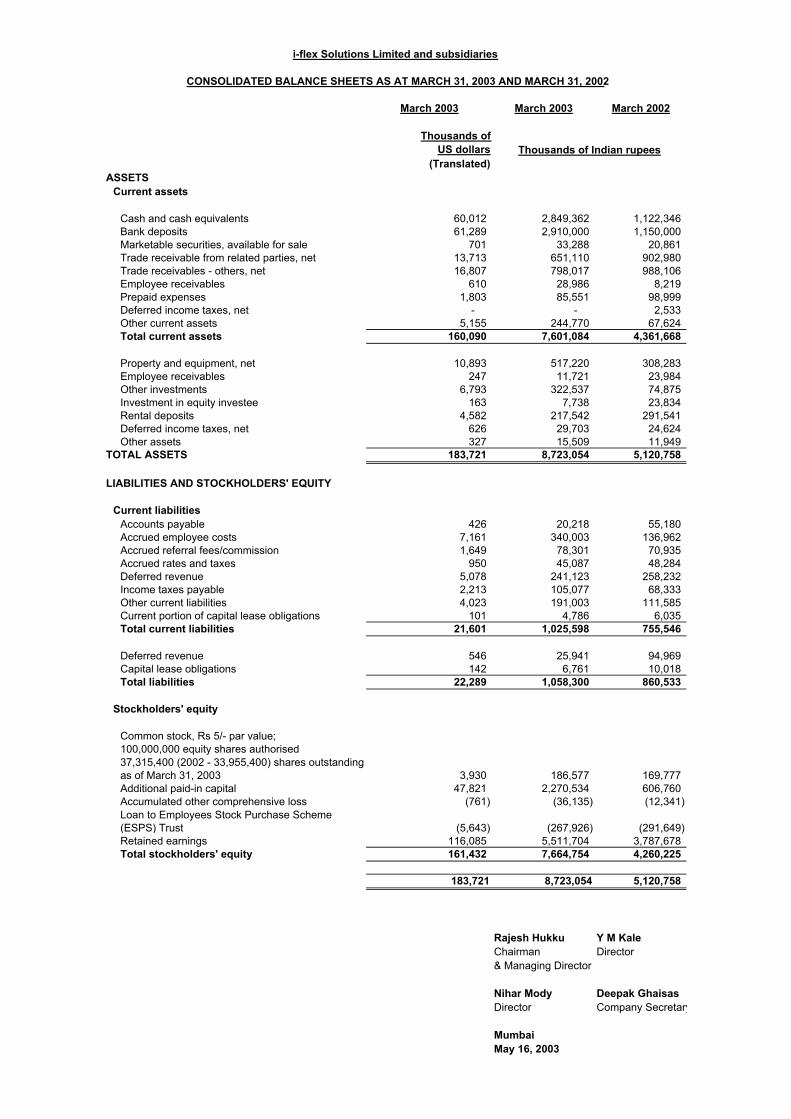
Cash and cash equivalents 60,012 2,849,362 1,122,346 Bank deposits 61,289 2,910,000 1,150,000 Marketable securities, available for sale 701 33,288 20,861 Trade receivable from related parties, net 13,713 651,110 902,980 Trade receivables - others, net 16,807 798,017 988,106 Employee receivables 610 28,986 8,219 Prepaid expenses 1,803 85,551 98,999 Deferred income taxes, net - - 2,533 Other current assets 5,155 244,770 67,624 Total current assets 160,090 7,601,084 4,361,668
Property and equipment, net 10,893 517,220 308,283 Employee receivables 247 11,721 23,984 Other investments 6,793 322,537 74,875 Investment in equity investee 163 7,738 23,834 Rental deposits 4,582 217,542 291,541 Deferred income taxes, net 626 29,703 24,624 Other assets 327 15,509 11,949
TOTAL ASSETS 183,721 8,723,054 5,120,758
LIABILITIES AND STOCKHOLDERS' EQUITY
Current liabilitiesAccounts payable 426 20,218 55,180 Accrued employee costs 7,161 340,003 136,962 Accrued referral fees/commission 1,649 78,301 70,935 Accrued rates and taxes 950 45,087 48,284 Deferred revenue 5,078 241,123 258,232 Income taxes payable 2,213 105,077 68,333 Other current liabilities 4,023 191,003 111,585 Current portion of capital lease obligations 101 4,786 6,035 Total current liabilities 21,601 1,025,598 755,546
Deferred revenue 546 25,941 94,969 Capital lease obligations 142 6,761 10,018 Total liabilities 22,289 1,058,300 860,533
Stockholders' equity
Common stock, Rs 5/- par value;100,000,000 equity shares authorised 37,315,400 (2002 - 33,955,400) shares outstanding as of March 31, 2003 3,930 186,577 169,777 Additional paid-in capital 47,821 2,270,534 606,760 Accumulated other comprehensive loss (761) (36,135) (12,341) Loan to Employees Stock Purchase Scheme (ESPS) Trust (5,643) (267,926) (291,649) Retained earnings 116,085 5,511,704 3,787,678 Total stockholders' equity 161,432 7,664,754 4,260,225
183,721 8,723,054 5,120,758
Rajesh Hukku Y M KaleChairman Director& Managing Director
Nihar Mody Deepak GhaisasDirector Company Secretary
MumbaiMay 16, 2003
i-flex Solutions Limited and subsidiaries
CONSOLIDATED BALANCE SHEETS AS AT MARCH 31, 2003 AND MARCH 31, 2002
Thousands of Indian rupees
March 2003 March 2003 March 2002
Thousands ofUS Dollars
(Translated)
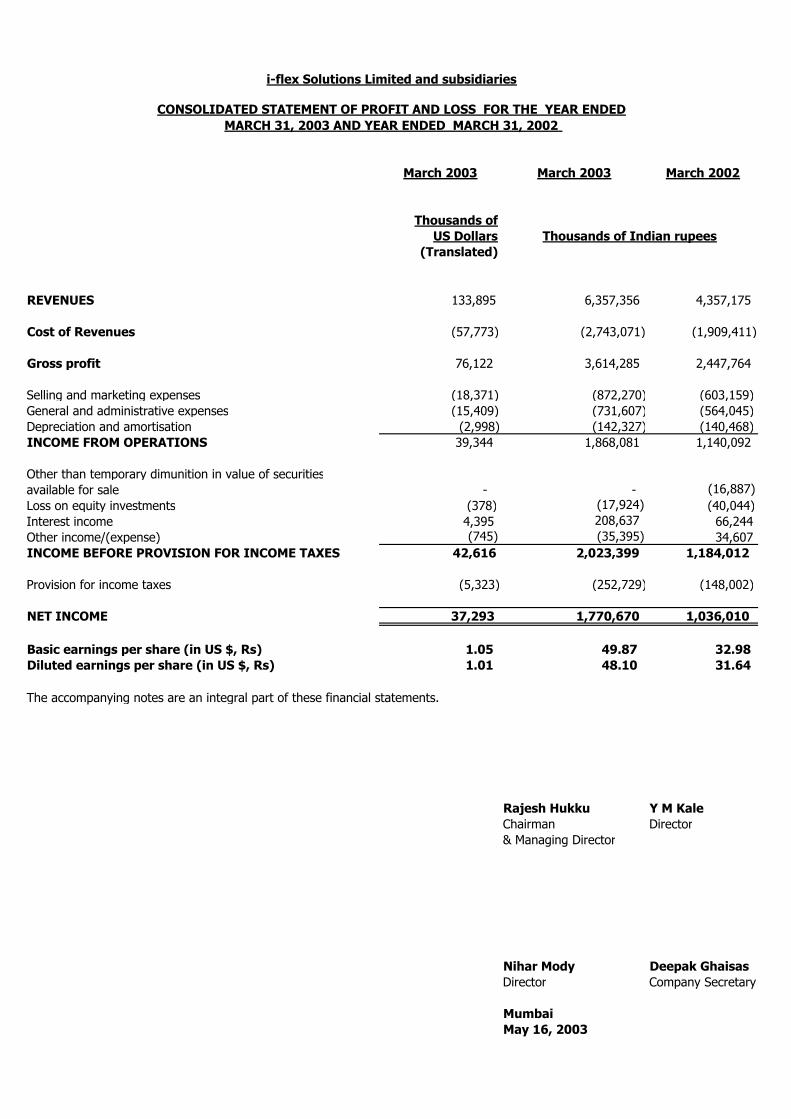
REVENUES 133,895 6,357,356 4,357,175
Cost of Revenues (57,773) (2,743,071) (1,909,411)
Gross profit 76,122 3,614,285 2,447,764
Selling and marketing expenses (18,371) (872,270) (603,159)General and administrative expenses (15,409) (731,607) (564,045)Depreciation and amortisation (2,998) (142,327) (140,468)INCOME FROM OPERATIONS 39,344 1,868,081 1,140,092
Other than temporary dimunition in value of securitiesavailable for sale - - (16,887) Loss on equity investments (378) (17,924) (40,044)Interest income 4,395 208,637 66,244 Other income/(expense) (745) (35,395) 34,607 INCOME BEFORE PROVISION FOR INCOME TAXES 42,616 2,023,399 1,184,012
Provision for income taxes (5,323) (252,729) (148,002)
NET INCOME 37,293 1,770,670 1,036,010
Basic earnings per share (in US $, Rs) 1.05 49.87 32.98 Diluted earnings per share (in US $, Rs) 1.01 48.10 31.64
The accompanying notes are an integral part of these financial statements.
Rajesh Hukku Y M KaleChairman Director& Managing Director
Nihar Mody Deepak GhaisasDirector Company Secretary
MumbaiMay 16, 2003
Thousands of Indian rupees
i-flex Solutions Limited and subsidiaries
CONSOLIDATED STATEMENT OF PROFIT AND LOSS FOR THE YEAR ENDEDMARCH 31, 2003 AND YEAR ENDED MARCH 31, 2002
March 31 2003 March 31 2003 March 2002
Thousands ofUS Dollars
(Translated)
CASH FLOWS FROM OPERATING ACTIVITIES
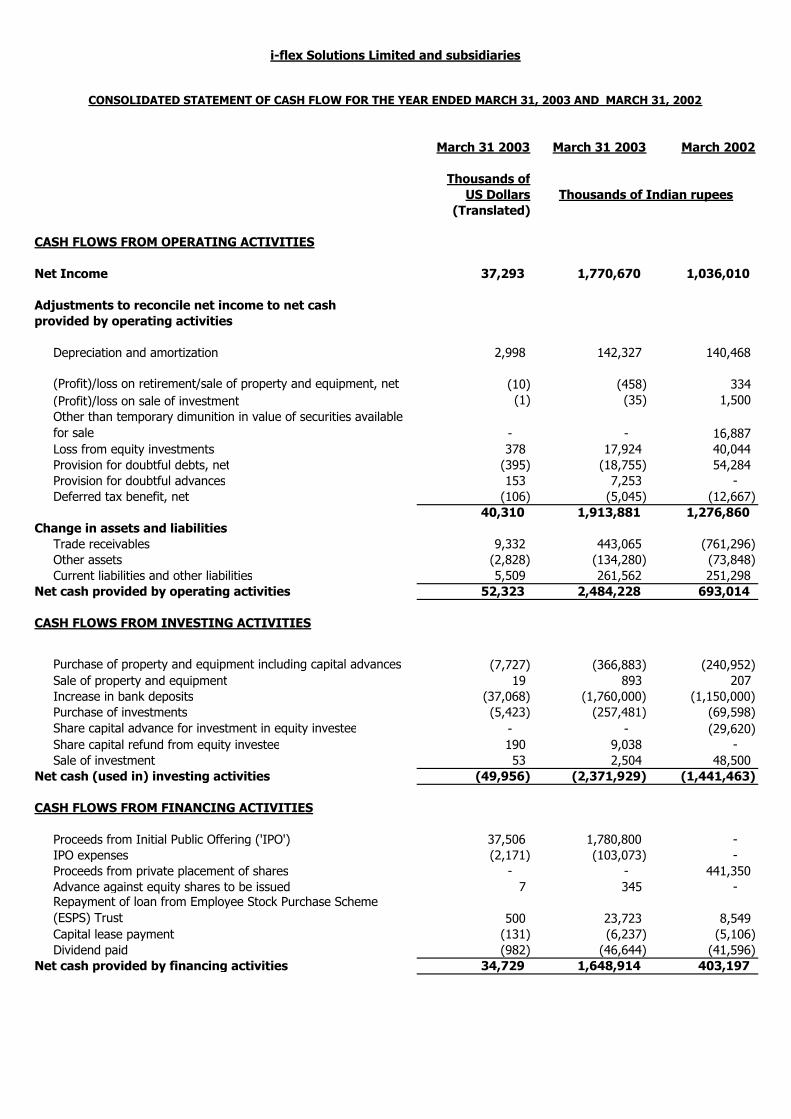
Net Income 37,293 1,770,670 1,036,010
Adjustments to reconcile net income to net cashprovided by operating activities
Depreciation and amortization 2,998 142,327 140,468
(Profit)/loss on retirement/sale of property and equipment, net (10) (458) 334 (Profit)/loss on sale of investment (1) (35) 1,500 Other than temporary dimunition in value of securities available for sale - - 16,887 Loss from equity investments 378 17,924 40,044 Provision for doubtful debts, net (395) (18,755) 54,284 Provision for doubtful advances 153 7,253 - Deferred tax benefit, net (106) (5,045) (12,667)
40,310 1,913,881 1,276,860 Change in assets and liabilities
Trade receivables 9,332 443,065 (761,296) Other assets (2,828) (134,280) (73,848) Current liabilities and other liabilities 5,509 261,562 251,298
Net cash provided by operating activities 52,323 2,484,228 693,014
CASH FLOWS FROM INVESTING ACTIVITIES
Purchase of property and equipment including capital advances (7,727) (366,883) (240,952) Sale of property and equipment 19 893 207 Increase in bank deposits (37,068) (1,760,000) (1,150,000) Purchase of investments (5,423) (257,481) (69,598) Share capital advance for investment in equity investee - - (29,620) Share capital refund from equity investee 190 9,038 - Sale of investment 53 2,504 48,500
Net cash (used in) investing activities (49,956) (2,371,929) (1,441,463)
CASH FLOWS FROM FINANCING ACTIVITIES
Proceeds from Initial Public Offering ('IPO') 37,506 1,780,800 - IPO expenses (2,171) (103,073) - Proceeds from private placement of shares - - 441,350 Advance against equity shares to be issued 7 345 - Repayment of loan from Employee Stock Purchase Scheme (ESPS) Trust 500 23,723 8,549 Capital lease payment (131) (6,237) (5,106) Dividend paid (982) (46,644) (41,596)
Net cash provided by financing activities 34,729 1,648,914 403,197
i-flex Solutions Limited and subsidiaries
Thousands of Indian rupees
CONSOLIDATED STATEMENT OF CASH FLOW FOR THE YEAR ENDED MARCH 31, 2003 AND MARCH 31, 2002

Net (decrease)/increase in cash and cash equivalents during the period/year 37,095 1,761,213 (345,252)
Effect of exchange (loss) on cash and cash equivalents (721) (34,197) (6,792) Cash and cash equivalents at the beginning of the year 23,638 1,122,346 1,474,390 Cash and cash equivalents at the end of the year 60,012 2,849,362 1,122,346
Supplementary informationCashTaxes paid
Domestic taxes 3,663 173,905 47,932 Foreign taxes 1,602 76,071 97,316 Dividend taxes - - 4,243
5,265 249,976 149,491 Non CashAssets acquired under capital leases 52 2,447 9,193
The accompanying notes are an integral part of these financial statements
Rajesh Hukku Y M KaleChairman Director& Managing Director
Nihar Mody Deepak GhaisasDirector Company Secretary
MumbaiMay 16, 2003

No. of Shares Par ValueAdditional paid-in
capitalComprehensive
income
Accumulated other
comprehensive loss Loan to Trust Retained earnings
Total stockholders' equity
Balance as of March 31, 2001 (As restated) (see note below) 33,276,400 166,382 168,805 (3,283) (300,198) 2,793,264 2,824,970
Cash dividend declared - - - - - - (41,596) (41,596) Common stock issued upon Preferential allotment 679,000 3,395 437,955 - - - - 441,350 Repayment of loan by ESPS Trust - - - - - 8,549 - 8,549 Net income for the year - - - 1,036,010 - - 1,036,010 1,036,010 Translation gain - - - (2,617) (2,617) - - (2,617) Unrealised loss on securities available for sale, net of deferred tax - - - (6,441) (6,441) - - (6,441) Comprehensive income 1,026,952
Balance as of March 31, 2002 33,955,400 169,777 606,760 (12,341) (291,649) 3,787,678 4,260,225
Cash dividend declared - - - - - - (46,644) (46,644) IPO of stock during the year 3,360,000 16,800 1,764,000 - - - - 1,780,800 IPO related expenses - - (103,073) - - - - (103,073) Gain on dilution of investment in equity investee (refer Note 10) - - 2,847 - - - - 2,847 Repayment of loan by ESPS Trust - - - - - 23,723 - 23,723 Net income for the year - - - 1,770,670 - - 1,770,670 1,770,670 Translation loss - - - (36,221) (36,221) - - (36,221) Unrealised gain on securities available for sale - - - 12,427 12,427 - - 12,427 Comprehensive income 1,746,876
Balance as of March 31, 2003 37,315,400 186,577 2,270,534 (36,135) (267,926) 5,511,704 7,664,754
(Thousands of US Dollars)
(Translated) Balance as of March 31, 2003 37,315,400 3,930 47,821 (761) (5,643) 116,085 161,432 The accompanying notes are an integral part of the financial statements
Note: These amounts are based on the restated financials for the year ended March 31, 2001
i-flex Solutions Limited and subsidiaries
CONSOLIDATED STATEMENT OF CHANGES IN STOCKHOLDERS' EQUITY AND COMPREHENSIVE STATEMENT FOR THE YEAR ENDED MARCH 31, 2003 AND MARCH 31, 2002
Common Stock(Thousands of Indian rupees)

i-flex Solutions Limited and subsidiaries
NOTES TO THE CONSOLIDATED FINANCIAL STATEMENTS FOR THE YEARS ENDED MARCH 31, 2003 AND MARCH 31, 2002
(All amounts in thousands of Indian rupees, unless otherwise stated)
1. BACKGROUND i-flex Solutions Limited ('i-flex' or 'the Company'), a public limited company, was incorporated in India with limited liability on September 27, 1989. The Company’s principal shareholder is OrbiTech Limited (‘OrbiTech’) with shareholding of 43.19 per cent. OrbiTech is a 100 per cent subsidiary of Citicorp Technology Holdings Inc, USA. In June 2002, the Company completed an Initial Public Offering (“IPO”) and issued 3,360,000 equity shares of Rs 5/- each at a price of Rs 530/- per share. Concurrently, 601,700 equity shares held by existing shareholders were also offered for sale. Consequently, on June 28, 2002, the equity shares of the Company were listed on the National Stock Exchange of India and The Stock Exchange, Mumbai. The Company had a controlling/significant influence in the following: �� i-flex solutions b.v. (‘i-flex b.v.’), a 100 per cent owned subsidiary company incorporated in
May 2000 under the laws of The Netherlands; �� i-flex solutions Pte. Ltd., (‘i-flex Pte.’), a 100 per cent owned subsidiary company incorporated in
November 2001 under the laws of Singapore; �� i-flex solutions inc., (‘i-flex inc’), a 100 per cent owned subsidiary company incorporated in
December 2001 under the laws of the United States of America; �� DotEx International Limited (‘DotEx’), a 49 per cent owned investee company incorporated in
June 2000 under the Indian laws; and �� Flexcel International Private Limited (‘Flexcel’), a 40 per cent owned investee company
incorporated in March 2001 under the Indian laws. The Company along with i-flex b.v., i-flex Pte. and i-flex inc. (hereinafter collectively referred to as ‘the Group’) is principally engaged in the business of providing information technology solutions to the financial services industry worldwide. i-flex has a suite of banking products, which caters to the needs of corporate, retail and investment banking as well as treasury operations and data warehousing. The Group also provides software development services and develops bespoke software for its customers from the financial services industry. The Group derives a substantial portion of its revenues from the overseas markets. 2. SUMMARY OF SIGNIFICANT ACCOUNTING POLICIES 2.1 Principles of consolidation The accompanying consolidated financial statements of the Group are prepared in conformity with generally accepted accounting principles in the United States of America (‘US GAAP’) to reflect the financial position and the results of operations of the Group. DotEx and Flexcel are accounted for using the equity method since the Group exerts significant influence on the operations of DotEx and Flexcel. All material transactions and balances between the Group entities have been eliminated. The Group records losses in excess of its proportionate investment in DotEx since it is committed to provide further financial support to DotEx.
1

2.2 Basis of presentation (a) These financial statements are prepared under the historical cost convention on the accrual basis of
accounting in accordance with the accounting and reporting requirements of US GAAP. (b) For the convenience of readers, the financial statements for the year ended March 31, 2003 have
been translated into United States Dollars (‘US$’) using the telex transfer average rate as prescribed by Citibank NA as at March 31, 2003 which was 1 US$ = Rs 47.48. The convenience translation should not be construed as a representation that the Indian Rupee amounts or the US$ amounts referred to in these financial statements have been, could have been, or could in the future be, converted into US$ or Rs, as the case may be, at this or at any other rate of exchange, or at all.
(c) On October 9, 1999, the Board of Directors authorised a one-for-one stock split of the Company’s
equity shares effected in form of a stock dividend. Further on October 31, 2000, there was one-for-one stock split of the Group’s shares in form of a stock dividend. Also, in accordance with the resolution passed in the shareholders’ and Board of Directors’ meetings held on August 14, 2001 and January 7, 2002, respectively, the equity share of par value Rs 10/- each has been split into two equity shares of par value of Rs 5/- each. Subsequent to the sub-division, the authorised Common Stock is 100,000,000 equity shares and issued and outstanding common stock is 37,315,400 equity shares. Accordingly, all share and per share amounts have been retroactively restated.
(d) The Group also separately presents its consolidated financial statements for the same period prepared in accordance with generally accepted accounting principles in India. The significant differences between the generally accepted accounting principles in India and those generally accepted in the United States of America so far as concerns the financial statements referred to above are primarily relating to the deferral of revenues pertaining to post-contract support and significant discounts, compensated absences, employee benefit plans, marketable securities and derivatives.
2.3 Use of estimates The preparation of financial statements in conformity with generally accepted accounting principles requires management to make estimates and assumptions that affect the reported amounts of assets and liabilities and disclosure of contingent assets and liabilities at the date of the financial statements and the results of operations during the reporting year. Although these estimates are based upon management’s best knowledge of current events and actions, actual results could differ from those estimates. 2.4 Foreign currency The functional currency of each entity in the Group is its respective local currency. Monetary assets and liabilities in foreign currencies are remeasured into functional currency at the rates of exchange prevailing at the balance sheet date. Transactions in foreign currencies are remeasured into functional currency at the rates of exchange prevailing at the date of the transaction. All foreign exchange gains and losses are recorded in the accompanying consolidated income statements. The results of each entity in the Group are translated into Indian rupees, the reporting currency, at the average rates of exchange during the year and the balance sheet is translated at the rate in effect at the balance sheet date. Translation adjustments are included as a separate component of stockholders’ equity.
2
2.5 Revenue recognition The Group derives revenues from: Product licensing and related services - The licensing of banking software products, normally sold as perpetual licenses, along with the provision of related implementation services and post contract support (“PCS”); and IT solutions and consulting services - Providing bespoke software development and other consulting services to certain customers, which comprise primarily banking and financial services companies. License revenues are recognised when persuasive evidence of an arrangement exists, delivery has occurred, the license fee is fixed and determinable and the collection of the fee is probable. License revenues from arrangements, which contain extended payment terms is not considered to be fixed and determinable at the outset of the arrangement and revenue is therefore recognized as payments from customers become due (assuming all other conditions for revenue recognition have been satisfied). If a licensing arrangement provides a customer a right to a significant incremental discount (with reference to VSOE of the fair value of that element) on a future purchase of any other software product or a service, a proportionate amount of that discount is applied to each element covered by that arrangement based on each element’s fair value. Licensing arrangements, which allow a customer to purchase additional copies of products already licensed and delivered to the customer, do not result in the provision of a significant discount to the customer. Revenues are recognised as each additional copy is purchased by the customer based on the price per copy stated in the agreement. Implementation services essentially comprise, inter alia, minor functional enhancements, interface building, implementation planning, data conversion, training and product walkthrough. Such services are not essential to the functionality of the software and do not affect the realisability of the license fees. Accordingly, implementation services is treated as a separate element. Revenue related to implementation services are recognized as services are provided when arrangements are on a time and material basis. In case of fixed price arrangements, revenue related to implementation services is recognized on a percentage of completion basis. When an arrangement provides for significant modification or customisation of the product or if Implementation Services are essential to the functionality of the product, the revenue related to both the License and Implementation Services is recognized on a percentage of completion basis. The Group enters into support arrangements, which are generally for a period of 12 months and renewable thereafter, to provide technical support, maintenance, query solving and upgrades (on a when and if available basis) to its customers. PCS revenue is recognized ratably over the period of the PCS. The Group allocates a portion of its software revenues to PCS activities provided free of charge to the customer for a specified period as included under the licensing arrangement, based on its Vendor Specific Objective Evidence (“VSOE”) which is derived from the renewals of PCS arrangements. Revenues from IT solutions and consulting services are recognized as services are provided when arrangements are on a time and material basis. Revenues for fixed price contracts is recognized on a percentage of completion basis. Percentage of completion is determined based on the proportion of efforts spent to total efforts to complete or on the basis of contractually determined milestones as certified by the customer. Provisions for estimated losses, if any, on uncompleted contracts are recorded in the period in which such losses become probable based on current contract estimates.
3
Reimbursement for out-o -pocket expenses f
Reimbursements of out-of-pocket expenses are included in revenue in accordance with Emerging Issues Task Force Consensus (“EITF’) 01-14 “Income Statement Characterization of Reimbursement received for ‘Out of Pocket’ expenses incurred”. Accordingly out-of-pocket expenses amounting to Rs. 198,134 and Rs. 246,308 for the years ended March 31, 2003 and 2002 are included in revenues.
Deferred revenue Deferred revenue primarily represents the unexpired amount of PCS. 2.6 Cost of revenues Cost of revenues comprises of salaries and employee benefits, project related travel costs, application software costs and professional fees. 2.7 Research and development expenses for products Research and development costs are expensed as incurred. Software product development costs are expensed as incurred until technological feasibility is established. Software product development costs incurred subsequent to the achievement of technological feasibility are not material and have been expensed. 2.8 Cash and cash equivalents Cash and cash equivalents include all highly liquid investments with an original maturity of ninety-one days or less. 2.9 Property and equipment Property and equipment including assets under capital lease agreements are stated at cost, less accumulated depreciation and amortisation. Depreciation is computed using the written-down value method, which is an accelerated method of depreciation and is charged to income over the estimated useful life of the assets. Assets under capital leases are amortised over the shorter of the useful life or lease term. Costs of normal repairs and maintenance are charged to income as incurred. Major replacements or betterment of property and equipment are capitalised. When assets are sold or otherwise disposed off, the cost and related accumulated depreciation are removed from the accounts and any resulting gain or loss is included in the profit and loss statement. Advances paid towards the acquisition of property and equipment outstanding at each balance sheet date and the cost of property and equipment not put to use before such date are disclosed under ‘Capital advances’. 2.10 Impairment of long-lived assets The Group reviews long-lived assets for impairment, whenever an event or changes in circumstances indicate that the carrying amount of such assets may not be recoverable. The carrying values of long-lived assets are assessed for recoverability by reference to the estimated future undiscounted cash flows associated with them. Where this assessment indicates a deficit, the assets are written down to market value. For assets, which do not have a readily determinable market value, the assets are written down to their estimated market value, calculated by reference to the estimated future discounted cash flows. Assets to be disposed are reported at the lower of the written down value or the fair value, less the cost to sell.
4
2.11 Marketable securities Investments in marketable securities are classified as available for sale and are accounted for at fair value, which is determined by reference to prevailing market prices. Changes in fair value are recorded, net of taxes as comprehensive income (loss) and reported as a separate component of stockholders' equity. Declines in fair value below original cost are recorded in the income statement when they are considered to be other than temporary. 2.12 Other investments Investments where the Group controls between 20 percent and 50 percent of the voting interest are accounted for using the equity method. Investments in unquoted equity and debt securities held to maturity, where the Group controls less than 20 percent voting interest are accounted for at cost. Decline in fair value below original cost is recorded in the income statement when they are considered to be other than temporary. 2.13 Income taxes The current charge for income taxes is calculated in accordance with the relevant tax regulations applicable to the Group. Deferred income taxes are recognised for the future tax consequences attributable to temporary differences between the financial statement carrying amounts of existing assets and liabilities and their respective tax bases. The effect on deferred tax assets and liabilities of a change in tax rates is recognised in income statement in the year the change is enacted. Deferred tax assets are recognised in full, subject to a valuation allowance to reduce the amount recognised to that, which is more likely than not to be realised. 2.14 Employee Benefit Plans In accordance with Indian law, all employees of the Company in India, are entitled to receive benefits under the Provident Fund, a defined contribution plan in which both the employee and the Company, contribute monthly at a determined rate (currently 12 per cent of the employees' base salary). These contributions are made to the Government Provident Fund. The Superannuation Plan is a defined contribution pension plan for a certain category of employees of the Company in India. The Company contributes to employees’ superannuation fund at 5 to 10 per cent of the employee’s base salary. The superannuation fund is administered by a trust formed for this purpose through the Group Scheme of the Life Insurance Corporation of India (‘LIC’). The Company has no further obligation under the Provident Fund or Superannuation Plan, beyond its contributions. Contributions to defined contribution plans are charged to income in the year in which they accrue. In accordance with Indian law, the Company provides for gratuity, a defined benefit retirement plan (‘the Gratuity Plan’) covering all its employees in India. The Gratuity Plan provides a lump sum payment to vested employees on retirement or on termination of employment of an amount based on the respective employees' salary and the years of employment with the Company. The gratuity plan fund benefits of the Company are administered by a trust formed for this purpose through the Group Schemes of Life Insurance Corporation of India ('LIC'). Gratuity benefit cost for the year is calculated on an actuarial basis. The Company’s liability towards compensated absences is determined on an actuarial basis for the entire unavailed vacation balance standing to the credit of each employee as at year-end. 2.15 Operating leases Leases of assets under which the lessor effectively retains all the risks and rewards of ownership are classified as operating leases. Lease payments under an operating lease are recognised as an expense on a straight-line basis over the lease term.
5

2.16 Earnings per share Basic earnings per share is computed by dividing the net income by the weighted average number of common shares outstanding during the year. Diluted earnings per share is computed using the weighted average of common and dilutive common equivalent shares outstanding during the year, using the treasury stock method for shares which have been granted to employees pursuant to the Employees Stock Purchase Scheme (‘the Scheme’) adopted by the Group, except where the result would be anti-dilutive. 2.17 Stock-based compensation The Group accounts for stock-based compensation using the intrinsic value method prescribed in APB No. 25, “Accounting for Stock Issued to Employees”. Compensation cost for stock options is measured as the excess of the fair value of the Company’s stock on the measurement date over the amount an employee must pay to acquire the stock and is recognised over the vesting period. The intrinsic value of the options is measured on the basis of the fair value of the Company’s stock at the end of each year. SFAS No. 123, “Accounting for Stock-Based Compensation,” established accounting and disclosure requirements using a fair-value-based method of accounting for stock-based employee compensation plans. The Company has elected its current method of accounting as described above, and has adopted the disclosure requirements of SFAS No. 148, “Accounting for Stock-Based Compensation – Transition and Disclosure”, an amendment of SFAS No. 123. Had compensation cost for the Group's ESOP been determined based on the fair value at the grant dates for awards under those plans consistent with the method of FASB Statement 123, the Company's net income and earnings per share would have been reduced to the pro forma amounts indicated below:
March 2003
US Dollars Indian rupees
(in thousands except per share data)
Net income As reported 37,293 1,770,670 Pro forma 30,348 1,440,909 Basic earning per share As reported (in US$, Rs) 1.05 49.87 Pro forma (in US$, Rs) 0.84 40.58
Diluted earning per share As reported (in US$, Rs) 1.03 48.96 Pro forma (in US$, Rs) 0.84 39.84
Compensation cost recognized for the fair value of the ESOP as per the requirement of SFAS 123 is based on the Black-Scholes model with the following assumptions:
Dividend yield 0.16 per cent
Expected volatility 65 per cent
Risk-free interest rates 8.5 per cent
Expected life 6 years
6

2.18 Derivative instruments and hedging activities The Group does not use derivative financial instruments and does not engage in any hedging activities. However, some of the license arrangements entered into by the Group with its customers are denominated in a currency which is neither the functional currency of the Group or the customer, and thus qualify as embedded derivative instruments as per SFAS No. 133. Accordingly, gains or losses on such embedded derivative instruments are recognised in the Group’s consolidated income statements based on the market value of the embedded derivative contracts at each year end and corresponding asset/liability is recorded in the balance sheet under other current assets or other current liabilities. 3. CASH AND CASH EQUIVALENTS Cash and cash equivalents consist of physical cash, cheques on hand and balances available in current accounts and time deposits with banks. Time deposits are interest-bearing deposits for periods ranging from 30 to 91 days. The details of cash and cash equivalents are as follows:
March 2003 March 2003 March 2002
US Dollars Indian rupees
(in thousands)
Cash on hand 18 832 506
Funds in transit 149 7,091 —
Bank balances
Current accounts 51,504 2,445,422 882,651
Time deposits 8,341 396,017 239,189
60,012 2,849,362 1,122,346 Cash and cash equivalents of the Company are subject to local exchange control restrictions and can be remitted overseas only with prior approval from the relevant regulatory authorities.
7

4. TRADE RECEIVABLES, NET Trade receivable from related parties as of March 31, 2003 and March 31, 2002, net of provision for doubtful accounts of Rs Nil and Rs 1,221, respectively amounted to Rs 651,110 and Rs 902,980, respectively. Trade receivable - others as of March 31, 2003 and March 31, 2002 net of provisions for doubtful accounts of Rs 38,842 and Rs 54,691, respectively amounted to Rs 798,017 and Rs 988,106, respectively. The movement in provision for doubtful accounts is given below:
March 2003 March 2003 March 2002
US Dollars Indian rupees
(in thousands)
Provision for doubtful debts
Trade receivables from related parties
Opening balance 26 1,221 —
Additions — — 1,221
Reversals related to changes in estimates (26) (1,221) —
Collections — — —
Closing balance — — 1,221
Trade receivables – others
Opening balance 1,152 54,691 4,233
Additions — — 52,198
Reversals related to changes in estimates (179) (8,498) —
Collections (155) (7,351) (1,740)
Closing balance 818 38,842 54,691
8

5. PROPERTY AND EQUIPMENT, NET Property and equipment consist of the following:
March 2003 March 2003 March 2002
US Dollars Indian rupees
Estimated
useful life
(years)
Rates(%)
(in thousands)
Land 942 44,734 44,734
Improvement to leasehold premises 7 35 2,138 101,522 83,479
Building 20 15 424 20,116 7,116
Computer equipments 3 60 9,915 470,781 401,650
Electrical and office equipment 7 35 3,279 155,687 143,349
Furniture and fixtures 7 35 2,842 134,965 120,228
Vehicles on lease 4-5 25-20 519 24,631 26,890
Capital advances 4,663 221,383 2,412
24,722 1,173,819 829,858
Less: Accumulated depreciation and amortisation (13,829) (656,599) (521,575)
Property and equipment, net 10,893 517,220 308,283 Depreciation is computed at the rates referred to above, applied to the written-down value of the assets over its useful life estimated. Property and equipment above include the following assets held under capital leases:
March 2003 March 2003 March 2002
US Dollars Indian rupees
(in thousands)
Vehicles 519 24,631 26,890
Less: Accumulated amortisation (303) (14,390) (12,370)
216 10,241 14,520 6. FINANCIAL INSTRUMENTS
6.1 Fair Value of Financial Instruments
The fair values of the Group's current assets and current liabilities approximate their carrying values because of their short maturity. Such financial instruments are classified as current and are expected to be liquidated within the next twelve months. Long term employee receivables are loans given to employees to acquire assets such as property and cars. Such loans are repayable over fixed periods ranging from three to ten years. The Group recovers interest on such loans at rates, which closely approximate the market rates. Hence, the fair value of the long-term employee receivables closely approximates the carrying value in the financial statements at Rs 11,721 and Rs. 23,984 for the years ended March 31, 2003 and 2002 respectively.
9

Long-term rental deposits comprise of interest free deposits maintained for office and residential premises taken on lease. Such deposits are repayable on termination of such lease agreements. The fair value of the long-term rental deposits carried in the financial statements as at March 31, 2003 and 2002 at Rs 217,542 and Rs 291,541, respectively, determined using market rates of interest as at March 31, 2003 and March 31,2002 is approximately Rs 171,144 and Rs 206,814, respectively.
6.2 Concentration of credit risk
Financial instrument that potentially subject the Group to concentrations of credit risk consist principally of cash equivalents, trade receivables from related parties, trade receivables from others and bank deposits. By their nature, all such financial instruments involve risk including the credit risk of non-performance by counter parties. The Group’s cash equivalents and bank deposits are invested with banks with high investment grade credit ratings. As at March 31, 2003, 50 per cent (March 31, 2002 – 51 per cent) and 32 per cent (March 31, 2002 – 34 per cent) of cash equivalents (primarily denominated in US $) were placed with Citibank and HDFC Bank, respectively. 58 per cent (March 31, 2002 – 100 per cent) and 38 per cent (March 31, 2002 – nil) of bank deposits were placed with HDFC Bank and Bank of India, respectively. Trade receivables (primarily denominated in US $) are typically unsecured and are derived from revenues earned from customers in the financial service industry worldwide. The Group monitors the credit worthiness of its customers to which it grants credit terms in the normal course of the business. As at March 31, 2003 and March 31, 2002, 94 per cent and 69 per cent of trade receivables from related parties was recoverable from various Citibank branches, 5 per cent and 30 per cent are recoverable from CITI. As at March 31, 2003 and March 31, 2002, 13 per cent and Nil per cent are recoverable from Customer 1 of non related parties and 10 per cent and 5 per cent from Customer 2. In management’s opinion, as of March 31, 2003, there is no significant risk of loss in the event of non-performance of the counter parties to these financial instruments, other than the amounts already provided for in the financial statements, if any. 6.3 Derivative Financial Instruments Licence arrangement contract are bifurcated into functional currencty denominated sales contracts and contractual currency denominated forward contracts. As at March 31, 2003 the Company has committed to deliver US $ 6,747,288 pursuant to such contracts, these contracts mature between 0 to 13 months. As a result, the group has accounted Rs 8,861 as derivative loss and Rs 643 as derivative gain for the year ended March 31, 2003 and 2002, respectively. Accordingly, the group has accounted for Rs 8,218 as other current liabilities and Rs 643 as other current assets as at March 31, 2003 and 2002. 7. STOCKHOLDERS' EQUITY 7.1 Common stock The Group has only one class of common stock referred to herein as equity shares. 7.2 Voting Each holder of equity shares is entitled to one vote per share. 7.3 Dividends Final dividends proposed by the Board of Directors are payable when formally approved by the shareholders, who have the right to decrease but not increase the amount of the dividend recommended by the Board of Directors. With respect to equity shares issued by the Company during a particular fiscal year, cash dividends declared and paid for such fiscal year generally will be prorated from the date of issuance to the end of such fiscal year. The Company accrues for dividend upon obtaining shareholders
10
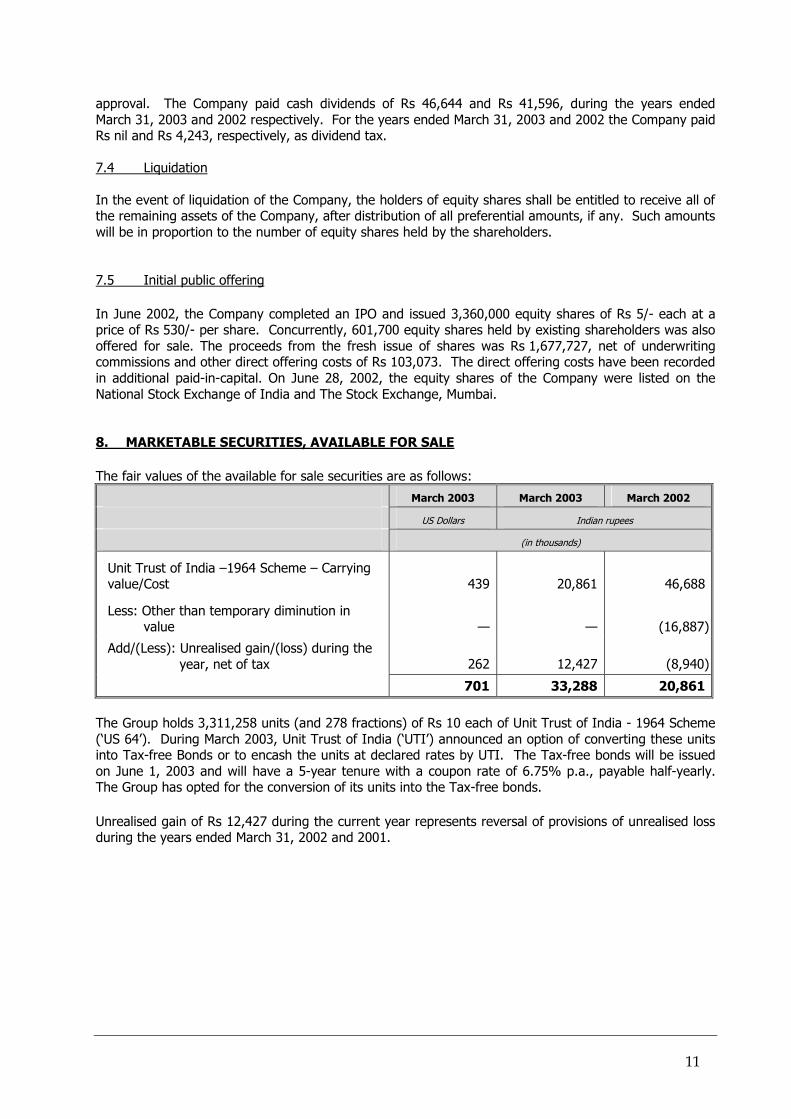
approval. The Company paid cash dividends of Rs 46,644 and Rs 41,596, during the years ended March 31, 2003 and 2002 respectively. For the years ended March 31, 2003 and 2002 the Company paid Rs nil and Rs 4,243, respectively, as dividend tax. 7.4 Liquidation In the event of liquidation of the Company, the holders of equity shares shall be entitled to receive all of the remaining assets of the Company, after distribution of all preferential amounts, if any. Such amounts will be in proportion to the number of equity shares held by the shareholders. 7.5 Initial public offering In June 2002, the Company completed an IPO and issued 3,360,000 equity shares of Rs 5/- each at a price of Rs 530/- per share. Concurrently, 601,700 equity shares held by existing shareholders was also offered for sale. The proceeds from the fresh issue of shares was Rs 1,677,727, net of underwriting commissions and other direct offering costs of Rs 103,073. The direct offering costs have been recorded in additional paid-in-capital. On June 28, 2002, the equity shares of the Company were listed on the National Stock Exchange of India and The Stock Exchange, Mumbai. 8. MARKETABLE SECURITIES, AVAILABLE FOR SALE The fair values of the available for sale securities are as follows:
March 2003 March 2003 March 2002
US Dollars Indian rupees
(in thousands)
Unit Trust of India –1964 Scheme – Carrying value/Cost 439 20,861 46,688
Less: Other than temporary diminution in value — — (16,887)
Add/(Less): Unrealised gain/(loss) during the year, net of tax 262 12,427 (8,940)
701 33,288 20,861 The Group holds 3,311,258 units (and 278 fractions) of Rs 10 each of Unit Trust of India - 1964 Scheme (‘US 64’). During March 2003, Unit Trust of India (‘UTI’) announced an option of converting these units into Tax-free Bonds or to encash the units at declared rates by UTI. The Tax-free bonds will be issued on June 1, 2003 and will have a 5-year tenure with a coupon rate of 6.75% p.a., payable half-yearly. The Group has opted for the conversion of its units into the Tax-free bonds. Unrealised gain of Rs 12,427 during the current year represents reversal of provisions of unrealised loss during the years ended March 31, 2002 and 2001.
11

9. OTHER INVESTMENTS Other investments comprise:
March 2003 March 2003 March 2002
US Dollars Indian rupees
(in thousands)
Unquoted equity Securities
EBZ Online Private Limited (‘EBZ’) 948 45,000 45,000
Eastern Software Systems Limited (‘ESSL’) 156 7,406 9,875
1,104 52,406 54,875
Held to maturity debt securities
12.75% KEONICS Mahithi Bonds Series –1 421 20,000 20,000
JM High Liquidity Fund - Serial Plan 2004 (Growth) 5,265 250,000 —
National Saving Certificates 3 131 —
6,793 322,537 74,875 The Company’s ownership interest in EBZ and ESSL is 19.5 percent and 6.62 percent , respectively. The nature of business of each of these companies is as follows:
EBZ is a strategic partnership between Brihans Technologies Private Limited (‘BTPL’) and the Company to integrate the selected and adapted software provided under Group’s products with BTPL’s products for Co-operative banking sector in India.
��
��
ESSL is primarily engaged in catering to the needs of small businesses through its flagship product, ‘ebizframe’. During the year ended March 31, 2003, the company accepted the buy-back offer from ESSL for 89,428 shares. As a result the ownership interest has reduced from 6.65 per cent to 6.62 per cent. The Group made a profit of Rs 35 on the acceptance of buy-back offer which has been recognised as part of Other income.
The Group does not exert significant influence directly/indirectly on the operations of EBZ and ESSL by way of representation on the Board of Directors, participation in policy-making processes, material inter company transactions, interchange of managerial personnel or technological dependency. Accordingly these investments are valued at cost less any decline in fair value below original cost when considered to be other than temporary. Investments in debt securities of 12.75% KEONICS Mahithi Bonds Series -1 allotted on February 1, 2001 are non-convertible redeemable at par at the end of seven years from the date of allotment. As per the terms of the securities, the Group has a put and call option at par at the end of five years from the date of allotment. During March 2003 the group has invested Rs 250 million in JM High Liquidity - Serial Plan 4 which will mature on April 15, 2004. 10. INVESTMENTS IN EQUITY INVESTEES DotEx is a 51:49 joint venture between NSE.IT Limited, a wholly owned subsidiary of The National Stock Exchange of India Limited (‘NSE’) and the Company for setting up a Broker Plaza enabling brokers and their clients to transact in stock/securities markets through the internet.
12

Flexcel is a 40:40:20 joint venture with the Company, HDFC Bank Limited and Lord Krishna Bank Limited to provide the Group’s products through an Application Service Provider (‘ASP’) model to various banks and financial institutions in India.
March 2003 March 2003 March 2002
US Dollars Indian rupees
(in thousands)
Original Cost
DotEx 1,187 56,350 49,000
Flexcel 436 20,680 98
Add: Advance against shares given to Flexcel — — 29,620
Add: Gain on dilution of equity in Flexcel 60 2,847 —
Less: Group's share of accumulated losses in
DotEx (1,187) (56,350) (45,402)
Flexcel (333) (15,789) (9,482)
163 7,738 23,834 The analysis of the carrying amount of investments and the earnings of the investee included in net income is as follows:
March 2003 March 2003 March 2002
US Dollars Indian rupees (in thousands)
Share of net assets
DotEx — — 3,598
Flexcel 163 7,738 10,172
Advance against share capital paid to Flexcel in excess of committed share — —
10,064
163 7,738 23,834
Carrying value
DotEx — — 3,598
Flexcel 163 7,738 20,236
163 7,738 23,834
Share of (loss) of equity investee
DotEx (245) (11,617) (30,562)
Flexcel (133) (6,307) (9,482)
(378) (17,924) (40,044)
(Loss) included in net income
DotEx (245) (11,617) (30,562)
Flexcel (133) (6,307) (9,482)
(378) (17,924) (40,044)
13
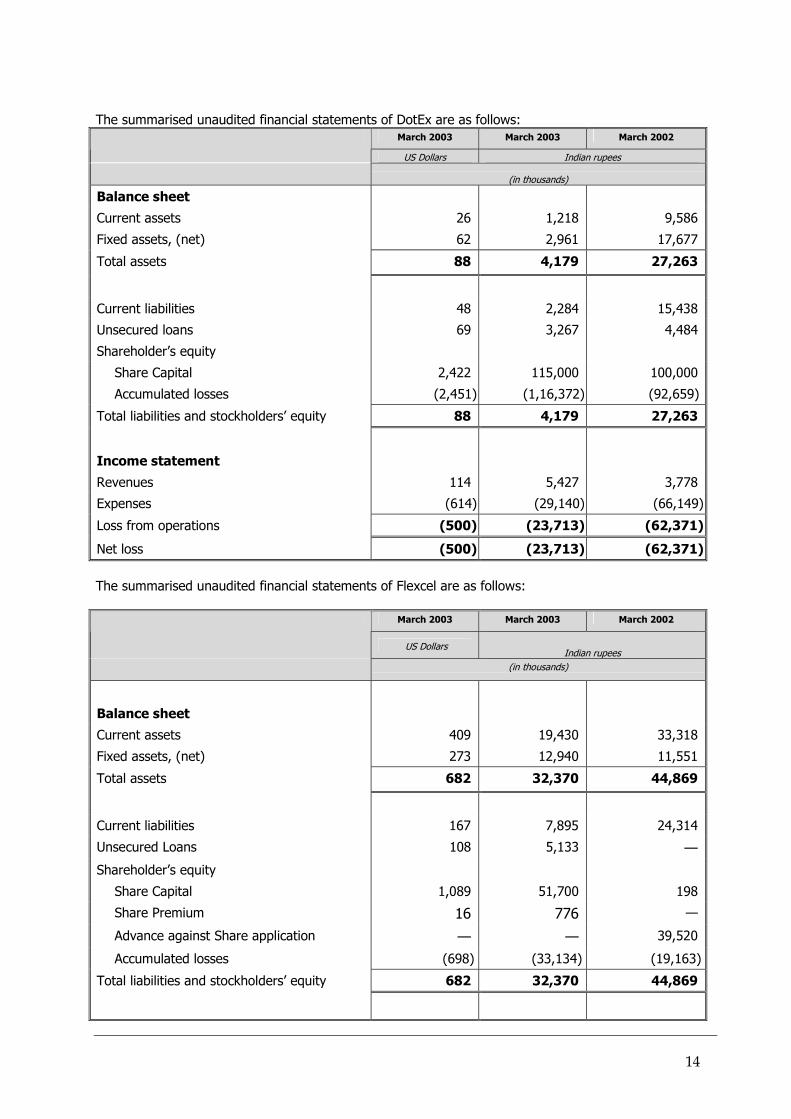
The summarised unaudited financial statements of DotEx are as follows:
March 2003 March 2003 March 2002
US Dollars Indian rupees
(in thousands)
Balance sheet
Current assets 26 1,218 9,586
Fixed assets, (net) 62 2,961 17,677
Total assets 88 4,179 27,263
Current liabilities 48 2,284 15,438
Unsecured loans 69 3,267 4,484
Shareholder’s equity
Share Capital 2,422 115,000 100,000
Accumulated losses (2,451) (1,16,372) (92,659)
Total liabilities and stockholders’ equity 88 4,179 27,263
Income statement
Revenues 114 5,427 3,778
Expenses (614) (29,140) (66,149)
Loss from operations (500) (23,713) (62,371)
Net loss (500) (23,713) (62,371) The summarised unaudited financial statements of Flexcel are as follows:
March 2003 March 2003 March 2002
US Dollars
Indian rupees
(in thousands)
Balance sheet
Current assets 409 19,430 33,318
Fixed assets, (net) 273 12,940 11,551
Total assets 682 32,370 44,869
Current liabilities 167 7,895 24,314
Unsecured Loans 108 5,133 —
Shareholder’s equity
Share Capital 1,089 51,700 198
Share Premium 16 776 —
Advance against Share application — — 39,520
Accumulated losses (698) (33,134) (19,163)
Total liabilities and stockholders’ equity 682 32,370 44,869
14

Income statement
Revenues 93 4,432 542
Expenses (387) (18,402) (19,706)
Loss from operations (294) (13,970) (19,164)
Net loss (294) (13,970) (19,164) 11. OTHER CURRENT LIABILITIES Other current liabilities primarily comprise of:
March 2003 March 2003 March 2002
US Dollars Indian rupees
(in thousands)
Communication expenses 217 10,301 11,291
Travelling expenses 641 30,418 47,394
Professional fees 1,730 82,128 22,681
Embedded derivatives 173 8,219 —
Other liabilities 1,262 59,937 30,219
4,023 191,003 111,585
15
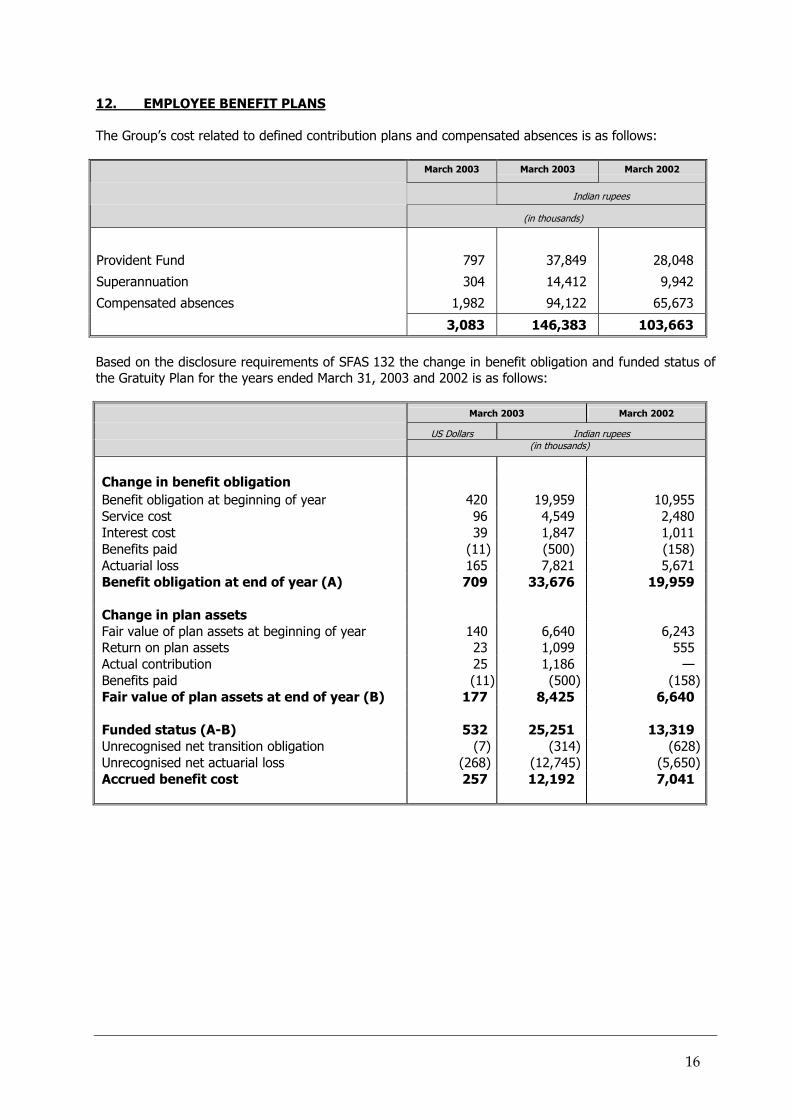
12. EMPLOYEE BENEFIT PLANS The Group’s cost related to defined contribution plans and compensated absences is as follows:
March 2003 March 2003 March 2002
US Dollars Indian rupees
(in thousands)
Provident Fund 797 37,849 28,048
Superannuation 304 14,412 9,942
Compensated absences 1,982 94,122 65,673
3,083 146,383 103,663
Based on the disclosure requirements of SFAS 132 the change in benefit obligation and funded status of the Gratuity Plan for the years ended March 31, 2003 and 2002 is as follows:
March 2003 March 2002
US Dollars Indian rupees
(in thousands)
Change in benefit obligation Benefit obligation at beginning of year 420 19,959 10,955 Service cost 96 4,549 2,480 Interest cost 39 1,847 1,011 Benefits paid (11) (500) (158) Actuarial loss 165 7,821 5,671 Benefit obligation at end of year (A) 709 33,676 19,959 Change in plan assets Fair value of plan assets at beginning of year 140 6,640 6,243 Return on plan assets 23 1,099 555 Actual contribution 25 1,186 — Benefits paid (11) (500) (158)Fair value of plan assets at end of year (B) 177 8,425 6,640
Funded status (A-B) 532 25,251 13,319 Unrecognised net transition obligation (7) (314) (628)Unrecognised net actuarial loss (268) (12,745) (5,650)Accrued benefit cost 257 12,192 7,041
16

Net gratuity cost for the years ended March 31, 2003 and 2002 comprises of the following components:
March 2003 March 2002
US Dollars Indian rupees
(in thousands)
Components of net yearly benefit cost Service cost 96 4,549 2,480Interest cost 39 1,847 1,011Expected return on plan assets (13) (596) (534)Amortisation of Transition liabilities 7 314 314Recognised net actuarial loss 4 223 — Net yearly benefit cost 133 6,337 3,271
The assumptions used in accounting for the gratuity plan for the year ended March 31, 2003 are set out below:
March 2003 March 2002
% %
Discount rate 8.00 9.50
Expected return on plan assets 8.50 9.00
Rate of compensation increase 5.00 5.00
The Company evaluates these assumptions based on its long-term plans of growth and industry standards. 13. OTHER INCOME/(EXPENSE) Other income/(expense) comprises of the following:
March 2003 March 2003 March 2002
US Dollars Indian rupees
(in thousands)
Foreign exchange gain/(loss), net (774) (36,750) 32,782
Dividend — — 3,311
Profit/(Loss) on sale of investment 1 35 (1,500)
Miscellaneous income 28 1,320 14
(745) (35,395) 34,607
17
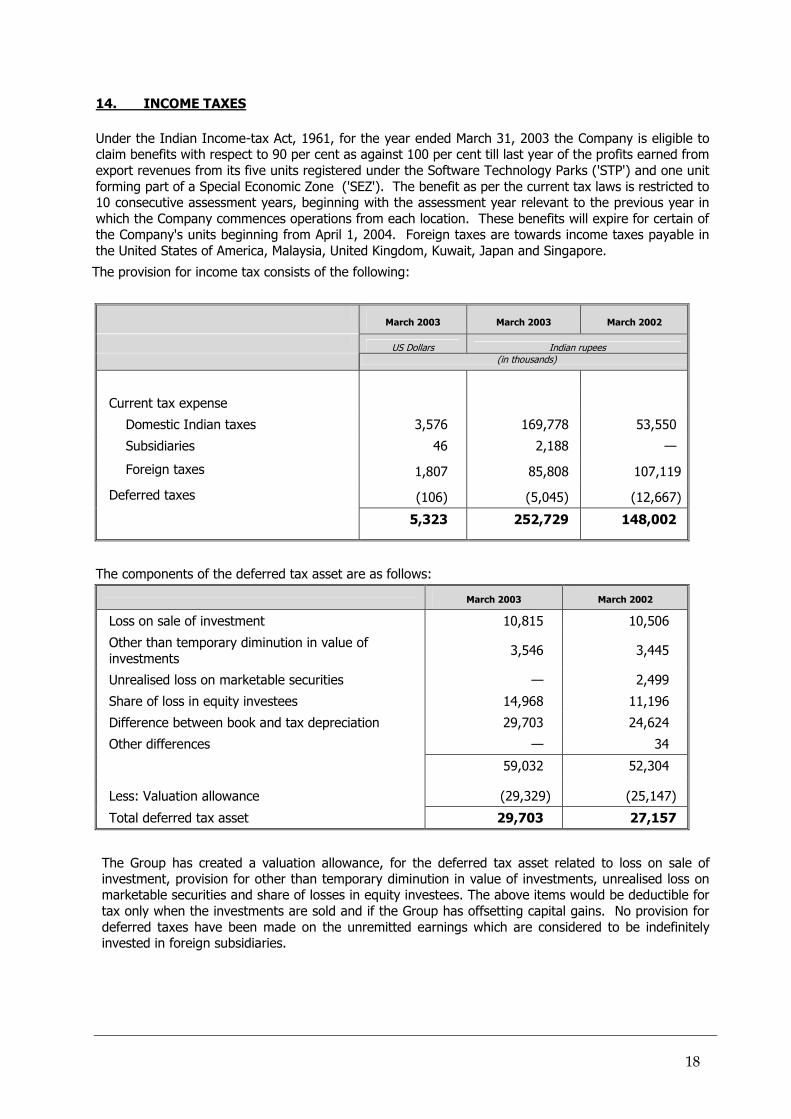
14. INCOME TAXES Under the Indian Income-tax Act, 1961, for the year ended March 31, 2003 the Company is eligible to claim benefits with respect to 90 per cent as against 100 per cent till last year of the profits earned from export revenues from its five units registered under the Software Technology Parks ('STP') and one unit forming part of a Special Economic Zone ('SEZ'). The benefit as per the current tax laws is restricted to 10 consecutive assessment years, beginning with the assessment year relevant to the previous year in which the Company commences operations from each location. These benefits will expire for certain of the Company's units beginning from April 1, 2004. Foreign taxes are towards income taxes payable in the United States of America, Malaysia, United Kingdom, Kuwait, Japan and Singapore.
The provision for income tax consists of the following:
March 2003 March 2003 March 2002
US Dollars Indian rupees
(in thousands)
Current tax expense
Domestic Indian taxes 3,576 169,778 53,550
Subsidiaries 46 2,188 —
Foreign taxes 1,807 85,808 107,119
Deferred taxes (106) (5,045) (12,667)
5,323 252,729 148,002
The components of the deferred tax asset are as follows: March 2003 March 2002
Loss on sale of investment 10,815 10,506
Other than temporary diminution in value of investments
3,546 3,445
Unrealised loss on marketable securities — 2,499
Share of loss in equity investees 14,968 11,196
Difference between book and tax depreciation 29,703 24,624
Other differences — 34
59,032 52,304
Less: Valuation allowance (29,329) (25,147)
Total deferred tax asset 29,703 27,157
The Group has created a valuation allowance, for the deferred tax asset related to loss on sale of investment, provision for other than temporary diminution in value of investments, unrealised loss on marketable securities and share of losses in equity investees. The above items would be deductible for tax only when the investments are sold and if the Group has offsetting capital gains. No provision for deferred taxes have been made on the unremitted earnings which are considered to be indefinitely invested in foreign subsidiaries.
18

The following is a reconciliation of the statutory tax rate under the Indian Income-tax Act, 1961 and the Group's effective tax rate:
March 2003 March 2003 March 2002
US Dollars Indian rupees
(in thousands)
Accounting profit 42,616 2,023,399 1,184,012
Enacted tax rate % 36.75% 36.75% 35.70%
Computed tax expense 15,661 743,600 422,692
Tax effect on exempt profit/income (12,513) (594,137) (455,820)
Difference in tax rate between Indian and Foreign taxes (62) (2,945) —
Incremental taxes paid in foreign jurisdictions 1,807 85,808 107,119
Taxes on dividend paid — — 4,243
Impact of change in tax rates 22 1,038 10,578
Tax effect on loss of subsidiaries 414 19,670 36,656
Double taxation relief (94) (4,467) —
Valuation allowance 88 4,182 22,795
Others — (20) (261)
Income tax expense, net 5,323 252,729 148,002
The total deferred tax asset has been presented in the balance sheet as follows:
March 2003 March 2003 March 2002
US Dollars Indian rupees
(in thousands)
Current deferred tax asset — — 2,533
Non current deferred tax asset 626 29,703 24,624
626 29,703 27,157
19

15. LEASES The Group takes vehicles under capital lease upto five years. Future minimum lease payments under capital leases as at March 31, 2003 are as follows:
March 31, 2002 US Dollars Indian rupees
(in thousands)
2004 132 6,249
2005 94 4,467
2006 51 2,419
2007 21 1,025
2008 1 68
Total minimum payments 299 14,228
Less: Amount representing future interest (56) (2,681)
Present value of minimum payments 243 11,547
Less: Current portion of capital lease obligation (101) (4,786)
Long term capital lease obligation 142 6,761 The Group has taken certain office premises, residential premises and vehicles for employees under operating lease, which expire at various dates through to 2011. Gross rental expense for the years ended March 31, 2003 and year ended March 31, 2002 was Rs 120,794 and Rs 99,393, respectively. The minimum rental payments to be made in future in respect of these leases:
March 31, 2003 US Dollars Indian rupees
(in thousands)
2004 2,018 95,811
2005 1,154 54,794
2006 560 26,575
2007 557 26,463
2008 467 22,153
Thereafter till 2011 1,175 55,811
20
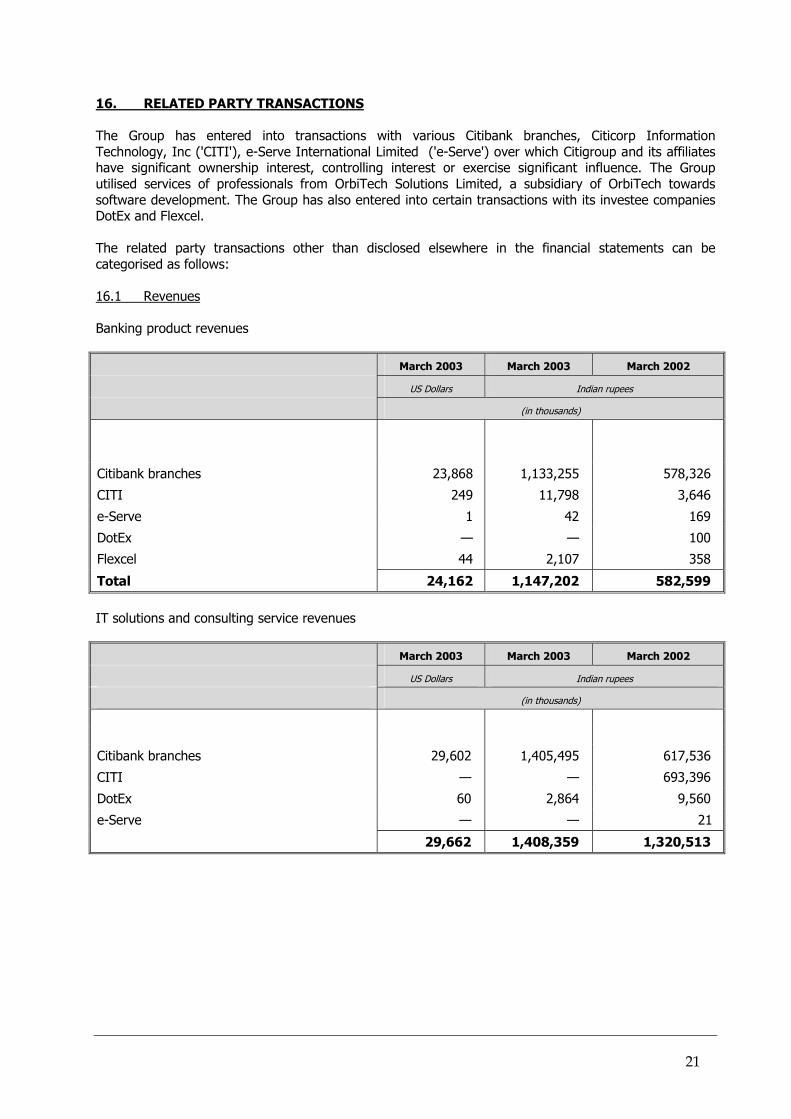
16. RELATED PARTY TRANSACTIONS The Group has entered into transactions with various Citibank branches, Citicorp Information Technology, Inc ('CITI'), e-Serve International Limited ('e-Serve') over which Citigroup and its affiliates have significant ownership interest, controlling interest or exercise significant influence. The Group utilised services of professionals from OrbiTech Solutions Limited, a subsidiary of OrbiTech towards software development. The Group has also entered into certain transactions with its investee companies DotEx and Flexcel. The related party transactions other than disclosed elsewhere in the financial statements can be categorised as follows: 16.1 Revenues Banking product revenues
March 2003 March 2003 March 2002
US Dollars Indian rupees
(in thousands)
Citibank branches 23,868 1,133,255 578,326
CITI 249 11,798 3,646
e-Serve 1 42 169
DotEx — — 100
Flexcel 44 2,107 358
Total 24,162 1,147,202 582,599 IT solutions and consulting service revenues
March 2003 March 2003 March 2002
US Dollars Indian rupees
(in thousands)
Citibank branches 29,602 1,405,495 617,536
CITI — — 693,396
DotEx 60 2,864 9,560
e-Serve — — 21
29,662 1,408,359 1,320,513
21

16.2 Expenses
March 2003 March 2003 March 2002
US Dollars Indian rupees
(in thousands)
Communication expenses paid to Citibank branches
923
43,811
—
Finance lease payments to e-Serve (Interest) 32 1,532 2,630
Professional fees paid to OrbiTech Solutions Limited for software development
36 1,696 25,155
Professional fees payments to Flexcel 34 1,619 —
Provision for doubtful debts for Citibank branches (26) (1,221) 1,221
Bank charges paid to Citibank branches 57 2,729 1,852
1,056 50,166 30,858 16.3 Assets Trade receivables
March 2003 March 2003 March 2002
US Dollars Indian rupees
(in thousands)
Citibank branches
net of provision for doubtful debts Rs Nil (March 2002 –1,221 and March 2003 – Rs NIL)
12,913
613,088
618,835
CITI 693 32,919 276,761
DotEx 33 1,574 6,999
Flexcel 74 3,529 385
e-Serve — — —
13,713 651,110 902,980 Loans outstanding
March 2003 March 2003 March 2002
US Dollars Indian rupees
(in thousands)
i-flex ESPS Trust 5,643 267,926 291,649
Key managerial personnel 84 4,000 4,844
5,727 271,926 296,493
22

Repayment of loan during the year
March 2003 March 2003 March 2002
US Dollars Indian rupees
(in thousands)
i-flex ESPS Trust 500 23,723 8,549
Key managerial personnel 18 844 1,703
518 24,567 10,252 Bank balance with Citibank branches
March 2003 March 2003 March 2002
US Dollars Indian rupees
(in thousands)
Current accounts 25,961 1,232,622 437,286
Time deposits 3,051 144,877 139,800
29,012 1,377,499 577,086 Interest accrued on fixed deposits
March 2003 March 2003 March 2002
US Dollars Indian rupees
(in thousands)
Citibank branches 10 454 361
16.4 Liabilities Amount due to related parties
March 2003 March 2003 March 2002
US Dollars Indian rupees
(in thousands)
e-Serve towards lease obligations repayable (Principal and interest) 163 7,727 14,896
OrbiTech Solutions Limited towards professional fees — — 1,427
163 7,727 16,323
23

Payment of lease obligations
March 2003 March 2003 March 2002
US Dollars Indian rupees
(in thousands)
e-Serve (Principal) 105 4,963 4,506
105 4,963 4,506 Deferred revenue from related parties
March 2003 March 2003 March 2002
US Dollars Indian rupees
(in thousands)
Citibank branches 39 1,869 88,145
e-Serve — — 42
39 1,869 88,187 17. SEGMENTAL INFORMATION The Group has adopted SFAS No. 131, “Disclosures about Segments of an Enterprises and Related Information”, which requires reporting information about operating segments in annual financial statements. It has also established standards for related disclosures about products and services, and geographic areas. Operating segments are defined as components of an enterprise about which separate financial information is available. This information is reviewed and evaluated regularly by the management, in deciding how to allocate resources and in assessing the performance. The Group is organised geographically and by business segment. For the management purpose the Group is primarily organised on a worldwide basis into two business segments: �� Product licenses and related activities; and �� IT solutions and consulting services The segments are the basis on which the Group reports its primary segment information to the management. The Product license segment has banking products like FLEXCUBE suite of products and Microbanker which cater to needs of corporate, retail and investment banking as well as treasury operations and data warehousing requirements. The related activities include enhancements, implementation and maintenance activities. IT solutions and consulting services comprise of bespoke software development, computer software solutions and related consulting services arising from such activities. This segment is further sub-divided in the following sub-segments i.e. Business intelligence, Customer relationship management, Brokerage, e-commerce, Internet services and IT and business consulting. Revenue is generated through licensing of software products as well as by providing software solutions to the customers including consultancy. The expenses, which are not attributable to a business segment, are shown as unallocated expenses. Cost of revenues comprise of all direct cost towards employee cost, travel cost of software professionals, Professional fees to software vendors and application software cost used for internal use. These costs are direct costs for each segment.
24
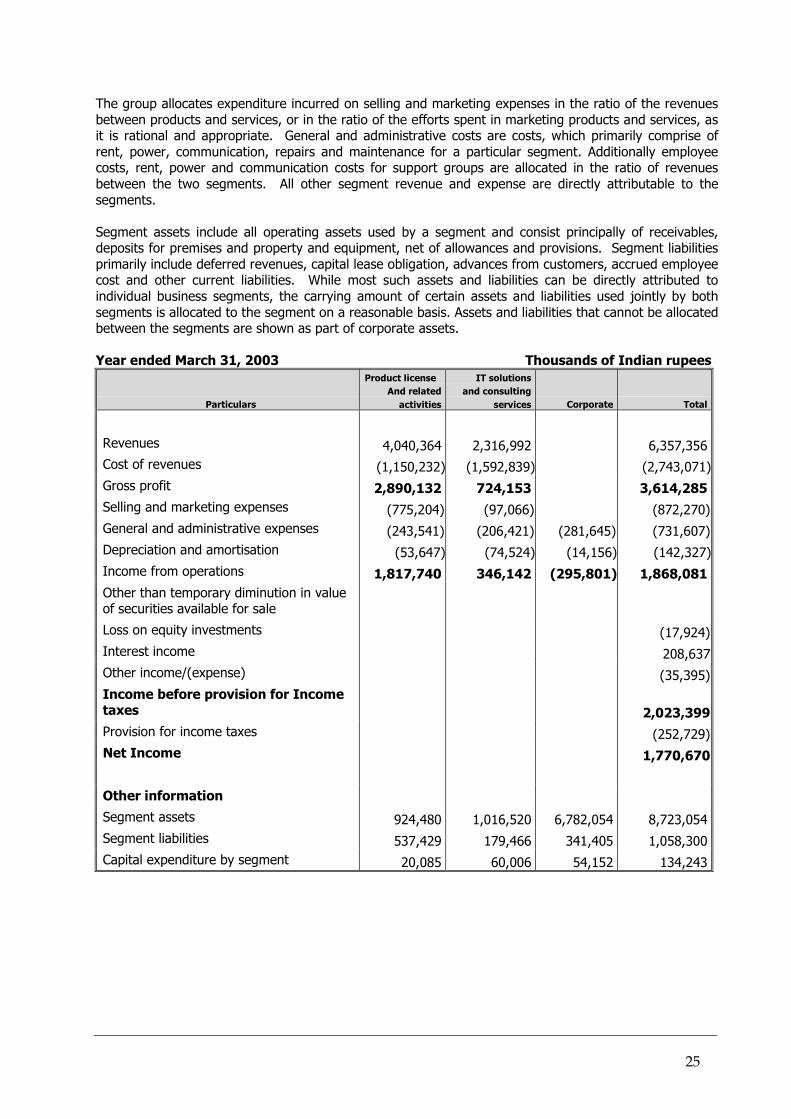
The group allocates expenditure incurred on selling and marketing expenses in the ratio of the revenues between products and services, or in the ratio of the efforts spent in marketing products and services, as it is rational and appropriate. General and administrative costs are costs, which primarily comprise of rent, power, communication, repairs and maintenance for a particular segment. Additionally employee costs, rent, power and communication costs for support groups are allocated in the ratio of revenues between the two segments. All other segment revenue and expense are directly attributable to the segments. Segment assets include all operating assets used by a segment and consist principally of receivables, deposits for premises and property and equipment, net of allowances and provisions. Segment liabilities primarily include deferred revenues, capital lease obligation, advances from customers, accrued employee cost and other current liabilities. While most such assets and liabilities can be directly attributed to individual business segments, the carrying amount of certain assets and liabilities used jointly by both segments is allocated to the segment on a reasonable basis. Assets and liabilities that cannot be allocated between the segments are shown as part of corporate assets. Year ended March 31, 2003 Thousands of Indian rupees
Particulars
Product license And related
activities
IT solutionsand consulting
services Corporate Total
Revenues 4,040,364 2,316,992 6,357,356Cost of revenues (1,150,232) (1,592,839) (2,743,071)Gross profit 2,890,132 724,153 3,614,285Selling and marketing expenses (775,204) (97,066) (872,270)General and administrative expenses (243,541) (206,421) (281,645) (731,607)Depreciation and amortisation (53,647) (74,524) (14,156) (142,327)Income from operations 1,817,740 346,142 (295,801) 1,868,081Other than temporary diminution in value of securities available for sale Loss on equity investments (17,924)Interest income 208,637Other income/(expense) (35,395)Income before provision for Income taxes 2,023,399Provision for income taxes (252,729)Net Income 1,770,670
Other information
Segment assets 924,480 1,016,520 6,782,054 8,723,054Segment liabilities 537,429 179,466 341,405 1,058,300Capital expenditure by segment 20,085 60,006 54,152 134,243
25

Year ended March 31, 2003 Thousands of US dollars
Particulars
Product license and related
activities
IT solutionsand consulting
services Corporate Total
Revenues 85,096 48,799 — 133,895
Cost of revenues (24,225) (33,548) — (57,773)Gross profit 60,871 15,251 — 76,122
Selling and marketing expenses (16,327) (2,044) — (18,371)General and administrative expenses (5,129) (4,348) (5,932) (15,409)Depreciation and amortisation (1,130) (1,570) (298) (2,998)Income from operations 38,285 7,289 (6,230) 39,344
Other than temporary diminution in value of securities available for sale
Loss on equity investments (378)Interest income 4,395Other income/(expense) (745)Income before provision for Income taxes 42,616Provision for income taxes (5,323)
Net income 37,293
Other information
Segment assets 19,471 21,409 142,841 183,721
Segment liabilities 11,319 3,780 7,190 22,289
Capital expenditure by segment 423 1,264 1,141 2,828
26

Year ended March 31, 2002 Thousands of Indian rupees
Particulars
Product license And related
activities
IT solutions and consulting
services Corporate Total
Revenues 2,614,393 1,742,782 — 4,357,175Cost of revenues (836,935) (1,072,476) — (1,909,411)Gross profit 1,777,458 670,306 — 2,447,764Selling and marketing expenses (559,932) (43,227) — (603,159)General and administrative expenses (173,064) (147,415) (243,566) (564,045)Depreciation and amortisation (49,296) (78,061) (13,111) (140,468)Income from operations 995,166 401,603 (256,677) 1,140,092Other than temporary diminution in value of securities available for sale (16,887)Loss on equity investments (40,044)Interest income 66,244Other income, net 34,607Income before provision for Income taxes 1,184,012Provision for income taxes (148,002)Net income 1,036,010
Other information
Segment assets 1,326,768 1,179,260 2,614,730 5,120,758Segment liabilities 477,119 117,356 266,058 860,533Capital expenditure by segment 51,465 122,269 66,287 240,021
27

Geographical segments: The following table shows the distribution of the Group’s consolidated sales by geographical market:
March 2003 March 2003 March 2002
US Dollars Indian rupees
(in thousands)
United States of America 50,935 2,418,378 1,378,167
Middle East and Africa 31,663 1,503,369 1,096,343
Asia Pacific 25,056 1,189,671 959,710
Europe 25,253 1,199,001 897,662
Latin America and Caribbean 988 46,937 25,293
133,895 6,357,356 4,357,175
Region March 2003 March 2002
Percentage
United States of America 38 32
Middle East and Africa 24 25
Asia Pacific 19 21
Europe 18 21
Latin America and Caribbean 1 1
100 100 The Group derives more than 10 per cent of its revenues from the following customer:
March 2003 March 2003 March 2002 US Dollars Indian rupees
(in thousands)
Customer 1, related party 53,718 2,550,548 1,892,904
28

18. COMMITMENTS AND CONTINGENCIES 18.1 Capital expenditure The Group had committed to spend as at March 31, 2003 and 2002 approximately Rs 507,642 and Rs 140,186, respectively under agreements to purchase property and equipment. 18.2 Guarantees The Group accounts for loss contingencies when the likelihood of the underlying adverse event occurring is probable and the loss can be reasonably estimated. Guarantees provided by banks on behalf of the Group amounted to Rs 11,205 and Rs. 20,302 at March 31, 2003 and 2002, respectively. The guarantees were provided to various Indian Government agencies and a few customers and prospects. In the event of default the fair value of the guarantee will approximate the outstanding payments due under accrued rates and taxes and accrued expenses. The Group has concluded that the risk of the guarantee being called is remote, and accordingly, no provision has been made. 18.3 Other commitments i-flex’s operations are carried out from five units registered under the Software Technology Parks (‘STP’) scheme and one unit forming part of Special Economic Zone (‘SEZ’) in India. Under these schemes the registered units have export obligations, which are based on the formula provided by the notifications/circulars issued by the STP and SEZ authorities from time to time. The consequence of not meeting the above commitments would be a retroactive levy of import duty on items previously imported duty free for these units. Additionally the respective authorities have rights to levy penalties for any defaults on a case-by-case basis. Management believes that it would meet the required export obligations. 18.4 Contingencies The Dutch authorities have alleged violation of immigration and taxation rules by i-flex BV in the Netherlands. i-flex BV has not received any written communication from the authorities yet. If such communication is received, the Company shall defend itself vigorously. The determination of the liability, if any, is not possible at this point. 19. STOCK BASED COMPENSATION 19.1 Employee Stock Purchase Scheme (‘ESPS’) On March 29, 1998 the Company adopted the ESPS to provide equity-based incentives to key employees of the Company ('1998 Scheme'). Subsequently on April 1, 1999, April 1, 2000 and April 1, 2001, the Company adopted another Stock based schemes ('1999 Scheme’, ‘2000 Scheme’ and '2001 Scheme'). These schemes, which have similar terms, are administered through a Trust ('the Trust'). The Trust purchases shares of the Company using the proceeds of loans obtained from the Company. Such shares are offered by the Trust to employees at an exercise price, which approximates the fair value on the date of the grant. The employees can purchase the shares in a phased manner over a period of five years based on continued employment, until which, the Trust holds the shares for the benefit of the employees. The employee will be entitled to receive dividends, bonus, etc that may be declared by the Company from time to time for the entire portion of shares held by the Trust on behalf of the employees.
29
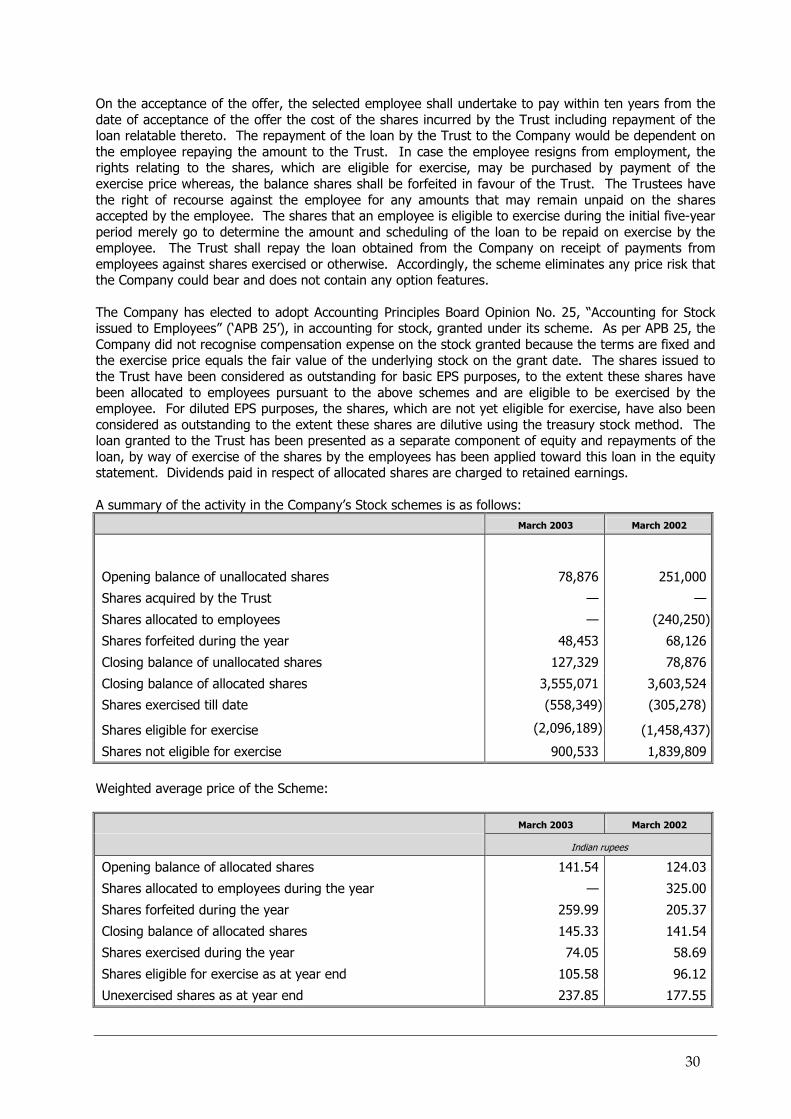
On the acceptance of the offer, the selected employee shall undertake to pay within ten years from the date of acceptance of the offer the cost of the shares incurred by the Trust including repayment of the loan relatable thereto. The repayment of the loan by the Trust to the Company would be dependent on the employee repaying the amount to the Trust. In case the employee resigns from employment, the rights relating to the shares, which are eligible for exercise, may be purchased by payment of the exercise price whereas, the balance shares shall be forfeited in favour of the Trust. The Trustees have the right of recourse against the employee for any amounts that may remain unpaid on the shares accepted by the employee. The shares that an employee is eligible to exercise during the initial five-year period merely go to determine the amount and scheduling of the loan to be repaid on exercise by the employee. The Trust shall repay the loan obtained from the Company on receipt of payments from employees against shares exercised or otherwise. Accordingly, the scheme eliminates any price risk that the Company could bear and does not contain any option features. The Company has elected to adopt Accounting Principles Board Opinion No. 25, “Accounting for Stock issued to Employees” (‘APB 25’), in accounting for stock, granted under its scheme. As per APB 25, the Company did not recognise compensation expense on the stock granted because the terms are fixed and the exercise price equals the fair value of the underlying stock on the grant date. The shares issued to the Trust have been considered as outstanding for basic EPS purposes, to the extent these shares have been allocated to employees pursuant to the above schemes and are eligible to be exercised by the employee. For diluted EPS purposes, the shares, which are not yet eligible for exercise, have also been considered as outstanding to the extent these shares are dilutive using the treasury stock method. The loan granted to the Trust has been presented as a separate component of equity and repayments of the loan, by way of exercise of the shares by the employees has been applied toward this loan in the equity statement. Dividends paid in respect of allocated shares are charged to retained earnings. A summary of the activity in the Company’s Stock schemes is as follows: March 2003 March 2002
Opening balance of unallocated shares 78,876 251,000
Shares acquired by the Trust — —
Shares allocated to employees — (240,250)
Shares forfeited during the year 48,453 68,126
Closing balance of unallocated shares 127,329 78,876
Closing balance of allocated shares 3,555,071 3,603,524
Shares exercised till date (558,349) (305,278)
Shares eligible for exercise (2,096,189) (1,458,437)
Shares not eligible for exercise 900,533 1,839,809
Weighted average price of the Scheme: March 2003 March 2002
Indian rupees
Opening balance of allocated shares 141.54 124.03
Shares allocated to employees during the year — 325.00
Shares forfeited during the year 259.99 205.37
Closing balance of allocated shares 145.33 141.54
Shares exercised during the year 74.05 58.69
Shares eligible for exercise as at year end 105.58 96.12
Unexercised shares as at year end 237.85 177.55
30

Number of shares and weighted average price stated above has been computed after giving effect of split of shares as referred in Note 2.2(c). As the shares granted to the employees vest upon the employee accepting the offer, the fair value of the shares granted to the employee computed in accordance with SFAS 123 would not differ significantly from the intrinsic value of the shares as determined in accordance with APB 25. 19.2 Employee Stock Option Plan (‘ESOP’) At the Annual General Meeting of the shareholders of the Company held on August 14, 2001, the Company introduced an additional ESOP, pursuant to which equity shares not exceeding an additional 7.5 per cent of the issued and paid-up equity share capital of the Company have been earmarked for grant, at any given time to present and future employees and directors of the Company and its existing and future subsidiaries. Pursuant to the above resolution, the Board of Directors, at their meeting held on March 4, 2002 approved the Employees Stock Option Scheme (‘the Scheme’) for issue of 2,376,800 options to the employees and directors of the Company. According to the ESOP the Company has granted 2,274,460 options to the eligible employees and directors of the Company and its subsidiaries at an exercise price, which will equate the issue price determined through the book-building procedure. 20 per cent of the total options granted under the Scheme will vest to the eligible employees and directors on the completion of 12, 24, 36, 48 and 60 months and is subject to the continued employment of the employee or director with the Company or its subsidiaries. As per the terms of the Scheme, the exercise price would equate the price determined for the IPO through book building process for the options granted prior to the IPO and at the fair market value on the date of grant for options granted thereafter. The Group applied APB Opinion 25 and related Interpretations in accounting for this plan. In accordance with APB Opinion 25, no compensation cost would need to be recognised for the Employee Stock Option Plan as the exercise price would equal to the fair value of value of the shares on the date of the IPO. The Company completed its IPO in June 2002 and fixed its IPO price through book building scheme at Rs 530. As per the terms of the plan the IPO price would be the exercise price for the ESOP.
A summary of the activity in the Group’s ESOP is as follows:
No of options Weighted
average price No of options March 2003 March 2002
Outstanding at beginning of year 2,274,460 530.00 —
Granted during the year 40,000 868.30 2,274,460
Exercised during the year — — —
Forfeited during the year 64,760 530.00 —
Outstanding at end of year 2,249,700 536.02 2,274,460
The weighted average prices during the year ended March 31, 2002 have not been given since the price of the options was determined at the time of the completion of IPO in June 2002.
31

20. EARNINGS PER SHARE The following is a reconciliation of the weighted average number of equity shares used in the computation of basic and diluted earnings per equity share:
March 2003 March 2002
Weighted average number of common shares used for basic EPS purposes
35,505,072 31,409,803
Dilutive component of shares that are not eligible for exercise 1,302,077 1,337,260
Weighted average number of common shares used for diluted EPS purposes
36,807,149 32,747,063
Number of shares stated above has been computed after giving effect of split of shares as referred in Note 2.2(c). Basic EPS does not include shares considered by the Company as outstanding but held by the ESPS Trust. Shares that are not eligible for exercise are treated as dilutive. 21. CONTRACT ACQUISITION COSTS On December 3, 2002 the Group acquired two IT consulting service contracts and 51 employees working on these contracts from Silverline Technologies Limited and its subsidiary, Silverline Technologies Inc. (“Silverline Group”) for a total consideration of Rs 35,176, which includes a cash payment made to/behalf of the Silverline Group and the assumption of certain employee related liabilities of the Silverline Group. The contract acquisition costs are be amortized into Cost of Revenues on a straight line basis over the remaining contract term of 11 months. Accordingly, Rs 12,788 was amortized and included in Cost of Revenues for the year ended March 31, 2003 and the remaining Deferred contract acquisition costs of Rs 22,388 is included in other current assets.
32