vale usgaap 3t09i gaap 3q09 returning to growth performance of vale in 3q09 rio de janeiro, october...
TRANSCRIPT

1
US GAAP
3Q09
RETURNING TO GROWTH
Performance of Vale in 3Q09 Rio de Janeiro, October 28, 2009 – Vale S.A. (Vale) announces a strong operational and financial performance in the third quarter of 2009 (3Q09), returning to growth after the impact of the global financial shock. The improved performance reflects the underlying earnings power arising from our world-class assets and strategic positioning, our efforts to weather the global downturn and the broadening of the current economic recovery. Vale continues to pursue sustainable shareholder value creation, implementing the growth strategy with discipline in capital allocation, consistent with a long-term vision of the mining business. Main highlights and metrics of 3Q09 performance:
• Shipments of iron ore and pellets totaled 72.930 million metric tons, a 35.5% increase on a quarter-on-quarter basis.
• Operating revenue of US$ 6.9 billion, 35.6% more than the US$ 5.1 billion in 2Q09. Year-to-date (Ytd) revenue reached US$ 17.4 billion.
• Operational profit, as measured by adjusted EBIT(a) (earnings before interest and taxes), of US$ 2.3 billion, 134.9% above 2Q09. Ytd adjusted EBIT was US$ 5.0 billion.
• Operational margin, as measured by adjusted EBIT margin, of 34.2%, recovering from the 19.7% figure for 2Q09.
• Cash generation, as measured by adjusted EBITDA(b) (earnings before interest, taxes, depreciation and amortization), increased to US$ 3.0 billion in 3Q09 from US$ 1.7 billion in 2Q09. Ytd adjusted EBITDA reached US$ 7.0 billion.
• Net earnings of US$ 1.7 billion, equal to US$ 0.31 per share on a fully diluted basis, against US$ 790 million in 2Q09. Ytd net earnings totaled US$ 3.8 billion.
• Dividend of US$ 1.5 billion to be paid from October 30, 2009. Total dividend distribution of US$ 2.75 billion in 2009, in line with the US$ 2.85 billion dividend in 2008, a year of record cash generation.
• Investment reached US$ 8.9 billion in the first nine months of 2009 (9M09). US$ 6.0 billion was spent in sustaining capital, research and development and project execution, and US$ 2.9 billion in acquisitions.
• Investment of US$ 567 million in corporate social responsibility in 9M09, of which US$ 413 million was allocated to environmental protection and conservation and US$ 154 million to social projects.
BOVESPA: VALE3, VALE5
NYSE: VALE, VALE.P
EURONEXT PARIS: VALE3, VALE5
LATIBEX: XVALO, XVALP
www.vale.com [email protected]
Department of Investor
Relations
Roberto Castello Branco Alessandra Gadelha
Patricia Calazans Samantha Pons Theo Penedo
Phone: (5521) 3814-4540

US GAAP 3Q09
2
Table 1 - SELECTED FINANCIAL INDICATORS 3Q08 2Q09 3Q09 % % US$ million
(A) (B) (C) (C/A) (C/B) Operating revenues 12,122 5,084 6,893 -43.1 35.6 Adjusted EBIT 5,535 976 2,293 -58.6 134.9 Adjusted EBIT margin (%) 47.2 19.7 34.2 Adjusted EBITDA 6,374 1,725 3,014 -52.7 74.7 Net earnings 4,821 790 1,677 -65.2 112.3 Earnings per share (US$) 0.96 0.15 0.32 -66.4 112.3 Earnings per share fully diluted basis(US$) 0.94 0.15 0.31 -66.8 109.7 ROE (%) 28.3 15.9 8.8 Total debt/ adjusted LTM EBITDA (x) 1.0 1.5 2.2 Capex (excluding acquisitions) 2,718 2,080 2,170 -20.2 4.3 Except where otherwise indicated the operational and financial information in this release is based on the consolidated figures in accordance with US GAAP and, with the exception of information on investments and behavior of markets, quarterly financial statements are reviewed by the company’s independent auditors. The main subsidiaries that are consolidated are the following: Vale Inco, MBR, Cadam, PPSA, Alunorte, Albras, Valesul, Vale Manganês S.A., Vale Manganèse France, Vale Manganese Norway AS, Urucum Mineração S.A., Ferrovia Centro-Atlântica (FCA), Vale Australia, Vale International and CVRD Overseas.

US GAAP 3Q09
3
INDEX
RETURNING TO GROWTH 1
Table 1 - SELECTED FINANCIAL INDICATORS............................................................ 2
BUSINESS OUTLOOK ............................................................................................................ 4
REVENUES ............................................................................................................................... 7
Table 2 - GROSS REVENUE BY PRODUCT..................................................................... 8
Table 3 - GROSS REVENUE BY DESTINATION............................................................. 8
COSTS........................................................................................................................................ 9
Table 4 - COST OF GOODS SOLD..................................................................................... 11
OPERATING PROFIT............................................................................................................. 11
NET EARNINGS....................................................................................................................... 11
CASH GENERATION.............................................................................................................. 12
Table 5 - ADJUSTED EBITDA BY BUSINESS AREA...................................................... 13
Table 6 - QUARTERLY ADJUSTED EBITDA................................................................... 13
DEBT INDICATORS................................................................................................................ 13
Table 7 - DEBT INDICATORS............................................................................................ 14
INVESTMENTS........................................................................................................................ 14
Table 8 – TOTAL INVESTMENT BY CATEGORY .......................................................... 15
Table 9 – TOTAL INVESTMENT BY BUSINESS AREA ................................................. 16
PERFORMANCE OF THE BUSINESS SEGMENTS .......................................................... 17
Table 10 – FERROUS MINERALS BUSINESS PERFORMANCE ................................... 19
Table 11 – NON FERROUS MINERALS BUSINESS PERFORMANCE.......................... 21
Table 12 – COAL BUSINESS PERFORMANCE................................................................ 22
Table 13 – LOGISTCS SERVICES BUSINESS PERFORMANCE.................................... 23
FINANCIAL INDICATORS OF NON-CONSOLIDATED COMPANIES........................ 23
CONFERENCE CALL AND WEBCAST .............................................................................. 23
ANNEX 1 – FINANCIAL STATEMENTS ............................................................................. 24
Table 14 - INCOME STATEMENTS................................................................................... 24
Table 15 - FINANCIAL RESULT........................................................................................ 24
Table 16 - EQUITY INCOME BY BUSINESS SEGMENT................................................ 24
Table 17 - BALANCE SHEET ............................................................................................. 25
Table 18 – CASH FLOW...................................................................................................... 26
ANNEX 2 – VOLUMES SOLD, PRICES, MARGINS AND CASH FLOWS ..................... 27
Table 19 - VOLUMES SOLD: MINERALS AND METALS.............................................. 27
Table 20 - AVERAGE SALE PRICE ................................................................................... 27
Table 21 - ADJUSTED EBIT MARGIN BY BUSINESS SEGMENT ................................ 27
Table 22 - ADJUSTED EBITDA BY BUSINESS SEGMENT............................................ 27
ANNEX 3 – RECONCILIATION OF US GAAP and “NON-GAAP” INFORMATION... 28

US GAAP 3Q09
4
BUSINESS OUTLOOK
The global recession is coming to an end, with recovery taking place earlier and at a stronger pace than previously expected. According to IMF estimates, the global economy rose by 3% during 2Q09 following a 6.5% contraction in the first quarter. The flow of high-frequency data suggests that global GDP continued to expand in 3Q09 and the nascent recovery is very likely to be sustained over the next few quarters. Although bank corporate credit is still retrenched in some countries, including in the US, the behavior of financial markets since the end of the first quarter is playing an important role in the recovery. The massive supply of liquidity provided by the main central banks, the return of confidence leading to declining risk aversion, and the anticipation of economic recovery have spurred financial asset re-pricing as well as a rebound in international capital flows. The strong demand for equities has laid the groundwork for a rising volume of transactions, both initial public offerings and follow-ons. Simultaneously, debt issuance in global capital markets is booming: accumulated USD and Euro denominated bond issuance has already surpassed the record level of 2007, suggesting that debt markets are partially replacing banks as suppliers of funds to corporates. Therefore, the renaissance of global capital markets following the difficult days of 4Q08 is creating a positive feedback loop to economic activity. Initially fuelled by a turn in the inventory cycle - produced by a decreasing sales/inventory ratio - global manufacturing output has bounced back since April, 2009. Simultaneously to the re-stocking cycle there was a stabilization of final sales - followed by early signals of increase – and a firm rise in new orders relative to inventories, reaching a five-year peak in August, thereby pointing to the continuation of the recovery. Against this backdrop, emerging economies have withstood the global financial shock much better than expected from the past experience. As the global economy is starting a synchronized recovery, emerging economies are further ahead on the road to recovery, with the rebound being primarily driven by China, India, Indonesia, other Asian emerging economies and Brazil. Anticipating this trend, emerging markets also led the rally in global equity prices. Given the leading role of manufacturing output growth and emerging market economies in driving the current economic recovery, a strong expansion in the demand for minerals and metals has ensued, arising not only from re-stocking but also from the need to meet final demand increase. Emerging economies are the largest consumers of minerals and metals1 and their demand for metals is more income elastic than in mature developed economies. As of consequence of these developments, metal prices rallied from March to July, setting the fastest and the highest increase compared to the global recessions of the last 40 years. For example, in this cycle nickel prices hiked by 80% from their trough, October 2008, to the end of September 2009, while the average increase in previous recoveries from recessions was only 13%. Iron ore prices in the spot market staged a 53% increase from trough, November 2008, to September 302, 2009. Once metal prices reacted to the positive news about economic recovery, they then remained range bound over the last three months and further upward volatility in the short-term will depend on the strength of the recovery. If global economic activity continues to accelerate, there is a high probability of a renewed wave of metal price increases. On the other hand, we believe that downside risks to the sustainability of the recovery have gradually diminished. The main source of risk stems from a premature reversal of the current stance of monetary policies. However, the probability of such mistakes seems to be relatively low, given the knowledge and 1 In 2008, emerging economies were responsible for 46% of the global consumption of nickel, 59.2% of aluminum and 61.2% of copper. China alone had a share of 53.8% in the iron ore seaborne trade. 2 As the spot market for iron ore is a relatively recent phenomenon there is no data to compare with previous recoveries from recessions.
US GAAP 3Q09
5
experience accumulated by central banks and the higher focus on higher-frequency data and real time policy evaluation. At this point, we expect that the acceleration phase of the global recovery - highlighted by the two-digit marginal growth rates of industrial production and GDP of emerging Asia - will be replaced by a more moderate pace of expansion. High-growth in manufacturing output is likely to decelerate to more sustainable rates while at the same time growth takes place in the US and Europe. The transition to a more broadly based growth of economic activity is the key for sustaining a synchronized expansion through next year. The US economy, which was the epicenter of the global financial shock, is likely to have reached a trough at the end of 2Q09 and is poised to recover in this second half of the year, in spite of the high and still rising unemployment rate. Being the largest economy in the world and the largest importer of goods and services, the US recovery is of paramount importance to the sustainability of global growth. The US real estate market is stabilizing, with prices seeming to have bottomed and slight increases in housing starts. The household saving rate responded to wealth losses and has risen to the highest level of the last five years. Both moves are very important as residential construction and consumption expenditures had negatively impacted economic growth over the last few quarters. At the same time, the depreciation of the US dollar contributes to enhance external demand, adding strength to aggregate demand. China, the largest emerging market economy and by far the chief driver of minerals and metals consumption growth, posted 10% quarterly seasonally adjusted annualized GDP growth in 3Q09. Robust domestic demand performance has been the underlying force in Chinese expansion, explained by the acceleration of fixed asset investment – both public and private - and resilient consumption expenditure. Expansion seems to be gaining momentum, being no longer entirely dependent on government spending. There is a move towards the broadening of growth sources to consumption and private sector investment, as well as exports. Exports are still showing year-on-year double digit declines, but on a sequential basis are starting to increase, tending to swing to a modest positive contribution to demand growth from strongly negative. Domestic demand expansion has led to a rebound in imports, generating a positive spillover into equipment and commodity exporters in Asia and South America, such as Japan, South Korea, Indonesia, Brazil, Chile and Peru. One of the key features of recent Chinese economic performance is the rebound of property construction – residential and commercial – after a large fall last year. This change gave rise to a substantial resurgence of steel consumption, in a movement that has been supported also by government infrastructure spending and record auto production. The strength of steel demand and the substitution of domestic iron ore, determined by high production costs and poor quality, explain the very large amount of iron ore imports in the first nine months of the year, reaching 633 million metric tons on a seasonally adjusted annualized basis, with a 33% year-on-year increase. We expect the demand for imported iron ore into China to remain strong due to the steel demand fundamentals and the lack of competitiveness of local iron ore production. Global crude steel output grew in 3Q09 by 13.9% over 2Q09 on a seasonally adjusted basis, in its second quarterly increase after declining by 2.1% in 1Q09 and 18.8% in 4Q08. As the recovery in industrial production is broadening, carbon steel output is recovering at a brisk pace in regions of the world where it was running much below nominal capacity. On a seasonally adjusted basis, in 3Q09 quarterly seasonally adjusted growth was 20.2% in Europe, 27.6% in Japan and 33.1% in Brazil. The end of a period of consumption of iron ore inventories and the growth of steel production in the Americas, Europe and non-China Asia are adding pressure to the demand for iron ore, benefiting mostly Vale due to its very large production capacity and global sales reach.

US GAAP 3Q09
6
Given the expectations of a sustainable recovery of economic activity, global steel consumption is estimated by the World Steel Organization to increase by 9.2% in 2010, returning to the pre-crisis level of 1.2 billion metric tons after plunging from 3Q08 to 2Q09. Global stainless steel production has risen for the second quarter in a row in 3Q09, increasing by 28.5% on a quarterly seasonally adjusted basis, after four consecutive quarters of decline. There was some improvement in the US - where melting had recovered to average levels of 2006/2007 - and Europe, while the industry in China, Taiwan, South Korea and Japan was operating at high levels of capacity. In addition, scrap supply has remained tight. Thus, even in the face of an increasing production of nickel pig iron and a weak demand from non-stainless steel applications – where high nickel alloys and alloy steels were the main sources of weakness - nickel prices have hovered around US$ 18,500 per metric ton over the last three months. After at blistering 3Q09, demand for nickel in Asia is suffering from the effects of an inventory mini-cycle. There was some stainless steel stockpiling in China, Taiwan and South Korea, which led some mills making temporary stoppages for maintenance. In addition, Chinese mills have reduced capacity utilization to 80-85% from the full swing operation in 3Q09. As a consequence of the deceleration of China´s demand, Japanese stainless steel exports slowed down, affecting its demand for nickel. It is worthwhile noticing that inventory mini-cycles are temporary events that do not have the power to reverse medium-term trends and usually happen during expansionary cycles. Based on a long-term view of the market fundamentals for minerals and metals and rigorous discipline in capital allocation, Vale has invested US$ 60 billion from 2003 to 2009, creating significant shareholder value. Over the last ten years, Vale was positioned as number four among the top 25 sustainable shareholder value creators in the world and number one among basic materials companies3, a stellar performance. As we strongly believe that the global recession has not affected long-term market fundamentals, we will continue to pursue growth and sustainable value creation through investment in a fairly large number of organic growth options. Rapidly growing emerging economies tend to make large investments in housing, infrastructure and industrialization, which are intensive consumers of minerals and metals. Real income growth from low levels leads to significant changes in consumption patterns, resulting in a much larger demand for consumer durables, metal intensive goods.
At the same time, increasing per capita income in emerging economies produces diet changes towards a larger intake of protein, thus stimulating the demand for fertilizer nutrients, key ingredients for grain crops.
In a long-term perspective, emerging economies tend to grow faster than developed mature economies to make their per capita incomes converge over time to the levels reached by the wealthiest economies. Convergence is primarily determined by the higher rates of return on physical and human capital, the faster increase of the labor force and the stronger productivity growth in emerging economies.
As a matter of fact, convergence has been taking place throughout the post-World War II period, being more pronounced in the 60´s and 70´s and more recently, from the late 90´s until now. Unless there is a major deterioration in the quality of macroeconomic policies, we expect convergence to continue for the foreseeable future, with emerging economies continuing to play a key role in the demand for minerals and metals.
The prospects for minerals and metals demand depend increasingly on growth in emerging economies, given their large shares in global consumption. This is particularly important to the extent that they tend, as we have pointed out, to grow faster than developed economies. Moreover, the demand for minerals and metals in emerging economies is more elastic to real income increase. At the same time, new technologies focused 3 Please see “Searching for sustainability”, The Boston Consulting Group, October 2009.

US GAAP 3Q09
7
on the rise of non-climate changing sources of energy are likely to add further pressure on the demand for minerals and metals. In order to continue to exploit profitable growth opportunities, our Board of Directors has approved for 2010 capital expenditures of US$ 12.9 billion dedicated to sustaining existing operations and to fostering growth through research and development (R&D) and project execution.
The investment plan continues to reflect the focus on organic growth as the priority of our growth strategy: 76.6% of the budget is allocated to finance R&D and greenfield and brownfield project execution against an average of 71.1% over the last five years.
Given the existing assets and those which will come on stream in the near future we expect to maintain production growing at a brisk pace. Our output index, which encompasses the operational performance of all minerals and metals produced by Vale, is estimated to increase at an annual average rate of 12.6% in 2010-2014, a higher rate of expansion than the already high 11.2% per annum for 2003-2008.
Although iron ore and nickel will continue to be our main businesses, we plan to boost the production capacity of copper, coal and fertilizers, creating a more diversified portfolio of world-class assets. Given the current project pipeline, we expect to reach the following production flows in 2014: 450 million metric tons of iron ore, 380,000 metric tons of nickel, 650,000 metric tons of copper, 30 million metric tons of coal, 3.1 million metric tons of potash and 6.6 million metric tons of phosphate rock4.
To enhance the competitiveness of our operations, we will continue to invest a sizeable amount of funds in our railroads, maritime terminals, shipping and power generation.
REVENUES In 3Q09, our operating revenues totaled US$ 6.893 billion, 35.6% greater than the US$ 5.084 billion reached in 2Q09. In the first nine months of this year, revenue was US$ 17.398 billion against US$ 31.067 billion in the same period of 2008.
Rising prices contributed with US$ 1.153 billion – 64% – to the revenue increase of US$ 1.809 billion over 2Q09, while sales volume growth added US$ 656 million. Major contributors were: (a) iron ore and pellet shipments, US$ 938 million; (b) iron ore and pellet prices, US$ 696 million; and (c) non-ferrous minerals prices, US$ 401 million. Lower volumes of non-ferrous minerals shipments caused a decrease of US$ 319 million in our revenues, of which US$ 222 million and US$ 97 million were related to lower nickel and by-products sales volumes, respectively. Due to the strike in Sudbury and Voisey´s Bay there was a fall in the production of nickel, copper, cobalt, platinum group metals (PGMs) and gold. Sales of ferrous minerals represented 63.4% of this quarter's operating revenue, as against 28.9% for non-ferrous minerals. Logistics services reached 4.6% and coal 2.0%. Sales to Europe increased their share to 17.7% of total revenues in 3Q09 from 13.1% in 2Q09, which is explained by the rise of iron ore and pellet shipments to the region. Asia continued to be the main destination of our sales, although its share declined to 56.4% in 3Q09 from 58.1% in the previous quarter. The Americas were responsible for 24.2% of total revenues and the rest of the world 1.7%. On a country basis, China is the leading market, responsible for 37.3% of our revenues, Brazil 15.5%, Japan 9.8%, Germany 4.2%, South Korea 3.8% and the USA 3.7%.
4 Unexpected changes in demand and involuntary delays in project development can cause signification deviations from the production targets.

US GAAP 3Q09
8
Table 2 - OPERATING REVENUE BREAKDOWN
US$ million 3Q08 % 2Q09 % 3Q09 % Ferrous minerals 8,130 67.1 2,716 53.4 4,370 63.4 Iron ore 6,175 50.9 2,423 47.7 3,821 55.4 Pellets 1,399 11.5 176 3.5 412 6.0 Manganese ore 119 1.0 43 0.8 23 0.3 Ferroalloys 330 2.7 69 1.4 93 1.3 Pellet plant operation services 13 0.1 3 0.1 5 0.1 Others 94 0.8 2 - 16 0.2 Non-ferrous minerals 3,245 26.8 1,909 37.6 1,991 28.9 Nickel 1,358 11.2 916 18.0 963 14.0 Copper 630 5.2 271 5.3 295 4.3 Kaolin 57 0.5 42 0.8 43 0.6 Potash 103 0.8 121 2.4 118 1.7 PGMs 120 1.0 54 1.1 28 0.4 Precious metals 32 0.3 26 0.5 4 0.1 Cobalt 56 0.5 12 0.2 10 0.1 Aluminum 456 3.8 193 3.8 207 3.0 Alumina 425 3.5 275 5.4 322 4.7 Bauxite 8 0.1 - - 1 - Coal 203 1.7 96 1.9 138 2.0 Logistics services 472 3.9 280 5.5 318 4.6 Railroads 386 3.2 223 4.4 239 3.5 Ports 86 0.7 57 1.1 79 1.1 Others 72 0.6 83 1.6 76 1.1 Total 12,122 100.0 5,084 100.0 6,893 100.0
Table 3 - OPERATING REVENUE BY DESTINATION US$ million 3Q08 % 2Q09 % 3Q09 % North America 1,028 8.5 513 10.1 451 6.5 USA 657 5.4 198 3.9 253 3.7 Canada 328 2.7 315 6.2 193 2.8 Others 43 0.4 - - 5.0 0.1 South America 2,628 21.7 839 16.5 1,215 17.6 Brazil 2,292 18.9 802 15.8 1,068 15.5 Others 336 2.8 37 0.7 147 2.1 Asia 5,017 41.4 2,952 58.1 3,885 56.4 China 2,482 20.5 2,018 39.7 2,574 37.3 Japan 1,310 10.8 378 7.4 674 9.8 South Korea 390 3.2 165 3.2 261 3.8 Taiwan 276 2.3 193 3.8 191 2.8 Others 559 4.6 198 3.9 185 2.7 Europe 3,015 24.9 665 13.1 1,222 17.7 Germany 887 7.3 130 2.6 292 4.2 Belgium 313 2.6 85 1.7 74 1.1 France 297 2.5 41 0.8 129 1.9 UK 343 2.8 149 2.9 84 1.2 Italy 136 1.1 43 0.8 68 1.0 Others 1,039 8.6 217 4.3 575 8.3 Rest of the World 434 3.6 115 2.3 120 1.7 Total 12,122 100.0 5,084 100.0 6,893 100.0

US GAAP 3Q09
9
COSTS
Cost of goods sold (COGS) totaled US$ 3.591 billion in 3Q09, showing a 14.5% increase relatively to 2Q09, at US$ 3.135 billion.
A major part of the quarterly cost increase of US$ 456 million - 53.9% - was due to the expansion of our sales volumes, while the depreciation of the US dollar5 added US$ 245 million to COGS. We expect the currencies of countries where most of our operations are based - the Brazilian real, the Canadian dollar, the Australian dollar and the Indonesian rupiah - to remain strong against the US dollar in the near future. Our cost cutting efforts resulted in a US$ 34 million reduction.
In 3Q09, the cost of materials accounted for 21.4% of COGS, being the largest component. These expenses amounted to US$ 769 million, against US$ 660 million in 2Q09. Currency price changes and higher sales volumes contributed to increase costs by US$ 61 million and US$ 49 million, respectively.
The main materials items were: spare parts and maintenance equipment, US$ 282 million (vs. US$ 222 million in 2Q09), inputs, US$ 285 million (vs. US$ 274 million in 2Q09), tires and conveyor belts, US$ 46 million (vs. US$ 34 million in 2Q09).
Expenses with energy consumption reached US$ 596 million, accounting for 16.6% of COGS. These expenses increased by US$ 135 million compared to 2Q09, being the largest contributor to the higher COGS.
Fuel and gases costs reached US$ 371 million, a US$ 92 million increase compared to 2Q09. US$ 39 million was due to the increase of our activities, US$ 27 million to higher fuel and gases prices and US$ 26 million to the depreciation of the US dollar.
The cost of electricity was US$ 225 million against US$ 182 million in 2Q09, representing a 23.6% quarter-on-quarter increase. Higher consumption contributed with US$ 19 million, currency price changes with US$ 13 million, and higher tariffs with US$ 11 million.
Costs for outsourced services, making up 16.5% of COGS, totaled US$ 591 million in 3Q09, compared to US$ 519 million in 2Q09. The cost increase was caused by higher sales volumes (US$ 50 million) and the US dollar depreciation (US$ 40 million). On the other hand, lower average service prices reduced expenses by US$ 18 million.
The main outsourced services are: (a) cargo freight, which accounted for US$ 195 million (vs. US$ 179 million in 2Q09); (b) maintenance of equipment and facilities, US$ 125 million (vs. US$ 102 million in 2Q09); and (c) operational services, US$ 143 million (vs. US$ 138 million in 2Q09), which include US$ 40 million for ore and waste removal.
Expenses with railroad freight increased to US$ 138 million from US$ 112 million in 2Q09, due to greater iron ore shipments from the Southern System mines. Differently to the Northern and Southeastern Systems where Vale owns and operates an integrated mine-railroad-port structure, in the Southeastern System, MRS, a non-consolidated affiliated logistics company, carries iron ore and pellets to our wholly-owned and operated maritime terminals, Guaíba Island and Itaguaí.
Costs with maritime freight services – mainly involving the shipping of bauxite from Trombetas to Barcarena – totaled US$ 34 million and expenses with truck transportation services amounted to US$ 22 million. It is worthwhile noting that these costs do not include freight expenses with iron ore shipping to Asia, which are deducted from gross revenues.
Personnel expenses reached US$ 497 million, representing 13.8% of COGS. The increase of US$ 48 million relatively to 2Q09 reflected higher sales volume (US$ 77 million) and exchange rate changes (US$ 33 million) that were offset by the US$ 62 million in savings related to our restructuring plan.
5 COGS currency exposure in 3Q09 was made up as follows: 67% in Brazilian reais, 15% in Canadian dollars, 13% in US dollars, 2% in Indonesian rupiah and 3% in other currencies.
US GAAP 3Q09
10
The cost of purchasing products from third parties amounted to US$ 152 million – 4.2% of COGS – against US$ 153 million in 2Q09. The reduction of nickel products purchases (US$ 49 million) more than offset the increase in purchases of iron ore and pellets (US$ 27 million) and aluminum products (US$ 14 million).
The cost of purchasing iron ore and pellets was US$ 32 million, against US$ 5 million in 2Q09 and US$ 43 million in 1Q09. The volume of iron ore bought from smaller miners came to 620,000 metric tons in 3Q09 compared with 273,000 metric tons in 2Q09 and 962,000 metric tons in 1Q09. The acquisition of pellets from joint ventures amounted to 240,000 metric tons in this quarter; there was no acquisition of pellets from our joint ventures in the last two quarters. The increase of purchases from third parties is related to the higher sales levels, as this is a fast way to meet demand increase.
The purchase of nickel products reached US$ 31 million, against US$ 79 million in 2Q09. There was a substantial reduction – by one third - in the acquisition of intermediates, while there was a 26% increase in the purchase of finished nickel. Both trends are related to the stoppage of our Canadian operations in this quarter. Since the smelting operations in Sudbury are idle, we are not able to process intermediate products and, at the same time, there was a need to buy more finished product to comply with our sales contracts.
Purchases of aluminum totaled US$ 15 million this quarter, against none in the past, as Valesul has recently become a producer of billets for extrusion employing purchased aluminum ingots and scraps as its main raw materials.
Depreciation and amortization – 16.7% of COGS – amounted to US$ 598 million, against US$ 571 million in 2Q09, being negatively impacted by the effect of exchange rate variations.
The cost with shared services – which reflects the cost of our shared services organization to provide services to the rest of the company – reached US$ 68 million, increasing 23.6% over the 2Q09 level of US$ 55 million. The increase was due to the higher level of activities and to the depreciation of the US dollar.
Other operational costs reached US$ 320 million, compared to US$ 267 million in 2Q09. The increase is derived from the increase of lease payments for the Tubarão pellet plants, mining royalties and demurrage charges, which are related to the higher level of our operational activities in this quarter compared to the previous one.
In 3Q09, demurrage costs - fines paid for delays in loading ships at our maritime terminals - totaled US$ 22 million, equivalent to US$ 0.33 per metric ton of iron ore shipped, against US$ 8 million in the previous quarter, or US$ 0.17 per metric ton.
Sales, general and administrative expenses (SG&A) came to US$ 289 million, against US$ 230 million in the previous quarter. The quarter-over-quarter increase is mainly explained by the effect of the US dollar depreciation in our administrative costs and higher selling expenses. In addition, a positive copper price adjustment of US$ 17 million helped to reduce SG&A in 2Q09.
Research and development (R&D) expenses, which reflect our investment to create long-term growth opportunities, amounted to US$ 231 million6 in the quarter, compared to US$ 265 million invested in 2Q09 and US$ 189 million in 1Q09.
Other operational expenses reached US$ 302 million, against US$ 342 million in 2Q09 and US$ 317 million in 1Q09.
Expenses related to idle capacity and stoppage of operations totaled US$ 262 million against US$ 224 million in 2Q09. US$ 209 million of the 3Q09 expenses were due to the idling of Canadian nickel operations. The restart of some ferrous minerals operations, which led to a US$ 64 million decline in this expenses item, was more than offset by the stoppage of nickel operations in 3Q09, which added US$ 102 million.
6 This is an accounting figure. In the Investment section of this press release, we disclose a figure of US$ 265 million for research & development, computed in accordance with financial disbursements in 3Q09.

US GAAP 3Q09
11
In this quarter, the other operational expenses item was positively affected by US$ 131 million of non-recurring revenues, due to the recovery of provisional taxes related to spare parts and maintenance equipment.
Severance payments reached US$ 16 million, compared to US$ 25 million in 2Q09 and US$ 39 million in 1Q09.
Table 4 - COGS BREAKDOWN
US$ million 3Q08 % 2Q09 % 3Q09 % Outsourced services 828 16.2 519 16.6 591 16.5 Material 785 15.3 660 21.1 769 21.4 Energy 887 17.3 461 14.7 596 16.6 Fuel and gases 569 11.1 279 8.9 371 10.3 Electric energy 318 6.2 182 5.8 225 6.3 Acquisition of products 584 11.4 153 4.9 152 4.2 Iron ore and pellets 286 5.6 5 0.2 32 0.9 Aluminum products 99 1.9 63 2.0 77 2.1 Nickel products 189 3.7 79 2.5 31 0.9 Other products 10 0.2 6 0.2 12 0.3 Personnel 559 10.9 449 14.3 497 13.8 Depreciation and exhaustion 676 13.2 571 18.2 598 16.7 Shared services 63 1.2 55 1.8 68 1.9 Others 734 14.3 267 8.5 320 8.9 Total 5,116 100.0 3,135 100.0 3,591 100.0
OPERATING PROFIT In 3Q09, operating profit, as measured by adjusted EBIT, totaled US$ 2.293 billion, more than double the previous quarter figure, at US$ 976 million.
Year-to-date operating profit reached US$ 4.954 billion, against US$ 13.685 billion in same period of 2008.
The effects of higher sales prices (US$ 696 million) and shipment volumes (US$ 570 million) of iron ore and pellets and higher sales prices for non-ferrous minerals products (US$ 401 million) were partially offset by the negative impact of the weaker US dollar (US$ 395 million).
Adjusted EBIT margin was 34.2%, against 19.7% in 2Q09 and 31.6% in 1Q09. The widening of the operational margin was influenced by an across-the-board improvement of profitability, especially in the ferrous minerals business, in which the adjusted EBIT margin has increased by 1,320 basis points.
NET EARNINGS In 3Q09, net earnings reached US$ 1.677 billion, with a 112.3% increase related to the 2Q09 figure, at US$ 790 million. Earnings per share, on a fully diluted basis, were US$ 0.31.
In 9M09, net earnings came to US$ 3.830 billion, against US$ 11.851 billion in 9M08.
Earnings excluding income taxes amounted to US$ 2.603 billion, compared to US$ 2.414 billion in 2Q09. In this quarter the exchange rate variation produced an income tax burden of US$ 316 million, compared to US$ 1.279 billion in the previous quarter. The variation of the Brazilian real/US dollar exchange rate produced another direct effect on net earnings through foreign exchange and monetary variations. As the

US GAAP 3Q09
12
Brazilian real is our functional currency, its appreciation against the US dollar produced a positive impact of US$ 119 million in our net earnings7.
In 3Q09, financial revenues totaled US$ 98 million, US$ 5 million above the figure for 2Q09, at US$ 93 million, due to the increase in average cash holdings.
Financial expenses reached US$ 430 million, with a US$ 137 million increase compared to the previous quarter, of which US$ 121 million was related to the mark-to-market of the shareholders debentures.
In 3Q09, the net effect of the mark-to-market of the transactions with derivatives contributed to an increase of US$ 341 million in our accounting results, against US$ 873 million in 2Q09. These transactions produced a net positive cash flow impact of US$ 12 million.
The net result of the currency and interest rate swaps, structured mainly to convert the BRL-denominated debt into US dollar to protect our cash flow from exchange rate volatility, produced a positive effect of US$ 443 million in 3Q09, of which US$ 29 million generated a positive impact on the cash flow.
Our positions with nickel derivatives produced a negative charge of US$ 65 million in 3Q09 against net earnings, contributing to reduce our cash flow by US$ 45 million.
Derivative transactions related to bunker oil and freight costs, structured to minimize the volatility of the cost of maritime freight from Brazil to Asia, had a negative impact of US$ 36 million, but it had a positive cash effect of US$ 30 million.
In this quarter we sold some forest assets and stakes in some small non-ferrous minerals joint ventures, adding US$ 73 million to our net earnings as gain on sale of investments.
Equity income amounted to US$ 155 million, compared to US$ 135 million in 2Q09.
The non-consolidated affiliates in the ferrous minerals business contributed with 56.8% to the total, logistics 21.9%, coal 13.5%, non-ferrous minerals 6.5%, and steel 1.3%.
Individually, the greatest contributors to equity earnings were Samarco (US$ 110 million) and MRS (US$ 34 million).
CASH GENERATION Cash generation, as measured by the adjusted EBITDA, reached US$ 3.014 billion in 3Q09, 74.7% higher than the US$ 1.725 billion for 2Q09. The increase of US$ 1.289 billion was chiefly caused by the increment of US$ 1.317 billion in the operational profit, partially offset by the decline of US$ 106 million in the dividends received from non-consolidated affiliates. In 3Q09, no dividends were distributed by affiliated non-consolidated companies.
In 9M09, adjusted EBITDA totaled US$ 7.020 billion and in the last twelve-month period ended September 30, 2009, adjusted EBITDA reached US$ 9.717 billion.
Given the increase in iron ore and pellet prices and shipments, the ferrous minerals business increased its importance as a source of cash flow, coming from 84.6% in 2Q09 to 87.0% of the adjusted EBITDA in 3Q09. Non-ferrous minerals were responsible for 16.9% and logistics services for 3.9% of the adjusted EBITDA. Other businesses and expenditures with R&D reduced it by 7.8%.
7 From the beginning to the end of the 3Q09 period, the Brazilian real appreciated 9.8% against the US dollar.

US GAAP 3Q09
13
Table 5 - QUARTERLY ADJUSTED EBITDA
US$ million 3Q08 2Q09 3Q09 Net operating revenues 11,739 4,948 6,706 COGS -5,116 -3,135 -3,591 SG&A -374 -230 -289 Research and development -331 -265 -231 Other operational expenses -383 -342 -302 Adjusted EBIT 5,535 976 2,293 Depreciation, amortization & exhaustion 713 643 721 Dividends received 126 106 - Adjusted EBITDA 6,374 1,725 3,014
Table 6 - ADJUSTED EBITDA BY BUSINESS AREA US$ million 3Q08 2Q09 3Q09 Ferrous minerals 5,094 1,459 2,623 Non-ferrous minerals 1,342 413 508 Logistics 177 91 118 Coal 88 -7 -9 Others -327 -231 -226 Total 6,374 1,725 3,014
DEBT INDICATORS As of September 30, 2009, our total debt was US$ 21.166 billion, with an average maturity of 8.42 years and an average cost of 5.22% per year.
Net debt(c) on September 30, 2009, was US$ 8.146 billion, against US$ 8.301 billion on June 30, 2009.
As of September 30, 2009, cash holdings amounted to US$ 13.020 billion, including US$ 4.6 billion invested in liquid low-risk fixed income securities with maturities ranging from 91 to 360 days, averaging 121 days.
In July 2009, we issued mandatorily convertible notes due in 2012, with interest at 6.75% per year. Proceeds net of fees amounted to US$ 937 million. These hybrid securities are considered 100% equity and their issuance had no impact on our debt., only increasing our cash holdings.
In September 2009, we issued US$ 1.0 billion of a 10-year note due in 2019, with a coupon of 5 5/8% per year, a spread of 225 basis points over U.S. Treasuries and yield to maturity of 5.727%.
The mining industry is highly sensitive to economic cycles and is capital intensive. Given these two features, one of the focuses of our financial policy is to pursue low debt leverage during cyclical expansions, as in economic downturns the cyclical deceleration of cash flows can lead to high leverage ratios, with a potential to create serious financial constraints.
Debt leverage, as measured by total debt/LTM adjusted EBITDA(d) ratio, went up to 2.2x on September 30, 2009 from 1.5x on June 30, 2009. Although it has increased to a higher level than in the past, it is a comfortable situation at this point of the cycle, when economic recovery is still young, and in particular in light of our very large stock of liquid assets.
The total debt/enterprise value(e) ratio was 16.7% on September 30, 2009, against 19.9% on June 30, 2009.
Interest coverage, measured by the LTM adjusted EBITDA/LTM interest payment(f) ratio, decreased to 8.5x from 10.8x on June 30, 2009.

US GAAP 3Q09
14
Considering hedge positions, 36% of total debt on September 30, 2009, was linked to floating interest rates and 64% to fixed interest rates, while 98% was denominated in US dollars and the remainder in other currencies.
Table 7 - DEBT INDICATORS
US$ million 3Q08 2Q09 3Q09 Total debt 19,188 19,493 21,166 Net debt 3,928 8,301 8,146 Total debt / adjusted LTM EBITDA (x) 1.0 1.5 2.2 Adjusted LTM EBITDA / LTM interest expenses (x) 15.03 10.83 8.53 Total debt / EV (%) 18.52 19.87 16.70
INVESTMENTS In the third quarter of 2009, Vale carried out investments of US$ 2.170 billion. US$ 1.439 billion was dedicated to the development of projects, US$ 265 million to research and development (R&D) and US$ 466 million for sustaining existing operations.
In the first nine months of 2009, we invested US$ 5.964 billion, compared to US$ 6.725 billion in the same period of last year. Of the total disbursement in the year, 78% was allocated to financing growth: project execution and R&D.
In addition in this quarter, Vale spent US$ 1.495 billion in acquisitions. Acquisition expenditures amount to US$ 2.9 billion year-to-date.
We have concluded the all-cash acquisition of the Corumbá iron ore mining operations, located in the state of Mato Grosso do Sul, Brazil, for US$ 814 million. US$ 750 million was paid for the asset and the remaining US$ 64 million was due to working capital and the cash variation from the price settlement to the payment date in accordance with the transaction terms.
Corumbá is a world-class asset, with high Fe content and strategic importance to our product portfolio, adding to our reserves a substantial volume of lump ore which can be employed in the direct reduction process. We are studying the possibility of expanding Corumbá’s capacity up to 15.0 million metric tons per year (Mtpy), from the current 2.5 Mtpy.
Vale has agreed with ThyssenKrupp Steel AG (ThyssenKrupp) to increase its stake in ThyssenKrupp CSA Siderúrgica do Atlântico Ltda. (CSA) to 26.87%, from the previous 10% interest, through a capital infusion of EUR$ 965 million. We have disbursed US$ 681 million as the first of the two tranches of the capital injection. The second tranche will be disbursed in November 2009.
CSA is building an integrated steel slab plant, with nominal capacity of five million metric tons of slab per year, in the state of Rio de Janeiro, Brazil. The expected start-up is the first half of 2010. Jointly with the steelmaking facilities, the project comprises a power plant and a maritime terminal. As a strategic partner of ThyssenKrupp, Vale is the sole and exclusive supplier of iron ore to CSA.
On the other hand, we sold through a book-building process for IDR 925.6 billion, or US$ 88 million, 205,680,000 shares of our subsidiary PT International Nickel Indonesia Tbk (PTI), representing 2.07% of PTI’s outstanding shares. As an outcome of this transaction, the free float of PTI shares has returned to 20%, in line with our previous commitment.
In October, Vale signed a memorandum of understanding (MOU) with Insitec - shareholder of companies that own the Corredor de Desenvolvimento de Nacala (CDN) - the Nacala corridor, and the Government of Mozambique, concerning mutual interest in developing the Nacala logistics corridor, in the north of Mozambique.

US GAAP 3Q09
15
The corridor will make it possible to expand the Moatize coal mine (Moatize II), develop the Evate phosphate mine - projects that are currently under study-, and will allow the transportation of copper to be produced in the future from our projects in the Zambian copperbelt. The Konkola North copper mine will be our first African copper project to be developed.
It will replicate our successful experience with the iron ore business in owning and operating an integrated mine-railroad-port system, which for bulk products is key to maximizing operational efficiency and cost reduction. Moreover, it will create an efficient way to ship the Zambian copper. Currently, copper produced in Zambian mines is carried by trucks that have to cover almost 2,000 km of poor quality roads to reach the Eastern coast of Africa.
The Moatize mine, already under implementation, has its start-up scheduled for the first half of 2011, with an annual production capacity of 11 million metric tons of coal. In this first stage, coal output will be transported by Sena-Beira railroad to a coal maritime terminal, in the Beira port.
However, given the limited capacity of the Sena-Beira railroad, the feasibility of the second phase of Moatize will depend on a different solution. In this context, we are studying the viability of a Moatize-Nacala railroad, which would involve the construction of a 180 km railway spur from Moatize to Lirangwe, in Malawi, the rehabilitation of 730 km of the existing railroad between Malawi and Mozambique, and the construction of a deep sea maritime terminal, with access bridge of 1.5 km and depth of 20 meters, in Nacala.
Vale owns the option to purchase 51% of the company that owns the railroad and port concessions, allowing it to control the logistics assets.
In 3Q09, R&D investments comprised US$ 160 million spent in the mineral exploration program, US$ 78 million in conceptual, pre-feasibility and feasibility studies for projects, and US$ 28 million to develop new processes, technological innovations and adaptation of technologies.
Investments in the non-ferrous minerals business were US$ 740 million due to the various projects under development, some in the late stage - Onça Puma, Goro, Salobo, Tres Valles and Bayóvar. US$ 501 million was spent in the ferrous minerals business, US$ 420 million in logistics, US$ 243 million in energy, including power generation and natural gas exploration, US$ 140 million in coal, US$ 43 million in steel projects and US$ 83 million in corporate activities and other business segments.
On October 19, 2009, Vale disclosed its capex budget for 2010, involving capital expenditures of US$ 12.9 billion. US$ 8.6 billion will be allocated to project execution, US$ 1.2 billion to R&D and US$ 3.0 billion to the maintenance of existing operations.
Our investment plan continues to reflect the focus on organic growth as the priority of our growth strategy, as 76.6% of the budget is allocated to finance R&D and greenfield and brownfield project execution against an average of 71.1% over the last five years.
For more details about the projects and capex budget for 2010, please see the press release “Vale to invest US$ 12.9 billion in 2010” available at our website, www.vale.com/Investors/Investments/Press Release Capex.
Table 8 - TOTAL INVESTMENT BY CATEGORY
US$ million 3Q08 % 2Q09 % 3Q09 % Organic growth 2,034 74.8 1,617 77.7 1,704 78.5 Projects 1,733 63.8 1,363 65.5 1,439 66.3 R&D 301 11.1 254 12.2 265 12.2 Stay-in-business 684 25.2 463 22.3 466 21.5 Total 2,718 100.0 2,080 100.0 2,170 100.0
US GAAP 3Q09
16
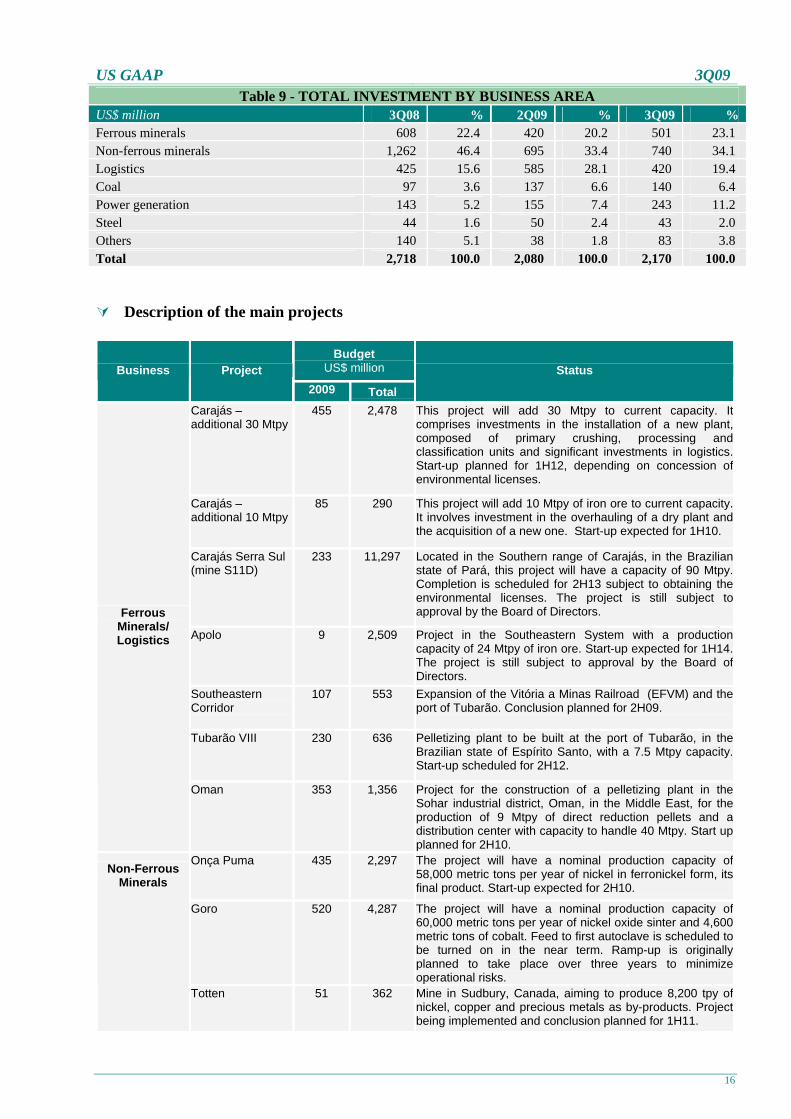
Table 9 - TOTAL INVESTMENT BY BUSINESS AREA US$ million 3Q08 % 2Q09 % 3Q09 % Ferrous minerals 608 22.4 420 20.2 501 23.1 Non-ferrous minerals 1,262 46.4 695 33.4 740 34.1 Logistics 425 15.6 585 28.1 420 19.4 Coal 97 3.6 137 6.6 140 6.4 Power generation 143 5.2 155 7.4 243 11.2 Steel 44 1.6 50 2.4 43 2.0 Others 140 5.1 38 1.8 83 3.8 Total 2,718 100.0 2,080 100.0 2,170 100.0
Description of the main projects
Budget US$ million Business Project
2009 Total
Status
Carajás – additional 30 Mtpy
455 2,478 This project will add 30 Mtpy to current capacity. It comprises investments in the installation of a new plant, composed of primary crushing, processing and classification units and significant investments in logistics. Start-up planned for 1H12, depending on concession of environmental licenses.
Carajás – additional 10 Mtpy
85 290 This project will add 10 Mtpy of iron ore to current capacity. It involves investment in the overhauling of a dry plant and the acquisition of a new one. Start-up expected for 1H10.
Carajás Serra Sul (mine S11D)
233 11,297 Located in the Southern range of Carajás, in the Brazilian state of Pará, this project will have a capacity of 90 Mtpy. Completion is scheduled for 2H13 subject to obtaining the environmental licenses. The project is still subject to approval by the Board of Directors.
Apolo 9 2,509 Project in the Southeastern System with a production capacity of 24 Mtpy of iron ore. Start-up expected for 1H14. The project is still subject to approval by the Board of Directors.
Southeastern Corridor
107 553 Expansion of the Vitória a Minas Railroad (EFVM) and the port of Tubarão. Conclusion planned for 2H09.
Tubarão VIII 230 636 Pelletizing plant to be built at the port of Tubarão, in the Brazilian state of Espírito Santo, with a 7.5 Mtpy capacity. Start-up scheduled for 2H12.
Ferrous Minerals/ Logistics
Oman 353 1,356 Project for the construction of a pelletizing plant in the Sohar industrial district, Oman, in the Middle East, for the production of 9 Mtpy of direct reduction pellets and a distribution center with capacity to handle 40 Mtpy. Start up planned for 2H10.
Onça Puma 435 2,297 The project will have a nominal production capacity of 58,000 metric tons per year of nickel in ferronickel form, its final product. Start-up expected for 2H10.
Goro 520 4,287 The project will have a nominal production capacity of 60,000 metric tons per year of nickel oxide sinter and 4,600 metric tons of cobalt. Feed to first autoclave is scheduled to be turned on in the near term. Ramp-up is originally planned to take place over three years to minimize operational risks.
Non-Ferrous Minerals
Totten 51 362 Mine in Sudbury, Canada, aiming to produce 8,200 tpy of nickel, copper and precious metals as by-products. Project being implemented and conclusion planned for 1H11.

US GAAP 3Q09
17
Salobo 375 1,152 The project will have a production capacity of 127,000 metric tons of copper in concentrate. Project implementation under way and civil engineering work has started. Conclusion of work scheduled for 2H11.
Salobo expansion 6 855 The project will expand the Salobo mine’s annual production capacity from 127,000 to 254,000 metric tons of copper in concentrate. Conclusion is estimated for 2H13.
Tres Valles 56 102 Located in the Coquimbo region in Chile, with an annual production capacity of 18,000 metric tons of copper cathode. Conclusion expected for 1H10.
Bayóvar 308 479 Open pit mine in Peru with nominal capacity of 3.9 million metric tons per year of phosphate concentrate. Project under implementation with conclusion scheduled for 2H10.
CAP 36 2,200 The new alumina refinery will be located in Barcarena, in the Brazilian state of Pará. The plant will have a production capacity of 1.86 Mtpy of alumina, with potential for future expansion to produce up to 7.4 mtpy. Completion is expected in 2H12.
Paragominas III 12 487 The third phase, Paragominas III, will add 4.95 Mtpy of bauxite to existing capacity and completion is scheduled for 2H12.
Carborough Downs
122 330 Expansion of the Carborough Downs underground coal mine in Central Queensland, Australia. This project includes the installation of a longwall and the duplication of the coal handling and preparation plant (CHPP) to be concluded in 2H09. It will allow the mine to achieve 4.4 Mtpy capacity in 2011. Coal
Moatize 319 1,322 This project is located in Mozambique and will have a production capacity of 11 Mtpy, of which 8.5 Mtpy of metallurgic coal and 2.5 Mtpy of thermal coal. Completion is currently scheduled for 1H11.
Karebbe 83 410 Karebbe hydroelectric power plant in Sulawesi, Indonesia, aims to supply 90MW for the Indonesian operations, targeting production cost reduction by substitution of oil as fuel. Work started and main equipment purchased. Scheduled to start up in 1H11.
Energy Estreito 166 514 Hydroelectric power plant on the Tocantins river, between the states of Maranhão and Tocantins, Brazil, has already obtained the implementation license, and is being built. Vale has a 30% share in the consortium that will build and operate the plant, which will have a capacity of 1,087 MW. Start-up is planned for 2H10.
PERFORMANCE OF THE BUSINESS SEGMENTS Ferrous minerals
In 3Q09, shipments of iron ore and pellets totaled 72.930 million metric tons, 35.5% above 2Q09. Sales volumes of iron ore amounted to 66.768 million metric tons, 31.8% higher, while pellets accounted for 6.162 million metric tons – 95.4 % up against 2Q09.
In 9M09, shipments of iron ore and pellets reached 178.851 million metric tons, against 241.345 million in 9M08.
Vale has been successfully exploiting the strong expansion of Chinese iron ore imports. Our sales to China reached another all-time high quarterly figure, totaling 39.838 million metric tons, representing 54.6% of total shipments. Sales to China contributed 22.1% to the expansion of our iron ore and pellets shipments in 3Q09.
In addition to the stronger sales to China, we have benefited from the rebound of carbon steel output in Brazil, Europe, Japan and South Korea.

US GAAP 3Q09
18
Shipments to Asia ex-China totaled 11.756 million metric tons, representing 16.1% of total shipments, rising 4.8 million compared to the previous quarter, driven by higher qoq volumes to Japan (3.2 million) and South Korea (0.7 million).
Sales to Europe more than doubled, reaching 10.9 million metric tons against 4.7 million in 2Q09, contributing 32.3% to the total increase. The main contributors to the higher sales volumes to Europe were Germany, with an increase of 1.8 million, the Netherlands (1.3 million) and France (1.2 million).
Our sales to the Brazilian market reached 7.8 million metric tons, 10.7% of total shipments, increasing 3.4 million on a quarter-on-quarter basis.
Revenues generated from the sale of iron ore amounted to US$ 3.821 billion, presenting a 57.7% increase over 2Q09. Average sales prices increased 19.7%, to US$ 57.23 per metric ton from US$ 47.82 in the previous quarter. If we adjust 2Q09 prices for the retroactive charge related to the 2009 price settlement, the average price in the last quarter rises to US$ 50.03, and the percentage increase is smaller, 14.4%.
Pellet sales generated revenues of US$ 412 million, from US$ 176 million in 2Q09. Average sales prices increased 19.8%, to US$ 66.86 per metric ton from US$ 55.82.
At the end of 3Q09 we had seven out of ten of our pellet plants operating. Another pellet plant resumed operations in mid-October. The amount of pellets purchased in this quarter amounted to 240,000 metric tons, compared to none in the previous period.
It is important to notice that reported revenues are net of the costs of maritime freight, implying that prices of C&F sales are comparable to average FOB prices. In 3Q09, Vale sold 22.5 million metric tons of iron ore and pellets on a C&F basis, against 25.4 million in 2Q09.
Volumes of manganese ore sold in 3Q09 reached 244,000 metric tons, 17.8% lower than 2Q09, at 297,000. The temporarily stoppage of Azul mine, for preventive and structure maintenance, in July, affected our manganese production and sales in 3Q09. Sales of ferroalloy amounted to 65,000 metric tons, 8.5% lower than in 2Q09, when 71,000 metric tons were sold.
Revenues from the sale of manganese ore totaled US$ 23 million, a 46.5% decrease over 2Q09, at US$ 43 million. The average sales price reached US$ 94.26 per metric ton, 34.9% below the 2Q09 realized price.
Ferroalloy sales produced revenues of US$ 93 million, against US$ 69 million in 2Q09, with average price increasing to US$ 1,430.77 from US$ 971.83 per metric ton in 2Q09.
The sales of ferrous minerals products - iron ore, pellets, manganese and ferroalloys - produced a total revenue of US$ 4.370 billion in 3Q09, an increase of 60.9% vis-à-vis US$ 2.716 billion in 2Q09.
The adjusted EBIT margin for the ferrous minerals business in 3Q09 was 53.0%, against 39.8% in 2Q09 and 56.5% in 1Q09. The margin hike was positively influenced by the return to operation of some assets that were kept idle in the last quarter.
Adjusted EBITDA for the ferrous minerals business increased 79.8%, totaling US$ 2.623 billion, against US$ 1.459 billion in 2Q09.
The increase of US$ 1.164 billion in 3Q09 vis-à-vis 2Q09 was due to higher prices and sales volumes, which positively impacted the adjusted EBITDA by US$ 697 million and US$ 563 million, respectively. On the other hand, the exchange rate variation had a negative effect of US$ 109 million.

US GAAP 3Q09
19
Table 10 - FERROUS MINERALS BUSINESS PERFORMANCE
VOLUME SOLD BY DESTINATION – IRON ORE AND PELLETS thousand tons 3Q08 % 2Q09 % 3Q09 % Americas 19,575 22.8 5,094 9.5 9,202 12.6 Brazil 15,660 18.2 4,393 8.2 7,801 10.7 Steel mills and pig iron producers 13,256 15.4 4,393 8.2 7,801 10.7 JVs pellets 2,404 2.8 - - - - USA 1,079 1.3 77 0.1 73 0.1 Others 2,836 3.3 624 1.2 1,328 1.8 Asia 41,259 48.0 42,561 79.1 51,594 70.7 China 28,192 32.8 35,611 66.2 39,838 54.6 Japan 8,250 9.6 3,372 6.3 6,539 9.0 South Korea 3,041 3.5 2,269 4.2 3,012 4.1 Others 1,776 2.1 1,309 2.4 2,205 3.0 Europe 21,439 25.0 4,738 8.8 10,901 14.9 Germany 6,946 8.1 1,396 2.6 3,169 4.3 United Kingdom 2,004 2.3 1,261 2.3 560 0.8 France 3,316 3.9 490 0.9 1,670 2.3 Belgium 2,373 2.8 - - 787 1.1 Italy 1,336 1.6 595 1.1 869 1.2 Others 5,464 6.4 996 1.9 3,846 5.3 Rest of the World 3,642 4.2 1,428 2.7 1,233 1.7 Total 85,915 100.0 53,821 100.0 72,930 100.0
OPERATING REVENUE BY PRODUCT US$ million 3Q08 2Q09 3Q09 Iron ore 6,175 2,423 3,821 Pellet plant operation services 13 3 5 Pellets 1,399 176 412 Manganese ore 119 43 23 Ferroalloys 330 69 93 Others 94 2 16 Total 8,130 2,716 4,370
AVERAGE SALE PRICE US$/ metric ton 3Q08 2Q09 3Q09 Iron ore 80.19 47.82 57.23 Pellets 157.00 55.82 66.86 Manganese ore 474.10 144.78 94.26 Ferroalloys 3,473.68 971.83 1,430.77
VOLUME SOLD ‘000 metric tons 3Q08 2Q09 3Q09 Iron ore 77,004 50,668 66,768 Pellets 8,911 3,153 6,162 Manganese ore 251 297 244 Ferroalloys 95 71 65
SELECTED FINANCIAL INDICATORS Adjusted EBIT margin (%) 58.4 39.8 53.0 Adjusted EBITDA (US$ million) 5,094 1,459 2,623

US GAAP 3Q09
20
Non-ferrous minerals
Total revenues from the sales of non-ferrous minerals reached US$ 1.991 billion, US$ 82 million higher than in 2Q09. Their increase was mostly influenced by higher nickel (US$ 269 million) and aluminum products prices (US$ 97 million), partially offset by the decline of nickel and its by-products sales volume (US$ 319 million).
In 9M09, revenues of non-ferrous minerals totaled US$ 5.418 billion, against US$ 10.201 billion in 9M08.
In 3Q09, sales of nickel generated revenues of US$ 963 million, against US$ 916 million in 2Q09. The rise of 36.1% in nickel sales prices to US$ 18,001 per metric ton from US$ 13,224 in 2Q09, more than offset lower volumes.
Total shipments of finished nickel reached 53,000 metric tons in 3Q09, decreasing by 23.2% against 2Q09. Sales to Asia amounted to 35,000 metric tons, representing 65.1% of the total volume. North America was responsible for 22.8%, and Europe 11.5%
Revenues from sales of bauxite, alumina and aluminum amounted to US$ 530 million, compared to US$ 468 million in 2Q09. The effect of higher sales prices more than offset the impact of lower shipments.
The average sales price of aluminum was US$ 1,798.25 per metric ton in 3Q09 against US$ 1,451.61 in the previous quarter, while the price of alumina, which is mostly indexed to the metal price, changed to US$ 247.12 per metric ton from US$ 196.01 in 2Q09.
In 3Q09, we sold 114,000 metric tons – vs. 124,000 in 2Q09 and 127,000 in 1Q09 - of aluminum, and 1.303 million metric tons – vs. 1.403 million in 2Q09 and 1.257 million in 1Q09 - of alumina. Variance in quarterly volumes is due to the shipments program.
Copper revenues amounted to US$ 295 million, compared with US$ 271 million in 2Q09 as the effect of the 15.8% increase of average sales prices more than offset the 7.4% decline in volumes sold.
The average sales price was US$ 5,849.94 per metric ton in 3Q09, above the US$ 5,051.54 for 2Q09. Copper shipments during this quarter reached 50,000 metric tons, lower than the volume shipped in 2Q09, at 54,000, negatively influenced by the smaller production in the Sudbury and Voisey’s Bay sites.
PGMs revenues amounted to US$ 28 million, almost half of the previous quarter, at US$ 54 million, due to a 56.7% drop in quantity sold. Average sales prices for platinum reached US$ 1,327.66 per oz, increasing 29.1% on a quarter-on-quarter basis.
Revenues from cobalt totaled US$ 10 million, with a reduction of 16.7% compared to the last quarter. Average sales prices increased to US$ 13.68 per lb from US$ 7.99 in 2Q09.
Potash sales produced revenues of US$ 118 million, in line with the previous quarter, at US$ 121 million. Larger volumes shipped, 229,000 metric tons against 192,000 in 2Q09, counterbalanced the decline on average sales prices to US$ 515.28 per metric ton in 3Q09 from US$ 630.21 in 2Q09.
In 3Q09, kaolin revenues amounted to US$ 43 million, similar to the US$ 42 million in the previous quarter. As in potash, higher sales volumes offset lower average sales prices.
The adjusted EBIT margin for non-ferrous minerals improved further in 3Q09, reaching 5.1% compared to 0.2% in 2Q09. Cost reductions and the surge in prices contributed to improve profitability.
Adjusted EBITDA for non-ferrous minerals totaled US$ 508 million in 3Q09 versus US$ 413 million in 2Q09.
The increase of US$ 95 million relative to 2Q09 was mainly a result of higher prices (US$ 385 million), which was counterbalanced by lower shipments (US$ 153 million), the effect of exchange rate variations in our COGS (US$ 81 million) and higher SG&A (US$ 37 million).

US GAAP 3Q09
21
Table 11 - NON-FERROUS MINERALS BUSINESS PERFORMANCE
OPERATING REVENUE BY PRODUCT US$ million 3Q08 2Q09 3Q09 Nickel 1,358 916 963 Copper 630 271 295 Kaolin 57 42 43 Potash 103 121 118 PGMs 120 54 28 Precious metals 32 26 4 Cobalt 56 12 10 Aluminum 456 193 207 Alumina 425 275 322 Bauxite 8 - 1 Total 3,245 1,909 1,991
AVERAGE SALE PRICE US$/ metric ton 3Q08 2Q09 3Q09 Nickel 19,691.15 13,223.86 18,000.61 Copper 6,635.14 5,051.54 5,849.94 Kaolin 198.61 217.62 211.82 Potash 817.46 630.21 515.28 Platinum (US$/oz) 1,498.02 1,028.53 1,327.66 Cobalt (US$/lb) 30.64 7.99 13.68 Aluminum 2,973.33 1,451.61 1,798.25 Alumina 365.43 196.01 247.12 Bauxite 44.20 - -
VOLUME SOLD ‘000 metric tons 3Q08 2Q09 3Q09 Nickel 69 69 53 Copper 95 54 50 Kaolin 287 193 203 Potash 126 192 229 Precious metals (oz) 673 522 23 PGMs (oz) 114 97 42 Cobalt (metric ton) 829 681 332 Aluminum 150 124 114 Alumina 1,163 1,403 1,303 Bauxite 181 - 37
SELECTED FINANCIAL INDICATORS 3Q08 2Q09 3Q09 Adjusted EBIT margin (%) 24.4 0.2 5.1 Adjusted EBITDA (US$ million) 1,342.00 413.00 508.00
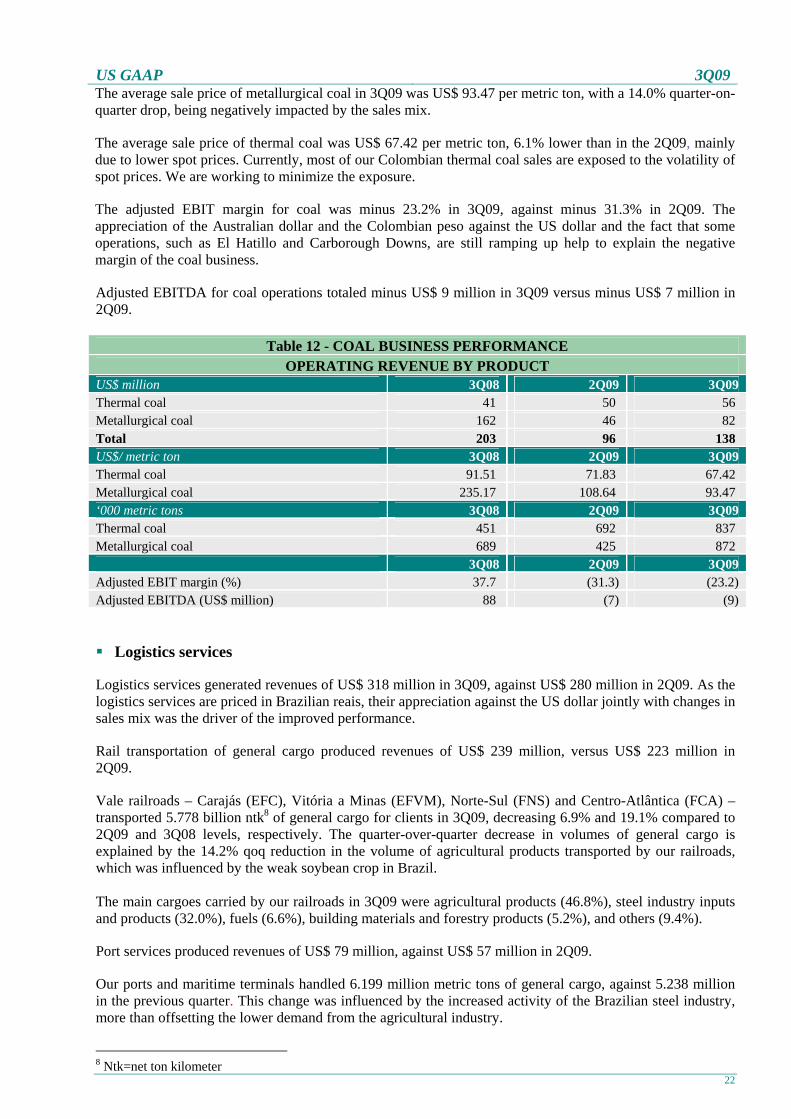
Coal Revenues from coal sales reached US$ 138 million in 3Q09, of which US$ 56 million arose from shipments of thermal coal and US$ 82 million from metallurgical coal. There was an increase of 43.9% versus the US$ 96 million figure for 2Q09, driven by higher sales volumes for both types of coal.
In 3Q09 total shipments reached a record of 1.709 million metric tons, showing a 53.0% increase vis-à-vis the last quarter, at 1.117 million metric tons. We sold 872,000 metric tons of metallurgical coal – vs. 425,000 in 2Q09 - and 837,000 metric tons of thermal coal – vs. 692,000 in 2Q09.
US GAAP 3Q09
22
The average sale price of metallurgical coal in 3Q09 was US$ 93.47 per metric ton, with a 14.0% quarter-on-quarter drop, being negatively impacted by the sales mix.
The average sale price of thermal coal was US$ 67.42 per metric ton, 6.1% lower than in the 2Q09, mainly due to lower spot prices. Currently, most of our Colombian thermal coal sales are exposed to the volatility of spot prices. We are working to minimize the exposure.
The adjusted EBIT margin for coal was minus 23.2% in 3Q09, against minus 31.3% in 2Q09. The appreciation of the Australian dollar and the Colombian peso against the US dollar and the fact that some operations, such as El Hatillo and Carborough Downs, are still ramping up help to explain the negative margin of the coal business.
Adjusted EBITDA for coal operations totaled minus US$ 9 million in 3Q09 versus minus US$ 7 million in 2Q09.
Table 12 - COAL BUSINESS PERFORMANCE OPERATING REVENUE BY PRODUCT
US$ million 3Q08 2Q09 3Q09 Thermal coal 41 50 56 Metallurgical coal 162 46 82 Total 203 96 138 US$/ metric ton 3Q08 2Q09 3Q09 Thermal coal 91.51 71.83 67.42 Metallurgical coal 235.17 108.64 93.47 ‘000 metric tons 3Q08 2Q09 3Q09 Thermal coal 451 692 837 Metallurgical coal 689 425 872 3Q08 2Q09 3Q09 Adjusted EBIT margin (%) 37.7 (31.3) (23.2) Adjusted EBITDA (US$ million) 88 (7) (9) Logistics services
Logistics services generated revenues of US$ 318 million in 3Q09, against US$ 280 million in 2Q09. As the logistics services are priced in Brazilian reais, their appreciation against the US dollar jointly with changes in sales mix was the driver of the improved performance.
Rail transportation of general cargo produced revenues of US$ 239 million, versus US$ 223 million in 2Q09.
Vale railroads – Carajás (EFC), Vitória a Minas (EFVM), Norte-Sul (FNS) and Centro-Atlântica (FCA) – transported 5.778 billion ntk8 of general cargo for clients in 3Q09, decreasing 6.9% and 19.1% compared to 2Q09 and 3Q08 levels, respectively. The quarter-over-quarter decrease in volumes of general cargo is explained by the 14.2% qoq reduction in the volume of agricultural products transported by our railroads, which was influenced by the weak soybean crop in Brazil. The main cargoes carried by our railroads in 3Q09 were agricultural products (46.8%), steel industry inputs and products (32.0%), fuels (6.6%), building materials and forestry products (5.2%), and others (9.4%).
Port services produced revenues of US$ 79 million, against US$ 57 million in 2Q09.
Our ports and maritime terminals handled 6.199 million metric tons of general cargo, against 5.238 million in the previous quarter. This change was influenced by the increased activity of the Brazilian steel industry, more than offsetting the lower demand from the agricultural industry.
8 Ntk=net ton kilometer

US GAAP 3Q09
23
In 3Q09, the adjusted EBIT margin was 26.7%, versus 15.3% in 2Q09.
The increase of US$ 27 million relative to 2Q09 was mainly a result of higher average sales prices (US$ 36 million) and lower SG&A (US$ 12 million), partially offset by the effect of exchange rate variation in our COGS (US$ 15 million).
Table 13 - LOGISTICS BUSINESS PERFORMANCE
OPERATING REVENUE BY PRODUCT US$ million 3Q08 2Q09 3Q09 Railroads 386 223 239 Ports 86 57 79 Total 472 280 318 ‘000 metric tons 3Q08 2Q09 3Q09 Railroads (million ntk) 7,138 6,207 5,778 3Q08 2Q09 3Q09 Adjusted EBIT margin (%) 22.3 15.3 26.7 Adjusted EBITDA (US$ million) 177 91 118
FINANCIAL INDICATORS OF NON-CONSOLIDATED COMPANIES For selected financial indicators of the main companies not consolidated, see our quarterly financial statements on www.vale.com /Investors/Financial Performance/SEC Reports.
CONFERENCE CALL AND WEBCAST Vale will hold a conference call and webcast on October 29, at 12:00 am Rio de Janeiro time, 10:00 am US Eastern Standard Time, 2:00 pm UK time and 3:00 pm Paris time. To connect the webcast, please dial: Participants from Brazil: (55 11) 4688-6341 Participants from USA: (1-800) 860-2442 Participants from other countries: (1-412) 858-4600 Access code: VALE Instructions for participation will be available on the website www.vale.com/Investors/Presentations/2009. A recording will be available on Vale’s website for 90 days from October 29, 2009.

US GAAP 3Q09
24
ANNEX 1 – FINANCIAL STATEMENTS
Table 14 - INCOME STATEMENTS US$ million 3Q08 2Q09 3Q09 Gross operating revenues 12,122 5,084 6,893 Taxes (383) (136) (187) Net operating revenue 11,739 4,948 6,706 Cost of goods sold (5,116) (3,135) (3,591) Gross profit 6,623 1,813 3,115 Gross margin (%) 56.4 36.6 46.5 Selling, general and administrative expenses (374) (230) (289) Research and development expenses (331) (265) (231) Others (383) (342) (302) Operating profit 5,535 976 2,293 Financial revenues 277 93 98 Financial expenses (457) (293) (430) Gains (losses) on derivatives, net (587) 873 341 Monetary variation (321) 523 119 Gains on sale of affiliates - 157 73 Tax and social contribution (Current) (477) (1,494) (696) Tax and social contribution (Deferred) 621 (130) (230) Equity income and provision for losses 290 135 155 Minority shareholding participation (60) (50) (46) Net earnings 4,821 790 1,677 Earnings per share (US$) 0.96 0.15 0.32 Diluted earnings per share (US$) 0.94 0.15 0.31
Table 15 - FINANCIAL RESULTS US$ million 3Q08 2Q09 3Q09 Gross interest (293) (213) (206) Debt with third parties (290) (212) (206) Debt with related parties (3) (1) - Tax and labour contingencies (23) (14) (19) Others (141) (66) (205) Financial expenses (457) (293) (430) Financial income 277 93 98 Derivatives (587) 873 341 Foreign exchange and monetary gain (losses), net (321) 523 119 Financial result, net (1,088) 1,196 128
Table 16 - EQUITY INCOME BY BUSINESS SEGMENT US$ million 3Q08 % 2Q09 % 3Q09 % Ferrous minerals 175 60.3 93 68.9 88 56.8 Non-ferrous minerals 18 6.2 3 2.2 10 6.5 Logistics 47 16.2 24 17.8 34 21.9 Coal 28 9.7 8 5.9 21 13.5 Steel 26 9.0 7 5.2 2 1.3 Others (4) (1.4) - - - - Total 290 100.0 135 100.0 155 100.0

US GAAP 3Q09
25
Table 17 - BALANCE SHEET US$ million 9/30/2008 6/30/2009 9/30/2009 Assets Current 28,008 20,528 23,148 Long-term 6,982 6,264 7,494 Fixed 57,135 62,264 70,115 Total 92,125 89,056 100,757 Liabilities Current 7,737 5,788 8,743 Long term 33,170 30,914 32,670 Shareholders’ equity 51,218 52,354 59,344 Paid-up capital 24,993 24,231 24,232 Reserves 24,356 23,777 29,511 Non controlling interest - 2,477 2,798 Mandatory convertible notes 1,869 1,869 2,803 Total 92,125 89,056 100,757

US GAAP 3Q09
26
Table 18 - CASH FLOW US$ million 3Q08 2Q09 3Q09 Cash flows from operating activities: Net income 4,881 840 1,723
Adjustments to reconcile net income with cash provided by operating activities: Depreciation, depletion and amortization 713 643 721 Dividends received 126 106 - Equity in results of affiliates and joint ventures and change in provision for losses on equity investments (290) (135) (155) Deferred income taxes (621) 130 230 Loss on sale of property, plant and equipment 243 46 93 Gain on sale of investment - (157) (73) Foreign exchange and monetary losses 1,133 (817) (184) Net unrealized derivative losses 608 (809) (329) Net interest payable 83 (54) 24 Others 1 (18) 59 Decrease (increase) in assets: Accounts receivable (1,481) 271 (373) Inventories (77) 98 441 Recoverable taxes - 1,275 (272) Others 5 (8) (93) Suppliers 237 (227) (108) Payroll and related charges 97 62 128 Income tax (291) (276) 522 Others (35) 96 140 Net cash provided by operating activities 5,332 1,066 2,494 Short term investments (634) 217 (1,562) Loans and advances receivable (25) (52) (117) Guarantees and deposits (26) (34) (24) Additions to investments (85) (291) (712) Additions to property, plant and equipment (1,553) (2,008) (1,645) Proceeds from disposals of investment - 277 171 Net cash used to acquire subsidiaries - (300) (802) Net cash used in investing activities (2,323) (2,191) (4,691) Cash flows from financing activities: Short-term debt, net issuances (repayments) - 9 49 Loans (16) (155) (135) Long-term debt 71 296 1.086 Mandatorily convertibles - - 934 Repayment of long-term debt (313) (52) (97) Treasury stock - - 1 Interest attributed to shareholders - (1.255) - Net cash used in financing activities (258) (1,157) 1.838 Increase (decrease) in cash and cash equivalents 14,941 (2,282) (359) Effect of exchange rate changes on cash and cash equivalents (2,469) 1.477 625 Cash and cash equivalents, beginning of period 2,154 8,997 8,192 Cash and cash equivalents, end of period 14,626 8,192 8,458 Cash paid during the period for: Interest on short-term debt (1) - (1) Interest on long-term debt (305) (311) (236) Income tax (726) (85) (130) Non-cash transactions Interest capitalized 14 50 74
US GAAP 3Q09
27
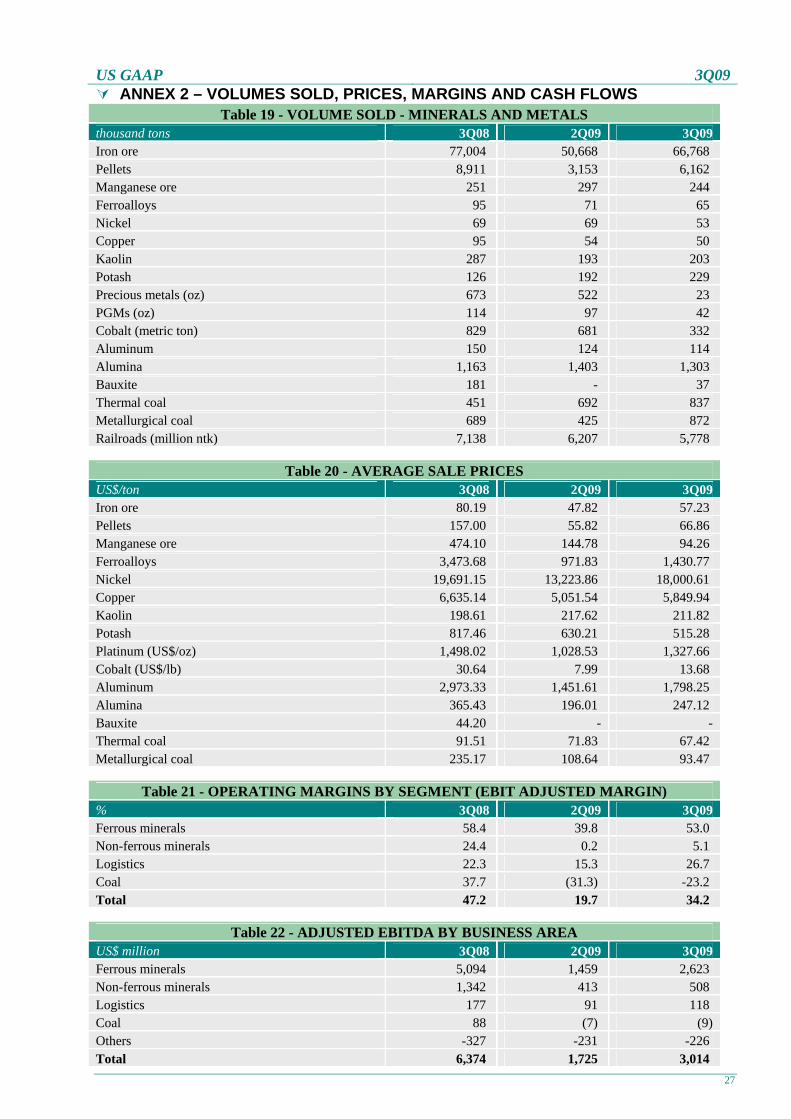
ANNEX 2 – VOLUMES SOLD, PRICES, MARGINS AND CASH FLOWS Table 19 - VOLUME SOLD - MINERALS AND METALS
thousand tons 3Q08 2Q09 3Q09 Iron ore 77,004 50,668 66,768 Pellets 8,911 3,153 6,162 Manganese ore 251 297 244 Ferroalloys 95 71 65 Nickel 69 69 53 Copper 95 54 50 Kaolin 287 193 203 Potash 126 192 229 Precious metals (oz) 673 522 23 PGMs (oz) 114 97 42 Cobalt (metric ton) 829 681 332 Aluminum 150 124 114 Alumina 1,163 1,403 1,303 Bauxite 181 - 37 Thermal coal 451 692 837 Metallurgical coal 689 425 872 Railroads (million ntk) 7,138 6,207 5,778
Table 20 - AVERAGE SALE PRICES US$/ton 3Q08 2Q09 3Q09 Iron ore 80.19 47.82 57.23 Pellets 157.00 55.82 66.86 Manganese ore 474.10 144.78 94.26 Ferroalloys 3,473.68 971.83 1,430.77 Nickel 19,691.15 13,223.86 18,000.61 Copper 6,635.14 5,051.54 5,849.94 Kaolin 198.61 217.62 211.82 Potash 817.46 630.21 515.28 Platinum (US$/oz) 1,498.02 1,028.53 1,327.66 Cobalt (US$/lb) 30.64 7.99 13.68 Aluminum 2,973.33 1,451.61 1,798.25 Alumina 365.43 196.01 247.12 Bauxite 44.20 - - Thermal coal 91.51 71.83 67.42 Metallurgical coal 235.17 108.64 93.47
Table 21 - OPERATING MARGINS BY SEGMENT (EBIT ADJUSTED MARGIN) % 3Q08 2Q09 3Q09 Ferrous minerals 58.4 39.8 53.0 Non-ferrous minerals 24.4 0.2 5.1 Logistics 22.3 15.3 26.7 Coal 37.7 (31.3) -23.2 Total 47.2 19.7 34.2
Table 22 - ADJUSTED EBITDA BY BUSINESS AREA US$ million 3Q08 2Q09 3Q09 Ferrous minerals 5,094 1,459 2,623 Non-ferrous minerals 1,342 413 508 Logistics 177 91 118 Coal 88 (7) (9) Others -327 -231 -226 Total 6,374 1,725 3,014

US GAAP 3Q09
28
ANNEX 3 – RECONCILIATION OF US GAAP and “NON-GAAP” INFORMATION (a) Adjusted EBIT US$ million 3Q08 2Q09 3Q09 Net operating revenues 11,739 4,948 6,706 COGS (5,116) (3,135) (3,591) SG&A (374) (230) (289) Research and development (331) (265) (231) Other operational expenses (383) (342) (302) Adjusted EBIT 5,535 976 2,293 (b) Adjusted EBITDA
EBITDA defines profit or loss before interest, tax, depreciation and amortization. Vale uses the term adjusted EBITDA to reflect exclusion, also, of: monetary variations; equity income from the profit or loss of affiliated companies and joint ventures, less the dividends received from them; provisions for losses on investments; adjustments for changes in accounting practices; minority interests; and non-recurrent expenses. However our adjusted EBITDA is not the measure defined as EBITDA under US GAAP, and may possibly not be comparable with indicators with the same name reported by other companies. Adjusted EBITDA should not be considered as a substitute for operational profit or as a better measure of liquidity than operational cash flow, which are calculated in accordance with GAAP. Vale provides its adjusted EBITDA to give additional information about its capacity to pay debt, carry out investments and cover working capital needs. The following table shows the reconciliation between adjusted EBITDA and operational cash flow, in accordance with its statement of changes in financial position:
RECONCILIATION BETWEEN ADJUSTED EBITDA AND OPERATIONAL CASH FLOW US$ million 3Q08 2Q09 3Q09 Operational cash flow 5,332 1,066 2,494 Income tax 477 1,494 696 FX and monetary losses (812) 294 65 Financial expenses 684 (619) (33) Net working capital 1,524 (1,355) (385) Other (831) 845 177 Adjusted EBITDA 6,374 1,725 3,014 (c) Net debt RECONCILIATION BETWEEN Total debt AND NET DEBT US$ million 3Q08 2Q09 3Q09 Total debt 19,188 19,493 21,166 Cash and cash equivalents 15,260 11,192 13,020 Net debt 3,928 8,301 8,146 (d) Total debt / LTM Adjusted EBITDA US$ million 3Q08 2Q09 3Q09 Total debt / LTM Adjusted EBITDA (x) 1.0 1.5 2.2 Total debt / LTM operational cash flow (x) 1.4 1.3 1.8 (e) Total debt / Enterprise value US$ million 3Q08 2Q09 3Q09 Total debt / EV (%) 18.52 19.87 16.70 Total debt / total assets (%) 20.83 21.89 20.98 Enterprise value = Market capitalization + Net debt (f) LTM Adjusted EBITDA / LTM interest payments US$ million 3Q08 2Q09 3Q09 LTM adjusted EBITDA / LTM interest payments (x) 15.03 10.83 8.53 LTM operational profit / LTM interest payments (x) 12.39 8.45 6.12

US GAAP 3Q09
29
This press release may include declarations about Vale's expectations regarding future events or results. All declarations based upon future expectations, rather than historical facts, are subject to various risks and uncertainties. Vale cannot guarantee that such declarations will prove to be correct. These risks and uncertainties include factors related to the following: (a) the countries where Vale operates, mainly Brazil and Canada; (b) the global economy; (c) capital markets; (d) the mining and metals businesses and their dependence upon global industrial production, which is cyclical by nature; and (e) the high degree of global competition in the markets in which Vale operates. To obtain further information on factors that may give rise to results different from those forecast by Vale, please consult the reports filed with the Brazilian Comissão de Valores Mobiliários (CVM), the French Autorité des Marchés Financiers (AMF), and with the U.S. Securities and Exchange Commission (SEC), including Vale’s most recent Annual Report on Form 20F and its reports on Form 6K.