final thesis shelton wittenberg
TRANSCRIPT

ii
Copyright Page
©2018 Shelton Grace Wittenberg
ALL RIGHTS RESERVED

iii
Dedication Page
This thesis is dedicated to my friends, family, and Harry Potter.
iv
Acknowledgements
I would like to begin by thanking Dr. Kathy Knight for agreeing to work with me
on this project. I really did not have an exact image for what I was hoping to accomplish,
but she spent countless hours helping me along the way. It truly could not have happened
without her guidance and direction. I would also like to thank Dr. Scott Knight for his
help in data analysis, and his willingness to help with this important aspect of my thesis. I
would like to further thank Dr. Georgianna Mann and Dr. Melinda Valliant for serving as
my Second and Third readers and for their support and critiques.
I also would like to thank the Sally McDonnell Barksdale Honors College for the
opportunities during my undergraduate experience, and for challenging me in the
classroom.
I would also like to thank my family and friends. Thank you for listening to me
talk about my thesis far more than you probably ever wished to hear about. Thank you for
encouraging me on the good and bad days. Lastly, thank you for being there for me
always your friendships mean the world to me. Also, to my roommates, thank you for
letting me watch and listen to Harry Potter when I needed inspiration. I promise I will
never force you to do that ever again.
v
Table of Contents
Acknowledgements iv
Table of Contents v
Abstract 1
Chapter 1: Introduction 3
Chapter 2: Literature Review 6
Chapter 3: Methods 18
Chapter 4: Results 20
Chapter 5: Discussion 23
Chapter 6: Conclusions 25
References 27
Appendix 35
1
Abstract
Weight gain is common for undergraduate college students because of factors
such as body maturation, increased consumption of fast food, and less physical activity.
Weight gain may continue after college if diet and exercise habits do not improve, so
learning healthy habits during college can contribute to a healthy adulthood. Recent
research has reported that weight gain is inversely related to fruit and vegetable
consumption. Because a large portion of college students’ diets come from on-campus
dining options, fruit and vegetable intake may be lacking because many of these venues
may not serve these items or serve them in a way that is not appealing to students. Greek
communities on college campuses usually encompass a significant portion of the student
population, so research is needed on how to influence Greek students to make healthy
dining choices. The purpose of this project was to determine if a three week point-of-
purchase intervention targeting vegetables would have an effect on the amount of
vegetables selected from one sorority’s salad bar. Weights of vegetables served and left
over were measured during the first week of the study. The point-of-purchase materials
were placed at the beginning of the foodservice line for a two week period and amounts
of vegetable served and left over were weighed during that two weeks. Data was
analyzed using Analysis of Variance (ANOVA) to look for differences in weekly means
of total vegetable consumption, followed by Student-Newman-Kewles Test (SNK) to
separate the means (determine which means were significantly different) when
differences were found. Student’s t-tests were conducted on the weekly means for each
2
vegetable to determine differences over time. Only tomato selection significantly
increased from week 1 to week 2. However, significant differences in the means were
seen between weeks 2 and 3 for broccoli, edamame, and tomatoes and between weeks 1
and 3 for cucumber, edamame, and tomatoes. Point-of-purchase marketing did increase
the selection of vegetables. With the increasing obesity rates of college students
(including those who are Greek) it is important that this area of continues to be explored.
3
Chapter 1: Introduction
With the current media focus on weight and the obesity epidemic in America,
many students come to college with the fear of weight gain. College students of all races
and genders struggle with weight gain, which may be referred to as the “Freshman 15.”
Hellmich found that on average college students gained an average of about 7½ to 9
pounds their freshman year and an average 10 to 14 pounds total during their college
years (2012). In another study conducted at a private school in the Northeast, Alfano
found that more than 17 percent of the college students were overweight or obese,
compared to 14 percent at the beginning of their college experience. Weight gain in
college may be due to a difference in diet because of the freedom to choose food items,
more alcohol consumption, less physical activity, and stress (Alfano, 2006).
Furthermore the USDA 2015- 2020 Dietary Guidelines provide information
regarding the importance of consuming fruits and vegetables. Fruits and vegetables are
said to be associated with positive health outcomes, but over half of the population is not
meeting the recommended intake. Research has also shown that consumption of fruits
and vegetables decreases the risk for chronic diseases. The Dietary Guidelines say that an
individual consuming 2000 calories should consume 4.5 servings of fruits and vegetables
per day (2015).
Another factor that may affect students’ weight is whether or not students join a
Greek organization (Moosa, 2011). Greek organizations are popular on college campuses

4
around the United States and include from 4 to 75 percent of the undergraduate
population, depending on the college or university. These organizations provide
community during the transition to college while also providing many social and service
opportunities. Greek organizations also often have houses where members can live, and
where meals and snacks are served to members daily.
The Greek house director is tasked with developing the menu and ordering the
ingredients for the meals that will be served, but they are often not equipped with
education or experience in nutrition or food service management (Moosa, 2011). They
may not have the knowledge to be able to successfully market healthy food to their
student members, so there is a need to determine the best ways to get students to make
healthier, more nutritious choices when dining.
The meal service at Greek Houses is similar to that of an all-you-can-eat buffet
where there is little portion control. Members grab a plate and go through a line getting
at much or as little food as they want, and have the option to go back for seconds.
Members pay dues which cover the cost of breakfast, lunch and dinner Monday through
Thursday, and breakfast and lunch on Fridays; therefore eating at the house is seen as
desirable since it is already paid for.
One possible solution to improving the nutritional health of students in the Greek
system is posting nutrition information to prompt the students to select more fruits and
vegetables. There have been a limited number of studies done about nutrition in the
Greek system. However, one study surveying 72 sorority women revealed that members
did not meet the recommendations of 2 cups of fruit per day, but those eating six or more
meals did meet the 2.5 cups of vegetables recommendation (Mize and Valliant, 2012).
5
This study also determined that members of sororities were not eating a balanced diet
(2012).
The purpose of this study is to determine if providing point-of-purchase
information in Greek food service setting will increase selection of vegetables by
students. This will be completed by measuring the intake of fruits and vegetables from
the salad bar by college students without nutrition education materials posted and with
nutrition education materials posted.
6
Chapter 2: Literature Review
Transition to College
The transition to college has an effect on weight gain in students (G. Prushinski,
C. Etaugh, M. Sas and A. Newell, 2017). A study conducted using surveys and weight
measurements of students found that there is weight gain by students during their
freshman year of college but it may not be as significant at 15 pounds. The “Freshman
15” is a popular belief, but there is not much evidence to support this claim. The study
measured the weight changes in participants during their freshman year and used surveys
to assess self-esteem, body image, eating patterns, exercise, social life, and alcohol
consumption, and measurements of their beginning and end weight. The study revealed
that there was significant weight gain in males and females (+4.3 lbs for females and +4.9
lbs for males) (Prushinski et al.). In the first months of the study, female weight gain was
originally associated with an increase in exercise, nighttime snacking, eating with people,
and consumption of alcohol, but at follow-up, weight gain was related to eating with
people.
The freshman weight gain was further explored by Wengreen and Moncur who
conducted the Freshman Health Study, a longitudinal study that examined changes in
weight, exercise, and other behaviors related to health during the first semester of college,
and found that some students experienced significant weight gain during transition to
college (2009). Participants’ weights and measurements were
7
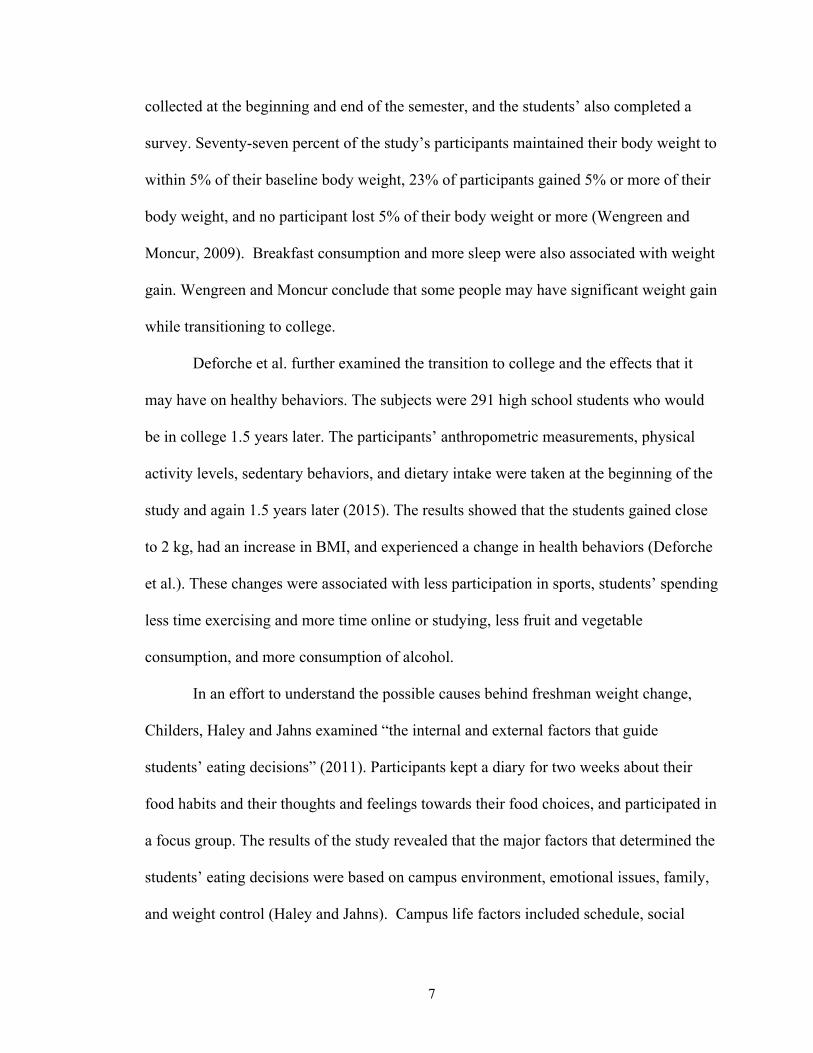
collected at the beginning and end of the semester, and the students’ also completed a
survey. Seventy-seven percent of the study’s participants maintained their body weight to
within 5% of their baseline body weight, 23% of participants gained 5% or more of their
body weight, and no participant lost 5% of their body weight or more (Wengreen and
Moncur, 2009). Breakfast consumption and more sleep were also associated with weight
gain. Wengreen and Moncur conclude that some people may have significant weight gain
while transitioning to college.
Deforche et al. further examined the transition to college and the effects that it
may have on healthy behaviors. The subjects were 291 high school students who would
be in college 1.5 years later. The participants’ anthropometric measurements, physical
activity levels, sedentary behaviors, and dietary intake were taken at the beginning of the
study and again 1.5 years later (2015). The results showed that the students gained close
to 2 kg, had an increase in BMI, and experienced a change in health behaviors (Deforche
et al.). These changes were associated with less participation in sports, students’ spending
less time exercising and more time online or studying, less fruit and vegetable
consumption, and more consumption of alcohol.
In an effort to understand the possible causes behind freshman weight change,
Childers, Haley and Jahns examined “the internal and external factors that guide
students’ eating decisions” (2011). Participants kept a diary for two weeks about their
food habits and their thoughts and feelings towards their food choices, and participated in
a focus group. The results of the study revealed that the major factors that determined the
students’ eating decisions were based on campus environment, emotional issues, family,
and weight control (Haley and Jahns). Campus life factors included schedule, social
8
eating, and emotional eating. Accessibility of food played a larger role than expected in
that the college students did not have large budgets which limited food choices. The food
diaries revealed that students’ food decisions affected their overall health because many
students find themselves in negative eating cycles due to adapting to time management in
college.
Boyce and Juijer (2015) examined the interaction between baseline BMI and
perceived stress in university freshman. The study surveyed participants to assess their
weight and then again after 7 months. The results showed that participants gained 1.10 kg
during their freshman year. The study also reveals that behaviors did not change but the
living situations played a role in weight gain.
College Environment Stressors
The college environment also places stressors on students that can lead to weight
gain. A study by Huang et al. (2003) of college students assessing overweight, obesity,
diet, and physical activity showed that college students may be overweight, obese, and
still fail to meet dietary recommendations. In order to determine overweight and obesity
status, participants self-reported their weight and height from which their BMI was then
calculated. Fruit, vegetable, and fiber intake was evaluated using the Berkeley Fruit,
Vegetable, and Fiber Screener (Block et al., 2000). Physical activity was assessed using
the Youth Risk Behavior Survey (CDC, 2016). It was found that men were more likely to
be overweight, two thirds of people did not consume enough fruits and vegetables, and
women did not eat enough fiber. Male students were also exercised more days than
females. Huang et al. found that a a large portion of participants were overweight and had
less healthy diets (2003). It is also noted that it is difficult to categorize overweight and

9
obesity in the college population because they are in transition from adolescence to
adulthood. The authors suggested that because of the lack of fruit and vegetables
consumed, there is a raised concern in future disease risk. Why is this the case? Because
a preponderance of evidence suggests that increasing fruit and vegetable intake plays an
important role in the prevention of chronic diseases (Ammerman,
The American Cancer Society (1996) has stated that greater consumption of
vegetables, fruits, or both together has been associated with a lower risk of lung cancer.
They reported that fruits and vegetables contain more than 100 beneficial vitamins,
minerals, fiber, and other substances such as phytochemicals which are protective against
several types of cancer. Beans, another vegetable, have also been shown to be protective
against cancer. Other agencies such as The United State Department of Agriculture and
the United States Department of Health and Human Services (2000), the National
Institutes of Health (1997), and the American Diabetes Association have all affirmed that
fruit and vegetable consumption leads to reduced risk for cancer, heart disease, and Type
II Diabetes, respectively.
In a study to identify the factors that contribute to college students eating patterns
LaCaille et al. (2011) recruited 49 students and placed them into six focus groups. The
six focus groups’ purpose was to identify factors that contribute to college students eating
patterns. The participants were asked open-ended questions that related to eating and
physical activity habits. Eating behavior was affected negatively by alcohol consumption,
the perceived inconvenience of food preparation, food cost, and perceived lack of food
choices in campus dining. Personal motivation was a factor in determining the eating
habits of men, and social life had an effect on eating habits in women.
10
Kandiah et al. (2005) studied the effect of stress on appetite and eating habits of
college students, and found that people who are stressed have a change in appetite and
choose sweet foods over healthier options. Three hundred fifteen students were surveyed
using a 45-item stress eating survey. The results also showed that people who want to eat
healthy typically eat less healthy when under stress. As determined by Kandiah et al
(2005), there is a significant effect of stress on appetite and eating habits in the college
population.
Raynor and Levine (2009) examined associations between the five-factor model
(FFM) of personality and several key health behaviors in six hundred three college
students. The FFM classifies all personality dimensions into 5 broad domains: openness,
conscientiousness, extraversion, agreeableness, and neuroticism. The majority of students
reported eating less than 2 servings of fruits and vegetables and half the participants
reported engaging in physical activity less than two days a week. The study also found
that many students participated in risky health behaviors, and that Greek affiliation
predicts risky behavior.
Hartwell et al. examined the effect of emotions on food consumption in a cafeteria
with four hundred eight potential diners. Participants were asked to complete the
emotional status questionnaire before eating and again once they had finished. When
there was a change in pre- and post- emotions, participants ate food that had a higher fat
percentage. When people were humiliated their meals were not fulfilling, and when they
were encouraged meals became for fulfilling. They reported that hat emotions can play a
role in what people eat and suggested that negative emotions are reduced when people eat
with others.
11
Gender Roles
Weight management in college can differ between male and female students and
classification year of the student. In a longitudinal cohort study which followed freshman
through their sophomore years found that weight gain was common in over two-thirds of
male and female college students. Participants were assessed at three separate times
during their freshman year, and assessed either three times or twice during their
sophomore year depending on the cohort number to which they were assigned. The
results of the study reveal that both male and females exhibited significant gains in
weight and percent body fat over the two-year period (Gropper et al., 2014). The study
also found that there is a negative relationship between weight, eating habits, motivation
and eating regulation in females, but this was not found in males. The women who had a
more regulated eating pattern had lower BMI, weight, and fat. Men with less eating
regulation and less motivation had a higher BMI and body fat.
Greek Affiliation
Does Greek Affiliation have any effect on college weight gain? Although this is a
question that is often asked, there have been few studies conducted that address the role
of the Greek system in college students weight and behavior. Scott-Sheldon, K. Carey
and M. Carey administered questionnaires examining risky behaviors, eating, physical
activity, and sleeping and found no significant difference in behavior between freshmen
and upperclassmen, but that Greek affiliation does significantly impact eating and
exercise behavior among college students (2007). Of the students surveyed, 17% were
members of Greek organizations. Eating behavior was assessed by analyzing how many
12
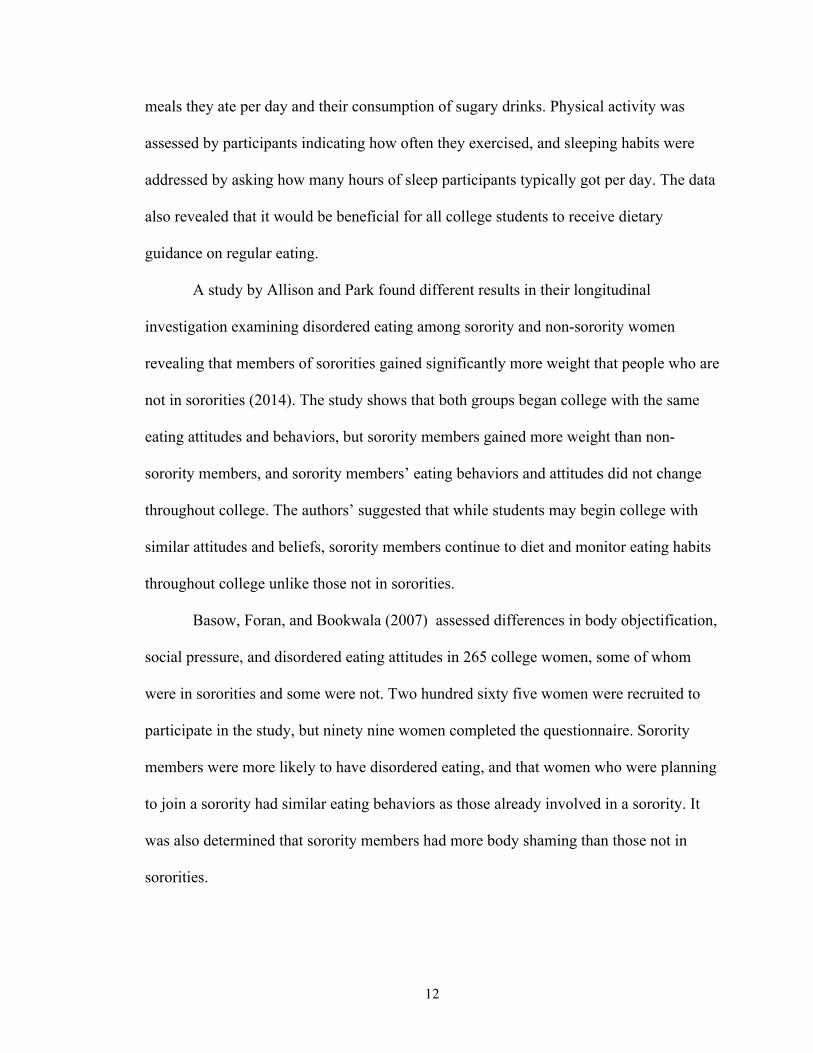
meals they ate per day and their consumption of sugary drinks. Physical activity was
assessed by participants indicating how often they exercised, and sleeping habits were
addressed by asking how many hours of sleep participants typically got per day. The data
also revealed that it would be beneficial for all college students to receive dietary
guidance on regular eating.
A study by Allison and Park found different results in their longitudinal
investigation examining disordered eating among sorority and non-sorority women
revealing that members of sororities gained significantly more weight that people who are
not in sororities (2014). The study shows that both groups began college with the same
eating attitudes and behaviors, but sorority members gained more weight than non-
sorority members, and sorority members’ eating behaviors and attitudes did not change
throughout college. The authors’ suggested that while students may begin college with
similar attitudes and beliefs, sorority members continue to diet and monitor eating habits
throughout college unlike those not in sororities.
Basow, Foran, and Bookwala (2007) assessed differences in body objectification,
social pressure, and disordered eating attitudes in 265 college women, some of whom
were in sororities and some were not. Two hundred sixty five women were recruited to
participate in the study, but ninety nine women completed the questionnaire. Sorority
members were more likely to have disordered eating, and that women who were planning
to join a sorority had similar eating behaviors as those already involved in a sorority. It
was also determined that sorority members had more body shaming than those not in
sororities.
13
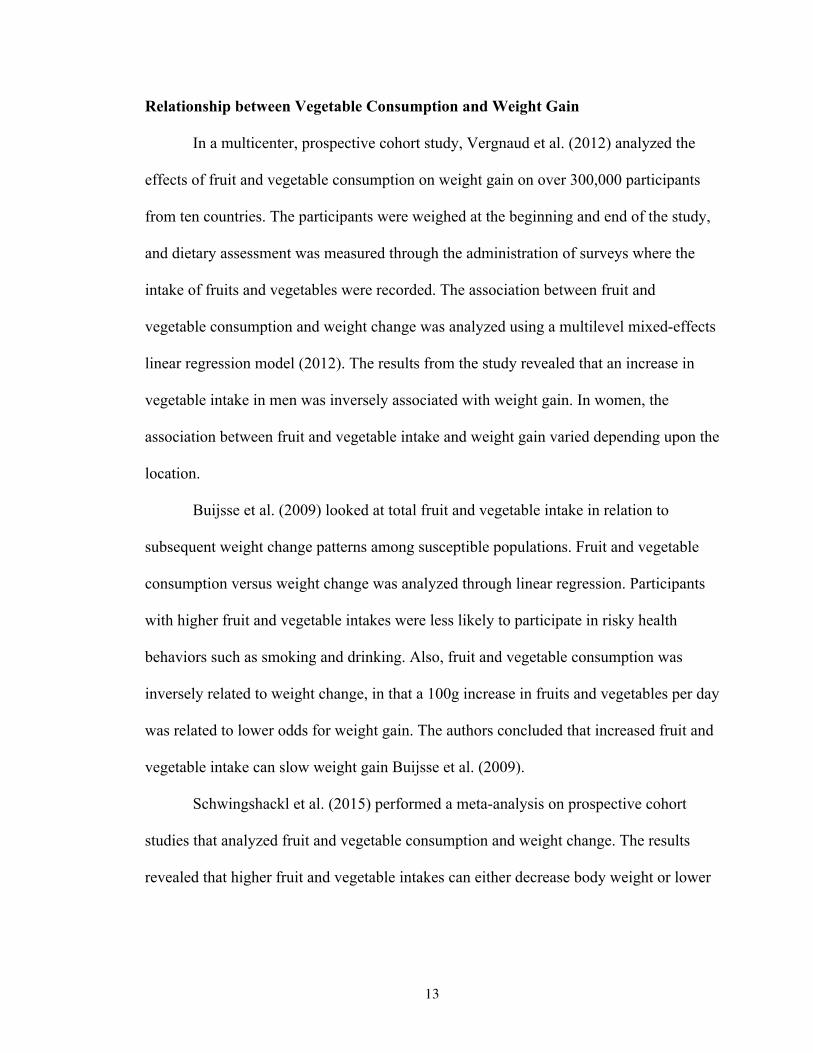
Relationship between Vegetable Consumption and Weight Gain
In a multicenter, prospective cohort study, Vergnaud et al. (2012) analyzed the
effects of fruit and vegetable consumption on weight gain on over 300,000 participants
from ten countries. The participants were weighed at the beginning and end of the study,
and dietary assessment was measured through the administration of surveys where the
intake of fruits and vegetables were recorded. The association between fruit and
vegetable consumption and weight change was analyzed using a multilevel mixed-effects
linear regression model (2012). The results from the study revealed that an increase in
vegetable intake in men was inversely associated with weight gain. In women, the
association between fruit and vegetable intake and weight gain varied depending upon the
location.
Buijsse et al. (2009) looked at total fruit and vegetable intake in relation to
subsequent weight change patterns among susceptible populations. Fruit and vegetable
consumption versus weight change was analyzed through linear regression. Participants
with higher fruit and vegetable intakes were less likely to participate in risky health
behaviors such as smoking and drinking. Also, fruit and vegetable consumption was
inversely related to weight change, in that a 100g increase in fruits and vegetables per day
was related to lower odds for weight gain. The authors concluded that increased fruit and
vegetable intake can slow weight gain Buijsse et al. (2009).
Schwingshackl et al. (2015) performed a meta-analysis on prospective cohort
studies that analyzed fruit and vegetable consumption and weight change. The results
revealed that higher fruit and vegetable intakes can either decrease body weight or lower

14
weight gain, and that high fruit and vegetable consumption was associated with less
consumption of refined carbohydrates (Schwingshackl et al., 2015).
Vegetable Consumption
According to the 2013 Behavioral Risk Factor Surveillance System (BRFSS)
(2017) data only one-in-ten adults meet the federal fruit and vegetable recommendations.
Although consumption does vary greatly from state to state, consistently lower intakes
were found among men, young adults, and adults living in poverty. Ha and Caine-Bish
(2009) assessed the dietary intake of vegetables in college students through the use of
food diaries. Participants recorded their intakes over a 3-day period. The intake values
were then compared with the MyPyramid food guidance system (2009). Results revealed
that consumption of fruits and vegetables was low with over seventy percent of
participants eating a cup or less per day.
Tam et al. (2017) examined the body mass index (BMI) values of students as
related to their fruit and vegetable intakes. Students kept a three-day diet record and a
physical activity record. The participants were educated on serving sizes of vegetables
prior to keeping the food records, and the average numbers of servings of fruits and
vegetables were determined by dividing the sum of the total amount consumed by three.
The average amount of fruits and vegetables consumed was three servings per day. This
falls below the five to nine recommended servings of fruits and vegetables by the Center
for Disease Controls and Prevention.
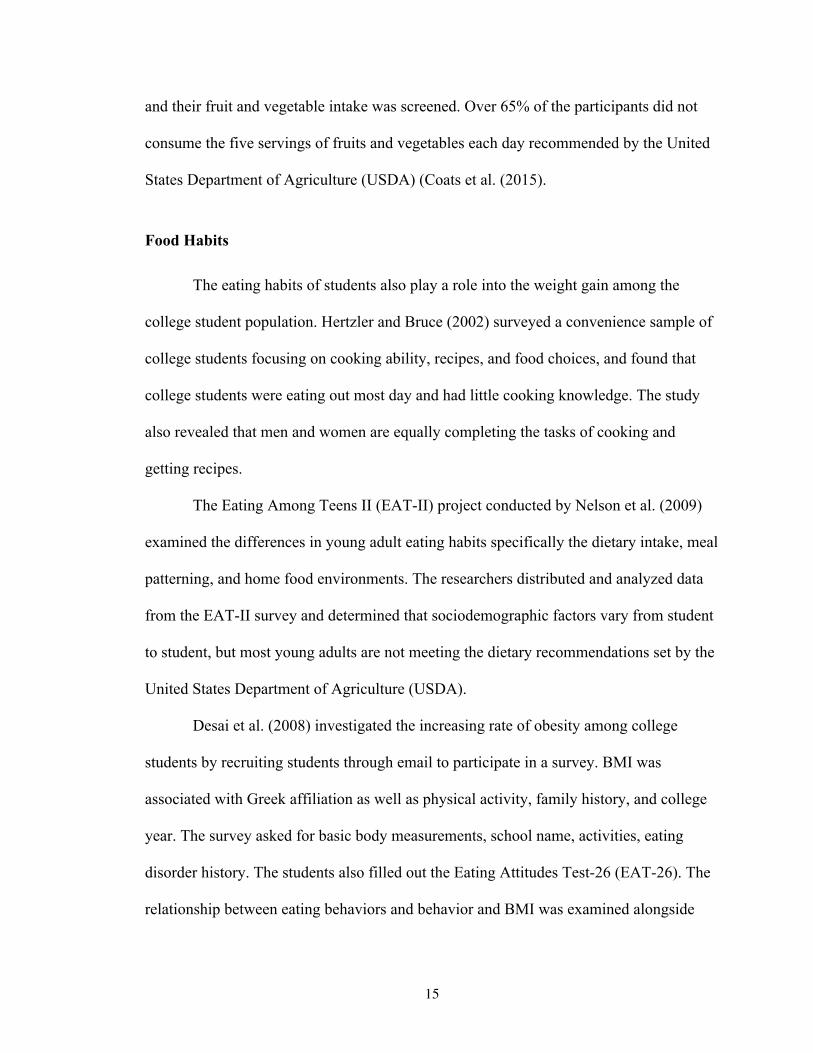
Coats et al. (2015) examined the fruit and vegetable consumption of freshmen
students at Mississippi State University. Participants completed a demographic survey
15
and their fruit and vegetable intake was screened. Over 65% of the participants did not
consume the five servings of fruits and vegetables each day recommended by the United
States Department of Agriculture (USDA) (Coats et al. (2015).
Food Habits
The eating habits of students also play a role into the weight gain among the
college student population. Hertzler and Bruce (2002) surveyed a convenience sample of
college students focusing on cooking ability, recipes, and food choices, and found that
college students were eating out most day and had little cooking knowledge. The study
also revealed that men and women are equally completing the tasks of cooking and
getting recipes.
The Eating Among Teens II (EAT-II) project conducted by Nelson et al. (2009)
examined the differences in young adult eating habits specifically the dietary intake, meal
patterning, and home food environments. The researchers distributed and analyzed data
from the EAT-II survey and determined that sociodemographic factors vary from student
to student, but most young adults are not meeting the dietary recommendations set by the
United States Department of Agriculture (USDA).
Desai et al. (2008) investigated the increasing rate of obesity among college
students by recruiting students through email to participate in a survey. BMI was
associated with Greek affiliation as well as physical activity, family history, and college
year. The survey asked for basic body measurements, school name, activities, eating
disorder history. The students also filled out the Eating Attitudes Test-26 (EAT-26). The
relationship between eating behaviors and behavior and BMI was examined alongside
16
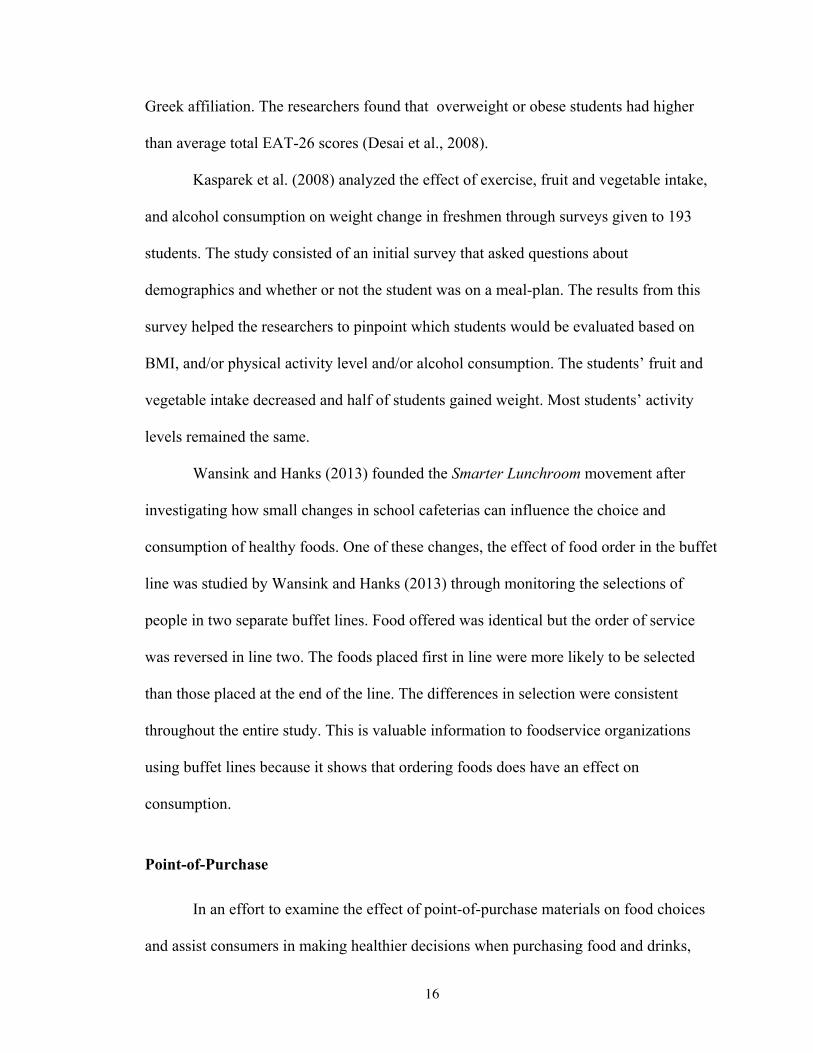
Greek affiliation. The researchers found that overweight or obese students had higher
than average total EAT-26 scores (Desai et al., 2008).
Kasparek et al. (2008) analyzed the effect of exercise, fruit and vegetable intake,
and alcohol consumption on weight change in freshmen through surveys given to 193
students. The study consisted of an initial survey that asked questions about
demographics and whether or not the student was on a meal-plan. The results from this
survey helped the researchers to pinpoint which students would be evaluated based on
BMI, and/or physical activity level and/or alcohol consumption. The students’ fruit and
vegetable intake decreased and half of students gained weight. Most students’ activity
levels remained the same.
Wansink and Hanks (2013) founded the Smarter Lunchroom movement after
investigating how small changes in school cafeterias can influence the choice and
consumption of healthy foods. One of these changes, the effect of food order in the buffet
line was studied by Wansink and Hanks (2013) through monitoring the selections of
people in two separate buffet lines. Food offered was identical but the order of service
was reversed in line two. The foods placed first in line were more likely to be selected
than those placed at the end of the line. The differences in selection were consistent
throughout the entire study. This is valuable information to foodservice organizations
using buffet lines because it shows that ordering foods does have an effect on
consumption.
Point-of-Purchase
In an effort to examine the effect of point-of-purchase materials on food choices
and assist consumers in making healthier decisions when purchasing food and drinks,
17
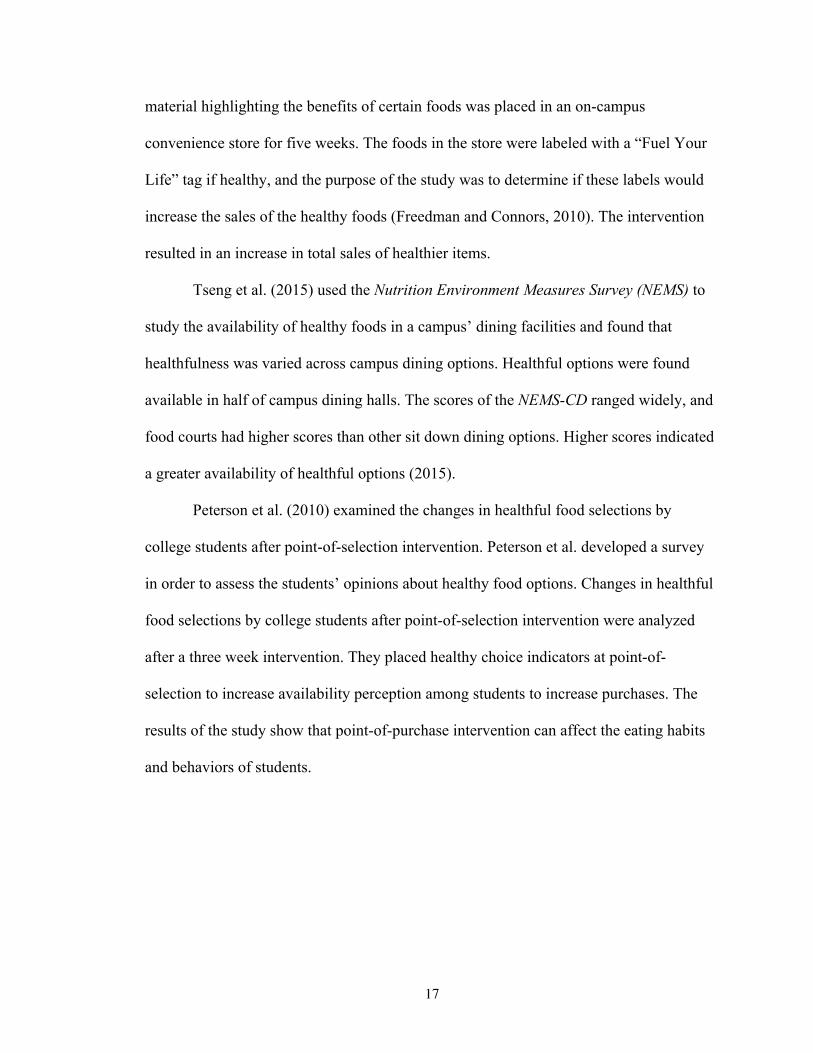
material highlighting the benefits of certain foods was placed in an on-campus
convenience store for five weeks. The foods in the store were labeled with a “Fuel Your
Life” tag if healthy, and the purpose of the study was to determine if these labels would
increase the sales of the healthy foods (Freedman and Connors, 2010). The intervention
resulted in an increase in total sales of healthier items.
Tseng et al. (2015) used the Nutrition Environment Measures Survey (NEMS) to
study the availability of healthy foods in a campus’ dining facilities and found that
healthfulness was varied across campus dining options. Healthful options were found
available in half of campus dining halls. The scores of the NEMS-CD ranged widely, and
food courts had higher scores than other sit down dining options. Higher scores indicated
a greater availability of healthful options (2015).
Peterson et al. (2010) examined the changes in healthful food selections by
college students after point-of-selection intervention. Peterson et al. developed a survey
in order to assess the students’ opinions about healthy food options. Changes in healthful
food selections by college students after point-of-selection intervention were analyzed
after a three week intervention. They placed healthy choice indicators at point-of-
selection to increase availability perception among students to increase purchases. The
results of the study show that point-of-purchase intervention can affect the eating habits
and behaviors of students.
18
Chapter 3: Methods
The Greek house system, on the University of Mississippi campus has houses that
contain living, studying, food service, and sleeping areas. While not all members actually
live in the houses, members can take advantage of the common areas anytime. The
houses have House Directors who manage the staff, develop the menus, and the purchase
the food. Most members do not have a campus meal plan once they join a Greek house,
and often get their nutrition from the meals provided at their respective house. Meals at
Greek houses are typically buffet-style, and there is no restriction on what a person
chooses from available foods or how much they eat.
The purpose of this project was to determine if a point-of-purchase nutrition
intervention targeting vegetables offered during lunch would have an effect on the
amount of vegetables selected from one sorority’s salad bar. The intervention followed
the method which Peterson et al. (2010) used in their study except there was no
reordering of the food in the foodservice line.
Approval from the University of Mississippi’s Institutional Review Board (IRB)
was granted at the beginning of the study, and allowed the primary investigator to place
point-of-purchase materials on the tray line of a sorority house at lunch and measure the
amount of vegetables set out and recovered from the salad bar. The house serves lunch
daily, Mondays through Fridays, to approximately 400 female members between the ages
of 18-23 years.

19
Intervention
The study lasted for three weeks in the spring. Vegetable selection was monitored
through weighing the amount of food before and after the 11 A.M. through 1 P.M. lunch
period. Amounts of vegetables set out and recovered were measured by weighing during
the first week of the study. The point-of- purchase materials were placed at the beginning
of the foodservice line for a two week period and amounts of vegetables set out and
recovered were weighed during that two weeks. All point-of-purchase material can be
found in Appendix B.
Statistical Analysis
Data was analyzed using Analysis of Variance (ANOVA) to look for differences
in weekly means of total vegetable selection. Weeks served as treatments because each
week received a different level of point-of-purchase information (none, one-week, and
two-weeks of information). This was followed by Student-Newman-Kewles Test (SNK)
to separate the means (determine which means were significantly different) when
differences were found. Student’s t-tests were conducted on the weekly means for each
vegetable to determine differences over time.
20
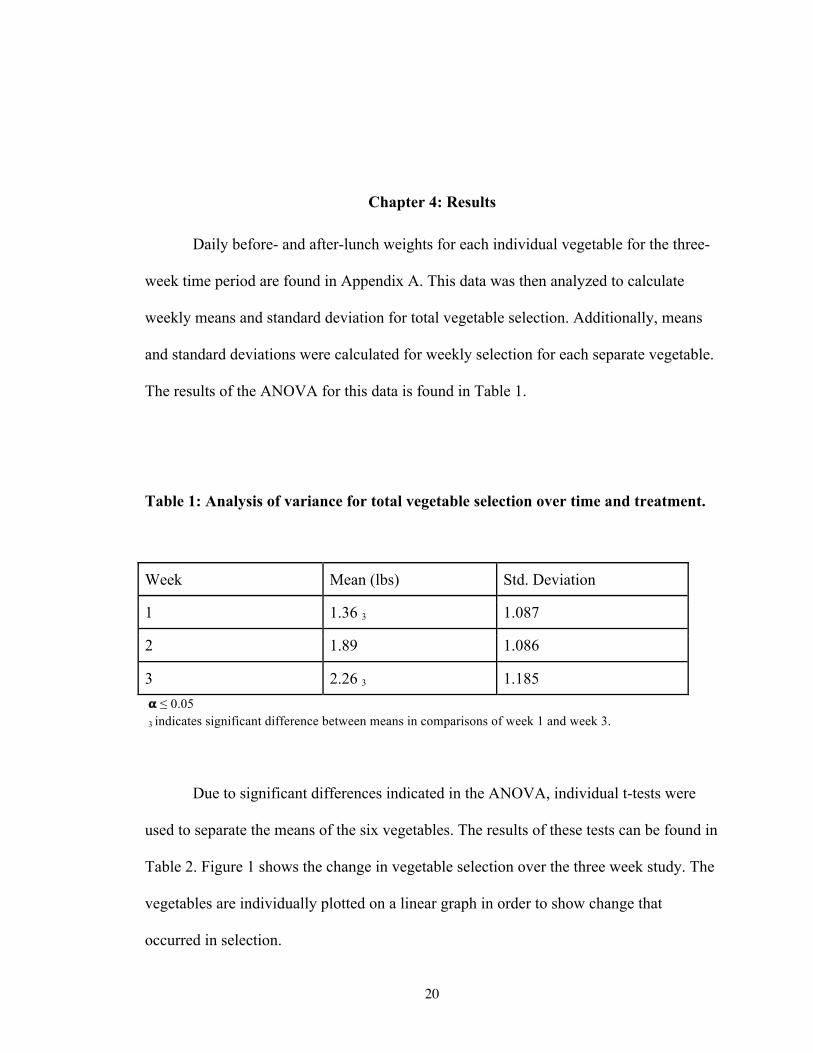
Chapter 4: Results
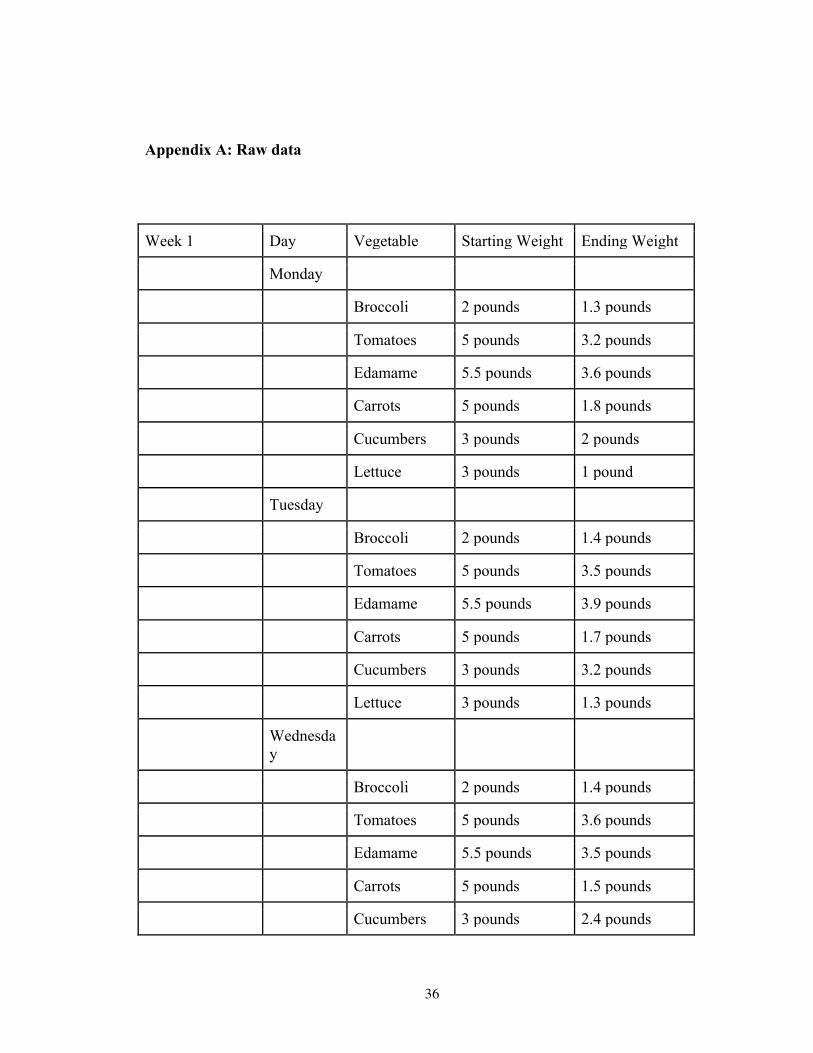
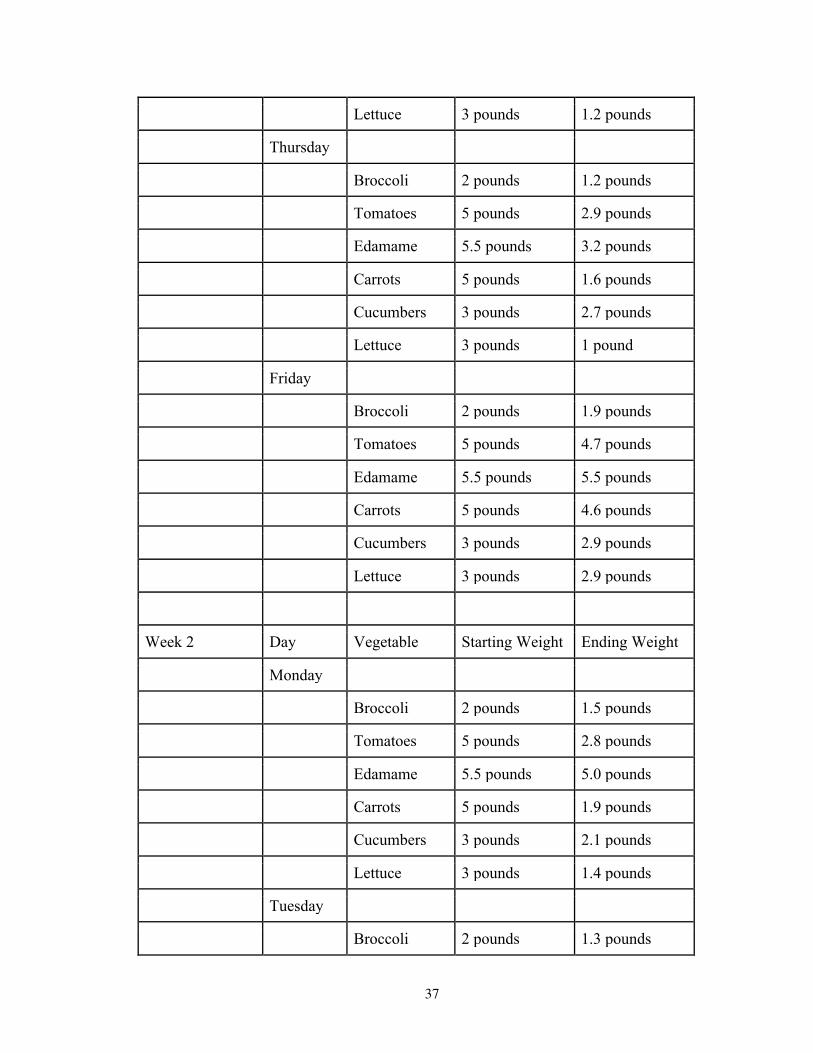
Daily before- and after-lunch weights for each individual vegetable for the three-
week time period are found in Appendix A. This data was then analyzed to calculate
weekly means and standard deviation for total vegetable selection. Additionally, means
and standard deviations were calculated for weekly selection for each separate vegetable.
The results of the ANOVA for this data is found in Table 1.
Table 1: Analysis of variance for total vegetable selection over time and treatment.
Week Mean (lbs) Std. Deviation
1 1.36 3 1.087
2 1.89 1.086
3 2.26 3 1.185 𝛂 ≤ 0.05 3 indicates significant difference between means in comparisons of week 1 and week 3.
Due to significant differences indicated in the ANOVA, individual t-tests were
used to separate the means of the six vegetables. The results of these tests can be found in
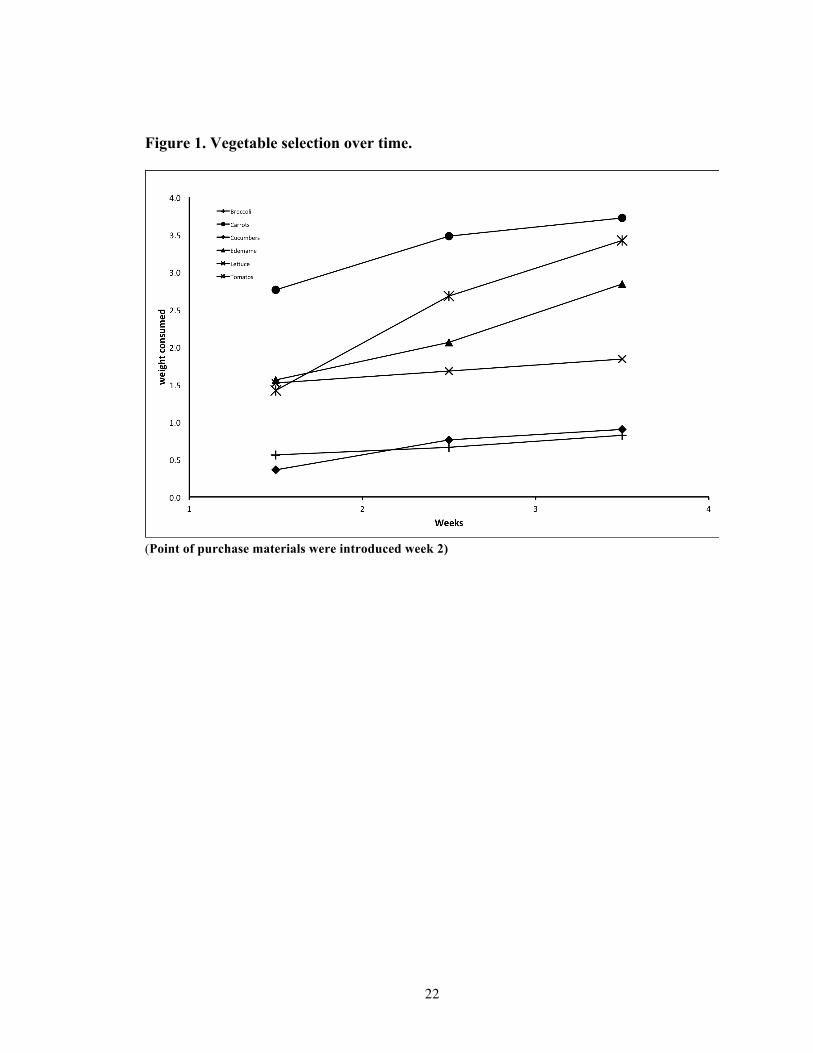
Table 2. Figure 1 shows the change in vegetable selection over the three week study. The
vegetables are individually plotted on a linear graph in order to show change that
occurred in selection.
21
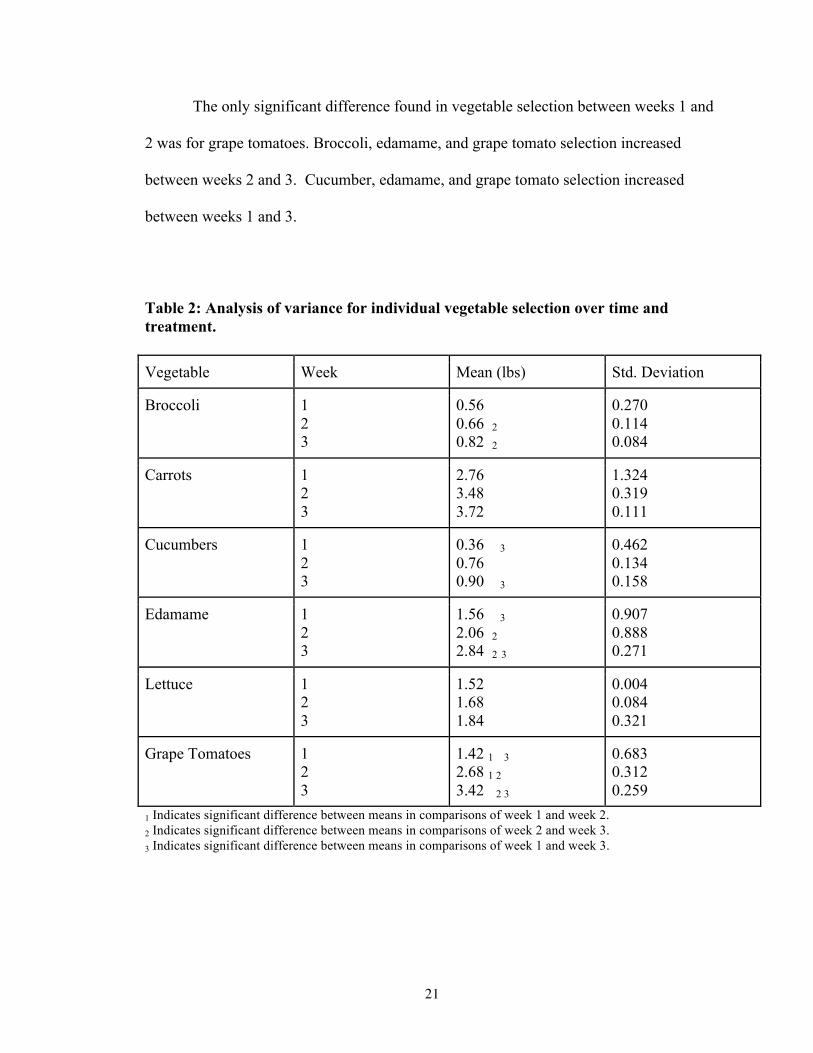
The only significant difference found in vegetable selection between weeks 1 and
2 was for grape tomatoes. Broccoli, edamame, and grape tomato selection increased
between weeks 2 and 3. Cucumber, edamame, and grape tomato selection increased
between weeks 1 and 3.
Table 2: Analysis of variance for individual vegetable selection over time and treatment.
Vegetable Week Mean (lbs) Std. Deviation
Broccoli 1 2 3
0.56 0.66 2 0.82 2
0.270 0.114 0.084
Carrots 1 2 3
2.76 3.48 3.72
1.324 0.319 0.111
Cucumbers 1 2 3
0.36 3 0.76 0.90 3
0.462 0.134 0.158
Edamame 1 2 3
1.56 3 2.06 2 2.84 2 3
0.907 0.888 0.271
Lettuce 1 2 3
1.52 1.68 1.84
0.004 0.084 0.321
Grape Tomatoes 1 2 3
1.42 1 3 2.68 1 2 3.42 2 3
0.683 0.312 0.259
1 Indicates significant difference between means in comparisons of week 1 and week 2. 2 Indicates significant difference between means in comparisons of week 2 and week 3. 3 Indicates significant difference between means in comparisons of week 1 and week 3.
22
Figure 1. Vegetable selection over time.
(Point of purchase materials were introduced week 2)
23
Chapter 5: Discussion
Greek houses offer breakfast, lunch, and dinner during the week, and most
members eat most of their meals there due to convenience and the fact that the meals are
paid for in membership dues. Because this is where many members are getting their
nutrients, an intervention to increase vegetable selection by the members was considered
beneficial.
This focused on increasing the selection of vegetables by members of a Greek
organization through the use of point-of-purchase materials to market the health benefits
of eating these vegetables. The hypothesis that increased amounts of vegetables would be
selected during meals due to point of purchase intervention is supported by the results of
this study.
When the means of the total amounts of vegetables from weeks 1 through 3 were
compared there was no significant difference between the total amount of vegetables
selected from the salad bar between weeks 1 and 2 but there was a difference in amounts
between weeks 1 and 3. This supports Peterson et al. (2010) who suggested that it
probably takes more than one week for point-of-purchase materials to be effective.
When mean differences of the individual vegetables were compared, only tomato
selection was significantly increase from week 1 to week 2. However, significant
differences in the means were seen between weeks 2 and 3 for broccoli, edamame, and
tomatoes and between weeks 1 and 3 for cucumber, edamame, and tomatoes. No
differences in the means were seen for carrots or lettuce.
24
These differences were not due to variability in food source as all vegetables were
procured from the same vendor. Seasonality was not a factor because all vegetables were
purchased during late winter. As Peterson et al. (2010) also suggested, there is also the
possibility that students are already eating a significant amount of lettuce and they were
not just going to take more. Lettuce and carrots could have stayed the same because they
were already more popular in general. Also, the density of lettuce would be less than that
of other vegetables offered, so the lack of a significant difference in lettuce selection
could be due to the fact that students could only get so much lettuce on a plate. Some of
the point-of-purchase materials such as “dipping in ranch or peanut butter” could have
shown students how to eat other vegetables in other ways.
25
Chapter 6: Conclusions
A goal of the study was to determine if marketing vegetables through point-of-
purchase materials would increase the overall selection of the vegetables offered during
on the salad bar during lunch at a Greek organization. Results revealed that point-of-
purchase marketing did increase the selection of vegetables. While there is little research
conducted towards nutrition and food service in the Greek system on college campuses,
with the increasing obesity rates of students it is important that this area of continues to
be explored.

26
List of References
27
Adolescent and School Health. (2018, March 22). Retrieved April 04, 2018, from
https://www.cdc.gov/healthyyouth/data/yrbs/index.htm
Alfano, S. (2006, October 23). Study: College Weight Gain Gradual. Retrieved February
28, 2018, from https://www.cbsnews.com/news/study-college-weight-gain-
gradual/
Allison, K. C., & Park, C. L. (2004). A Prospective Study of Disordered Eating Among
Sorority and Non-sorority Women. International Journal of Eating Disorders,
35(3), 354-358. doi:10.1002/eat.10255
American Diabetes Association. ADA: clinical practive reccomendations 2000. Diabetes
Care 2000;23:S1-S116.
Barry, A. E., & Piazza-Gardner, A. K. (2012). Drunkorexia: Understanding the Co-
occurrence of Alcohol Consumption and Eating/Exercise Weight Management
Behaviors. Journal of American College Health, 60(3), 236-243.
doi:10.1080/07448481.2011.587487
Basow, S. A., Foran, K. A., & Bookwala, J. (2007). Body Objectification, Social
Pressure, and Disordered Eating Behavior in College Women: The Role of
Sorority Membership. Psychology of Women Quarterly, 31(4), 394-400.
doi:10.1111/j.1471-6402.2007.00388.x
Block, G., Gillespie, C., Rosenbaum, EH., Jenson, C. (2000). A rapid food screener to
assess fat and fruit and vegetable intake. Am J Prev Med; 18:284-288.
28
Boyce, J. A., & Kuijer, R. G. (2015). Perceived stress and freshman weight change: The
Moderating Role of Baseline Body Mass Index. Physiology & Behavior, 139,
491-496. doi:10.1016/j.physbeh.2014.12.011
Buijsse, B., Feskens, E. J., Schulze, M. B., Forouhi, N. G., Wareham, N. J., Sharp, S., . . .
Boeing, H. (2009). Fruit and vegetable intakes and subsequent changes in body
weight in European populations: Results from the project on Diet, Obesity, and
Genes (DiOGenes). The American Journal of Clinical Nutrition, 90(1), 202-209.
doi:10.3945/ajcn.2008.27394
Childers, C. C., Haley, E., & Jahns, L. (2011). Insights into University Freshman Weight
Issues and How They Make Decisions About Eating. Journal of Consumer
Affairs, 45(2), 306-328. doi:10.1111/j.1745-6606.2011.01204.x
Coats, L., Byrd, S., Buys, D., & Fountain, B. (2015). Fruit and Vegetable Consumption
in College Freshmen at Mississippi State University. Journal of the Academy of
Nutrition and Dietetics, 115(9). doi:10.1016/j.jand.2015.06.060
Deforche, B., Dyck, D. V., Deliens, T., & Bourdeaudhuij, I. D. (2015). Changes in
Weight, Physical Activity, Sedentary Behaviour and Dietary Intake During the
Transition to Higher Education: A Prospective Study. International Journal of
Behavioral Nutrition and Physical Activity, 12(1), 16. doi:10.1186/s12966-015-
0173-9
Desai, M. N., Miller, W. C., Staples, B., & Bravender, T. (2008). Risk Factors Associated
With Overweight and Obesity in College Students. Journal of American College
Health, 57(1), 109-114. doi:10.3200/jach.57.1.109-114

29
Filipkowski, K. B., Heron, K. E., & Smyth, J. M. (2016). Early Adverse Experiences and
Health: The Transition to College. American Journal of Health Behavior, 40(6),
717-728. doi:10.5993/ajhb.40.6.4
Freedman, M. R., & Connors, R. (2011). Point-of-Purchase Nutrition Information
Influences Food-Purchasing Behaviors of College Students: A Pilot Study.
Journal of the American Dietetic Association, 111(5).
doi:10.1016/j.jada.2011.03.008
Gropper, S. S., Arsiwalla, D. D., Lord, D. C., Huggins, K. W., Simmons, K. P., & Ulrich,
P. V. (2014). Associations Among Eating Regulation and Body Mass Index,
Weight, and Body Fat in College Students: The Moderating Role of Gender.
Eating Behaviors, 15(2), 321-327. doi:10.1016/j.eatbeh.2014.04.002
Guidelines on diet, nutrition, and cancer prevention: Reducing the risk of cancer with
healthy food choices and physical activity. The American Cancer Society 1996
Advisory Committee on Diet, Nutrition, and Cancer Prevention. (1996). CA: A
Cancer Journal for Clinicians, 46(6), 325-341. doi:10.3322/canjclin.46.6.325
Ha, E., & Caine-Bish, N. (2009). Effect of Nutrition Intervention Using a General
Nutrition Course for Promoting Fruit and Vegetable Consumption among College
Students. Journal of Nutrition Education and Behavior, 41(2), 103-109.
doi:10.1016/j.jneb.2008.07.001
Hartwell, H. J., Edwards, J. S., & Brown, L. (2012). The Relationship Between Emotions
and Food Consumption (macronutrient) in a Foodservice College Setting – A
Preliminary Study. International Journal of Food Sciences and Nutrition, 64(3),
261-268. doi:10.3109/09637486.2012.734288
30
Hellmich, N. (2012, August 29). Drinking, Overeating Pack on Pounds in College.
Retrieved February 28, 2018, from
https://usatoday30.usatoday.com/news/health/backtoschool/story/2012-08-
29/college-healthy-
eating/57375226/1?fb_comment_id=130332233779956_169610#mainstory
Hertzler, A. A., & Bruce, F. (2002). Cooking, Recipe Use and Food Habits of College
Students and Nutrition Educators. International Journal of Consumer Studies,
26(4), 340-345. doi:10.1046/j.1470-6431.2002.00248.x
Huang, T. T., PhD, MPH, Harris, K. J., PhD, MPH, Lee, R. E., PhD, Nazir, N., MBBS,
MPH, Born, W., PhD, & Kaur, H., MD, MPH. (2003). Assessing Overweight,
Obesity, Diet, and Physical Activity in College Students. Journal of American
College Health, 52(2).
Kandiah, J., Yake, M., Jones, J., & Meyer, M. (2006). Stress Influences Appetite and
Comfort Food Preferences in College Women. Nutrition Research, 26(3), 118-
123. doi:10.1016/j.nutres.2005.11.010
Kasparek, D. G., Corwin, S. J., Valois, R. F., Sargent, R. G., & Morris, R. L. (2008).
Selected Health Behaviors That Influence College Freshman Weight Change.
Journal of American College Health, 56(4), 437-444. doi:10.3200/jach.56.44.437-
444
Lacaille, L. J., Dauner, K. N., Krambeer, R. J., & Pedersen, J. (2011). Psychosocial and
Environmental Determinants of Eating Behaviors, Physical Activity, and Weight
Change Among College Students: A Qualitative Analysis. Journal of American
College Health, 59(6), 531-538. doi:10.1080/07448481.2010.523855
31
Lee-Kwan, S. H., Moore, L. V., Blanck, H. M., Harris, D. M., & Galuska, D. (2017).
Disparities in State-Specific Adult Fruit and Vegetable Consumption — United
States, 2015. MMWR. Morbidity and Mortality Weekly Report, 66(45), 1241-
1247. doi:10.15585/mmwr.mm6645a1
Mize, Blair, and Melinda Valliant. “An Assessment of Panhellenic Sorority Member
Meal Consumption Patterns.” Oracle: The Reasearch Journal of the Association
of Fraternity/ Sorority Advisors, vol. 7, no. 2, 2012, pp. 49–59.
Moosa, J.M. (2008). [A menu analysis of Ole Miss sororites]. Unpublished masters
thesis.
National Institutes of Health, National Heart, Lung, and Blood Institute, National High
Blood Pressure Education Program. The sixth report of the Joint National
Committee on prevention, detection, evaluation, and treatment of high blood
pressure, NIH Publication, 1997.
Nelson, M. C., Larson, N. I., Barr-Anderson, D., Neumark-Sztainer, D., & Story, M.
(2009). Disparities in Dietary Intake, Meal Patterning, and Home Food
Environments Among Young Adult Nonstudents and 2- and 4-Year College
Students. American Journal of Public Health, 99(7), 1216-1219.
doi:10.2105/ajph.2008.147454
Park, A., Sher, K. J., Wood, P. K., & Krull, J. L. (2009). Dual Mechanisms Underlying
Accentuation of Risky Drinking via Fraternity/Sorority Affiliation: The Role of
Personality, Peer Norms, and Alcohol Availability. Journal of Abnormal
Psychology, 118(2), 241-255. http://dx.doi.org/10.1037/a0015126
32
Peterson, S., Duncan, D. P., Null, D. B., Roth, S. L., & Gill, L. (2010). Positive Changes
in Perceptions and Selections of Healthful Foods by College Students After a
Short-Term Point-of-Selection Intervention at a Dining Hall. Journal of American
College Health, 58(5), 425-431. doi:10.1080/07448480903540457
Prushinski, G., Etaugh, C., Sas, M., & Newell, A. (2017). “The Freshman Fifteen:”
Prevalence and Predictors of Weight Gain Among College Freshmen Students.
Journal of the Academy of Nutrition and Dietetics, 117(9).
doi:10.1016/j.jand.2017.06.336
Raynor, D. A., & Levine, H. (2009). Associations Between the Five-Factor Model of
Personality and Health Behaviors Among College Students. Journal of American
College Health, 58(1), 73-82. doi:10.3200/jach.58.1.73-82
Scott-Sheldon, L. A., Carey, K. B., & Carey, M. P. (2007). Health Behavior and College
Students: Does Greek Affiliation Matter? Journal of Behavioral Medicine, 31(1),
61-70. doi:10.1007/s10865-007-9136-1
Schwingshackl, L., Hoffmann, G., Kalle-Uhlmann, T., Arregui, M., Buijsse, B., &
Boeing, H. (2015). Fruit and Vegetable Consumption and Changes in
Anthropometric Variables in Adult Populations: A Systematic Review and Meta-
Analysis of Prospective Cohort Studies. Plos One, 10(10).
doi:10.1371/journal.pone.0140846
Sher, K. J., & Rutledge, P. C. (2007). Heavy Drinking Across the Transition to College:
Predicting First-semester Heavy Drinking from Precollege Variables. Addictive
Behaviors, 32(4), 819-835. doi:10.1016/j.addbeh.2006.06.024
33
Tam, C. F., Xi, E., Chan, V., & Gouzoubachain, A. (2017). An inverse correlation
between fruit and vegetable consumption and bmi among college female and male
students. College Student Journal.
Tseng, M., Degreef, K., Fishler, M., Gipson, R., Koyano, K., & Neill, D. B. (2016).
Assessment of a University Campus Food Environment, California, 2015.
Preventing Chronic Disease, 13. doi:10.5888/pcd13.150455
USDA Dietary Guidelines for Americans 2015-2020. (n.d.). Retrieved from
https://health.gov/dietaryguidelines/2015/resources/2015-
2020_Dietary_Guidelines.pdf
U.S. Department of Health and Human Services. Healthy people 2010: understanding and
improving health and objectives for improving health (2 Vols.). Washington, DC,
U.S. Govt Printing Office, 2000.
Vergnaud, A., Norat, T., Romaguera, D., Mouw, T., May, A. M., Romieu, I., . . . Peeters,
P. H. (2011). Fruit and vegetable consumption and prospective weight change in
participants of the European Prospective Investigation into Cancer and Nutrition–
Physical Activity, Nutrition, Alcohol, Cessation of Smoking, Eating Out of
Home, and Obesity study. The American Journal of Clinical Nutrition, 95(1),
184-193. doi:10.3945/ajcn.111.019968
Wansink, B., & Hanks, A. S. (2013). Slim by Design: Serving Healthy Foods First in
Buffet Lines Improves Overall Meal Selection. SSRN Electronic Journal.
doi:10.2139/ssrn.2324615

34
Wengreen, H. J., & Moncur, C. (2009). Change in Diet, Physical Activity, and Body
Weight Among Young-adults During the Transition from High School to College.
Nutrition Journal, 8(1). doi:10.1186/1475-2891-8-32

35
Appendices
36
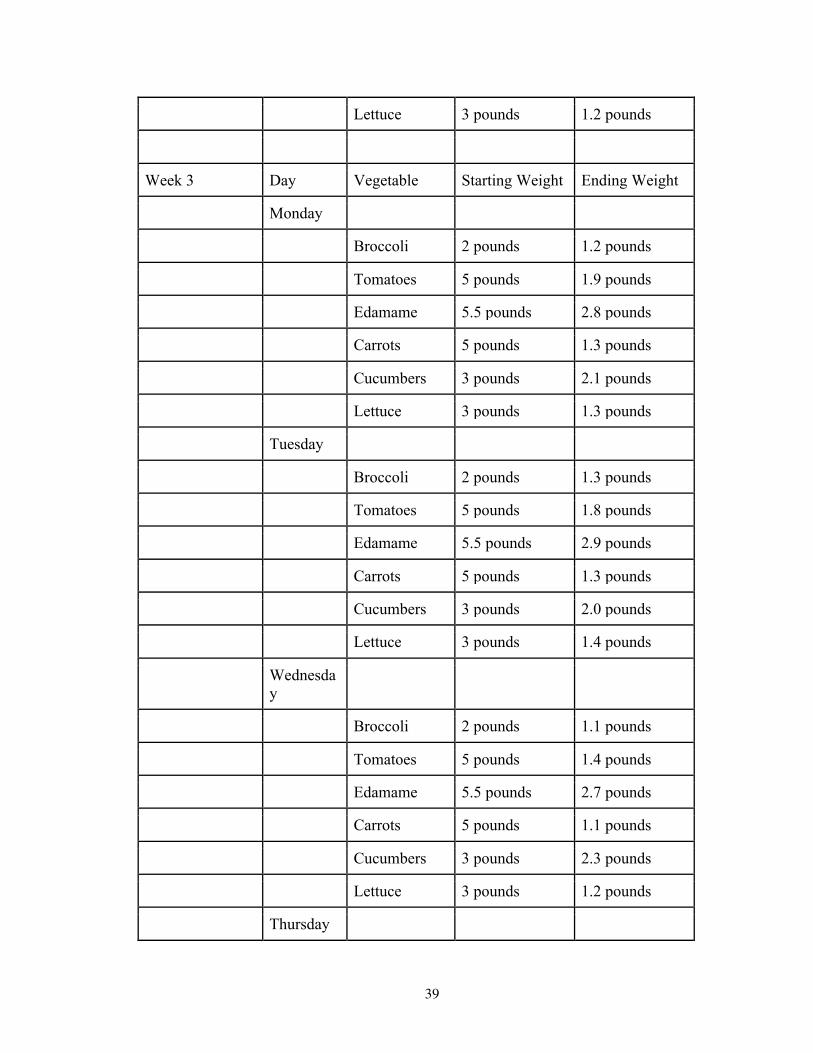
Appendix A: Raw data
Week 1 Day Vegetable Starting Weight Ending Weight
Monday
Broccoli 2 pounds 1.3 pounds
Tomatoes 5 pounds 3.2 pounds
Edamame 5.5 pounds 3.6 pounds
Carrots 5 pounds 1.8 pounds
Cucumbers 3 pounds 2 pounds
Lettuce 3 pounds 1 pound
Tuesday
Broccoli 2 pounds 1.4 pounds
Tomatoes 5 pounds 3.5 pounds
Edamame 5.5 pounds 3.9 pounds
Carrots 5 pounds 1.7 pounds
Cucumbers 3 pounds 3.2 pounds
Lettuce 3 pounds 1.3 pounds
Wednesday
Broccoli 2 pounds 1.4 pounds
Tomatoes 5 pounds 3.6 pounds
Edamame 5.5 pounds 3.5 pounds
Carrots 5 pounds 1.5 pounds
Cucumbers 3 pounds 2.4 pounds
37
Lettuce 3 pounds 1.2 pounds
Thursday
Broccoli 2 pounds 1.2 pounds
Tomatoes 5 pounds 2.9 pounds
Edamame 5.5 pounds 3.2 pounds
Carrots 5 pounds 1.6 pounds
Cucumbers 3 pounds 2.7 pounds
Lettuce 3 pounds 1 pound
Friday
Broccoli 2 pounds 1.9 pounds
Tomatoes 5 pounds 4.7 pounds
Edamame 5.5 pounds 5.5 pounds
Carrots 5 pounds 4.6 pounds
Cucumbers 3 pounds 2.9 pounds
Lettuce 3 pounds 2.9 pounds
Week 2 Day Vegetable Starting Weight Ending Weight
Monday
Broccoli 2 pounds 1.5 pounds
Tomatoes 5 pounds 2.8 pounds
Edamame 5.5 pounds 5.0 pounds
Carrots 5 pounds 1.9 pounds
Cucumbers 3 pounds 2.1 pounds
Lettuce 3 pounds 1.4 pounds
Tuesday
Broccoli 2 pounds 1.3 pounds

38
Tomatoes 5 pounds 2.4 pounds
Edamame 5.5 pounds 3.3 pounds
Carrots 5 pounds 1.3 pounds
Cucumbers 3 pounds 2.3 pounds
Lettuce 3 pounds 1.3 pounds
Wednesday
Broccoli 2 pounds 1.2 pounds
Tomatoes 5 pounds 2.0 pounds
Edamame 5.5 pounds 2.9 pounds
Carrots 5 pounds 1.1 pounds
Cucumbers 3 pounds 2.1 pounds
Lettuce 3 pounds 1.3 pounds
Thursday
Broccoli 2 pounds 1.4 pounds
Tomatoes 5 pounds 2.3 pounds
Edamame 5.5 pounds 3.1 pounds
Carrots 5 pounds 1.7 pounds
Cucumbers 3 pounds 2.4 pounds
Lettuce 3 pounds 1.4 pounds
Friday
Broccoli 2 pounds 1.3 pounds
Tomatoes 5 pounds 2.1 pounds
Edamame 5.5 pounds 2.9 pounds
Carrots 5 pounds 1.6 pounds
Cucumbers 3 pounds 2.3 pounds
39
Lettuce 3 pounds 1.2 pounds
Week 3 Day Vegetable Starting Weight Ending Weight
Monday
Broccoli 2 pounds 1.2 pounds
Tomatoes 5 pounds 1.9 pounds
Edamame 5.5 pounds 2.8 pounds
Carrots 5 pounds 1.3 pounds
Cucumbers 3 pounds 2.1 pounds
Lettuce 3 pounds 1.3 pounds
Tuesday
Broccoli 2 pounds 1.3 pounds
Tomatoes 5 pounds 1.8 pounds
Edamame 5.5 pounds 2.9 pounds
Carrots 5 pounds 1.3 pounds
Cucumbers 3 pounds 2.0 pounds
Lettuce 3 pounds 1.4 pounds
Wednesday
Broccoli 2 pounds 1.1 pounds
Tomatoes 5 pounds 1.4 pounds
Edamame 5.5 pounds 2.7 pounds
Carrots 5 pounds 1.1 pounds
Cucumbers 3 pounds 2.3 pounds
Lettuce 3 pounds 1.2 pounds
Thursday

40
Broccoli 2 pounds 1.2 pounds
Tomatoes 5 pounds 1.5 pounds
Edamame 5.5 pounds 2.7 pounds
Carrots 5 pounds 1.3 pounds
Cucumbers 3 pounds 2.2 pounds
Lettuce 3 pounds 1.3 pounds
Friday
Broccoli 2 pounds 1.1 pounds
Tomatoes 5 pounds 1.3 pounds
Edamame 5.5 pounds 2.2 pounds
Carrots 5 pounds 1.4 pounds
Cucumbers 3 pounds 1.9 pounds
Lettuce 3 pounds 0.6 pounds

41
Appendix B: Point of purchase materials

42
Appendix B.1.

43
Appendix B.2.
44
Appendix B.3.

45
Appendix B.4.

46
Appendix B.5.
47
Appendix B.6.

48
Appendix B.7.

49
Appendix B.8.
50
Appendix B.9.
51
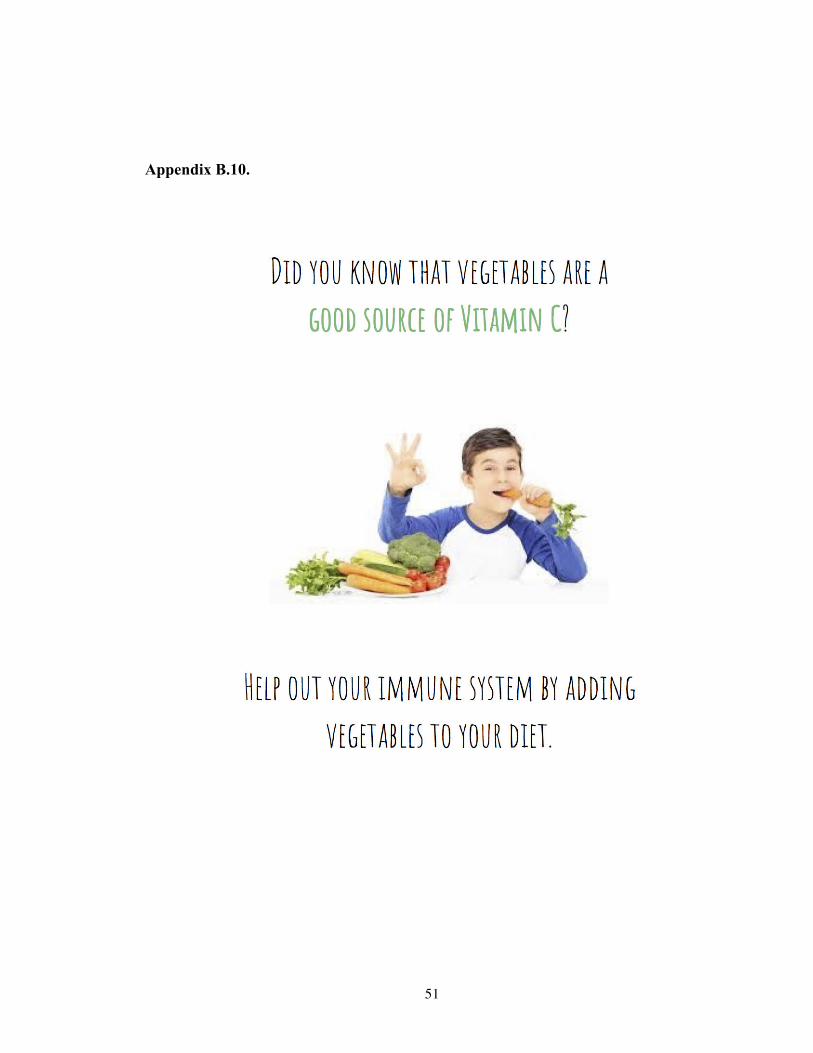
Appendix B.10.