final revisions to the national emission standards for
TRANSCRIPT

Economic Impact Analysis
Final Revisions to the National Emission Standards
for Hazardous Air Pollutants
Subpart S (MACT I and MACT III)
for the Pulp and Paper Industry
July 2012
U.S. Environmental Protection Agency
Office of Air and Radiation
Office of Air Quality Planning and Standards
Research Triangle Park, NC 27711
ii
CONTACT INFORMATION
This document has been prepared by staff from the Office of Air Quality Planning and
Standards, U.S. Environmental Protection Agency. Questions related to this document should be
addressed to Alexander Macpherson, U.S. Environmental Protection Agency, Office of Air
Quality Planning and Standards, C445-B, Research Triangle Park, North Carolina 27711 (email:
ACKNOWLEDGEMENTS
In addition to EPA staff from the Office of Air Quality Planning and Standards,
personnel from RTI International contributed data and analysis to this document. Specific
sections where RTI International made contributions include the industry profile and sections
describing emissions, pollution control options, the engineering cost analysis, and potential
employment impacts.
iii
TABLE OF CONTENTS
TABLE OF CONTENTS .................................................................................................................... III
LIST OF TABLES ............................................................................................................................. IV
LIST OF FIGURES ............................................................................................................................ V
1 EXECUTIVE SUMMARY ........................................................................................................ 1-1
1.1 INTRODUCTION ............................................................................................................................................ 1-1 1.2 RESULTS ...................................................................................................................................................... 1-1 1.3 ORGANIZATION OF THIS REPORT .................................................................................................................. 1-2
2 INDUSTRY PROFILE ............................................................................................................. 2-1
2.1 INTRODUCTION ............................................................................................................................................ 2-1 2.2 SUPPLY AND DEMAND CHARACTERISTICS ................................................................................................... 2-4
2.2.1 Goods and Services Used in Paper Manufacturing ............................................................................ 2-4 2.2.2 Uses and Consumers ........................................................................................................................ 2-10
2.3 FIRM AND MARKET CHARACTERISTICS ...................................................................................................... 2-10 2.3.1 Location ........................................................................................................................................... 2-11 2.3.2 Production Capacity and Utilization ................................................................................................ 2-11 2.3.3 Employment ..................................................................................................................................... 2-12 2.3.4 Plants and Capacity .......................................................................................................................... 2-13 2.3.5 Firm Characteristics ......................................................................................................................... 2-13 2.3.6 Size Distribution .............................................................................................................................. 2-15 2.3.7 Domestic Production........................................................................................................................ 2-16 2.3.8 International Trade ........................................................................................................................... 2-17 2.3.9 Market Prices ................................................................................................................................... 2-17
3 REGULATORY PROGRAM COST AND EMISSIONS REDUCTIONS ......................................... 3-1
3.1 INTRODUCTION ............................................................................................................................................ 3-1 3.2 EMISSIONS REDUCTIONS, ENGINEERING COSTS FOR REGULATORY OPTIONS .............................................. 3-1 3.3 SECONDARY ENVIRONMENTAL AND ENERGY IMPACTS ............................................................................... 3-3
4 ECONOMIC IMPACT ANALYSIS ........................................................................................... 4-1
4.1 INTRODUCTION ............................................................................................................................................ 4-1 4.2 MARKET ANALYSIS ..................................................................................................................................... 4-1
4.2.1 Market Analysis Methods .................................................................................................................. 4-2 4.2.2 Model Baseline .................................................................................................................................. 4-4 4.2.3 Model Parameters .............................................................................................................................. 4-6 4.2.4 Entering Estimated Annualized Engineering Compliance Costs into Economic Model ................... 4-8 4.2.5 Model Results .................................................................................................................................. 4-11 4.2.6 Limitations ....................................................................................................................................... 4-14
4.3 SMALL BUSINESS IMPACTS ANALYSIS ....................................................................................................... 4-15 4.3.1 Small Business National Overview ................................................................................................. 4-15 4.3.2 Small Entity Economic Impact Measures ........................................................................................ 4-17 4.3.3 Small Entity Economic Impact Analysis and Conclusions .............................................................. 4-18
4.4 EMPLOYMENT IMPACTS ANALYSIS ............................................................................................................ 4-20
5 REFERENCES ........................................................................................................................ 5-1
iv
LIST OF TABLES
Table 2-1 Key Statistics: Paper Manufacturing (NAICS 322) ........................................................................... 2-1 Table 2-2 Industry Data: Paper Manufacturing (NAICS 322) ........................................................................... 2-2 Table 2-3 Costs of Goods and Services Used in the Paper Manufacturing Industry (NAICS 322) ................... 2-6 Table 2-4 Key Goods and Services Used in the Paper Manufacturing Industry (NAICS 322) ($millions, $2007)
.......................................................................................................................................................... 2-7 Table 2-5 Energy Used in Paper Manufacturing (NAICS 322) ........................................................................ 2-8 Table 2-6 Estimated Energy Sources for the U.S. Pulp and Paper Industry....................................................... 2-9 Table 2-7 Demand by Sector: Paper Manufacturing Industry (NAICS 322) ($millions, $2007) ..................... 2-10 Table 2-8 Largest U.S. Paper and Forest Products Companies: 2006 .............................................................. 2-14 Table 2-9 Distribution of Economic Data by Enterprise Size: Paper Manufacturing (NAICS 322) ................ 2-15 Table 2-10 Small Business Size Standards: Paper Manufacturing (NAICS 322) .............................................. 2-16 Table 3-1 National-level Estimated Costs, Emissions Reductions, and Cost Effectiveness (costs in 2010 dollars)
.......................................................................................................................................................... 3-3 Table 3-2 Secondary Environmental and Energy Impacts of Kraft Condensates Regulatory Options .............. 3-3 Table 4-1 Baseline Paper Market Data, 2010 (in 2010 dollars) ......................................................................... 4-5 Table 4-2 Products Used for Price Information ................................................................................................. 4-6 Table 4-3 Demand Elasticity Estimates ............................................................................................................. 4-7 Table 4-4 Supply Elasticity Estimates ............................................................................................................... 4-8 Table 4-5 Estimated Annualized Engineering Compliance Costs by Paper Product across Regulatory Options
(thousands 2010 dollars) ................................................................................................................... 4-9 Table 4-6 Estimated Annualized Engineering Compliance Costs by Paper Product across Regulatory Options,
after Redistributing Estimated Costs to Pulp Producers (thousands 2010 dollars) ......................... 4-10 Table 4-7 Annualized Engineering Compliance Costs per Ton Product Produced at National Level across
Regulatory Options (in 2010 dollars) ............................................................................................. 4-11 Table 4-8 Summary of Market Impacts (%) Across Products and Regulatory Option .................................... 4-12 Table 4-9 Change in Price and Quantity (#) across Products and Regulatory Options (costs in 2010 dollars) 4-13 Table 4-10 Summary of Consumer and Producer Surplus Changes: 2010 (in millions of 2010 dollars) .......... 4-14 Table 4-11 Number of Firms, Total Employment, and Estimated Salaries ........................................................ 4-17 Table 4-12 Potentially Affected Small Entities: Employees and Sales, 2010 .................................................... 4-19 Table 4-13 Estimated Annualized Engineering Costs for Potentially Affected Small Entities across Regulatory
Options (costs in 2010 dollars) ....................................................................................................... 4-19 Table 4-14 Labor-based Employment Estimates for Operating and Maintaining Control Equipment
Requirements, across Regulatory Options ...................................................................................... 4-22

v
LIST OF FIGURES
Figure 2-1 Distribution of Value of Shipments within Paper Manufacturing (NAICS 322): 2007 ..................... 2-4 Figure 2-2 Distribution of Employment within Paper Manufacturing (NAICS 322): 2007 ................................ 2-4 Figure 2-3 Electrical Power Use Trends in the Paper Manufacturing Industry: 1997–2005 ............................... 2-9 Figure 2-4 Establishment Concentration in Paper Manufacturing Industry (NAICS 322): 2002 ...................... 2-11 Figure 2-5 Capacity Utilization Trends in the Paper Manufacturing Industry (NAICS 322) ............................ 2-12 Figure 2-6 Employment Concentration in the Paper Manufacturing Industry (NAICS 322): 2002 .................. 2-13 Figure 2-7 Capacity Trends in the Paper Manufacturing Industry (NAICS 322) .............................................. 2-14 Figure 2-8 Industrial Production Trends in the Paper Manufacturing Industry (NAICS 322): 1997–2009 ...... 2-17 Figure 2-9 International Trade Trends in the Paper Manufacturing Industry (NAICS 322) ............................. 2-18 Figure 2-10 Producer Price Trends in the Paper Manufacturing Industry (NAICS 222) .................................... 2-18

1-1
1 EXECUTIVE SUMMARY
1.1 Introduction
EPA is performing a Risk and Technology Review (RTR) that focuses on the National
Emission Standards for Hazardous Air Pollutants (NESHAP) Subpart S. Subpart S controls
hazardous air pollutant (HAP) emissions from the pulp and paper production areas of mills using
the kraft, sulfite, semi-chemical, and soda pulp processes (MACT I) and HAP emissions from
pulp and paper production areas of mills using mechanical, secondary fiber, and non-wood
pulping, and papermaking systems at all mills (MACT III). As of this review, a total of 171 pulp
and paper major sources are subject to MACT I and III.
Under the finalized rules, affected pulp and paper facilities will be required to implement
control measures and absorb regulatory costs. As part of the regulatory process, EPA is required
to develop an economic impact analysis (EIA) and small entity impacts analysis for the
potentially affected industries. This report documents the methods and results of this EIA.
1.2 Results
EPA estimates the program will result in very small increases in market prices and very
small reductions in output of paper and paperboard products produced by the affected industries.
The economic approach and engineering cost approach yield approximately the same estimate of
the total change in surplus under the regulatory program. However, the economic approach
identifies important distributional impacts among stakeholders. The key results of the EIA are as
follows:
Engineering Cost Analysis: Total annualized engineering costs measure the costs
incurred by affected industries annually. The annualized engineering costs for the
promulgated regulatory alternative are estimated to be $2.1 million in 2010 dollars.
Market Analysis: The finalized regulatory option induces minimal changes in the
average national price of paper and paperboard products. Paper and paperboard product
prices increase less than 0.01% on average, while production levels decrease less than
0.01% on average, as a result of the finalized rule.
Economic Welfare Analysis: The economic impact analysis identifies important
transitory impacts across stakeholders as paper and paperboard product markets adjust to
higher production costs. Consumers see reductions in economic welfare of about $1.1
million as the result of higher prices and reduced consumption. Although producers’

1-2
welfare losses are mitigated to some degree by higher prices, market conditions limit
their ability to pass on all of the compliance costs. As a result, they also experience a loss
in economic welfare of about $1.0 million.
Small Business Analysis: EPA performed an analysis for impacts on small businesses by
comparing estimated annualized engineering compliance costs at the company-level to
company sales. The screening analysis found that the ratio of compliance cost to
company revenue falls below 1% for the three small companies that are likely to be
affected by the finalized rule. Based upon this analysis, we conclude there is no
significant economic impact on a substantial number of small entities (SISNOSE) arising
from the final NESHAP amendments.
Employment Impact Analysis: EPA estimated the annual labor required to comply with
the requirements of the final rule. To do this, EPA first estimated the labor required for
emission control equipment operation and maintenance, as well as reporting and
recordkeeping, then converted this number to full-time equivalents (FTEs) by dividing by
2,080 (40 hours per week multiplied by 52 weeks). The upfront (one-time) and ongoing,
annual labor required for complying with the finalized option is estimated at about 3 and
4 FTEs, respectively. EPA notes that this type of FTE estimate cannot be used to make
assumptions about the specific number of people involved or whether new jobs are
created for new employees.
1.3 Organization of this Report
The remainder of this report details the methodology and the results of the EIA. Section
2 presents the industry profile of the papermaking industry. Section 3 summarizes the regulatory
options evaluated in the EIA, emissions reduction estimates, and engineering costs analysis.
Section 4 presents the economic, small business, and employment impacts analyses. Section 5
lists references cited throughout the EIA.

2-1
2 INDUSTRY PROFILE
2.1 Introduction
The paper manufacturing subsector is an essential component of all business operations
worldwide. Broadly speaking, paper and paperboard are manufactured by converting timber or
recycled material into products such as printing and writing papers, newsprint, tissue, and
containerboard (Benwart 2006). The subsector has been experiencing a decline in shipments as
of late. From 1997 to 2007, shipments in the industry declined 7%, and employment declined by
27% (Table 2-1). While total payroll dropped 26% over this time, annual payroll per employee
rose 2% from 1997 to 2007 because of the decline in the number of employees (Table 2-2).
Shipments per employee grew 28% from 1997 to 2007, with much of that growth taking place
between 2002 and 2006 (Table 2-2).
Table 2-1 Key Statistics: Paper Manufacturing (NAICS 322)
1997 2002 2006 2007
Shipments ($2007, millions) $188,496 $175,983 $174,887 $175,806
Payroll ($2007, millions) $27,983 $24,561 $21,188 $20,804
Employees 574,274 489,367 414,049 416,886
Establishments 5,868 5,495 NA 4,803
NA = Not available.
Sources: U.S. Census Bureau; generated by RTI International; using American FactFinder; “Sector 31: Annual
Survey of Manufactures: General Statistics: Statistics for Industry Groups and Industries: 2006 and 2005.”
<http://factfinder.census.gov>; (July 8, 2008).
U.S. Census Bureau; generated by RTI International; using American FactFinder; “Sector 00: All Sectors:
Core Business Statistics Series: Comparative Statistics for the United States and the States (1997 NAICS
Basis): 2002 and 1997.” <http://factfinder.census.gov>; (July 8, 2008).
U.S. Census Bureau; generated by Kapur Energy and Environment; using American FactFinder; “Sector
00: EC0700A1: All Sectors: Geographic Area Series: Economy-Wide Key Statistics: 2007.” Accessed on
December 28, 2009. [Source for 2007 numbers]

2-2
Table 2-2 Industry Data: Paper Manufacturing (NAICS 322)
Industry Data 1997 2002 2006 2007
Total shipments ($2007, millions) $188,496 $175,983 $174,887 $175,806
Shipments per establishment ($2007, thousands) $32,123 $32,026 NA $36,603
Average Shipments per employee ($2007) $328,233 $359,614 $422,381 $421,712
Average Shipments per $ of payroll ($2007) $6.74 $7.17 $8.25 $8.45
Average Annual payroll per employee ($2007) $48,727 $50,189 $51,174 $49,904
Average Employees per establishment 98 89 NA 87
NA = Not available.
Sources: U.S. Census Bureau; generated by RTI International; using American FactFinder; “Sector 31: Annual
Survey of Manufactures: General Statistics: Statistics for Industry Groups and Industries: 2006 and 2005.”
<http://factfinder.census.gov>; (July 8, 2008).
U.S. Census Bureau; generated by RTI International; using American FactFinder; “Sector 00: All Sectors:
Core Business Statistics Series: Comparative Statistics for the United States and the States (1997 NAICS
Basis): 2002 and 1997.” <http://factfinder.census.gov>; (July 8, 2008).
U.S. Census Bureau; generated by Kapur Energy and Environment; using American FactFinder; “Sector
00: EC0700A1: All Sectors: Geographic Area Series: Economy-Wide Key Statistics: 2007.”
<http://factfinder.census.gov>. Accessed on December 28, 2009. [Source for 2007 numbers]
The U.S. Census Bureau categorizes this industry’s facilities into two categories: pulp,
paper, and paperboard manufacturing and converted paper product manufacturing. These are
further divided into the following types of facilities as defined by the U.S. Census Bureau
(2001):
Pulp, Paper, and Paperboard:
– Pulp Mills (NAICS 32211): This industry comprises establishments primarily
engaged in manufacturing pulp without manufacturing paper or paperboard. The
pulp is made by separating the cellulose fibers from the other impurities in wood
or other materials, such as used or recycled rags, linters, scrap paper, and straw.
– Paper Mills (NAICS 32212): This industry comprises establishments primarily
engaged in manufacturing paper from pulp. These establishments may
manufacture or purchase pulp. In addition, the establishments may convert the
paper they make. The activity of making paper classifies an establishment into
this industry regardless of the output.
– Paperboard Mills (NAICS 32213): This industry comprises establishments
primarily engaged in manufacturing paperboard from pulp. These establishments
may manufacture or purchase pulp. In addition, the establishments may also
convert the paperboard they make.
2-3
Converted Paper Products:
– Paperboard Containers Manufacturing (NAICS 32221): This industry comprises
establishments primarily engaged in converting paperboard into containers
without manufacturing paperboard. These establishments use corrugating, cutting,
and shaping machinery to form paperboard into containers. Products made by
these establishments include boxes; corrugated sheets, pads, and pallets; paper
dishes; and fiber drums and reels.
– Paper Bag and Coated and Treated Paper Manufacturing (NAICS 32222): This
industry comprises establishments primarily engaged in one or more of the
following manufacturing activities: cutting and coating paper and paperboard;
cutting and laminating paper and paperboard and other flexible materials (except
plastics film to plastics film); bags or multiwall bags or sacks of paper, metal foil,
coated paper, or laminates or coated combinations of paper and foil with plastics
film; laminated aluminum and other converted metal foils from purchased foils;
and surface coating paper or paperboard.
– Stationary Product Manufacturing (NAICS 32223): This industry comprises
establishments primarily engaged in converting paper or paperboard into products
used for writing, filing, art work, and similar applications.
– Other Converted Paper Products (NAICS 32229): This industry comprises
establishments primarily engaged in one of the following manufacturing
activities:
converting paper and paperboard into products (except containers, bags,
coated and treated paper and paperboard, and stationery products), or
converting pulp into pulp products, such as disposable diapers, or molded pulp
egg cartons, food trays, and dishes.
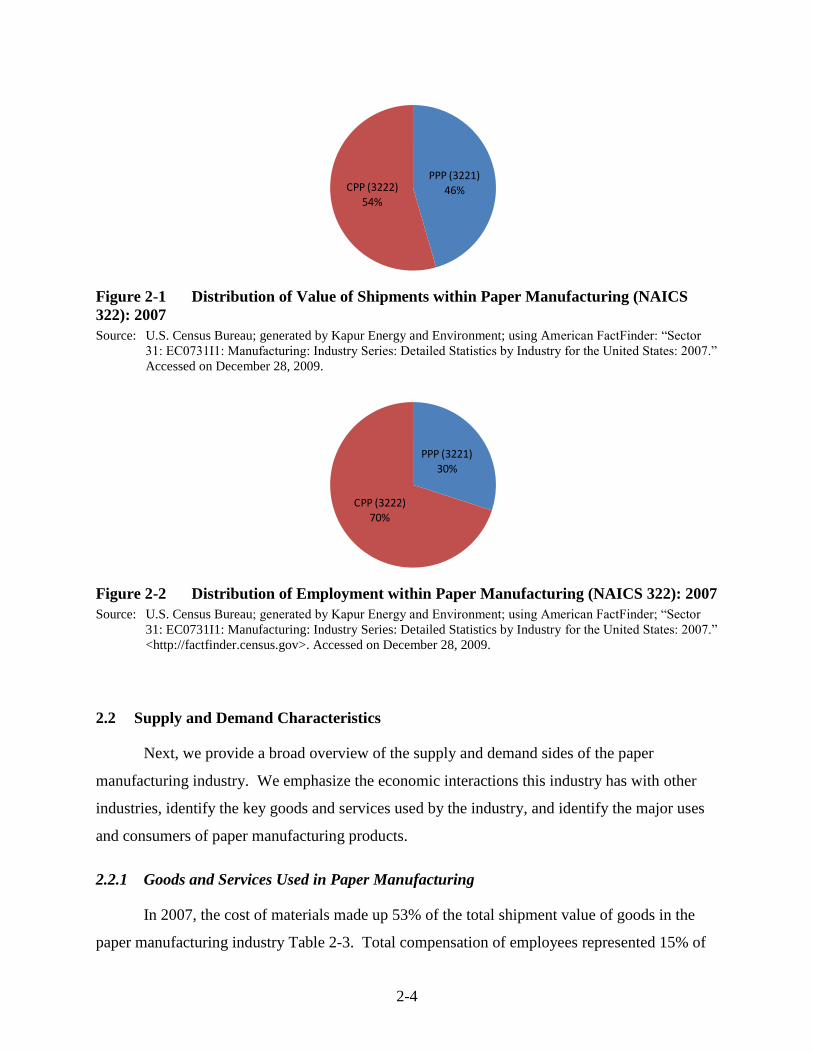
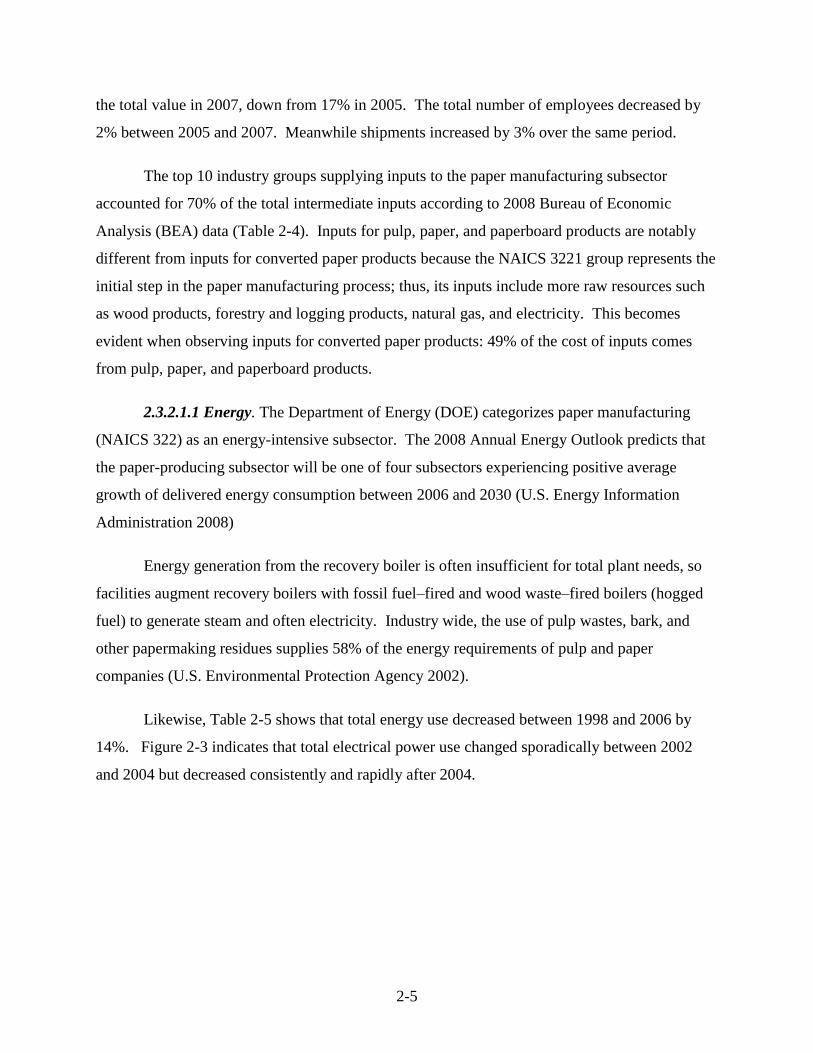
Figure 2-1 shows that the value of shipments for converted paper products was 54% of
the value of all paper products in 2007, while the value of shipments for pulp, paper, and
paperboard products was 46%. Figure 2-2 indicates that 70% of industry employees worked in
the converted paper product category of the industry due to the labor intensive aspects of those
facilities.
2-4
Figure 2-1 Distribution of Value of Shipments within Paper Manufacturing (NAICS
322): 2007
Source: U.S. Census Bureau; generated by Kapur Energy and Environment; using American FactFinder: “Sector
31: EC0731I1: Manufacturing: Industry Series: Detailed Statistics by Industry for the United States: 2007.”
Accessed on December 28, 2009.
Figure 2-2 Distribution of Employment within Paper Manufacturing (NAICS 322): 2007
Source: U.S. Census Bureau; generated by Kapur Energy and Environment; using American FactFinder; “Sector
31: EC0731I1: Manufacturing: Industry Series: Detailed Statistics by Industry for the United States: 2007.”
<http://factfinder.census.gov>. Accessed on December 28, 2009.
2.2 Supply and Demand Characteristics
Next, we provide a broad overview of the supply and demand sides of the paper
manufacturing industry. We emphasize the economic interactions this industry has with other
industries, identify the key goods and services used by the industry, and identify the major uses
and consumers of paper manufacturing products.
2.2.1 Goods and Services Used in Paper Manufacturing
In 2007, the cost of materials made up 53% of the total shipment value of goods in the
paper manufacturing industry Table 2-3. Total compensation of employees represented 15% of
PPP (3221)
46%CPP (3222)
54%
PPP (3221)
30%
CPP (3222)70%
2-5
the total value in 2007, down from 17% in 2005. The total number of employees decreased by
2% between 2005 and 2007. Meanwhile shipments increased by 3% over the same period.
The top 10 industry groups supplying inputs to the paper manufacturing subsector
accounted for 70% of the total intermediate inputs according to 2008 Bureau of Economic
Analysis (BEA) data (Table 2-4). Inputs for pulp, paper, and paperboard products are notably
different from inputs for converted paper products because the NAICS 3221 group represents the
initial step in the paper manufacturing process; thus, its inputs include more raw resources such
as wood products, forestry and logging products, natural gas, and electricity. This becomes
evident when observing inputs for converted paper products: 49% of the cost of inputs comes
from pulp, paper, and paperboard products.
2.3.2.1.1 Energy. The Department of Energy (DOE) categorizes paper manufacturing
(NAICS 322) as an energy-intensive subsector. The 2008 Annual Energy Outlook predicts that
the paper-producing subsector will be one of four subsectors experiencing positive average
growth of delivered energy consumption between 2006 and 2030 (U.S. Energy Information
Administration 2008)
Energy generation from the recovery boiler is often insufficient for total plant needs, so
facilities augment recovery boilers with fossil fuel–fired and wood waste–fired boilers (hogged
fuel) to generate steam and often electricity. Industry wide, the use of pulp wastes, bark, and
other papermaking residues supplies 58% of the energy requirements of pulp and paper
companies (U.S. Environmental Protection Agency 2002).
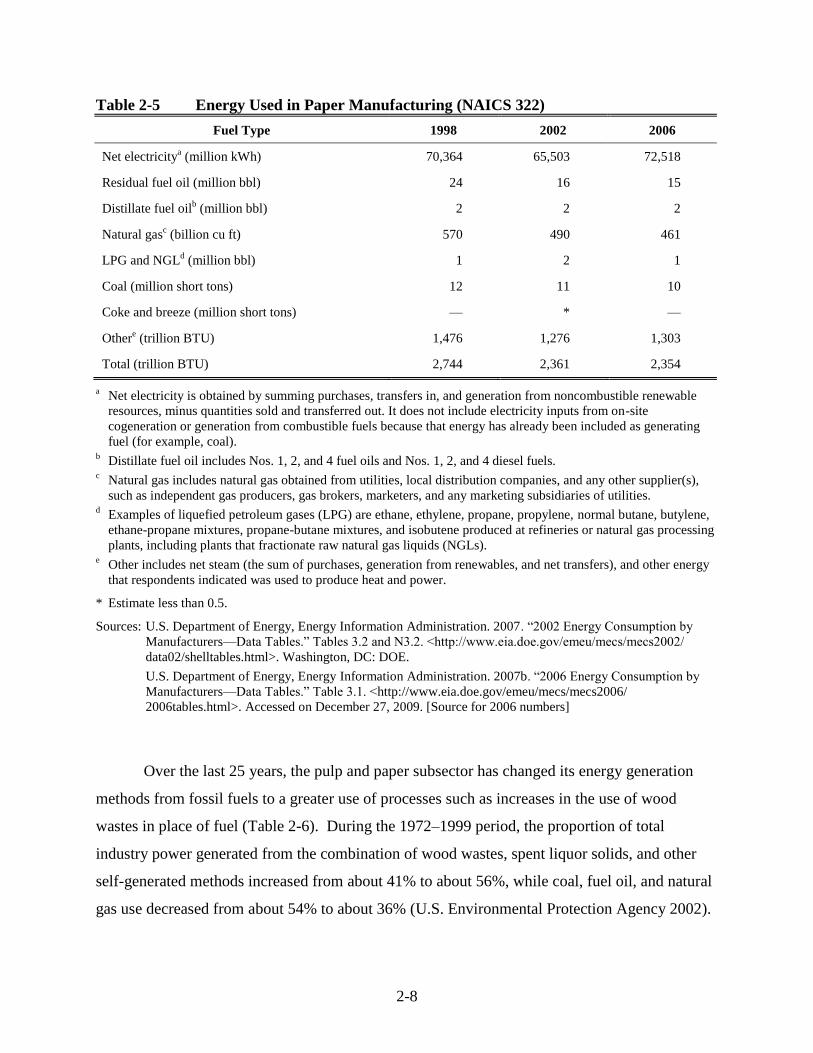
Likewise, Table 2-5 shows that total energy use decreased between 1998 and 2006 by
14%. Figure 2-3 indicates that total electrical power use changed sporadically between 2002
and 2004 but decreased consistently and rapidly after 2004.

2-6
Table 2-3 Costs of Goods and Services Used in the Paper Manufacturing Industry
(NAICS 322)
Variable 2005 Share 2006 Share 2007 Share
Total shipments ($2007, millions) $171,477 100% $174,887 100% $176,018 100%
Total compensation ($2007, millions) $28,846 17% $27,791 16% $27,150 15%
Annual payroll $21,792 13% $21,188 12% $20,804 12%
Fringe benefits $7,054 4% $6,603 4% $6,346 4%
Total employees 426,748 414,049 417,367
Average compensation per employee $67,596 $67,121 $65,051
Total production workers wages ($2007,
millions)
$14,965 9% $14,689 8% $14,190 8%
Total production workers 331,228 321,684 321,937
Total production hours (thousands) 716,963 691,134 680,732
Average production wages per hour $21 $21 $21
Total cost of materials ($2007, thousands) $91,897 54% $92,452 53% $94,029 53%
Materials, parts, packaging $77,494 45% $78,202 45% $79,984 45%
Purchase electricity $3,788 2% $3,841 2% $3,780 2%
Purchased fuel ($2007) $5,537 3% $5,509 3% $5,511 3%
Other $5,078 3% $4,901 3% $4,755 3%
Sources: U.S. Census Bureau; generated by RTI International; using American FactFinder; “Sector 31: Annual
Survey of Manufactures: General Statistics: Statistics for Industry Groups and Industries: 2006 and 2005.”
<http://factfinder.census.gov>; (July 8, 2008).
U.S. Census Bureau; generated by Kapur Energy and Environment; using American FactFinder; “Sector
31: EC0731I1: Manufacturing: Industry Series: Detailed Statistics by Industry for the United States: 2007.”
<http://factfinder.census.gov>. Accessed on December 28, 2009. [Source for 2007 numbers]

2-7
Table 2-4 Key Goods and Services Used in the Paper Manufacturing Industry
(NAICS 322) ($millions, $2007)
Description BEA Code
NAICS 3221
Pulp, Paper, and
Paperboard
NAICS 3222
Converted
Paper Products Total
Pulp, paper, and paperboard 3221 $4,155 $30,448 $34,603
Wholesale trade 4200 $3,916 $6,356 $10,273
Management of companies and enterprises 5500 $3,154 $3,838 $6,993
Forestry and logging products 1130 $5,389 $0 $5,389
Basic chemicals 3251 $3,734 $263 $3,997
Electric power generation, transmission,
and distribution
2211 $2,690 $913 $3,603
Wood products 3210 $3,450 $33 $3,484
Converted paper products 3222 $1,415 $1,745 $3,159
Natural gas distribution 2212 $2,680 $345 $3,026
Truck transportation 4840 $1,428 $1,571 $2,999
Total intermediate inputs T005 $47,835 $62,690 $110,525
Source: U.S. Bureau of Economic Analysis (BEA). 2008. “2002 Benchmark Input-Output Accounts: 2002
Standard Make and Use Tables at the Summary Level.” Table 2. Washington, DC: BEA.
2-8
Table 2-5 Energy Used in Paper Manufacturing (NAICS 322)
Fuel Type 1998 2002 2006
Net electricitya (million kWh) 70,364 65,503 72,518
Residual fuel oil (million bbl) 24 16 15
Distillate fuel oilb (million bbl) 2 2 2
Natural gasc (billion cu ft) 570 490 461
LPG and NGLd (million bbl) 1 2 1
Coal (million short tons) 12 11 10
Coke and breeze (million short tons) — * —
Othere (trillion BTU) 1,476 1,276 1,303
Total (trillion BTU) 2,744 2,361 2,354
a Net electricity is obtained by summing purchases, transfers in, and generation from noncombustible renewable
resources, minus quantities sold and transferred out. It does not include electricity inputs from on-site
cogeneration or generation from combustible fuels because that energy has already been included as generating
fuel (for example, coal). b Distillate fuel oil includes Nos. 1, 2, and 4 fuel oils and Nos. 1, 2, and 4 diesel fuels.
c Natural gas includes natural gas obtained from utilities, local distribution companies, and any other supplier(s),
such as independent gas producers, gas brokers, marketers, and any marketing subsidiaries of utilities. d Examples of liquefied petroleum gases (LPG) are ethane, ethylene, propane, propylene, normal butane, butylene,
ethane-propane mixtures, propane-butane mixtures, and isobutene produced at refineries or natural gas processing
plants, including plants that fractionate raw natural gas liquids (NGLs). e Other includes net steam (the sum of purchases, generation from renewables, and net transfers), and other energy
that respondents indicated was used to produce heat and power.
* Estimate less than 0.5.
Sources: U.S. Department of Energy, Energy Information Administration. 2007. “2002 Energy Consumption by
Manufacturers—Data Tables.” Tables 3.2 and N3.2. <http://www.eia.doe.gov/emeu/mecs/mecs2002/
data02/shelltables.html>. Washington, DC: DOE.
U.S. Department of Energy, Energy Information Administration. 2007b. “2006 Energy Consumption by
Manufacturers—Data Tables.” Table 3.1. <http://www.eia.doe.gov/emeu/mecs/mecs2006/
2006tables.html>. Accessed on December 27, 2009. [Source for 2006 numbers]
Over the last 25 years, the pulp and paper subsector has changed its energy generation
methods from fossil fuels to a greater use of processes such as increases in the use of wood
wastes in place of fuel (Table 2-6). During the 1972–1999 period, the proportion of total
industry power generated from the combination of wood wastes, spent liquor solids, and other
self-generated methods increased from about 41% to about 56%, while coal, fuel oil, and natural
gas use decreased from about 54% to about 36% (U.S. Environmental Protection Agency 2002).

2-9
Figure 2-3 Electrical Power Use Trends in the Paper Manufacturing Industry: 1997–
2005
Source: Federal Reserve Board. 2009. “Industrial Production and Capacity Utilization: Electric Power Use:
Manufacturing and Mining.” Series ID: G17/KW/KW.GMF.S & G17/KW/KW.G322.S.
<http://www.federalreserve.gov/datadownload/>.
Table 2-6 Estimated Energy Sources for the U.S. Pulp and Paper Industry
Energy Source 1972 1979 1990 1999
Purchased steam 5.4% 6.7% 7.3% 1.5%
Coal 9.8% 9.1% 13.7% 12.5%
Fuel oil 22.3% 19.1% 6.4% 6.3%
Natural gas 21.5% 17.8% 16.4% 17.6%
Other purchased energy — — — 6.7%
Waste wood and wood chips (hogged fuel)
and bark
6.6% 9.2% 15.4% 13.5%
Spent liquor solids 33.7% 37.3% 39.4% 40.3%
Other self-generated power 0.6% 0.8% 1.2% 1.6%
Source: U.S. Environmental Protection Agency. 2002. “Profile of the Pulp and Paper Industry.” Sector Notebook
Project. <http://www.epa.gov/Compliance/resources/publications/assistance/sectors/notebooks/
index.html>.
90
92
94
96
98
100
102
104
106
108
Jan
-97
Jul-
97
Jan
-98
Jul-
98
Jan
-99
Jul-
99
Jan
-00
Jul-
00
Jan
-01
Jul-
01
Jan
-02
Jul-
02
Jan
-03
Jul-
03
Jan
-04
Jul-
04
Jan
-05
Jul-
05
Ind
ex
Val
ue
(Ja
n-9
7=
10
0)
Manufacturing Paper

2-10
2.2.2 Uses and Consumers
Products manufactured in the NAICS groups 3221 and 3222 have different, but
complementary, consumer profiles. NAICS 3221 supplies a significant portion of NAICS 3222
demand (37% of total commodity output). Both industries specialize in products with
intermediate uses, with an average of 92% of sales between the two going toward this purpose.
NAICS 3222 has a very diverse assortment of subsector groups from which it receives demand.
Food manufacturing makes up 21% of the demand, making members of this industry the largest
consumer of converted paper products (Table 2-7). Pulp, paper, and paperboard products have a
large trade deficit, while converted paper products have a very small trade surplus.
Table 2-7 Demand by Sector: Paper Manufacturing Industry (NAICS 322) ($millions,
$2007)
Sector BEA Code
3221
Pulp, Paper, and
Paperboard
3222
Converted
Paper Products Total
Converted paper product manufacturing 3222 $30,448 $1,745 $32,193
Food manufacturing 3110 $638 $18,782 $19,421
Printing and related support activities 3230 $13,320 $3,874 $17,194
General state and local government
services
S007 $6,065 $7,792 $13,857
Pulp, paper, and paperboard mills 3221 $4,155 $1,415 $5,569
Newspaper, periodical, book, and
directory publishers
5111 $4,851 $168 $5,018
Plastics and rubber products
manufacturing
3260 $1,249 $3,403 $4,651
Wholesale trade 4200 $990 $2,619 $3,609
Food services and drinking places 7220 $1,510 $2,597 $4,107
Total intermediate use T001 $76,729 $80,862 $157,591
Personal consumption expenditures F010 $11,882 $9,295 $21,177
Exports of goods and services F040 $7,724 $5,799 $13,523
Imports of goods and services F050 −$15,284 −$5,720 −$21,005
Total final uses (GDP) T004 $4,996 $9,607 $14,604
Total commodity output T007 $81,725 $90,469 $172,195
Source: U.S. Bureau of Economic Analysis (BEA). 2008. “2002 Benchmark Input-Output Accounts: 2002
Standard Make and Use Tables at the Summary Level.” Table 2. Washington, DC: BEA.
2.3 Firm and Market Characteristics
This section describes geographic, production, and market data. These data provide the
basis for further analysis, and depict recent historical trends of production and pricing.

2-11
2.3.1 Location
As Figure 2-4 illustrates, as of 2002, California was home to the most paper
manufacturing establishments in the United States, followed by Illinois and some bordering
northeastern states. The location of establishments in the paper manufacturing industry varies a
great deal by subsector. Wisconsin and New York had the most pulp, paper, and paperboard
establishments, while California dominated with over 500 converted paper product
establishments. Overall, as of 2002, the United States had 561 pulp, paper, and paperboard
establishments and 4,956 converted paper product establishments.
Figure 2-4 Establishment Concentration in Paper Manufacturing Industry (NAICS
322): 2002
Source: U.S. Census Bureau; generated by RTI International; using American FactFinder; “Sector 31:
Manufacturing: Geographic Area Series: Industry Statistics for the States, Metropolitan and Micropolitan
Statistical Areas, Counties, and Places: 2002.” <http://factfinder.census.gov>; (July 23, 2008).
2.3.2 Production Capacity and Utilization
Capacity utilization of the paper manufacturing subsector has been experiencing a steady
decline, similar to the decline of the total manufacturing sector. However, paper manufacturing
has managed to use its capacity at a consistently higher rate than the average for manufacturing
industries (Figure 2-5).
Establishments
Fewer than 50
50 - 99
100 - 199
200 - 300
More than 300

2-12
Figure 2-5 Capacity Utilization Trends in the Paper Manufacturing Industry
(NAICS 322)
Source: Source: Federal Reserve Board. 2009. “Industrial Production and Capacity Utilization: Capacity
Utilization.” Series ID: G17/CAPUTL/CAPUTL.GMF.S & G17/CAPUTL/CAPUTL.G322.S.
<http://www.federalreserve.gov/datadownload/>.
2.3.3 Employment
Wisconsin has the largest number of employees in the paper manufacturing subsector
with over 38,008 reported in the 2002 census followed by 29,379 in California (Figure 2-6). The
converted paper products group has more employees per establishment, 283, than the pulp,
paper, and paperboard group, 67.
05
101520253035404550556065707580859095
100
Jan
-97
Jul-
97
Jan
-98
Jul-
98
Jan
-99
Jul-
99
Jan
-00
Jul-
00
Jan
-01
Jul-
01
Jan
-02
Jul-
02
Jan
-03
Jul-
03
Jan
-04
Jul-
04
Jan
-05
Jul-
05
Jan
-06
Jul-
06
Jan
-07
Jul-
07
Jan
-08
Jul-
08
Jan
-09
Jul-
09
Pe
rce
nta
ge C
apac
ity
Uti
lizat
ion
Manufacturing Paper (NAICS 322)

2-13
Figure 2-6 Employment Concentration in the Paper Manufacturing Industry (NAICS
322): 2002
Source: U.S. Census Bureau; generated by RTI International; using American FactFinder; “Sector 31:
Manufacturing: Geographic Area Series: Industry Statistics for the States, Metropolitan and Micropolitan
Statistical Areas, Counties, and Places: 2002.” <http://factfinder.census.gov>; (July 23, 2008).
2.3.4 Plants and Capacity
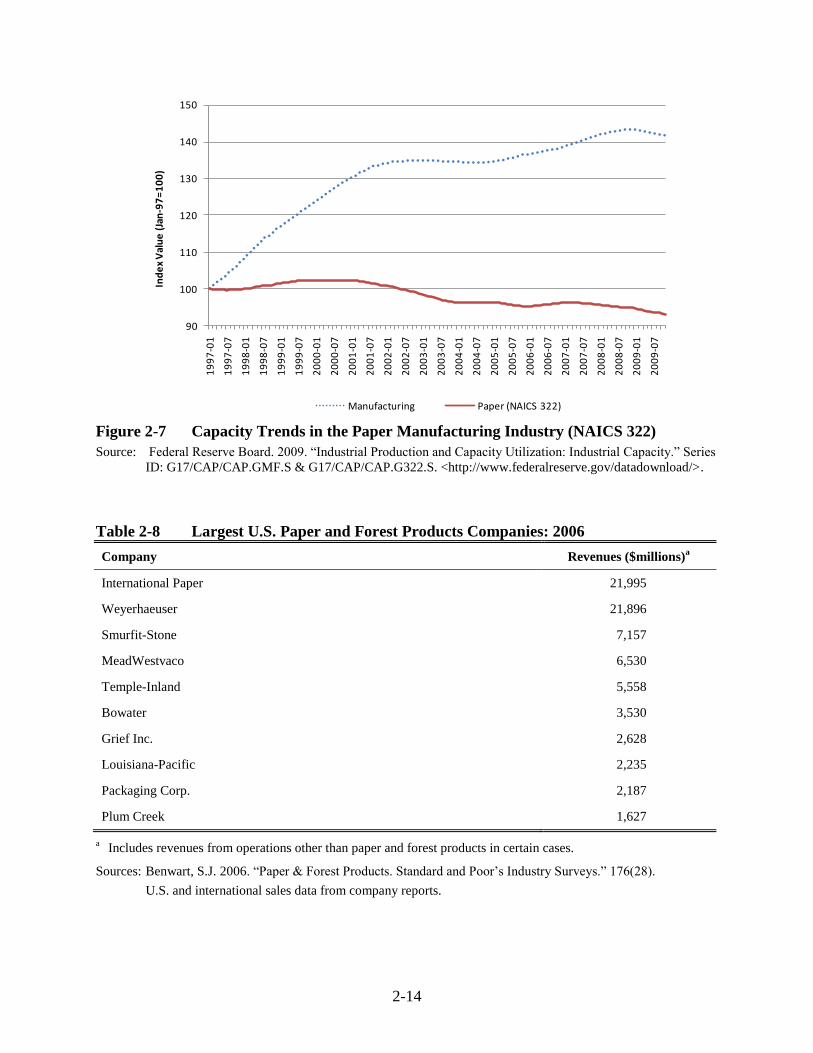
While the manufacturing sector has been growing consistently since 1997, the paper
manufacturing sector has not experienced the same amount of success in the same period.
Despite a small amount of growth in capacity between 1997 and 2001, the paper manufacturing
subsector’s capacity has declined to as much as 7% below 1997 capacity levels (Figure 2-7).
2.3.5 Firm Characteristics
In 2006, the top 10 paper and forest product companies produced over $75 billion in
sales, with the top two companies—International Paper and Weyerhaeuser—generating nearly
$22 billion each (Figure 2-8). The top two companies’ revenue consists of 58% of the revenue
of the top 10 companies in Standard & Poor’s (S&P’s) list (Benwart 2006). Although these
numbers do not exclusively reflect paper products, they do convey the market environment in
which firms in this sector compete.
Employment
Fewer than 3,000
3,000 - 5,999
6,000 - 11,999
12,000 - 24,000
More than 24,000
2-14
Figure 2-7 Capacity Trends in the Paper Manufacturing Industry (NAICS 322)
Source: Federal Reserve Board. 2009. “Industrial Production and Capacity Utilization: Industrial Capacity.” Series
ID: G17/CAP/CAP.GMF.S & G17/CAP/CAP.G322.S. <http://www.federalreserve.gov/datadownload/>.
Table 2-8 Largest U.S. Paper and Forest Products Companies: 2006
Company Revenues ($millions)a
International Paper 21,995
Weyerhaeuser 21,896
Smurfit-Stone 7,157
MeadWestvaco 6,530
Temple-Inland 5,558
Bowater 3,530
Grief Inc. 2,628
Louisiana-Pacific 2,235
Packaging Corp. 2,187
Plum Creek 1,627
a Includes revenues from operations other than paper and forest products in certain cases.
Sources: Benwart, S.J. 2006. “Paper & Forest Products. Standard and Poor’s Industry Surveys.” 176(28).
U.S. and international sales data from company reports.
90
100
110
120
130
140
150
19
97
-01
19
97
-07
19
98
-01
19
98
-07
19
99
-01
19
99
-07
20
00
-01
20
00
-07
20
01
-01
20
01
-07
20
02
-01
20
02
-07
20
03
-01
20
03
-07
20
04
-01
20
04
-07
20
05
-01
20
05
-07
20
06
-01
20
06
-07
20
07
-01
20
07
-07
20
08
-01
20
08
-07
20
09
-01
20
09
-07
Ind
ex
Val
ue
(Ja
n-9
7=
10
0)
Manufacturing Paper (NAICS 322)

2-15
2.3.6 Size Distribution
The primary criterion for categorizing a business as small is the number of employees,
using definitions by the SBA for regulatory flexibility analyses. According to SUSB reports for
2002, large companies dominated revenue-generating transactions in the paper manufacturing
subsector; 80% of receipts were generated by companies with 500 employees or more (Table
2-9). This was especially true in the pulp, paper, and paperboard group, in which large
companies generated 92% of receipts. The number of employees in the small business cutoff
varies according to six-digit NAICS codes (Table 2-10). The cutoff for all subsectors in the pulp,
paper, and paperboard group is 750 employees, while the cutoff for most converted paper
product groups is 500 employees.
Table 2-9 Distribution of Economic Data by Enterprise Size: Paper Manufacturing
(NAICS 322)
Enterprises with
Variable Total
1 to 20
Employeesa
20 to 99
Employees
100 to 499
Employees
500 to 749
Employees
750 to 999
Employees
1,000 to
1,499
Employees
Firms 3,538 1,482 1,200 476 43 22 33
Establishments 5,546 1,488 1,271 755 83 69 138
Employment 495,990 11,325 52,334 78,402 13,293 12,496 23,283
Receipts ($millions ) $154,746 $2,218 $9,483 $17,620 $3,034 $3,951 $6,798
Receipts/firm
($thousands) $43,738 $1,497 $7,903 $37,017 $70,561 $179,577 $206,001
Receipts/establishment
($thousands) $27,902 $1,491 $7,461 $23,338 $36,556 $57,256 $49,261
Receipts/employment
($) $311,994 $195,850 $181,203 $224,742 $228,250 $316,157 $291,974
a Excludes SUSB employment category for zero employees. These entities only operated for a fraction of the year.
Source: U.S. Census Bureau. 2008. “Firm Size Data from the Statistics of U.S. Businesses: U.S. Detail
Employment Sizes: 2002.” <http://www.census.gov/csd/susb/download_susb02.htm>.

2-16
Table 2-10 Small Business Size Standards: Paper Manufacturing (NAICS 322)
NAICS NAICS Description Employees
322110 Pulp Mills 750
322121 Paper (except Newsprint) Mills 750
322122 Newsprint Mills 750
322130 Paperboard Mills 750
322211 Corrugated and Solid Fiber Box Manufacturing 500
322212 Folding Paperboard Box Manufacturing 750
322213 Setup Paperboard Box Manufacturing 500
322214 Fiber Can, Tube, Drum, and Similar Products Manufacturing 500
322215 Non-Folding Sanitary Food Container Manufacturing 750
322221 Coated and Laminated Packaging Paper Manufacturing 500
322222 Coated and Laminated Paper Manufacturing 500
322223 Coated Paper Bag and Pouch Manufacturing 500
322224 Uncoated Paper and Multiwall Bag Manufacturing 500
322225 Laminated Aluminum Foil Manufacturing for Flexible, Packaging
Uses
500
322226 Surface-Coated Paperboard Manufacturing 500
322231 Die-Cut Paper and Paperboard Office Supplies, Manufacturing 500
322232 Envelope Manufacturing 500
322233 Stationery, Tablet, and Related Product Manufacturing 500
322291 Sanitary Paper Product Manufacturing 500
322299 All Other Converted Paper Product Manufacturing 500
Source: U.S. Small Business Administration (SBA). 2008. “Table of Small Business Size Standards Matched to
North American Industry Classification System Codes.” Effective August 22, 2008.
<http://www.sba.gov/services/contractingopportunities/sizestandardstopics/size/index.html>.
2.3.7 Domestic Production
Similar to industry capacity rates, subsector production rates for paper manufacturing
have witnessed a decreasing rate of production compared to the steady increase in production for
the manufacturing sector since 1997 (Figure 2-8). It seems that the paper manufacturing sector
was not able to return to its former levels of growth following the 2001 recession; it has
experienced a downward production trend since then.

2-17
Figure 2-8 Industrial Production Trends in the Paper Manufacturing Industry (NAICS
322): 1997–2009
Source: Federal Reserve Board. 2009. “Industrial Production and Capacity Utilization: Industrial Production.”
Series ID: G17/IP_MAJOR_INDUSTRY_GROUPS/IP.GMF.S & G17/IP_MAJOR_INDUSTRY_
GROUPS/IP.G322.S. <http://www.federalreserve.gov/datadownload/>.
2.3.8 International Trade
Since 1997, paper manufacturing products, both pulp, paper, and paperboard products
and converted paper products, have contributed to an increasing trade surplus in this sector
(Figure 2-9). Imports and exports have been changing at similar rates since 1999.
2.3.9 Market Prices
Prices of goods in paper manufacturing have not been increasing at a rate consistent with
all manufacturing products (Figure 2-10). Producer price indices (PPIs) show that producer
prices for paper in 2007 fell by about 20% since 1997, while producer prices for all
manufacturing goods increased by roughly 27%.
90
100
110
120
130
140
150
19
97
-01
19
97
-07
19
98
-01
19
98
-07
19
99
-01
19
99
-07
20
00
-01
20
00
-07
20
01
-01
20
01
-07
20
02
-01
20
02
-07
20
03
-01
20
03
-07
20
04
-01
20
04
-07
20
05
-01
20
05
-07
20
06
-01
20
06
-07
20
07
-01
20
07
-07
20
08
-01
20
08
-07
20
09
-01
20
09
-07
Ind
ex
Val
ue
(Ja
n-9
7=1
00
)
Manufacturing Paper (NAICS 322)

2-18
Figure 2-9 International Trade Trends in the Paper Manufacturing Industry (NAICS
322)
Source: U.S. International Trade Commission. 2008b. “U.S. Total Exports” & “U.S. Imports for Consumption.”
<http://dataweb.usitc.gov/scripts/user_set.asp>.
Figure 2-10 Producer Price Trends in the Paper Manufacturing Industry (NAICS 222)
Source: U.S. Bureau of Labor Statistics (BLS). 2009. “Producer Price Index.” Series ID: PCU322–322– &
PCUOMFG–OMFG–. <http://www.bls.gov/ppi/home.htm>.
0
5,000
10,000
15,000
20,000
25,000
30,000
1997 1998 1999 2000 2001 2002 2003 2004 2005 2006 2007
$1
,00
0,0
00
(20
07
)
Year
Paper Exports Paper Imports
75
85
95
105
115
125
135
Jan
-97
Jul-
97
Jan
-98
Jul-
98
Jan
-99
Jul-
99
Jan
-00
Jul-
00
Jan
-01
Jul-
01
Jan
-02
Jul-
02
Jan
-03
Jul-
03
Jan
-04
Jul-
04
Jan
-05
Jul-
05
Jan
-06
Jul-
06
Jan
-07
Jul-
07
Jan
-08
Jul-
08
Jan
-09
Jul-
09
Ind
ex
Val
ue
(Ja
n-9
7=
10
0)
Manufacturing Paper (NAICS 322)
3-1
3 REGULATORY PROGRAM COST AND EMISSIONS REDUCTIONS
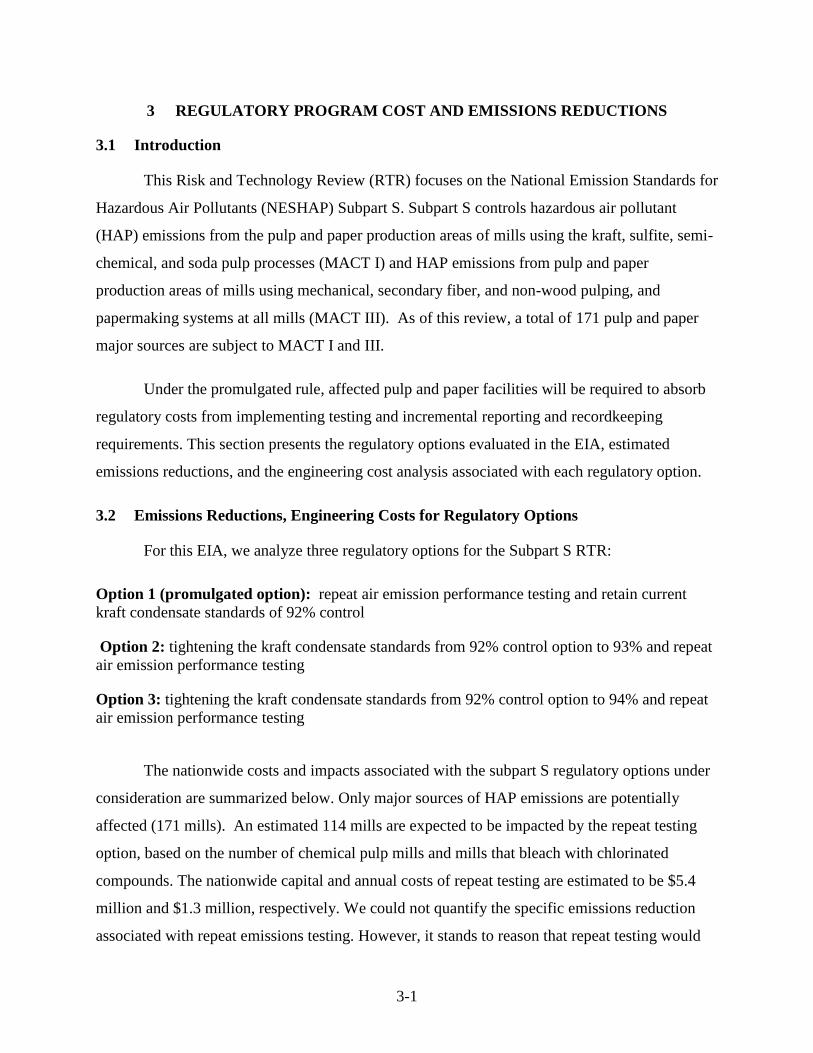
3.1 Introduction
This Risk and Technology Review (RTR) focuses on the National Emission Standards for
Hazardous Air Pollutants (NESHAP) Subpart S. Subpart S controls hazardous air pollutant
(HAP) emissions from the pulp and paper production areas of mills using the kraft, sulfite, semi-
chemical, and soda pulp processes (MACT I) and HAP emissions from pulp and paper
production areas of mills using mechanical, secondary fiber, and non-wood pulping, and
papermaking systems at all mills (MACT III). As of this review, a total of 171 pulp and paper
major sources are subject to MACT I and III.
Under the promulgated rule, affected pulp and paper facilities will be required to absorb
regulatory costs from implementing testing and incremental reporting and recordkeeping
requirements. This section presents the regulatory options evaluated in the EIA, estimated
emissions reductions, and the engineering cost analysis associated with each regulatory option.
3.2 Emissions Reductions, Engineering Costs for Regulatory Options
For this EIA, we analyze three regulatory options for the Subpart S RTR:
Option 1 (promulgated option): repeat air emission performance testing and retain current
kraft condensate standards of 92% control
Option 2: tightening the kraft condensate standards from 92% control option to 93% and repeat
air emission performance testing
Option 3: tightening the kraft condensate standards from 92% control option to 94% and repeat
air emission performance testing
The nationwide costs and impacts associated with the subpart S regulatory options under
consideration are summarized below. Only major sources of HAP emissions are potentially
affected (171 mills). An estimated 114 mills are expected to be impacted by the repeat testing
option, based on the number of chemical pulp mills and mills that bleach with chlorinated
compounds. The nationwide capital and annual costs of repeat testing are estimated to be $5.4
million and $1.3 million, respectively. We could not quantify the specific emissions reduction
associated with repeat emissions testing. However, it stands to reason that repeat testing would

3-2
provide incentive for facilities to maintain their control systems and make periodic adjustments
to ensure peak performance, thereby reducing emissions and the potential for periodic episodes
of acute risk.
The number of mills impacted by the incremental efficiency increase in the kraft
condensates standards ranges from 48 mills (93 percent removal) to 54 mills (94 percent
removal). Mills already meeting each incremental limit are not impacted by either option (43 of
97 total kraft mills evaluated). Nationwide costs associated with the kraft condensate regulatory
options include the costs for upgrading equipment to meet the revised percent removal options
(e.g., adjustment from 92 to 93 or 94 percent), costs for a repeat Clean Condensate Alternative
(CCA) demonstration, and costs for mills where the CCA option may be negated.
Lastly, additional reporting and recordkeeping labor hours and costs were developed as
part of the Paperwork Reduction Act supporting statement for the 114 affected mills. The
incremental reporting and recordkeeping costs resulting from the amendments to subpart S are
estimated to be $4,344 per mill ($0.50 million nationwide) as a one-time cost to revamp existing
recordkeeping systems to be consistent with revisions to the startup and shutdown provisions,
and $6,516/yr per mill ($0.74 million/yr nationwide) for two instances of affirmative defense.
Details on these cost estimates, as well as an accounting for the labor hours involved, can be
found in the supporting statement.
Table 3-1 summarizes estimated total engineering costs, emissions, reductions, and HAP
reduction cost-effectiveness across the three regulatory options. The cost effectiveness of
Options 2 and 3 is $75,000/ton and $37,000/ton, respectively, for the 93 and 94 percent removal
options. Estimated costs are significantly higher than the proposal estimates because a greater
number of mills were determined to be affected after considering variability in performance and
because we have accounted for potential effects on CCA mills.

3-3
Table 3-1 National-level Estimated Costs, Emissions Reductions, and Cost
Effectiveness (costs in 2010 dollars)
No. of Facilities
Affected
Engineering
Capital Costs
(millions)
Engineering
Annualized
Costs (millions)
HAP/VOC1
Reductions
(tons per year)
Cost
Effectiveness
($/ton)
Option 1
(promulgated) 114 $5.9 $2.1 0 N/A
Option 22 48 $396 $74.4 989 $75,000
Option 32 54 $423 $85.1 2,300 $37,000
1 HAP emissions are approximately 99 percent methanol and 1 percent acetaldehyde. VOC emissions would be
essentially equivalent to HAP emissions reductions. 2 Also includes testing and reporting costs used in Option 1.
3.3 Secondary Environmental and Energy Impacts
The nationwide energy impacts and secondary air emissions of the kraft condensate
regulatory options (Options 2 and 3) are substantial compared to the HAP emissions reduction,
primarily due to the power boiler emissions associated with the increased steam demand needed
for new and upgraded stripper systems (Table 3-2).
Table 3-2 Secondary Environmental and Energy Impacts of Kraft Condensates
Regulatory Options
Energy impacts,
MMBtu/yr Secondary emissions, tpy
Elec-
tricity
Steam
PM CO NOX SO2 CO2 CH4 N2O
Option 2 99,419 660 430 2,082 1,443 659 1,004,258 65 40
Option 3 113,685 910 593 2,870 1,986 901 1,383,081 89 55
Energy and secondary air emissions impacts for strippers were not considered prior to proposal,
but have been considered here as a result of public comments. When converted to CO2
equivalents, GHG emissions associated with the 93 and 94 percent removal options would have
been 1,018,048 and 1,402,084 tpy CO2-equivalent, respectively.
4-1
4 ECONOMIC IMPACT ANALYSIS
4.1 Introduction
The EIA is designed to inform decision makers about the potential economic consequences
of a regulatory action. For the current promulgation, EPA performed a partial-equilibrium
analysis of national pulp and paper product markets to estimate potential paper product market
and consumer and producer welfare impacts of the regulatory alternatives. This section also
presents the analysis used to support the conclusion that EPA anticipates there will be no
Significant Economic Impact on a Substantial Number of Small Entities (SISNOSE) arising from
the final NESHAP amendments. The section concludes with estimates of the initial and annual
labor required to comply with the regulatory alternatives.
4.2 Market Analysis
EPA performed a series of single-market, partial-equilibrium analyses of national pulp and
paper product markets to measure the economic consequences of the regulatory options. With
the basic conceptual model described below, we estimated how the regulatory program affects
prices and quantities for ten paper and paperboard products that, aggregated, constitute the
production of the industry. We also conducted an economic welfare analysis that estimates the
consumer and producer surplus changes associated with the regulatory program. The welfare
analysis identifies how the regulatory costs are distributed across two broad classes of
stakeholders: consumers and producers.
While a series of partial equilibrium models was used to analyze the economic impacts of
this promulgation, EPA notes that it is currently developing the Industrial Sectors Integrated
Solution Model (ISIS) for the U.S. pulp and paper industry. When completed, the ISIS model
for the pulp and paper industry will be a dynamic engineering-economic model that facilitates
analysis of emission reduction strategies for multiple pollutants, while taking into account plant-
level economic and technical factors such as the type of mill, associated capacity, location, cost
of production, applicable controls, and costs. By considering various emission reduction

4-2
strategies, the model, when completed, will provide information on optimal industry operation
and determine the most cost-effective controls to meet the demand for pulp and paper products
and the emission reduction requirements for a given time period of interest.
4.2.1 Market Analysis Methods
The models use a common analytic expression to analyze supply and demand in a single
market (Berck and Hoffmann 2002; Fullerton and Metcalf 2002) and follows EPA guidelines for
conducting an EIA (U.S. Environmental Protection Agency 2010). We illustrate our approach
for estimating market-level impacts using a simple, single partial-equilibrium model. The
method involves specifying a set of nonlinear supply and demand relationships for the affected
market, simplifying the equations by transforming them into a set of linear equations, and then
solving the equilibrium system of equations (see Fullerton and Metcalfe (2002) for an example).
First, we consider the formal definition of the elasticity of supply, qs, with respect to
changes in own price, p, where s represents the market elasticity of supply:
/
/
s ss
dq q
dp p (4.1)
Next, we can use “hat” notation to transform Eq. 1 to proportional changes and rearrange terms:
ˆ ˆs sq p (4.1a)
where ˆsq equals the percentage change in the quantity of market supply, and p̂ equals the
percentage change in market price. As Fullerton and Metcalfe (2002) note, we have taken the
elasticity definition and turned it into a linear behavioral equation for the market we are
analyzing.
To introduce the direct impact of the regulatory program, we assume the per-unit cost
associated with the regulatory program, c, leads to a proportional shift in the marginal cost of
production mc . The per-unit costs are estimated by dividing the total estimated annualized
engineering costs accruing to producers within a given product market by the baseline national

4-3
production in that market. Under the assumption of perfect competition (e.g., price equaling
marginal cost), we can approximate this shift at the initial equilibrium point as follows:
0 0
c cmc
mc p. (4.1b)
The with-regulation supply equation can now be written as
ˆ ˆ( )s sq p mc . (4.1c)
Next, we can specify a demand equation as follows:
ˆ ˆd dq p (4.2)
where
ˆdq = percentage change in the quantity of market demand,
d = market elasticity of demand, and
p̂ = percentage change in market price.
Finally, we specify the market equilibrium conditions in the affected market. In response
to the exogenous increase in production costs, producer and consumer behaviors are represented
in Eq. 4-1a and Eq. 4-2, and the new equilibrium satisfies the condition that the change in supply
equals the change in demand:
ˆ ˆs dq q . (4.3)
We now have three linear equations in three unknowns ( p̂ , ˆdq , and ˆ
sq ), and we can
solve for the proportional price change in terms of the elasticity parameters ( s and d ) and the
proportional change in marginal cost:
ˆ ˆ
ˆ ˆ
ˆ ˆ
ˆ
ˆ
s d
s s d
s d s
s d s
s
s d
p mc p
p mc p
p p mc
p mc
p mc
(4.4)

4-4
Given this solution, we can solve for the proportional change in market quantity using Eq. 4-2.
The change in consumer surplus in the affected market can be estimated using the
following linear approximation method:
1 0.5cs q p q p (4.5)
where 1q equals with-regulation quantities produced. As shown, higher market prices and
reduced consumption lead to welfare losses for consumers.
For affected supply, the change in producer surplus can be estimated with the following
equation:
1 1 0.5ps q p q c q p c . (4.6)
Increased regulatory costs and declines in output have a negative effect on producer surplus,
because the net price change p c is negative. However, these losses are mitigated, to some
degree, as a result of higher market prices.
4.2.2 Model Baseline
Standard EIA practice compares and contrasts the state of a market with and without the
regulatory policy. EPA selected 2010 as the baseline year for the analysis and collected pulp and
paper production and price data for this year from the American Forest and Paper Association
and RISI, Inc., respectively. The figures cited were obtained from RISI Inc.’s PPI Pulp and
Paper Week. Baseline data are reported in Table 4-1.

4-5
Table 4-1 Baseline Paper Market Data, 2010 (in 2010 dollars)
Products
Price1
($/ton)
Quantity2
(tons/year)
% of Total
Production
Paper
Newsprint $580 3,429,000 4%
Uncoated mechanical $740 2,002,000 2%
Coated paper $960 7,903,000 10%
Uncoated freesheet $930 9,500,000 12%
Tissue3 $1,765 7,302,000 9%
Other printing/writing $1,305 4,917,000 6%
Total Paper
4 $1,118 35,053,000 43%
Paperboard
Unbleached Kraft paperboard $640 21,579,000 26%
Semichemical paperboard $610 5,443,000 7%
Bleached paperboard $1,290 5,499,000 7%
Recycled paperboard $855 14,896,000 18%
Total Paperboard
4 $779 47,417,000 57%
Total Paper and Paperboard4 $923 82,470,000 100%
1 Source: RISI Inc. (2011a)
2 Source: American Forest and Paper Association; cited in RISI Inc. (2011b)
3 EPA was unable to obtain national price averages for tissue paper. For this analysis, EPA relied upon the average
of the prices reported by two major tissue producers in corporate earnings statements. The price used in this table is
derived from prices reported by Cellu Tissue in 2009 and Clearwater Paper (2010). 4 Weighted average of individual product prices.
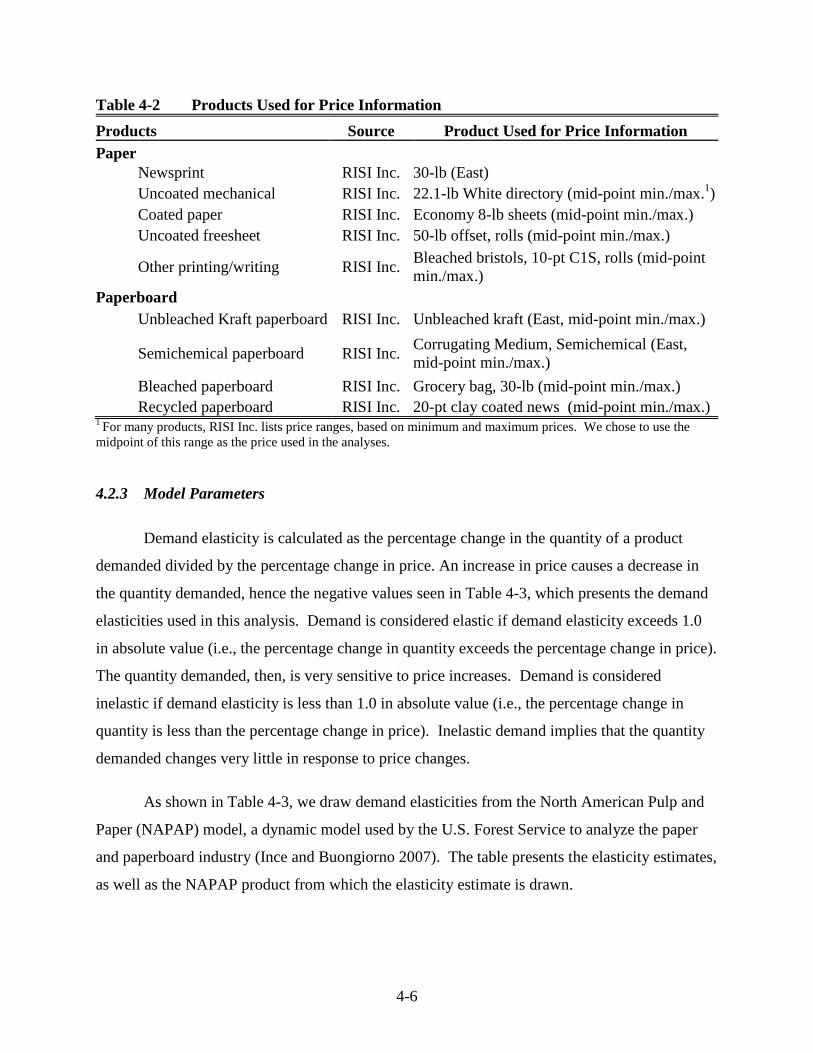
Because the paper and paperboard products listed in Table 4-2 below are aggregates of
many relatively distinct types of products, EPA had to choose one product per aggregated
product for price information. Ideally, the analyst would use the weighted averaged of all
products within the aggregate product category, but this information is not available to EPA as of
the signature date for this final rule. With the exception of tissue papers (note footnote in Table
4-2), all product prices were drawn from a RISI, Inc. publication. Table 4-2 lists the aggregated
product category and product selected for pricing purposes as representative of the aggregated
product.
4-6
Table 4-2 Products Used for Price Information
Products Source Product Used for Price Information
Paper
Newsprint RISI Inc. 30-lb (East)
Uncoated mechanical RISI Inc. 22.1-lb White directory (mid-point min./max.
1)
Coated paper RISI Inc. Economy 8-lb sheets (mid-point min./max.)
Uncoated freesheet RISI Inc. 50-lb offset, rolls (mid-point min./max.)
Other printing/writing RISI Inc.
Bleached bristols, 10-pt C1S, rolls (mid-point
min./max.)
Paperboard
Unbleached Kraft paperboard RISI Inc. Unbleached kraft (East, mid-point min./max.)
Semichemical paperboard RISI Inc.
Corrugating Medium, Semichemical (East,
mid-point min./max.)
Bleached paperboard RISI Inc. Grocery bag, 30-lb (mid-point min./max.)
Recycled paperboard RISI Inc. 20-pt clay coated news (mid-point min./max.)
1 For many products, RISI Inc. lists price ranges, based on minimum and maximum prices. We chose to use the
midpoint of this range as the price used in the analyses.
4.2.3 Model Parameters
Demand elasticity is calculated as the percentage change in the quantity of a product
demanded divided by the percentage change in price. An increase in price causes a decrease in
the quantity demanded, hence the negative values seen in Table 4-3, which presents the demand
elasticities used in this analysis. Demand is considered elastic if demand elasticity exceeds 1.0
in absolute value (i.e., the percentage change in quantity exceeds the percentage change in price).
The quantity demanded, then, is very sensitive to price increases. Demand is considered
inelastic if demand elasticity is less than 1.0 in absolute value (i.e., the percentage change in
quantity is less than the percentage change in price). Inelastic demand implies that the quantity
demanded changes very little in response to price changes.
As shown in Table 4-3, we draw demand elasticities from the North American Pulp and
Paper (NAPAP) model, a dynamic model used by the U.S. Forest Service to analyze the paper
and paperboard industry (Ince and Buongiorno 2007). The table presents the elasticity estimates,
as well as the NAPAP product from which the elasticity estimate is drawn.

4-7
Table 4-3 Demand Elasticity Estimates
Products Elasticity Source Source Product
Paper
Newsprint -0.22 NAPAP Newsprint
Uncoated mechanical -0.40 NAPAP Uncoated groundwood
Coated paper -0.40 NAPAP Coated freesheet
Uncoated freesheet -0.47 NAPAP Uncoated freesheet
Tissue -0.26 NAPAP Tissue
Other printing/writing -0.23 NAPAP Specialty packaging
Paperboard
Unbleached Kraft paperboard -0.54 NAPAP Kraft packaging paper
Semichemical paperboard -0.43 NAPAP Corrugating medium
Bleached paperboard -0.29 NAPAP Solid bleached board
Recycled paperboard -0.40 NAPAP Recycled board
Source: The North American Pulp and Paper (NAPAP) model (Ince and Buongiorno 2007)
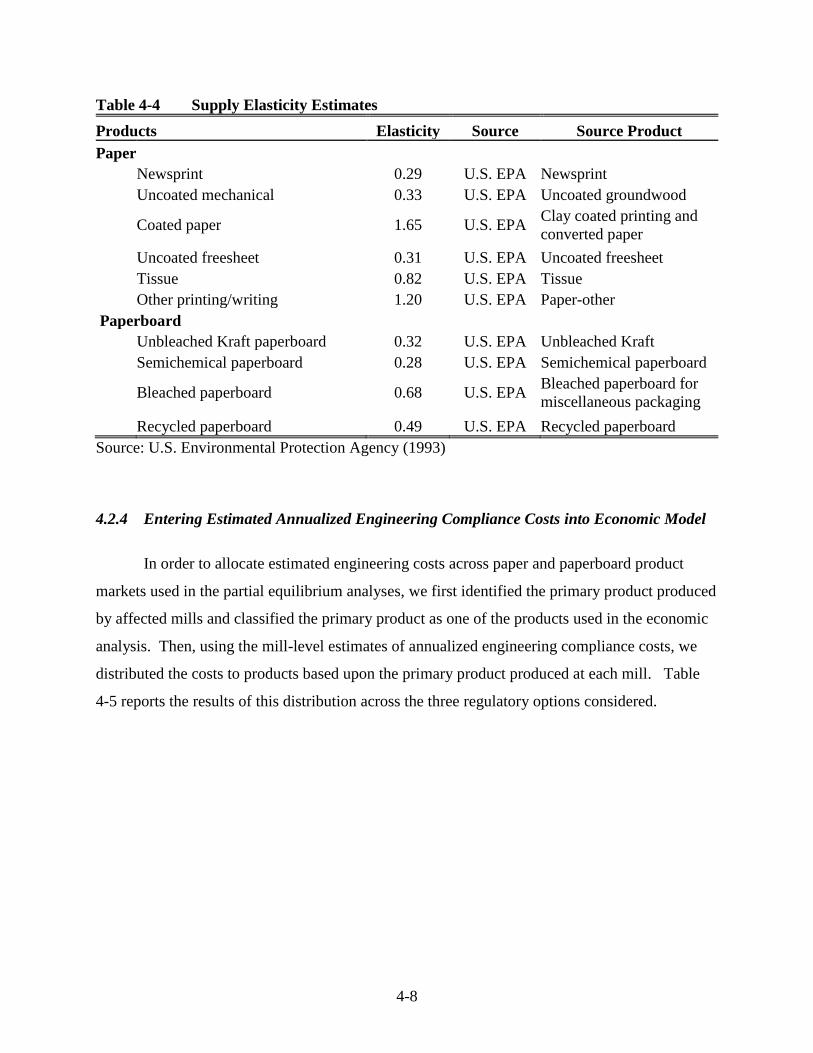
Supply elasticity is calculated as the percentage change in quantity supplied divided by
the percentage change in price. An upward sloping supply curve has a positive elasticity since
price and quantity move in the same direction. If the supply curve has an elasticity greater than
one, then supply is considered elastic, which means a small price increase will lead to a relatively
large increase in quantity supplied. A supply curve with elasticity less than one is considered
inelastic, which means an increase in price will cause little change in quantity supplied. In the
long-run, when producers have sufficient time to completely adjust their production to a change
in price, the price elasticity of supply is usually greater than one.
As shown in Table 4-4, we draw supply elasticities from the U.S. Environmental
Protection Agency’s Economic Impact and Regulatory Flexibility Analysis of Proposed Effluent
Guidelines and NESHAP for the Pulp, Paper, and Paperboard Industry (1993). The table
presents the elasticity estimates, as well as the product, from the 1993 U.S. EPA analysis from
which each elasticity is drawn.
4-8
Table 4-4 Supply Elasticity Estimates
Products Elasticity Source Source Product
Paper
Newsprint 0.29 U.S. EPA Newsprint
Uncoated mechanical 0.33 U.S. EPA Uncoated groundwood
Coated paper 1.65 U.S. EPA Clay coated printing and
converted paper
Uncoated freesheet 0.31 U.S. EPA Uncoated freesheet
Tissue 0.82 U.S. EPA Tissue
Other printing/writing 1.20 U.S. EPA Paper-other
Paperboard
Unbleached Kraft paperboard 0.32 U.S. EPA Unbleached Kraft
Semichemical paperboard 0.28 U.S. EPA Semichemical paperboard
Bleached paperboard 0.68 U.S. EPA Bleached paperboard for
miscellaneous packaging
Recycled paperboard 0.49 U.S. EPA Recycled paperboard
Source: U.S. Environmental Protection Agency (1993)
4.2.4 Entering Estimated Annualized Engineering Compliance Costs into Economic Model
In order to allocate estimated engineering costs across paper and paperboard product
markets used in the partial equilibrium analyses, we first identified the primary product produced
by affected mills and classified the primary product as one of the products used in the economic
analysis. Then, using the mill-level estimates of annualized engineering compliance costs, we
distributed the costs to products based upon the primary product produced at each mill. Table
4-5 reports the results of this distribution across the three regulatory options considered.

4-9
Table 4-5 Estimated Annualized Engineering Compliance Costs by Paper Product
across Regulatory Options (thousands 2010 dollars)
Products
Option 1
(promulgated) Option 2 Option 3
Paper
Newsprint $0 $0 $0
Uncoated mechanical $61 $2,332 $2,332
Coated paper $192 $3,708 $4,096
Uncoated freesheet $429 $10,720 $12,932
Tissue $117 $2,890 $3,020
Other printing/writing $90 $2,113 $3,897
Total Paper $890 $21,764 $26,277
Paperboard
Unbleached Kraft paperboard $82 $2,076 $2,335
Semichemical paperboard $633 $31,603 $34,118
Bleached paperboard $153 $6,186 $6,315
Recycled paperboard $17 $17 $17
Total Paperboard $885 $39,881 $42,785
Pulp
All pulp products $289 $14,785 $18,068
All pulp products $289 $14,785 $18,068
All products $2,064 $76,429 $87,130
Note in Table 4-5 that annualized engineering compliance costs accrue to producers of
pulp products. However, in the partial equilibrium models used within this EIA, we are
modeling the impacts of compliance costs on prices and quantities of paper products. Because of
this, we allocate the annualized engineering compliance costs accruing to pulp producers to
producers of paper products that are potentially affected by this rule. This redistribution is based
on the strong assumption that impacts on the pulp sector can be reallocated to producers of paper
products in proportion to the estimated compliance costs, absent costs expected to accrue to pulp
producers. The results of this redistribution are shown in Table 4-6.

4-10
Table 4-6 Estimated Annualized Engineering Compliance Costs by Paper Product
across Regulatory Options, after Redistributing Estimated Costs to Pulp Producers
(thousands 2010 dollars)
Products
Option 1
(promulgated) Option 2 Option 3
Paper
Newsprint $0 $0 $0
Uncoated mechanical $72 $2,891 $2,942
Coated paper $224 $4,597 $5,168
Uncoated freesheet $499 $13,291 $16,315
Tissue $136 $3,583 $3,810
Other printing/writing $105 $2,620 $4,916
Total Paper $1,035 $26,983 $33,152
Paperboard
Unbleached Kraft paperboard $95 $2,574 $2,946
Semichemical paperboard $737 $39,182 $43,044
Bleached paperboard $177 $7,669 $7,967
Recycled paperboard $19 $21 $21
Total Paperboard $1,029 $49,446 $53,978
All products $2,064 $76,429 $87,130
Using this engineering cost information and total national production of paper and
paperboard products, we estimate the annualized compliance cost per ton of product produced.
Across regulatory options, these annualized engineering compliance costs per ton of product
produced are presented in Table 4-7.

4-11
Table 4-7 Annualized Engineering Compliance Costs per Ton Product Produced at
National Level across Regulatory Options (in 2010 dollars)
Products
Option 1
(promulgated)
($/ton)
Option 2
($/ton)
Option 3
($/ton)
Paper
Newsprint $0.000 $0.000 $0.000
Uncoated mechanical $0.036 $1.444 $1.470
Coated paper $0.028 $0.582 $0.654
Uncoated freesheet $0.052 $1.399 $1.717
Tissue $0.019 $0.491 $0.522
Other printing/writing $0.021 $0.533 $1.000
Total Paper $0.030 $0.770 $0.946
Paperboard
Unbleached Kraft paperboard $0.004 $0.119 $0.137
Semichemical paperboard $0.135 $7.199 $7.908
Bleached paperboard $0.032 $1.395 $1.449
Recycled paperboard $0.001 $0.001 $0.001
Total Paperboard $0.022 $1.043 $1.138
All products $0.025 $0.927 $1.057
Note that mills primarily producing newsprint are unaffected by any of the regulatory options.
These per-ton of product produced annualized engineering costs estimates were then entered into
the series of partial equilibrium market models to estimate impacts on the respective paper and
paperboard product markets.
4.2.5 Model Results
Across regulatory options, market-level changes in the paper and paperboard markets are
estimated to be insignificant. For the finalized option, national-level weighted average paper and
paperboard prices are predicted to increase less than 0.01%, while total quantities are predicted
to decrease less than 0.01% (Table 4-8).

4-12
Table 4-8 Summary of Market Impacts (%) Across Products and Regulatory Option
Option 1
(promulgated) Option 2 Option 3
Products
Price
Change
(%)
Quantity
Change
(%)
Price
Change
(%)
Quantity
Change
(%)
Price
Change
(%)
Quantity
Change
(%)
Paper
Newsprint 0.00% 0.00% 0.00% 0.00% 0.00% 0.00%
Uncoated mechanical <0.01% <0.01% 0.09% -0.04% 0.09% -0.04%
Coated paper <0.01% <0.01% 0.05% -0.02% 0.05% -0.02%
Uncoated freesheet <0.01% <0.01% 0.06% -0.03% 0.07% -0.03%
Tissue <0.01% <0.01% 0.02% -0.01% 0.02% -0.01%
Other printing/writing <0.01% <0.01% 0.03% -0.01% 0.06% -0.01%
Total Paper <0.01% <0.01% 0.04% -0.02% 0.05% -0.02%
Paperboard
Unbleached Kraft
paperboard <0.01% <0.01% 0.01% 0.00% 0.01% 0.00%
Semichemical paperboard <0.01% <0.01% 0.46% -0.20% 0.51% -0.22%
Bleached paperboard <0.01% <0.01% 0.08% -0.02% 0.08% -0.02%
Recycled paperboard <0.01% <0.01% <0.01% <0.01% <0.01% <0.01%
Total Paperboard <0.01% <0.01% 0.06% -0.03% 0.07% -0.03%
Total Paper and Paperboard <0.01% <0.01% 0.05% -0.02% 0.06% -0.03%
Overall for the promulgated rule, the economic models predict an overall price increase
of about 1.3 cents per ton of paper and paperboard product, from a baseline price of about $920
per ton (Table 4-9). Overall production quantities are predicted to decrease about 500 tons under
the promulgated rule, from a baseline production level of about 82 million tons. Note that, under
the final rule, the weighted average price increase is lower than the weighted per ton compliance
cost increase of about 2.5 cents per ton as shown in Table 4-7. As the welfare impacts analysis
that follows shows, producers absorb a portion of the regulatory program costs and do not pass
on the full burden to consumers.

4-13
Table 4-9 Change in Price and Quantity (#) across Products and Regulatory Options
(costs in 2010 dollars)
Option 1
(promulgated) Option 2 Option 3
Products
Price
Change
($/ton)
Quantity
Change
(tons/year)
Price
Change
($/ton)
Quantity
Change
(tons/year)
Price
Change
($/ton)
Quantity
Change
(tons/year)
Paper
Newsprint $0.00 0 $0.00 0 $0.00 0
Uncoated mechanical $0.02 -18 $0.65 -707 $0.66 -719
Coated paper $0.02 -75 $0.47 -1,542 $0.53 -1,734
Uncoated freesheet $0.02 -100 $0.55 -2,663 $0.68 -3,269
Tissue $0.01 -15 $0.37 -400 $0.40 -426
Other printing/writing $0.02 -16 $0.45 -388 $0.84 -728
Total Paper $0.02 -223 $0.45 -5,700 $0.56 -6,875
Paperboard
Unbleached Kraft
paperboard <$0.01 -30 $0.04 -801 $0.05 -917
Semichemical paperboard $0.05 -203 $2.81 -10,791 $3.09 -11,854
Bleached paperboard $0.02 -28 $0.98 -1,209 $1.02 -1,256
Recycled paperboard <$0.01 -5 <$0.01 -5 <$0.01 -5
Total Paperboard $0.01 -266 $0.48 -12,806 $0.53 -14,033
Total Paper and Paperboard $0.01 -489 $0.48 -18,506 $0.55 -20,908
The national compliance cost estimates are often used to approximate the social cost of the
rule. However, in cases where the engineering costs of compliance are used to estimate social
cost, the burden of the regulation is typically measured as falling solely on the affected
producers, who experience a profit loss exactly equal to these cost estimates. Thus, the entire
loss is a change in producer surplus with no change (by assumption) in consumer surplus,
because no changes in price and consumption are estimated. This is typically referred to as a
“full-cost absorption” scenario in which all factors of production are assumed to be fixed and
firms are unable to adjust their output levels when faced with additional costs.
In contrast, EPA’s economic analysis builds on the engineering cost analysis and
incorporates economic theory related to producer and consumer behavior to estimate changes in
market conditions. Paper and paperboard producers can make supply adjustments that will
generally affect the market environment in which they operate. As producers change levels of

4-14
product supply in response to a regulation, consumers are typically faced with changes in prices
that cause them to alter the quantity they are willing to purchase. These changes in price and
output from the market model are used to estimate the total economic surplus changes for two
types of stakeholders: paper and paperboard consumers and producers.
As shown in Table 4-10, under the finalized Option 1, paper and paperboard consumers are
predicted to experience a $1.1 million reduction in surplus as the result of higher prices and
reduced consumption. Producer surplus is predicted to decrease about $1.0 million. Total
welfare losses are then estimated at $2.1 million.
Table 4-10 Summary of Consumer and Producer Surplus Changes: 2010 (in millions of
2010 dollars)
Surplus Change (in 2010 dollars)
Option Product Type Consumer Producer Total
Option 1 Paper -$0.6 -$0.4 -$1.0
(promulgated) Paperboard -$0.5 -$0.6 -$1.0
Total -$1.1 -$1.0 -$2.1
Option 2
Paper -$15.2 -$11.8 -$27.0
Paperboard -$21.6 -$27.8 -$49.4
Total -$36.8 -$39.6 -$76.4
Option 3 Paper -$19.0 -$14.2 -$33.1
Paperboard -$23.5 -$30.4 -$53.9
Total -$42.5 -$44.6 -$87.1
4.2.6 Limitations
Ultimately, the regulatory program may cause negligible increases in the costs of
supplying paper and paperboard products to consumers. The partial equilibrium model used in
this EIA is designed to evaluate behavioral responses to this change in costs within an
equilibrium setting within nationally competitive markets. The national competitive market
assumption is clearly very strong because the markets in paper products may be regional for
some products, as well as some product markets within the paper industry may be
interdependent. Regional price and quantity impacts could be different from the average impacts
reported if local market structures, production costs, or demand conditions are substantially
different from those used in this analysis.
4-15
4.3 Small Business Impacts Analysis
The Regulatory Flexibility Act as amended by the Small Business Regulatory Enforcement
Fairness Act (SBREFA) generally requires an agency to prepare a regulatory flexibility analysis
of any rule subject to notice and comment rulemaking requirements under the Administrative
Procedure Act or any other statute, unless the agency certifies that the rule will not have a
significant economic impact on a substantial number of small entities. Small entities include
small businesses, small governmental jurisdictions, and small not-for-profit enterprises.
After considering the economic impact of the finalized rules on small entities, the
screening analysis indicates that these finalized rules will not have a significant economic impact
on a substantial number of small entities (or “SISNOSE”). The supporting analyses for these
determinations are presented in this section of the EIA.
4.3.1 Small Business National Overview
The industry sectors covered by the final rule were identified during the development of
the engineering cost analysis. The U.S. Census Bureau’s Statistics of U.S. Businesses (SUSB)
provides national information on the distribution of economic variables by industry and
enterprise size. The Census Bureau and the Office of Advocacy of the Small Business
Administration (SBA) supported and developed these files for use in a broad range of economic
analyses.1 Statistics include the total number of establishments, and receipts for all entities in an
industry; however, many of these entities may not necessarily be covered by the final rule. SUSB
also provides statistics by enterprise employment and receipt size (Table 2-10).
The Census Bureau’s definitions used in the SUSB are as follows:
Establishment: A single physical location where business is conducted or where
services or industrial operations are performed.
Firm: A firm is a business organization consisting of one or more domestic
establishments in the same state and industry that were specified under common
ownership or control. The firm and the establishment are the same for single-
establishment firms. For each multi-establishment firm, establishments in the same
industry within a state will be counted as one firm- the firm employment and annual
payroll are summed from the associated establishments.
1See http://www.census.gov/csd/susb/ and http://www.sba.gov/advocacy/ for additional details.
4-16
Receipts: Receipts (net of taxes) are defined as the revenue for goods produced,
distributed, or services provided, including revenue earned from premiums,
commissions and fees, rents, interest, dividends, and royalties. Receipts exclude all
revenue collected for local, state, and federal taxes.
Enterprise: An enterprise is a business organization consisting of one or more
domestic establishments that were specified under common ownership or control. The
enterprise and the establishment are the same for single-establishment firms. Each
multi-establishment company forms one enterprise—the enterprise employment and
annual payroll are summed from the associated establishments. Enterprise size
designations are determined by the sum of employment of all associated
establishments.
Because the SBA’s business size definitions apply to an establishment’s “ultimate parent
company,” we assumed in this analysis that the “firm” definition above is consistent with the
concept of ultimate parent company that is typically used for SBREFA screening analyses, and
the terms are used interchangeably.

4-17
Table 4-11 Number of Firms, Total Employment, and Estimated Salaries
by Firm Size and NAICS for Primarily Affected Segments, 2006
NAICS NAICS Description
SBA Size
Standard
Small
Businesses
Large
Businesses
Total
Firms
Number of Firms by Firm Size
322110 Pulp Mills 750 21 10 31
322121 Paper (except Newsprint) Mills 750 137 42 179
322122 Newsprint Mills 750 11 7 18
322130 Paperboard Mills 750 57 30 87
Percentage of Firms by Firm Size
322110 Pulp Mills 750 68% 32% 100%
322121 Paper (except Newsprint) Mills 750 77% 23% 100%
322122 Newsprint Mills 750 61% 39% 100%
322130 Paperboard Mills 750 66% 34% 100%
Source: U.S. Census Bureau. 2011. “Statistics of U.S. Businesses, Business Dynamics Statistics, Business Employment
Dynamics, and Nonemployer Statistics.” < http://www.sba.gov/advocacy/849/12162#susb>
4.3.2 Small Entity Economic Impact Measures
The promulgated NESHAP amendments will affect the owners of the facilities that will
incur compliance costs to control their regulated emissions. The owners, either firms or
individuals, are the entities that will bear the financial impacts associated with these additional
operating costs. The finalized rule has the potential to impact all firms owning affected facilities,
both large and small.
The analysis provides EPA with an estimate of the magnitude of impacts the final
NESHAP amendments may have on the ultimate domestic parent companies that own facilities
EPA expects might be impacted by the rules. The analysis focuses on small firms because they
may have more difficulty complying with a new regulation or affording the costs associated with
meeting the new standard. This section presents the data sources used in the screening analysis,
the methodology we applied to develop estimates of impacts, the results of the analysis, and
conclusions drawn from the results.

4-18
The small business impacts analysis relies upon a series of firm-level sales tests
(represented as cost-to-sales ratios) for firms that are likely to be associated with NAICS codes
listed in Table 2-10. EPA obtained firm-level employment, revenues, and production levels
using various sources, including the Dun & Bradstreet, the American Business Directory,
corporate websites, and publically-available financial reports. Using these data, we estimated
firm-level compliance cost impacts and calculated cost-to-sales ratios to identify small firms that
might be significantly impacts by the rules.
For the sales test, we divided the estimates of annualized establishment compliance costs
at the company-level by estimates of company sales. This is known as the cost-to-revenue ratio,
or the “sales test.” The “sales test” is the impact methodology EPA employs in analyzing small
entity impacts as opposed to a “profits test,” in which annualized compliance costs are calculated
as a share of profits. The sales test is often used because revenues or sales data are commonly
available for entities impacted by EPA regulations, and profits data normally made available are
often not the true profit earned by firms because of accounting and tax considerations. Revenues
and sales as typically published are correct figures and are more reliably reported when
compared to profit data. The use of a “sales test” for estimating small business impacts for a
rulemaking such as this one is consistent with guidance offered by EPA on compliance with
SBREFA2 and is consistent with guidance published by the U.S. SBA’s Office of Advocacy that
suggests that cost as a percentage of total revenues is a metric for evaluating cost increases on
small entities in relation to increases on large entities (U.S. SBA, 2010).38
4.3.3 Small Entity Economic Impact Analysis and Conclusions
As discussed in Section 3, 114 facilities are potentially affected by each of the regulatory
options, but as the options increase in stringency the relative impacts increase. Of these 114
facilities, three are owned by small entities. Table 4-12 presents facility names, ultimate owners,
number of employees, and estimated sales in 2010 for the three small firms.
2 The SBREFA compliance guidance to EPA rulewriters regarding the types of small business analysis that should
be considered can be found at <http://www.epa.gov/sbrefa/documents/rfaguidance11-00-06.pdf> 3U.S. SBA, Office of Advocacy. A Guide for Government Agencies, How to Comply with the Regulatory
Flexibility Act, Implementing the President’s Small Business Agenda and Executive Order 13272, June 2010.

4-19
Table 4-12 Potentially Affected Small Entities: Employees and Sales, 2010
Faculty Ultimate Owner
Employees in
2010
Sales in 2010
(million of 2010
dollars)
Lincoln Paper and Tissue,
LLC
Lincoln Paper and Tissue,
LLC 350 141.2
Old Town Fuel & Fiber Patriarch Partners, LLC 170 12.9
Port Townsend Paper Corp. Port Townsend Paper Corp 585 181.3
Table 4-13 shows that cost-to-sales ratios for the three affected small firms do not exceed
1% for the promulgated option. In fact, the ratios are well below 1%, ranging from 0.01% to
about 0.14%. However, an impact level greater than 1% is estimated for two of the three
affected small firms under the more stringent, but unselected, Options 2 and 3.
Table 4-13 Estimated Annualized Engineering Costs for Potentially Affected Small
Entities across Regulatory Options (costs in 2010 dollars)
Option 1
(promulgated) Option 2 Option 3
Ultimate Owner
Estimated
Annualized
Costs ($)
Estimated
Costs to
Sales Ratio
Estimated
Annualized
Costs ($)
Estimated
Costs to
Sales Ratio
Estimated
Annualized
Costs ($)
Estimated
Costs to
Sales Ratio
Lincoln Paper and Tissue,
LLC 18,223 0.01% 18,223 0.01% 735,283 0.52%
Patriarch Partners, LLC 18,223 0.14% 735,283 5.70% 1,963,508 15.22%
Port Townsend Paper Corp 13,345 0.01% 2,283,931 1.26% 2,283,931 1.26%
EPA concludes from this analysis that a substantial number of small firms are not
significantly impacted. Based upon the analysis in this section, we conclude there is no
SISNOSE arising from the finalized NESHAP amendments.
4-20
4.4 Employment Impacts Analysis
While a standalone analysis of employment impacts is not included in a standard cost-
benefit analysis, such an analysis is of particular concern in the current economic climate of
sustained high unemployment. Executive Order 13563, states, “Our regulatory system must
protect public health, welfare, safety, and our environment while promoting economic growth,
innovation, competitiveness, and job creation”. Therefore, we seek to inform the discussion of
labor demand and job impacts by providing an estimate of the employment impacts of the
finalized regulations using labor requirements for the operation and maintenance of control
requirements.
Regulations set in motion new orders for pollution control equipment and services. New
categories of employment have been created in the process of implementing regulations to make
our air safer to breathe. When a new regulation is promulgated, a response of industry is to order
pollution control equipment and services in order to comply with the regulation when it becomes
effective. Revenue and employment in the environmental technology industry have grown
steadily between 2000 and 2008, reaching an industry total of approximately $300 billion in
revenues and 1.7 million employees in 2008.4 While these revenues and employment figures
represent gains for the environmental technologies industry, they are costs to the regulated
industries required to install the equipment. Moreover, it is not clear the 1.7 million employees
in 2008 represent new employment as opposed to workers being shifted from the production of
goods and services to environmental compliance activities.
Once the equipment is installed, regulated firms hire workers to operate and maintain the
pollution control equipment – much like they hire workers to produce more output. Morgenstern
et al. (2002) examined how regulated industries respond to regulation. The authors found that,
on average for the industries they studied, employment increases in regulated firms. Of course,
these firms may also reassign existing employees to perform these activities.
4 Environmental Business International (EBI), Inc., San Diego, CA. Environmental Business Journal, monthly
(copyright). http://www.ebiusa.com/ EBI data taken from the Department of Commerce International Trade
Administration Environmental Industries Fact Sheet from April 2010:
http://web.ita.doc.gov/ete/eteinfo.nsf/068f3801d047f26e85256883006ffa54/4878b7e2fc08ac6d85256883006c45
2c?OpenDocument

4-21
Environmental regulations support employment in many basic industries. In addition to
the increase in employment in the environmental protection industry (via increased orders for
pollution control equipment), environmental regulations also support employment in industries
that provide intermediate goods to the environmental protection industry. The equipment
manufacturers, in turn, order steel, tanks, vessels, blowers, pumps, and chemicals to manufacture
and install the equipment. Bezdek et al. (2008) found that investments in environmental
protection industries create jobs and displace jobs, but the net effect on employment is positive.
Unlike several recent RIAs, however, we do not provide employment impacts here using
estimates based on the study by Morgenstern et al. (2002). Using plant-level data from 1979-
1991, Morgenstern et al. (2002) estimate a model for four highly-polluting, regulated industries
(pulp and paper, plastics, steel, and petroleum refining) to examine the effect of higher
abatement costs from regulation on net employment. The results indicate that, on average across
the four industries, each additional $1 million in spending on pollution abatement results in a net
increase of 1.55 jobs (95% confidence interval: -2.9 to + 6.0). We do not, however, provide
employment impacts estimates for this rulemaking based on the study by Morgenstern et al.
(2002) because the study’s results for the pulp and paper industry, specifically, were not
statistically significant.
The focus of this part of the analysis is on labor requirements related to the compliance
actions of the affected entities within the affected sector. We do not estimate any potential
changes in labor outside of the pulp and paper industry. This analysis estimates the potential
employment impacts due to the operation and maintenance of control equipment, as well as
additional reporting and recordkeeping requirements. No estimates of the labor used to
manufacture or assemble pollution control equipment or to supply the materials for manufacture
or assembly are included because U.S. EPA does not currently have this information.
The employment analysis uses a bottom-up engineering-based methodology to estimate
employment impacts. The engineering cost analysis summarized in this EIA includes estimates
of the labor requirements associated with implementing the finalized regulations. These labor
changes may be required as an upfront, intensive expenditure of effort required to initially
comply with the new requirements, or as continuous, annual efforts to sustain compliance.
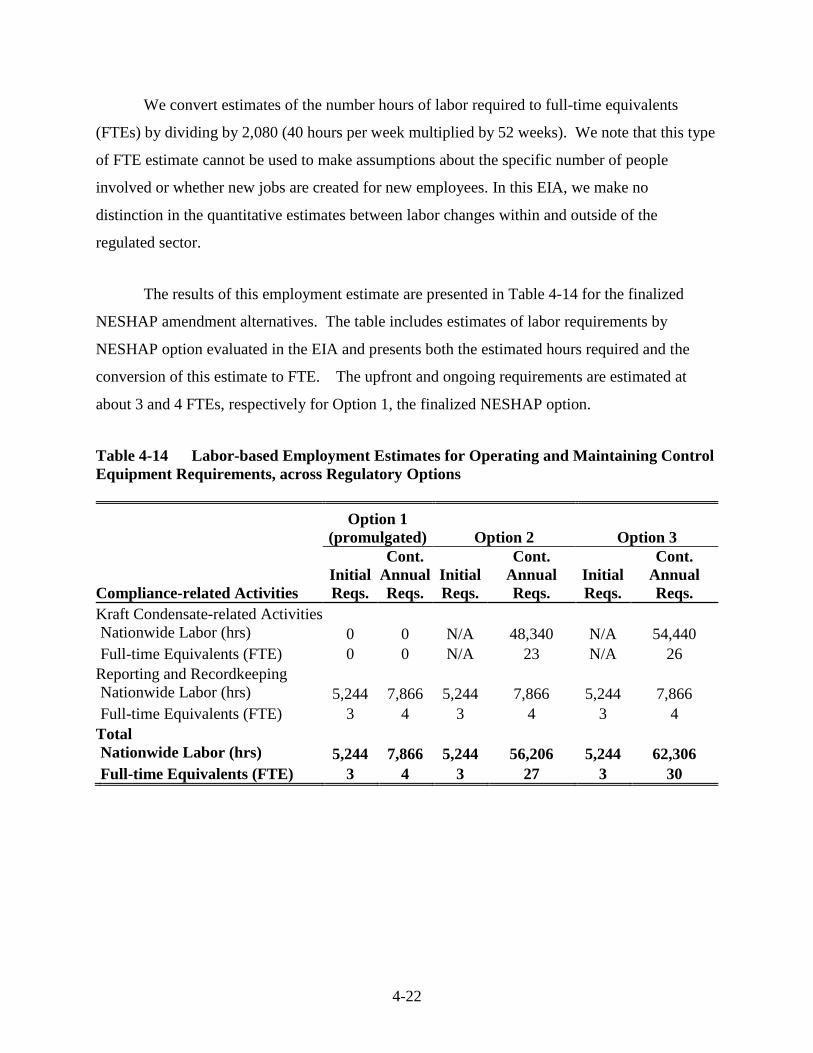
4-22
We convert estimates of the number hours of labor required to full-time equivalents
(FTEs) by dividing by 2,080 (40 hours per week multiplied by 52 weeks). We note that this type
of FTE estimate cannot be used to make assumptions about the specific number of people
involved or whether new jobs are created for new employees. In this EIA, we make no
distinction in the quantitative estimates between labor changes within and outside of the
regulated sector.
The results of this employment estimate are presented in Table 4-14 for the finalized
NESHAP amendment alternatives. The table includes estimates of labor requirements by
NESHAP option evaluated in the EIA and presents both the estimated hours required and the
conversion of this estimate to FTE. The upfront and ongoing requirements are estimated at
about 3 and 4 FTEs, respectively for Option 1, the finalized NESHAP option.
Table 4-14 Labor-based Employment Estimates for Operating and Maintaining Control
Equipment Requirements, across Regulatory Options
Option 1
(promulgated) Option 2 Option 3
Compliance-related Activities
Initial
Reqs.
Cont.
Annual
Reqs.
Initial
Reqs.
Cont.
Annual
Reqs.
Initial
Reqs.
Cont.
Annual
Reqs.
Kraft Condensate-related Activities
Nationwide Labor (hrs) 0 0 N/A 48,340 N/A 54,440
Full-time Equivalents (FTE) 0 0 N/A 23 N/A 26
Reporting and Recordkeeping
Nationwide Labor (hrs) 5,244 7,866 5,244 7,866 5,244 7,866
Full-time Equivalents (FTE) 3 4 3 4 3 4
Total
Nationwide Labor (hrs) 5,244 7,866 5,244 56,206 5,244 62,306
Full-time Equivalents (FTE) 3 4 3 27 3 30
5-1
5 REFERENCES
Benwart, S.J., 2006. Forest and paper products. Standard and Poor’s Industry Surveys 176(28).
Berck, P., Hoffmann, S., 2002. Assessing the Employment Impacts of Environmental and
Natural Resource Policy. Environmental and Resource Economics 22(1): 133-156.
Bezdek, R.H., Wendling, R.M., DiPerna, P., 2008. Environmental protection, the economy, and
jobs: National and regional analyses. Journal of Environmental Management 86(1): 63-
79.
Fullerton, D., Metcalf, G., 2002. Tax Incidence. In Handbook of Public Economics, eds A.
Auerbach, M. Feldstein. Elsevier: Amsterdam.
Ince, P., Buongiorno, J., 2007. North American Pulp and Paper Model (NAPAP). In Resource
and Market Projections for Forest Policy Development: Twenty-five Years of
Experience with the US RPA Timber Assessment, eds D.M. Adams, R.W. Haynes, pp.
99-174. Springer: Dordrecht, The Netherlands.
Morgenstern, R.D., Pizer, W.A., Shih, J.-S., 2002. Jobs Versus the Environment: An Industry-
Level Perspective. Journal of Environmental Economics and Management 43(3): 412-
436.
RISI Inc., January 20,2011a. Price Watch. PPI Pulp & Paper Week 33(3): 3.
RISI Inc., February 4,2011b. Price Watch. PPI Pulp & Paper Week 33(5): 5.
U.S. Census Bureau, 2001. 1997 Census NAICS Definitions.
<http://www.census.gov/econ/industry/current/c322.htm> Accessed on: 11/14/11.
U.S. Energy Information Administration, 2008. Assumptions to the Annual Energy Outlook
2008: With Projections for 2030.
<http://www.eia.gov/oiaf/aeo/assumption/pdf/0554(2008).pdf> Accessed on: 11/14/11.
U.S. Environmental Protection Agency, 2002. Profile of the Pulp and Paper Industry. Sector
Notebook Project. EPA/310-R-02-002. <http://www.epa.gov/Compliance/resources/publications/assistance/sectors/notebooks/in
dex.html>. Accessed on: 11/14/11.
U.S. Environmental Protection Agency, 2010. Guidelines for Preparing Economic Analyses,
EPA 240-R-10-001. <http://yosemite.epa.gov/ee/epa/eed.nsf/pages/Guidelines.html>
Accessed on: 11/14/11.

5-2
U.S. Environmental Protection Agency, Office of Water, Office of Air and Radiation, 1993.
Economic Impact and Regulatory Flexibility Analysis of Proposed Effluent
Guidelines and NESHAP for the Pulp, Paper, and Paperboard Industry: Final
Report, 821R93021.