final report impact of agoa on the textile and …
TRANSCRIPT

FINAL REPORT
IMPACT OF AGOA ON
THE TEXTILE AND APPAREL INDUSTRY OF KENYA
Prepared by Margaret K. Chemengich Charmy Investment Limited Kenya Reinsurance Plaza, Mezannine Floor, Taifa Road Nairobi, Kenya P.O. BOX 50968-00200, NAIROBI TEL: 254 020 315450 ; Mobile +254-722314416 FAX 254 020 315450 EMAIL: [email protected]
March 2010

ii
Contents
ACRONYMS ............................................................................................................................ 1
EXECUTIVE SUMMARY ........................................................................................................... 2
1.0.BACKGROUND .................................................................................................................. 4
1.1. SCOPE OF WORK AND SPECIFIC TERMS OF REFERENCE .......................................................................... 5
(i) Scope of Work ........................................................................................................................ 5
(ii) Specific Terms of Reference (TOR) ........................................................................................... 5
1.2. METHODOLOGY AND APPROACH .................................................................................................... 6
1.3. LIMITATIONS OF THE STUDY ........................................................................................................... 7
2.0.OVERVIEW OF THE COTTON TEXTILE AND APPAREL (CTA) INDUSTRY AND POLICY
INCENTIVES OFFERED BY THE GOVERNMENT ....................................................................... 8
2.1. OVERVIEW OF COTTON, TEXTILE AND APPAREL (CTA) INDUSTRY ........................................................... 8
2.2. GOVERNMENT POLICY INCENTIVES FOR COTTON, TEXTILE AND APPAREL INDUSTRY ..................................... 9
2.2.1. ESTABLISHMENT OF EXPORT PROCESSING ZONES (EPZ) ...................................................................... 10
2.2.2. DUTY DRAWBACK ...................................................................................................................... 10
2.2.3. MANUFACTURE UNDER BOND (MUB) ........................................................................................... 11
2.2.4. TAX REMISSION FOR EXPORTS OFFICE (TREO) SCHEME...................................................................... 11
2.2.5. STRATEGIC POSITION AND MODERNIZATION OF PORT OF MOMBASA ..................................................... 11
2.2.6. LINKAGE WITH INTERNATIONAL SHIPPING LINES ................................................................................ 11
2.2.7. GLOBAL AND REGIONAL CONNECTIVITY .......................................................................................... 11
3.0.IMPACT OF AGOA ON KENYA’S COTTON, TEXTILE AND APPAREL INDUSTRY................. 12
3.1. IMPACT OF AGOA ON KENYA DURING THE PERIOD 2000 - 2004 AND 2005 - 2009 ............................. 12
3.1.1. Investments ..................................................................................................................... 12 3.1.2. Number of Enterprises ..................................................................................................... 14 3.1.3. Number of employees ...................................................................................................... 14 3.1.4. Production and Manufacturing ........................................................................................ 15 As regard garment and apparel manufacturers, it is estimated that there are 170 large scale and 74,576 small and micro garment/apparel manufacturers operating in Kenya today. Of these 37 are exports oriented and generate a bulk of the revenue for the country. ............................................. 16 3.1.5. Exports and Import Performance ...................................................................................... 16 3.1.6. Trade Performance .......................................................................................................... 17 3.1.7. Intra-regional Trade and Transport .................................................................................. 20 3.1.8. Contribution to GDP – Textile Exports as a % of total Exports ............................................ 20 3.1.9. Backward Linkage (Impact of other related industries) ..................................................... 21
3.2. PROJECTED IMPACT OF AGOA ..................................................................................................... 21 3.2.1. Projected impact if AGOA is extended on short term basis (under 5yrs) ............................. 21 3.2.2. Projected impact if AGOA is not extended......................................................................... 22 3.2.3. Projected Impact of AGOA on sourcing of raw materials ................................................... 22
4.0.CONCLUSION .................................................................................................................. 23

iii
Tables: Table 3.1: Trends of Investment in Textile and Apparel Industry in Kenya, 2000-2010 Table 3.2: Trends of Investment in Textile and Apparel Industry in Kenya, 2000-2010 Table 3.3: Kenya’s Export of Manufactured products 2002 -2006 (Kshs 000) Table 3.4: Kenya’s Export Performance, 2000 – 2009 (Kshs Million) Table3.5: Bilateral Trade Profile Between Kenya and USA: 2000 -2008 (Kshs Million) Table 3.6: Exports to US under AGOA / GSP provisions for selected Africa AGOA
eligible countries 2003 – 2009 (US $ ‘000) Table 3.7: Kenya’s Real GDP Growth Rates and Per capita Income: 2000 – 2010 Figures: Figure 3.1: Kenya’s Exports by destination, 2000-2009 Graphs Graph 3.1: Exports of Kenya’s Major Manufacturing Sectors 2002 -2006 Graph 3.2: Kenya Textile Exports to US under AGOA / GSP Provisions, 2004–2008 Graph 3.3: Kenya’s Real GDP Growth Rates: 2000 -2010 Annexes: Annex 1: References Annex 2: Contacts Annex 3: List Firms
:

1
ACRONYMS
ACTIF - African Cotton & Textile Industries Federation AGOA - African Growth and Opportunity Act BRRU - Business Regulatory Reform Unit COMESA - Common Market for Eastern and Southern Africa DFQF - Duty free Quota free EAC - East African Community EDP - Export Development Program EPZ - Export Processing Zones ERS - Economic Recovery Strategy FDI - Foreign Direct Investment GDP - Gross Domestic Product GOK - Government of Kenya GSP - Generalized System of Preferences JKIA - Jomo Kenyatta International airport KAM - Kenya Association of Manufacturers LDC - Least developed Countries MFA - Multi Fibre Agreement MTP - Medium Term Plan NSE - Nairobi Stock Exchange SAP - Structural Adjustment Programme SSA - Sub-Saharan African TMA - Textile Manufacturers Association TREO - Tax Remission for Exports Office Scheme UNDP - United Nations Development Programme VAT - Value Added Tax VSAT - Very Small Aperture Terminal WTO - World Trade Organization

2
Executive Summary
The fact that the African Growth and Opportunity Act (AGOA), United States Trade Act, has significantly enhanced market access to U.S. for Kenya’s products is not in doubt. AGOA builds on existing U.S. trade programs by expanding the (duty-free) benefits previously available only under the Generalized System of Preferences (GSP) program. Duty-free access to the U.S. market under the combined AGOA/GSP program stands at approximately 7,000 product tariff lines, including the roughly 1,800 product tariff lines that were added to the GSP by the AGOA legislation. Owing to the dynamics of international trade, AGOA has undergone several changes. Until January 1, 2005 when textile quotas were phased out, the major beneficiary sector since the passing of the AGOA has been the textile sector. Originally the program covered 8-year period from October 2000 to September 2008, but amendments signed into law in July 2004 further extended AGOA to 2015. During the same period, a special dispensation relating to apparel was extended by three years to 2007. On 20 December 2006, other key changes to AGOA were signed into law, extending the garment provisions to 2012. In June 2007, a revised textile certificate of origin was published to give effect to the "abundant supply" provisions contained in the most recent legislative changes. The foregoing changes have made the SSA AGOA beneficiary countries, like Kenya to face substantive competition from the more efficient Far East countries of Asia. Kenya’s development agenda since independence has principally been driven by market based policies in which the private sector plays a relative key role in resource allocation. The market policies have further benefited from the enhanced liberalization under WTO and regional integration. Towards this end export led growth remains a key strategy for enhancing growth, employment generation and poverty reduction while integrating Kenya into the global economy. The cotton-to-garments supply chain can be divided into four major sectors and a number of sub sectors. The principal sectors are smallholder cotton farmers, ginners, textile and spinners, and garment and apparel manufacturers. The textile and apparel firms in the country produce a large variety of products. With the entry of AGOA in 2000, a number of textile industries were established in the Kenya Export Processing Zones and those located outside EPZs were extended the benefits enjoyed by those firms located in EPZs. The government policy incentives for cotton, textile and apparel industry include fiscal benefits due to tax exemptions and income tax waivers, the textile firms operating within the framework of EPZ also enjoy one stop approvals and fast tracking of customs clearance; Manufacture under Bond (MUB); and Tax Remission for Exports Office (TREO) Scheme to encourage local manufacturers to export their products by remitting duty and VAT on raw materials used in the manufacture of goods for export among other incentives.

3
With the afore mentioned changes that the AGOA program has faced, the impact of AGOA on the Kenya’s economy and in particular the textile and apparel industry may be segregated into two distinct periods that is from 2000 to 2004 and from 2005 to 2009 after the expiry of the MFA. The impact has been broadly assessed in the economic parameters such as the trend of investment growth or decline; growth or decline in numbers of enterprises and employees in the sector; production levels; international trade (exports and imports); contribution to the GDP (textile and apparel exports to total exports); the on other related industries in the supply chain (backward linkages). The study has observed an increase and decline in the trend of investment as reflected in number of enterprises and employees in the sector; production levels immediately when AGOA was embraced and when the MFA came into effect respectively. The; performance in the international trade dwindled particularly slow growth in exports and the continued rise in imports, with unfavorable balance of trade between Kenya and USA; dismal contribution to the GDP by the textile and apparel exports); and the weak backward and forward linkages with other related industries in the supply chain all call for the need to continue with AGOA. In fact failure to guarantee AGOA extension shall negate the intention of AGOA to alleviate poverty via “Trade not Aid”; inadvertently remove the motivation to build an Kenyan fiber (African Fiber in the wider context), textile and apparel value chain; discourage new investments and reverse the development of apparel manufacturing capacity of Kenya that has resulted from AGOA; and create unfair competition if DFQF status is extended to Asian LDCs among others.
It is in view of the above that that this study report asserts that lobbying the US Congress by the ACTIF to consider extending the period of AGOA and AGOA IV beyond 2015 to promote Kenya’s cotton, textile and apparel sector as originally intended; extending the period of the “third country fabric” provision; and deferring/postponing the introduction of DFQF status to Asian LDCs so that it does not undermine the original purpose of AGOA and AGOA IV should be pursued relentlessly.

1.0. Background
The African Cotton and Textile Industries Federation (ACTIF) is a not for profit regional industry/trade body formed in June 2005 by the Cotton, Textile and Apparel sectors from Eastern and Southern Africa covering the COMESA, SADC and the EAC trading blocks, and currently includes members of National Associations from 19 countries (Botswana, Egypt, Ethiopia, Kenya, Lesotho, Ghana, Madagascar, Mozambique, Namibia, Nigeria, Sudan, Mauritius, Malawi, South Africa, Swaziland, Tanzania, Uganda, Zambia and Zimbabwe). Among the key mandates of ACTIF include bringing the disparate needs of the cotton, textile and apparel sectors of its Members into a cohesive and consensus driven positions at the regional and international trade and development forums; enhancing dedication to the specific concerns of the industry; and promoting the improvement of competitiveness in both the regional and global market place. The African Growth and Opportunity Act (AGOA), United States Trade Act, has significantly enhanced market access to U.S. for Kenya as one of the 41 Sub-Saharan African (SSA) countries. AGOA builds on existing U.S. trade programs by expanding the (duty-free) benefits previously available only under the Generalized System of Preferences (GSP) program. Duty-free access to the U.S. market under the combined AGOA/GSP program stands at approximately 7,000 product tariff lines, including the roughly 1,800 product tariff lines that were added to the GSP by the AGOA legislation. Notably, the other products in addition to textiles and apparel include honey and footwear among other products. Originally the program covered 8-year period from October 2000 to September 2008, but amendments signed into law by U.S. President George Bush in July 2004 further extend AGOA to 2015. At the same time, a special dispensation relating to apparel was extended by three years to 2007. On 20 December 2006, key changes to AGOA were signed into law, extending the garment provisions to 2012. In June 2007, a revised textile certificate of origin was published to give effect to the "abundant supply" provisions contained in the most recent legislative changes. Apart from a few SSA countries endowed with oil and minerals, the major beneficiary sector since the passing of the AGOA has been the textile sector until January 1, 2005 when textile quotas were phased out. The foregoing changes were repealed in 2009 and a new Bill recently published. The foregoing changes have made the SSA AGOA beneficiary countries, Kenya inclusive to face substantive competition from the more efficient Far East countries of Asia, China among others. For instance it has been observed that with the expiry of Multi-fiber Agreement (MFA) provisions in 2005, the SSA textile and apparel trade has declined substantially, and the net beneficiary has been China and Asian LDC countries. Since each of the participating

5
SSA signed onto the AGOA agreement individually, ACTIF has found it prudent to consolidate the voice of the SSA textile and apparel producers to lobby the US Congress to consider extending the period of AGOA and AGOA IV beyond 2015 to promote SSA cotton sector as originally intended; extending the period of the “third country fabric” provision; and deferring/postponing the introduction of DFQF status to Asian LDCs as it would undermine the purpose of AGOA and AGOA IV.
ACTIF would equally wish to prove that failure to guarantee AGOA extension shall negate the intention of AGOA to alleviate poverty via “Trade not Aid”; inadvertently remove the motivation to build an African Fiber, textile and apparel value chain; discourage new investments and reverse the development of apparel manufacturing capacity of SSA that has resulted from AGOA; and create unfair competition if DFQF status is extended to Asian LDCs among others.
It is in view of the above development that ACTIF would like to establish a detailed position on the impact of AGOA in Kenya as one of its member counties. This information will be indeed crucial in the alignment of ACTIF’s strategy in reaching out to its members and develop a paper for the purpose of lobbying the US Congress for the future success of AGOA.
1.1. Scope of Work and Specific Terms of Reference
(i) Scope of Work
The need for ACTIF to bring the disparate needs of the cotton, textile and apparel sectors of its Members into a cohesive and consensus driven positions at the regional and international trade and development forums may not be overemphasized. The study shall establish that failure to guarantee AGOA extension shall negate the noble intentions of AGOA to alleviate poverty via “Trade not Aid” and inadvertently remove the motivation to build an African Fiber, textile and apparel value chain. The study also aims to establish that new developments shall discourage new investments and reverse the development of apparel manufacturing capacity of Kenya that has resulted from AGOA; and create unfair competition if DFQF status is extended to the Asian countries with more competitive advantages.
(ii) Specific Terms of Reference (TOR)
To establish a detailed position on the impact of AGOA in Kenya’s cotton, textile and apparel sector the specific tasks and expected outcomes forming the basis for the study are prioritized into:
1) Collecting Kenya data and compiling a report using the format provided. The data to be collected, covering the period December 2004 to March, 2010

6
include the number of factories (spinning Mills); Weaving or Knitting mills; number of Garment factories and the percentage capacity utilization of the mills and factories; Direct and Indirect number of Employees; Cotton Lint production in Tones and Value of exports (USD); Pieces of exports and total value of exports (USD); Total Exports in pieces and Percentage of Export value on GDP
2) Establishing the trend of investment in the textile and apparel sector during the
period covered (2004 – 2010). 3) Establishing the impact on other related industries across the value chain during
the period covered.
4) Establishing the socio economic impact on the Textile and Apparel industry of Kenya for exporting under AGOA:-
a. During the period of 2000 – 2004 or before the end of MFA b. During the period 2005 – 2009 or after end of MFA c. Projected impact if AGOA is extended on permanent basis (Over 15 Yrs) with LDC
and without LDC status d. Projected impact if AGOA is extended on short term basis (Under 5 Yrs) e. Projected if AGOA is not extended
5) Detailing any incentives offered by the Government to the Textile and Apparel
sector, if any. Include both direct incentives (cash) and indirect (e.g. subsidy on power or wages).
6) Providing the view of the country and its impact on the industry if enacted, on
direct and indirect employment; on investment and the on backward linkages. 7) Submitting the study report with the following format:
- Executive summary - Statistics of the country - Consultants report on the Country pertaining to points 1 to 7 - Conclusion - References
1.2. Methodology and Approach
Since there has been substantial research carried out in the cotton and textile industry including impact of AGOA on Kenya’s economy, the principle methodology of carrying out the assignment shall be that of literature review. Since the assignment is mainly to evaluate the impact of AGOA since 2000 to present use of cross-country and time series data on GDP, exports and imports, and employment among others has been employed. This has further been complemented by comparative analysis, internet searches and
7
limited interviews with key stakeholders from the public and private sector organizations representing the value chain to validate findings.
1.3. Limitations of the Study
The report has provided an analytical discussion of the impact of AGOA and the phasing out of MFA on the Kenyan economy but data limitations, have however not allowed a detailed quantitative assessment of this impact particular in the cotton, textile and apparel value chain. The institutions contacted, all of whom did not have comprehensive data on textile and apparel included Ministry of Trade, Ministry of Industry. Annex….gives a listing of spinning factories, weaving or knitting, garment factories. However, information on capacity utilization among others could not be accessed for comprehensive analysis.

2.0. OVERVIEW OF THE COTTON TEXTILE AND APPAREL (CTA) INDUSTRY AND POLICY INCENTIVES OFFERED BY THE GOVERNMENT
Kenya’s development agenda since independence has principally been driven by market based policies in which the private sector plays a relative key role in resource allocation. The market policies were boosted by SAPs of the 80s and the major liberalization and privatization reforms of the 90s. The market policies have further benefited from the enhanced liberalization under WTO and regional integration. Towards this end export led growth remains a key strategy for enhancing growth, employment generation and poverty reduction while integrating Kenya into the global economy.
2.1. Overview Of Cotton, Textile And Apparel (CTA) Industry
In general the manufacturing sector makes an important contribution to the Kenyan economy and currently employs 254,000 people, which represents 13 per cent of total employment. The sector is divided into several broad sub-sectors with the top three manufacturing sub sectorsi accounting for 50 per cent of the sector GDP, 50 per cent of exports, and 60 per cent of formal employment. Nearly 50 per cent of manufacturing firms in Kenya employ 50 workers or less. The sector’s current contribution to GDP is 10 per cent and recorded a growth of 6.9 per cent in value addition, and is expected to register a growth of 10 by selling to per cent that is driven by local, regional and global markets. Despite a long tradition of manufacturing in Kenya there has however been a continued decline in investment and the overall lack of competitiveness have made it difficult for the sector to play a larger role in the economy. As a result, many manufacturing companies in Kenya have struggled to thrive and some key players have moved their operations to other countries. The cotton-to-garments supply chain can be divided into four major sectors and a number of sub sectors. The principal sectors are smallholder cotton farmers, ginners, textile and spinners, and garment and apparel manufacturers. The textile and apparel firms in the country produce a large variety of products. For instance the Spinning firms produce yarn (including industrial) and sewing thread while integrated mills produce a wide variety of products including yarn, fabrics (knitted and woven), canvas, school and traveling bags, blankets, sweaters, shawls, uniforms, towels, baby nappies and knitted garments. Garment manufacturers on the other hand, produce various types of men’s’ wears or garments both for the local market and for export. Other products include woven chemise and robes, pants, Kaunda suits (for men), knitted and woven garments. The textile and apparel industry has made a sizeable contribution to income generation in rural areas by providing a market for cotton growing.

9
In addition to its close touch with the rural farmers, it has linkages with the textile processing and manufacturing industry, manufacturers of soaps and detergents, animal feeds, chemicals, fats and oils. These direct linkages with the textile and apparel processing and manufacturing firms are particularly important for the exploitation of the market opportunities presented by AGOA.
Table 2.1: Summary Overview of Cotton, Textile and Apparel sector, 2004-2010 Description Dec-04 Dec-05 Dec-06 Dec-07 Dec-08 Dec-09 Mar-10
Number of factories : Spinning Mills Capacity Utilization %
1 1
….. ….. …. …. …. …. ….
Number of Weaving or Knitting mills Capacity Utilization %
…. …. …. …. ….. ….. ….
…. …. ….. …. ….. …… …..
Number of Garment factories Capacity Utilization %
36 25 25 22 28 26 20
…. …. …. …. …. …. ….
Direct number of Employees 37,000 42,000 37,000 35,000 31,000 31,000 ….
Indirect number of Employees
Cotton Lint production in bales 23,000 51,000 45,000 27,000 27,000 21,000
*Cat _____ : Value of exports (USD) Pieces of exports
56.3 56.0 46.3 59.6 67.9 58.1 …..
Total value of Exports (USD) Total Exports in pieces
Percentage of Export value on GDP
Source: EPZ Performance Report, 2009; Cotton Development Authority, 2010
* Include export data for all the categories of Textile and Apparel exported by the respective country (Value in USD and Total pieces)
2.2. Government Policy Incentives For Cotton, Textile And Apparel Industry
Like many governments in the region, Kenya has undertaken reforms to provide a competitive business and investment environment. For instance to quicken and simplify the process of starting a new business in order to remain competitive in attraction and retention of investment, a one-stop –shop (OSS), expanding the range of incentives to cover a wider spectrum of the business community, strengthening the regulatory environment, enhancing private sector involvement in policy formulation and implementation; and enhancing investments in infrastructure have been undertaken.

10
The political reforms ushered in by the new constitution are business friendly with regard to guarantee of title, governance and right of investments As regards incentives targeting the cotton, textile and apparel sector, majority of the textile firms are located in EPZ designated areas. However, with entry of AGOA in 2000, a number of textile industries were located outside EPZs but continued to enjoy the same status as those firms located in EPZs. Besides the fiscal benefits due to tax exemptions and income tax waivers, the textile firms operating within the framework of EPZ also enjoy one stop approvals and fast tracking of customs clearance. The government policy incentives for cotton, textile and apparel industry include:
2.2.1. Establishment of Export Processing Zones (EPZ)
Kenya inaugurated Export Processing Zones (EPZ) program in 1990 as part of the Export Development Program (EDP) undertaken by the Government to transform the economy from import substitution to a path of export led growth. The following are the incentives enjoyed by the EPZ investors:
(i) Fiscal incentives
10 year corporate income tax holiday and a 25% tax rate for a further 10 years
thereafter;
10 year Withholding Tax holiday on remittance of dividends;
Duty and VAT exemption on raw materials, machinery and other inputs;
Stamp duty exemption;
100% investment deduction over 20 years on initial investment.
(ii) Physical Infrastructure Benefits
Ready factory buildings for rent or purchase
Serviced land for construction of buildings
Office premises
Water, sewerage and electricity supply
Landscaping, garbage disposal, street cleaning services
Illuminated perimeter fence and 24-hour security
Accessible Customs offices
2.2.2. Duty drawback
The EA Customs Management Act provides for drawback of import duty on goods imported for the manufacture of goods which are to be exported transferred to a free port; and transferred to an Export Processing Zone.

11
2.2.3. Manufacture under Bond (MUB)
This facility was introduced in 1986 as an export drive policy measure. It aims at promoting industrial production for the export market. The facility allows manufacturers to import plant, machinery, equipment and raw materials tax free, for exclusive use in the manufacture of goods for export. Specific incentives include exemption from customs/excise duty and VAT on imported plant, machinery, equipment, raw materials and other imported inputs; and 100 percent investment allowance on plant, machinery, equipment and buildings.
2.2.4. Tax Remission for Exports Office (TREO) Scheme
The TREO scheme aims at encouraging local manufacturers to export their products by remitting duty and VAT on raw materials used in the manufacture of goods for export. It also provides for tax remission on inputs to make goods defined as essential for the domestic market. The TREO encourages manufacturers to produce for the export market by granting remission of import duty on inputs; exemption of IDF fees on inputs except for payment of processing fee of Kshs. 5,000; remission of VAT on inputs; and remission of excise duty on fuel oil and kerosene.
2.2.5. Strategic Position and Modernization of Port of Mombasa
The port of Mombasa is the gateway for Kenya and hinterland countries of the region with the rest of the world. Continued investments and modernization of the port has made it possible to increase the throughput of the port. In this regard the private sector has benefitted from increased capacity. Another added advantage is the move to transact most businesses online.
2.2.6. Linkage with International Shipping Lines
Mombasa as hub of marine transportation has created connectivity through international shipping lines. Both local and foreign investors and business people are able to transact business on line.
2.2.7. Global and Regional Connectivity
Kenya is linked to the region and the rest of the work through efficient air and road transport. There are over 40 flights per week into/out of Nairobi to Europe, another 25 flights per week to Asia. Further, connectivity within Africa and a number of continental airlines makes accessibility much easier. Road network is also elaborate, though much more needs to be done to improve the quality of roads.

3.0. IMPACT OF AGOA ON KENYA’S COTTON, TEXTILE AND APPAREL INDUSTRY
The impact of AGOA on textile and apparel industry may be segregated into two distinct periods that is from 2000 to 2004 and from 2005 to 2009 after the expiry of the MFA. The impact can be broadly assessed in the economic parameters such as the trend of investment growth or decline; number of enterprises and employees in the sector; production levels; international trade (exports and imports); contribution to the GDP (textile and apparel exports to total exports); the on other related industries in the supply chain (backward linkages).
3.1. Impact Of AGOA on Kenya During the Period 2000 - 2004 and 2005 - 2009
3.1.1. Investments
As can be seen from Table 3.1, it is apparent that the confidence generated from AGOA attracted more investors to relocate to Kenya from 2000 to 2003 with a steady flow of investment from Kshs1.2 billion to about Kshs 8.6 billion. The growth trend in terms of investment seem to have stagnated from 2005 and value of investment decreased from 8.6 billion in 2003 to Kshs 7.6 billion in 2008, an average annual decline of 3.04%. Table 3.1: Trends of Investment in Textile and Apparel Industry in Kenya, 2000-2009
Source: EPZA Annual Reports of 2003, 2008 & KAM Policy Brief Vol.3 No.1.
Due to the AGOA benefits, foreign investors came into the country particularly under the Export Processing Zone (EPZ) program to manufacture apparel for export to the US market. The AGOA initiative revitalized the textiles and apparel industry, which led to a substantial growth in investment and exports of apparel to the USA from Kshs 1.2 billion (investment) and 2.3billion (exports) in the year 2000 to Kshs 9.7 billion (investment and Kshs 17.6 billion (exports) in 2004.
YEAR No. of Factories/Firms
No. of Employees
Quantity Exported (pieces)
Export Value (US$)
Average Unit price (in US $)
No. of Visas Issued
Investment Ksh (Billions)
Imports (Kshs Millions)
2000 10 10,000 6,050,000 30,000,000 …. ….. 1.2 …..-
2001 17 16,000 14,548,266 70,095,508 4.82 1,060 3.74 ……-
2002 25 26,000 28,615,384 119,907,104 4.19 1,986 6.90 5,699
2003 40 37,000 41,463,230 178,384,135 4.30 2,980 8.595 7,121
2004 36 36,600 61,312,309 261,014,329 4.26 4,185 9.710 10,012
2005 25 34,000 59,958,104 263,109,630 4.39 3,337 9.977 8,592
2006 25 32,000 61,730,934 272,435,816 4.41 3,431 10.317 7,674
2007 22 29,000 63,322,416 241,630,196 3.82 2,720 8.314 8,439
2008 28 26,000 66,919,400 232,217,560 3.47 2,830 7.578 9,146
2009* 26 20,000* 19,607,260 194,641,000 3.08 755 …. …..-
* Data available up to end of April, 2009; …….Data not accessed
** Estimates

13
According to the available statistics (Tables 3.1 & 3.2), there was a steep rise in the level of employment with enactment of AGOA. In 2000 there were 10,000 direct jobs in the textile sector alone. This rose with the enactment of AGOA to form about 16,000 in 2001, over 37,000 in 2004. Since these were only direct jobs, more jobs were definitely created with the multiplier effect in areas like cotton fields, ginneries, suppliers of seeds and other farm inputs and other textile raw material suppliers.
Table 3.2: Trends of Investment in Textile and Apparel Industry in Kenya, 2000-2010 Year No of firms % growth of firms Value of Exports, US$ Employment
2000 10 30,000,000 10,000
2001 17 70% 70,095,508 16,000
2002 25 47% 119,907,104 26,000
2003 40 60% 178,384,135 37,000
2004 36 - 10% 261,014,329 36,600 2005 25 - 31% 263,109,630 34,000
2006 25 0% 272,435,816 32,000
2007 22 -12% 241,630,196 29,000
2008 28 27% 232,217,560 26,000
2009 26 -7.14 194,641,000 20,000*
Source: EPZA Annual Reports of 2003 &, 2008 and 2010 KAM Policy Brief Vol. 3 No. 1
To build capacity in the cotton spinning sector investments had to be undertaken. Even though spinning projects are highly capital-intensive, investment in spinning was bound to increase under AGOA. Investments in other textile sectors such as the weaving of fabrics and dyeing of yarn; and investment in the garment sector among others were undertaken. The absence of supporting data not withstanding, it is expected that the setting up of the spinning units led to a temporary boom in the construction sector. As such, some temporary jobs were created in the construction sector. AGOA thus brought a temporary boom in the construction sector as the spinning projects were put in place. In Kenya cotton is mainly grown by small-scale farmers in the marginal and arid areas, on small land holdings averaging about 1 hectare. It is estimated that Kenya has over 140, 000 small-scale cotton farmers compared with over 200,000 in the mid-1980s when the industry was at its peak. The investment in growing of cotton or the general situation has not however been lucrative enough, due to a number of impeding factors. The Cotton Board of Kenya estimates that countrywide, 350,000 hectares is suitable for rain-fed cotton production with the potential to produce about 260,000 bales of lint annually, and 34,500 hectares for irrigated cotton with the potential to produce 108,000 bales of lint annually. However, only about 25,000 hectares is currently under the crop, and the total annual lint production stands at only about 20,000 bales. The total investment in the textile sector in Kenya as of December 2003 was Kshs. 9.7 billion. Most of the large investments were in the EPZ from foreign investors with a few local investors under the MUB scheme.

14
3.1.2. Number of Enterprises
From table 3.2, the number of firms in textile and apparel manufacture increased from 10 in 2000 to 17 in 2001, an increment of 70% with a subsequent increment in terms of value of investment from Ksh.1.2 billion to Kshs 3.8 billion that is approximately US$ 15 million to US$ 47 million) another significant increment of 214%. The improved performance of the textile and apparel industry was mainly attributed to the market opportunities made available through AGOA. It can be seen that the number of firms investing in the sector declined 2003 and 2007. This can be seen as a signal that firms were aware of the end of MFA and did not possibly see the rationale of continued investing in Kenya.
As can be seen from table 3.2, the number of textile enterprises in Kenya rose from 10
in 2000 to 40 in 2003 and decreased to 36 in 2004 and 19 enterprises in 2008 on the
phasing out of the MFA. Between 2000 and 2008 the number of firms increased by
180% but with instances of decline and stagnations as earlier pointed out.
3.1.3. Number of employees
Direct employment rose from 10,000 in 2000 to 36,600 in 2004. It is expected that more than twice as many employees benefited from the textile value chain as well as complementary services like transportation, banking, etc Currently there are about 40,000 farmers growing cotton in the country; 12 operational ginneries which are however operating at only 35% of their full capacity. Statistics in Table 5.2 show that the textile and apparel sector immensely contributed in creating employment opportunities rising from about 10,000 people in 2000 to almost four times in 2004 with more than 36,600 employees. This trend however changed downward with more than 16,000 people loosing their jobs in 2009. As at 2010 there were about 20,000 people employed by the sector. The severity of the loss of the jobs in the textile sector is underpinned by the fact that the majority of those employed in the garment manufacture are women in child bearing age and with no other skills to secure alternative employment. With 8.9% decline in investment between 2007 and 2008, local employment contracted by 9.6 % to stand at 25,766 persons in 2008 from 28,506 persons in the 2007. Sadder still is the fact that those losing jobs are women with no other alternative sources of employment and income. This is against the spirit or governments’ ambition to create 500,000 jobs annually. Instead the sector with the greatest potential to generate jobs is the one losing jobs. In spite of the fact that the Kenya Textiles and Apparels Sector has had great potential to spur economic growth, the textile sector has been declining over the years from a

15
high of 40 firms in 2003 to only 26 recorded in January, 20101. The available statistics (Tables 5.2.) indicates that between 2008 and 2009 Kenya’s Textile and apparels exports to the US under AGOA and GSP continued to decline by about 24% ($232 million in 2008 $195 million in 2009). The persistent declining trend is indeed worrying with January to June, 2010 compared to the same period (January-June, 2009) having recorded a 24%. Without appropriate mitigation measures, it is apparent that the textile-apparel sector performance shall be worse in 2010 and subsequent years. The decline has been attributed to the un-competitiveness of the sector due to high production costs including cost of electricity. Taking into that AGOA does not apply solely to the cotton, textile and apparel sector, new employment opportunities emerged in the light engineering sectors such as jewelers, honey production and the like among other eligible products.
3.1.4. Production and Manufacturing
Out of the 24 registered ginneries, some of which have been leased to the private sector only about 10 ginneries are working currently. Some of the ginneries like Hola ginnery ceased operation as a result of the collapse of the Hola Irrigation scheme, after River Tana which was supplying water changed course and left the pumps dry. Some of the major ginneries that are privately owned include Kibos & Nyanza Ginneries in Nyanza Province and Tharaka Ginnery in Eastern Province. Ginneries are a focal point in the cotton industry, and their location, efficiency and organization are critical to it. There are 24 ginneries in the country with an installed capacity of approximately 140,000 bales annually. But the utilized capacity is a meager 20,000 bales (about 14%), meaning that if the cotton production capacity were increased by 400% the ginneries would still be able to handle the production. Prior to the decline of the textile industry in the early 1990s, there were 52 textile mills devoted to fabric and yarn production and over 110 large-scale garment manufacturers registered with the Registrar of Industries. The mills had an installed combined capacity of 115.0 million square meters of fabric whilst the garment manufacturing sector had a combined installed capacity to process fabric into garments equivalent to 85% of the total national demand i.e. (141.3 million square meters). It is estimated that the total annual fabric requirement is at least 225.0 million square meters.
1 See Annex 3 in which out of 99 EPZ operating enterprises by January, 2010, 26 were Garment
Manufacturers.

16
As regard garment and apparel manufacturers, it is estimated that there are 170 large
scale and 74,576 small and micro garment/apparel manufacturers operating in Kenya
today. Of these 37 are exports oriented and generate a bulk of the revenue for the
country.
Table 3.3 indicates textile and clothing export manufacture had a modest growth from Kshs1, 963,421,000 in 2002 to Kshs 3,187,830,000 in 2006, an increase of 62.4%. Compared to other export manufactures such as leather and cement, this was a modest growth. Percentage share of textile exporters in total manufacture decreased during 2002 – 2003 and then improved between 2004 and 2005 to about 6% and 7% respectively. In 2006 share of textile and clothing exports to the total manufactures declined to about 4%. Table: 3.3 Kenya’s Export of Manufactured products 2002 -2006 (Kshs 000)
Source: Annual Trade Reports – Customs & Excise Department, KNBS, Government of Kenya
3.1.5. Exports and Import Performance
Kenya was the first African country to be accredited as an AGOA beneficiary in the sub- Saharan African region. The enactment of AGOA opened up an opportunity for growth and revival of the textile and apparel industry in Kenya. Bilateral trade between Kenya and USA expanded substantially with enactment of AGOA (table 3.4). Table 3.4: Kenya’s Export Performance, 2000 – 2009 (Kshs Million) Year EAC COMESA Rest of Africa Total Africa Europe Asia, ME America Total Exports
2000 35,278 45,889 4,338 61,934 41,804 6,583 3,589 199,415
2001 43,551 54,188 4,391 72,513 42,498 8,937 4,257 230,335
2002 45,461 59,098 9,806 83,085 49,478 7,065 4,107 258,100
2003 45,256 61,769 8,296 84,653 56,579 6,604 3,880 267,037
2004 54,980 74,794 9,139 101,853 60,933 7,465 6,066 315,230 2005 73,630 90,026 11,271 120,790 66,451 9,016 13,259 384,443
2006 53,050 75,436 14,582 108,309 71,415 9,714 21,487 353,993
2007 64,122 86,838 14,865 124,029 79,277 13,734 20,520 403,385
2008 83,942 111,395 21,921 162,541 98,513 15,932 22,054 516,298
2009 90,460 113,093 19,552 162,732 100,321 19,300 18,890 524,348
Source: Annual Trade Reports – Customs & Excise Department, KNBS, Government of Kenya
INDUSTRY 2002 2003 2004 2005 2006 % growth Textiles & clothing 1,963,421 1,777,163 3,041,351 3,037,438 3,187,830 62.4
Leather 601,427 1,017,625 1,114,820 1,604,102 1,971,434 227.8
Cement 1,478,811 1,976,566 1,959,406 2,858,305 3,848,869 160.3
Paper and Paper products 2,074,829 2,316,863 2,855,343 3,072,829 3,134,217 51.1
Footwear 1,548,511 1,457,133 1,790,671 1,951,805 2,278,715 47.1
Total manufactured 34,930,085 38,299,808 49,417,428 45,160,484 81,261,669 112
Share of textile exporters in manufactures (%) 5.62 4.64 6.15 6.73 3.92

17
Figure 3.1: Kenya’s Exports by destination, 2000-2009
Kenya's Export by Destination 2000 - 2009
0
100,000
200,000
300,000
400,000
500,000
600,000
2000 2001 2002 2003 2004 2005 2006 2007 2008 2009
YEAR
Ksh
s in
Millio
n
EAC COMESA Rest of Africa Total Africa Europe Asia, ME America Total Exports
3.1.6. Trade Performance
According to data compiled by UN COMPTRADE for the period 2006 and 2008, Kenya’s
top export products were tea, cut flowers and flower buds and petroleum oils, which
accounted respectively for 18.6, 8.9 and 3.5 percent of exported goods in 2008. EAC
(49%) and COMESA (12%) remain the preferred export destination for the manufactures
while Europe is the export destination for the bulk of the commodity products (table 3.4
and graph 3.1). Exports to the USA are predominantly textiles and apparel.
Graph 3.1: Exports of Kenya’s Major Manufacturing Sectors 2002 -2006
Kenya's Major Manufacturing Sectors 2002 -2006
-
500,000
1,000,000
1,500,000
2,000,000
2,500,000
3,000,000
3,500,000
4,000,000
4,500,000
2002 2003 2004 2005 2006Year
Ksh
s ('
000)
Textiles & clothing Leather Cement Paper and Paper products Footwear
Source: Economic Survey (Various)

18
AGOA preferences created market access for Kenyan textiles rising from US$ 30 million in 2000 to US$ 261 million in 2004. Foreign buyers getting their supplies at competitive prices from Kenya were able to place orders during the period 2000-2008 in which AGOA was assured to remain operation. Concurrently, competitiveness was also enhanced with unit cost declining from US$ 4.82 in 2001 to 4.26. The enactment of AGOA meant that the American market opened up to Kenyan exports thereby giving market access to one of the leading markets of the world. Trade between Kenya and USA picked up with the entry of AGOA in 2000 (table 3.4). Trade balance however remained in favour of USA (table 3.5). From the export statistics it is apparent that immediately after the expiry of the MFA in 2005, Kenya export to the USA continued to rise up to 2009 when there was a decline of about 14% (see tables 3.4 and 3.5). The impact on Kenyan economy was more pronounced since the bulk of the Kenyan exports to the USA were predominantly textiles. Table3.5: Bilateral Trade Profile Between Kenya and USA: 2000 -2009 (Kshs Million)
Source: Annual Trade Reports – Customs & Excise Department, KNBS, Government of Kenya
From the region and based on the data provided, all the sub-Saharan African countries that export textiles to the US under AGOA, the 6 main beneficiaries listed in table 3.6, in which Kenya is included, constitute about 89% share of exports by volume and 91% by value. All these countries experienced declined in export trade with the expiry of MFA as illustrated in table 3.6 and graph 3.3. While other SSA countries like Lesotho, Mauritius, Swaziland and Uganda saw their exports declining by as much as 10.7%, 15.1%, 11.2%, and 37.6% respectively (table 3.6), Kenyan exports registered a huge decline of 25.4% from US$ 232,218,000 in 2008 to stand at US$ 194,641,000 in 2009. The EPZ garment exports were US$ 261,014,000 (table 3.5 and graph 3.2) in 2004, constituting 89.4% of the national exports while during 2007 it constituted 80% confirming the decline of textile export performance that came along with MFA expiry. Available statistics indicate that the performance of Kenya
2000 2001 2002 2003 2004 2005 2006 2007 2008
EXPORTS TO U.S.A 3,589 4,257 4,107 3,880 6,066 13,259 21,487 20,520 22,054
IMPORTS FROM U.S.A. 10,084 38,967 14,648 14,388 14,425 42,558 24,731 44,523 27,549
TRADE BALANCE (6,495) (34,710) (10,541) (10,508) (8,359) (30,505) (3,244) (24,003) (5,495)
2000 2001 2002 2003 2004 2005 2006 2007 2008
EXPORTS TO U.S.A 3,589 4,257 4,107 3,880 6,066 13,259 21,487 20,520 22,054
IMPORTS FROM U.S.A. 10,084 38,967 14,648 14,388 14,425 42,558 24,731 44,523 27,549
TRADE BALANCE (6,495) (34,710) (10,541) (10,508) (8,359) (30,505) (3,244) (24,003) (5,495)

19
garments exports reached its peak in the year 2006 of US$ 272, 436,000 and since then, it has been on a downward trend. Table 3.6: Exports to US under AGOA / GSP provisions for selected Africa AGOA eligible countries 2004– 2009 (US $ ‘000) Country 2004 2005 2006 2007 2008 2009 % Growth – 2004 to 2009
Lesotho 447,803 388,584 384,591 379,617 338,940 -10.7
Madagascar 316,817 275,466 231,611 283,807 279,293 -1.6
Kenya 261,014 263,110 272,436 241,630 232,218 194,641 - 25.4
Mauritius 160,468 152,591 157,502 119,906 101,742 -15.1
Swaziland 176,853 176,117 149,815 141,410 125,566 -11.2
Ethiopia 9,354 7,034 11,098 12,622 14,526
South Africa 114,700 61,700 41,800 21,500 15,900
Source: www.agoa.info/index.php, EPZA, and KAM
Graph 3.2: Kenya Textile Exports to US under AGOA / GSP Provisions, 2004–2008 (US $ ‘000)
Kenya and Other Selected AGOA Countries - Textile Exports to US Under AGOA/GSP
Provision: 2004 - 2008
0
100,000
200,000
300,000
400,000
500,000
2004 2005 2006 2007 2008
YEAR
Va
lue
of
Ex
po
rts
US
$ '0
00
'
Lesotho Madagascar KenyaMauritius Swaziland South Africa
Kenya’s overall textile export performance from 2007 was characterized by downward trend and given that over 90% of the production is destined for the American market. Part of the decline can be explained by the impact of the 2008 global finance crisis and resultant recession which cut down Kenya’s exports by more than 50%. This meant that some firms had to undergo restructuring in order to remain afloat, while others had to scale down their operations substantially. Kenya like other SSA countries faced stiffer competition with the liberalization of the global textile market with expiry of MFA in 2005. In particular, China and other Asian LDC countries with more efficient and competitive textile sectors have continued to displace the SSA from the American market.

20
3.1.7. Intra-regional Trade and Transport
It is also expected that AGOA increased Kenya’s intra-regional and international trade. More trade has taken place between Kenya and its Sub Saharan African nations, particularly the COMESA members that have benefited from AGOA. Greater trade implies greater need for transportation and storage. The port of Mombasa has facilitated increased flow of goods with the shipping companies and flights also benefiting from AGOA.
3.1.8. Contribution to GDP – Textile Exports as a % of total Exports
Tracing Kenya’s economic growth prior to Kenya’s accreditation to AGOA in 2000 and post AGOA accreditation up to June, 2010, it is evident that the economy registered mixed performance. In the period immediately prior to AGOA, the economy registered low growth rates of 0.3% in 1997 to 0.5% in 2000. In 2001, immediately after accreditation to AGOA, the economy recorded an impressive growth of 4.5 % (table 3.7 and graph 3.3). Table 3.7: Kenya’s Real GDP Growth Rates and Per capita Income: 2000 – 2010
2000 2001 2002 2003 2004 2005 2006 2007 2008 2009 2010 (est)
Real GDP % 0.5 4.5 0.6 3 5.1 5.9 6.3 7.0 1.6 2.6 3.5
Per capita income (Kshs) 33,283 33,735 32,907 31,925 33,180 33,442 34,570 36,000 35,553 35,461 ………
Source: Economic Survey (Various editions)
The observed improvement may not be solely associated with AGOA as the growth declined to 0.6% in 2002, apparently due to the uncertainties of the general election which led to lower demand for imports and credit; among others. Nevertheless, strong growth in horticulture, EPZ related textile exports and the expanded market from COMESA region in subsequent years contributed to overall good economic growth and the substantial increases in total exports. The 7.1% growth rate in 2007 is the highest that the Kenyan economy has registered since 2000. Graph 3.3: Kenya’s Real GDP Growth Rates: 2000 -2010
Kenya's Trend of Real GDP Growth i % 2000 - 2010
0
2
4
6
8
2000 2001 2002 2003 2004 2005 2006 2007 2008 2009 2010
YEAR
% G
row
th in
Real G
DP
Real GDP %
21
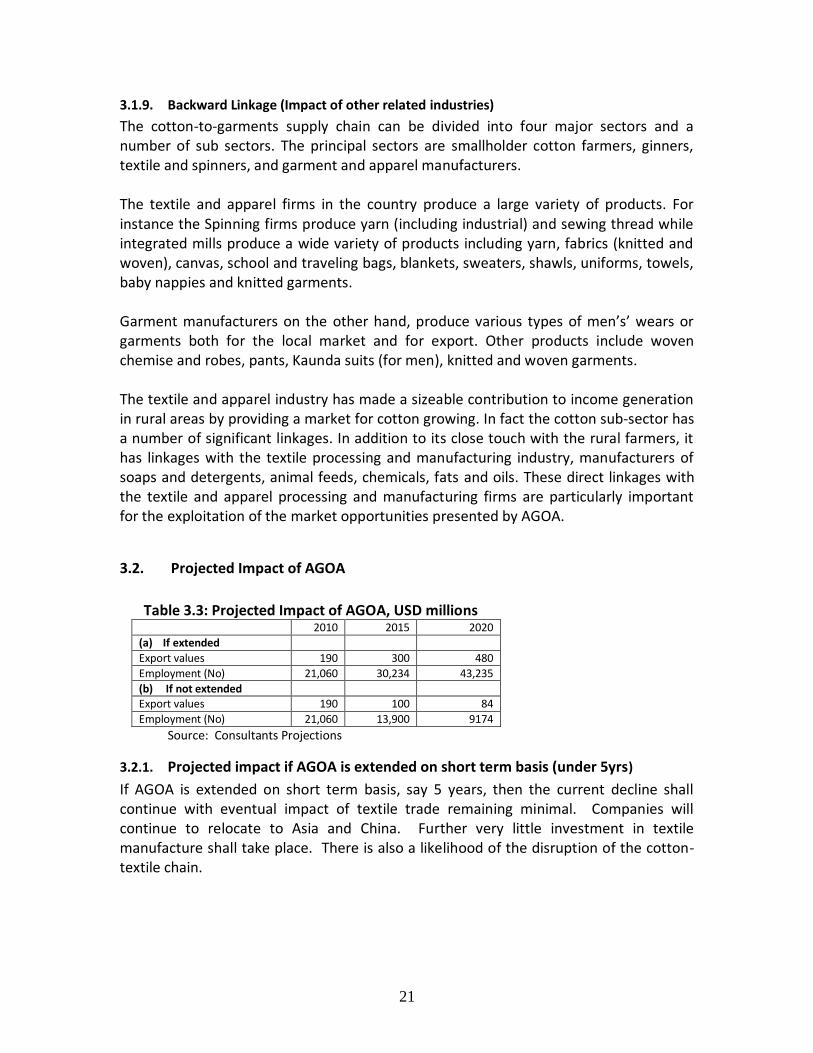
3.1.9. Backward Linkage (Impact of other related industries)
The cotton-to-garments supply chain can be divided into four major sectors and a number of sub sectors. The principal sectors are smallholder cotton farmers, ginners, textile and spinners, and garment and apparel manufacturers. The textile and apparel firms in the country produce a large variety of products. For instance the Spinning firms produce yarn (including industrial) and sewing thread while integrated mills produce a wide variety of products including yarn, fabrics (knitted and woven), canvas, school and traveling bags, blankets, sweaters, shawls, uniforms, towels, baby nappies and knitted garments. Garment manufacturers on the other hand, produce various types of men’s’ wears or garments both for the local market and for export. Other products include woven chemise and robes, pants, Kaunda suits (for men), knitted and woven garments. The textile and apparel industry has made a sizeable contribution to income generation in rural areas by providing a market for cotton growing. In fact the cotton sub-sector has a number of significant linkages. In addition to its close touch with the rural farmers, it has linkages with the textile processing and manufacturing industry, manufacturers of soaps and detergents, animal feeds, chemicals, fats and oils. These direct linkages with the textile and apparel processing and manufacturing firms are particularly important for the exploitation of the market opportunities presented by AGOA.
3.2. Projected Impact of AGOA
Table 3.3: Projected Impact of AGOA, USD millions
2010 2015 2020
(a) If extended
Export values 190 300 480
Employment (No) 21,060 30,234 43,235
(b) If not extended Export values 190 100 84
Employment (No) 21,060 13,900 9174
Source: Consultants Projections
3.2.1. Projected impact if AGOA is extended on short term basis (under 5yrs)
If AGOA is extended on short term basis, say 5 years, then the current decline shall continue with eventual impact of textile trade remaining minimal. Companies will continue to relocate to Asia and China. Further very little investment in textile manufacture shall take place. There is also a likelihood of the disruption of the cotton-textile chain.

22
3.2.2. Projected impact if AGOA is not extended
In the event that AGOA is not extended, textile and apparel contribution to the manufacturing sector in Kenya is set to be compromised, yet the manufacturing sector is expected to play a critical role in propelling the economy to a 10 per cent growth rate. According to the aspirations of Vision 2030, the manufacturing sector is expected to support the country’s social development agenda through the creation of jobs, the generation of foreign exchange, and by attracting foreign direct investment (FDI).
3.2.3. Projected Impact of AGOA on sourcing of raw materials
The apparel sector has been importing nearly all its requirements for garment manufacture since the local textile manufacturers are yet to produce the right fabrics in right quantities. The garment manufacturers have continued to benefit from the 3rd country provisions. Nearly all fabrics and accessories come from China and Asian countries currently, the same countries are the ones giving SSA countries stiff competition with expiry of the MFA. At present Kenya imports 30 million Sq metres of denim per year for use in the textile industry. This quantity is adequate to start a factory in the country whose multiplier effects will assist in the sustainability of the cotton-textile and apparel sectors.

23
4.0 CONCLUSION Based on the foregoing analysis, it can be seen that the advent of AGOA and the phasing out of the MFA have far reaching ramifications for the Kenyan economy. Save for lack of some reliable data, the impact of AGOA on textile and apparel industry has been disintegrated into the production and growing of cotton, manufacturing and ginning; yarn and thread production; fabric manufacture; and apparel manufacture. The study has observed a decline in the trend of investment as reflected in number of enterprises and employees in the sector; production levels; dwindling performance in the international trade particularly slow growth in exports and the continued rise in imports, have led to unfavorable balance of trade between Kenya and USA; dismal contribution to the GDP by the textile and apparel exports); and the weak backward and forward linkages with other related industries in the supply chain call for appropriate remedial measures. It has therefore been observed that Kenya has lost out under MFA, but it can make up for some of the losses via the extension of AGOA. The continued overall effect on the economy will however depend on which of the two counteracting forces is greater. To mitigate any serious adverse consequences emanating from the phasing out of the MFA, it is imperative that Kenya harnesses the benefits accrued under AGOA. For this to happen, the vertical integration process in the textile and clothing industry must be sped up and one strategy is by enhancing the incentives that the government has for the sector. Otherwise, the viability of the EPZA sector, more so the textile and clothing industry, might be seriously jeopardized. It is in view of the above that lobbying the US Congress by the ACTIF to consider extending the period of AGOA and AGOA IV beyond 2015 to promote Kenya’s cotton, textile and apparel sector as originally intended; extending the period of the “third country fabric” provision; and deferring/postponing the introduction of DFQF status to Asian LDCs so that it does not undermine the original purpose of AGOA and AGOA IV should be pursued in earnest. It is indeed hoped that ACTIF would succeed in bringing the disparate needs of the cotton, textile and apparel sectors of its Members into a cohesive and consensus driven positions at the regional and international trade and development forums. From the analysis, ACTIF should enhance dedication to the identified concerns of the industry (reduction in the levels of investment, employment opportunities, dwindling export of textile, stiff competition from well placed Asian countries and promoting the improvement of competitiveness in both the regional and global market place among others. Lack of certain pertinent data (as pointed out in the limitation of the study) we wish to confirm that failure to guarantee AGOA extension shall negate the intention of AGOA

24
to alleviate poverty via “Trade not Aid”; inadvertently remove the motivation to build a Kenyan Fiber, textile and apparel value chain; discourage new investments and reverse the development of apparel manufacturing capacity of Kenya that has resulted from AGOA since 2000; and that it would create unfair competition if DFQF status is extended to Asian LDCs among others.

25
i Food processing, beverages and tobacco; refined petroleum products; and textiles, apparel, leather and footwear
Annex 1: References:
Moses M Ikiara & Lydia K Ndirangu of KIPPRA (Jan 2003), Developing a Revival
Strategy for Kenya’s Cotton-Textile Industry: A Value Chain Approach
Moses M Ikiara & Lydia K Ndirangu of KIPPRA (Jan 2003), Prospects of Kenya’s
Clothing Exports under AGOA after 2004
EPZ, Annual Reports of 2003 and 2008
EPZA (July 2002), Kenya Textile Sector Profiles
EPZA, Value Chain Analysis of Selected Strategic Sectors in Kenya
Kenya’s Apparel and Textile Industry, 2005
Quarterly Economic Bulletins (2002 to 2010) – Ministry of Finance
Increasing The Impact Of Trade Expansion On Growth: Lessons From Trade Reforms
For The Kenya National Bureau of Statistics, Kenya Facts and Figures 2009
Jean-Jacques Hallaert, Design Of Aid For Trade - OECD Trade Policy Working Paper
No. 100 By
GOK, Kenya’s Vision 2030 – A Globally Competitive and Prosperous Kenya
UNCTAD, World Investment Report 2010 –Investing in a Low-Carbon Economy
Sub-Saharan Africa: Effects on Infrastructure Conditions on Export Competitiveness,
USITC, Third Annual Report by United State International Trade Commission – April,
2009
EPZ, Performance Report, 2009; Cotton Development Authority, 2010
Annex 2: Contacts Name Organization Contacts
Rajeev Arora ACTIF +254-20-3748411
Joseph Nyagari ACTIF +254-20-3748411
Lina Ochieng Ministry of Trade Department of External Trade
P.O. Box 30430, Nairobi
Robert O. Okoth Ministry of Trade Department of Internal Trade
P.O. Box 30430, Nairobi
Christopher Onyango KIPPRA 0722642997
KIA
Joseph Kosure EPZA P.O. Box 50563 Nairobi 00200
Kenya
Fanuel Lubanga CDA P.O. Box 66271-00800, Westlands, Kenya
Francis Rotich EPZA P.O. Box 50563 Nairobi 00200
Kenya

26
Annex 3: List Firms List of EPZ Garment enterprises
Company Name & Contacts Licensed Activity Status Location /Zone
Alltex EPZ Ltd.,
P. O. Box 30500 -00100 , Nairobi
Tel. +254-45-6622593
Fax. +254-45-6626163
Email: [email protected]
Contact Person: GM:Sudath Perera
MD:Lutaf Kassam & Nadir
Badruddin
Manufacturing
Garments
Operational
Athi River EPZ - Athi
River
Africa Apparel EPZ Ltd.
P. O. Box 1443 - 00100 Nairobi
Tel. +254 - 020- 556134/38
Fax. +254 -020- 556155
Email: [email protected]
Contact person:MD: Suhrit Bharwas
GM: Pankaj Motilal
Manufacturing –
Garments
Operational
Sunflag Runyenjes
Rd, Nairobi
Ashton Apparel EPZ Ltd,
P. O. Box 43371, Mombasa
Tel. +254-41- 434251/434225
Fax. +254-41-435436
Email: [email protected]
Contact Person:MD: Shezaan F Amiji
GM: Deepak Verma
Manufacturing –
Garments
Operational Ashton Apparels EPZ
- Mombasa
Balaji EPZ Ltd.
P.O.Box 1716 – 00621, Village Market Nairobi
Tel. 0733 416 420
Garment Setting up Indigo EPZ - Ruaraka
Celebrity Fashions K. EPZ Ltd.
P. O. Box 116 - 00204 Athi River,
Tel: +254-20- 2511617, 0720 - 078618
Contact person: MD Nikhil Rajan Lal
GM Praveen Nair
Manufacturing –
Hangers/Garments
Operational
Athi River EPZ - Athi
River
Future Garments EPZ Ltd.
P. O. Box 18420-00500, Nairobi
Tel. +254-20- 2508067
Email:[email protected]
Contact Person: MD: MA Guangsheng/ xiaomei
MA
Manufacturing -
Garments
Operational
Athi River EPZ - Athi
River
Hantex Garments EPZ Ltd Manufacturing -
Garments
Setting up Mazeras EPZ -
Mombasa
Kenya Trading EPZ Ltd.
P. O. Box 78788 -00507, Nairobi
Tel. 532040/532050/020 8008836/7
Fax. 020 8008838
Email: [email protected]
Contact person: James Jones
Manufacturing –
Garments
Oparational Sameer Industrial
Park EPZ - Nairobi

27
United Aryan EPZ Ltd.
P.O. Box 126 - 00621 Village Market, Nairobi
Tel. +254-20-8561951/2
Fax. +254-20-8566153
Email: [email protected]
Contact Person:MD Amit Bedi
GM: Mohan Kumar
Manufacturing –
Garments
Oparational Indigo EPZ -
Ruaraka, Nairobi
Global Apparels (K) EPZ Ltd
P. O. Box 322, Athi River
Tel. +254-45-6622575, 6622720 ,6622725
Fax +254-45-6622452
Email: [email protected]
Chairman: Suresh Lakhiani
MD: Narain Shahdadpuri – 0722 846555
GM: Ghanysham Shahdadpuri
Manufacturing –
Garments
Operational
Athi River EPZ - Athi
River
Kapric Apparels EPZ Ltd.
P. O. Box 81579, Mombasa
Tel. +254-41-3432609/432626
Fax. +254-41-3434438
Email. [email protected]
Contact Person: Thomas Puthoor
Manufacturing –
Garments
Operational
Pwani Industrial Park
EPZ – Changamwe,
Mombasa
Kenya Knit Garments EPZ Ltd.
P. O. Box 87789, Mombasa
Tel. +254-41-221230/ 020 350 2282, 0720683046
Fax. +254-41-221188/2221188
Email : [email protected]
Contact Person: chairman: David Lin
MD:Chiu Chuei Hong
Manufacturing –
Garments
Operational
Mazeras EPZ -
Mombasa
New Wide Garments (K) EPZ Ltd
P.O.Box 504 , Athi River
Tel: c/o Protex K EPZ Ltd
Fax:
Email:
Contact Name: Rudolf Isinga
Manufacturing – Knit
Garments
Operational Transfleet – Athi
River Zone
Protex Kenya EPZ Ltd.
P. O. Box 504, Athi River
Tel. +254-45-6622345/6626059
Fax. +254-45-6622344
Email : [email protected]
Contact Person: Rudolf Isinga
Manufacturing –
Garments
Operational
Athi River - Export
Processing Zone -
Athi River, Mavoko
Municipality
Ricardo EPZ International Co. Ltd.
P. O. Box 156 – 00204, Tai River
Tel. +254-45-6622483/4
Email: [email protected]
Contact Person: Chairman: Richard Ndubai
Manufacturing –
Garments
Operational
Athi River EPZ - Athi
River, Mavoko
Municipality
Royal Garments EPZ Ltd
P.O.Box 78894 – 00507, Nairobi
Manufacturing -
Garments
Setting up Sameer Industrial
Park EPZ - Nairobi
Senior Best Garments K. EPZ Ltd.
P. O. Box 93351, Mombasa
Tel. +254-41-433888/9,434504, 3433888/9
Fax. +254-41-434389
Email: [email protected]
Contact Person: Lin Shiuh Sheng
Manufacturing –
Garments
Operational Zois (ii) EPZ –
Mtwapa, Kilifi

28
Shin Ace Garments K. EPZ Ltd.
P. O. Box 87337 -80100, Mombasa
Tel. +254-41-434845/+254-41-3434845 020
2080517/ 0722988889
Fax.
Email: [email protected]
Contact Person:GM Chen Mei Lan
MD: Peter Lee
Manufacturing –
Garments
Operational
Kwa Jomvu EPZ –
Changamwe,
Mombasa
Sino Link EPZ Ltd.
P. O. Box 83218, Mombasa
Tel. - 020 2057661
Fax. 020- 2057661
Email: [email protected]
Contact Person: Y.K. Tung
Manufacturing -
Garments
Operational
King’orani EPZ –
Changamwe,
Mombasa
Wild Life Works EPZ Ltd.
P. O. Box 310 - 80300, Voi
Tel. +254-43-30062/30238 /020 8030575
Fax. +254-43-30062/043 30238
Email: [email protected]
Contact Person: Robert Dodson(GM)/Mike
Korchinsky (MD)Pascal Mutinda
Manufacturing –
Garments
Oparational Wildlife Works EPZ –
Maungu, Voi
EPZ spinning enterprise Rupa Cotton Mills EPZ Ltd. P. O. Box 5050, Eldoret Tel. +254-53-2032644/5 (+254-45-6622799) Fax. +254-53-2062916 (+254-45-6622351) Email: [email protected] Contact Person: Tinu Shah
Manufacturing - Cotton Yarn
Athi River EPZ - Athi River, Mavoko Municipality
List of Ginneries 1. Kitui Ginnery, KITUI
2. Nyanza Ginnery, KISUMU 3. Salawa Ginnery, NAKURU
4. Ndere Ginnery, SIAYA
5. Mwea Ginnery, WANGURU
6. Meru Ginnery, NAIROBI
7. Nambale Farmers”Coop Union Ltd. Ginnery, NAMBALE
8. Malindi Ginnery, MOMBASA
9. Voi Ginnery, VOI
10. Mpeketoni Ginnery, MOMBASA
11. Mluanda Ginnery, VOI