impact of dust pollution on worker’s health in textile ... paper/ee_working_paper-7.pdf · mills,...
TRANSCRIPT

REDUCE
CONSERVE OPTIMIZE
EXPLORE
Department of Environmental Economics Pakistan Institute of Development Economics, Islamabad, Pakistan
Department of Environmental EconomicsWorking Paper No. 7
CORE
Impact of Dust Pollution on Worker’s Health in Textile Industry: A Case
Study of Faisalabad, Pakistan
Nazia MehwishUsman Mustafa

Department of Environmental Economics
Working Paper No. 7
Impact of Dust Pollution on Worker’s Health in Textile Industry: A Case
Study of Faisalabad, Pakistan
Nazia Mehwish Pakistan Institute of Development Economics, Islamabad
and
Usman Mustafa
Pakistan Institute of Development Economics, Islamabad
PAKISTAN INSTITUTE OF DEVELOPMENT ECONOMICS
ISLAMABAD

Note: This working paper is published in continuation of the Working Paper Series published earlier
by Centre for Environmental Economics and Climate Change (CEECC), Pakistan Institute of
Development Economics (PIDE), Islamabad.
All rights reserved. No part of this publication may be reproduced, stored in a retrieval system or
transmitted in any form or by any means electronic, mechanical, photocopying, recording or
otherwise without prior permission of the Publications Division, Pakistan Institute of Development
Economics, P. O. Box 1091, Islamabad 44000.
© Pakistan Institute of Development Economics, 2016.
Pakistan Institute of Development Economics
Islamabad, Pakistan
E-mail: [email protected]
Website: http://www.pide.org.pk
Fax: +92-51-9248065
Designed, composed, and finished at the Publications Division, PIDE.

C O N T E N T S
Page
Abstract v
1. Introduction 1
2. Data Description and Methodology 3
2.1. Description of Study Area 3
2.2. Data Collection and Survey Design 3
2.3. Methodology 5
3. Results and Discussion 8
3.1. Results of Confirmatory Factor Analysis 8
3.2. Results of the Structural Regression Model 10
4. Conclusion and Policy Implications 16
4.1. Conclusion 16
4.2. Policy Implications 17
References 18
List of Tables
Table 2.1. Measurement Model (Confirmatory Factor Analysis) 5
Table 2.2. Structure Regression Model 8
Table 3.1. Results of the Measurement Model (Confirmatory Factor
Analysis) 11
Table 3.2. Results of Structural Regression Model 13
List of Figures
Figure 3.1. Confirmatory Factor Analysis of Respiratory Diseases 9
Figure 3.2. Path Diagram for Estimated Model Cost of Illness/
Structural Regression Model 12

ABSTRACT
The textile industry in Pakistan has largest share in the manufacturing
industry sector. The textile sector is one of the most polluting industrial sectors.
Cotton dust is present in the air during the handling and processing of cotton
which threatens the health of labours working in this industry. This study
estimated the impact of the dust pollution on workers’ health and cost of illness
in the textile industry of the Faisalabad, Pakistan. This was the cross sectional
research conducted among the 200 randomly selected textile workers. Both
health and opportunity cost of textile workers estimated by using the structural
equation model (SEM) with observed and latent variables. This paper used the
confirmatory factor analysis (CFA) to interlink the latent factor diseases with
their indicators symptoms. The results of the SEM model on age, respiratory
diseases, overtime work, duration of employment, use of masks and dust level
are significant. Study finds that 62 percent workers beard the cost of illness and
43 percent workers miss the work last two weeks. The 69 percent workers
reported that due to the illness their work performance in industry is not normal,
they suffered the problems during the work such as muscle aches, asthma,
cough; respiratory allergy etc. It also calculated the prevalence of the respiratory
diseases among the textile workers was high. Result revealed that 35.5 percent
workers had wheezing, 65.5 percent phlegm, 58 percent chest tightness, 72
percent had a throat irritation problems. Paper concluded that there is a high
prevalence of respiratory diseases among the textile workers due to the exposure
of dust pollution and if successfully reduction in dust pollution occurs in textile
industry; the worker will gained the benefits in term of the reduction in medical
cost and gain in terms of wages.
Keywords: Dust Pollution, Health Cost, Opportunity Cost, Respiratory
Diseases and Symptoms, Structural Equation Model (SEM),
Confirmatory Factor Analysis (CFA), Faisalabad, Pakistan

1. INTRODUCTION*
In the world the textile is the second largest industry after the agriculture
[Sangeetha, et al. (2013)]. The textile industry in Pakistan holds the leading role
in the manufacturing industry sector. This sector comprises almost 8.5 percent to
the GDP, provides employment to more than 46 percent of the manufacturing
sector labour force and contribute major share in foreign exchange earnings for
the country. Further, Pakistan is the 8th largest exporter of textile products in
Asia, 4th largest producer of cotton, with the third largest spinning capacity in
Asia after China and India, and contributes 5 percent to the global spinning
capacity. This textile sector has an overwhelming impact on the growth and
development of the Pakistan’s economy [Government of Pakistan (2015)].
The textile sector is one of the most polluting industrial sectors [Banuri
(1998)]. The textile industry is also associated with a number of environmental
problems such as water pollution, soil pollution, noise pollution and air/ dust
pollution. Among the different textile pollution, cotton dust pollution is the most
important in terms of health effects [Camici, et al. (1978); Beck, et al. (1983)].
Cotton dust pollution, lint, and particulates impact the working environment and
affect the workers respiratory system. The dust level or quantity small particles
of cotton lint infiltrate in to the respiratory system of the human beings and
cause the respiratory diseases and symptoms among the workers. These
respiratory diseases cause some limitations such as increase the doctor visit, loss
in workdays and reduction in quality of work. Cotton mills are polluted with the
different type of the cotton dust hazards. Workers which work in these mills are
associated with the number of the respiratory diseases and symptoms e.g. chest
tightness, shortness of breath, increased cough and phlegm, wheezing, asthma,
tuberculosis, lung-function loss, eye sight problems and skin diseases
[Salvaggio, et al. (1986)].
Due to such kind of the illnesses, the number of the problem arises for
workers, such as the loss in income, the loss in the good health and suffering
pain due to the illnesses, increase in the health care cost, poor work performance
due to the bad health, medicine and doctor fees, loss in workers’ productivity
due to the cost of illness, increase the social conflicts in the workers families,
reduction in the production, and negative impact occur on moral of the other
workers. World Health Organisation showed that eight hundred thousand labour
Acknowledgement: Authors express deepest thankfulness to South Asian Network for
Development and Environmental Economics (SANDEE) for assistant in providing the data on the
workers respiratory diseases, socio-eco factors, health and medical status of the textile workers.

2
forces in the cotton and in rope making industries are suffering due to the dust
pollution so in such situation there is the high probability of prevalence of the
respiratory and byssinosis diseases [WHO (2008)]. Byssinosis is the name of the
brown lung disease which is caused by the cotton dust.
Mostly, workforce in the developing countries is uneducated and most of
them are involve in the cotton handling process in the textile industry. So, that
there is the high probability of prevalence of the respiratory diseases like
asthma, cough, fever and brown lung diseases. The intensity of these diseases
among these workers is high due to their illiteracy and they are not aware of the
use of the safety gadgets such as wearing the face masks, use of the respirator
etc.
The long term exposure to dust pollution can cause the respiratory
diseases [WHO (2008)]. Cotton dust exposure at textile industries adds
considerably to the occupational burden of disease globally [Nafees, et al.
(2013)]. The relationship between the cotton dust in the textile industries and the
prevalence of the respiratory illnesses among the industrial workers has been
well documented [Memon, et al. (2008); Farooque, et al. (2008); Anjum, et al.
(2009); Nafees, et al. (2013)]. The objective of the study wasto provide the
strong evidence of Byssinosis and other respiratory diseases in textile industry
and to estimate the workers’ cost of illness associated with dust pollution among
textile workers in Faisalabad, Pakistan.
There are number of respiratory diseases and difficult to identify with
clinical tests, therefore, the study identified the respiratory diseases through their
symptoms. These latent respiratory diseases are linked with their indicators
symptoms because which are verified by chest specialist. The chest specialist
provided consultancy/expert views in identifying the related diseases that may
be caused by the dust pollution in the textile mills. This is a social scientist study
and adopting the medical test and professional is very expensive and time
consuming, therefore, for the identification of the diseases study used the
confirmatory factor analysis model.
So in this context, this study estimated the cost of illness. For the
estimation of the cost of illness study use the structural equation models (SEM)
with observed and latent variables. The estimation of the cost of illness by using
the structural equation models (SEM) is different from other studies because
costs are directly linked to the respiratory diseases but diseases are not
predictable among the humans but its reflected with their symptoms (indicators),
so for solving this causal problem we used the confirmatory factor analysis
(CFA) model to predict the different latent factors diseases with their different
symptoms indicators and then we estimate the impact of the respiratory diseases
and different demographic variables on the endogenous variables health and
opportunity cost.

3
Paper is organised as follow, Section 2 provides data description and
methodology, Section 3 results and discussion and Section 4 is about conclusion
and policy implication.
2. DATA DESCRIPTION AND METHODOLGY
2.1. Description of Study Area
Faisalabad is the big industrial town of Pakistan. Faisalabad is known as
the “city of textile” because the numbers of the textile industry are clustered in
the district Faisalabad. Textile industry is the backbone of the Faisalabad
economy. Sitara Textile Mills and Lyallpur Cotton Textile Mills, Kohinoor
Textile Mills, Crescent Textile Mills, Rahmania Textile Mills, Masood Textile
Mills, Aasim Textile Mills and Nishat Textile Mills are the famous textile
industries in the district Faisalabad. These industries have the major role in the
development of the Faisalabad economy and 5 billion dollars are the annual
textile exports arrive from the Faisalabad textile industries [Khan (2013)]. There
are 612 large industrial units out of which 248 are textile units [Malik (2010)].
Due to the rapid development in the textile sector, Faisalabad is known the
“Manchester of the Pakistan” [Khan (2013)]. At the same time, city has high
energy utilisation and dense transport system which cause dust pollution. Dust
pollution can lead to a variety of health as well as environmental problems. One
of the main sources of dust pollution is the textile industry.
2.2. Data Collection and Survey Design
The objective of the paper is measuring the impact of dust pollution on
workers’ health and related cost of illness, so for this purpose we needed to
collect the primary data. The primary data collected through questionnaire and
face to face interview with workers. The questionnaire was developed on the
basis of the questionnaires of the health cost and respiratory symptoms studies
[Gupta (2006); Murty, et al. (2003); Adhikari (2012); Chowdhury and Imran
(2010); Bogahwatte and Herath (2008); Memon, et al. (2008); Farooque, et al.
(2008); Nafees, et al. (2013); Hinson, et al. (2014)]. The questionnaire has two
parts, the first part is the general workers survey questionnaire (socio-economic
characteristics of workers) and second part is Health Diary Questionnaire
[Kamat and Doshi (1987); Gupta (2006); Chowdhury and Imran (2010);
Bogahwatte and Herath (2008)].
The general worker survey questionnaire includes information on work
characteristics and socio-economic factors. Variable in socioeconomic
characteristics are age, education, monthly income, gender and smoking history
of workers in textile industry and variables in work characteristics are duration
of employment, work section, mask use and working hours. A notable feature
of this study is that it uses data from health diaries.

4
The second part of the questionnaire is health diary questionnaire. The
health diary questionnaire includes the detail information on respiratory illnesses
and symptoms of textile workers. Through Health Diaries we collected the data
on respiratory diseases and symptoms, health cost, dust level, opportunity cost
and data on workday lost in the last two weeks. Gupta (2006); Adhikari (2012);
Chowdhury and Imran (2010); Bogahwatte and Herath (2008) used the similar
health diary technique to collect the data on health and medical status of the
respondents and associated cost.
Health cost data consist the expenditure on medicines, hospital stay,
pathological tests, doctor fees and accompanying person cost. The opportunity cost
includes the cost of the workday miss in the period of the last two weeks. The study
used the multistage sampling technique to select workers. This is the cross sectional
research conducted in the 3 spinning textile mills and randomly selected the 200
workers. These three spinning textile mills associated with the All Pakistan Textile
Mills Association (APTMA) Faisalabad. The previous literature has shown that level
of dust is much higher in the spinning section of the textile industry. “Spinning is a
manufacturing process where fibres are converted into yarn”. Spinning is the
twisting together of drawn out strands of fibres to form yarn.
The data was collected through the permission of the industry
administration. The actual data on dust pollution is not collected, since it is not
useful for the industry. The measurement of dust pollution in each factory and in
each section of spinning mill is very costly and monotonous job. Further they do
not allow outsider to do this kind of activity as it is against the industry. So here
the data on variable dust level is available through the self-reported by the
textile workers. Dust level is measured on a five point likert scale from high dust
pollution to low dust pollution.
Study used the health diary data based on the “upcoming two weeks”.
Same two weeks health diary data used the Bogahwatte and Herath (2008) in
their study but their health diary data based on the “two week recall”.
This study collected the data in two phases:
In the first phase, the data collected on the “upcoming two weeks”
based health diary questionnaire.
The second phase was the collection of the information on general
worker survey.
The data on health diary questionnaire has collected through the
following procedure. The first health diary was translated in to Urdu language.
Then the health diary questionnaires were dropped to the workers and requested
them to fill the Urdu health diary questionnaire for the upcoming fifteen days. In
health diary questionnaire workers mentioned the information on respiratory
diseases, cost of illness and workday lost. But the general worker survey data
was collected through face to face interview.

5
2.3. Methodology
To estimate the cost of illness we used the Structural Equation Model
(SEM).
2.3.1. Structural Equation Modelling (SEM) with Observed and Latent
Variables
To test the cost of illness of the textile workers we employ structural
equation model (SEM) with observed and latent variables. SEM is a “statistical
technique for testing and estimating causal relationships amongst the variables,
some of which may be latent using a combination of statistical data and
qualitative causal assumptions. Latent variables (also known as unobserved
variables, hypothetical variables or hypothetical constructs) are variables that are
not directly observed but are reflected from other variables that are observed and
directly measurable.”
SEM deal with the latent and observed variable. The observed or
measured variables are those variables which is directly measurable. Latent
variables are not directly measured able but it is inferred from the observed
variables and confirmatory factor analysis (CFA) deal the latent variables.
The structural equation model (SEM) basically consist two parts, one part
is the measurement model (confirmatory factor analysis) which shows the
relationship between the latent variables with their component indicators and
second part is structural model which assign the causal relationships among the
latent variables [Toma, et al. (2009)]. So for this purpose this study used the
structural equation model (SEM) in two stages,
Stage 1: is measurement model or confirmatory factor analysis (CFA).
Stage 2: is structural model or structural regression model (SRM).
Stage 1
2.3.1.1. Confirmatory Factor Analysis / Measurement Model
Diana (2000) stated that Confirmatory factor analysis (CFA) is “a
statistical technique used to verify the factor structure of a set of observed
variables. CFA allows the researcher to test the hypothesis that a relationship
between observed variables and their underlying latent constructs exists”.
In Confirmatory factor analysis (CFA) we identify the number of the
different factors which fundamentals in the data set and measured those
variables which is related to the latent variable. Mueller and Hancock (2007)
evaluate that the variation in dependent variables typically is not completely
explicable by the amount of variation in their particular causes or independent
variable. Confirmatory factor analysis (CFA) of the model is the part which
links each of the indicator variables with designated latent variable. In CFA,
indicators are specified to load on a single factor and consistent factor loading

6
are estimated correlations among the factor and its indicators and indicators are
generally correlated with each other but errors terms of the different indicators
are uncorrelated. In CFA per factor is fixed at least on one loading. Each set of
indicators are loaded onto a separate factor is given in the Figure 3.1.
The CFA is defined by the following system of the equations in Table 2.1
Table 2.1
Measurement Model (Confirmatory Factor Analysis)
Endogenous Variables Structural Equation Exogenous Variables
SBDW (X11) 111 11 EASTX X Asthma
SBODO (X12) 212 12 EASTX X
SBOT (X13) 313 13 EASTX X
SBOA (X14) 414 14 EASTX
Weaz (15) 515 15 EASTX
CT (16) 616 16 EASTX
LC (X21) 721 21 EBYSX Byssinosis
Fever (X22) 822 22 EBYSX
Swet (X23) 923 23 EBYSX
MA (X24) 1024 24 EBYSX
Phl (X25) 1125 25 EBYSX
Head (X26) 1226 26 EBYSX
EI (X31) 1331 31 ERAX Respiratory Allergy
TI (X32) 1432 32 ERAX
NI (X33) 1533 33 ERAX
CFT (X41) 1641 41 ECougX Chronic Cough
CMT (X42) 1742 42 ECougX
Table 2.1 implies a set of 17 structural equations from the measurement
portion of the model or confirmatory factor analysis (CFA). Here the X11=
shortness of breath during work, X12= shortness of breath one day off, X13=
shortness of breath other time. X14= shortness of breath always, X15=
wheezing, X16= chest tightness, X21= lung cancer, X22= fever, X23=sweating,
X24= muscle aches, X25= phlegm, X26= headache, X31= eye irritation, X32=
throat irritation, X41= cough few times and X42= cough many times. The
measured and latent variables in the current models are labelled X11 through
X42 and AST through Coug respectively.
7
In CFA system of model Asthma is the unobserved exogenous latent
variable which we cannot measure directly so we estimate it with the different
symptoms as X11, X12, X13, X14, X15 and X16. So through this system of the
CFA we estimated the one respiratory disease Asthma and similarly we
estimated the other unobserved latent respiratory diseases like a byssinosis,
respiratory allergy and chronic cough.
Stage 2
2.3.1.2. Structural Regression Model (SRM)
The structural model or structural regression model screening the
prospective causal dependence among endogenous and exogenous variables.
In this study we measured the cost of illness (OC and HC) through the help
of the SRM model because cost is directly associated with the dust pollution
illnesses but these diseases are unidentified. The actual data on these
diseases are not available from the textile workers. After consultation of the
Doctors and according to their advice then study interlink the respective
diseases with symptoms. Diseases are latent factor so that these diseases are
reflected by their symptoms. Medical studies show that respiratory illnesses
especially byssinosis are not directly observable but we reflect these
diseases with their cause (symptoms) and textile workers are not aware
about these diseases so we find these diseases among workers through their
symptoms. Memon, et al. (2008) and Manthur, et al. (2005) observed that
byssinosis is such respiratory disease which occur among the textile workers
in minimum of the 10 years of the work in the textile industry and its
symptoms among the workers occur within the 3-5 years duration of the
work in textile industry.
So for solving this causal problem first we predicted the different latent
diseases with their different symptoms indicators and then estimated the impact
of the respiratory diseases and different demographic variables on the
endogenous variables health and opportunity cost.
The SRM is defined by the following system of the equations in Table
2.2.
The structural regression model consists of two endogenous variables,
opportunity cost (Cost of workday miss) and health cost (medication cost)
and the number of the exogenous variable. We estimated the health and
opportunity cost with the help of the number of latent and other variables of
the model. Table 2.1 and 2.2 lists the all 19 structural equations and
connected dependent and independent variable that evaluate the path model
in Figure 3.2.

8
Table 2.2
Structure Regression Model
Endogenous
Variable Structure Equation Exogenous Variable
Health cost
Opport-
unity cost
2.....................
1.....................
1211109
87654321
12119
87654321
10
SmOTUMDW
DLEduIncAgeCougRABYSASTOC
SmOTUMDW
DLEduIncAgeCougRABYSASTHC
Asthma, Chornic
Cough,
Byssinosis,
Respiratory Allergy
Age, income,
education, overtime,
use of mask, dust
level, duration of
work, smoking
3. RESULTS AND DISCUSSION
This section of the study describes the results obtained from structural
equation modelling, which is generally categorised as two stages modelling
first stage is CFA and second stage is SRM. As in this study we have the
different number of the unobserved latent variables so at first stage we apply
the CFA as a measurement model approach to specify the reflection of
asthma, byssinosis, respiratory allergy, and chronic cough in terms of their
relevant indicators (symptoms). Once the CFA has been estimated then we
in the second stage SRM is applied to shows the effect of the latent factors
and different socio-economic variables on endogenous variables health and
opportunity cost.
3.1. Results of Confirmatory Factor Analysis
Statistical techniques such as factor analysis, explanatory or
confirmatory have been widely used to examine the number of latent
constructs underlying the observed respondents and to evaluate the adequacy
if individual item or variables as indicator for the latent constructs they are
supported to measure. In our case we have four factors, asthma, byssinosis,
respiratory allergy and chronic cough. Each factor is reflected with list of
indicators.
The indicators are generally correlated with each other but errors terms of
the different indicators are uncorrelated. In CFA per factor is fixed at least on
one loading. Each set of variables loaded onto a separate indicator is presented
in the Figure 3.1.
Medical literature on respiratory illnesses reported that respiratory
diseases are not directly observed this study observed it by the different
symptoms through the confirmatory factor analysis factor loading.

9
Fig. 3.1. Confirmatory Factor Analysis of Respiratory Diseases
In Figure 3.1 the measured variables are point out by in rectangular form
(X11to X42) and latent variables are point out by ellipses (BYS, AST, COUG,
and RA). There are four endogenous latent variable as AST (asthma), BYS
(byssinosis), RA (respiratory allergy) and Coug (chronic cough) and we loaded
these variables with their symptoms because these diseases are not directly
observable its depend on different factors or indictors. As AST (asthma) is
indicated with the following set of indicators X11, X12, X13, X15, X16, X17
and X24. In this Figure, the one headed arrows show the direct causal effect

10
hypothesised from one variable effect to another variable. In Figure 3.1, the
residual terms (e) point out that reflection to indicators is influenced by the
causes other than the latent variables.
There is nonzero covariance may exist between e1 to e5. The analysis
of covariance is based on the implicit assumption that indicators are
measured as deviations from their means (i.e., all indicator means equal
zero). It seems that CFA model justifiable the causes with latent factors and
it allow the residual terms of resultant respiratory symptoms to freely
covary. Covariance exit between the two headed arrows among the two
variables. In SEM, the latent variables are the free of error term. Factor
loadings estimate the direct effect of factors on indicators. This factor
loading shows that we estimate the respiratory disease asthma through the
following symptoms. This factor loading is doing for this purpose to access
the impact of this factor loading on the opportunity and health cost because
diseases are not directly identified and also not statistically significant on
health and opportunity cost. The study also aims to know about the health
status of the textile workers.
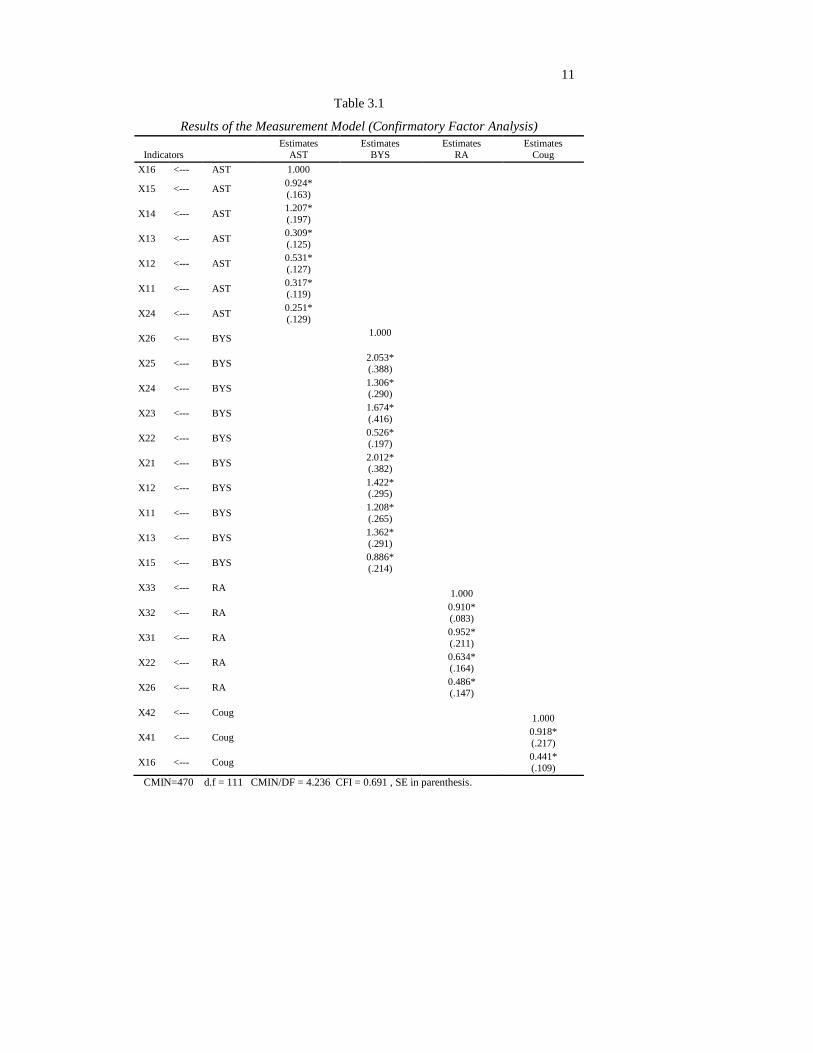
The Table 3.1 shows the results of number of the respiratory illness
and symptoms. The results indicate that the relationships between the latent
and observed variables diseases and symptoms have the significant positive
relationship. In SEM model the variables are supposed mean centred, so
eradicating the requirement for the intercept term in the mean centred data,
the indictors X16, X26, X33 and X42 are used as the indication variable for
their respective variable loading and their factor or variable loading are not
freely statistical measured but we fixed to 1. It is sufficient condition for the
identification of the measurement model and AMOS software automatically
fixed the one indicator. Asthma, byssinosis, respiratory allergy, and chronic
coughing are statistical significant at 5 percent level.
This shows that the textile workers are suffering these diseases due to the
exposure of the dust pollution. This setup is called confirmatory factor analysis.
This explains that the relationships between these variables are driven by
underlying latent variables.
The results of the Figure 3.1 and in the Table 3.1 shows that standardised
factor loading was statistically significant, it similarly shows that the
correlations between error terms and among latent variables these factor
loadings were also statistically significant.
3.2. Results of the Structural Regression Model
Structural regression model is the second stage of the structural equation
model (SEM). In structural regression model (SRM) we estimated the SRM with
the measurement model proven in first stage but with the different other
exogenous variable of the SRM.
11
Table 3.1
Results of the Measurement Model (Confirmatory Factor Analysis)
Indicators
Estimates
AST
Estimates
BYS
Estimates
RA
Estimates
Coug
X16 <--- AST 1.000
X15 <--- AST 0.924*
(.163)
X14 <--- AST 1.207*
(.197)
X13 <--- AST 0.309*
(.125)
X12 <--- AST 0.531*
(.127)
X11 <--- AST 0.317* (.119)
X24 <--- AST 0.251*
(.129)
X26 <--- BYS
1.000
X25 <--- BYS
2.053*
(.388)
X24 <--- BYS
1.306* (.290)
X23 <--- BYS
1.674*
(.416)
X22 <--- BYS
0.526*
(.197)
X21 <--- BYS
2.012*
(.382)
X12 <--- BYS
1.422* (.295)
X11 <--- BYS
1.208*
(.265)
X13 <--- BYS
1.362*
(.291)
X15 <--- BYS
0.886*
(.214)
X33 <--- RA
1.000
X32 <--- RA 0.910*
(.083)
X31 <--- RA
0.952*
(.211)
X22 <--- RA
0.634*
(.164)
X26 <--- RA
0.486*
(.147)
X42 <--- Coug
1.000
X41 <--- Coug
0.918*
(.217)
X16 <--- Coug
0.441*
(.109)
CMIN=470 d.f = 111 CMIN/DF = 4.236 CFI = 0.691 , SE in parenthesis.
12
So we estimated the structural Equations (1) and (2) in Table 2.2 through
the structural regression analysis. The diagrammatic representation of the
structural model is given in Figure 3.2 and estimates are presented in Table 3.2
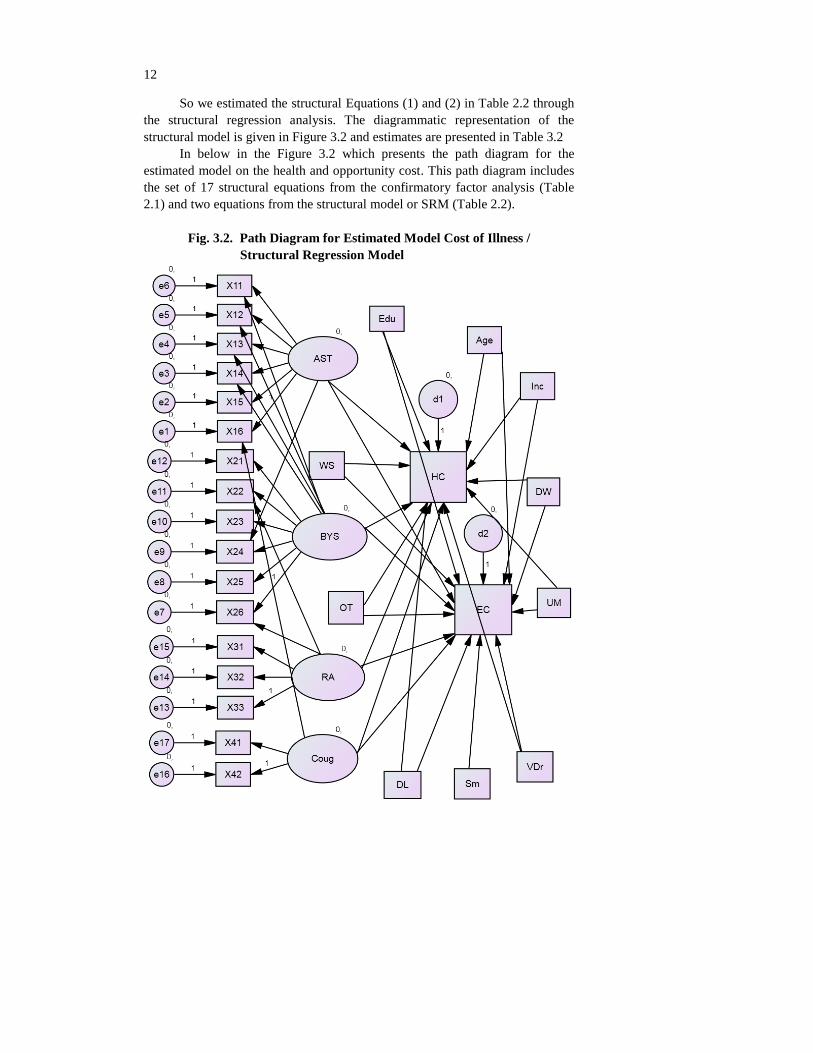
In below in the Figure 3.2 which presents the path diagram for the
estimated model on the health and opportunity cost. This path diagram includes
the set of 17 structural equations from the confirmatory factor analysis (Table
2.1) and two equations from the structural model or SRM (Table 2.2).
Fig. 3.2. Path Diagram for Estimated Model Cost of Illness /
Structural Regression Model

13
In Figure 3.2 path diagram include the two endogenous variable as health
and opportunity cost and twelve exogenous variable, namely asthma (AST),
byssinosis (BYS), respiratory allergy (RA), cough, age, income (Inc), education
(Edu), duration of work (DW), smoking (Sm), use mask (UM), dust level (DL)
and overtime work (OT).
Table 3.2
Results of Structural Regression Model
Health Cost Opportunity Cost
AST 742.74
(0.002)
490.5
(0.000)
BYS 250.32
(0.008)
485.49
(0.137)
RA 798.18
(0.000)
579.15
(0.000)
Coug 407.14
(0.000)
164.93
(0.000)
Sm 178.74
(0.000)
28.01
(0.249)
Age 2.08
(0.074)
7.14
(0.000)
Inc 0.012
(0.098)
0.010
(0.002)
Edu 5.14
(0.481)
0.019
(0.995)
DW 9.87
(0.044)
6.43
(0.003)
OT 6.895
(0.041)
6.03
(0.000)
UM 0.626
(0.09)
46.55
(0.05)
DL 105.4
(0.000)
4.3
(0.758)
CMIN =1864, d.f1 =382, CMIN/DF=4.8, CFI=0.635 P-values in parenthesis.
In Table (3.2) shows the results of structural regression model (SRM)
which measured the impact of latent diseases and other variables on health and
opportunity cost. The latent variable chronic diseases, Byssinosis, chronic
1d.f= P(P+1)/2-K.
P= number of items, K= number of parameters.

14
cough, asthma and respiratory allergy have positive coefficients are significant
at one percent level, meaning thereby that workers with these conditions have
higher medical and opportunity costs.
One respiratory disease byssinosis are statistical significant to health cost
(HC) but not significant to opportunity cost (OC) with expected positive sign
(P=0.137). However byssinosis is significant with the OC at the univariate level
but it is insignificant at the multivariate level when we attached the other
variables in the structural equation model (SEM). Byssinosis is brown lung
disease which occurs due to the dust pollution exposure [Hinson (2014)]. As
workday lost is one censored variable so the present study results shows that
may worker not miss the work last two weeks due to the byssinosis and so not
bear the opportunity cost. Study has the some policy and time restrictions so
collected the data only for last two weeks, thus the impact of this limitation
occurs on results.
Age is significant at one percent level (P = 0.000) to OC but at ten percent
to HC with the expected positive sign and age coefficient has the positive sign
which shows that old age workers have the more medication and opportunity cost
because they have work in the same industry from the number of the years as
survey data shows that some workers have the 20–25 years work experience and
also these old age workers are mostly uneducated. The uneducated workers are not
follows the safety health measures so these workers suffer the number of the
respiratory diseases and bear the cost of illness. It is well established fact that age
has dominant effect on the health and working capacity of a man. A young person
can work for more time and not much susceptible to diseases than old one. Old
people are highly affected from respiratory diseases. So, working capacity of
different age group workers is different. Age group of respondents is given an
important position in the present study.
The coefficient income has the positive sign which is statistical significant
at five percent (P=0.002) and ten percent level (P=0.09) in both opportunity and
health cost respectively. The positive sign of the coefficient income mean higher
income and higher income or positive income associated with the higher medical
and economic expenditure. Adhikari (2012) reported the same results about
positive income effect on mitigation cost. Literatures highlight that which workers
have the higher income they spend more income on their health. Same results
proposed by the Chowdury and Imran (2010) that better standard of living and
positive income have positive effect on the medical expenditure.
The variable smoking has a significant positive relationship on health cost
of the textile workers. Smoking is injurious to health is a very well-known
proverb. Smoking is has very bad effect on the respiratory system of a human
body. It causes various diseases like asthma, shortness of breath, cough, T.B,
and lungs carcinoma. Ghasemkhani, et al. (2006) also described that smokers
have the higher prevalence of the respiratory diseases and symptoms.

15
So smoking has the significant impact on the health cost of the workers
which mean smoker workers tolerate more medical expenses as compared to the
non-smoker workers. As a result, smoking affects the working capacity of
workers thus they bear the additional cost. The results of the SEM indicate that
smoking is not significant to opportunity cost since opportunity cost is workday
miss cost may workers not miss their work last two weeks due to the effect of
the habit of the smoking. A same result was declared to the Gupta (2006) in his
study he did not found the significant relationship between cost and smoking
habit.
The duration of employment in the textile industry also significant at the
5 percent level on both opportunity and health cost. The prolonged period of
employment in the dusty section of the textile industry have the negative impact
on the worker health [Vays (2000)].
Ghasemkhani, et al. (2006) and Memon, et al. (2008) indicate that long
duration of employment in the textile industry have the major role in the
development of the respiratory diseases among the textile workers.
Ghasemkhani, et al. (2006) described that the incidence of the respiratory
diseases increased with the age and duration of employment. Farooque, et al.
(2008) observed that those workers had the more respiratory illnesses which
work in the same industry last 10 to15 years. The present study pragmatic that
around the 62 percent workers had the duration of employment in the textile
industry between 6 to 15 years. Therefore the long period of the employment in
the textile industry has the impact on the worker health and thus worker bear the
more health and opportunity cost.
The relation of use mask with opportunity and health cost is significant at
5 percent (P=0.05) and at 10 percent level (P=0.09) respectively but it
coefficient positive sign is surprised for the study. Use of mask is very good
habit during work in textile industries. It helps to overcome the allergy and other
respiratory illness in workers but the results of the survey data shows that 77
percent workers not used the mask during the work.
The literature and general evidence shows that there is positive
association between dust level and prevalence of the respiratory diseases. Dust
level has the positive relation with the health and opportunity cost. It is
statistical significant at 1 percent with the HC (P=0.000) but not significant with
OC (P=0.758). The positive sign of the coefficient shows that higher the dusts
level higher the health cost of the textile workers. Su (2003) highlighted that
high prevalence of the byssinosis among workers significantly associated with
the high dust level, 45 percent workers had the symptoms of byssinosis due to
high dust exposure. The above Table result shows that dust level is not statistical
significant to opportunity cost but it has positive sign (P = 0.758). The positive
sign of the coefficient of dust level indicate that higher the level of dust is
positively associated with the opportunity cost (high level of dust increase the
cost).

16
Some our demographic variables like gender, education and heat or
temperature are not significant to the cost of illness. Gender and temperature are
also not significant in Gupta (2006) study. In present study, the frequency of
female workers in textile industry is very less as compared to the male workers,
so for this reason the variable gender is insignificant.
Structural regression models are usually evaluated in term of how well
they fit the data. The goodness of fit of the models measured by the usually chi
square statistics.
In order to check to check the overall goodness of fit in SEM model
usually we are using the two criteria of chi-squared statistic one is the
CMIN/DF2 and second is the comparative fit index (CFI).In general CFI ranges
from 0 to 1and the larger value of CFI is indicating good model fit, the
acceptable range of the CFI is between 0 to 1 and it is good fit model if CFI is
near to 0.9 or 1. In our study CFI =0.63 is close to 0.9 or 1 which indicated that
model good fit the data and CMIN/DF=4.8 which is the less than to the table
value 5, the table value roughly is closed to 5 thus H03 is acceptable so the
calculated value should be less than the table value. When considered the
following indices then data model fit is considered acceptable.
4. CONCLUSION AND POLICY IMPLICATIONS
4.1. Conclusion
This study is conducted in the textile industry of the Faisalabad. The
primary goal of the study was to assess the impact of dust pollution on worker
health, productivity and cost. This study found the high prevalence of the
respiratory diseases and symptoms among the textile workers. This shows that
workers lose their productivity and working capacity in the textile industry. The
69 percent workers reported that due to the illness their work performance in
industry not normal, they suffered the problems during the work such as muscle
aches, wheezing, chronic cough, asthma, respiratory allergy etc. This indication
that workers are exposed to the dust pollution illnesses. Study also measured the
prevalence of the respiratory diseases among the textile workers. Study revealed
that (35.5 percent) workers had wheezing, (65.5 percent) phlegm, (58 percent)
chest tightness, (72 percent) had a throat irritation problems.
Study observed that almost 30 percent workers suffered the health cost
(HC) between the 1 to 500 rupees, 15 percent in the range of 600 to 1000 rupees,
15 percent among Rs 1100 to 2000 and 2.5 percent between 2100 to 2500 rupees
in the last two weeks. Due to the last two weeks workday lost 41 percent
workers beard the opportunity cost in the range of Rs 500 to 1500.
2CMIN : Chi-Square minimum, CFI: Comparative fit index, d.f: degree of freedom. 3In SEM , H0: model fit the data.
H1: model does not fit the data.

17
The research paper provided the conclusive evidence on the opportunity
and health cost. The reduction in dust pollution positively impact on the health
and opportunity cost status of the workers. The results evidently show that
reduced in dust will reduced the respiratory diseases and due to the reduction in
respiratory diseases will reduced the health and opportunity cost.
4.2. Policy Implications
The safe workplace environment gives the indication of the good health,
increase in productivity of the workers and also enhances the production of the
industry. The Govt. should to take such inventiveness measure which reduced
the dust from the textile industry and promote the safe and clean environment
and also take such initiative to measure the dust level within the industry on
overtime.
Govt. should to give the subsidy in polluted industries such as textile;
construction industries etc. for the installation of the modern technology and
make the law and policies for such type of industries to check the level of dust in
these industries on the daily or weekly basis. If clean working environment
promote in our industries we observed the great change in the health status of
the worker and change in economic condition of the worker.
Factory owners must needed to adopt such technologies in industry which
automatically abate the dust pollution during the work. Factory owner also
should to compensate the affected workers for their health losses in terms of the
reduction in the opportunity cost which they bear due to absent from work due
to the dust pollution sickness. Industry administration has to arrange the
programmes and training workshop about awareness of the dust pollution
hazards among the workers.
The textile industry worker should to follow the preventive safety
measures; they must wear the mask during the work and adopt such useful
measures which prevent them from the dust during the work.
The industry proprietors have the great indication on the business as usual
basis to potentially increase their savings in terms of the provision of the healthy
work environment. When workers have the less prevalence of the respiratory
diseases, they will have the more working capacity and they will increase the
production level of the industry. Industry owner should to increase their
economic performance in terms of the safe provision of the working
environment and this effort of the firms mean they play a vital role in the
sustainable development of the country. The evidence shows that safe
environment have the significant positive impact on the workers health as well
as on their social life. The healthy and mentally relax workforce play the vital
role in the sustainable development of the country.
The purpose of the present study is to aware the policy makers, Govt and
other stakeholders about the tangible opportunity and health costs that workers

18
bear due to the dust pollution in the textile industry so the policy-makers should
to adopt such interventions which tackle the dust pollution from the textile
industries of the Pakistan.
REFERENCES
Adhikari, N. (2012) Measuring the Health Benefits from Reducing Air Pollution
in Kathmandu Valley: Kathmandu: South Asian Network for Development
and Environmental Economics (SANDEE).
Ahmed Nafees, Masood Fatmi, and N. Sathiakumar (2013) Pattern and
Predictors for Respiratory Illnesses and Symptoms and Lung Function
among Textile Workers in Karachi, Pakistan. Occupational and
Environmental Medicine 70:2, 101–109.
Alemu, K., A. Kumie, and G. Davey (2010) Byssinosis and other Respiratory
Symptoms among Factory Workers in Akaki Textile Factory, Ethiopia.
Ethiopian Journal of Health Development 24:2.
Anjum, Mann, and Anjum (2009) Health Concerns among Workers in Weaving
Industry: A Case Study of Tehsil Faialabad, Pakistan. J. Agric. Soc. Sci. 5:
106, 8.
APTMA, All Pakistan Textile Mills Association.www.aptma.org
Ayres, J. G., R. Boyd, H. Cowie, and J. F. Hurley (2010) Costs of Occupational
Asthma in the UK. Thorax, thx. 2010.136762.
Beck, G. J., Schachter, L. R. Maunder, and R. S. Schilling (1982) A Prospective
Study of Chronic Lung Disease in Cotton Textile Workers. Annals of
Internal Medicine 97:5, 645–651.
Bogahawatte, C. and J. Herath (2008) Air Quality and Cement Production:
Examining the Implications of Point Source Pollution in Sri Lanka.
Byrne, B. M. (2013) Structural Equation Modeling with AMOS: Basic
Concepts, Applications, and Programming: Routledge.
Dasgupta, P. (2004) Valuing Health Damages from Water Pollution in Urban
Delhi, India: A Health Production Function Approach. Environment and
Development Economics 9:01, 83–106.
Farooque, M. I., B. Khan, F. Aziz, M. Moosa, M. Raheel, S. Kumar, and F. A.
Mansuri (2008) Byssinosis: As Seen in Cotton Spinning Mill Workers of
Karachi. Journal-Pakistan Medical Association 58:2, 95.
Ghasemkhani, M., M. Kumashiro, M. Rezaei, A. R. Anvari, A. Mazloumi, and
Sadeghipour (2006) Prevalence of Respiratory Symptoms among Workers in
Industries of South Tehran, Iran. Industrial Health 44:2, 218–224.
Gupta, U. (2008) Valuation of Urban Air Pollution: A Case Study of Kanpur
City in India. Environmental and Resource Economics 41:3, 315–326.
Hinson, A., V. Schlünssen, G. Agodokpessi, T. Sigsgaards, and B. Fayomi
(2014) The Prevalence of Byssinosis among Cotton Workers in the North of

19
Benin. The International Journal of Occupational and Environmental
Medicine 5: (4 October), PII 448, pp. 194–200.
Malik, N. (2010) Perspective of Occupational Health and Safety in Textile
Industry. University of Agriculture, Faisalabad.
Mathers, C., D. M. Fat, and J. Boerma (2008) The Global Burden of Disease:
2004 Update: World Health Organisation.
Memon, I., A. Panhwar, D. K. Rohra, S. I. Azam, and N. Khan (2008)
Prevalence of Byssinosis in Spinning and Textile Workers of Karachi,
Pakistan. Archives of Environmental and Occupational Health 63:3, 137–
142.
Mishra, A., S. Rotti, A. Sahai, and K. Narayan (2003) Byssinosis among Male
Textile Workers in Pondicherry: A Case-control Study. National Medical
Journal of India 16:2, 70–72.
Punjab, Govt. of (2014) Development Statistics of Punjab. Bureau of Statistics,
Planning and Development Department, Lahore.
Sangeetha, B., M. Rajeswari, S. Atharsha, K. S. Sri, and S. Ramya (n.d.) Cotton
Dust Level in Textile Industries and Its Impact on Human. International
Journal of Scientific and Research Publications 780.
Saoji, A. V., D. Aniruddha, K. Meenal, N. Jaydeep, and A. B. Mudey (2010) To
Study the Prevalence of Chronic Respiratory Morbidities and Related
Epidemiological Factors among Spinning Mill Workers. Global Journal of
Health Science 2:2, 111.
Su, Y.-M., J.-R. Su, J.-Y. Sheu, C.-H. Loh, and S.-H. Liou (2003) Additive
Effect of Smoking and Cotton Dust Exposure on Respiratory Symptoms and
Pulmonary Function of Cotton Textile Workers. Industrial Health 41:2, 109–
115.
Suhr, D. D. (2006) Exploratory or Confirmatory Factor Analysis? SAS Institute
Cary.
Toma, L., A. McVittie, C. Hubbard, and A. W. Stott (2011) A Structural
Equation Model of the Factors Influencing British Consumers’ Behaviour
Toward Animal Welfare. Journal of Food Products Marketing 17:2-3, 261–
278.
World Health Organization (1986) Early Detection of Occupational Diseases.