final report food waste collections to smes: developing ... waste collections to smes... · final...
TRANSCRIPT
Final Report
Food Waste Collections to SMEs:
Developing the Business Case
This report looks at ways of making food waste collection services more efficient and more affordable to businesses, with the aim of increasing take up and diverting more food waste from landfill. It considers a number of potential service profiles for collecting food waste including integrating food waste with collections of dry recycling and refuse.
Project code: FWC001-000
Research date: October 2011 to December 2011 Publication Date: June 2012
WRAP’s vision is a world without waste, where resources are used sustainably. We work with businesses and individuals to help them reap the benefits of reducing waste, develop sustainable products and use resources in an efficient way. Find out more at www.wrap.org.uk
Written by: Gianluca Forlani, LRS Consultancy and Julia Hummel, Eco Alternatives
Document reference: [e.g. WRAP, 2006, Report Name (WRAP Project TYR009-19. Report prepared by…..Banbury, WRAP]
Front cover photography: [Add description or title of image.]
WRAP and (Consultants Name) believe the content of this report to be correct as at the date of writing. However, factors such as prices, levels of recycled content and
regulatory requirements are subject to change and users of the report should check with their suppliers to confirm the current situation. In addition, care should be taken
in using any of the cost information provided as it is based upon numerous project-specific assumptions (such as scale, location, tender context, etc.).
The report does not claim to be exhaustive, nor does it claim to cover all relevant products and specifications available on the market. While steps have been taken to
ensure accuracy, WRAP cannot accept responsibility or be held liable to any person for any loss or damage arising out of or in connection with this information being
inaccurate, incomplete or misleading. It is the responsibility of the potential user of a material or product to consult with the supplier or manufacturer and ascertain
whether a particular product will satisfy their specific requirements. The listing or featuring of a particular product or company does not constitute an endorsement by
WRAP and WRAP cannot guarantee the performance of individual products or materials. This material is copyrighted. It may be reproduced free of charge subject to the
material being accurate and not used in a misleading context. The source of the material must be identified and the copyright status acknowledged. This material must
not be used to endorse or used to suggest WRAP’s endorsement of a commercial product or service. For more detail, please refer to WRAP’s Terms & Conditions on its
web site: www.wrap.org.uk

Food Waste Collections to SMEs: Developing the Business Case 1
Executive summary
Following on from earlier work on collections of food waste from commercial premises and schools, WRAP
identified that further work was required to determine the financial business case for the provision of food waste
collections to SMEs. This additional work has identified and analysed a variety of potential service models for a
range of business types in the hospitality sector.
The aim of this research was to gather information about the main food waste service models available and, for
these, to determine the costs and the key variables that affect the viability of food waste collection services both
for the contractor providing the service and the SME receiving the service.
The research also looked at identifying the threshold (e.g. business size, type or food waste yield generated) at
which a food waste recycling service is likely to be viable and, where the business case for a regular food waste
collection service might not stack up for a business. A range of potential alternative options for recycling of food
waste was considered.
The work of the project team was assisted by an Industry Panel composed of four senior representatives of
companies currently undertaking food waste collections, which acted as a sounding board throughout the project
and helped to ensure that the outcomes of the cost model were realistic.
The service options to be modelled were identified with the Industry Panel and agreed with WRAP. Two main
service types were selected:
Bin swap: the system works by collecting a full bin and replacing it with a clean, empty one
Emptying on site: this is the more traditional system as used for household collections whereby the content of
a bin is emptied into the collection vehicle and the empty bin returned to the customer
The various service profiles were simplified into 6 service options for analysis and comparison with two different
baselines.
Service options chosen for use in cost model
Stream 1 Stream 2 Vehicles Containers
Baseline 1 Mixed dry
recyclables
Residual waste
after mixed dry
recyclables
removed
Single back 11t payload RCV for
both streams
Stream 1: 240L
Stream 2: 1100L
Baseline 2 Mixed waste
only (i.e. no
recycling)
n/a Single back 11t payload RCV 1100L
Option 1 Food waste
dedicated
vehicle
Residual waste
after food waste
removed
Stream 1: dedicated food waste
vehicle 3.5t payload
Stream 2: Single back 11t payload
RCV
Stream 1: 120L or
240L
Stream 2: 1100L
Option 2 Food waste &
glass - toploader
Residual after
food waste &
glass removed
Stream 1: twin compartment, 11t
payload toploader
Stream 2: Single back 11t payload
RCV
Stream 1: 120L or
240L
Stream 2: 1100L
Option 3 Food waste &
dry recyclables –
pod vehicle
Residual after
food waste & dry
recyclables
removed
Stream 1: split back 11t payload
RCV with front pod
Stream 2: Single back 11t payload
RCV
Stream 1: 120L or
240L
Stream 2: 1100L
Option 4 Food waste &
residual waste –
pod vehicle
n/a Split back 11t payload RCV with
front pod
Food waste: 120L
or 240L
Residual waste:
1100L

Food Waste Collections to SMEs: Developing the Business Case 2
Option 5 Bin swap food
waste only –
box vehicle
Residual after
food waste
removed
Stream 1: 3t payload box vehicle
Stream 2: Single back 11t payload
RCV
Stream 1: 120L or
240L
Stream 2: 1100L
Option 6 Bin swap food
waste & glass –
box vehicle
Residual after
food waste &
glass removed
Stream 1: 3t payload box vehicle
Stream 2: Single back 11t payload
RCV
Stream 1: 120L or
240L
Stream 2: 1100L
The model was developed in Excel and comprises four parts:
The first considers the operation from the SME’s perspective, i.e. the volumes of waste arising and the
number of bins required to accommodate the waste at particular collection frequencies
The second part considers the operation from the contractor’s perspective, i.e. how many SMEs can be
serviced a day by one collection vehicle
The third part considers the post collection costs such as transfer, treatment, disposal and landfill tax
Finally, the last section of the model summarises the costs and calculates a total weekly cost per
establishment for each service option. In all parts the primary categorisation of the service is with respect to
the collection vehicle
The main conclusions from the cost model are that: 1. The different collection options modelled have, overall, similar service costs despite the differences in the
collection of food waste and other dry recyclables;
2. The addition of a new food waste collection service should be able to be provided to an SME at a similar overall cost to a baseline situation where a dry recyclables and residual waste service is provided;
3. This is based on the proviso that efficiencies across the different waste streams are maximised - the addition of a separate food waste collection without making changes to the refuse service to take advantage of the reduction in service requirements will otherwise add a significant cost;
4. Future scheduled increases in landfill tax and higher gate fees in some regions could make the overall service cost lower for a system that includes the separate collection of food waste compared to one without the separation of food waste.
With regard to the different collection options, the outputs confirm the Industry Panel’s view that there are a
number of available service options none of which has a particular advantage over the others, but any one of
which may be more or less suitable in a specific situation depending on local conditions. The only exception is the
option of food waste plus glass collections using bin swap, which was consistently the most expensive option
throughout the sensitivity analysis, and therefore considered to be the least attractive to SMEs.
Regarding the comparison with the baseline options, a key reason for the similarity in costs, despite the
introduction of an additional food waste service, is the potential reduced collection frequency requirement for the
residual waste stream. This was considered to be a reasonable assumption as the model focuses on small size
SMEs in the hospitality sector, i.e. businesses with a large percentage of food waste.
Reviewing current capacity for refuse and enhancing the dry recyclables collection to SMEs are important factors
in delivering viable low cost food waste collection services. The findings support earlier WRAP research which
emphasised the need to promote packaged refuse and recycling services to realise the savings between systems
and that standalone separate collections of food waste would find it difficult to be competitive. Reviewing current
waste containment and amending collection contracts accordingly are essential for SMEs to ensure food collection
services are affordable.
Additional factors that point towards the viability of food waste collections in the future relate to the annual
increase in landfill tax, which will make disposal of residual waste to landfill progressively more expensive, and
the potential additional benefits of being able to send the residual waste to a ‘dirty MRF’ for further sorting
thereby saving further on landfill gate fees and tax. This is because, as explained by the Industry Panel, once
food waste (and dry recyclables) is removed from the residual waste stream, what remains is a stream very
similar to dry recyclables, only of lower quality. However, these factors will change the cost profile only marginally
– re-configuring the services to maximise efficiencies between the various streams collected and reducing as
much as possible the time needed to serve each premise have a much bigger impact on the viability of a food
waste collection scheme.

Food Waste Collections to SMEs: Developing the Business Case 3
While the outputs of the model suggest that SMEs should be able to be offered the option of separating their
food waste for collection at a sensible cost, this conclusion is based on generalised assumptions. Ultimately, this
outcome will depend on the contractor being able to identify cost savings in how it runs the service and on their
willingness to transfer at least some of these to the SME.
With regards to the level at which SMEs would be considered to be producing insufficient food waste to make a
dedicated collection scheme cost effective for them, it was established that typically this would equate to an SME
not producing enough material for a 120L food waste bin, collected once a week, with at least a 40kg/week
content.
In this situation, an SME would need to be part of a wider scheme coordinated either by a Business Improvement
District (BID) or by a shopping centre, in order to avoid additional service costs. Even so, experiences of existing
schemes are varied, with examples of successful collections from shopping centres contrasting with the
experience of Business Improvement Districts where businesses have reverted back to placing their food waste in
the residual waste stream as it is a cheaper option.
Overall the research included in this project suggests that SMEs in the hospitality sector should consider including
the separate collection of food waste together with improvements in their overall service provision as this could
result in either a cost neutral or lower cost service and result in additional environmental benefits through the
diversion of food waste and dry recyclables from landfill.

Food Waste Collections to SMEs: Developing the Business Case 4
Contents
1.0 Introduction ................................................................................................................................ 5 2.0 Methodology ............................................................................................................................... 5
2.1 The Industry Panel .............................................................................................................. 5 2.2 Review of existing data ........................................................................................................ 6 2.3 Identification of service options to model .............................................................................. 7 2.4 Development of the model ................................................................................................. 10
2.4.1 Part 1: the SME .................................................................................................... 11 2.4.2 Part 2: the contractor ............................................................................................ 11 2.4.3 Part 3: Post collection costs ................................................................................... 12 2.4.4 Part 4: Final cost summary .................................................................................... 13
2.5 Model assumptions ............................................................................................................ 13 3.0 Model outcomes ........................................................................................................................ 14
3.1 Relative costs of different food waste collection options ........................................................ 14 3.2 Comparison of food waste service options with no food waste service baselines ..................... 15 3.3 Impact on costs if efficiencies from reduced residual waste collection requirements are not
maximised .................................................................................................................................... 16 3.4 Impact of increase in landfill tax ......................................................................................... 17
4.0 Alternative options for small SMEs .......................................................................................... 18 4.1 Context ............................................................................................................................ 18 4.2 Options ............................................................................................................................ 18
4.2.1 Kerbside collections within main rounds .................................................................. 18 4.2.2 Collection from central bin store area...................................................................... 19 4.2.3 Bring sites ............................................................................................................ 20 4.2.4 Onsite composting ................................................................................................ 20
5.0 Conclusions and recommendation ........................................................................................... 21 5.1 Cost model ....................................................................................................................... 21 5.2 Small SMEs ....................................................................................................................... 22
Appendix 1: Literature reviewed .......................................................................................................... 23 Appendix 2: Cost model assumptions based on Industry Panel experience ....................................... 24 Appendix 3: Sensitivity analysis ........................................................................................................... 27
Acknowledgements
Our thanks to the following individuals who, as external members of the project Industry Panel, provided input
throughout all phases of the project: Bill Swan (Paper Round), Dean Pearce (PDM Group), Steve Longdon (May
Gurney) and Michael Cox (SITA UK).

Food Waste Collections to SMEs: Developing the Business Case 5
1.0 Introduction Over the past few years there has been considerable expansion of household food collections, with the amount
collected having increased six-fold since 2007/081. However, large quantities of food are also known to be
generated in the commercial and hospitality sector, for which collections and services are still limited.
Research has been undertaken over the last couple of years looking at the feasibility of undertaking collections of
food waste from small and medium sized businesses (SMEs) and schools2, and at waste arisings and waste
composition in the hospitality sector3.
Evidence from this research suggests that businesses are willing to recycle their food waste, but there is a lack of
service provision. In addition, a business would expect to pay a reasonable charge for the collection and disposal
of its waste, while the service provider will need to make an accurate assessment of the resources needed to run
the service, calculate the costs and estimate the revenues.
WRAP identified that further work was required to determine the financial business case for the provision of food
waste collections to SMEs, particularly those in the hospitality sector, through the identification and analysis of a
selection of potential service models for a range of business types.
This piece of research was commissioned with the aim to gather information about the main food waste collection
service models available and, for these, produce a cost model that would help determine the key variables that
affect the viability of providing food waste collection services for both the contractor (i.e. the service provider)
and the SME (i.e. the service user).
The research also looked at identifying the threshold (e.g. business size, type or food waste yield generated) at
which a food recycling service is likely to be viable. Where the business case for a regular food recycling
collection might not stack up for a business, a range of potential alternative options for recycling of food waste
has been considered.
The scope of the work was limited to the use of existing data, therefore excluding primary research. The work of
the project team was assisted by an Industry Panel composed of four senior representatives of companies
undertaking food waste collections. They provided useful information used in the creation of the model and
acted as a sounding board throughout the project, helping ensure that the outcomes of the cost model were
realistic in the context of the current waste collection industry.
2.0 Methodology
The project was undertaken in five phases:
1. Set up of the Industry Panel
2. Review of existing data
3. Identification of service options to model
4. Development of the model
5. Review of alternative options for SMEs producing limited amounts of food waste
2.1 The Industry Panel The remit of the Industry Panel was to help develop and then sign off the assumptions at the different stages of
the work. Specifically, the Panel assisted with the selection of the service options to model, reviewed the data
assumptions and the model outcomes, and provided input into the identification of alternative options for SMEs
generating insufficient amounts of food waste to justify a dedicated collection service.
The Panel comprised Bill Swan, Director of Paper Round, Steve Longdon, Director at May Gurney, Dean Pearce,
Regional Account Manager of PDM Group and Michael Cox, Head of Optimisation and Trading for SITA UK.
1 UK Organics Survey 2009, http://www.organics-recycling.org.uk/dmdocuments/2009_Organics_Report_Final.pdf 2 Collecting food waste from small businesses and schools, WRAP, 2010, http://www.wrap.org.uk/local_authorities/research_guidance/food_waste/sme_and_schools_food.html 3 The composition of waste disposed of by the UK hospitality industry, WRAP, July 2011.

Food Waste Collections to SMEs: Developing the Business Case 6
These four companies offer food waste collection services to businesses using a variety of systems, ideally
positioning the Panel members to provide hands on technical advice on operational issues, as well as their
strategic views on the key elements that make a service viable and sustainable over time.
The project team engaged with the Industry Panel mainly through conference calls, but three meetings were also
held with specific members of the Panel during the project.
2.2 Review of existing data
The next phase of the project was to gather information and data from existing reports (full list provided in
Appendix 1) to help identify a reasonable number of service options and key assumptions and base data to be
used in the model.
With regards to the service options, the review of existing information provided an initial set of data on a number
of schemes that are either in place or are being/have been trialled. The outcome of this review was that due to
the different characteristics of these schemes and the fact that their set up tended to be dependent on local
factors, the best way to select a limited number of realistic, generic service options to model would be through a
discussion with the Industry Panel. More details on the service options identified are provided in section 2.3.
In terms of key assumptions for total waste arisings, waste composition and size of establishments to be
modelled, a report (July 2011) by WRAP which assessed the composition of waste disposed of by the UK
hospitality industry4 was the most useful data source. Alternative sources of information on waste arisings were
used to cross check the quantities drawn from this report5.
The approach to selecting the type and size of establishments to model was considered particularly important as
it would have direct implications on the complexity of the cost model. More specifically, the UK hospitality
industry report broke down the hospitality sector as outlined in Tables 1 and 2.
Table 1: WRAP Hospitality Industry Report 2011 - ONS individual site count of hospitality
businesses in the UK for the four subsectors of interest (March 2009) by size-band (number of
employees) 6
Subsector Employee size-band
0-9 10-19 20-49 50-99 100-249 250+ Total
Hotels 5,975 2,245 2,330 1,100 555 85 12,290
Pubs 33,675 8,435 4,790 340 20 10 42,270
QSRs 27,335 1,895 725 75 10 0 30,040
Restaurants 29,525 7,170 5,200 1,280 155 20 43,350
Total 96,510 19,745 13,045 2,795 740 115 132,950
Table 2: WRAP Hospitality Industry Report 2011 - Average total waste per company for each
sample cell (tonnes per year)7
Sector Employee size-band
1-9 10-19 20-49 50-99 100-249 250+
Hotels 11 32 40 129 152 339
Restaurants 9 38 97 18 69 251
QSRs 6 18 54 112 262 375
Pubs 24 61 53 108 262 375
4 The Composition of Waste Disposed of by the UK Hospitality Industry, WRAP, July 2011. 5 Including: WRAP, SME Food Waste Collection trials - Bath and Bristol Final report (0004014), 2007; Resource Futures, The Promotion of tourism waste recycling and business resource efficiency in Cumbria, 2007; Remade South East, The Viability of Food Waste Collections from Businesses, 2011; LDA Park Royal trial : ‘London Food – Central Kitchen and Industrial Food Waste Collection Pilot’, 2010; Bexley trial: ‘Trade Waste Recycling Collection Service – London Borough of Bexley’, 2008; SME Recycling Feasibility trial – West Yorkshire, East Lancashire & the East of greater Manchester, 2007 6 Ibid, table 15, page 35. 7 Ibid, table 18, page 37.
Food Waste Collections to SMEs: Developing the Business Case 7
Based on this information, the decision was made to limit the size and categorisation of establishments for the
study for the following reasons:
The 250+ category was excluded from the model by default as 250 employees is the upper limit for a
company to be considered an SME8
It was decided to focus the model on the 1-19 SME size band only. This is because SMEs with between 1 and
19 employees, according to Table 1, account for 88% of the total number of SMEs in the hospitality sector.
This was considered to be sufficient to meet the objectives of the project and broadening the scope to include
the larger SMEs would have added considerable complexity to the model which was not considered to be of
significant additional value.
In order to limit the complexity of the model, and in the light of the fact that collection rounds will normally
have a variety of types of businesses, it was decided not to differentiate between the type of SME in the
model, but rather to take a weighted average of the weight and composition data for the types of SME.
With regards to the other assumptions for the model, most of these (e.g. vehicle operational costs, frequency of
collections, container types, etc.) were agreed during discussions with the Industry Panel, based on their direct
experience of the services they run (more details are provided in section 2.5).
The model requires the time taken to service each establishment and move onto the next. Only qualitative
observations were available for this; therefore, times for these activities could only be estimated indirectly based
on the number of establishments that experience suggests it is possible to service in a day. Ideally, direct
monitoring of these times would be carried out to provide more robust data; however, as the same values are
used across the options operating the same service including the baselines and comparable timings are used in
the other options, the estimates will not affect the relative costs of the different options.
The assumptions described above ensured that a simple to use high level model, relevant to the quality of the
input data, was developed. We have confidence in the model outputs and accuracy based on the agreed
assumptions based on Industry Panel and WRAP experience.
Ideally, more detailed data, broken down into the different collection activities, e.g. moving between the vehicle
and the bin, driving between establishments, etc., could be researched, which would enable a greater level of
accuracy for the projections.
2.3 Identification of service options to model
The service options to be modelled were identified during discussions with the Industry Panel using information
from existing research documents and the Industry Panel’s experience of collecting food waste. Two main service
types were selected:
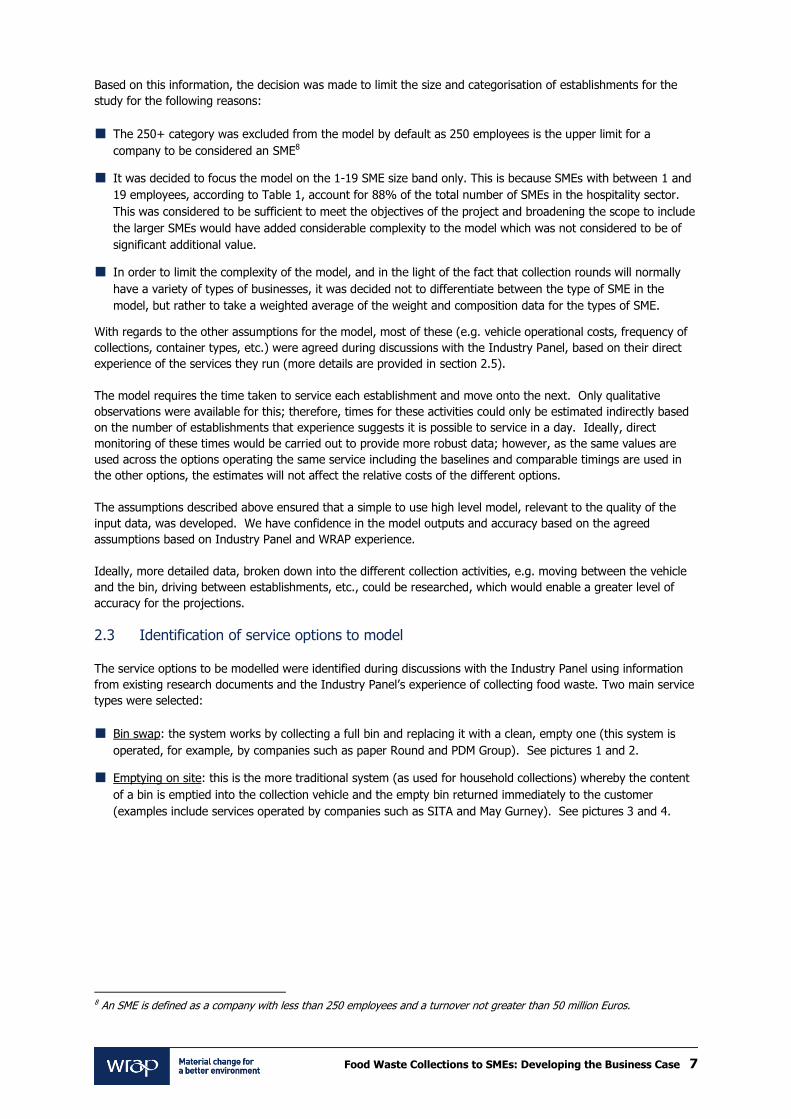
Bin swap: the system works by collecting a full bin and replacing it with a clean, empty one (this system is
operated, for example, by companies such as paper Round and PDM Group). See pictures 1 and 2.
Emptying on site: this is the more traditional system (as used for household collections) whereby the content
of a bin is emptied into the collection vehicle and the empty bin returned immediately to the customer
(examples include services operated by companies such as SITA and May Gurney). See pictures 3 and 4.
8 An SME is defined as a company with less than 250 employees and a turnover not greater than 50 million Euros.

Food Waste Collections to SMEs: Developing the Business Case 8
Pictures 1 and 2: Examples of bin swap schemes
PDM Group Paper Round
Materials collected:
food waste
Vehicle used:
Box vehicle
Containers provided:
120L /240L wheeled bins
Pictures 3 and 4: Emptying on site schemes operated by SITA UK and May Gurney
SITA UK
Materials collected:
food waste and glass
Vehicle used:
three compartment top-
loader
Containers provided:
120L /240L wheeled bins and 10L / 23L caddies
May Gurney
Materials collected:
food waste and other recyclables
Vehicle used:
Multi compartment top-loader
Containers provided:
120L /240L wheeled bins and 10L / 23L caddies

Food Waste Collections to SMEs: Developing the Business Case 9
Within these two main service types, appropriate material stream combinations, vehicle and container types and
treatment options were identified. These are summarised in Figure 1.
Figure 1: Food waste service options flowchart
The various possible service combinations were simplified into six service options for inclusion in the cost model,
evaluated against two baselines:
Baseline 1: dry recyclables (paper, card, plastic bottles, glass bottles, metal and aluminium cans) & residual
waste
Baseline 2: mixed residual waste only
The different baselines and service options included in the model are listed in Table 3.
The reason for using two baselines is that, due to the pre-treatment of waste obligations9, it should be expected
that an SME will be receiving some type of recycling service, hence the inclusion of baseline 1. On the other
hand, some of the food waste service options modelled for this study don’t include the collection of dry
recyclables and, therefore, it was considered useful to be able to model them against a baseline excluding dry
recyclables.
It is worth pointing out that, from an operational perspective, compacted cardboard could be easily added as a
stream to either a bin swap round or even to an emptying on site round using a multi-compartment vehicle.
However, earlier research10 indicates that only 0.8% of businesses in this sector have compacting equipment, and
it was considered that these were most likely to be the larger ones (e.g. large hotels with compactors), rather
than businesses with 1 to 19 employees. Therefore it was not considered of enough relevance or value to include
cardboard as an option in the cost model.
9 http://publications.environment-agency.gov.uk/PDF/GEHO0507BMQM-E-E.pdf 10 The Composition of Waste Disposed of by the UK Hospitality Industry, WRAP, July 2011.

Food Waste Collections to SMEs: Developing the Business Case 10
Table 3: Service options chosen for use in cost model
Stream 1 Stream 2 Vehicles Containers
Baseline
1
Mixed dry recyclables Residual waste after
mixed dry recyclables
removed
Single back 11t payload
RCV for both streams
Stream 1: 240L
Stream 2: 1100L
Baseline
2
Mixed waste only
(i.e. no recycling)
n/a Single back 11t payload
RCV
1100L
Option 1 Food waste
dedicated vehicle
Residual waste after
food waste removed
Stream 1: dedicated food
waste vehicle 3.5t payload
Stream 2: Single back 11t
payload RCV
Stream 1: 120L or
240L
Stream 2: 1100L
Option 2 Food waste & glass -
toploader
Residual after food
waste & glass removed
Stream 1: twin
compartment, 11t payload
toploader
Stream 2: Single back 11t
payload RCV
Stream 1: 120L or
240L
Stream 2: 1100L
Option 3 Food waste & dry
recyclables – pod
vehicle
Residual after food
waste & dry recyclables
removed
Stream 1: split back 11t
payload RCV with front
pod
Stream 2: Single back 11t
payload RCV
Stream 1: 120L or
240L
Stream 2: 1100L
Option 4 Food waste &
residual waste – pod
vehicle
n/a Split back 11t payload
RCV with front pod
Food waste: 120L
or 240L
Residual waste:
1100L
Option 5 Bin swap food waste
only – box vehicle
Residual after food
waste removed
Stream 1: 3t payload box
vehicle
Stream 2: Single back 11t
payload RCV
Stream 1: 120L or
240L
Stream 2: 1100L
Option 6 Bin swap food waste
& glass – box vehicle
Residual after food
waste & glass removed
Stream 1: 3t payload box
vehicle
Stream 2: Single back 11t
payload RCV
Stream 1: 120L or
240L
Stream 2: 1100L
2.4 Development of the model
In developing a suitable Excel model, a key consideration was the level of detail and accuracy of the data
available to populate the model. Initially, it was planned to develop a model that considered different types and
sizes of SME individually; however, it became clear that the operational data necessary to populate such a model
e.g. collection times for servicing buildings, is not currently available. Previous WRAP research also faced
problems with gaps in operational data and estimates had to be made. Thus, a simpler model, based on the
assumptions outlined in Section 2.2, was developed.
The model comprises four parts:
The first considers the operation from the SME’s perspective, i.e. the volumes of waste arising and the
number of bins required to accommodate the waste at particular collection frequencies
The second part considers the operation from the contractor’s perspective, i.e. how many SMEs can be
serviced a day, by one collection vehicle
The third part considers the post collection costs such as transfer, treatment, disposal and landfill tax
Finally, the last section summarises the costs and calculates a total weekly cost per establishment for each
service option.
In all parts the primary categorisation of the service is with respect to the collection vehicle type.

Food Waste Collections to SMEs: Developing the Business Case 11
In each part there are a number of data provided from reference sources, e.g. composition and quantities arising,
type and capacity of collection vehicles. There are also fields in which scheme-specific data can be entered, e.g.
number of each type of bin, hours worked a day, etc. Finally, there are cells containing formulae that are used to
make projections based on the input data. The reference data on composition, bins and vehicles are contained in
separate pages in the excel workbook and can be easily accessed and used/updated by the user. Data fields
where scheme-specific data can be entered are white, while those containing formulae are pale blue (detailed
instructions on how to use the model are provided in a specific worksheet within the excel workbook).
More details on each section of the model are provided below.
2.4.1 Part 1: the SME The relevant fields and the inputs for the baseline and first service option are summarised in Figure 2 (Note: the
numbers in the example are illustrative only and do not represent a particular service option in the report - final
results for the service options considered are presented in Section 3).
Figure 2: The cost model – Part 1: the SME
Based on the data entered on the waste arising, the number and type of bins and the collection frequency, the
model calculates the weight and volume of the different streams that must be collected each day. It also
calculates the utilisation of the bins. It is possible to collect up to 2 different streams in each vehicle.
2.4.2 Part 2: the contractor The part of the model relevant to the contractor is presented in Figure 3 (Note: again, the numbers in the
example are illustrative only and do not represent a particular service option in the report - final results for the
service options considered are presented in Section 3).
The user can select from a limited number of collection vehicles which are specified in the vehicles page of the
workbook. Based on the type of collection vehicle selected, the working hours, time taken to service each
establishment and the quantities available for collection from each establishment, the model calculates the
number of loads it is possible to collect by a vehicle in a day, with respect to weight, volume and, for bin swap
services, the number of bins it is possible to load on a vehicle. The user should look at these calculations and, if

Food Waste Collections to SMEs: Developing the Business Case 12
necessary, make adjustments to the productive time11 a day to ensure adequate provision is made for unloading
the vehicle (including driving to/from the unloading point). Based on these inputs, the model will also calculate
the number of establishments it is possible to service in a day. The value generated by the model using the pre-
agreed assumptions was discussed and validated with the panel.
Finally, based on the vehicle unit costs included in the database, the model calculates the daily vehicle cost and
also the weekly cost (dependant on the collection frequency).
Figure 3: The cost model – Part 2: the contractor
2.4.3 Part 3: Post collection costs The post collection costs included in the model are presented in Figure 4 (Note: again, the numbers in the
example are illustrative only and do not represent a particular service option in the report - final results for the
service options considered are presented in Section 3).
Figure 4: The cost model – Part 3: Post collection costs
11 Defined as the time spent on the collection round, excluding time spent to drive from the depot to the first customer, to unload and back to the depot at the end of the round.

Food Waste Collections to SMEs: Developing the Business Case 13
The model calculates the total daily and weekly collection costs based on the quantities collected and the unit
costs entered in this part of the model.
2.4.4 Part 4: Final cost summary The final cost summary is presented in Figure 5 (Note: again, the numbers in the example are illustrative only
and do not represent a particular service option in the report. Final results for the service options considered are
presented in Section 3).
Figure 5: The cost model – Part 4: Final cost summary
The user is unable to enter any data in this part of the model except to include a notional profit as it simply
summarises the collection and post collection costs calculated in the earlier parts of the model. The costs are all
consolidated into weekly costs to enable comparison between the costs of collections at different frequencies.
The costs are presented broken down in a number of ways that relate to how the service is provided (e.g. cost
per lift, cost per visit, etc.) and as the total service cost. Where more than one stream is collected, the cost to
collect each stream is presented and then the consolidated cost for all the streams is calculated.
Caution is needed when looking at the costs, with the most useful figure for comparison being the ‘Total weekly
service cost per establishment for all collected streams’. The cost per lift can be misleading as illustrated in the
example above: here, the cost per lift in Service Option 2 is higher than in Service Option 3, due to the fact that
Option 3 requires more lifts than Option 2 (i.e. the total service cost is divided by a greater denominator).
However, the total service cost per week for Service Option 2 is actually lower than the total service cost for
Service Option 3, because the higher cost per lift is more than offset by the lower overall cost due to fewer lifts
required. Ultimately, it is the total service cost (or charge) which the SME will have to pay, and the contractor
will receive, that is relevant. The cost per lift is simply a way of charging for the service which is why it is
included in the presentation of the model outputs.
2.5 Model assumptions
In addition to assumptions on waste arisings and composition as described in section 2.2, the other main
assumptions used in the model relate to vehicles (both capital and operational costs), crews, containers,
operations timings, treatment/disposal costs and other costs (e.g. account management, marketing, etc.).
In a number of situations during our discussions with the Industry Panel members, it was only possible to identify
a range of values rather than an average value to use in the model, due to the different characteristics of the
services they provide. A typical example refers to the time to collect from one premise and drive to the next one,
which affects the total number of premises that can be served per day; it became clear that this can vary
significantly, depending on the type of environment where collections are undertaken and the type of collection

Food Waste Collections to SMEs: Developing the Business Case 14
service offered. As it was not possible to agree a value that was considered realistic or average for all services, a
range of between 6min and 11min was used in the model.
On other elements, though, there was general consensus by the panel, for example on the treatment costs of
food waste at IVC and AD (£50/tonne and £43/tonne respectively, which is in line with WRAP’s 2011 Gate Fees
Report), or on the types of containers used, these being 120l or 240L wheeled bins.
A summary of the main assumptions used for the model is provided in Appendix 2.
3.0 Model outcomes
3.1 Relative costs of different food waste collection options Based on the above assumptions, the costs for the different food waste service options are summarised below.
These projections have been reviewed by the Panel who have confirmed that they are realistic ballpark estimates.
Table 4: Cost of food service options
Stream 1 Stream 2 Total cost per establishment
Per week Per annum
Option 1 Food waste dedicated vehicle
Residual waste after food waste removed
£48.31 £2,512.12
Option 2 Food waste & glass -
toploader
Residual after food
waste & glass removed
£48.03 £2,497.56
Option 3 Food waste & dry
recyclables – pod vehicle
Residual after food
waste & dry recyclables removed
£50.94 £2,648.88
Option 4 Food waste & residual
waste – pod vehicle
n/a £50.31 £2,616.12
Option 5 Bin swap food waste only – box vehicle
Residual after food waste removed
£50.20 £2,610.40
Option 6 Bin swap food waste &
glass – box vehicle
Residual after food
waste & glass removed
£52.28 £2,718.56
Overall, the results from the model suggest that the costs of the alternative food waste collection service options
(Options 1 to 6) are in the same ballpark, ranging from £48 to £52 per week per establishment.
This confirms the Panel’s view that, if there were a service option much cheaper than the others, everyone would
be providing that same service, which of course is not the case.
It is worth noting that these results are based on a number of assumptions that, even though realistic and
validated by the Industry Panel, are necessarily the result of a generalisation. The sensitivity of some of these
assumptions should be considered when analysing the results of the model, a key one being the time required to
collect from one premise and move to the next. In this respect, the figures used in the model to generate the
results outlined in Table 5 are based on an assumption that the time required to service one premise and move to
the next is, for example, 6 minutes for Service Option 2 (the least expensive option according to the model) and
11 minutes for Service Option 6 (the most expensive one). An increase of just a couple of minutes for Service
Option 2, though, would make the service cost per establishment jump to £53, making it become the most
expensive of the options.
Additional commentary on the possible interpretations of the model results and on the desirability of undertaking
further research is provided in Section 5.

Food Waste Collections to SMEs: Developing the Business Case 15
3.2 Comparison of food waste service options with no food waste service baselines
Tables 5 and 6 look at how the food collection service options compare to the no food waste collection baseline
options.
More specifically, Table 5 compares the baseline of mixed residual waste only with services were food waste
collections are introduced as either emptying on site or bin swap. As it can be seen, the options with food waste
collections are more expensive than the residual waste only service, between 7.5% and 12%.
Table 5: Comparison between ‘residual waste only’ baseline and ‘residual waste plus food waste
service’ options
Stream 1 Stream 2
Total cost per establishment
Additional cost for collecting
food waste Per week Per annum
Baseline
2
Mixed waste only
(i.e. no recycling)
n/a
£44.93 £2,336.36 n/a
Option 1 Food waste
dedicated vehicle
Residual waste
after food waste removed
£48.31 £2,512.12 + 7.5%
Option 4 Food waste &
residual waste – pod vehicle
n/a
£50.31 £2,616.12 + 12%
Option 5 Bin swap food
waste only – box
vehicle
Residual after
food waste
removed
£50.20 £2,610.40 + 12%
Table 6 compares the baseline option of a mixed dry recyclables plus residual waste collection with the option
where food waste is also extracted from the residual waste stream. As it can be seen, the cost of the service
option that includes food waste is only slightly higher (about 4%) than the baseline.
Table 6: Comparison between ‘dry recyclables and residual waste’ baseline and ‘food waste, dry
recyclables and residual waste’ service option
Stream 1 Stream 2
Total cost per establishment
Additional cost for collecting
food waste Per week Per annum
Baseline
1
Mixed dry
recyclables
Residual waste
after mixed dry recyclables
removed
£48.77 £2,536.04 n/a
Option 3 Food waste & dry recyclables – pod
vehicle
Residual after food waste &
dry recyclables removed
£50.94 £2,648.88 4%
Service options 2 and 6 (Table 7) do not compare directly to any of the two baselines (they are effectively in
between baselines 1 and 2, as they collect one recyclable stream in addition to residual waste), but have been
included as they were indicated as realistic services by the Industry Panel. The model shows that Option 2 could
be a viable option as an upgrade from a residual waste only service, while Option 6 comes across as the most
expensive of the options assessed.
Food Waste Collections to SMEs: Developing the Business Case 16
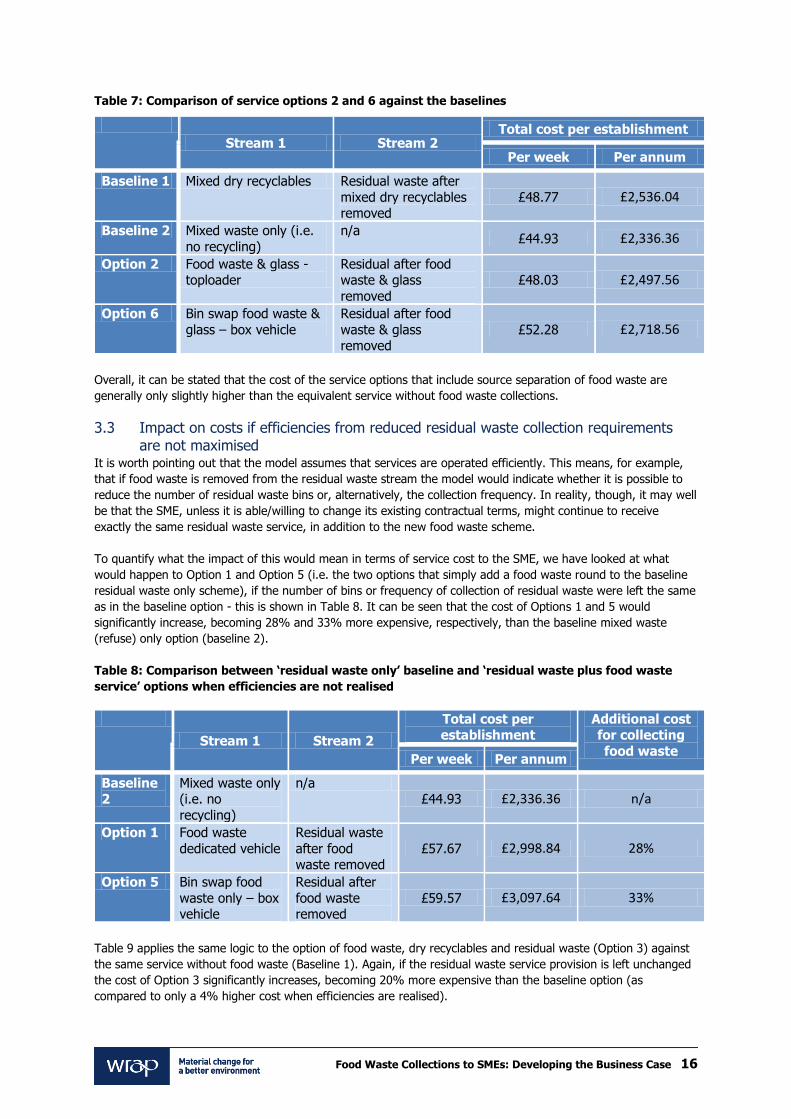
Table 7: Comparison of service options 2 and 6 against the baselines
Stream 1 Stream 2 Total cost per establishment
Per week Per annum
Baseline 1 Mixed dry recyclables Residual waste after
mixed dry recyclables removed
£48.77 £2,536.04
Baseline 2 Mixed waste only (i.e.
no recycling)
n/a £44.93 £2,336.36
Option 2 Food waste & glass - toploader
Residual after food waste & glass
removed
£48.03 £2,497.56
Option 6 Bin swap food waste &
glass – box vehicle
Residual after food
waste & glass removed
£52.28 £2,718.56
Overall, it can be stated that the cost of the service options that include source separation of food waste are
generally only slightly higher than the equivalent service without food waste collections.
3.3 Impact on costs if efficiencies from reduced residual waste collection requirements are not maximised
It is worth pointing out that the model assumes that services are operated efficiently. This means, for example,
that if food waste is removed from the residual waste stream the model would indicate whether it is possible to
reduce the number of residual waste bins or, alternatively, the collection frequency. In reality, though, it may well
be that the SME, unless it is able/willing to change its existing contractual terms, might continue to receive
exactly the same residual waste service, in addition to the new food waste scheme.
To quantify what the impact of this would mean in terms of service cost to the SME, we have looked at what
would happen to Option 1 and Option 5 (i.e. the two options that simply add a food waste round to the baseline
residual waste only scheme), if the number of bins or frequency of collection of residual waste were left the same
as in the baseline option - this is shown in Table 8. It can be seen that the cost of Options 1 and 5 would
significantly increase, becoming 28% and 33% more expensive, respectively, than the baseline mixed waste
(refuse) only option (baseline 2).
Table 8: Comparison between ‘residual waste only’ baseline and ‘residual waste plus food waste
service’ options when efficiencies are not realised
Stream 1 Stream 2
Total cost per establishment
Additional cost for collecting
food waste Per week Per annum
Baseline 2
Mixed waste only (i.e. no
recycling)
n/a £44.93 £2,336.36 n/a
Option 1 Food waste
dedicated vehicle
Residual waste
after food waste removed
£57.67 £2,998.84 28%
Option 5 Bin swap food
waste only – box vehicle
Residual after
food waste removed
£59.57 £3,097.64 33%
Table 9 applies the same logic to the option of food waste, dry recyclables and residual waste (Option 3) against
the same service without food waste (Baseline 1). Again, if the residual waste service provision is left unchanged
the cost of Option 3 significantly increases, becoming 20% more expensive than the baseline option (as
compared to only a 4% higher cost when efficiencies are realised).

Food Waste Collections to SMEs: Developing the Business Case 17
Table 9: Comparison between ‘dry recyclables and residual waste’ baseline and ‘food waste, dry
recyclables and residual waste’ service option, when efficiencies are not realised
Stream 1 Stream 2
Total cost per
establishment
Additional cost
for collecting food waste
Per week Per annum
Baseline
1
Mixed dry
recyclables
Residual waste
after mixed dry
recyclables removed
£48.77 £2,536.04 n/a
Option 3 Food waste & dry
recyclables – pod vehicle
Residual after
food waste & dry recyclables
removed
£58.42 £3,037.84 20%
3.4 Impact of increase in landfill tax Looking at the impact of landfill tax, with the scheduled annual increase of £8/t, the cost of not diverting food
waste from landfill progressively will have a greater impact, with the increase in weekly costs being greater in the
options that divert the least waste from landfill. Looking for instance at 2013, when landfill tax will be £72/t
(from 1st April), everything else being the same the model shows interesting changes in the difference between
service options costs, as outlined in Table 10. In particular:
segregating food waste and glass for collection (Option 2) would become cheaper than collecting mixed waste
only (Baseline 2), and;
a three stream collection service for food waste, dry recyclables and residual waste (Option 3) would become
cheaper than a two-stream collection of dry recyclables and residual waste only (Baseline 1).
Table 10: Service options costs with landfill tax at £72/t (from cheapest to most expensive)
Stream 1 Stream 2
Base cost with landfill tax @£56/t (£/wk)
Landfill tax @£72/t (£/wk)
Option 2 Food waste &
glass - toploader
Residual after food
waste & glass removed
48.02 50.94
Baseline 2 Mixed waste only
(i.e. no recycling)
n/a 44.92 51.31
Option 1 Food waste dedicated vehicle
Residual waste after food waste
removed
48.30 52.16
Option 3 Food waste & dry recyclables – pod
vehicle
Residual after food waste & dry
recyclables removed
50.93 53.79
Option 5 Bin swap food
waste only – box vehicle
Residual after food
waste removed 50.20 54.06
Baseline 1 Mixed dry
recyclables
Residual waste after
mixed dry recyclables removed
48.76 54.15
Option 4 Food waste &
residual waste – pod vehicle
n/a 50.30 54.16
Option 6 Bin swap food
waste & glass – box vehicle
Residual after food
waste & glass removed
52.27 55.19
A more detailed sensitivity analysis is provided in Appendix 3.

Food Waste Collections to SMEs: Developing the Business Case 18
4.0 Alternative options for small SMEs
4.1 Context This element of the research focused on assessing the potential options available to those SMEs whose size
and/or the amount of food waste they produce means that the provision of a separate food waste collection
service would not be deemed to be financially viable. In practical terms, based on discussions with the Industry
Panel, these would be SMEs that would not meet the minimum requirement of needing 1 x 120L food waste bin,
collected once a week, with at least a 40kg/week content. Examples of these businesses might be small sandwich
shops or takeaways where the majority of food preparation is done off site. In addition, it was felt that a
minimum number of about 70 customers would be needed in order to make a round viable, and within these a
couple of large clients on which to build the rest of the round.
To develop these alternative options we undertook desk based research, discussed operational issues with the
Industry Panel and discussed the barriers / opportunities facing SMEs with regard to food waste collections with a
number of Business Improvement Districts (BIDS)12 in London.
4.2 Options
4.2.1 Kerbside collections within main rounds
Description
This option assessed the feasibility of incorporating these smaller SMEs into the collections rounds, as the vehicle
“passes” the premises on its way to larger customers. SMEs could be provided with kitchen caddies (as they may
not have space/requirement for a 120L bin), which they would be instructed to leave out at an agreed location
and on an agreed collection day.
The panel’s feedback
The panel felt that this option would still not be financially viable based on the limited yield versus the time
required to collect. Even though the vehicle would be in the area, the collections would still take time: stopping,
swapping and emptying containers and, according to some members of the panel, leaving consignment notes
(even though others suggested that consignment notes need not be issued every time, just once a year).
It is our view, though, that if the scheme was part, for example, of a collaborative procurement exercise where,
in order to be able to collect from a few large businesses, rounds needed to include a number of smaller SMEs,
this would not be ruled out as unfeasible by the contractors, but rather would need to be assessed on a case by
case basis.
Examples
We are aware that this arrangement has recently been trialled by a number of small SMEs that took part in a
commercial food waste collection trial operated by one of the London BIDs over a period of 9 months. The trial
served 10 businesses in total, made up of five small offices and five larger ones.
The service during the trial was provided free of charge to the SMEs and, from the contractor’s point of view, the
scheme was viable as it guaranteed a number of businesses to collect from each day, allowing for the inclusion of
smaller food waste producers alongside the larger ones, which are the most desirable to the collector.
However, when the trial ended it was clear that the SMEs would not be prepared to pay for the service directly,
as it was considered too expensive. To address this issue, the BID has decided to continue subsidising the
scheme by covering 20% of the service costs, but even this measure has not proven sufficient to prevent
businesses dropping out of the scheme and reverting back to using the residual waste collection service to
dispose of their food waste, as this option is still cheaper to them than the subsidised food waste service.
As an alternative approach, the BID is considering purchasing an IVC unit (rocket) and possibly working with
other local BIDs. It they decide to proceed with this option, they will need to find a site for the IVC and come to
12 Business improvement district (BID) is a defined area within which businesses pay an additional tax or fee in order to fund
improvements within the district's boundaries.
Food Waste Collections to SMEs: Developing the Business Case 19
an arrangement about how and / or who will operate it (they will need a collection contractor, a team to operate
the IVC and will need to consider health and safety and relevant legislation such as the Animal Bi-Products
Regulations (ABPR)). In addition, they will also need to identify funding to cover the capital costs.
4.2.2 Collection from central bin store area
Description
This option would see a number of small SMEs that share waste bin facilities and/or bin storage areas being
provided with access to a food waste container. It is an option for businesses located within a shopping centre or
businesses within a BID located within a block managed by a facilities manager. Internal arrangements would
need to be made to bring the food waste from the individual premises to the shared bin, normally by a back door
collection round operated by the facilities management company to take the kitchen caddies/wheeled bins to the
central location, to be then collected by the waste management contractor.
In this option the volume of food waste available for each collection would be increased above the threshold at
which the collection becomes financial viable for the waste collectors.
The panel’s feedback
There are no insurmountable operational obstacles with this option. The panel did however raise a number of
issues that would need to be addressed by the shopping centre manager / facilities manager internally:
It is unlikely that the waste contractors would split invoices between a number of companies, especially as the
value of the contract could be low. This option therefore requires one company / organisation to take
responsibility for paying the invoice. Where a shopping centre, BID or facilities manager is in place, then it
could be their responsibility to pass on the service costs as appropriate to the premises using the service.
A key concern of the experts was the quality of the food waste in a shared bin(s) and the ability to identify
the origin of any contamination. Following on from this would be how to re-charge users if the food waste
was so contaminated that the contractor charged more for handling the waste.
As mentioned previously, the manager responsible would need to make arrangements for transporting the
food waste from the individual premise to the shared bin(s). If may be that the arrangements already in
place for transporting other waste streams, e.g. recycling and refuse could be utilised to also transport the
food waste.
Training for participating business and cleaners (where appropriate) would be required to ensure the success
of the scheme and cover off health and safety. Agreements for managing contamination should also be
included and communicated to all participating businesses prior to launching the scheme.
Examples
We spoke to Hammerson Plc., a company that manages shopping centres such as The Oracle in Reading where
food waste collections are in place. The spokesperson confirmed that the scheme at The Oracle is working well
and that Hammerson’s plans to develop food waste collection services at their shopping centres nationwide.
The operational set up is as follows:
The businesses within the shopping centre are each charged a fraction of the overall waste management
costs as part of their service charge costs
Those businesses producing food waste put it in kitchen caddies/wheeled bins and bins are placed outside
their premises
A back door collection service operated by the shopping centre facilities manager collects the caddies/bins
from each premise and takes them to a central location
The contractor then collects the food waste containers from this location
While the option of each business taking its own waste to the central location is also a possibility, Hammerson
stated that, due to the potential leakage from the food containers, they would always try to set up the scheme so
that back door collections are in place.

Food Waste Collections to SMEs: Developing the Business Case 20
Another key point made was that the collection contractor needs to be able to accept packaged food waste. This
implies the need for a de-packaging unit at the treatment site. Packaged food will also significantly change the
bulk density and therefore the container requirements.
From the shopping centre management’s point of view, the incentive of introducing food waste collections is
twofold: it helps achieve Corporate Social Responsibility (CSR) objectives and, in Hammerson’s experience, can
also provide cost savings.
4.2.3 Bring sites
Description
Communal bins are located on the street / outside the boundary of a particular premise, with participating
premises transporting their food waste to the bin.
The panel’s feedback
As with the shared bin option, the experts confirmed that they see no operational obstacles with serving a bring
site for food waste (for each specific site/scheme, though, there would be the need to consult with the relevant
local authority department - highways, planning, etc. – as well as with any other relevant departments such as
the Police, Fire Brigade, Animal Health, etc and check planning, permitting and duty of care requirements). The
same issues mentioned for the shared bin option, though, are applicable to the bring site option, i.e. managing
charging for the service, taking responsibility for the quality of the food waste and transporting the food waste to
the bin(s). However, the solutions are different:
Managing charging and payment for the service and quality of food waste; unless there is a BID operating in
the area it is difficult to identify an appropriate person to take overall responsibility for managing the service.
Transporting waste to the bin(s); since it is unlikely that the users of the bins will have shared cleaners whose
responsibility is to transport waste, someone within the participating businesses or their individual cleaners
would need to transport the food waste to the bin(s).
In addition to these points, the location of the bin(s) would need to be carefully considered. The needs of the
businesses, i.e. a bin conveniently located so that waste does not need to be transported too far and easily
accessible, would need to be weighed up against the need to keep the bins secured so that the public cannot
access them. For a street of businesses participating in the service it may be worth considering siting a
number of bins along the street however, Council Highways departments may have issues and will need to be
consulted. Bins will also need to be secure to comply with ABPR.
Examples
We are unaware of any examples at present, although we are aware that the idea of a central residual bin is
being trialled and operated in a couple of authorities13.
4.2.4 Onsite composting Description
This option would be similar to the one described in section 4.2.2, with the difference being that instead of
having the individual food waste containers taken to a central bin store area for collection by a contractor, the
material would be composted directly on site. There are a number of onsite composting options, typically
variations of an in-vessel composter, that could be installed and made accessible to SMEs - these include the
Rocket and the Big Hannah.
The panel’s feedback
The panel was sceptical about on-site composting as they consider it expensive and operationally complex. They
stated that this complexity includes the need for carefully managing the mix of food waste input material and the
additional requirement for wood chip to be part of the input mix. In addition, it needs a technically competent
resource to manage the equipment on an on-going basis and to deal with the outputs generated, including
finding an appropriate use. This, coupled with the cost of the units themselves, according to the Panel makes this
service option not commercially viable for them.
13 WIN case study October 2010: Communal Containers in City Centres – Brighton & Hove and Bristol pave the way and reap the benefits! http://www.eastmidlandsiep.gov.uk/uploads/Waste-%20Becky%20/Communal%20Containers%20in%20City%20Centres.pdf

Food Waste Collections to SMEs: Developing the Business Case 21
However, WRAP has undertaken work on this subject and the model has proved suitable for certain
businesses/organisations, and there are indeed examples where a central composting unit is being used
successfully (e.g. at the O2 Arena – more information below). Therefore, this model should not be completely
dismissed as an option for dealing with food waste in specific situations.
Examples
In November 2009 Furniture Now! began a food waste composting scheme as a joint project with East Sussex
County Council and its French partners SMEDAR, and Transition Town Lewes as a solution to composting catering
waste from a number of local businesses. The scheme was a pilot funded by the European Union but, when the
funding ended the trial also terminated. This is because, even though Furniture Now! looked at the option of
continuing with the scheme, their conclusion was that the scheme was too expensive to be funded by the
businesses alone, due to the amount of resources required to operate the composting unit.
Other examples that were referred to in a previous WRAP report14 outline the outcomes of a series of trials using
rockets and in-vessel composting units for hotels and educational establishments. Some of the trials were not
successful due to issues such as management requirements for the units and issues with feedstock leading to
odour problems.
We were unable to identify other examples of situations where a number of SMEs are sharing one of these
composters currently. However, a number of commercial premises use in-vessel composters to dispose of the
food waste they produce. The O2 Arena has installed an in-vessel composter (“Big Hannah”). This has the
capacity to recycle around half of the food waste that the Arena concessions generate15.
5.0 Conclusions and recommendation
The aim of this research was to gather information about the main food waste collection service models available
and, for these, produce a cost model that would help determine the key variables that affect the viability of
providing food waste collection services from both the perspective of the contractor providing the service and the
SME as the service user.
In addition, it looked at the situation where SMEs might not have enough material to justify a dedicated food
waste collection, and considered the viability of alternative options that may be available.
5.1 Cost model The main conclusions from the cost model are that:
1. The different food waste collection options modelled have, overall, similar service costs
2. The addition of a new food waste collection service should be able to be provided to an SME at a similar
overall cost to a baseline situation where a dry recyclables and residual waste service is provided
3. This is based on the proviso that efficiencies across the different waste streams are maximised - the addition
of a separate food waste collection without making changes to the refuse service to take advantage of the
reduction in service requirements will otherwise add a significant cost
4. Future scheduled increases in landfill tax and higher gate fees in some regions could make the overall service
cost lower for a system that includes the separate collection of food waste compared to one without the
separation of food waste
With regard to the different collection options, this confirms the Industry Panel’s view that there are a number of
available service options which do not have a particular advantage one over the other, but may be more or less
suitable in a specific situation depending on local conditions. The only exception is the option of food waste plus
glass collections using bin swaps, which consistently was the most expensive option throughout the sensitivity
analysis, and therefore considered to be the least attractive to SMEs.
Regarding the comparison with the baseline options, one reason for this similarity in costs, despite the
introduction of an additional service, is the reduced collection requirement for the residual stream when collected
14 Feasibility trials to increase and improve recycling collection services to small and medium-sized enterprises – options for disposal of food waste from the hospitality sector, WRAP, March 2008. 15 http://www.imco.co.uk/cateringcasestudies/foodwasteato2

Food Waste Collections to SMEs: Developing the Business Case 22
alongside a food waste collection, which we consider to be a reasonable assumption as the model focuses on
small size SMEs in the hospitality sector, i.e. with large percentage of food waste. Furthermore, the reliability of
the results is reinforced by the assumption made that the collection time for food waste (i.e. the time to serve
one premise and drive to the next) will be the same as for residual waste. This is a conservative assumption, as
there are likely to be more bins to empty for residual waste than for food waste. However, in the absence of
actual measured data we felt it was best to make this assumption.
Additional factors that point towards the viability of food waste collections in the future relate to the yearly
increase in landfill tax, which will make disposal of residual waste progressively more expensive, and the potential
additional benefits of being able to send the residual waste to a ‘dirty MRF’ for further sorting rather than directly
to landfill, thereby saving on landfill gate fees and tax. This is because, as explained by the Industry Panel, once
food waste (and dry recyclables) is removed from the residual waste stream, what is left is a stream very similar
to dry recyclables, only of lower quality. Considering these potential savings would have further contributed
towards a lower service cost for food waste collections as opposed to residual waste. However, this factor has not
been included in the modelling as facilities of this type are limited in the UK and, therefore, it cannot be assumed
that this option would be available generally.
Overall, while the outputs of the model suggest that SMEs should be able to be offered the option of separating
their food waste for collection at sensible costs, this conclusion is based on generalised assumptions which will
vary between areas.
5.2 Small SMEs It was considered by the Industry Panel that there is a tipping point at which some businesses are generating too
little food waste to make a dedicated collection scheme cost effective for them. It was established that typically
this would equate to an SME not producing enough material for a 120L food waste bin, collected once a week,
with at least a 40kg/week content.
In this situation, the two most practicable available options are:
A kerbside collection where this can be part of a round servicing larger food waste producing SMEs or other
organisations
Collection from central bin store area
Examples of schemes such as the above normally involve an SME being part of a wider scheme coordinated, for
example, either by a Business Improvement District (BID) or by a shopping /business centre. Not every SME,
though, will be able to join a BID or will be part of a shopping centre and, even so, experiences of existing
schemes are varied, with examples of shopping centres running operationally successful and financially cost
effective schemes contrasting with the experience, for example, of a BID where, at the end of a free food waste
collection trial, businesses reverted back to placing their food waste in the residual waste bin as despite a 20%
subsidy by the BID this remained a cheaper option.
Further research is required to gain a better understanding of why these differences in the viability of schemes
exist, ideally by reviewing new and established services where both the operational and financial aspects of the
schemes can be considered. The WRAP-funded food waste collection demonstration projects will provide useful
data on scheme performance and the types of businesses taking up food waste collections. WRAP also is giving
further consideration to collaborative procurement options of collection services.

Food Waste Collections to SMEs: Developing the Business Case 23
Appendix 1: Literature reviewed
UK Organics Survey 2009, http://www.organics-recycling.org.uk/dmdocuments/2009_Organics_Report_Final.pdf
Collecting food waste from small businesses and schools, WRAP, 2010,
http://www.wrap.org.uk/local_authorities/research_guidance/food_waste/sme_and_schools_food.html
The composition of waste disposed of by the UK hospitality industry, WRAP, July 2011
WRAP, SME Food Waste Collection trials - Bath and Bristol Final report (0004014), 2007
Resource Futures, The promotion of tourism waste recycling and business resource efficiency in Cumbria, 2007
Remade South East, The Viability of Food Waste Collections from Businesses, 2011
LDA Park Royal trial: ‘London Food – Central Kitchen and Industrial Food Waste Collection Pilot’, 2010;
Bexley trial: ‘Trade Waste Recycling Collection Service – London Borough of Bexley’, 2008;
SME Recycling Feasibility trial – West Yorkshire, East Lancashire & the East of greater Manchester, 2007
WIN Case Study October 2010: Communal Containers in City Centres – Brighton & Hove and Bristol pave the
way and reap the benefits!
Thriving partnership boosts commercial food waste recycling, WRAP, 2009.
Dorset County Council, Commercial Food Waste Study – Final Report, SLR, 2008.

Food Waste Collections to SMEs: Developing the Business Case 24
Appendix 2: Cost model assumptions
based on Industry Panel experience
Food waste density:
Density Average density of 500 - 550 kg/m3 (550 was used in the model to match the one used in another WRAP project16)
Potential bin weight when completely full
A 500 kg/m3 would mean that a completely full 240 litre wheeled bin weighs: (240L x 0.001m3) x 550 kg/m3 = 120kg – using 550kg/m3 this raises to 132kg A full 120L bin = 60 kg at 500kg/m3 and 66kg at 550kg/m3
Realistic bin weight
A realistic assumption is that a bin will be 75-80% full, so a full 240L bin would weigh around 100/105kg and a 120L 50/52kg (at 550 kg/m3 food waste density)
Note It is worth noting though that food waste density varies depending on the type of food material collected. Specific waste streams such as abattoir waste (such as the one that PDM collects) would be heavier than the above estimates.
Rounds and bins
Bin swap Emptying on site
Full truck Food waste
50 to 55 bins volume capacity
2.5 – 3.5 tonnes payload for a 7.5t chassis
Generally bin volume capacity reached first than weight capacity, but not always like that
Food waste
Many sizes of top loader – 8t to 26t chassis
Crew size Driver Only Driver + 1
Bins Either 120L or 240L for food waste – larger volumes would cause the bins to be too heavy
Normally a company would have the same type and size of bin for a certain material (i.e. either all 120L or all 240L bins for food waste, not a mix). It normally applies to both food waste and residual.
On a bin swap round, glass would normally be on collected in a 240L bin
Note Space is a big issue for premises, in terms of specifying number and type of container that can be provided
Minimum number of customers to justify purchase of vehicle and hiring of crews is about 70 premises, with one or two large customers and the remainder a mix of small and medium sized businesses
16 Collection of food waste from flats: research to identify current practices for collection and average collection times.

Food Waste Collections to SMEs: Developing the Business Case 25
Operations timings
Time spent driving to first collection point (minutes)
10min to 40min (25min used in model)
Time spent driving to tip (minutes)
15min to 20min but depends on traffic – can be longer (20min used in model)
Time spent to unload (including any waiting time) (minutes)
10min to 30min (20min used in model)
Time spent driving back to round
Same as time spent driving to tip
Time spent to service a premise Between 5min and 15min depending on number of bins and access (6 – 10 min used for the cost model as focused on small SMEs)
Total productive time (hours) Average is between 5h30min and 6h30min /day depending on the number of loads
Vehicle and crew costs
Depreciation period 7 years
Interest 7%
Working days a year 312 days/year, assuming the vehicle working 6 days a week
Annual cost of driver Approx. £25K to £30K depending on licence required, including N.I. and average sick leave
Annual cost of a crew member Approx. £20,000
Annual operating costs (fuel, insurance, maintenance)
£15K to £35K depending on vehicle type
Annual supervision costs £5,000
Other annual costs About £200/account per year to cover Account Manager costs and another £100/account for year for miscellaneous costs
Disposal costs
Food waste – at IVC Food waste to AD
£50/tonne £43/tonne (gate fees starting to go down due to new facilities being built)
Landfill gate fee: Landfill tax
£20 to £25/tonne in the South East; £10/tonne in the Midlands £56/tonne (rate for 2011/12)
Transfer station costs: £6/tonne for use of transfer station – up to an additional £15/tonne for transport to treatment plant once bulked (commercial rate)
This does not apply if companies have their own treatment facilities on the same site as the transfer station.
Note:
It was pointed out that the value of reducing contamination from the different waste streams by introducing collections of certain key materials should be considered. For example, by introducing separate food waste and glass collections, this has a significant impact on the quality of:
Mixed dry recyclables – as by removing the glass, quality of the paper increases and sorting costs decrease
Residual waste – by removing the food waste, what is left is a dry material similar to low quality dry recyclables that could be sent to a dirty MRF for further material recovery, rather than to landfill (dirty MRF gate fee in London is around £60/tonne London)
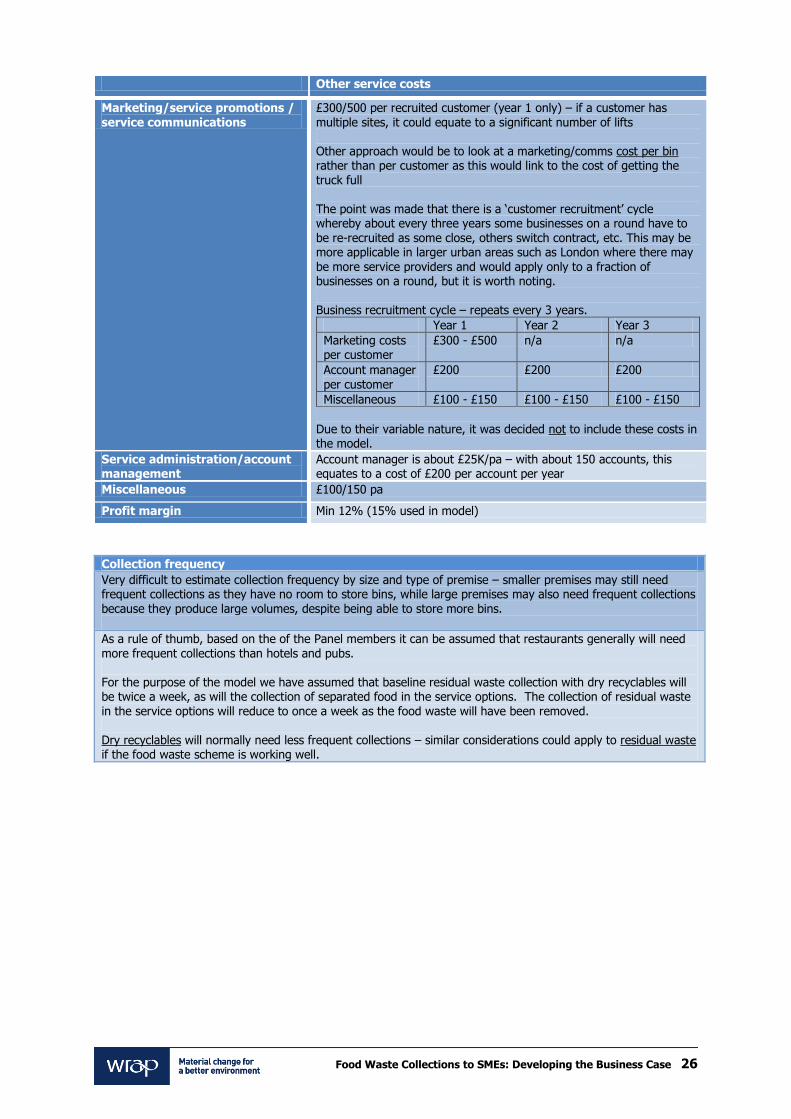
Food Waste Collections to SMEs: Developing the Business Case 26
Other service costs
Marketing/service promotions / service communications
£300/500 per recruited customer (year 1 only) – if a customer has multiple sites, it could equate to a significant number of lifts Other approach would be to look at a marketing/comms cost per bin rather than per customer as this would link to the cost of getting the truck full The point was made that there is a ‘customer recruitment’ cycle whereby about every three years some businesses on a round have to be re-recruited as some close, others switch contract, etc. This may be more applicable in larger urban areas such as London where there may be more service providers and would apply only to a fraction of businesses on a round, but it is worth noting. Business recruitment cycle – repeats every 3 years.
Year 1 Year 2 Year 3
Marketing costs per customer
£300 - £500 n/a n/a
Account manager per customer
£200 £200 £200
Miscellaneous £100 - £150 £100 - £150 £100 - £150
Due to their variable nature, it was decided not to include these costs in the model.
Service administration/account management
Account manager is about £25K/pa – with about 150 accounts, this equates to a cost of £200 per account per year
Miscellaneous £100/150 pa
Profit margin Min 12% (15% used in model)
Collection frequency
Very difficult to estimate collection frequency by size and type of premise – smaller premises may still need frequent collections as they have no room to store bins, while large premises may also need frequent collections because they produce large volumes, despite being able to store more bins.
As a rule of thumb, based on the of the Panel members it can be assumed that restaurants generally will need more frequent collections than hotels and pubs. For the purpose of the model we have assumed that baseline residual waste collection with dry recyclables will be twice a week, as will the collection of separated food in the service options. The collection of residual waste in the service options will reduce to once a week as the food waste will have been removed.
Dry recyclables will normally need less frequent collections – similar considerations could apply to residual waste if the food waste scheme is working well.

Food Waste Collections to SMEs: Developing the Business Case 27
Appendix 3: Sensitivity analysis
Selected sensitivity analyses have been carried out on the options. The analyses have concentrated on the
impact external changes will have on the relative costs of the options, for example landfill tax. It would also be
possible to carry out sensitivity analyses on many of the other operational variables, for example the time taken
to service each establishment and drive onto the next. However, as the assumptions used in the options are
consistent across all the options, and as the final operational outputs dependant on these values, such as the
number of loads it is possible to collect in a day or the number of establishments it is possible to serve, have
been peer reviewed by the panel, a sensitivity analyses of these variables would not contribute to the analysis
and overall conclusions regarding the relative costs of the different options.
Sensitivity to an increase in landfill gate fee for refuse from £15 to £25 per tonne
A gate fee of £15 was used in the modelling to reflect an average national fee for landfill disposal; however, in
the south and around London gate fees can be as high as £25 per tonne. The result of this sensitivity is shown in
Table 11.
Table 11: Sensitivity to an increase in landfill gate fee for refuse disposal from £15 to £25 per tonne
Base Disposal £25 Increase in cost
baseline 1 £48.77 £52.13 £3.36
baseline 2 £44.93 £48.92 £3.99
option 1 £48.31 £50.72 £2.41
option 2 £48.03 £49.85 £1.82
option 3 £50.94 £52.72 £1.78
option 4 £50.31 £52.72 £2.41
option 5 £50.20 £52.61 £2.41
option 6 £52.28 £54.10 £1.82
The increase in landfill gate fee has the greatest impact on the options that collect the most refuse. Baseline 2,
in which there is no separation of food waste or dry recyclables, remains the lowest cost (although potentially
non-compliant with duty of care requirements for pre-treatment of waste) option. However, the difference
between the lowest cost options that include the separation of food waste is not as great as before. An increase
in gate fees would mean that Options 1 and 2 would both have a lower cost than Baseline 1, and Options 3, 4
and 5 have only a slightly higher cost. Option 6 remains the most expensive option, although the difference in
cost between it and Options 3 and 4 the next most expensive under this sensitivity analysis, has reduced to £1.38
a week.
Sensitivity to an increase in landfill tax from £56 to £72/ tonne
The result of the landfill tax increasing from £56/t in 2011/12 to £72/t in 2013/14 on the options is shown in
Table 12.
Table 12: Sensitivity to an increase in landfill tax from £56 to £72/t
Base – Landfill
tax £56/t
Landfill tax
£72/t
Increase in cost
baseline 1 £48.77 £54.15 £5.39
baseline 2 £44.93 £51.32 £6.39
option 1 £48.31 £52.17 £3.86
option 2 £48.03 £50.95 £2.92
option 3 £50.94 £53.79 £2.85
option 4 £50.31 £54.16 £3.86
option 5 £50.20 £54.06 £3.86
option 6 £52.28 £55.20 £2.92
The increase in weekly cost is clearly greater in the options that divert the least waste from landfill. All the
options with the exception of Option 6 now have the same or a lower cost than Baseline 1 (in which refuse is

Food Waste Collections to SMEs: Developing the Business Case 28
collected separately from dry recyclables). Furthermore, Option 2, in which food and glass are collected
separately but in the same vehicle and refuse is collected in another vehicle, is now the lowest cost option. Its
cost is even lower than the Baseline 2 in which there is no separation of waste. Option 1, in which food waste is
collected separately from refuse, is only slightly higher than Baseline 2.
The chart below presents the additional costs of the options over the baseline 1 together with the impact of the
sensitivity analyses on landfill tax and gate fee.
-£4.00
-£3.00
-£2.00
-£1.00
£0.00
£1.00
£2.00
£3.00
£4.00
option 1 option 2 option 3 option 4 option 5 option 6
Option
Weekly
co
st
(£/w
k)
Base Disposal £25 Landfill tax £72
The graph shows that including the collection of food waste can result in an overall cost saving even at current
disposal costs. In the future, as disposal costs rise, either due to gate fees or landfill tax, the additional cost
reduces until the inclusion of food waste can result in an overall cost reduction.

Printed on xx% recycled
content paper
www.wrap.org.uk/relevant link