final report florida maintenance rating program (mrp ... · mrp as a measure for florida highways...
TRANSCRIPT

FINAL REPORT
Florida Maintenance Rating Program (MRP) Assessment and Enhancement
FDOT Project Number: BD548-28
Submitted to
The Florida Department of Transportation Research Center
605 Suwannee Street, MS 30 Tallahassee, FL 32399
Timothy Allen Project Manager
FDOT Maintenance Office
By
Dr. Yasser. Hosni, P.E. and Dr. Ahmed Khalafallah
Center for Advanced Transportation Systems Simulation University of Central Florida
P.O. Box 162450, Orlando, FL 32816-2450 Phone: (407) 823-5817, Fax: (407) 823-3413, Email: [email protected]
May 28, 2008

ii
Disclaimer
The opinions, findings, and conclusions expressed in this publication are those of the authors and not necessarily those of the State of Florida Department of Transportation

iii
Technical Report Documentation Page 1. Report No.
2. Government Accession No.
3. Recipient's Catalog No. 5. Report Date May 28, 2008
4. Title and Subtitle Florida Maintenance Rating Program (MRP) Assessment and Enhancement 6. Performing Organization Code
7. Author(s) Yasser Hosni, Ahmed Khalafallah,
8. Performing Organization Report No. 10. Work Unit No. (TRAIS)
9. Performing Organization Name and Address University of Central Florida 4440 Central Florida Blvd. Orlando, FL 32816
11. Contract or Grant No. BD548-28
13. Type of Report and Period Covered
12. Sponsoring Agency Name and Address
14. Sponsoring Agency Code
15. Supplementary Notes
16. Abstract The Maintenance Rating Program (MRP), developed in 1985 by FDOT, is a statewide maintenance system aimed at evaluating the State highway maintenance conditions, and determining FDOT asset maintenance needs. In the quest for continuous improvement and in response to concerns of previous studies, this study evaluates the use of MRP as a measure for Florida highways and roads maintenance needs. The study develops, and documents a method used for assigning weights to the maintenance elements and characteristics. The study examines the statistical and the computational aspects currently used in MRP. The findings of this study include: (1) the system is based on relatively old technology (mainframe computer), hence it is rigid in its abilities to be used by the State as well as the FDOT districts; (2) the system is limited in its ability to accommodate new road elements, features/ characteristics, modifications to the weights, or changes in the rating computational procedure (True/ false versus rating); and (3) the sampling methodology used in the system does not guarantee proper representation of the evaluated road. The study concluded that the current MRP sampling mechanism and weights do not adequately address the evaluation of Florida roads and highways. Recommended remedial actions are: (1) develop a new version of Florida MRP system that will adequately address the office of maintenance needs and alleviate current MRP system shortfalls; (2) conduct a study aimed at identifying new road maintenance elements that have become standard features since the initiation of MRP system in 1985; and (3) initiate a number of studies aimed at linking the MRP system rating to the allocation of maintenance budget and resources, streamlining the evaluation procedures of road maintenance and verification of contractors’ performance, and investigating the use of new technologies in data collection and inspection processes. 17. Key Word Maintenance Rating Program, MRP, Highway Road Maintenance Inspection, Evaluation, FDOT
18. Distribution Statement
19. Security Classif. (of this report)
20. Security Classif. (of this page)
21. No. of Pages 58
22. Price
Form DOT F 1700.7 (8-72) Reproduction of completed page authorized

iv
Acknowledgements
The authors would like to express their appreciation to the highway maintenance and operations experts who participated in this study. This includes Ddirectors of Operations, maintenance engineers, and traffic operations engineers, in the eight Florida districts as well as consultants and practitioners in the highway maintenance. Without the valuable information provided by the experts, it would have been impossible to carry out this study. The authors would like also to acknowledge the technical and administrative support provided by Mr. Tim Lattner, Director, Office of Maintenance, and Mr. Tim Allen, FDOT Project Manager. Without their support, this study would have never been completed on time. Acknowledgment also goes to our project consultant Mr. George Gilhooley for leveraging his experience in highway maintenance operations and management in support of the study.
v
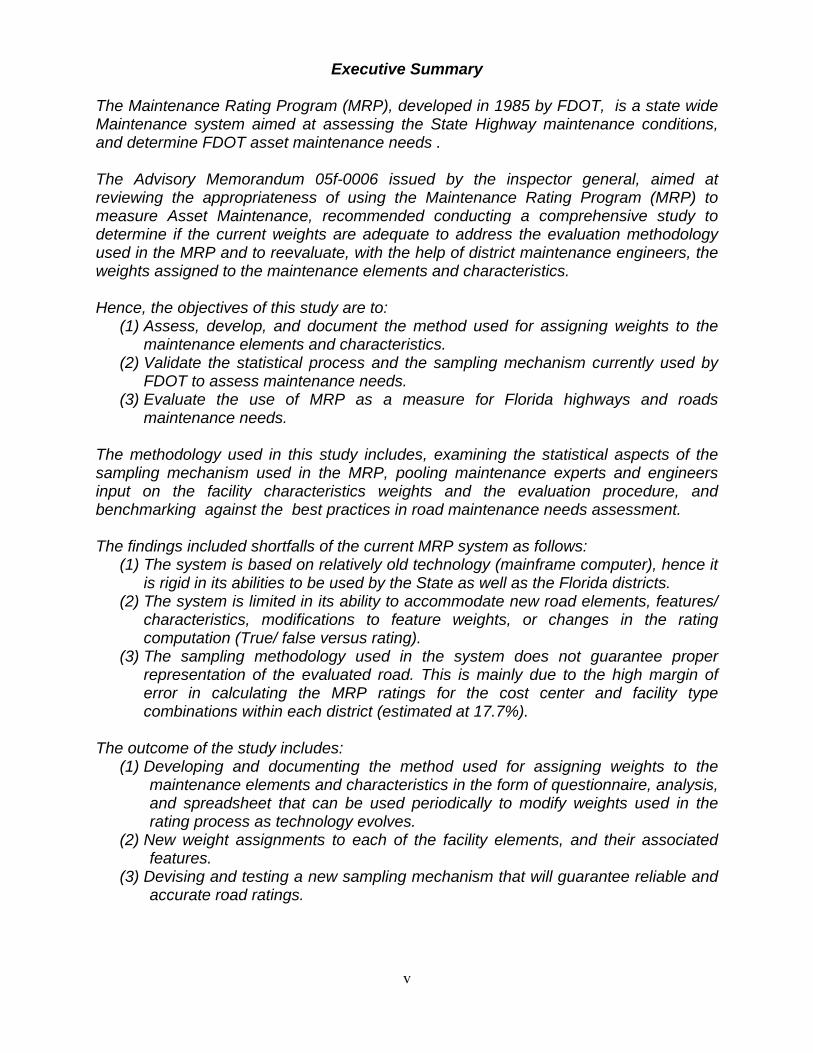
Executive Summary
The Maintenance Rating Program (MRP), developed in 1985 by FDOT, is a state wide Maintenance system aimed at assessing the State Highway maintenance conditions, and determine FDOT asset maintenance needs . The Advisory Memorandum 05f-0006 issued by the inspector general, aimed at reviewing the appropriateness of using the Maintenance Rating Program (MRP) to measure Asset Maintenance, recommended conducting a comprehensive study to determine if the current weights are adequate to address the evaluation methodology used in the MRP and to reevaluate, with the help of district maintenance engineers, the weights assigned to the maintenance elements and characteristics. Hence, the objectives of this study are to:
(1) Assess, develop, and document the method used for assigning weights to the maintenance elements and characteristics.
(2) Validate the statistical process and the sampling mechanism currently used by FDOT to assess maintenance needs.
(3) Evaluate the use of MRP as a measure for Florida highways and roads maintenance needs.
The methodology used in this study includes, examining the statistical aspects of the sampling mechanism used in the MRP, pooling maintenance experts and engineers input on the facility characteristics weights and the evaluation procedure, and benchmarking against the best practices in road maintenance needs assessment. The findings included shortfalls of the current MRP system as follows:
(1) The system is based on relatively old technology (mainframe computer), hence it is rigid in its abilities to be used by the State as well as the Florida districts.
(2) The system is limited in its ability to accommodate new road elements, features/ characteristics, modifications to feature weights, or changes in the rating computation (True/ false versus rating).
(3) The sampling methodology used in the system does not guarantee proper representation of the evaluated road. This is mainly due to the high margin of error in calculating the MRP ratings for the cost center and facility type combinations within each district (estimated at 17.7%).
The outcome of the study includes:
(1) Developing and documenting the method used for assigning weights to the maintenance elements and characteristics in the form of questionnaire, analysis, and spreadsheet that can be used periodically to modify weights used in the rating process as technology evolves.
(2) New weight assignments to each of the facility elements, and their associated features.
(3) Devising and testing a new sampling mechanism that will guarantee reliable and accurate road ratings.

vi
The study concluded that the current MRP sampling mechanism and weights do not adequately address the evaluation of Florida roads and highways. The study recommends the following:
1. Proceed with Phase-2 of this study, with the objective of developing a new version of Florida MRP system that will adequately address the office of maintenance needs; consider Phase-1 study findings and outcomes; and alleviate current MRP system shortfalls.
2. Conduct a study aimed at identifying new road maintenance elements that have become standard features since the initiation of MRP system in 1985.
3. Initiate a study aimed at linking the MRP system rating to the allocation of maintenance budget and resources.
4. Devise a methodology to streamline the evaluation procedures of road maintenance and verification of contractors’ performance.
5. Investigate the use of new technologies such as high-speed cameras and image analysis in data collection and inspection processes.

vii
Table of Contents Disclaimer ........................................................................................................................ii Acknowledgements .........................................................................................................iv Executive Summary ........................................................................................................ v Chapter One: Introduction ............................................................................................... 1
1.1 Background ........................................................................................................... 1 1.2 Objectives of the Project........................................................................................ 2
Chapter Two: Literature Review...................................................................................... 3 Chapter Three: Research Methodology .......................................................................... 5
3.1 Assess the Adequacy of the MRP System ............................................................ 5 3.1.1 MRP Weights Estimation.............................................................................. 5 3.1.2 MRP Computation........................................................................................ 7
3.2 Statistical aspects of MRP ................................................................................... 8 3.2.1 Sampling Mechanism................................................................................... 8 3.2.2 Sample Size ................................................................................................. 8 3.2.3 Frequency of Sampling ................................................................................ 8
Chapter Four: Study Findings ......................................................................................... 9 4.1. Survey Results and Analysis ................................................................................ 9
4.1.1 The Objectives and their weights .................................................................... 9 4.1.2 The Road Elements and their weights .......................................................... 10 4.1.3 The Features and their weights..................................................................... 11 4.1.4 The Sampling Mechanism............................................................................. 12 4.1.5 The Overall System Performance ................................................................. 13
4.2 Analysis of the Sampling Mechanism .................................................................. 14 4.2.1 Current Sampling Mechanism....................................................................... 14 4.2.2 Sample Size and Error Analysis.................................................................... 14
Chapter Five: Technical Discussion .............................................................................. 17 5.1 On additional objectives, elements, and features ................................................ 17 5.2 On the MRP Weights ........................................................................................... 17 5.3 On the MRP Computation.................................................................................... 18 5.4 On the sampling Mechanism ............................................................................... 20 5.5 Other Observations.............................................................................................. 22
5.5.1 On Setting Road Standards .......................................................................... 22 5.5.2 On The Use Of Contractors in Collecting Data.............................................. 22 5.5.3 On The Use of Technology for Data Collection ............................................. 22 5.5.4 On Linking the MRP to the Maintenance Budget .......................................... 22
Chapter Six: Conclusions and Recommendations ........................................................ 23 6.1 Conclusions ......................................................................................................... 23 6.2 Recommendations............................................................................................... 24
Appendix 1: Overview of the MRP System................................................................... 27 Appendix 2: Expert Questionnaire................................................................................. 29 Appendix 3: Applied example for MRP program computation ....................................... 37 Appendix 4: Questionnaire Data and Analysis ............................................................. 40 Appendix 5: Sampling Analysis .................................................................................... 47
viii
List of Figures Figure 1 Data entry section in MRP Excel Program ........................................................ 7 Figure 2 Element and Road Ratings Reporting in MRP Excel Program.......................... 8 List of Tables Table 4.1 Objective Weights …………………………………………………………… 9 Table 4.2 Element Weights ………………………………...…………………............. 10 Table 4.3 Features/ Characteristics Weights based on the survey results ……….. 11 Table 4.4 Sampling Mechanism Questions…………………………………………… 12 Table 4.5 Overall System Performance…..…………………………………………… 13 Table 5.1 Element weights Ranges – Current and New………………..……………. 17 Table 5.2 Features Recommended for Scale Rating by Maintenance Experts ...... 18 Table 5.3 Comparative Simulation Study Results……………………………………. 19 Table 5.4 Suggested sample sizes by Cost Center………………………………….. 20

1
Florida Maintenance Rating Program (MRP) Assessment and Enhancement
Chapter One: Introduction
1.1 Background The Maintenance Rating Program (MRP) is a statewide Maintenance system aimed at assessing the State Highway maintenance condition. MRP is based on a sampling process that rates five primary categories of highway environment three times a year. The items rated are roadway (potholes etc.), roadside (shoulders), vegetation and aesthetics (mowing, litter removal), traffic services (signs, lighting), and drainage (ditches). Each feature or characteristic is rated in the field according to whether it meets a pre-defined condition standard. An overall maintenance condition is calculated by applying respective element weightings to the individual element ratings, producing one overall MRP rating for for each maintenance area and various combinations of the ratings by maintenance area, district and statewide. –DOT district combination. A maintenance rating of 80 is considered acceptable. The Department's objective is to ensure that 100 percent of the State Highway System meets the maintenance standard. A complete overview of the MRP system [4] is provided in Appendix 1. In a recent Advisory Memorandum 05f-0006 issued by the inspector general aimed at reviewing the appropriateness of using the Maintenance Rating Program (MRP) to measure Asset Maintenance contractors’ performance and to determine if the MRP adequately addresses Office of Maintenance needs, it was recommended:
(1) To evaluate performance measures and quality control processes to supplement the MRP for Asset Maintenance contracts.
(2) Reevaluate, with the help of District Maintenance Engineers, the weights assigned to the maintenance elements and characteristics.
The purpose of this study is to respond to the advisory recommendation and to recommend updates to the MRP accordingly.
2
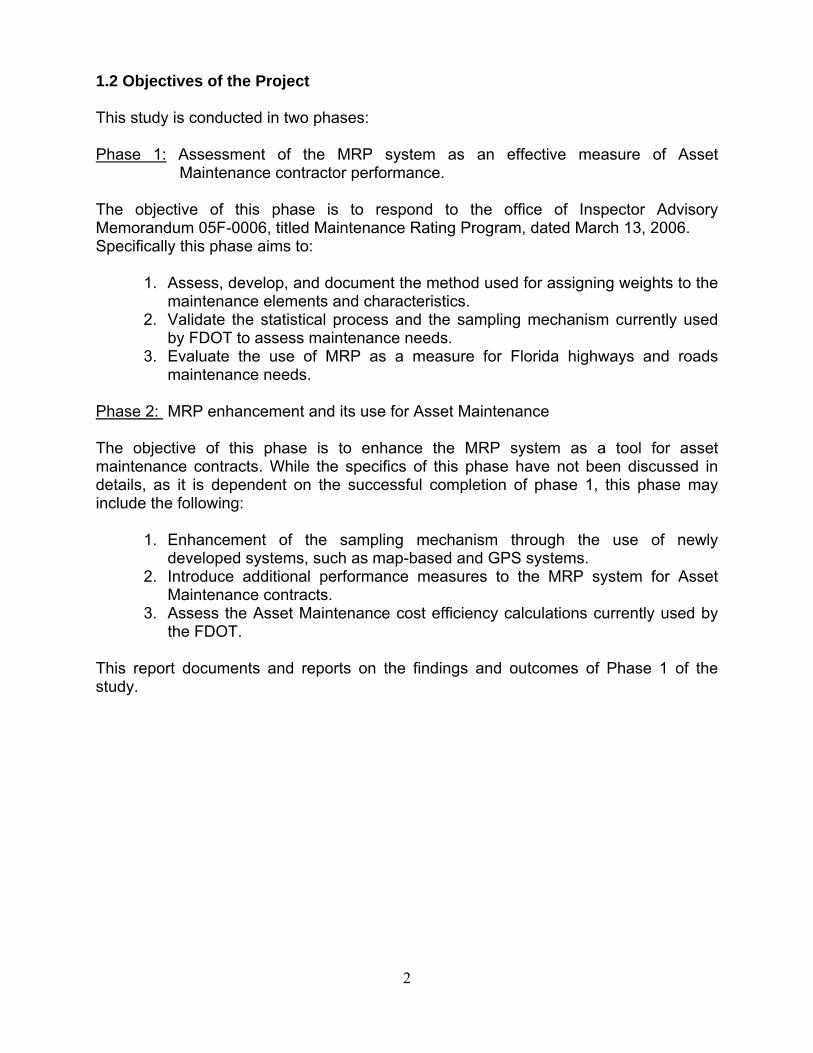
1.2 Objectives of the Project This study is conducted in two phases: Phase 1: Assessment of the MRP system as an effective measure of Asset
Maintenance contractor performance. The objective of this phase is to respond to the office of Inspector Advisory Memorandum 05F-0006, titled Maintenance Rating Program, dated March 13, 2006. Specifically this phase aims to:
1. Assess, develop, and document the method used for assigning weights to the maintenance elements and characteristics.
2. Validate the statistical process and the sampling mechanism currently used by FDOT to assess maintenance needs.
3. Evaluate the use of MRP as a measure for Florida highways and roads maintenance needs.
Phase 2: MRP enhancement and its use for Asset Maintenance The objective of this phase is to enhance the MRP system as a tool for asset maintenance contracts. While the specifics of this phase have not been discussed in details, as it is dependent on the successful completion of phase 1, this phase may include the following:
1. Enhancement of the sampling mechanism through the use of newly developed systems, such as map-based and GPS systems.
2. Introduce additional performance measures to the MRP system for Asset Maintenance contracts.
3. Assess the Asset Maintenance cost efficiency calculations currently used by the FDOT.
This report documents and reports on the findings and outcomes of Phase 1 of the study.

3
Chapter Two: Literature Review
Florida developed its Maintenance Rating Program (MRP) in 1985, and issued the MRP Handbook [7]. The Handbook contains visual and mechanical evaluation methods used by inspectors in determining the rating of highways in Florida. Though it did not illustrate the computational aspects of the MRP, the handbook served as a solid basis for understanding the method of road evaluation, and later helped inferring how the computational analysis is conducted. The MRP system and its updating(s) served well its intended purpose. In a paper prepared by members of the Transportation Research Board (TRB) Maintenance and Operations Management Committee in 1999 as part of TRB’s Millennium Papers, (later updated in January 2006), to respond to rapid changes in the state of the art and practice in the field of road maintenance and its management [3], Hamilton, and Hyman; recommended that “Maintenance organizations will no longer be allowed to measure performance solely in terms of budget compliance or units of work performed. The public demands accountability for results and wants assurance that its highway tax dollars are being invested wisely.” Specifically the paper recommended, “The new paradigm for maintenance management is expected to incorporate performance management and customer service at all organizational levels.” In February 1999, the PB²Performance Report No. 98-59, Transportation Maintenance Program Meets Standards; Its Accountability System in Need of Strengthening, the Florida Legislature office of Program Policy Analysis and Government Accountability, recommended continuous improvement on the MRP system among other improvement measures [5]. To this end and over the years a number of studies aimed at improving the MRP system have been initiated by FDOT. In August 1996, Zahn, Wu, and Stein, reported in their final report, Assessment and Improvement of the Maintenance Rating Program, FDOT, [6]; on the statistical and computational aspects of MRP system. The report illustrates the basic procedures used in calculating the MRP of all facility types using the current MRP weights. In July 2003, Smith, Beckemeyer, Bourdon, and Myzie, reported results of their study, Development And Application Of The Expanded Version Of The Florida Maintenance Rating Program, [4]; The aim of this study was to evaluate the quality of maintenance on a scale from 1-5 instead of pass/fail evaluation, while the overall rating of facilities lies between 0 and 100. They specified three MRP ratings, one for the features, a second for the element, and another for the overall rating of the facility. This study was conducted on Miami-Dade Expressway. In August 2006, the FDOT, Office of the Inspector General, issued the Advisory Memorandum 05F-0006, Maintenance Rating Program [1], with the aim of reviewing the appropriateness of using the Maintenance Rating Program (MRP) to measure Asset

4
Management contractors’ performance. The objectives were to determine if the MRP is an appropriate measure to evaluate Asset Management Contractors’ performance and to determine if the MRP adequately addresses Office of Maintenance needs. The advisory concluded that the Office of Maintenance did not retain documentation of the MRP development including the method used to assign weights to maintenance elements and characteristics, and without complete documentation to support how the MRP was developed it was unable to make a determination on adequacy of the MRP. It recommended that a comprehensive study should be performed to determine if the current weights are adequate to address the evaluation methodology. In a review of other states methods of maintenance quality evaluation of different road facilities, Tennessee Department of Transportation proposed a maintenance rating program for the State. The proposal included a pilot project for the analysis of different maintenance activities. The proposed maintenance program divides the roadways into three facility types: Full access controlled highways and interstates, U.S. Routes and all routes on the National Highway System and Non-U.S. Routes and other routes not on the National Highway System. Each facility type was divided into five main elements as follows: Traveled Pavement, Shoulder, Drainage, Traffic Services, and Roadside, which are quite similar to FDOT MRP elements. Each of these elements was broken down to a number of features/characteristics. The features are rated as passing or failing and valued on a scale from 0 to 9. The sampling mechanism is conducted randomly, where each sample represents one tenth of a mile. Bartlett et al. (2001) conducted a study for determining the appropriate and adequate sample size needed for achieving highly precise results in research analysis [8]. The study utilized Cochran’s formulas [9], for determining and adjusting the sample size of the population being investigated. Ozbek (2007) developed a framework for road maintenance that measures the efficiency of different roadways maintenance processes. The framework is based on score-board approach and accounts for all inputs and outputs of road maintenance methods, and the uncontrollable factors believed to have a major impact on the selection of the appropriate road maintenance strategy. The approach has yet to be proven practically implement-able.

5
Chapter Three: Research Methodology The approach used in this study has two folds:
1. Assess the adequacy of the system to evaluate the road maintenance needs by maintenance area (Cost center), district, and Statewide. This was done through the evaluation of the current MRP weights used in the FDOT-MRP system, and the computational method used to determine the rating.
2. Examine the statistical aspects of the current methodology as far as the sampling mechanism, sample size, frequency of sampling, and the statistical confidence of the ratings.
3.1 Assess the Adequacy of the MRP System 3.1.1 MRP Weights Estimation The methodology adopted for determining the weights used in the computation of the roads MRP was through surveying maintenance experts in Florida districts. A questionnaire was prepared (Appendix 2) and sent to around 40 maintenance experts in Florida. At least three experts from each of the eight Florida districts, as well as practitioners and consultants, were selected for the survey. Pooling experts opinion was recommended in the inspector general report and it is a known method for parameter estimations. The questionnaire is designed to extract expert estimates to percentage contribution (importance) of road maintenance elements: Roadway, Road Side, Traffic Services, Drainage, and Vegetation and Aesthetics, for each facility type: rural and urban for limited access and arterial roads; in achieving the goals and objectives of maintenance program. The questionnaire also pools experts’ estimates to the weights assigned to each of the 36 features used in the MRP computation. And was a chance to determine experts’ input on the Florida maintenance program goals, assessment on the current MRP methodology, the sampling size and frequency. An attempt was made to measure the relative importance of each of road maintenance elements to enable applying the Analytical Hierarchy Process (AHP); however, the response to the question was poor and could not be incorporated in the study. For each of the questions, provisions were made for the experts to add new objectives, elements, and features.

6
In the following section, we introduce a brief description of relevant survey questions and their use in the study.
Section I. OBJECTIVES AND THEIR WEIGHTS Q#1: Provide a percentage value reflecting the relative importance of each of the Road Maintenance Program objectives. Provide additional objectives as necessary.
Safety, protecting public investment, environmental aspects, and minimize expenditure were “loosely” stated as objectives of the MRP in an FDOT document. No ranking or other information are documented. While it is known that safety is the prime objective of MRP, we felt it is important to pool expert opinions on the MRP objectives in their estimate, as well as providing additional objectives they may feel necessary.
SECTION II. ELEMENT WEIGHTS Q#2: Indicate for every road/ facility type your estimation of the weights that should be assigned to each of the road maintenance elements. i.e. Indicate as a percentage the contribution of maintaining each of the elements to the achievement of the Maintenance Goals. For convenience, current percentages for each road facility are provided.
Q#3: Compare the importance of each of the elements to every other element on how important it is to achieve an integrated highway maintenance goal;
This was an optional questions that was meant to measure consistency in the answers. The response for this question was poor. The question was relatively irrelevant due to the large percentage given to Safety as the goal of the MRP. In a more elaborate study with much more conflicting objectives and goals, this question could be relevant.
Section III. FEATURES/ CHARACTERISTICS WEIGHTS Q#4: a) Provide your own Suggested level of importance of each of the Features/ Characteristics weights for each road category on a scale (0 to 9) where 9 is Extremely important, and 0 is not relevant.
b) Current System uses a pass/ fail inspection for each feature by measuring the
feature against a preset level of performance (LOP). It is suggested that some of the features may be more amenable to be evaluated on a scale (Ex: 0 to 5, where 0 means completely failing the LOP, and 5 is meeting or exceeding the LOP.) Mark (X) on the feature, you think its LOP should measured on a scale rather than Pass/ Fail

7
SECTION IV. THE SAMPLING MECHANISM In this section, we pool expert opinions on the sample size, the frequency of MRP evaluation, and if sampling should be performed state-wide or district-wide.
SECTION V. OVERALL SYSTEM
The experts are asked to rate the FDOT-MRP system between poor and excellent. 3.1.2 MRP Computation To enable the analysis, we developed an Excel-based program for computing road ratings from sample data. Program user enters the road type and sample results in the form of pass/ fail for each of the road features. The program computes element ratings as well as the road rating, using weights stored in another sheet of the program. The program uses the same computational procedure outlined in the Overview of the MRP System – Appendix 1. Figure 1 is a screen shot of the data entry section, and Figure 2 is a screen shot of the elements and road rating section in MRP Excel Program. Appendix 3 is an applied example for MRP program computation for evaluating a rural arterial road for cost center 59(1) in district 5 using current MRP weights.
5Cost Center: 1
Facility Type 2Road Type b
Element Roadway Roadside Veget. & Aesth. Feature 1 2 3 4 5 1 2 3 4 5 1 2 3 4 5 6 7 8 9 1 2 3 4 5 6 1 2 3 4 5 6 7
1 1 1 1 1 1 1 1 1 1 0 1 1 1 0 1 0 1 1 1 1 0 1 1 0 1 1 0 0 1 1 1 12 1 1 1 1 1 1 0 1 1 1 1 1 1 1 1 1 1 1 1 1 1 1 1 1 1 1 1 0 1 1 0 03 1 1 1 1 1 1 1 1 1 1 1 1 1 1 1 1 1 1 1 1 1 1 1 1 1 1 1 0 1 1 1 14 1 0 1 1 0 1 1 0 0 1 1 1 1 1 1 1 1 1 1 1 0 1 1 1 1 1 1 1 1 1 1 15 1 1 1 1 1 1 1 1 1 1 1 1 1 0 1 1 1 1 1 1 0 1 1 0 1 1 0 1 1 1 1 06 0 1 0 1 1 1 1 1 1 1 1 1 1 1 1 1 1 1 1 1 1 1 0 1 1 1 1 1 1 1 0 17 0 1 1 1 1 1 0 1 1 1 1 1 1 1 1 0 1 1 1 1 1 1 1 1 1 1 1 1 1 1 1 08 1 1 1 1 0 1 1 1 1 0 1 1 1 1 1 1 1 0 1 1 1 1 1 1 1 1 1 1 1 1 0 19 1 1 1 1 1 1 1 1 0 1 1 1 0 1 1 1 1 1 1 1 0 1 1 1 1 1 0 1 1 1 1 1
10 1 1 1 1 1 0 1 1 1 1 1 1 1 1 1 1 1 1 1 1 1 1 1 0 1 1 1 1 1 1 1 111 1 1 1 1 1 1 1 1 1 1 1 1 1 1 1 1 1 1 0 1 1 1 1 1 1 0 1 1 1 1 0 112 1 1 1 1 0 1 1 1 0 1 1 1 1 1 1 1 1 1 1 1 1 1 1 1 o 1 1 1 1 1 1 113 0 1 1 1 1 1 1 1 1 1 1 1 1 1 1 1 0 1 1 1 1 1 1 1 1 1 1 0 1 1 1 114 1 0 0 1 1 1 1 0 1 1 1 1 0 1 1 1 1 0 1 1 1 1 1 1 1 0 1 0 1 1 1 115 0 1 1 1 1 1 0 1 1 1 1 0 1 1 1 1 1 1 1 1 1 1 1 1 1 1 1 1 0 1 1 016 1 0 1 1 1 1 0 1 1 1 1 1 1 0 1 0 1 1 1 0 1 1 1 1 1 1 0 1 1 1 1 117 1 0 1 1 0 0 0 1 1 1 0 1 1 1 1 1 1 1 1 0 0 1 1 1 1 0 1 1 1 1 1 118 0 1 1 1 1 1 1 1 1 1 1 1 1 1 1 1 1 1 0 1 1 1 1 0 1 1 1 1 1 1 1 019 1 1 1 1 0 1 1 1 1 1 1 1 1 1 1 1 1 1 1 1 1 1 1 1 1 1 1 1 1 1 1 120 0 1 0 1 1 1 1 1 1 1 1 1 0 1 1 1 1 1 1 1 1 1 1 1 1 1 1 1 1 1 0 121 1 1 0 1 0 0 1 1 1 1 1 1 1 1 1 1 0 0 1 1 1 0 1 1 1 1 1 1 1 1 1 122 1 1 1 0 1 0 1 1 1 1 0 1 1 1 1 1 1 1 1 0 1 1 1 0 1 1 1 1 0 1 1 023 1 1 1 0 1 1 0 1 1 1 1 1 1 1 1 1 1 1 1 0 1 1 1 1 1 1 1 1 1 1 1 124 1 1 1 0 0 1 1 1 1 1 1 1 1 1 1 0 1 1 1 0 1 1 1 1 1 1 1 1 1 1 1 125 1 1 1 1 1 1 1 1 1 1 1 1 1 1 1 1 1 1 1 1 1 1 1 1 1 1 0 1 1 1 1 126 1 1 1 1 0 1 1 1 1 1 1 1 1 1 1 1 1 0 1 1 1 1 1 1 0 1 1 1 1 0 1 127 1 1 1 1 1 0 1 1 0 1 1 1 1 1 1 1 1 1 1 1 1 1 0 1 1 0 1 1 1 1 1 128 1 1 0 1 0 1 1 1 0 1 1 1 1 1 1 1 1 1 1 0 1 0 1 1 1 1 1 1 0 1 1 029 0 1 1 1 1 0 1 1 1 1 1 1 1 1 1 0 0 1 1 1 1 1 1 1 0 1 1 1 1 1 1 130 1 1 1 1 0 1 0 1 1 1 1 1 1 1 1 1 1 1 1 1 1 1 1 1 0 1 1 1 1 1 1 1
Sum 23 26 25 27 20 24 23 28 25 28 28 29 27 27 30 25 27 26 28 24 25 28 28 25 26 26 25 25 27 29 25 23
(1= RURAL LIMITED ACCESS; 2= RURAL ARTERIAL; 3= URBAN LIMITED ACCESS; 4= URBAN ARTERIAL)
17%Drainage 27%Traffic Services 24% 18% 12%
District:
(A=Flexible; B= Rigid)
Figure 1 Data entry section in MRP Excel Program

8
OVERALL MRP
FACILITY TYPE : RURAL ARTERIAL
ELEMENT MRP Weight NormalizedRoadway 83.68 24.00% 0.20 Roadside 84.57 18.00% 0.15 Traffic Services 91.58 27.00% 0.25 Drainage 87.16 14.00% 0.12 Vegetation & Aesthetics 86.05 17.00% 0.15
FACILITY OVERALL MRP 86.86%
Figure 2 Element and Road Ratings Reporting in MRP Excel Program
3.2 Statistical aspects of MRP 3.2.1 Sampling Mechanism The sampling mechanism used to determine the MRP rating was examined to determine its appropriateness for generating the MRP rating values. The methodology used for validating the sampling mechanism includes checking the current procedure against established scientific sampling procedures. In addition, experts input was solicited about the appropriateness of sample size, frequency, and distribution. 3.2.2 Sample Size To determine the sample size used in the MRP calculation, the following factors were considered: (1) type of variables (e.g. continuous, dichotomous, or categorical); (2) the acceptable margin of error (in calculating the MRP); and (3) alpha level (the level of acceptable risk that the true margin of error exceeds the acceptable margin of error (Bartlett et al. 2001) [7]. In this regard, Cochran’s Formulas (Cochran 1977) [8] are used to determine the appropriate sample size. These formulas utilize parameters of population size, type of data used for sampling, accepted margin of error, and the level of confidence/ risk (1-alpha level) in the analysis. 3.2.3 Frequency of Sampling Currently, sampling is done 3 times each year. Such was examined both statistically to reflect the facility rating per year, and through pooling maintenance experts opinion. Having expert opinion would reflect the possible constraints such as resources, budget, and time consumed, in performing the sampling with certain frequency.

9
Chapter Four: Study Findings 4.1. Survey Results and Analysis There were 23 questionnaires completed by experts (57% response ratio). Questionnaire data and analysis are shown in Appendix 4. Data were verified and examined, and duplicate data and outliers were eliminated. A statistical summary of the questionnaires and the answers to the questions are shown in Tables 4.1 to 4.5. For questions related to weights, the average, variance, standard deviation, minimum, and maximum were computed. Such were examined and compared with values used in the current MRP computation. Recommended weight values were determined as listed in Tables 4.1 to 4.3. For frequency questions, Tables 4.4 and 4.5, ratios were computed and actions with the highest ratio or score were recommended. Where there was a score associated with an action, the findings are based on the weighted average. The details of the survey analysis is in Appendix 4 4.1.1 The Objectives and their weights
Table 4.1 MRP Objective Weights
Objective Weight Safety 60 Protecting Public Investment 18 Environmental Aspects 15 Minimize Expenditure 7 Aesthetics Determine Work Needs Free Flow Movement of Traffic Pleasing Experience/Value to Public Supporting economic development Comfort and Convenience
Objectives of the MRP system is not included in the MRP computation, however, the elements and feature weights, which are included in the rating, are estimated by experts bearing in mind these goals. The findings show that experts weigh safety the highest with 60 of a 100 point scale is followed by protecting public investment (18/100), environmental aspects (15/100). and minimize expenditure (7/100). “Protection of public investment” and “environmental aspects” has higher weights than originally anticipated. Individual experts suggested additional objectives that should be considered in the mission statement of the FDOT office of maintenance.
10
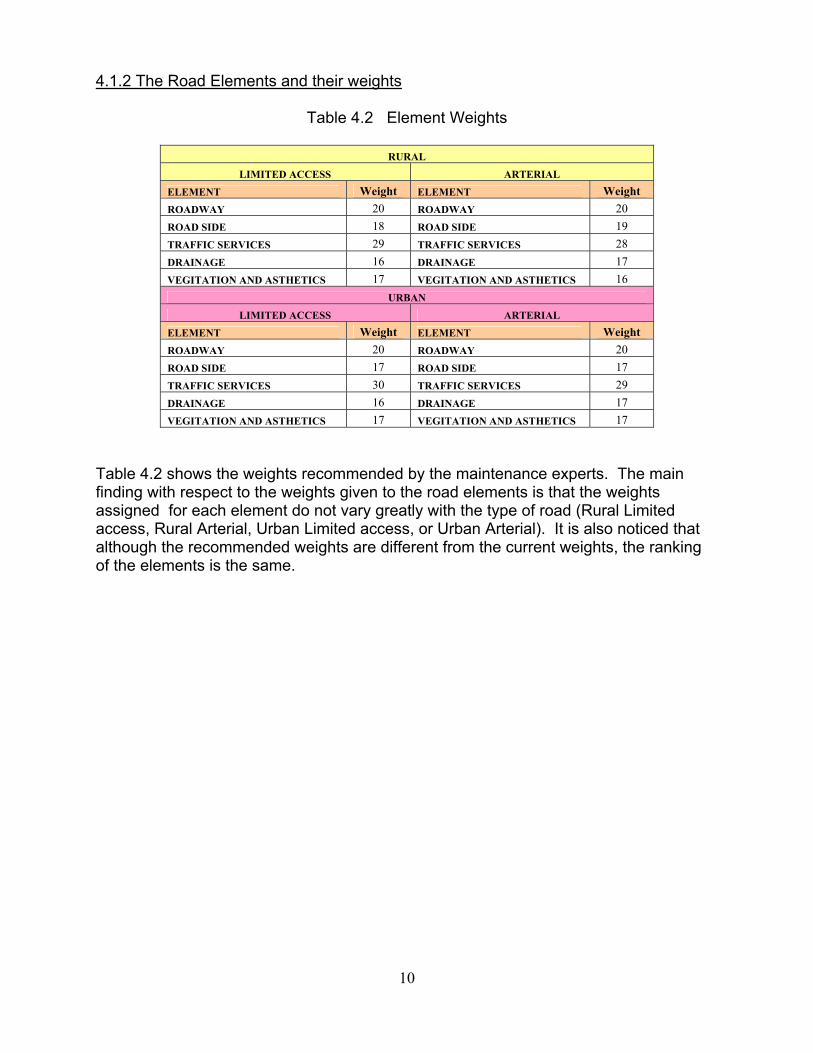
4.1.2 The Road Elements and their weights
Table 4.2 Element Weights
RURAL
LIMITED ACCESS ARTERIAL
ELEMENT Weight ELEMENT Weight ROADWAY 20 ROADWAY 20 ROAD SIDE 18 ROAD SIDE 19 TRAFFIC SERVICES 29 TRAFFIC SERVICES 28 DRAINAGE 16 DRAINAGE 17 VEGITATION AND ASTHETICS 17 VEGITATION AND ASTHETICS 16
URBAN
LIMITED ACCESS ARTERIAL
ELEMENT Weight ELEMENT Weight ROADWAY 20 ROADWAY 20 ROAD SIDE 17 ROAD SIDE 17 TRAFFIC SERVICES 30 TRAFFIC SERVICES 29 DRAINAGE 16 DRAINAGE 17 VEGITATION AND ASTHETICS 17 VEGITATION AND ASTHETICS 17
Table 4.2 shows the weights recommended by the maintenance experts. The main finding with respect to the weights given to the road elements is that the weights assigned for each element do not vary greatly with the type of road (Rural Limited access, Rural Arterial, Urban Limited access, or Urban Arterial). It is also noticed that although the recommended weights are different from the current weights, the ranking of the elements is the same.

11
4.1.3 The Features and their weights The new features/ characteristics weights based on the survey results are summarized in Table 4.3. Table 4.3 New Features/ Characteristics Weights based on the survey results
RURAL URBAN RURAL URBAN
Roadway Lim.
Access Arterial Lim.
Access Arterial Drainage Lim.
Access Arterial Lim.
Access Arterial Flexible pothole 9 9 9 9 Side/Cross Drain 7 7 7 7
Flexible edge raveling 5 6 5 5 Roadside/Median Ditch 5 5 5 5
Flexible shoving 5 6 5 6 Outfall Ditch 6 6 6 6 Flexible depression/bump 6 6 6 6 Inlets 7 8 8 8 Flexible shoulder/turnout 5 6 5 5
Miscellaneous Drainage 5 5 5 6
Rigid pothole 9 9 9 9 Roadway Sweeping 5 5 6 6
Rigid depression/bump 6 6 6 6
Rigid joint/cracking 7 7 7 6
Rigid shoulder/turnout 5 6 5 5
RURAL URBAN RURAL URBAN
Roadside Lim.
Access Arterial Lim.
Access Arterial Vegetation & Aesthetics
Lim. Access Arterial
Lim. Access Arterial
Unpaved shoulder 9 9 9 9 Roadside mowing 7 7 7 7
Front slope 6 7 6 7 Slope mowing 6 6 6 6
Slope pavement 6 6 6 6 Landscaping 4 4 5 5
Sidewalk 0 6 0 7 Tree trimming 6 6 7 7
Fencing 7 6 7 6 Curb or sidewalk edge 5 5 6 6
Litter removal 4 4 5 5
RURAL URBAN Turf condition 6 6 6 6
Traffic Services Lim.
Access Arterial Lim.
Access Arterial Turf condition 6 6 6 6 Raised pavement markers 9 9 9 9 Pavement striping 8 8 8 8 Pavement symbols 7 7 7 8 Guardrail 9 9 9 9 Attenuator 9 9 9 9 Signs ≤ 30 ft2 9 9 9 9
Features/ Characteristics MRP Weights
The weights for the roadway features/ characteristics came very close to the current values used in the MRP computation. There was relatively small number of experts who suggested assigning ratings (point scale 0 to 5) for the roadway features. The weights for the roadside features/ characteristics came very close to the current values used in the MRP computation. Some experts that answered the recommended rating question suggested evaluation through ratings (point scale: 0 to 5) for the roadside features: Unpaved shoulder, and sidewalk, and with a lesser degree for front slope and fencing.

12
The weights for the traffic services features/ characteristics came very close to the current values used in the MRP computation. Significant number of experts that answered the recommended rating question suggested evaluation through ratings (point scale 0 to 5) for the traffic service features: raised pavement markers and pavement striping. The weights for the drainage features came very close to the current values used in the MRP computation, Minor difference in two values, and no recommendation for point scale. The weights for the vegetation & aesthetics features came very close to the current values used in the MRP computation. Significant number of experts that answered the recommended rating question suggested evaluation through ratings (point scale 0 to 5) for the vegetation & aesthetics features: litter removal and turf condition, and to a lesser degree the tree trimming. 4.1.4 The Sampling Mechanism
Table 4.4 Sampling Mechanism Questions
(1) STATE ROADS ARE EVALUATED 3 TIMES A YEAR. IN YOUR OPINION HOW MANY EVALUATIONS SHOULD BE DONE PER YEAR?
# of Evaluations Per Year Total Ratio Recommended
1 1 5% 3
2 0 0%
3 14 64%
4 7 32%
22 100% (2) SHOULD SAMPLING BE PERFORMED STATE-WIDE RATHER THAN DISTRICT-WIDE?
Answer Total Ratio Recommended
YES 2 10.5% No
NO 17 89.5%
19 100% (3) IN YOUR OPINION, HOW SHOULD THE SAMPLE SIZE BE?
Number of Samples Total Ratio Recommended Should be more than 30 1 5% Should be proportional Should be 30 1 5% Should be less than 30 0 0% Should be proportional to the road length 20 90%
22 100%
13
The survey pointed out that 64% of the surveyed maintenance experts feel that evaluating MRP ratings 3 times per year is adequate while 32% of these surveyed experts suggested 4 times a year evaluation. The surveyed experts were asked if the sampling should be conducted statewide or district-wide for the four facility types. The results indicate that 89.5% of the experts do not agree with this suggestion. Currently the sample sizes are not proportional to the lengths of strata. This is believed to be a major contributor to the variation in the margin of error among strata. The current system also does not allow for distributing the samples on the measured object (stratum). This means that the samples could all fall within a limited area or a single road of the stratum leaving the rest of the stratum without sampling. This would not reflect the actual status of the highways within the stratum. Samples should be distributed over strata to guarantee actual depiction of stratum condition. The conducted survey pointed out that 90 % of the surveyed maintenance experts feel that the sample sizes should be proportional to the lengths of facility being sampled. 4.1.5 The Overall System Performance
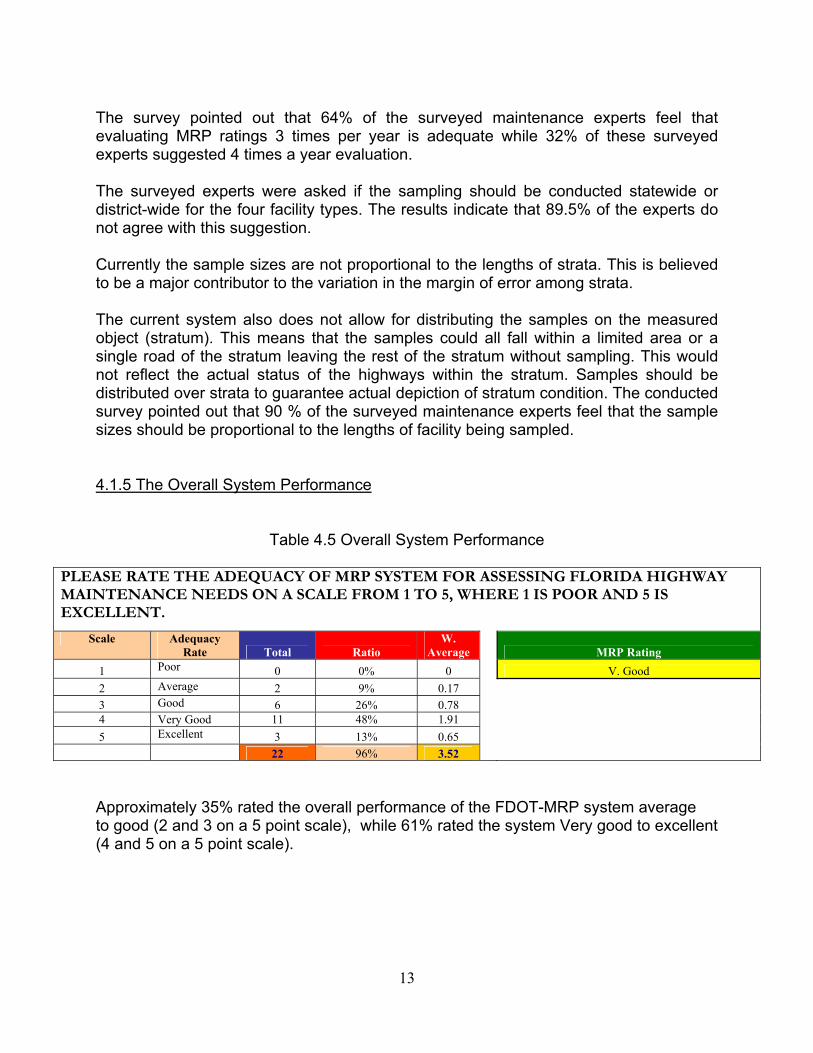
Table 4.5 Overall System Performance
PLEASE RATE THE ADEQUACY OF MRP SYSTEM FOR ASSESSING FLORIDA HIGHWAY MAINTENANCE NEEDS ON A SCALE FROM 1 TO 5, WHERE 1 IS POOR AND 5 IS EXCELLENT.
Scale Adequacy Rate Total Ratio
W. Average MRP Rating
1 Poor 0 0% 0 V. Good 2 Average 2 9% 0.17 3 Good 6 26% 0.78 4 Very Good 11 48% 1.91 5 Excellent 3 13% 0.65
22 96% 3.52 Approximately 35% rated the overall performance of the FDOT-MRP system average to good (2 and 3 on a 5 point scale), while 61% rated the system Very good to excellent (4 and 5 on a 5 point scale).

14
4.2 Analysis of the Sampling Mechanism Data for Florida roads and highways are housed and maintained in the Road Characteristics Inventory (RCI) database. In this database, highways are represented by a population of 116890 segments (each segment is 0.1 mile long). This population is partitioned into 93 basic strata; one for each maintenance zone (cost center) and facility type combination. These 93 strata are grouped into 8 districts. MRP rating zones are established based on geography and ratable centerline mileage (i.e., no bridges). 4.2.1 Current Sampling Mechanism A random sample (without replacement) is taken from each basic stratum. For strata with 10 miles of road or more, 30 road segments are selected. For smaller strata, 30% of the road segments are selected. For the turnpike, 90 segments are selected for each of rural and limited access facility types. A complete statewide sampling survey is conducted 3 times a year (Jul-Oct, Nov-Feb, and Mar-Jun). Each time period 162 MRP ratings are calculated (93 ratings for basic strata; and 69 ratings for facility-type-wide and cost-center-wide in each district, facility-type-wide for the state, and statewide). The latter 69 levels are obtained by aggregating data over a number of basic strata. The results of these periods are aggregated to produce the annual report. 4.2.2 Sample Size and Error Analysis The appropriateness of sample size is checked for (1) cost center and facility type combinations; (2) facility-type-wide for each district; (3) cost-center-wide for districts; (4) district wide; (5) facility-type-wide for the state; and (6) the State. This is accomplished by Cochran’s Formula for categorical and dichotomous data (Cochran 1977): n0 = (t) 2 x (p) (q) / (d2) (1) Where:
n0 = sample size; t = t-value for selected alpha level; (p) (q) = estimate of variance; and d = acceptable margin of error.
If the sample size (n0) is > 5% the following correction formula is used. n1 = (n0) / (1 + n0/Population) (2) Where: n1 = corrected sample size. In checking the appropriateness of sample sizes, the following assumptions are made:
- Variance (pq) = 0.25 (dichotomous data). - The alpha level is 0.05 (recommended for most studies). The t-value for this alpha level is 1.96.

15
Employing the data used in the FDOT study upon which sample sizes were determined [6], the margins of error are calculated for each of the following:
1. Cost center and facility type combinations 2. Facility-type-wide in districts 3. Cost-center-wide in districts 4. District 5. Facility-type-wide in the State 6. The State of Florida
Findings and analysis are as follows: 4.2.2.1 Cost center and facility type combinations The margins of error of current MRP sampling mechanism for cost center and facility type combinations range between 15.8% and 23.8%, except for the turnpike. The turnpike has a margin of error of 10.33% for Facility Type 1 and 9.6% for Facility Type 3. The highest margin of error (23.8%) is for Facility Type 3 of cost center 691, District 6. The majority of margins of error are around 17%. This means that the range for the actual MRP ratings is (MRP +/- 17) for these combinations. Appendix 5, Table A5.1 provides the calculations of these margins of error. It is important to note that these margins of error are considered very high especially when contractors are awarded contracts to raise the MRP 5 to 15 points as this is considered within the margin of error of calculation. As such, the research team believes that using the current sample sizes is not considered appropriate for calculating this category of MRP ratings. A new methodology for sampling is suggested in Chapter 5 of this report. 4.2.2.2 Facility-type-wide calculations in districts
The majority of the margins of error range are within 10%. The exceptions are: Facility Type 1 in District 6 (23.8%); Facility Type 3 in District 2 (17.3%); and Facility Type 3 in District 3 (16.1%). The new sampling methodology suggested in Chapter 5 would address these deficiencies. Calculations of these margins of error are provided in Appendix 5, Table A5.2.
4.2.2.3 Cost-center-wide calculations in districts
The margins of error range between 7.1% and 12.7%. The Turnpike has the least margins of error (7.1%). The highest margin of error (12.7%) is for cost centers 296 in District 2, 391 in District 3, and 595 in District 5. Calculations of these margins of error are provided in Appendix 5, Table A5.3.
16
4.2.2.4 MRP Error margins by, district, Facility within State, and the State The margins of error by district range between 4.2% (Districts 2 and 5) and 7.1% (Turnpike). Calculations of these margins of error are provided in Appendix 5, Table A5.4. The margins of error by facility type in the state range between 3.3% (Facility Type 4) and 4.7% (Facility Type 3). These margins of error are acceptable. Calculations of these margins of error are provided in Appendix 5, Table A5.5. The margin of error for the state of Florida is estimated to be 1.8%. This is an acceptable margin of error. Calculations of these margins of error are provided in Appendix 5, Table A5.5.
17
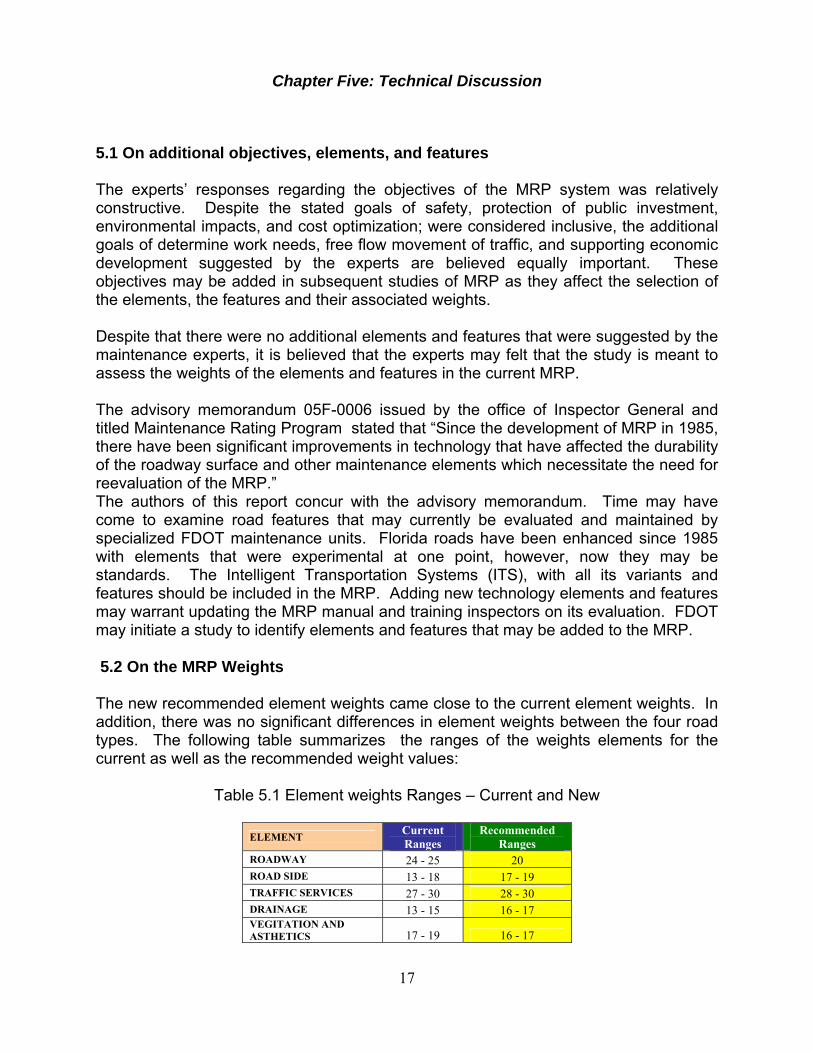
Chapter Five: Technical Discussion 5.1 On additional objectives, elements, and features The experts’ responses regarding the objectives of the MRP system was relatively constructive. Despite the stated goals of safety, protection of public investment, environmental impacts, and cost optimization; were considered inclusive, the additional goals of determine work needs, free flow movement of traffic, and supporting economic development suggested by the experts are believed equally important. These objectives may be added in subsequent studies of MRP as they affect the selection of the elements, the features and their associated weights. Despite that there were no additional elements and features that were suggested by the maintenance experts, it is believed that the experts may felt that the study is meant to assess the weights of the elements and features in the current MRP. The advisory memorandum 05F-0006 issued by the office of Inspector General and titled Maintenance Rating Program stated that “Since the development of MRP in 1985, there have been significant improvements in technology that have affected the durability of the roadway surface and other maintenance elements which necessitate the need for reevaluation of the MRP.” The authors of this report concur with the advisory memorandum. Time may have come to examine road features that may currently be evaluated and maintained by specialized FDOT maintenance units. Florida roads have been enhanced since 1985 with elements that were experimental at one point, however, now they may be standards. The Intelligent Transportation Systems (ITS), with all its variants and features should be included in the MRP. Adding new technology elements and features may warrant updating the MRP manual and training inspectors on its evaluation. FDOT may initiate a study to identify elements and features that may be added to the MRP. 5.2 On the MRP Weights The new recommended element weights came close to the current element weights. In addition, there was no significant differences in element weights between the four road types. The following table summarizes the ranges of the weights elements for the current as well as the recommended weight values:
Table 5.1 Element weights Ranges – Current and New
ELEMENT Current Ranges
Recommended Ranges
ROADWAY 24 - 25 20 ROAD SIDE 13 - 18 17 - 19 TRAFFIC SERVICES 27 - 30 28 - 30 DRAINAGE 13 - 15 16 - 17 VEGITATION AND ASTHETICS 17 - 19 16 - 17

18
The weight given to the Roadway was consistently less than the current values, while the roadside weight and the drainage weight was higher than the current. It is therefore advisable to use the recommended element weights of this study in the MRP computation. The feature weights for each of the elements vary from the current used values, however in general by not much. It was recommended to use point evaluation on a scale between 0 and 5 (0: Poor, 5: Excellent) for the following features:
Table 5.2 Features Recommended for Scale Rating by Maintenance Experts
Element Feature Raised pavement markers Traffic Services
Pavement striping Tree trimming Curb or sidewalk edge Litter removal
Vegetation & Aesthetic
Turf condition If FDOT decides to adopt these findings in the MRP computation, both the MRP manual and the MRP computation will have to be updated to reflect these findings. 5.3 On the MRP Computation A comparative study was performed using simulated sampling evaluation. The study was meant to compare the MRP values using current MRP weights vs. recommended weights. The study covers the four road categories (Rural Limited Access, Rural Arterial, Urban Limited Access, and Urban Arterial), using sample sizes of 30 and 15. Table 5.3 summarizes the results of the study.

19
Table 5.3 Comparative Simulation Study Results
MRP Record# Road
Category Road Type Current Weights Recommended Weights
Difference
1 82.35 82.28 0.07 2 85.31 85.23 0.08 3 53.23 53.15 0.08 4 65.54 65.48 0.06 5
Flexible
70.2 70.16 0.04 6 70.64 70.6 0.04 7 74.92 74.87 0.05 8 80.9 80.87 0.03 9 88.15 88.13 0.02
10
Rur
al L
imite
d A
cces
s
Rigid
91.08 91.07 0.01 11 82.36 82.23 0.13 12 85.22 85.09 0.13 13 53.7 53.48 0.22 14 65.8 65.54 0.26 15
Flexible
70.54 70.37 0.17 16 70.19 70.05 0.14 17 74.81 74.69 0.12 18 80.71 80.65 0.06 19 88.3 88.22 0.08 20
Rur
al A
rter
ial
Rigid
91.31 91.25 0.06 21 82.19 82.14 0.05 22 85.29 85.23 0.06 23 53.07 53.14 (0.07) 24 65.37 65.45 (0.08) 25
Flexible
70.06 70.15 (0.09) 26 70.49 70.59 (0.10) 27 74.74 74.8 (0.06) 28 80.81 80.82 (0.01) 29 88.04 88.13 (0.09) 30
Urb
an L
imite
d A
cces
s
Rigid
90.96 91.07 (0.11) 31 82.02 82.19 (0.17) 32 85.01 85.16 (0.15) 33 53.86 53.77 0.09 34 65.67 65.59 0.08 35
Flexible
70.46 70.41 0.05 36 74.69 74.68 0.01 37 80.61 80.62 (0.01) 38 88.18 88.21 (0.03) 39
Urb
an A
rter
ial
Rigid
91.21 91.26 (0.05) Examining the differences between the rating values for the current and the new weights show that the MRP model is not sensitive to the variability in the weights. The reason for this insensitivity is the pass/ fail methodology used in the MRP computation. To realize sensitivity using the current MRP methodology, it would require large number

20
of inspections by additional inspectors (a constraint for FDOT). The other alternative is to change the rating methodology from using pass/ fail where the total feature weight is “added” or “not added” to the rating based on a scale. i.e. inspectors would rate each factor on a scale from 0 to 5. A proportion of the weight is “added” or “not added” to the score based on the rating. [Ex: feature of maximum weight 9, being rated as 3 out of 5, would be allocated (3/5)*9 = 5.4 for this feature]. This will require experienced inspectors, revision of MRP manual, as well as MRP computational methodology. 5.4 On the sampling Mechanism From the findings reported in section 4.2, the average margin of error is almost 18%. To obtain an acceptable margin of error of 10% or less, the sample size for calculating MRP ratings should increase. In addition, the surveyed experts recommend that the sample sizes should be changed to be proportion to the lengths of strata and should be distributed over the highway segments within strata. This recommendation is supported by the evidence of high margins of error for calculating the MRP ratings for the combination of cost-center and facility-type strata. The investigators of this research developed a methodology to resolve this problem and limit the margin of error to a maximum of 10%. The new suggested sample sizes for various districts and cost centers, using the roads and highway data originally used in FSU study [8], are provided in Table 5.4
Table 5.4 Suggested sample sizes by Cost Center
10% Error 10% Error Dist. Cost Center
Facility Type
Miles Pop.
Annual Every 4
Mos
Dist. Cost
Center Facility Type
Miles Pop.
Annual Every 4
Mos D1 190 1 31.8 318 74 25 D4 490 1 69.6 696 84 28 2 314 3140 96 32 2 205.6 2056 96 32 3 0 - 0 3 0 - 0 4 320.6 3206 96 32 4 96.5 965 87 29 192 1 115.3 1153 89 30 491 1 44.7 447 79 26 2 280.2 2802 96 32 2 87.8 878 87 29 3 0 - 0 3 33.7 337 75 25 4 234.6 2346 96 32 4 225.3 2253 96 32 194 1 68 680 84 28 492 1 0 - 0 2 281 2810 96 32 2 166.3 1663 91 30 3 0 - 0 3 47.9 479 80 27 4 180.2 1802 91 30 4 214 2140 96 32 D2 291 1 34.9 349 75 25 D5 590 1 93.2 932 87 29 2 204.4 2044 96 32 2 103.3 1033 88 29 3 0 - 0 3 0 - 0 4 124.7 1247 89 30 4 174.8 1748 91 30 292 1 133.4 1334 90 30 591 1 91 910 87 29 2 342.4 3424 96 32 2 263.3 2633 96 32 3 0 - 0 3 0 - 0 4 82.5 825 86 29 4 102.3 1023 88 29 293 1 32.4 324 74 25 592 1 28 280 72 24 2 258.9 2589 96 32 2 239.1 2391 96 32 3 0 - 0 3 0 - 0 4 18.2 182 63 21 4 58.8 588 83 28 294 1 76 760 85 28 593 1 0 - 0 2 260.2 2602 96 32 2 24.2 242 69 23 3 54.3 543 82 27 3 27.1 271 71 24 4 256.9 2569 96 32 4 116.7 1167 89 30 296 1 0 - 0 594 1 50.8 508 81 27 2 271.1 2711 96 32 2 118.3 1183 89 30 3 0 - 0 3 48 480 80 27 4 17.8 178 62 21 4 121.1 1211 89 30 297 1 34.6 346 75 25 595 1 38 380 0 2 242.8 2428 96 32 2 144.5 1445 90 30 3 0 - 0 3 0 - 0 4 41.8 418 78 26 4 56.5 565 82 27

21
Cont. Table 5.4 Suggested sample sizes by Cost Center
10% Error 10% Error
Dist. Cost
Center Facility Type Miles Pop. Annual
Every
4 Mos Dist.
Cost Center
Facility Type Miles Pop. Annual
Every
4 Mos
D3 390 1 51.4 514 81 27 D6 690 1 0 - 0 2 272.5 2725 96 32 2 88.3 883 87 29 3 0 - 0 3 39.3 393 77 26 4 72.8 728 85 28 4 178.9 1789 91 30 391 1 0 - 0 691 1 4.3 43 30 10 2 249.7 2497 96 32 2 6.1 61 37 12 3 0 - 96 32 3 31.3 313 73 24 4 108 1080 88 29 4 162.2 1622 91 30 392 1 72.6 726 85 28 692 1 0 - 0 2 489.2 4892 96 32 2 81.7 817 86 29 3 0 - 0 3 0 - 0 4 110.3 1103 88 29 4 18.1 181 63 21 393 1 64.1 641 84 28 D7 796 1 64.4 644 84 28 2 328.3 3283 96 32 2 122.3 1223 89 30 3 0 - 0 3 31.4 314 74 25 4 61.8 618 83 28 4 180.8 1808 91 30 395 1 29.1 291 72 24 797 1 31.9 319 74 25 2 248.6 2486 96 32 2 226.4 2264 96 32 3 15.5 155 59 20 3 0 - 0 4 146.4 1464 90 30 4 109.6 1096 88 29
798 1 17.4 174 62 21 2 14.7 147 58 19 3 22 220 67 22 4 163.4 1634 91 30 D8 853 1 268.6 2686 96 32 2 0 - 0 3 68.6 686 84 28 4 0 - 0
Suggested Sample Size for 10% Margin of Errors
Total # of Samples 7828 2609 The suggested sample sizes are calculated assuming an annual sampling, collection, and evaluation of the MRP ratings. Generating these samples annually would guarantee the elimination of any double sampling of a segment (true sampling without replacement). The sample size for every period of evaluation is one third of the sample size for the annual evaluation. This would guarantee an appropriate sample size for a more precise calculation of the annual ratings. A comparison for the number of samples per year on a State level for the current methodology and the new methodology reveals a reduction from 8550 samples to 7828 sample per year. A reduction of 722 sample annually. Hence, the devised methodology decreases the margins of error without increasing the resources and budget for FDOT, generate samples proportional to the road length, and since its samples are generated on a yearly bases, it insures an even distribution of samples along all segments of the road. An additional measure could be added to the methodology to insure non-selection of samples with close proximity to each other. It is thus recommended to use this sampling methodology in the FDOT-MRP sampling mechanism to realize the benefits cited above.

22
5.5 Other Observations 5.5.1 On Setting Road Standards Current FDOT-MRP system considers an MRP value of 80 and above acceptable. There is no documented procedure on how this value was determined. Such value most likely was determined through an ad-hoc procedure without justification. It is thus suggested that such value be determined through a scientific study. Moreover, that this standard value is revised periodically to reflect the level of maintenance needed to satisfy the maintenance program goals and objectives. 5.5.2 On The Use Of Contractors in Collecting Data
Current procedure relays on maintenance contractors to collect sample data, especially after performing maintenance operations. This is a weak point in the MRP. To guarantee the integrity of the rating process, FDOT inspectors or consultants should conduct sampling, evaluation, and rating. A complete separation between maintenance contractors and the evaluation process is strongly recommended. 5.5.3 On The Use of Technology for Data Collection The cost of resources needed for collecting samples and analyzing data could be reduced by investigating the use of automated data collection technologies (e.g. GPS, high speed imaging, and others). The technology in data collection has advanced in the last few years that warrant investigating its use in road rating and maintenance operations. 5.5.4 On Linking the MRP to the Maintenance Budget There is valuable information that is gathered during the inspection process. It is not clear how this information is used in the allocation of maintenance resources and budget. It may be useful, and contribute to the MRP goal of “protecting public investment”, to qualify the MRP rating with identification and quantification of contributing elements and features to a lower or higher rating. Such can be translated to maintenance needs. This will require setting up a level of performance (LOP) associated with each element for each facility type and compare it with the MRP score of the evaluated element. This then would be used to identify features/ characteristics that can be translated into “maintenance needs” on the element and feature level. The current MRP system is not fully connected to budgeting and allocation of budget and resources such as inspectors. These are among the most important factors that affect the sampling frequency and the sample size. FDOT should consider linking the MRP to the budget and resource allocation system(s). This should answer to the concern raised by the advisory memorandum 05F-0006 by the Inspector General related to this issue.

23
Chapter Six: Conclusions and Recommendations 6.1 Conclusions In this study, a thorough evaluation of the MRP system was conducted. The system was examined statically, computationally and operationally. We developed, documented, and applied a methodology for weight estimation used in the MRP system. New weights were established through surveying the maintenance experts in the state. The new weights were applied and MRP values were compared with the current values. The study concluded that there are serious limitations associated with the current version of Florida MRP that hinder the ability of the system to adequately evaluate the Florida highway maintenance needs. The limitations spans over the sampling process, the weights, the evaluation methodology of MRP, and the system operation and inflexibility. Remedial solutions are suggested and experimented with during the study. The solutions, if implemented, could alleviate the shortfalls in the system in a new version of MRP that we are recommending in the next section. Due to the dynamic nature of highway construction and technological advances in highway construction, maintenance, and operations, the study concluded that periodic updating of the MRP system is warranted. Realizing the limitation in resources, such as inspectors and budget, and the dependency of successful maintenance operations on accurate evaluation/ rating and adequate resource and budget allocation, the study recommends initiating a number of studies and investigations aimed at linking the MRP system to the maintenance budge, and investigating supporting the inspection process through automated data collection technology.

24
6.2 Recommendations The recommendations of this study are:
1. Develop a new version of Florida MRP system. The system will adequately address the FDOT office of Maintenance needs, and will have the following characteristics:
1. PC- Windows- Based system, that can be used both on State, and district levels through a user-friendly interaction.
2. Open ended that can accommodate new road elements, features/ characteristics
3. A modified sampling mechanism that will insure accurate assessment of road conditions while maintaining the simplicity of the current system and considering the availability of resources (sampling: frequency, location, size, and spread-ness)
4. Include the outcome of this study regarding: i. The recommended MRP weights ii. Changes in the features/ characteristics evaluation methodology of
some features from pass/ fail to a grading methodology (0 to 5 scale)
iii. Showing the maintenance needs on the element level by comparing it to the element level of performance (LOP), and highlighting the deficiencies.
iv. Initiate a study aimed at identifying new road maintenance elements that has become standard features since the initiation of MRP system in 1985.
2. Conduct a study aimed at linking the MRP system rating to the allocation of
maintenance budget and resources.
3. Devise a methodology to streamline the evaluation procedures of road maintenance and verification of contractors’ performance.
4. Investigate the use of new technologies such as high speed cameras and image
analysis in data collection and inspection process.

25
References
1. FDOT, Office Of The Inspector General, Cecil T. Bragg, Jr. Advisory Memorandum 05f-0006, Maintenance Rating Program, August 25, 2006
2. FDOT, Maintenance Office, Maintenance Rating Program, Topic No.: 850-065-002-J, June 19, 2002
3. Transportation Research Board Maintenance And Operations Management Committee, Maintenance And Operations Of Transportation Facilities, 2005 Strategic Vision, Transportation Research Circular E-C092, ISSN 0097-8515, , Original Paper Written In 1999 As Part Of TRB’s Millennium Papers By Ronald B. Hamilton, Roy Jorgensen Associates, Inc. William A. Hyman, Booz–Allen & Hamilton, Updated In 2005, and published in January 2006 , www.trb.org
4. Kelly L. Smith, Curt A. Beckemeyer, Robert Bourdon, And David Myzie, Development And Application Of The Expanded Version Of The Florida Maintenance Rating Program, Transportation Research E-Circular, Number E-C052, July 2003, ISSN 0097-8515
5. PB²Performance Report No. 98-59, Transportation Maintenance Program Meets Standards; Its Accountability System in Need of Strengthening, Office of Program Policy Analysis and Government Accountability an office of the Florida Legislature, February 1999
6. Douglas Zahn, Shau-Ming Wu, Jeff Stein, Final Report, Assessment and Improvement of the Maintenance Rating Program, FDOT., August 1996.
7. Florida Department of Transportation (FDOT), 2006. "Florida Department of Transportation Maintenance Rating Program Handbook: Data Collection for Maintenance Rating Program." Florida Department of Transportation, Tallahassee, Fl.
8. Bartlett, J. E., II, Kotrlik, J. W., & Higgins, C. (2001). "Organizational research: Determining appropriate sample size for survey research." Information Technology, Learning, and Performance Journal, 19(1) 43-50.
9. Cochran, W G (1977). Sampling Techniques (3rd ed.), John Wiley & Sons, ISBN 0-471-16240-X
10. Ozbek, Mehmet, (2007) “Development of a Comprehensive Framework for the efficiency Measurement of Road Maintenance using Data Envelopment Analysis”, Ph.D. Dissertation in Civil Engineering, Virginia Polytechnic Institute and State University.

26
Appendices
Appendix 1: Overview of the MRP System Appendix 2: Expert Questionnaire Appendix 3: Applied Example for MRP Program Computation Appendix 4: Questionnaire Data and Analysis Appendix 5: Sampling Analysis

27
Appendix 1: Overview of the MRP System
OVERVIEW OF FLORIDA MAINTENANCE RATING PROGRAM The Florida MRP system consists of a quantifiable process to determine the levels of service (LOS) of various maintenance activities performed on any of five highway facility types—rural limited access, rural arterial, urban limited access, urban arterial, and special facilities. Three times each year, a random number generator program is used to select 0.1-mile (0.16 km) sections on each of the facility types contained within a maintenance unit (Cost Center). The number of samples required for the population (centerline miles) involved is determined using statistical formulas designed to provide accuracy within 3 percent at a confidence level of 95 percent. The quality of maintenance is evaluated by two-person teams in each of eight districts. Assessments are made using pass–fail ratings that indicate conformance or nonconformance with established agency-wide LOS criteria, which in turn is reflective of long-term, end-result performance. Maintenance Elements The Florida MRP is divided into five asset groups or maintenance elements, which represent portions of the highway system that serve similar functions (3). The five maintenance elements are as follows:
• Roadway, • Roadside, • Traffic Services, • Drainage, and • Vegetation and Aesthetics.
Maintenance Features and Characteristics Each maintenance element is comprised of multiple maintenance features and characteristics that represent specific maintainable items. The features and characteristics evaluated in the Florida MRP are as follows (3): • Roadway
Flexible pothole, Flexible edge raveling, Flexible shoving, Flexible depression/bump, Flexible shoulder/turnout, Rigid pothole, Rigid depression/bump, Rigid joint/cracking, Rigid shoulder/turnout
• Roadside Unpaved shoulder, Front slope, Slope pavement, Sidewalk, Fencing
• Traffic services Raised pavement markers, Pavement striping, Pavement symbols, Guardrail, Attenuator, Signs δ 30 ft2, Signs > 30 ft2, Object markers/ delineators, Lighting
• Drainage Side or cross drain, Roadside or median ditch, Outfall ditch, Inlets, Miscellaneous drainage structure, Roadway sweeping
• Vegetation and aesthetics Roadside mowing, Slope mowing, Landscaping, Tree trimming, Curb or sidewalk edge, Litter removal, Turf condition
28
Each feature or characteristic is rated in the field according to whether it meets a pre-defined condition standard. Development and Reporting of MRP Ratings The pass–fail ratings collected in the field from multiple 0.1-mile sample segments are used with level-of-importance weighting factors to develop LOS ratings for individual facility type–DOT district combinations. The weighting factors include feature and characteristic weightings (0-to-10 scale) that reflect how important each feature or characteristic in a maintenance element is to that element, and element weightings (0-to-100 percent scale) that reflect how important each element is to the overall system. The starting point in the MRP calculation process is identifying, for each feature or characteristic, the percentage of sample segments in which the feature or characteristic met the predefined condition standard. Applying the respective feature or characteristic weightings to these percentages results in individual MRP element ratings for the chosen facility type–DOT district combination. Applying the respective element weightings to the individual element ratings produces one overall MRP rating for the facility type–DOT district combination. Using the centerline mileage associated with each facility type in a DOT district, an overall MRP rating for the district is computed. Similarly, by using the centerline mileage associated with each facility type for all DOT districts, an overall MRP rating for the entire state is computed. The completed MRP results are summarized for distribution to all levels of management. The results, which are shown on a 0-to-100 scale (with 80 and above being considered acceptable), are then used to identify areas (features and characteristics, elements, roadways) that may need additional funding to return to the desired level of compliance.

29
Appendix 2: Expert Questionnaire
UNIVERSITY OF CENTRAL FLORIDA
FLORIDA MAINTENANCE RATING PROGRAM (MRP) ASSESSMENT AND ENHANCEMENT
PHASE I
FDOT#: BD548-28
EXPERT’S OPINION QUESTIONNAIRE
ON
MRP STUDY Thank you for your cooperation, please provide your contact information:
Name: ______________________________________________ Position: ______________________________________________ Phone: ______________________________________________ e-mail: ______________________________________________
Please send your response to the questionnaire by e-mail – preferred - to: [email protected] Or by regular mail to: Dr. Yasser Hosni UCF-CATSS 4000 Central Florida Blvd. Orlando, FL 32816 Tel: (407) 823-5817 Fax: (407) 823-3413 E-mail: [email protected]

30
Dear Highway Maintenance Expert, You have been selected to participate in the effort to devise a more robust Maintenance Rating Program (MRP) for the State of Florida. The Current Florida Department of Transportation (FDOT) Highway maintenance program goals include safety, protection of public investment, environmental impacts, and cost optimization. To achieve its goals FDOT uses the Maintenance Rating Program (MRP) to assess the State Highway conditions. MRP is based on a sampling process that rates four primary categories of highways three times a year. The four road categories are: Rural Limited Access, Rural Arterial, Urban Limited access, and Urban Arterial. Elements rated for each road category are Roadway (ex.: potholes etc.), Roadside (ex.: shoulders), Traffic Services (ex.: signs, lighting), Drainage (ex.: ditches), and Vegetation and Aesthetics (ex.: mowing, litter removal). Each feature or characteristic is rated in the field according to whether it meets a pre-defined Level of Performance (LOP). An overall maintenance condition is calculated by applying respective element weightings to the individual element ratings, producing one overall MRP rating for the facility type (rural and urban arterial highways, rural and urban limited access highways). A maintenance rating of 80 is considered acceptable. The Department's objective is to ensure that 100 percent of the State Highway System meets the maintenance standard. A complete overview of the MRP system is provided in http://www.dot.state.fl.us/statemaintenanceoffice/mrp.htm. Researchers from the University of Central Florida (UCF) are tasked with devising a more robust MRP. Specifically, UCF researchers are to develop and document a methodology to determine the element “weights” used in computing the MRP for a road facility. This questionnaire is meant to solicit your opinion and evaluation of the following:
I. Additional Objectives for Road Maintenance Program, and the relative importance of each. II. Additional Maintenance Elements and their respective weights used in the rating system.
III. Additional Features/ Characteristics that should be examined and their contribution to the road Elements.
IV. Sampling Mechanism. V. Overall Evaluation
The procedure involves pair-wise comparisons between different elements of the system at different levels for every road category. The following diagram illustrates the structure of the Maintenance Rating Program.

31
-Flexible
-Flexible pothole
-Flexible edge raveling -Flexible shoving
-Flexible depression/ bump
OR
-Rigid
-Rigid pothole -Rigid depression/ bump -Rigid joint/cracking -Rigid shoulder/ turnout
-Unpaved Shoulder -Front Slope
-Slope Pavement
-Sidewalk
-Fencing
-Raised pavement markers
-Pavement striping
-Pavement symbols
-Guardrails
-Attenuators
-Sign ≤ 30 ft2
-Sign > 30 ft2
-Object markers/ delineators
-Lighting
-Side or cross drain
-Roadside Or median ditch
-Outfall ditch
-Inlets
-Miscellaneous drainage structure
-Roadway sweeping
-Roadside mowing
-Slope mowing
-Landscaping
-Tree trimming
-Curb or sidewalk edge
-Litter removal
-Turf condition
Feat
ures
Roadway Roadside Traffic Drainage Vegetation &
AestheticsEle
men
ts
Attaining the Overall MRP
Safety Protecting Public Investment
Environmental Aspects
Cost (Expenditures) O
bjec
tives

32
I. OBJECTIVES AND THEIR WEIGHTS In the following table provide a percentage value reflecting the relative importance of each of the objectives. Provide any additional objectives that you feel should be included in the objectives
Obj# Objective Current
Relative Importance
Percentage (1)
Your Relative Importance Percentage
1 Safety 70 2 Protecting Public Investment 10 3 Environmental Aspects 10 4 Minimize Expenditure 10 5 6
TOTALS 100 100
(1) Our assessment on Current Relative Importance (2) Additional Space for comments (Obj#, Comments)
33
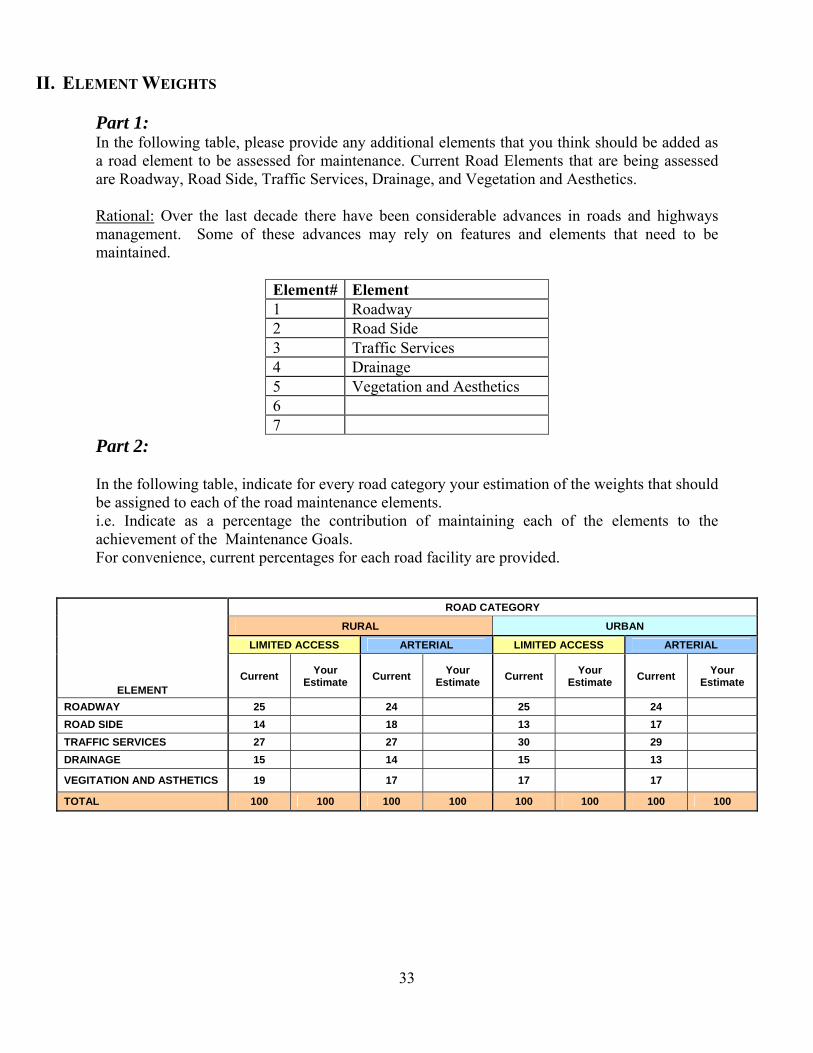
II. ELEMENT WEIGHTS Part 1: In the following table, please provide any additional elements that you think should be added as a road element to be assessed for maintenance. Current Road Elements that are being assessed are Roadway, Road Side, Traffic Services, Drainage, and Vegetation and Aesthetics. Rational: Over the last decade there have been considerable advances in roads and highways management. Some of these advances may rely on features and elements that need to be maintained.
Element# Element 1 Roadway 2 Road Side 3 Traffic Services 4 Drainage 5 Vegetation and Aesthetics 6 7
Part 2: In the following table, indicate for every road category your estimation of the weights that should be assigned to each of the road maintenance elements. i.e. Indicate as a percentage the contribution of maintaining each of the elements to the achievement of the Maintenance Goals. For convenience, current percentages for each road facility are provided.
ROAD CATEGORY
RURAL URBAN
LIMITED ACCESS ARTERIAL LIMITED ACCESS ARTERIAL
ELEMENT Current Your
Estimate Current Your Estimate Current Your
Estimate Current Your Estimate
ROADWAY 25 24 25 24 ROAD SIDE 14 18 13 17 TRAFFIC SERVICES 27 27 30 29 DRAINAGE 15 14 15 13
VEGITATION AND ASTHETICS 19 17 17 17
TOTAL 100 100 100 100 100 100 100 100

34
III. FEATURES/ CHARACTERISTICS WEIGHTS (1) The following table lists the Elements, the Feature/ Characteristics associated with each Element, and the
Current “C” level of importance of each Feature/ Characteristic on a scale from 0 to 9 for each of the Facility Types. You are solicited to provide your own Suggested “S” level of importance on the same scale (0 to 9) in columns 1 to 4, where 9 is Extremely important, and 0 is not relevant.
(2) Current System uses a pass/ Fail inspection for each feature by measuring the feature against a preset level of performance (LOP). It is suggested that some of the features may be more amenable to be evaluated on a scale (Ex: 0 to 5, where 0 means completely failing the LOP, and 5 is meeting or exceeding the LOP.) In Column [5] you are requested to Mark (X) on the feature, you think its LOP should measured on a scale rather than Pass/ Fail
FACILITY TYPE KEY TYPE 1 --- RURAL LIMITED ACCESS C : Current Value TYPE 2 --- RURAL ARTERIAL S : Suggested Value - Your estimation TYPE 3 --- URBAN LIMITED ACCESS TYPE 4 --- URBAN ARTERIAL
1 2 3 4 1 2 3 4
Roadway C S C S C S C S5
Drainage C S C S C S C S5
Flexible pothole 9 9 9 8 Side/Cross Drain 7 7 7 7 Flexible edge raveling 5 7 5 5 Roadside/Median Ditch 4 4 4 4 Flexible shoving 5 6 5 6 Outfall Ditch 6 6 6 7 Flexible depression/bump 6 6 6 6 Inlets 7 8 8 8 Flexible shoulder/turnout 5 6 5 6 Miscellaneous Drainage 5 5 5 6 Rigid pothole 9 9 9 8 Roadway Sweeping 5 4 7 7
Rigid depression/bump 6 6 6 6
Rigid joint/cracking 8 7 8 7
Rigid shoulder/turnout 5 6 5 6
Roadside C S C S C S C S 5 Vegetation & Aesthetics C S C S C S C S 5
Unpaved shoulder 9 9 9 9 Roadside mowing 7 7 7 7 Front slope 6 7 6 7 Slope mowing 6 6 6 6 Slope pavement 6 6 6 6 Landscaping 4 4 5 5 Sidewalk 0 7 0 7 Tree trimming 6 6 7 6 Fencing 7 6 6 6 Curb or sidewalk edge 6 6 6 7
Litter removal 3 3 4 4
Traffic Services C S C S C S C S 5 Turf condition 6 6 7 7
Raised pavement markers 9 9 9 9 Pavement striping 8 8 8 8 FACILITY TYPE KEY Pavement symbols 7 7 7 8 Guardrail 9 9 9 9 TYPE 1 --- RURAL LIMITED ACCESS Attenuator 9 9 9 9 TYPE 2 --- RURAL ARTERIAL Signs ≤ 30 ft2 9 9 9 9 TYPE 3 --- URBAN LIMITED ACCESS Signs > 30 ft2 8 8 8 8 TYPE 4 --- URBAN ARTERIAL Object markers/delineators 7 7 7 7 C : Current Value Lighting 8 8 8 8 S: Suggested Value - Your estimation

35
IV. THE SAMPLING MECHANISM (1) Currently, State Roads are evaluated 3 times a year. In your opinion do you think this is adequate or needs a change? Mark “X” where appropriate:
Number of Evaluations per Year 1 2 3 4
(2) Should sampling be performed state-wide or district-wide on the 4 main facility types rather than being performed maintenance cost-center-wide on the 4 facility types? Circle Your Preference!
a- Yes b- No (3) In your opinion, do you think that inspecting and assessing 30 sample segments per road facility category in each maintenance area is a fair assessment for the conditions of the road types? Mark “X” in front of your preference:
Number of Samples Preference Should be more than 30 Should be 30 Should be less than 30 Should be proportional to the road length
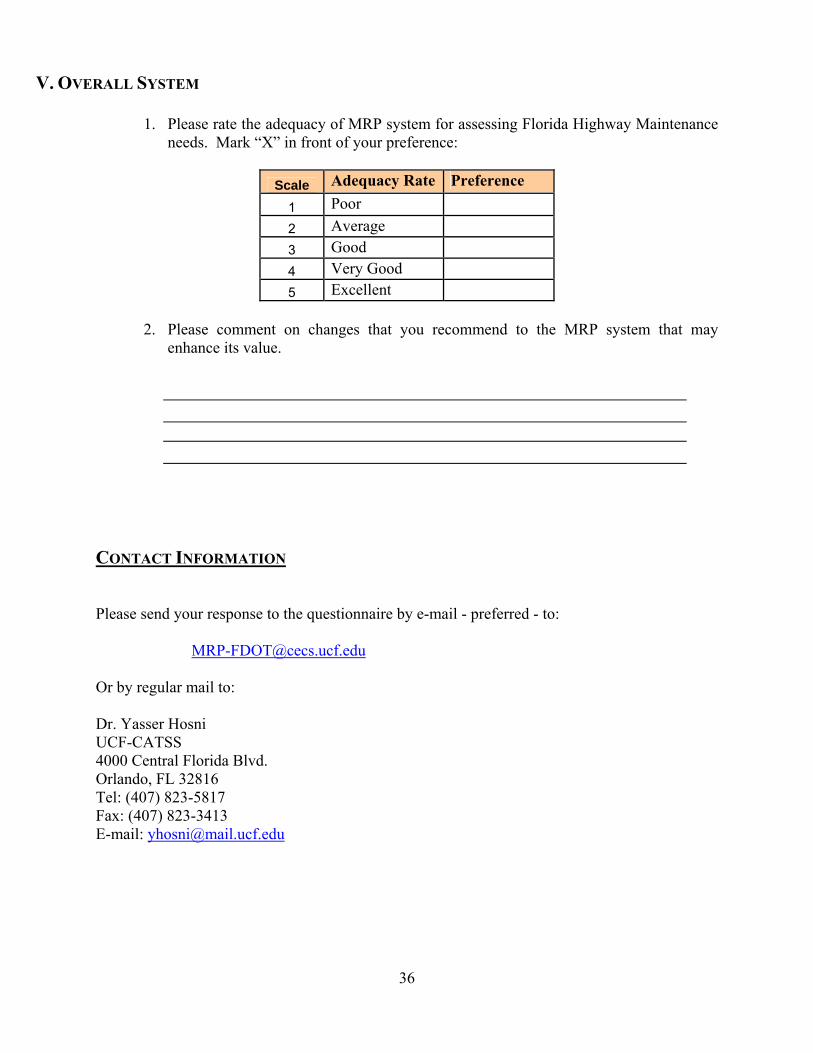
36
V. OVERALL SYSTEM
1. Please rate the adequacy of MRP system for assessing Florida Highway Maintenance needs. Mark “X” in front of your preference:
Scale Adequacy Rate Preference
1 Poor 2 Average 3 Good 4 Very Good 5 Excellent
2. Please comment on changes that you recommend to the MRP system that may
enhance its value. CONTACT INFORMATION Please send your response to the questionnaire by e-mail - preferred - to: [email protected] Or by regular mail to: Dr. Yasser Hosni UCF-CATSS 4000 Central Florida Blvd. Orlando, FL 32816 Tel: (407) 823-5817 Fax: (407) 823-3413 E-mail: [email protected]
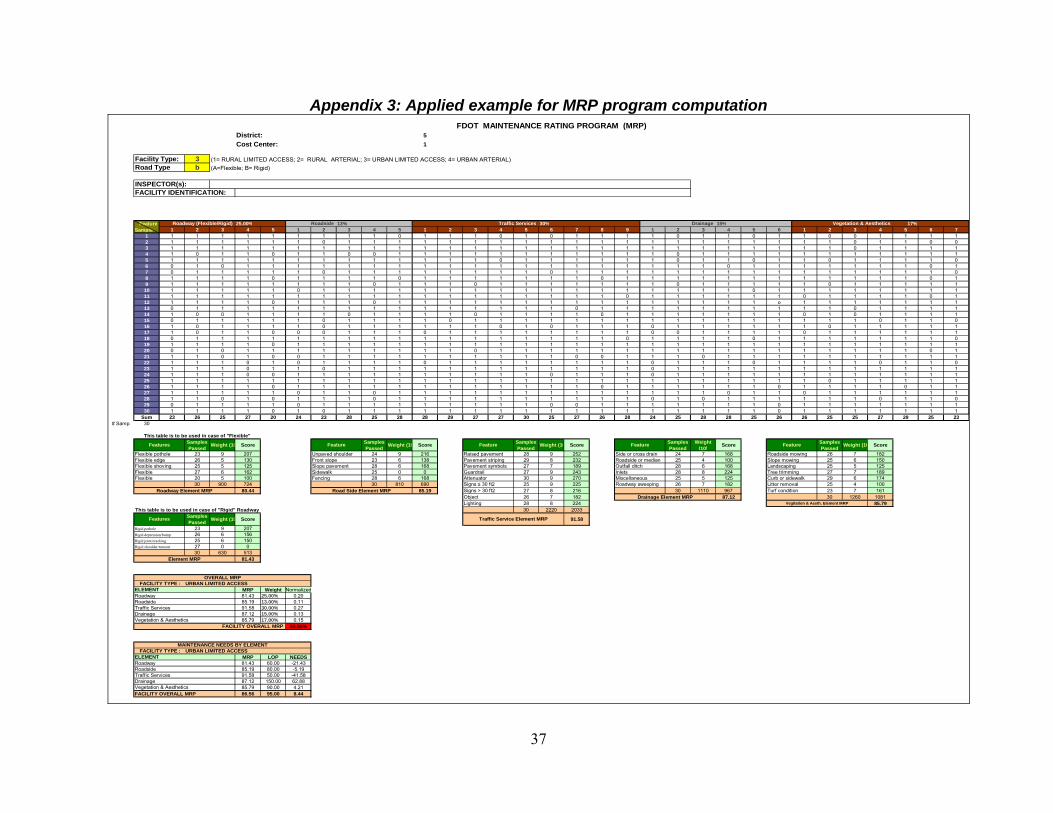
37
Appendix 3: Applied example for MRP program computation 51
Facility Type: 3 (1= RURAL LIMITED ACCESS; 2= RURAL ARTERIAL; 3= URBAN LIMITED ACCESS; 4= URBAN ARTERIAL)Road Type b (A=Flexible; B= Rigid)
25.00% 13% 30% 15% 17%1 2 3 4 5 1 2 3 4 5 1 2 3 4 5 6 7 8 9 1 2 3 4 5 6 1 2 3 4 5 6 7
1 1 1 1 1 1 1 1 1 1 0 1 1 1 0 1 0 1 1 1 1 0 1 1 0 1 1 0 0 1 1 1 12 1 1 1 1 1 1 0 1 1 1 1 1 1 1 1 1 1 1 1 1 1 1 1 1 1 1 1 0 1 1 0 03 1 1 1 1 1 1 1 1 1 1 1 1 1 1 1 1 1 1 1 1 1 1 1 1 1 1 1 0 1 1 1 14 1 0 1 1 0 1 1 0 0 1 1 1 1 1 1 1 1 1 1 1 0 1 1 1 1 1 1 1 1 1 1 15 1 1 1 1 1 1 1 1 1 1 1 1 1 0 1 1 1 1 1 1 0 1 1 0 1 1 0 1 1 1 1 06 0 1 0 1 1 1 1 1 1 1 1 1 1 1 1 1 1 1 1 1 1 1 0 1 1 1 1 1 1 1 0 17 0 1 1 1 1 1 0 1 1 1 1 1 1 1 1 0 1 1 1 1 1 1 1 1 1 1 1 1 1 1 1 08 1 1 1 1 0 1 1 1 1 0 1 1 1 1 1 1 1 0 1 1 1 1 1 1 1 1 1 1 1 1 0 19 1 1 1 1 1 1 1 1 0 1 1 1 0 1 1 1 1 1 1 1 0 1 1 1 1 1 0 1 1 1 1 110 1 1 1 1 1 0 1 1 1 1 1 1 1 1 1 1 1 1 1 1 1 1 1 0 1 1 1 1 1 1 1 111 1 1 1 1 1 1 1 1 1 1 1 1 1 1 1 1 1 1 0 1 1 1 1 1 1 0 1 1 1 1 0 112 1 1 1 1 0 1 1 1 0 1 1 1 1 1 1 1 1 1 1 1 1 1 1 1 o 1 1 1 1 1 1 113 0 1 1 1 1 1 1 1 1 1 1 1 1 1 1 1 0 1 1 1 1 1 1 1 1 1 1 0 1 1 1 114 1 0 0 1 1 1 1 0 1 1 1 1 0 1 1 1 1 0 1 1 1 1 1 1 1 0 1 0 1 1 1 115 0 1 1 1 1 1 0 1 1 1 1 0 1 1 1 1 1 1 1 1 1 1 1 1 1 1 1 1 0 1 1 016 1 0 1 1 1 1 0 1 1 1 1 1 1 0 1 0 1 1 1 0 1 1 1 1 1 1 0 1 1 1 1 117 1 0 1 1 0 0 0 1 1 1 0 1 1 1 1 1 1 1 1 0 0 1 1 1 1 0 1 1 1 1 1 118 0 1 1 1 1 1 1 1 1 1 1 1 1 1 1 1 1 1 0 1 1 1 1 0 1 1 1 1 1 1 1 019 1 1 1 1 0 1 1 1 1 1 1 1 1 1 1 1 1 1 1 1 1 1 1 1 1 1 1 1 1 1 1 120 0 1 0 1 1 1 1 1 1 1 1 1 0 1 1 1 1 1 1 1 1 1 1 1 1 1 1 1 1 1 0 121 1 1 0 1 0 0 1 1 1 1 1 1 1 1 1 1 0 0 1 1 1 0 1 1 1 1 1 1 1 1 1 122 1 1 1 0 1 0 1 1 1 1 0 1 1 1 1 1 1 1 1 0 1 1 1 0 1 1 1 1 0 1 1 023 1 1 1 0 1 1 0 1 1 1 1 1 1 1 1 1 1 1 1 0 1 1 1 1 1 1 1 1 1 1 1 124 1 1 1 0 0 1 1 1 1 1 1 1 1 1 1 0 1 1 1 0 1 1 1 1 1 1 1 1 1 1 1 125 1 1 1 1 1 1 1 1 1 1 1 1 1 1 1 1 1 1 1 1 1 1 1 1 1 1 0 1 1 1 1 126 1 1 1 1 0 1 1 1 1 1 1 1 1 1 1 1 1 0 1 1 1 1 1 1 0 1 1 1 1 0 1 127 1 1 1 1 1 0 1 1 0 1 1 1 1 1 1 1 1 1 1 1 1 1 0 1 1 0 1 1 1 1 1 128 1 1 0 1 0 1 1 1 0 1 1 1 1 1 1 1 1 1 1 0 1 0 1 1 1 1 1 1 0 1 1 029 0 1 1 1 1 0 1 1 1 1 1 1 1 1 1 0 0 1 1 1 1 1 1 1 0 1 1 1 1 1 1 130 1 1 1 1 0 1 0 1 1 1 1 1 1 1 1 1 1 1 1 1 1 1 1 1 0 1 1 1 1 1 1 1
Sum 23 26 25 27 20 24 23 28 25 28 28 29 27 27 30 25 27 26 28 24 25 28 28 25 26 26 25 25 27 29 25 23# Samp. 30
Samples Passed
Weight (10 Score Samples Passed
Weight (10 Score Samples Passed
Weight (10 Score Samples Passed
Weight (10)
Score Samples Passed
Weight (10 Score
23 9 207 24 9 216 28 9 252 24 7 168 26 7 18226 5 130 23 6 138 29 8 232 25 4 100 25 6 15025 5 125 28 6 168 27 7 189 28 6 168 25 5 12527 6 162 25 0 0 27 9 243 28 8 224 27 7 18920 5 100 28 6 168 30 9 270 25 5 125 29 6 17430 900 724 30 810 690 25 9 225 26 7 182 25 4 100
80.44 85.19 27 8 216 30 1110 967 23 7 16126 7 182 87.12 30 1260 108128 8 224 85.7930 2220 2033
Samples Passed Weight (10 Score 91.58
23 9 20726 6 15625 6 15027 0 030 630 513
81.43
MRP Weight Normalized81.43 25.00% 0.2085.19 13.00% 0.1191.58 30.00% 0.2787.12 15.00% 0.1385.79 17.00% 0.15
86.56%
MRP LOP NEEDS81.43 60.00 -21.4385.19 80.00 -5.1991.58 50.00 -41.5887.12 150.00 62.8885.79 90.00 4.21
FACILITY OVERALL MRP 86.56 95.00 8.44
ELEMENTRoadway Roadside Traffic ServicesDrainage Vegetation & Aesthetics
Traffic ServicesDrainage Vegetation & Aesthetics
FACILITY OVERALL MRP
MAINTENANCE NEEDS BY ELEMENT FACILITY TYPE : URBAN LIMITED ACCESS
OVERALL MRP FACILITY TYPE : URBAN LIMITED ACCESS
ELEMENTRoadway Roadside
Rigid potholeRigid depression/bumpRigid joint/crackingRigid shoulder/turnout
Element MRP
Lighting Vegitation & Aesth. Element MRP
This table is to be used in case of "Rigid" Roadway
Features Traffic Service Element MRP
Roadway Element MRP Road Side Element MRP Signs > 30 ft2 Turf conditionObject Drainage Element MRP
Flexible Fencing Attenuator Miscellaneous Curb or sidewalk Signs ≤ 30 ft2 Roadway sweeping Litter removal
Flexible shoving Slope pavement Pavement symbols Outfall ditch LandscapingFlexible Sidewalk Guardrail Inlets Tree trimming
Flexible pothole Unpaved shoulder Raised pavement Side or cross drain Roadside mowingFlexible edge Front slope Pavement striping Roadside or median Slope mowing
This table is to be used in case of "Flexible"
Features Feature Feature Feature Feature
Feature Sample
Roadway (Flexible/Rigid) Roadside Traffic Services Drainage Vegetation & Aesthetics
FDOT MAINTENANCE RATING PROGRAM (MRP)District: Cost Center:
INSPECTOR(s):FACILITY IDENTIFICATION:
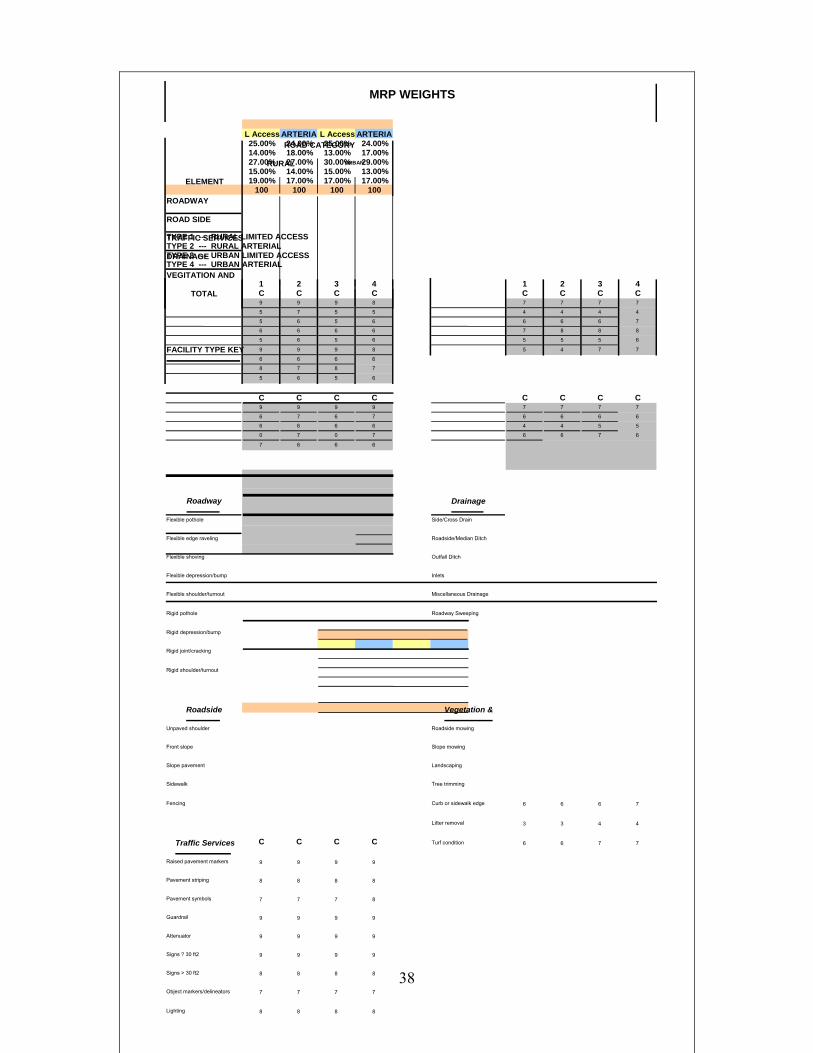
38
L Access ARTERIA L Access ARTERIA25.00% 24.00% 25.00% 24.00%14.00% 18.00% 13.00% 17.00%27.00% 27.00% 30.00% 29.00%15.00% 14.00% 15.00% 13.00%19.00% 17.00% 17.00% 17.00%
100 100 100 100
TYPE 1 --- RURAL LIMITED ACCESS TYPE 2 --- RURAL ARTERIAL TYPE 3 --- URBAN LIMITED ACCESS TYPE 4 --- URBAN ARTERIAL
1 2 3 4 1 2 3 4 C C C C C C C C 9 9 9 8 7 7 7 7 5 7 5 5 4 4 4 4 5 6 5 6 6 6 6 7 6 6 6 6 7 8 8 8 5 6 5 6 5 5 5 6 9 9 9 8 5 4 7 7 6 6 6 6
8 7 8 7
5 6 5 6
C C C C C C C C 9 9 9 9 7 7 7 7 6 7 6 7 6 6 6 6 6 6 6 6 4 4 5 5 0 7 0 7 6 6 7 6 7 6 6 6
6 6 6 7 3 3 4 4
C C C C 6 6 7 7 9 9 9 9
8 8 8 8
7 7 7 8
9 9 9 9
9 9 9 9
9 9 9 9
8 8 8 8
7 7 7 7
8 8 8 8
MRP WEIGHTS
ELEMENT ROADWAY ROAD SIDE
ROAD CATEGORY
RURAL URBAN
TRAFFIC SERVICES DRAINAGE
Signs > 30 ft2
Fencing
TOTAL
Raised pavement markers
Unpaved shoulder
Rigid joint/cracking
Flexible shoulder/turnout
Flexible edge raveling
Lighting
Pavement striping Pavement symbols Guardrail Attenuator Signs ? 30 ft2
Litter removal
Traffic Services Turf condition
VEGITATION AND
Object markers/delineators
Sidewalk
Front slope Slope mowing
Slope pavement Landscaping
Tree trimming
Curb or sidewalk edge
Rigid shoulder/turnout
Roadside Vegetation &
Roadside mowing
Inlets
Miscellaneous Drainage
Rigid pothole Roadway Sweeping
Rigid depression/bump
FACILITY TYPE KEY
Roadway Drainage
Roadside/Median Ditch
Flexible pothole Side/Cross Drain
Flexible shoving Outfall Ditch
Flexible depression/bump

39

40
Appendix 4: Questionnaire Data and Analysis
1 1 1 1 1 1 1 1 1 1 1 1 1 1 1 1 1 1 1 1 1 1 1 #Answered 233 6 7 8 16 18 19 20 21 22 24 27 32 35 38 39 40 42 45 49 50 51 52 Current RI Average Difference Max Min Variance SD Recommended
1 Safety 70 70 65 70 60 60 50 25 20 25 50 60 100 75 50 40 40 30 70 50 55 65 70 70 70 55 -15 100 20 364.72 19.10 602 Protecting Public Investment 10 10 10 10 30 15 25 25 20 25 30 10 0 9 30 10 15 20 10 20 20 20 10 10 10 17 7 30 0 67.95 8.24 183 Environmental Aspects 10 10 15 10 5 15 10 25 20 25 10 20 0 8 10 10 20 15 10 10 15 10 10 10 10 13 3 25 0 36.66 6.05 154 Minimize Expenditure 10 10 10 10 5 10 10 25 20 25 10 10 0 8 10 10 5 20 10 20 10 5 10 10 10 11 1 25 0 40.08 6.33 75 Aesthetics 5 10 10 56 Determine Work Needs 20 20 207 Free Flow Movement of Traffic 20 20 208 Pleasing Experience/Value to Public 10 10 109 Supporting economic development 20 20 20# Comfort and Convenience 5 5 5
100 100 100 100 100 100 100 100 100 100 100 100 100 100 100 100 100 100 100 100 100 100 100 100 100
1 1 1 1 1 1 0 0 1 1 1 1 1 1 1 1 1 1 1 1 1 1 1 #Answered 21ELEMENT Current 3 6 7 8 16 18 19 20 21 22 24 27 32 35 38 39 40 42 45 49 50 51 52 Current Average Difference Max Min Variance SD RecommendedROADWAY 25 25 5 5 30 25 5 Dlt20Dlt20 20 25 25 20 22 5 25 25 25 30 20 25 15 27 29 25 20.6 -4.4 30 5 72.55 8.52 20ROAD SIDE 14 18 30 30 15 14 18 Dlt20Dlt20 20 15 16 15 16 19 13 18 20 10 20 15 20 14 17 14 17.8 3.8 30 10 23.49 4.85 18TRAFFIC SERVICES 27 27 35 35 30 27 34 Dlt20Dlt20 20 30 27 30 28 37 25 25 25 30 20 30 30 27 31 27 28.7 1.7 37 20 19.81 4.45 29DRAINAGE 15 15 15 15 15 15 19 Dlt20Dlt20 20 10 16 20 15 20 12 20 20 20 20 15 15 15 18 15 16.7 1.7 20 10 8.83 2.97 16VEGITATION AND ASTHETICS 19 15 15 15 10 19 24 Dlt20Dlt20 20 20 16 15 19 19 25 12 10 10 20 15 20 17 5 19 16.2 -2.8 25 5 24.29 4.93 17
TOTAL 100 100 100 100 100 100 100 0 0 100 100 100 100 100 100 100 100 100 100 100 100 100 100 100 100 100.0 100.0
1 1 1 1 1 1 0 0 1 1 1 1 1 1 1 1 1 1 1 1 1 1 1 #Answered 21ELEMENT Current 3 6 7 8 16 18 19 20 21 22 24 27 32 35 38 39 40 42 45 49 50 51 52 Current Average Difference Max Min Variance SD RecommendedROADWAY 24 24 5 5 30 24 5 Dlt20Dlt20 20 25 25 20 21 5 25 25 25 30 20 25 14 24 28 24 20.2 -3.8 30 5 69.89 8.36 20ROAD SIDE 18 20 30 30 15 18 23 Dlt20Dlt20 20 15 16 15 19 19 13 18 20 10 20 17 21 17 19 18 18.8 0.8 30 10 22.46 4.74 19TRAFFIC SERVICES 27 27 30 30 30 27 34 Dlt20Dlt20 20 25 27 30 28 37 25 25 25 30 20 28 30 27 31 27 27.9 0.9 37 20 15.89 3.99 28DRAINAGE 14 16 20 20 15 14 17 Dlt20Dlt20 20 15 16 20 14 20 12 20 20 20 20 15 15 15 17 14 17.2 3.2 20 12 7.26 2.69 17VEGITATION AND ASTHETICS 17 13 15 15 10 17 21 Dlt20Dlt20 20 20 16 15 18 19 25 12 10 10 20 15 20 17 5 17 15.9 -1.1 25 5 22.13 4.70 16
TOTAL 100 100 100 100 100 100 100 0 0 100 100 100 100 100 100 100 100 100 100 100 100 100 100 100 100 100.0 100.0
1 1 1 1 1 1 0 0 1 1 1 1 1 1 1 1 1 1 1 1 1 1 1 #Answered 21ELEMENT Current 3 6 7 8 16 18 19 20 21 22 24 27 32 35 38 39 40 42 45 49 50 51 52 Current Average Difference Max Min Variance SD RecommendedROADWAY 25 25 5 5 30 25 5 Dlt20Dlt20 20 25 25 20 22 5 25 25 25 30 20 23 15 27 28 25 20.5 -4.5 30 5 71.06 8.43 20ROAD SIDE 13 17 25 25 15 15 16 Dlt20Dlt20 20 15 16 15 15 19 13 20 20 10 20 15 15 13 16 13 16.9 3.9 25 10 13.99 3.74 17TRAFFIC SERVICES 30 30 35 35 35 30 38 Dlt20Dlt20 20 30 27 30 30 37 25 25 25 30 20 30 30 28 33 30 29.7 -0.3 38 20 24.13 4.91 30DRAINAGE 15 15 15 15 10 13 19 Dlt20Dlt20 20 15 16 20 15 20 12 20 20 20 20 15 15 15 18 15 16.6 1.6 20 10 9.36 3.06 16VEGITATION AND ASTHETICS 17 13 20 20 10 17 22 Dlt20Dlt20 20 15 16 15 18 19 25 10 10 10 20 17 25 17 5 17 16.4 -0.6 25 5 27.55 5.25 17
TOTAL 100 100 100 100 100 100 100 0 0 100 100 100 100 100 100 100 100 100 100 100 100 100 100 100 100 100.0 100.0
1 1 1 1 1 1 0 0 1 1 1 1 1 1 1 1 1 1 1 1 1 1 1 #Answered 21ELEMENT Current 3 6 7 8 16 18 19 20 21 22 24 27 32 35 38 39 40 42 45 49 50 51 52 Current Average Difference Max Min Variance SD RecommendedROADWAY 24 24 5 5 30 24 5 Dlt20Dlt20 20 25 25 18 21 5 25 25 25 30 20 25 12 24 28 24 20.0 -4.0 30 5 71.55 8.46 20ROAD SIDE 17 19 20 20 15 17 21 Dlt20Dlt20 20 20 16 17 17 15 13 15 20 10 20 16 16 17 20 17 17.3 0.3 21 10 8.03 2.83 17TRAFFIC SERVICES 29 29 30 30 35 29 36 Dlt20Dlt20 20 25 27 25 30 40 25 25 25 30 20 29 30 29 31 29 28.6 -0.4 40 20 22.86 4.78 29DRAINAGE 13 14 25 25 10 15 17 Dlt20Dlt20 20 10 16 20 14 28 12 20 20 20 20 15 17 13 16 13 17.5 4.5 28 10 23.26 4.82 17VEGITATION AND ASTHETICS 17 14 20 20 10 15 21 Dlt20Dlt20 20 20 16 20 18 12 25 15 10 10 20 15 25 17 5 17 16.6 -0.4 25 5 26.66 5.16 17
TOTAL 100 100 100 100 100 100 100 0 0 100 100 100 100 100 100 100 100 100 100 100 100 100 100 100 100 100.0 100.0
Florida Maintenance Rating System (MRP)
I. OBJECTIVES AND THEIR WEIGHTS
IN THE FOLLOWING TABLE PROVIDE A PERCENTAGE VALUE REFLECTING THE RELATIVE IMPORTANCE OF EACH OF THE OBJECTIVES. PROVIDE ANY ADDITIONAL OBJECTIVES THAT YOU FEEL SHOULD BE INCLUDED IN THE OBJECTIVESO
bj
Objective Current RI
TOTALS
II. ELEMENTAL WEIGHTS
IN THE FOLLOWING TABLE, INDICATE FOR EVERY ROAD CATEGORY YOUR ESTIMATION OF THE WEIGHTS THAT SHOULD BE ASSIGNED TO EACH OF THE ROAD MAINTENANCE
RURAL LIMITED ACCESS
RURAL LIMITED ARTERIAL
URBAN LIMITED ACCESS
URBAN ARTERIAL
Experts' Survey Data and Analysis
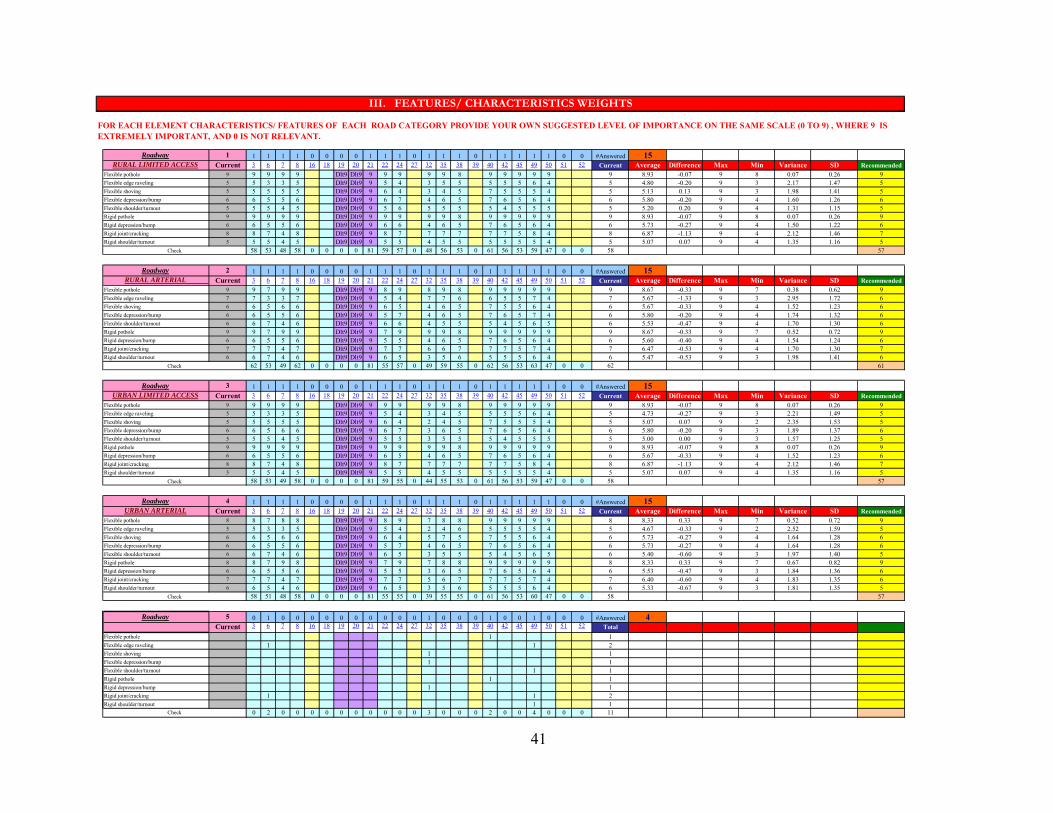
41
Roadway 1 1 1 1 1 0 0 0 0 1 1 1 0 1 1 1 0 1 1 1 1 1 0 0 #Answered 15RURAL LIMITED ACCESS Current 3 6 7 8 16 18 19 20 21 22 24 27 32 35 38 39 40 42 45 49 50 51 52 Current Average Difference Max Min Variance SD Recommended
Flexible pothole 9 9 9 9 9 Dlt9 Dlt9 9 9 9 9 9 8 9 9 9 9 9 9 8.93 -0.07 9 8 0.07 0.26 9Flexible edge raveling 5 5 3 3 5 Dlt9 Dlt9 9 5 4 3 5 5 5 5 5 6 4 5 4.80 -0.20 9 3 2.17 1.47 5Flexible shoving 5 5 5 5 5 Dlt9 Dlt9 9 6 4 3 4 5 7 5 5 5 4 5 5.13 0.13 9 3 1.98 1.41 5Flexible depression/bump 6 6 5 5 6 Dlt9 Dlt9 9 6 7 4 6 5 7 6 5 6 4 6 5.80 -0.20 9 4 1.60 1.26 6Flexible shoulder/turnout 5 5 5 4 5 Dlt9 Dlt9 9 5 6 5 5 5 5 4 5 5 5 5 5.20 0.20 9 4 1.31 1.15 5Rigid pothole 9 9 9 9 9 Dlt9 Dlt9 9 9 9 9 9 8 9 9 9 9 9 9 8.93 -0.07 9 8 0.07 0.26 9Rigid depression/bump 6 6 5 5 6 Dlt9 Dlt9 9 6 6 4 6 5 7 6 5 6 4 6 5.73 -0.27 9 4 1.50 1.22 6Rigid joint/cracking 8 8 7 4 8 Dlt9 Dlt9 9 8 7 7 7 7 7 7 5 8 4 8 6.87 -1.13 9 4 2.12 1.46 7Rigid shoulder/turnout 5 5 5 4 5 Dlt9 Dlt9 9 5 5 4 5 5 5 5 5 5 4 5 5.07 0.07 9 4 1.35 1.16 5
58 53 48 58 0 0 0 0 81 59 57 0 48 56 53 0 61 56 53 59 47 0 0 58 57
Roadway 2 1 1 1 1 0 0 0 0 1 1 1 0 1 1 1 0 1 1 1 1 1 0 0 #Answered 15RURAL ARTERIAL Current 3 6 7 8 16 18 19 20 21 22 24 27 32 35 38 39 40 42 45 49 50 51 52 Current Average Difference Max Min Variance SD Recommended
Flexible pothole 9 9 7 9 9 Dlt9 Dlt9 9 8 9 8 9 8 9 9 9 9 9 9 8.67 -0.33 9 7 0.38 0.62 9Flexible edge raveling 7 7 3 3 7 Dlt9 Dlt9 9 5 4 7 7 6 6 5 5 7 4 7 5.67 -1.33 9 3 2.95 1.72 6Flexible shoving 6 6 5 6 6 Dlt9 Dlt9 9 6 5 4 6 5 7 5 5 6 4 6 5.67 -0.33 9 4 1.52 1.23 6Flexible depression/bump 6 6 5 5 6 Dlt9 Dlt9 9 5 7 4 6 5 7 6 5 7 4 6 5.80 -0.20 9 4 1.74 1.32 6Flexible shoulder/turnout 6 6 7 4 6 Dlt9 Dlt9 9 6 6 4 5 5 5 4 5 6 5 6 5.53 -0.47 9 4 1.70 1.30 6Rigid pothole 9 9 7 9 9 Dlt9 Dlt9 9 7 9 9 9 8 9 9 9 9 9 9 8.67 -0.33 9 7 0.52 0.72 9Rigid depression/bump 6 6 5 5 6 Dlt9 Dlt9 9 5 5 4 6 5 7 6 5 6 4 6 5.60 -0.40 9 4 1.54 1.24 6Rigid joint/cracking 7 7 7 4 7 Dlt9 Dlt9 9 7 7 6 6 7 7 7 5 7 4 7 6.47 -0.53 9 4 1.70 1.30 7Rigid shoulder/turnout 6 6 7 4 6 Dlt9 Dlt9 9 6 5 3 5 6 5 5 5 6 4 6 5.47 -0.53 9 3 1.98 1.41 6
62 53 49 62 0 0 0 0 81 55 57 0 49 59 55 0 62 56 53 63 47 0 0 62 61
Roadway 3 1 1 1 1 0 0 0 0 1 1 1 0 1 1 1 0 1 1 1 1 1 0 0 #Answered 15URBAN LIMITED ACCESS Current 3 6 7 8 16 18 19 20 21 22 24 27 32 35 38 39 40 42 45 49 50 51 52 Current Average Difference Max Min Variance SD Recommended
Flexible pothole 9 9 9 9 9 Dlt9 Dlt9 9 9 9 9 9 8 9 9 9 9 9 9 8.93 -0.07 9 8 0.07 0.26 9Flexible edge raveling 5 5 3 3 5 Dlt9 Dlt9 9 5 4 3 4 5 5 5 5 6 4 5 4.73 -0.27 9 3 2.21 1.49 5Flexible shoving 5 5 5 5 5 Dlt9 Dlt9 9 6 4 2 4 5 7 5 5 5 4 5 5.07 0.07 9 2 2.35 1.53 5Flexible depression/bump 6 6 5 6 6 Dlt9 Dlt9 9 6 7 3 6 5 7 6 5 6 4 6 5.80 -0.20 9 3 1.89 1.37 6Flexible shoulder/turnout 5 5 5 4 5 Dlt9 Dlt9 9 5 5 3 5 5 5 4 5 5 5 5 5.00 0.00 9 3 1.57 1.25 5Rigid pothole 9 9 9 9 9 Dlt9 Dlt9 9 9 9 9 9 8 9 9 9 9 9 9 8.93 -0.07 9 8 0.07 0.26 9Rigid depression/bump 6 6 5 5 6 Dlt9 Dlt9 9 6 5 4 6 5 7 6 5 6 4 6 5.67 -0.33 9 4 1.52 1.23 6Rigid joint/cracking 8 8 7 4 8 Dlt9 Dlt9 9 8 7 7 7 7 7 7 5 8 4 8 6.87 -1.13 9 4 2.12 1.46 7Rigid shoulder/turnout 5 5 5 4 5 Dlt9 Dlt9 9 5 5 4 5 5 5 5 5 5 4 5 5.07 0.07 9 4 1.35 1.16 5
58 53 49 58 0 0 0 0 81 59 55 0 44 55 53 0 61 56 53 59 47 0 0 58 57
Roadway 4 1 1 1 1 0 0 0 0 1 1 1 0 1 1 1 0 1 1 1 1 1 0 0 #Answered 15URBAN ARTERIAL Current 3 6 7 8 16 18 19 20 21 22 24 27 32 35 38 39 40 42 45 49 50 51 52 Current Average Difference Max Min Variance SD Recommended
Flexible pothole 8 8 7 8 8 Dlt9 Dlt9 9 8 9 7 8 8 9 9 9 9 9 8 8.33 0.33 9 7 0.52 0.72 9Flexible edge raveling 5 5 3 3 5 Dlt9 Dlt9 9 5 4 2 4 6 5 5 5 5 4 5 4.67 -0.33 9 2 2.52 1.59 5Flexible shoving 6 6 5 6 6 Dlt9 Dlt9 9 6 4 5 7 5 7 5 5 6 4 6 5.73 -0.27 9 4 1.64 1.28 6Flexible depression/bump 6 6 5 5 6 Dlt9 Dlt9 9 5 7 4 6 5 7 6 5 6 4 6 5.73 -0.27 9 4 1.64 1.28 6Flexible shoulder/turnout 6 6 7 4 6 Dlt9 Dlt9 9 6 5 3 5 5 5 4 5 6 5 6 5.40 -0.60 9 3 1.97 1.40 5Rigid pothole 8 8 7 9 8 Dlt9 Dlt9 9 7 9 7 8 8 9 9 9 9 9 8 8.33 0.33 9 7 0.67 0.82 9Rigid depression/bump 6 6 5 5 6 Dlt9 Dlt9 9 5 5 3 6 5 7 6 5 6 4 6 5.53 -0.47 9 3 1.84 1.36 6Rigid joint/cracking 7 7 7 4 7 Dlt9 Dlt9 9 7 7 5 6 7 7 7 5 7 4 7 6.40 -0.60 9 4 1.83 1.35 6Rigid shoulder/turnout 6 6 5 4 6 Dlt9 Dlt9 9 6 5 3 5 6 5 5 5 6 4 6 5.33 -0.67 9 3 1.81 1.35 5
58 51 48 58 0 0 0 0 81 55 55 0 39 55 55 0 61 56 53 60 47 0 0 58 57
Roadway 5 0 1 0 0 0 0 0 0 0 0 0 0 1 0 0 0 1 0 0 1 0 0 0 #Answered 4Current 3 6 7 8 16 18 19 20 21 22 24 27 32 35 38 39 40 42 45 49 50 51 52 Total
Flexible pothole 1 1Flexible edge raveling 1 1 2Flexible shoving 1 1Flexible depression/bump 1 1Flexible shoulder/turnout 1 1Rigid pothole 1 1Rigid depression/bump 1 1Rigid joint/cracking 1 1 2Rigid shoulder/turnout 1 1
0 2 0 0 0 0 0 0 0 0 0 0 3 0 0 0 2 0 0 4 0 0 0 11
III. FEATURES/ CHARACTERISTICS WEIGHTS
FOR EACH ELEMENT CHARACTERISTICS/ FEATURES OF EACH ROAD CATEGORY PROVIDE YOUR OWN SUGGESTED LEVEL OF IMPORTANCE ON THE SAME SCALE (0 TO 9) , WHERE 9 IS EXTREMELY IMPORTANT, AND 0 IS NOT RELEVANT.
Check
Check
Check
Check
Check

42
Roadside 1 1 1 1 1 0 0 0 0 1 1 1 0 1 1 1 0 1 1 1 1 1 0 0 #Answered 15RURAL LIMITED ACCESS Current 3 6 7 8 16 18 19 20 21 22 24 27 32 35 38 39 40 42 45 49 50 51 52 Current Average Difference Max Min Variance SD Recommended
Unpaved shoulder 9 9 9 8 9 Dlt9 Dlt9 9 9 9 9 9 8 7 8 9 9 9 9 8.67 -0.33 9 7 0.38 0.62 9Front slope 6 5 7 7 6 Dlt9 Dlt9 9 6 7 7 6 6 5 5 6 6 7 6 6.33 0.33 9 5 1.10 1.05 6Slope pavement 6 5 5 5 6 Dlt9 Dlt9 9 6 5 5 5 6 5 5 5 6 6 6 5.60 -0.40 9 5 1.11 1.06 6Sidewalk 0 0 0 0 0 Dlt9 Dlt9 9 0 0 0 0 2 0 0 7 0 0 0 1.20 1.20 9 0 8.03 2.83 0Fencing 7 6 7 8 7 Dlt9 Dlt9 9 7 8 7 7 6 5 4 6 8 6 7 6.73 -0.27 9 4 1.64 1.28 7
25 28 28 28 0 0 0 0 45 28 29 0 28 27 28 0 22 22 33 29 28 0 0 28 28
Roadside 2 1 1 1 1 0 0 0 0 1 1 1 0 1 1 1 0 1 1 1 1 1 0 0 #Answered 15RURAL ARTERIAL Current 3 6 7 8 16 18 19 20 21 22 24 27 32 35 38 39 40 42 45 49 50 51 52 Current Average Difference Max Min Variance SD Recommended
Unpaved shoulder 9 9 9 9 9 Dlt9 Dlt9 9 9 9 9 9 8 7 8 9 9 9 9 8.73 -0.27 9 7 0.35 0.59 9Front slope 7 5 7 7 7 Dlt9 Dlt9 9 7 7 8 7 6 5 5 6 6 7 7 6.60 -0.40 9 5 1.26 1.12 7Slope pavement 6 7 5 5 6 Dlt9 Dlt9 9 6 5 5 4 6 5 5 5 6 6 6 5.67 -0.33 9 4 1.38 1.18 6Sidewalk 7 7 5 8 7 Dlt9 Dlt9 9 7 0 7 7 7 6 0 7 7 8 7 6.13 -0.87 9 0 6.98 2.64 6Fencing 6 7 5 5 6 Dlt9 Dlt9 9 6 8 7 3 6 5 4 6 6 6 6 5.93 -0.07 9 3 2.21 1.49 6
35 31 34 35 0 0 0 0 45 35 29 0 36 30 33 0 28 22 33 34 36 0 0 35 34
Roadside 3 1 1 1 1 0 0 0 0 1 1 1 0 1 1 1 0 1 1 1 1 1 0 0 #Answered 15URBAN LIMITED ACCESS Current 3 6 7 8 16 18 19 20 21 22 24 27 32 35 38 39 40 42 45 49 50 51 52 Current Average Difference Max Min Variance SD Recommended
Unpaved shoulder 9 9 9 8 9 Dlt9 Dlt9 9 9 9 9 9 8 7 8 9 9 9 9 8.67 -0.33 9 7 0.38 0.62 9Front slope 6 6 5 7 6 Dlt9 Dlt9 9 6 7 7 6 6 5 5 6 6 7 6 6.27 0.27 9 5 1.07 1.03 6Slope pavement 6 6 5 5 6 Dlt9 Dlt9 9 6 5 5 5 6 5 5 5 6 6 6 5.67 -0.33 9 5 1.10 1.05 6Sidewalk 0 0 0 0 0 Dlt9 Dlt9 9 0 0 0 0 2 0 0 7 0 0 0 1.20 1.20 9 0 8.03 2.83 0Fencing 6 6 7 8 6 Dlt9 Dlt9 9 7 6 5 6 6 5 4 6 8 6 6 6.33 0.33 9 4 1.67 1.29 7
27 26 28 27 0 0 0 0 45 28 27 0 26 26 28 0 22 22 33 29 28 0 0 27 28
Roadside 4 1 1 1 1 0 0 0 0 1 1 1 0 1 1 1 0 1 1 1 1 1 0 0 #Answered 15URBAN ARTERIAL Current 3 6 7 8 16 18 19 20 21 22 24 27 32 35 38 39 40 42 45 49 50 51 52 Current Average Difference Max Min Variance SD Recommended
Unpaved shoulder 9 9 7 9 9 Dlt9 Dlt9 9 9 9 9 9 8 7 8 9 9 9 9 8.60 -0.40 9 7 0.54 0.74 9Front slope 7 7 7 7 7 Dlt9 Dlt9 9 7 7 6 7 6 5 5 6 6 7 7 6.60 -0.40 9 5 0.97 0.99 7Slope pavement 6 6 5 5 6 Dlt9 Dlt9 9 6 5 5 4 6 5 5 5 6 6 6 5.60 -0.40 9 4 1.26 1.12 6Sidewalk 7 7 9 8 7 Dlt9 Dlt9 9 8 7 8 7 7 6 0 7 7 8 7 7.00 0.00 9 0 4.43 2.10 7Fencing 6 7 3 5 6 Dlt9 Dlt9 9 7 6 4 5 6 5 4 6 6 6 6 5.67 -0.33 9 3 2.10 1.45 6
36 31 34 35 0 0 0 0 45 37 34 0 32 32 33 0 28 22 33 34 36 0 0 35 35
Roadside 5 0 1 0 0 0 0 0 0 0 0 0 0 1 0 1 0 1 0 1 1 0 0 0 #Answered 6Current 3 6 7 8 16 18 19 20 21 22 24 27 32 35 38 39 40 42 45 49 50 51 52 Total
Unpaved shoulder 1 1 1 3Front slope 1 1 2Slope pavement 0Sidewalk 1 1 1 3Fencing 1 1 2
0 1 0 0 0 0 0 0 0 0 0 0 1 0 1 0 2 0 2 3 0 0 0 10
Check
Check
Check
Check
Check
III. FEATURES/ CHARACTERISTICS WEIGHTS
FOR EACH ELEMENT CHARACTERISTICS/ FEATURES OF EACH ROAD CATEGORY PROVIDE YOUR OWN SUGGESTED LEVEL OF IMPORTANCE ON THE SAME SCALE (0 TO 9) , WHERE 9 IS EXTREMELY IMPORTANT, AND 0 IS NOT RELEVANT.

43
Traffic Services 1 1 1 1 1 0 0 0 0 1 1 1 0 1 1 1 0 1 1 1 1 1 0 1 #Answered 16RURAL LIMITED ACCESS Current 3 6 7 8 16 18 19 20 21 22 24 27 32 35 38 39 40 42 45 49 50 51 52 Current Average Difference Max Min Variance SD Recommended
Raised pavement markers 9 9 9 9 9 Dlt9 Dlt9 9 9 9 9 9 8 7 9 9 9 9 9 9 8.81 -0.19 9 7 0.30 0.54 9Pavement striping 8 8 9 9 8 Dlt9 Dlt9 9 9 7 8 9 8 7 8 7 9 9 8 8 8.25 0.25 9 7 0.60 0.77 8Pavement symbols 7 7 5 8 7 Dlt9 Dlt9 9 7 5 7 7 7 5 6 7 7 7 7 7 6.75 -0.25 9 5 1.13 1.06 7Guardrail 9 9 9 9 9 Dlt9 Dlt9 9 9 9 9 9 9 7 9 9 9 9 9 9 8.88 -0.13 9 7 0.25 0.50 9Attenuator 9 9 9 9 9 Dlt9 Dlt9 9 9 8 9 9 9 7 9 9 9 9 9 9 8.81 -0.19 9 7 0.30 0.54 9Signs ≤ 30 ft2 9 9 7 9 9 Dlt9 Dlt9 9 9 9 9 9 9 6 9 8 9 9 9 9 8.63 -0.38 9 6 0.78 0.89 9Signs > 30 ft2 8 9 9 8 8 Dlt9 Dlt9 9 9 7 8 8 8 4 8 7 8 8 8 8 7.88 -0.13 9 4 1.45 1.20 8Object markers/delineators 7 8 5 7 7 Dlt9 Dlt9 9 7 5 6 7 6 5 6 7 6 6 8 7 6.56 -0.44 9 5 1.33 1.15 7Lighting 8 7 5 8 8 Dlt9 Dlt9 9 8 9 8 7 8 5 8 7 7 8 8 8 7.50 -0.50 9 5 1.33 1.15 8
75 67 76 74 0 0 0 0 81 76 68 0 73 74 72 0 53 72 70 73 74 0 75 74 74
Traffic Services 2 1 1 1 1 0 0 0 0 1 1 1 0 1 1 1 0 1 1 1 1 1 0 1 #Answered 16RURAL ARTERIAL Current 3 6 7 8 16 18 19 20 21 22 24 27 32 35 38 39 40 42 45 49 50 51 52 Current Average Difference Max Min Variance SD Recommended
Raised pavement markers 9 9 9 9 9 Dlt9 Dlt9 9 8 9 9 9 8 7 9 9 9 9 9 9 8.75 -0.25 9 7 0.33 0.58 9Pavement striping 8 8 9 9 8 Dlt9 Dlt9 9 8 7 8 9 8 7 8 7 9 9 8 8 8.19 0.19 9 7 0.56 0.75 8Pavement symbols 7 7 5 8 7 Dlt9 Dlt9 9 7 5 7 6 7 5 6 7 7 7 7 7 6.69 -0.31 9 5 1.16 1.08 7Guardrail 9 9 9 9 9 Dlt9 Dlt9 9 9 9 9 9 9 7 9 9 9 9 9 9 8.88 -0.13 9 7 0.25 0.50 9Attenuator 9 9 9 9 9 Dlt9 Dlt9 9 9 8 9 9 9 7 9 9 9 9 9 9 8.81 -0.19 9 7 0.30 0.54 9Signs ≤ 30 ft2 9 9 7 9 9 Dlt9 Dlt9 9 9 9 9 9 9 6 9 8 9 9 9 9 8.63 -0.38 9 6 0.78 0.89 9Signs > 30 ft2 8 9 7 8 8 Dlt9 Dlt9 9 8 7 8 8 8 4 8 7 8 8 8 8 7.69 -0.31 9 4 1.30 1.14 8Object markers/delineators 7 8 7 7 7 Dlt9 Dlt9 9 7 5 6 7 6 5 6 7 7 6 8 7 6.75 -0.25 9 5 1.13 1.06 7Lighting 8 7 5 8 8 Dlt9 Dlt9 9 8 9 8 7 8 5 8 7 7 8 8 8 7.50 -0.50 9 5 1.33 1.15 8
75 67 76 74 0 0 0 0 81 73 68 0 73 73 72 0 53 72 70 74 74 0 75 74 74
Traffic Services 3 1 1 1 1 0 0 0 0 1 1 1 0 1 1 1 0 1 1 1 1 1 0 1 #Answered 16URBAN LIMITED ACCESS Current 3 6 7 8 16 18 19 20 21 22 24 27 32 35 38 39 40 42 45 49 50 51 52 Current Average Difference Max Min Variance SD Recommended
Raised pavement markers 9 9 9 9 9 Dlt9 Dlt9 9 9 9 9 9 8 7 9 9 9 9 9 9 8.81 -0.19 9 7 0.30 0.54 9Pavement striping 8 8 9 9 8 Dlt9 Dlt9 9 9 9 8 9 8 7 8 7 8 9 8 8 8.31 0.31 9 7 0.50 0.70 8Pavement symbols 7 7 7 8 7 Dlt9 Dlt9 9 8 8 8 7 7 5 6 7 7 7 7 7 7.19 0.19 9 5 0.83 0.91 7Guardrail 9 9 9 9 9 Dlt9 Dlt9 9 9 9 9 9 9 7 9 9 9 9 9 9 8.88 -0.13 9 7 0.25 0.50 9Attenuator 9 9 9 9 9 Dlt9 Dlt9 9 9 9 9 9 9 7 9 9 9 9 9 9 8.88 -0.13 9 7 0.25 0.50 9Signs ≤ 30 ft2 9 9 9 9 9 Dlt9 Dlt9 9 9 8 9 9 9 6 9 8 9 9 9 9 8.69 -0.31 9 6 0.63 0.79 9Signs > 30 ft2 8 9 7 8 8 Dlt9 Dlt9 9 9 7 8 8 8 4 8 7 8 8 8 8 7.75 -0.25 9 4 1.40 1.18 8Object markers/delineators 7 8 5 7 7 Dlt9 Dlt9 9 7 5 6 7 6 5 6 7 6 6 8 7 6.56 -0.44 9 5 1.33 1.15 7Lighting 8 7 7 8 8 Dlt9 Dlt9 9 9 9 7 8 8 5 8 7 9 8 8 8 7.81 -0.19 9 5 1.10 1.05 8
75 71 76 74 0 0 0 0 81 78 73 0 73 75 72 0 53 72 70 74 74 0 75 74 74
Traffic Services 4 1 1 1 1 0 0 0 0 1 1 1 0 1 1 1 0 1 1 1 1 1 0 1 #Answered 16URBAN ARTERIAL Current 3 6 7 8 16 18 19 20 21 22 24 27 32 35 38 39 40 42 45 49 50 51 52 Current Average Difference Max Min Variance SD Recommended
Raised pavement markers 9 9 5 9 9 Dlt9 Dlt9 9 8 9 9 9 8 7 9 9 9 9 9 9 8.50 -0.50 9 5 1.20 1.10 9Pavement striping 8 8 9 9 8 Dlt9 Dlt9 9 8 9 8 9 8 7 8 7 8 9 8 8 8.25 0.25 9 7 0.47 0.68 8Pavement symbols 8 7 9 8 8 Dlt9 Dlt9 9 8 9 8 8 7 5 6 7 8 7 8 8 7.63 -0.38 9 5 1.18 1.09 8Guardrail 9 9 7 9 9 Dlt9 Dlt9 9 9 9 9 9 9 7 9 9 9 9 9 9 8.75 -0.25 9 7 0.47 0.68 9Attenuator 9 9 7 9 9 Dlt9 Dlt9 9 9 8 9 9 9 7 9 9 9 9 9 9 8.69 -0.31 9 7 0.50 0.70 9Signs ≤ 30 ft2 9 9 9 9 9 Dlt9 Dlt9 9 9 8 9 9 9 6 9 8 9 9 9 9 8.69 -0.31 9 6 0.63 0.79 9Signs > 30 ft2 8 9 5 8 8 Dlt9 Dlt9 9 9 7 8 8 8 4 8 7 8 8 8 8 7.63 -0.38 9 4 1.85 1.36 8Object markers/delineators 7 8 3 7 7 Dlt9 Dlt9 9 7 5 6 7 6 5 6 7 7 6 8 7 6.50 -0.50 9 3 2.00 1.41 7Lighting 8 7 9 8 8 Dlt9 Dlt9 9 9 9 7 8 8 5 8 7 7 8 8 8 7.81 -0.19 9 5 1.10 1.05 8
75 63 76 75 0 0 0 0 81 76 73 0 73 76 72 0 53 72 70 74 74 0 76 75 75
Traffic Services 5 0 1 0 0 0 0 0 0 0 0 0 0 1 0 1 0 1 0 1 1 0 0 1 #Answered 7Current 3 6 7 8 16 18 19 20 21 22 24 27 32 35 38 39 40 42 45 49 50 51 52 Frequency %age
Raised pavement markers 1 1 1 1 4 57%Pavement striping 1 1 1 3 43%Pavement symbols 1 1 2 29%Guardrail 0 0%Attenuator 0 0%Signs ≤ 30 ft2 1 1 2 29%Signs > 30 ft2 1 1 2 29%Object markers/delineators 1 1 2 29%Lighting 1 1 2 29%
0 2 0 0 0 0 0 0 0 0 0 0 2 0 4 0 5 0 2 1 0 0 1 17
Check
Check
Check
Check
Check
III. FEATURES/ CHARACTERISTICS WEIGHTS
FOR EACH ELEMENT CHARACTERISTICS/ FEATURES OF EACH ROAD CATEGORY PROVIDE YOUR OWN SUGGESTED LEVEL OF IMPORTANCE ON THE SAME SCALE (0 TO 9) , WHERE 9 IS

44
Drainage 1 1 1 1 1 0 0 0 0 1 1 1 0 1 1 1 0 1 1 1 1 1 0 0 #Answered 15RURAL LIMITED ACCESS Current 3 6 7 8 16 18 19 20 21 22 24 27 32 35 38 39 40 42 45 49 50 51 52 Current Average Difference Max Min Variance SD Recommended
Side/Cross Drain 7 7 7 7 7 Dlt9 Dlt9 9 6 8 7 7 7 7 7 7 7 8 7 7.20 0.20 9 6 0.46 0.68 7Roadside/Median Ditch 4 4 5 5 4 Dlt9 Dlt9 9 5 4 3 4 4 7 4 6 4 5 4 4.87 0.87 9 3 2.27 1.51 5Outfall Ditch 6 5 5 5 6 Dlt9 Dlt9 9 6 5 5 5 6 5 5 6 6 5 6 5.60 -0.40 9 5 1.11 1.06 6Inlets 7 7 5 8 7 Dlt9 Dlt9 9 8 8 6 8 7 7 7 8 6 8 7 7.27 0.27 9 5 1.07 1.03 7Miscellaneous Drainage 5 4 5 5 5 Dlt9 Dlt9 9 6 5 4 5 5 5 4 5 5 6 5 5.20 0.20 9 4 1.46 1.21 5Roadway Sweeping 5 4 7 4 5 Dlt9 Dlt9 9 5 5 4 5 7 5 4 4 6 6 5 5.33 0.33 9 4 2.10 1.45 5
31 34 34 34 0 0 0 0 54 36 35 0 29 34 36 0 36 31 36 34 38 0 0 34 35
Drainage 2 1 1 1 1 0 0 0 0 1 1 1 0 1 1 1 0 1 1 1 1 1 0 0 #Answered 15RURAL ARTERIAL Current 3 6 7 8 16 18 19 20 21 22 24 27 32 35 38 39 40 42 45 49 50 51 52 Current Average Difference Max Min Variance SD Recommended
Side/Cross Drain 7 7 7 7 7 Dlt9 Dlt9 9 6 8 7 7 7 7 7 7 7 8 7 7.20 0.20 9 6 0.46 0.68 7Roadside/Median Ditch 4 4 5 5 4 Dlt9 Dlt9 9 4 4 4 5 4 7 4 6 4 5 4 4.93 0.93 9 4 2.07 1.44 5Outfall Ditch 6 5 5 5 6 Dlt9 Dlt9 9 6 5 5 5 6 5 5 6 6 5 6 5.60 -0.40 9 5 1.11 1.06 6Inlets 8 7 7 8 8 Dlt9 Dlt9 9 8 8 8 8 8 7 7 8 7 8 8 7.73 -0.27 9 7 0.35 0.59 8Miscellaneous Drainage 5 4 5 5 5 Dlt9 Dlt9 9 5 5 5 5 5 5 4 5 5 6 5 5.20 0.20 9 4 1.31 1.15 5Roadway Sweeping 4 4 5 3 4 Dlt9 Dlt9 9 4 5 4 4 6 5 4 4 5 6 4 4.80 0.80 9 3 2.03 1.42 5
31 34 33 34 0 0 0 0 54 33 35 0 33 34 36 0 36 31 36 34 38 0 0 34 36
Drainage 3 1 1 1 1 0 0 0 0 1 1 1 0 1 1 1 0 1 1 1 1 1 0 0 #Answered 15URBAN LIMITED ACCESS Current 3 6 7 8 16 18 19 20 21 22 24 27 32 35 38 39 40 42 45 49 50 51 52 Current Average Difference Max Min Variance SD Recommended
Side/Cross Drain 7 7 7 7 7 Dlt9 Dlt9 9 7 8 8 7 7 7 7 7 7 8 7 7.33 0.33 9 7 0.38 0.62 7Roadside/Median Ditch 4 4 5 5 4 Dlt9 Dlt9 9 5 4 3 4 4 7 4 6 4 5 4 4.87 0.87 9 3 2.27 1.51 5Outfall Ditch 6 6 5 5 6 Dlt9 Dlt9 9 7 5 5 5 6 5 5 6 6 5 6 5.73 -0.27 9 5 1.21 1.10 6Inlets 8 7 9 8 8 Dlt9 Dlt9 9 9 8 8 8 8 7 7 8 8 8 8 8.00 0.00 9 7 0.43 0.65 8Miscellaneous Drainage 5 4 5 5 5 Dlt9 Dlt9 9 6 5 4 6 5 5 4 5 5 6 5 5.27 0.27 9 4 1.50 1.22 5Roadway Sweeping 7 4 7 5 7 Dlt9 Dlt9 9 8 5 7 6 7 5 4 4 8 6 7 6.13 -0.87 9 4 2.55 1.60 6
32 38 35 37 0 0 0 0 54 42 35 0 35 36 37 0 36 31 36 38 38 0 0 37 37
Drainage 4 1 1 1 1 0 0 0 0 1 1 1 0 1 1 1 0 1 1 1 1 1 0 0 #Answered 15URBAN ARTERIAL Current 3 6 7 8 16 18 19 20 21 22 24 27 32 35 38 39 40 42 45 49 50 51 52 Current Average Difference Max Min Variance SD Recommended
Side/Cross Drain 7 7 9 7 7 Dlt9 Dlt9 9 6 8 8 7 7 7 7 7 7 8 7 7.40 0.40 9 6 0.69 0.83 7Roadside/Median Ditch 4 4 7 5 4 Dlt9 Dlt9 9 4 4 4 5 4 7 4 6 4 5 4 5.07 1.07 9 4 2.35 1.53 5Outfall Ditch 7 5 7 5 7 Dlt9 Dlt9 9 7 5 6 6 6 5 5 6 7 5 7 6.07 -0.93 9 5 1.35 1.16 6Inlets 8 7 9 8 8 Dlt9 Dlt9 9 8 8 8 8 8 7 7 8 8 8 8 7.93 -0.07 9 7 0.35 0.59 8Miscellaneous Drainage 6 4 7 5 6 Dlt9 Dlt9 9 7 5 5 7 5 5 4 5 6 6 6 5.73 -0.27 9 4 1.78 1.33 6Roadway Sweeping 7 7 9 5 7 Dlt9 Dlt9 9 7 5 7 6 7 5 4 4 8 6 7 6.40 -0.60 9 4 2.54 1.59 6
34 48 35 39 0 0 0 0 54 39 35 0 38 39 37 0 36 31 36 40 38 0 0 39 38
Drainage 5 0 1 0 0 0 0 0 0 0 0 0 0 1 0 1 0 1 0 1 1 0 0 0 #Answered 6Current 3 6 7 8 16 18 19 20 21 22 24 27 32 35 38 39 40 42 45 49 50 51 52 Total
Side/Cross Drain 1 1Roadside/Median Ditch 1 1Outfall Ditch 1 1Inlets 1 1 2Miscellaneous Drainage 1 1 2Roadway Sweeping 1 1 2
0 1 0 0 0 0 0 0 0 0 0 0 2 0 1 0 2 0 2 1 0 0 0 9
Check
Check
Check
Check
Check
III. FEATURES/ CHARACTERISTICS WEIGHTS
FOR EACH ELEMENT CHARACTERISTICS/ FEATURES OF EACH ROAD CATEGORY PROVIDE YOUR OWN SUGGESTED LEVEL OF IMPORTANCE ON THE SAME SCALE (0 TO 9) , WHERE 9 IS EXTREMELY IMPORTANT, AND 0 IS NOT RELEVANT.

45
Vegetation & Aesthetics 1 1 1 1 1 0 0 0 0 1 1 1 0 1 1 1 0 1 1 1 1 1 0 0 #Answered 15RURAL LIMITED ACCESS Current 3 6 7 8 16 18 19 20 21 22 24 27 32 35 38 39 40 42 45 49 50 51 52 Current Average Difference Max Min Variance SD Recommended
Roadside mowing 7 6 5 8 7 Dlt9 Dlt9 9 6 6 6 7 8 5 7 7 7 8 7 6.80 -0.20 9 5 1.31 1.15 7Slope mowing 6 5 5 7 6 Dlt9 Dlt9 9 6 6 4 5 7 4 5 4 6 6 6 5.67 -0.33 9 4 1.81 1.35 6Landscaping 4 3 3 4 4 Dlt9 Dlt9 9 4 5 2 3 6 3 3 5 4 5 4 4.20 0.20 9 2 2.89 1.70 4Tree trimming 6 7 5 7 6 Dlt9 Dlt9 9 5 6 5 7 7 5 5 5 7 7 6 6.20 0.20 9 5 1.46 1.21 6Curb or sidewalk edge 6 6 3 5 6 Dlt9 Dlt9 9 6 5 4 5 6 3 3 6 6 6 6 5.27 -0.73 9 3 2.50 1.58 5Litter removal 3 3 3 5 3 Dlt9 Dlt9 9 4 4 3 4 7 3 3 4 3 6 3 4.27 1.27 9 3 3.21 1.79 4Turf condition 6 7 7 6 6 Dlt9 Dlt9 9 6 5 5 7 6 3 5 6 5 7 6 6.00 0.00 9 3 1.86 1.36 6
37 31 42 38 0 0 0 0 63 37 37 0 29 38 47 0 26 31 37 38 45 0 0 38 38
Vegetation & Aesthetics 2 1 1 1 1 0 0 0 0 1 1 1 0 1 1 1 0 1 1 1 1 1 0 0 #Answered 15RURAL ARTERIAL Current 3 6 7 8 16 18 19 20 21 22 24 27 32 35 38 39 40 42 45 49 50 51 52 Current Average Difference Max Min Variance SD Recommended
Roadside mowing 7 6 5 8 7 Dlt9 Dlt9 9 6 6 6 7 8 5 7 7 7 8 7 6.80 -0.20 9 5 1.31 1.15 7Slope mowing 6 5 5 7 6 Dlt9 Dlt9 9 6 6 4 5 7 4 5 4 6 6 6 5.67 -0.33 9 4 1.81 1.35 6Landscaping 4 3 5 4 4 Dlt9 Dlt9 9 4 5 2 3 6 3 3 5 4 5 4 4.33 0.33 9 2 2.81 1.68 4Tree trimming 6 7 5 7 6 Dlt9 Dlt9 9 6 6 5 7 7 5 5 5 7 7 6 6.27 0.27 9 5 1.35 1.16 6Curb or sidewalk edge 6 6 5 5 6 Dlt9 Dlt9 9 6 5 4 5 6 3 3 6 6 6 6 5.40 -0.60 9 3 2.11 1.45 5Litter removal 3 3 5 5 3 Dlt9 Dlt9 9 4 4 3 4 7 3 3 4 3 6 3 4.40 1.40 9 3 3.11 1.76 4Turf condition 6 7 7 6 6 Dlt9 Dlt9 9 6 5 5 6 6 3 5 6 5 7 6 5.93 -0.07 9 3 1.78 1.33 6
37 37 42 38 0 0 0 0 63 38 37 0 29 37 47 0 26 31 37 38 45 0 0 38 38
Vegetation & Aesthetics 3 1 1 1 1 0 0 0 0 1 1 1 0 1 1 1 0 1 1 1 1 1 0 0 #Answered 15URBAN LIMITED ACCESS Current 3 6 7 8 16 18 19 20 21 22 24 27 32 35 38 39 40 42 45 49 50 51 52 Current Average Difference Max Min Variance SD Recommended
Roadside mowing 7 6 7 8 7 Dlt9 Dlt9 9 7 6 7 7 9 5 7 7 7 8 7 7.13 0.13 9 5 1.12 1.06 7Slope mowing 6 5 5 7 6 Dlt9 Dlt9 9 6 6 5 6 7 4 5 4 6 6 6 5.80 -0.20 9 4 1.60 1.26 6Landscaping 5 3 5 5 5 Dlt9 Dlt9 9 5 5 4 5 6 3 3 5 5 5 5 4.87 -0.13 9 3 2.12 1.46 5Tree trimming 7 7 5 7 7 Dlt9 Dlt9 9 7 6 6 8 7 5 5 5 8 7 7 6.60 -0.40 9 5 1.54 1.24 7Curb or sidewalk edge 6 6 3 5 6 Dlt9 Dlt9 9 6 5 4 6 6 3 3 6 6 6 6 5.33 -0.67 9 3 2.52 1.59 6Litter removal 4 3 5 5 4 Dlt9 Dlt9 9 5 4 5 6 7 3 3 4 4 6 4 4.87 0.87 9 3 2.70 1.64 5Turf condition 7 7 7 7 7 Dlt9 Dlt9 9 6 5 6 7 6 3 5 6 6 7 7 6.27 -0.73 9 3 1.78 1.33 6
37 37 44 42 0 0 0 0 63 42 37 0 37 45 48 0 26 31 37 42 45 0 0 42 42
Vegetation & Aesthetics 4 1 1 1 1 0 0 0 0 1 1 1 0 1 1 1 0 1 1 1 1 1 0 0 #Answered 15URBAN ARTERIAL Current 3 6 7 8 16 18 19 20 21 22 24 27 32 35 38 39 40 42 45 49 50 51 52 Current Average Difference Max Min Variance SD Recommended
Roadside mowing 7 6 9 8 7 Dlt9 Dlt9 9 7 6 7 7 9 5 7 7 7 8 7 7.27 0.27 9 5 1.35 1.16 7Slope mowing 6 5 7 7 6 Dlt9 Dlt9 9 6 6 5 6 7 4 5 4 6 6 6 5.93 -0.07 9 4 1.64 1.28 6Landscaping 5 4 9 5 5 Dlt9 Dlt9 9 6 5 4 6 6 3 3 5 5 5 5 5.33 0.33 9 3 3.10 1.76 5Tree trimming 6 6 9 7 6 Dlt9 Dlt9 9 7 6 7 8 7 5 5 5 7 7 6 6.73 0.73 9 5 1.64 1.28 7Curb or sidewalk edge 7 6 7 5 7 Dlt9 Dlt9 9 7 5 6 7 6 3 3 6 7 6 7 6.00 -1.00 9 3 2.43 1.56 6Litter removal 4 3 7 5 4 Dlt9 Dlt9 9 5 4 6 6 7 3 3 4 4 6 4 5.07 1.07 9 3 3.07 1.75 5Turf condition 7 7 7 7 7 Dlt9 Dlt9 9 6 5 7 8 6 3 5 6 6 7 7 6.40 -0.60 9 3 1.97 1.40 6
37 55 44 42 0 0 0 0 63 44 37 0 42 48 48 0 26 31 37 42 45 0 0 42 42
Vegetation & Aesthetics 5 0 1 0 0 0 0 0 0 0 0 0 0 1 0 1 0 1 1 0 1 0 0 0 #Answered 6Current 3 6 7 8 16 18 19 20 21 22 24 27 32 35 38 39 40 42 45 49 50 51 52 Total
Roadside mowing 1 1 1 3Slope mowing 1 1 2Landscaping 1 1 1 3Tree trimming 1 1 1 1 4Curb or sidewalk edge 1 1 2Litter removal 1 1 1 1 1 5Turf condition 1 1 1 1 1 5
0 6 0 0 0 0 0 0 0 0 0 0 4 0 2 0 3 4 0 5 0 0 0 24
III. FEATURES/ CHARACTERISTICS WEIGHTS
FOR EACH ELEMENT CHARACTERISTICS/ FEATURES OF EACH ROAD CATEGORY PROVIDE YOUR OWN SUGGESTED LEVEL OF IMPORTANCE ON THE SAME SCALE (0 TO 9) , WHERE 9 IS EXTREMELY IMPORTANT, AND 0 IS NOT RELEVANT.
Check
Check
Check
Check
Check

46
3 6 7 8 16 18 19 20 21 22 24 27 32 35 38 39 40 42 45 49 50 51 52 Total Ratio Recommended1 1 1 5% 3
2 0 0%3 1 1 1 1 1 1 1 1 1 1 1 1 1 1 1 14 64%4 1 1 1 1 1 1 1 7 32%
22 100%
Recommended1 4 7 8 9 17 19 20 21 22 23 25 28 33 36 39 40 41 43 46 50 51 52 Total Ratio No
YES 0 0.0%NO 1 1 1 1 1 1 1 1 1 1 10 52.6%
10 53%
Recommended1 4 7 8 9 17 19 20 21 22 23 25 28 33 36 39 40 41 43 46 50 51 52 Total Ratio 4
Should be more than 30 0 0%Should be 30 1 1 5%Should be less than 30 0 0%Should be proportional to the road length 1 1 1 1 1 1 1 1 1 1 10 45%
11 50%
Recommended3 6 7 8 16 18 19 20 21 22 24 27 32 35 38 39 40 42 45 49 50 51 52 Total Ratio W. Average V. Good
1 0 0% 0
2 1 1 2 9% 0.17
3 1 1 1 1 1 1 6 26% 0.784 1 1 1 1 1 1 1 1 1 1 1 11 48% 1.91
5 1 1 1 3 13% 0.65
22 96% 3.52
# of Evaluations Per Year Current
(2) SHOULD SAMPLING BE PERFORMED STATE-WIDE RATHER THAN DISTRICT-WIDE?Answer
Excellent
(3) IN YOUR OPINION, HOW SHOULD THE SAMPLE SIZE BE?Number of Samples
V. OVERALL SYSTEM PERFORMANCE
PLEASE RATE THE ADEQUACY OF MRP SYSTEM FOR ASSESSING FLORIDA HIGHWAY MAINTENANCE NEEDS ON A SCALE FROM 1 TO 5, WHERE 1 IS POOR AND 5 IS EXCELLENT.
PoorFair
AverageVery Good
Scale Adequacy Rate
IV. THE SAMPLING MECHANISM
(1) STATE ROADS ARE EVALUATED 3 TIMES A YEAR. IN YOUR OPINION HOW MANY EVALUATIONS SHOULD BE DONE PER YEAR?

47
Appendix 5: Sampling Analysis
A5.1 Margin of Error for Cost Center and Facility Type Combinations
Dist. Cost
Center Facility
Type Miles Pop. Sample
Size Error
Margin D1 190 1 31.8 318 30 0.170596 2 314 3140 30 0.178923 3 0 - 0 - 4 320.6 3206 30 0.178923 192 1 115.3 1153 30 0.178923 2 280.2 2802 30 0.178923 3 0 - 0 - 4 234.6 2346 30 0.178923 194 1 68 680 30 0.178923 2 281 2810 30 0.178923 3 0 - 0 - 4 180.2 1802 30 0.178923 D2 291 1 34.9 349 30 0.170596 2 204.4 2044 30 0.178923 3 0 - 0 - 4 124.7 1247 30 0.178923 292 1 133.4 1334 30 0.178923 2 342.4 3424 30 0.178923 3 0 - 0 - 4 82.5 825 30 0.178923 293 1 32.4 324 30 0.170596 2 258.9 2589 30 0.178923 3 0 - 0 - 4 18.2 182 30 0.163333 294 1 76 760 30 0.178923 2 260.2 2602 30 0.178923 3 54.3 543 30 0.173241 4 256.9 2569 30 0.178923 296 1 0 - 0 - 2 271.1 2711 30 0.178923 3 0 - 0 - 4 17.8 178 30 0.163333 297 1 34.6 346 30 0.170596 2 242.8 2428 30 0.178923 3 0 - 0 - 4 41.8 418 30 0.173241 D3 390 1 51.4 514 30 0.173241 2 272.5 2725 30 0.178923 3 0 - 0 - 4 72.8 728 30 0.178923 391 1 0 - 0 - 2 249.7 2497 30 0.178923 3 0 - 0 - 4 108 1080 30 0.178923
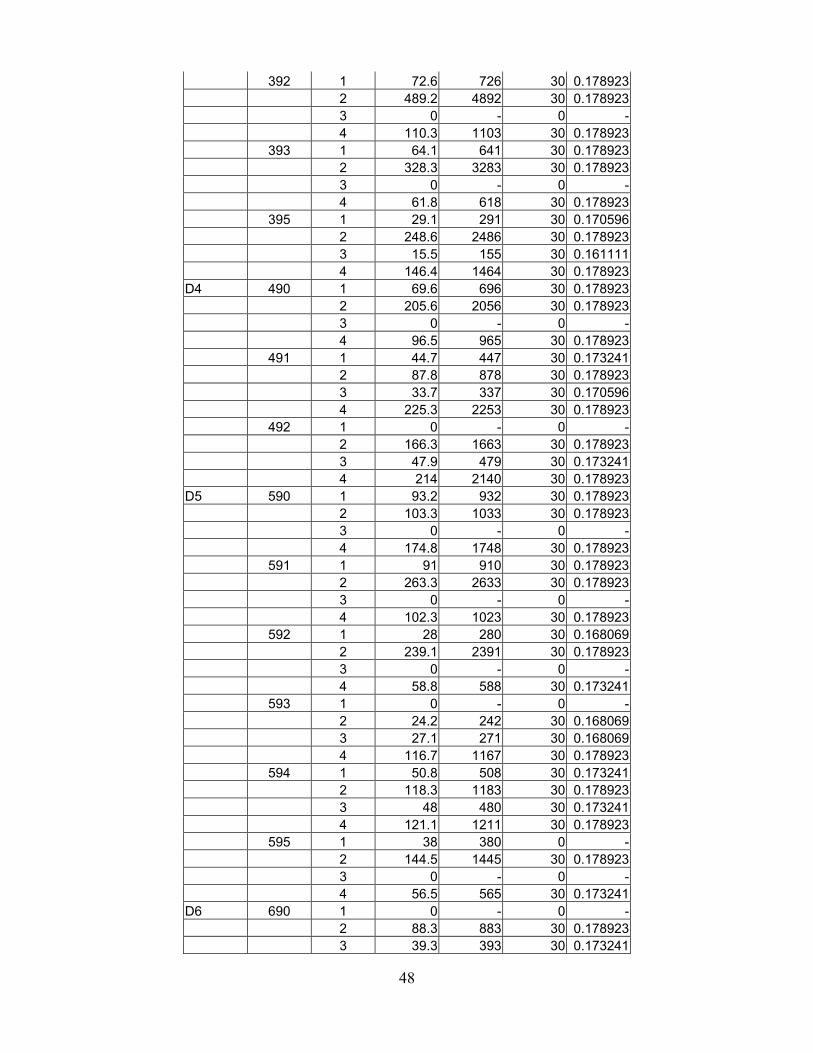
48
392 1 72.6 726 30 0.178923 2 489.2 4892 30 0.178923 3 0 - 0 - 4 110.3 1103 30 0.178923 393 1 64.1 641 30 0.178923 2 328.3 3283 30 0.178923 3 0 - 0 - 4 61.8 618 30 0.178923 395 1 29.1 291 30 0.170596 2 248.6 2486 30 0.178923 3 15.5 155 30 0.161111 4 146.4 1464 30 0.178923 D4 490 1 69.6 696 30 0.178923 2 205.6 2056 30 0.178923 3 0 - 0 - 4 96.5 965 30 0.178923 491 1 44.7 447 30 0.173241 2 87.8 878 30 0.178923 3 33.7 337 30 0.170596 4 225.3 2253 30 0.178923 492 1 0 - 0 - 2 166.3 1663 30 0.178923 3 47.9 479 30 0.173241 4 214 2140 30 0.178923 D5 590 1 93.2 932 30 0.178923 2 103.3 1033 30 0.178923 3 0 - 0 - 4 174.8 1748 30 0.178923 591 1 91 910 30 0.178923 2 263.3 2633 30 0.178923 3 0 - 0 - 4 102.3 1023 30 0.178923 592 1 28 280 30 0.168069 2 239.1 2391 30 0.178923 3 0 - 0 - 4 58.8 588 30 0.173241 593 1 0 - 0 - 2 24.2 242 30 0.168069 3 27.1 271 30 0.168069 4 116.7 1167 30 0.178923 594 1 50.8 508 30 0.173241 2 118.3 1183 30 0.178923 3 48 480 30 0.173241 4 121.1 1211 30 0.178923 595 1 38 380 0 - 2 144.5 1445 30 0.178923 3 0 - 0 - 4 56.5 565 30 0.173241 D6 690 1 0 - 0 - 2 88.3 883 30 0.178923 3 39.3 393 30 0.173241

49
4 178.9 1789 30 0.178923 691 1 4.3 43 12 0.237685 2 6.1 61 18 0.192194 3 31.3 313 30 0.170596 4 162.2 1622 30 0.178923 692 1 0 - 0 - 2 81.7 817 30 0.178923 3 0 - 0 - 4 18.1 181 30 0.163333 D7 796 1 64.4 644 30 0.178923 2 122.3 1223 30 0.178923 3 31.4 314 30 0.170596 4 180.8 1808 30 0.178923 797 1 31.9 319 30 0.170596 2 226.4 2264 30 0.178923 3 0 - 0 - 4 109.6 1096 30 0.178923 798 1 17.4 174 30 0.163333 2 14.7 147 30 0.158977 3 22 220 30 0.16565 4 163.4 1634 30 0.178923 D8 853 1 268.6 2686 90 0.103301 2 0 - 0 - 3 68.6 686 90 0.096097 4 0 - 0 -
Average Margin of Error with Turnpike (D8) 0.174965 Average Margin of Error without Turnpike (D8) 0.175832
A5.2 Margin of Error for Facility-Type-Wide MRP Calculations in Districts
District Facility Type Mileage Pop.
Sample Size
Error Margin
D1 1 215.1 2151 90 0.103301 2 875.2 8752 90 0.103301 3 0 0 0 0 4 735.4 7354 90 0.103301 D2 1 311.3 3113 150 0.080017 2 1579.8 15798 180 0.073045 3 54.3 543 30 0.173241 4 541.9 5419 180 0.073045 D3 1 217.2 2172 120 0.086961 2 1588.3 15883 150 0.080017 3 15.5 155 30 0.161111 4 499.3 4993 150 0.080017 D4 1 114.3 1143 60 0.123468 2 459.7 4597 90 0.103301 3 81.6 816 60 0.121554 4 535.8 5358 90 0.103301 D5 1 301 3010 120 0.089461

50
2 892.7 8927 180 0.073045 3 75.1 751 60 0.121554 4 630.2 6302 180 0.073045 D6 1 4.3 43 12 0.237685 2 176.1 1761 78 0.110963 3 70.6 706 60 0.12063 4 359.2 3592 90 0.103301 D7 1 113.7 1137 90 0.098995 2 363.4 3634 90 0.103301 3 53.4 534 60 0.118842 4 453.8 4538 90 0.103301 D8 1 268.6 2686 90 0.103301 2 0 0 0 0 3 68.6 686 90 0.096097 4 0 0 0 0
A5.3 Margin of Error for Cost-Center-Wide MRP Calculations in Districts
District Cost
Center Mileage Pop.Sample
Size Error
Margin D1 190 666.4 6664 90 0.103301 192 630.1 6301 90 0.103301 194 529.2 5292 90 0.103301 D2 291 364 3640 90 0.103301 292 558.3 5583 90 0.103301 293 309.5 3095 90 0.103301 294 647.4 6474 120 0.089461 296 288.9 2889 60 0.126517 297 319.2 3192 90 0.103301 D3 390 396.7 3967 90 0.103301 391 357.7 3577 60 0.126517 392 672.1 6721 90 0.103301 393 454.2 4542 90 0.103301 395 439.6 4396 120 0.089461 D4 490 371.7 3717 90 0.103301 491 391.5 3915 120 0.089461 492 428.2 4282 90 0.103301 D5 590 371.3 3713 90 0.103301 591 456.6 4566 90 0.103301 592 325.9 3259 90 0.103301 593 168 1680 90 0.100546 594 338.2 3382 120 0.089461 595 239 2390 60 0.126517

51
D6 690 306.5 3065 90 0.103301 691 203.9 2039 90 0.103301 692 99.8 998 60 0.1225 D7 796 398.9 3989 120 0.089461 797 367.9 3679 90 0.103301 798 217.5 2175 120 0.086961 D8 853 337.2 3372 180 0.071097
A5.4 Margin of Error for District MRP Calculations
District Mileage Pop.Sample
Size Error
MarginD1 1825.7 18257 270 0.059641D2 2487.3 24873 540 0.042172D3 2320.3 23203 450 0.046198D4 1191.4 11914 300 0.05658D5 1899 18990 540 0.042172D6 610.2 6102 240 0.063259D7 984.3 9843 330 0.053947D8 337.2 3372 180 0.071097
A5.5 Margin of Error for Facility-Type-Wide MRP Calculations in State
Facility Type Mileage Pop.
Sample Size
Error Margin
1 1545.5 15455 732 0.0362222 5935.2 59352 858 0.0334573 419.1 4191 390 0.047264 3755.6 37556 870 0.033225
A5.6 Margin of Error for State MRP Calculation
Mileage Pop. Sample
Size Error
Margin11655.4 116554 2850 0.018357