final report: evaluation of floating wetland islands (fwis
TRANSCRIPT

Final Report:
Evaluation of Floating Wetland Islands (FWIs) as a Retrofit to Existing
Stormwater Detention Basins
A 319(h) project sponsored by NCDENR – Division of Water Quality
NC DENR Contract Number 1653
Contract Period: 10/1/08 to 1/31/12
Total Project: $182,355
Requested 319(h) Funds: $95,000
Principal Investigators:
William F. Hunt, III, Associate Professor & Extension Specialist
Ryan J. Winston, Extension Associate (lead author of report)
Shawn G. Kennedy, Research Technician
Biological and Agricultural Engineering, NC State University
Report Submission Date: March 22, 2012
You created this PDF from an application that is not licensed to print to novaPDF printer (http://www.novapdf.com)

2
Table of Contents
LIST OF TABLES ...................................................................................................................................................... 4
LIST OF FIGURES..................................................................................................................................................... 6
EXECUTIVE SUMMARY ........................................................................................................................................... 8
INTRODUCTION ..................................................................................................................................................... 9
RESEARCH GOALS ................................................................................................................................................ 10
DELIVERABLES...................................................................................................................................................... 11
DESCRIPTION OF SITES ......................................................................................................................................... 12
MATERIALS AND METHODS ................................................................................................................................. 14
DATA COLLECTION ................................................................................................................................................ 14
LABORATORY ANALYSIS .......................................................................................................................................... 16
FLOATING WETLAND ISLANDS .................................................................................................................................. 18
WETLAND ISLAND PLANT SAMPLING AND ANALYSIS ...................................................................................................... 19
BENTHIC MACROINVERTEBRATE SAMPLING ................................................................................................................. 21
STATISTICAL ANALYSIS ........................................................................................................................................... 21
RESULTS AND DISCUSSION................................................................................................................................... 22
RAINFALL............................................................................................................................................................ 22
PRE-RETROFIT RESULTS ......................................................................................................................................... 23
Effluent Concentrations ............................................................................................................................... 23
Effect of Loading Ratio on Pond Performance .............................................................................................. 24
POST-RETROFIT RESULTS ........................................................................................................................................ 26
COMPARISONS BETWEEN PRE- AND POST-RETROFIT RESULTS ......................................................................................... 27
Effluent Concentrations ............................................................................................................................... 27
Efficiency Ratio ............................................................................................................................................ 29
Pollutant Load Performance ........................................................................................................................ 30
TURNOVER VOLUME ANALYSIS ................................................................................................................................ 31
WETLAND PLANT STUDY RESULTS............................................................................................................................. 32
BENTHIC MACROINVERTEBRATE SAMPLING RESULTS ..................................................................................................... 34
OUTCOMES AND CONCLUSIONS .......................................................................................................................... 36
ACKNOWLEDGEMENTS ........................................................................................................................................ 37
You created this PDF from an application that is not licensed to print to novaPDF printer (http://www.novapdf.com)

3
REFERENCES ......................................................................................................................................................... 38
BUDGET ............................................................................................................................................................... 41
APPENDIX A: RAINFALL DATA. ............................................................................................................................. 42
APPENDIX B: SAMPLED STORM EVENTS............................................................................................................... 44
APPENDIX C: NUTRIENT AND SEDIMENT CONCENTRATIONS. .............................................................................. 46
APPENDIX D: NUTRIENT AND SEDIMENT LOADS. ................................................................................................. 50
APPENDIX E: CUMULATIVE PROBABILITY PLOTS. ................................................................................................. 56
APPENDIX F: WETLAND ISLAND PLANT DATA. ..................................................................................................... 60
APPENDIX G: PICTORIAL DESCRIPTION OF FLOATING WETLAND ISLAND INSTALLATION. .................................... 63
You created this PDF from an application that is not licensed to print to novaPDF printer (http://www.novapdf.com)

4
List of Tables
Table 1. Characteristics of two wet detention ponds examined in Durham, NC.......................... 13
Table 2. Analytical methods for water quality analysis. ............................................................. 18
Table 3. Rainfall summary statistics during the pre- and post-retrofit monitoring periods. ......... 22
Table 4. Pre-retrofit monitoring period water quality results. ..................................................... 24
Table 5. Post-retrofit monitoring period water quality results. ................................................... 27
Table 6. Efficiency ratios for pre- and post-retrofit monitoring periods. ..................................... 30
Table 7. Pollutant loads (kg/ha/yr) for the DOT and Museum ponds.......................................... 31
both pre- and post-retrofit. ......................................................................................................... 31
Table 8. Mean total (above + below) plant tissue macro-nutrient concentrations for each species
at both sites ............................................................................................................................... 34
Table 9. Benthic macroinvertebrate sampling results for the Museum and DOT ponds. ............. 35
Table A.1. Rainfall data recorded during pre-retrofit monitoring period at the DOT site. .......... 42
Table A.2. Rainfall data recorded during post-retrofit monitoring period at the DOT site. ........ 42
Table A.3. Rainfall data recorded during pre-retrofit monitoring period at the Museum site. .... 43
Table A.4. Rainfall data recorded during post-retrofit monitoring period at the Museum site. ... 43
Table B.1. Summary of sampled storm events at DOT site. ....................................................... 44
Table B.2. Summary of sampled storm events at Museum site................................................... 45
Table C.1. Pre-retrofit nutrient and sediment concentrations at the DOT basin inlet................... 46
Table C.2. Pre-retrofit nutrient and sediment concentrations at the DOT basin outlet. ................ 46
Table C.3. Post-retrofit nutrient and sediment concentrations at the DOT basin inlet. ................ 47
Table C.4. Post-retrofit nutrient and sediment concentrations at the DOT basin outlet. .............. 47
Table C.5. Pre-retrofit nutrient and sediment concentrations at the Museum basin inlet. ............ 47
Table C.6. Pre-retrofit nutrient and sediment concentrations at the Museum basin outlet. .......... 48
Table C.7. Post-retrofit nutrient and sediment concentrations at the Museum basin inlet. .......... 48
Table C.8. Post-retrofit nutrient and sediment concentrations at the Museum basin outlet.......... 49
Table D.1. Nutrient and sediment loads for the pre-retrofit DOT pond inlet. .............................. 50
Table D.2. Nutrient and sediment loads for the pre-retrofit DOT pond outlet. ............................ 50
Table D.3. Nutrient and sediment loads for the post-retrofit DOT pond inlet. ............................ 51
Table D.4. Nutrient and sediment loads for the post-retrofit DOT pond outlet. .......................... 51
You created this PDF from an application that is not licensed to print to novaPDF printer (http://www.novapdf.com)

5
Table D.5. Nutrient and sediment loads for the pre-retrofit Museum pond inlet. ........................ 52
Table D.6. Nutrient and sediment loads for the pre-retrofit Museum pond outlet. ...................... 53
Table D.7. Nutrient and sediment loads for the post-retrofit Museum pond inlet. ....................... 53
Table D.8. Nutrient and sediment loads for the post-retrofit Museum pond outlet. ..................... 54
You created this PDF from an application that is not licensed to print to novaPDF printer (http://www.novapdf.com)

6
List of Figures
Figure 1a (left). Satellite imagery of DOT pond with twelve floating wetland islands. ............... 13
Figure 1b (right). Satellite imagery of Museum pond with four floating wetland islands. ........... 13
Photos: Google Earth. ............................................................................................................... 13
Figure 2a (left). Spring ring monitoring assembly with sample intake, suction tubing, and area-
velocity meter (submerged) at inlet of Museum pond. ............................................................... 15
Figure 2b (right). Installing monitoring equipment at the DOT pond inlet. ................................ 15
Figure 3. Spring ring monitoring assembly with sample intake, suction tubing, and bubbler
assembly at outlet of Museum pond. ......................................................................................... 15
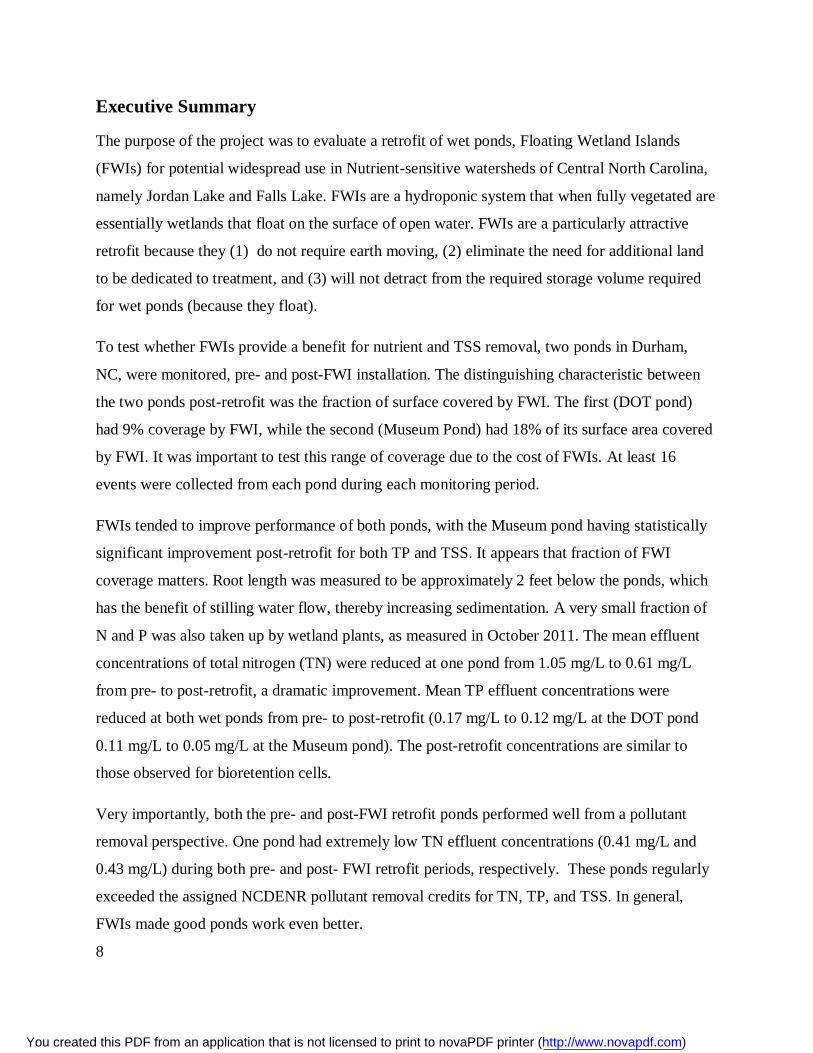
Figure 4a (left). Monitoring box containing ISCO 6712 sampler and ......................................... 16
deep cycle battery at Museum pond outlet. ................................................................................ 16
Figure 4b (right). Avalanche sampler, deep cycle battery, and solar panel DOT pond outlet. ..... 16
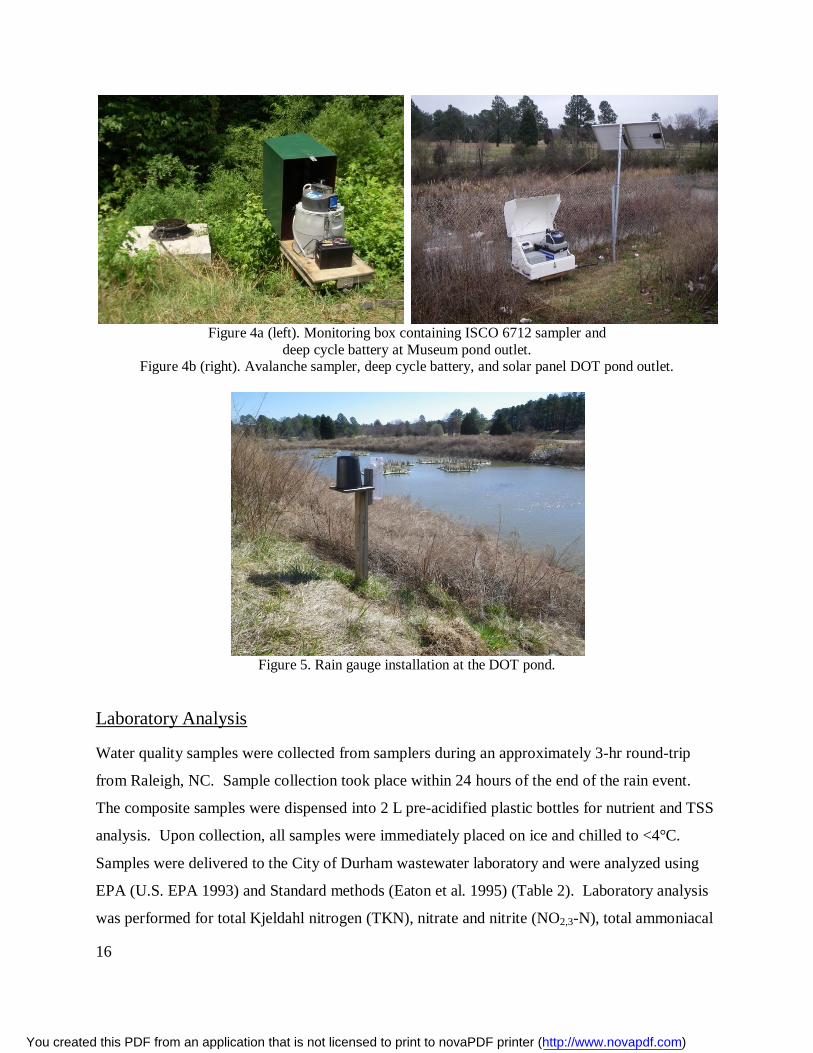
Figure 5. Rain gauge installation at the DOT pond. ................................................................... 16
Figure 6a (left). Launching a floating wetland island. ................................................................ 19
Figure 6b (right). Installing goose prevention fencing. ............................................................... 19
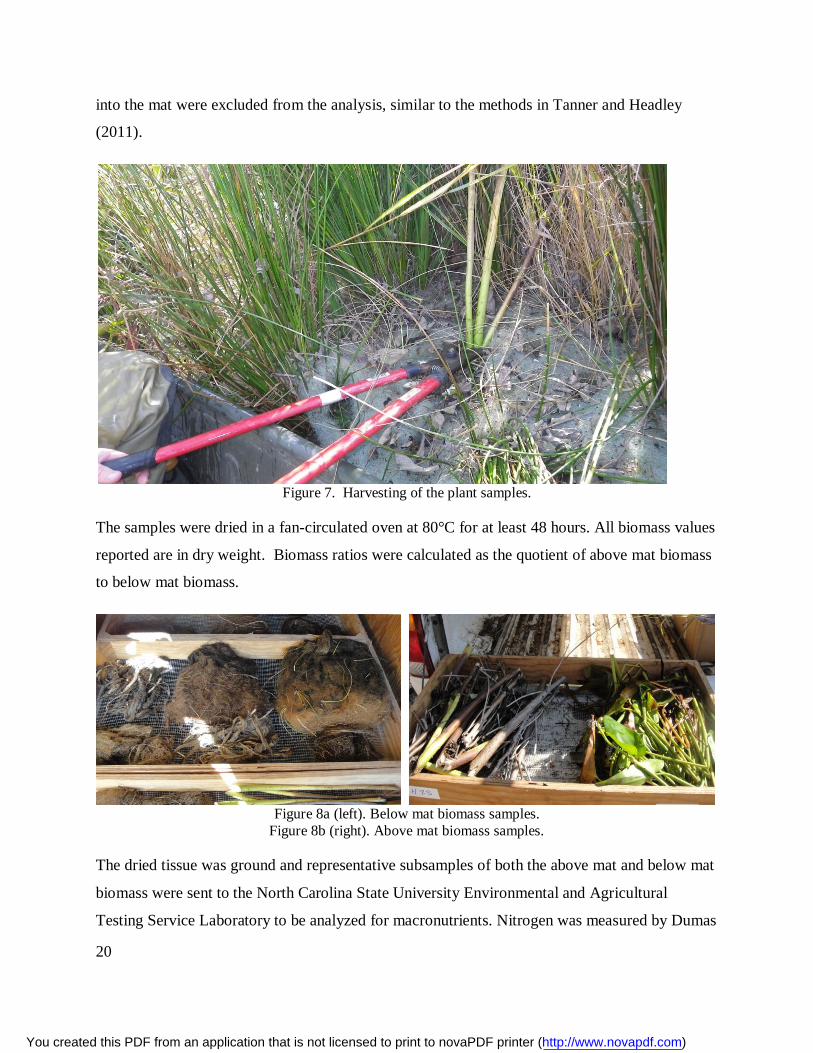
Figure 7. Harvesting of the plant samples. ................................................................................ 20
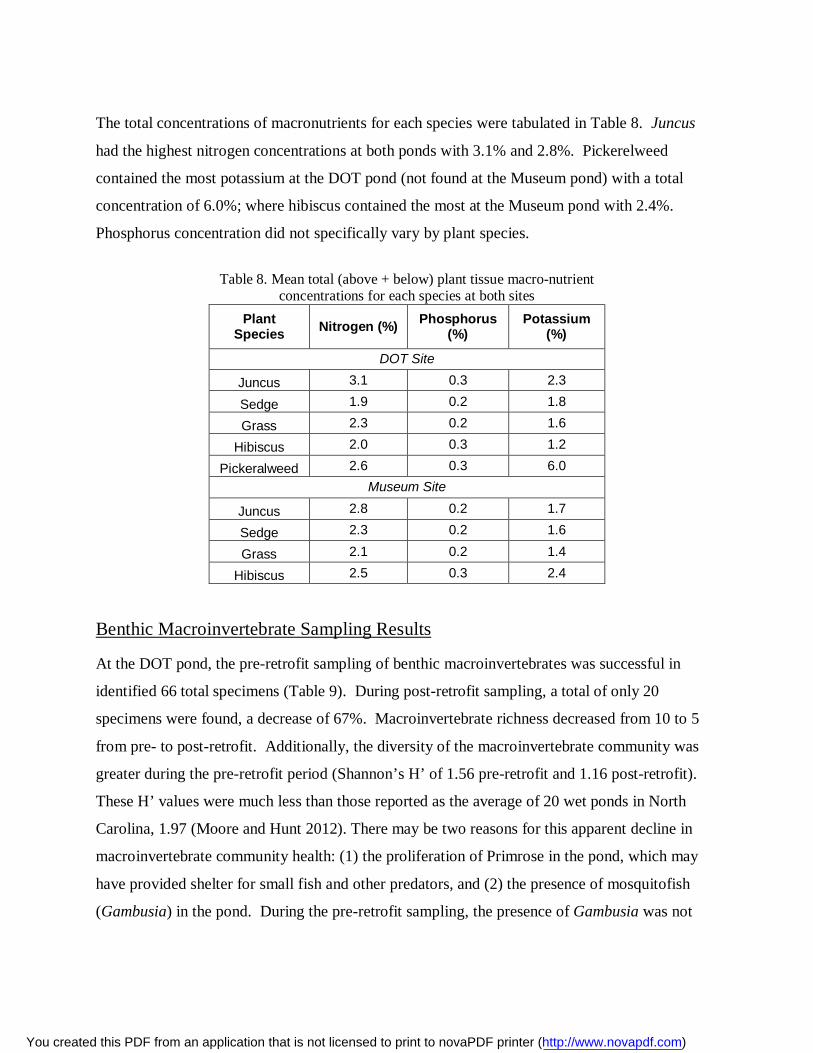
Figure 8a (left). Below mat biomass samples. ............................................................................ 20
Figure 8b (right). Above mat biomass samples. ......................................................................... 20
Figure 9. Stormwater pond performance for TSS as a function of loading ratio. ........................ 26
Figure 10. Presence of Primrose around banks and floating wetland islands .............................. 28
(photo on August 8, 2011) ......................................................................................................... 28
Figure 11. Side-by-Side comparison of the mean plant biomass values of the harvested plants at
the DOT and Museum sites. The error bars indicate standard error. ........................................... 32
Figure 12. Mean plant tissue macro-nutrient concentrations recorded in the above and below mat
biomass for the (a) DOT and (b) Museum sites. Values below the x-axis indicate concentrations
of the below mat biomass. ......................................................................................................... 33
Figure E.1. Cumulative probability plot for TN at the DOT site................................................. 56
Figure E.2. Cumulative probability plots for TP at the DOT site. ............................................... 57
Figure E.3. Cumulative probability plot for TSS at the DOT site. .............................................. 57
Figure E.4. Cumulative probability plot for TN at the Museum site. .......................................... 58
You created this PDF from an application that is not licensed to print to novaPDF printer (http://www.novapdf.com)

7
Figure E.5. Cumulative probability plot for TP at the Museum site. ........................................... 58
Figure E.6. Cumulative probability plot for TSS at the Museum site. ........................................ 59
You created this PDF from an application that is not licensed to print to novaPDF printer (http://www.novapdf.com)
8
Executive Summary
The purpose of the project was to evaluate a retrofit of wet ponds, Floating Wetland Islands
(FWIs) for potential widespread use in Nutrient-sensitive watersheds of Central North Carolina,
namely Jordan Lake and Falls Lake. FWIs are a hydroponic system that when fully vegetated are
essentially wetlands that float on the surface of open water. FWIs are a particularly attractive
retrofit because they (1) do not require earth moving, (2) eliminate the need for additional land
to be dedicated to treatment, and (3) will not detract from the required storage volume required
for wet ponds (because they float).
To test whether FWIs provide a benefit for nutrient and TSS removal, two ponds in Durham,
NC, were monitored, pre- and post-FWI installation. The distinguishing characteristic between
the two ponds post-retrofit was the fraction of surface covered by FWI. The first (DOT pond)
had 9% coverage by FWI, while the second (Museum Pond) had 18% of its surface area covered
by FWI. It was important to test this range of coverage due to the cost of FWIs. At least 16
events were collected from each pond during each monitoring period.
FWIs tended to improve performance of both ponds, with the Museum pond having statistically
significant improvement post-retrofit for both TP and TSS. It appears that fraction of FWI
coverage matters. Root length was measured to be approximately 2 feet below the ponds, which
has the benefit of stilling water flow, thereby increasing sedimentation. A very small fraction of
N and P was also taken up by wetland plants, as measured in October 2011. The mean effluent
concentrations of total nitrogen (TN) were reduced at one pond from 1.05 mg/L to 0.61 mg/L
from pre- to post-retrofit, a dramatic improvement. Mean TP effluent concentrations were
reduced at both wet ponds from pre- to post-retrofit (0.17 mg/L to 0.12 mg/L at the DOT pond
0.11 mg/L to 0.05 mg/L at the Museum pond). The post-retrofit concentrations are similar to
those observed for bioretention cells.
Very importantly, both the pre- and post-FWI retrofit ponds performed well from a pollutant
removal perspective. One pond had extremely low TN effluent concentrations (0.41 mg/L and
0.43 mg/L) during both pre- and post- FWI retrofit periods, respectively. These ponds regularly
exceeded the assigned NCDENR pollutant removal credits for TN, TP, and TSS. In general,
FWIs made good ponds work even better.
You created this PDF from an application that is not licensed to print to novaPDF printer (http://www.novapdf.com)

9
The authors took advantage of having these pond data and created a simple tool to predict
effluent concentrations based upon the relative size of the pond to its watershed. While this study
is not definitive, there are some “thumbnail” design standards that are offered to NCDENR:
1) More FWI coverage is better. Perhaps if NCDENR were to make 20% FWI coverage the
threshold for which additional TN, TP, or TSS credit is offered, this would be somewhat
conservative.
2) The amount of additional TN and TP credit to be awarded a pond that employs FWI should
initially be minimal, perhaps a 5% “bonus.” To receive additional TN credit, perhaps the
vegetated should be required to be harvested. That is, a pond with 20% FWI coverage would
receive 30% TN removal credit rather than 25% for a standard pond.
3) Finally, NCSU fully supports NCDENR if their decision is to hold off assigning any
benefits to FWIs until additional research (conducted elsewhere) is reported.
Introduction
Urban stormwater poses significant threats to waterways by more efficiently transporting
anthropogenic pollutants. Additionally, loads of pollutants, such as nutrients, heavy metals,
sediment, indicator organisms, and hydrocarbons, tend to be higher in urban areas than in rural
areas. The added volume of stormwater that is conveyed from impervious surfaces causes
stream bank erosion, degradation of aquatic habitat, and loss of real estate. Therefore, federal,
state, and local legislation in the U.S. mandates the use of stormwater control measures (SCMs)
to combat these negative consequences of urban growth.
Examples of SCMs include innovative stormwater practices, such as bioretention, permeable
pavement, water harvesting, and infiltration devices, which are often integrated into Low Impact
Development (LID) strategies. Since the passage of the Clean Water Act (1972), wet detention
basins have been required to mitigate the increased peak flow rates observed post-construction.
As such, there are many existing wet ponds across North Carolina. Further, because North
Carolina has many nutrient-sensitive waters, ponds have been assigned credit to “remove”
pollutants: 25% for total nitrogen (TN), 40% for total phosphorus (TP), and 85% for total
suspended solids (TSS) (NCDENR, 2007). Considering their widespread use, a surprising lack
You created this PDF from an application that is not licensed to print to novaPDF printer (http://www.novapdf.com)

10
of literature exists on the performance of wet ponds for removal of pollutants (Mallin et al. 2002;
Jones and Hunt 2010; Hancock et al. 2010; Gallagher et al. 2011; Wium-Andersen 2011;
DeLorenzo et al. 2012), especially for nutrient removal. One paper in the literature (Mallin et al.
2002) quantifies nutrient removal at three ponds in the North Carolina Coastal Plain. Of the
three ponds, one showed promising removal of TN, one showed negligible removal of TN, and
TN increased by 50% at the third pond. TP concentrations were reduced at two of the ponds, and
increased at a third. Nutrient removal from past studies of wet detention basins has been
uncertain, and is certainly less reliable than a media filter, such as bioretention (Hunt et al. 2008).
Field evaluations of wet ponds have shown between 41-93 percent removal of TSS, with
sediment removal a function of influent particle size distribution (Wu et al. 1996; Greb and
Bannerman, 1997; Mallin et al. 2002; Hathaway et al. 2007).
With the passage of the Jordan Lake Rules (North Carolina Administrative Code, 2008) and
similar rules in other watersheds in NC, nutrient reduction goals have been set with strict TN and
TP load limits for new and existing development. Since existing developments often have
limited space for retrofitting stormwater practices, methods to improve currently in-ground
stormwater practices’ performance for nutrient removal are crucial. One potential retrofit for
reducing nutrients in wet detention ponds is the use of floating wetland islands (FWIs), also
referred to as floating treatment wetlands (FTWs). FWIs function in a similar manner to
hydroponic systems, where plants and microbes inhabit a floating mat and uptake nutrients as
they grow. A laboratory study of FWIs (Tanner and Headley 2011) showed positive removal of
Cu, Zn, and fine suspended particulates. A study using FWIs to treat raw domestic wastewater
showed removal efficiencies of 22-42% for total ammoniacal nitrogen (TAN), TN, and TP (Van
de Moortel et al. 2010). However, field studies have not been completed on FWIs and their
performance as retrofits to stormwater wet ponds.
Research Goals
The goals of this research were threefold: (1) Examine the pollutant load reduction and effluent
water quality from two existing wet detention ponds in Durham, NC; (2) examine the impact of
the addition of floating wetland islands to the ponds on load reduction and effluent water quality;
You created this PDF from an application that is not licensed to print to novaPDF printer (http://www.novapdf.com)

11
and (3) determine ancillary benefits of floating wetland islands, including nutrient uptake by
plants and benthic macroinvertebrate health.
Deliverables
1. Two conventional stormwater wet ponds will be monitored for 1 year. Two ponds, one treating a DOT interchange I-85 and US 15-501 (DOT pond) and a second treating a parking lot and maintenance facilities at the NC Museum of Life and Science (Museum Pond) were monitored from November 2008 to March 2010. Sixteen storms were analyzed during the pre-retrofit period for water quality.
2. Two demonstration ponds will be retrofitted with floating wetland islands. Nine percent of the DOT pond surface area was coved by floating wetland islands, and 18% of the Museum pond’s surface was retrofit by islands. This occurred in March and April 2010.
3. The retrofitted floating island ponds will be monitored for 1 year. The FWI-retrofitted ponds were monitored from July 2010 through September 2011. During this period, 16 events were sampled at the DOT pond and 18 events were collected at the Museum Pond.
4. Two classroom training events for design professionals will highlight these retrofits. There will also be two site visits for design professionals made. Three classroom training events highlighting floating wetland islands were conducted in Raleigh (X2) and Lenoir. The workshops were held in June and August 2011. Additionally, during one of the installation days, several designers were invited and visited in March 2010.
5. A factsheet will be written detailing the use, design, and performance of the floating wetland ponds, provided the systems are shown to work. If the floating islands do not appear to function as intended, a short report will be made to the public discouraging the use of this particular retrofit. Either publication will be posted on the BAE Stormwater Website. This deliverable has not been completed. There will be two products however, that are in preparation that will fulfill this obligation. A version of this final report is to be submitted to the Journal of Environmental Engineering for publication. Additionally a factsheet is in the planning stages that will highlight many types of pond retrofits, including FWI’s, creation of aquatic shelves, and upflow filters. NCSU is still conducting an upflow filter study (and will through this summer), which is the cause for this delay. The university will provide the factsheet to NCDENR as soon as it has been prepared and we apologize for the delay.
6. Guidance, in the form of a Stormwater BMP Design Manual addendum, will be given to NC DENR personnel upon completion of the project either (1) recommending the use of this BMP retrofit (with design guidelines and nutrient removal credit), or (2) discouraging the adoption of this product as a BMP retrofit.
You created this PDF from an application that is not licensed to print to novaPDF printer (http://www.novapdf.com)

12
This final report and journal article will be provided to NCDENR stormwater and wetlands unit. Faculty at NCSU will meet with NCDENR officials to discuss how to incorporate these findings into the future pond chapter. Some recommendations are provided in the Executive Summary.
7. A final project report. Submitted herein.
Description of Sites
Two existing wet detention ponds in Durham, NC were identified for monitoring during the
summer of 2008. Sites were chosen because they had a single, piped inlet and an outlet structure
that allowed for the installation of monitoring equipment. Both ponds were designed to treat the
water quality volume and mitigate peak flow rates from the 1-yr, 2-yr, and 10-yr return period
storm events, as required by the NC Department of Environment and Natural Resources
(NCDENR), Division of Water Quality’s (2007) Stormwater Best Management Practices Design
Manual and/or the City of Durham. As such, they were designed to have a forebay, to treat the
2.5 cm event without overflow, to draw down to permanent pool elevation in 2 to 5 days, and to
release outflow through a vegetative filter strip.
The first wet pond was installed by the NC Department of Transportation (hereafter referred to
as “DOT pond”) during the expansion of an interchange at US 15-501 and Interstate-85. The
13.07 ha drainage area consisted entirely of roadway and associated vegetated shoulders, and
was 87.7% impervious (Table 1). The surface area of the pond at permanent pool elevation was
0.36 ha. The surface area of the forebay was 11.7% of the total surface area of the pond and the
forebay was not vegetated. The pond had both a concrete box outlet structure and a rip-rap lined
emergency spillway, which regulated overflow and conveyed emergency spillway flow,
respectively (Figure 1a). Throughout the monitoring periods, the pond was frequented by 20
Canada geese, Branta canadensis.
The second wet pond was installed at the North Carolina Museum of Life and Science (hereafter
referred to as “Museum pond”) and drains a parking lot, a maintenance building, and a picnic
area (Table 1). The drainage area was 2.37 ha and 54.3% impervious. The wet basin was 0.05
ha in surface area, and the surface area of the forebay was 18% of the total surface area of the
You created this PDF from an application that is not licensed to print to novaPDF printer (http://www.novapdf.com)

13
basin. The forebay was vegetated with a dense mat of cattails (Typha latifolia). The pond had a
concrete box outlet structure which regulated overflow, which doubled as an emergency spillway
(Figure 1b). Both the DOT and museum ponds, respectively, had somewhat similar length to
width ratios (2.84 and 2.4), forebay depths (0.83 m and 0.53 m) and depths at permanent pool
(1.22 m and 0.93 m).
Table 1. Characteristics of two wet detention ponds examined in Durham, NC.
Attribute DOT Pond Museum Pond
Surface area (ha) 0.36 0.05
Drainage area (ha) 13.07 2.37
Hydraulic Loading (unitless) 36.4 47.4
Watershed Imperviousness (%) 87.7% 54.3%
Watershed Land Use Interstate highway Parking lot, maintenance
building, picnic area
Forebay Area (m2) 421 90
Average Forebay Depth (m) 0.83 0.53
Wet Pond Length (m) 91 36
Wet Pond Average Width (m) 32 15
Length to Width Ratio 2.84 2.4
Mean Depth at Permanent Pool Elevation (m) 1.22 0.93
Storage Volume at Permanent Pool Elevation (m3) 3869 386
Brink of Overflow Storage Volume (m3) 7993 1190
Brink of Emergency Spillway Storage Volume (m3) 9625 NA
Figure 1a (left). Satellite imagery of DOT pond with twelve floating wetland islands.
Figure 1b (right). Satellite imagery of Museum pond with four floating wetland islands. Photos: Google Earth.
Inlet
Inlet
Outlet
Outlet
You created this PDF from an application that is not licensed to print to novaPDF printer (http://www.novapdf.com)

14
Materials and Methods
Data Collection
At the DOT pond, stormwater entered through a 152 cm reinforced concrete pipe (RCP) which
was partially submerged at the permanent pool elevation. An ISCO 720 (Lincoln, Neb.) area
velocity meter was fixed to the bottom of the pipe to collect flow data. These meters collect
continuous velocity measurements based upon the Doppler Effect and continuous stage data
using a pressure transducer. Since the cross-sectional area of the pipe was known, the meter
could make measurements of flow rate. Similar area velocity flow measuring locations were
installed at the outlet to the DOT pond (41 cm RCP), which was continuously submerged, and
the inlet to the Museum basin (61 cm RCP), which was partially submerged at normal pool
(Figures 2a and 2b). At the Museum pond, stage measurements were made in the freely-flowing
61 cm RCP outlet pipe using an ISCO 730 bubbler module (Figure 3). Stage measurements
were converted to flow rate using Manning’s Equation with known values for pipe slope, pipe
roughness, and cross-sectional area (Manning 1891).
Flow measurements were taken on a 2-minute interval, which triggered automated samplers to
collect flow-weighted, composite water quality samples (Figures 4a and 4b). At the DOT pond,
ISCO Avalanche® refrigerated samplers were used, while at the Museum pond ISCO 6712
samplers were employed. Sample intake strainers were located in an area with well-mixed flow.
A minimum of five aliquots was required to adequately represent the entire hydrograph (U.S.
EPA 2002). Samples were stored in a 10L glass jar inside the sampler. Samples were taken to a
U.S. EPA certified laboratory on ice within 24 hours of the cessation of rainfall. Storm events
were characterized by a minimum antecedent dry period of 6 hours and had rainfall depths
between 3 and 150 mm. Rainfall data were collected at each site using both a manual rain gauge
and a recording, tipping bucket (Davis Rain Collector II) rain gauge (Figure 5). Hydrologic and
rainfall data were analyzed using Flowlink® and Hoboware Pro® software, respectively.
You created this PDF from an application that is not licensed to print to novaPDF printer (http://www.novapdf.com)

15
Figure 2a (left). Spring ring monitoring assembly with sample intake, suction tubing, and area-velocity
meter (submerged) at inlet of Museum pond. Figure 2b (right). Installing monitoring equipment at the DOT pond inlet.
Figure 3. Spring ring monitoring assembly with sample intake, suction tubing, and bubbler assembly at
outlet of Museum pond.
You created this PDF from an application that is not licensed to print to novaPDF printer (http://www.novapdf.com)
16
Figure 4a (left). Monitoring box containing ISCO 6712 sampler and
deep cycle battery at Museum pond outlet. Figure 4b (right). Avalanche sampler, deep cycle battery, and solar panel DOT pond outlet.
Figure 5. Rain gauge installation at the DOT pond.
Laboratory Analysis
Water quality samples were collected from samplers during an approximately 3-hr round-trip
from Raleigh, NC. Sample collection took place within 24 hours of the end of the rain event.
The composite samples were dispensed into 2 L pre-acidified plastic bottles for nutrient and TSS
analysis. Upon collection, all samples were immediately placed on ice and chilled to <4°C.
Samples were delivered to the City of Durham wastewater laboratory and were analyzed using
EPA (U.S. EPA 1993) and Standard methods (Eaton et al. 1995) (Table 2). Laboratory analysis
was performed for total Kjeldahl nitrogen (TKN), nitrate and nitrite (NO2,3-N), total ammoniacal
You created this PDF from an application that is not licensed to print to novaPDF printer (http://www.novapdf.com)

17
nitrogen (TAN), orthophosphate (ortho-P), TP, and TSS. Organic nitrogen (ON) was calculated
as the difference between TKN and TAN. Particle bound phosphorus (PBP) was calculated by
subtracting the ortho-P concentration from the TP concentration. Total nitrogen TN was
calculated as the sum of TKN and NO2,3-N.
You created this PDF from an application that is not licensed to print to novaPDF printer (http://www.novapdf.com)

18
Table 2. Analytical methods for water quality analysis.
Constituent Laboratory Testing Methods Preservation Laboratory
Reporting Limit (mg/L)
TAN Std Method 4500-NH3-D (Eaton et al. 1995) H2SO4 (<2 pH), <4°C 0.05 TKN Std Method 4500-Norg (Eaton et al. 1995) H2SO4 (<2 pH), <4°C 0.3
NO2,3-N EPA method 300.0 revision 2.1 (U.S. EPA 1983) H2SO4 (<2 pH), <4°C 0.1 TN Calculated as NO2-3-N + TKN N/A N/A ON Calculated as TKN – TAN N/A N/A
Ortho-P Std Method 4500-P-E H2SO4 (<2 pH), <4°C 0.03 PBP Calculated as TP – Ortho-P N/A N/A TP Std Method 4500-P-E (Eaton et al. 1995) H2SO4 (<2 pH), <4°C 0.03 TSS Std Method 2540 D (Eaton et al. 1995) <4°C 2.5
Floating Wetland Islands
Monitoring of the pre-retrofit wet detention basins was completed during the 14 month period
spanning December 2008 through February 2010. During this time, sixteen paired samples were
obtained from the inlet and outlet of the DOT pond. Sixteen paired samples were also collected
at the inlet and outlet of the Museum pond.
In late March 2010, FWIs were installed as retrofits at both the Museum and DOT ponds. FWIs
act as a hydroponic system, with the plants and microbes that inhabit the plant roots taking up
nutrients from the stormwater. The surface vegetation improves the above-water ecosystem,
while the roots provided submerged habitat. At the DOT pond, twelve floating wetland islands
were installed, or a surface coverage of 9%. Four islands were installed at the Museum pond, or
a surface coverage of 18%.
Each island had a surface area of approximately 23 m2 and was 25 cm thick. The mats are
constructed of extruded plastic woven together and float because of injected closed-cell foam
that is internal to the island. The islands had pre-drilled holes on 20 cm centers that were 13 cm
deep. These were filled half-full with peat moss, and planted with a mixture of Carex stricta
(Tussock sedge), Juncus effusus (soft rush), Spartina pectinata (prairie cordgrass), Acorus
gramineus (Japanese sweet flag), Pontederia cordata (pickerelweed), Peltandra virginica (arrow
arum), Andropogon gerardii (big bluestem), and Hibiscus moscheutos (marsh hibiscus). A total
of 3,550 plugs (2.5 cm diameter) were planted, or an average of 225 plants per island. Following
planting, the islands were moved into the basin (Figure 6a). FWIs were affixed to the bottom of
You created this PDF from an application that is not licensed to print to novaPDF printer (http://www.novapdf.com)

19
the ponds through the use of four cinder block anchors. Goose fencing was installed by the City
of Durham at the DOT pond, because of a resident Canada goose population (Figure 6b). During
and immediately following planting, North Carolina experienced a period of unseasonably hot
and dry Spring weather; mortality of approximately 20% of the plants was observed. They were
replaced during a second planting conducted the second week of April 2010. Plantings were
allowed to mature from April through June 2010 before monitoring recommenced in July 2010.
Figure 6a (left). Launching a floating wetland island. Figure 6b (right). Installing goose prevention fencing.
The post-retrofit monitoring period ended in September 2011. A total of sixteen and eighteen
paired water quality samples were taken at the DOT pond and the Museum pond, respectively.
During both the pre- and post-retrofit monitoring efforts, samples were relatively well distributed
across all seasons, with between one and six storms sampled per season.
Wetland Island Plant Sampling and Analysis
Methods for plant sampling and analysis were adapted from Tanner and Headley (2011). The
sampling was conducted at both sites, DOT and Museum. Juncus (Juncus spp.), Sedge (Carex
stricta), Grass (Sacciolepis striata), and Hibiscus (Hibiscus coccineus) were the dominant
species found at both sites. Pickerelweed (Pontedaria cordata) was dominant at the DOT pond,
but not found at the Museum. Three samples of each species were somewhat randomly harvested
from all the mats at each site in October 2011, when the plants wer nineteen months old. The
samples were collected via boat and machete, and for root accessibility, the samples were
harvested from the outer edge of each mat. The shoot base and root biomass which had grown
You created this PDF from an application that is not licensed to print to novaPDF printer (http://www.novapdf.com)
20
into the mat were excluded from the analysis, similar to the methods in Tanner and Headley
(2011).
Figure 7. Harvesting of the plant samples.
The samples were dried in a fan-circulated oven at 80°C for at least 48 hours. All biomass values
reported are in dry weight. Biomass ratios were calculated as the quotient of above mat biomass
to below mat biomass.
Figure 8a (left). Below mat biomass samples.
Figure 8b (right). Above mat biomass samples.
The dried tissue was ground and representative subsamples of both the above mat and below mat
biomass were sent to the North Carolina State University Environmental and Agricultural
Testing Service Laboratory to be analyzed for macronutrients. Nitrogen was measured by Dumas
You created this PDF from an application that is not licensed to print to novaPDF printer (http://www.novapdf.com)

21
combustion, and phosphorus and potassium by Inductively Coupled Plasma Optical Emission
Spectrometry (ICP-OES) using the Dry Ash Method (Munter et al., 1984).
Benthic Macroinvertebrate Sampling
Benthic macroinvertebrate samples were taken at both the DOT pond and Museum pond soon
after installation of the floating wetland islands (July 16, 2010) to serve as a control. The ponds
were revisited a year later (August 26, 2011) to reassess any potential increase in
macroinvertebrate populations, such diversity or total number of specimens. At each site, four
sweeps were conducted in the shallow water zone (near the bank) at randomized locations.
Macroinvertebrates were collected by jabbing a D-frame sweep net into shallow water sediments
and sweeping upward through the water column a distance of 1 m (Batzer et al. 2001).
Specimens from all sweeps were live-sorted and identified to the family level. All specimens in
the same family were composited for data analysis. Macroinvertebrate richness (number of
different families present), Shannon’s diversity index (H’), and relative abundance were
determined for each site. The presence of fish in sweep net samples was also recorded as it may
be an indicator of predation.
Statistical Analysis
The water quality data were statistically analyzed to compare paired influent and effluent
concentrations and loads. Statistical tests were separately completed on pre-retrofit and post-
retrofit data for each pond. The difference between each set of paired data was tested for
normality using four goodness-of-fit tests (Shapiro-Wilk, Cramer-von Mises, Anderson-Darling,
and Kolmorogov-Smirnov). If data were normal or log-normal, a paired t-test was performed.
Otherwise, a Wilcoxon signed rank test was utilized.
To determine the effects of the floating islands on nutrient and sediment concentrations,
statistical comparisons between the pre- and post-retrofit data sets were made. These tests were
completed using Wilcoxon rank-sum tests to compare influent concentrations pre- and post-
retrofit and effluent concentrations pre- and post- retrofit. A criterion of 95% confidence
(α=0.05) was used for this research. Statistical analyses were performed using the SAS software
version 9.1.3 (SAS Institute 2006). A value of one-half the detection limit was substituted for
You created this PDF from an application that is not licensed to print to novaPDF printer (http://www.novapdf.com)

22
concentration data that were below the detection limit (Gilbert 1987). Each sampling event was
considered a replicate for statistical purposes.
Results and Discussion
A summary of rainfall depths, sample collection type (nutrients, sediment, or both nutrients and
sediment), and nutrient and sediment concentrations are presented in Appendices A-C,
respectively. Pollutant loads were calculated for each storm for which water quality samples
were collected (Appendix D). Cumulative probability plots, an alternative method for evaluating
SCM performance, are presented in Appendix E. Raw data from the plant analysis are located in
Appendix F. Finally, a pictorial view of FWI installation is provided in Appendix G.
Rainfall
During the pre-retrofit monitoring period, 79 and 74 storm events occurred at the DOT and
Museum ponds, respectively. Of these, sixteen events were sampled for water quality analysis.
Slightly fewer rain events took place during the post retrofit monitoring period, with 64 and 62
events, respectively, at the DOT and Museum ponds. Sixteen and eighteen of these were
sampled for water quality analysis. Mean and median rainfall depths for sampled storm events
were greater than those for all storm events during the monitoring period (Table 3).
Table 3. Rainfall summary statistics during the pre- and post-retrofit monitoring periods.
Statistic
DOT Pond Museum Pond Pre-Retrofit Post-Retrofit Pre-Retrofit Post-Retrofit
All Storm Events
Events Sampled for Water
Quality
All Storm Events
Events Sampled for Water
Quality
All Storm Events
Events Sampled for Water
Quality
All Storm Events
Events Sampled for Water
Quality Number 79 16 64 16 74 16 62 18
Mean Rainfall (mm)
17 29 19 21 17 31 21 27
Median Rainfall (mm)
10 19 11 22 10 24 12 18
Rainfall Depth
Range (mm) 3 - 149 7 -149 3 -132 9 -132 3 - 143 6 -143 3 - 96 3 - 96
You created this PDF from an application that is not licensed to print to novaPDF printer (http://www.novapdf.com)

23
The range of rainfall depths was very similar between sampled and non-sampled storm events.
The median monitored water quality storm event was between the 70th and 80th percentile storm
rainfall depth calculated from 30 years of rainfall data at Raleigh-Durham International Airport
(Bean 2005).
Pre-Retrofit Results
Effluent Concentrations
The existing DOT wet detention basin performed well for TN, TP, and TSS reduction during the
fourteen month pre-retrofit monitoring period. The inlet concentrations (Table 4) at the DOT
pond were representative of previous studies on transportation runoff in North Carolina (Wu et
al. 1998; Winston et al. 2012). Mean concentration reductions for TN, TP, and TSS at the DOT
pond were 36%, 36%, and 92%. The TN reduction compared favorably to the credit that
NCDENR provides to wet ponds (25%). Statistically significant reductions were observed
between influent and effluent concentration at the DOT pond for NO2-3-N, PBP, and TSS. The
variability in concentration (as determined by the standard deviation) was reduced by more than
50% when comparing the effluent to influent concentrations for all pollutants except TAN.
McNett et al. (2010) correlated benthic macroinvertebrate health to in-stream pollutant
concentrations for the three ecoregions in North Carolina (Mountain, Piedmont, and Coastal
Plain). The benthic health was rated on a scale from excellent to poor. Excellent and good water
quality supported intolerant macroinvertebrate species, including mayflies and caddisflies.
Median effluent concentrations for TN, TP, and TSS for the DOT pond were 0.65 mg/L, 0.13
mg/L, and 26 mg/L. This corresponded to excellent water quality for TN and fair water quality
for TP. The target of 25 mg/L established for TSS by Barrett et al. (2004) was just exceeded.
The Museum pond had lower mean influent concentrations for TN and TSS than the DOT pond
(Table 4), perhaps due to differences in watershed composition (parking lot vis-à-vis interstate
highway). The mean TN and TP concentrations were very near those from for eight asphalt
parking lots in North Carolina [mean TN (1.57 mg/L) and TP (0.19 mg/L)] reported by Passeport
and Hunt (2009). Mean concentration reductions for TN, TP, and TSS at the Museum pond were
You created this PDF from an application that is not licensed to print to novaPDF printer (http://www.novapdf.com)

24
59%, 57%, and 89%, all of which were statistically significant. Additionally, TKN, TAN, ON,
and PBP concentrations were all statistically reduced in the Museum wet pond. TN and TP
reductions for this pond easily exceed the North Carolina credit for wet ponds (25% TN and 40%
TP). The treatment provided by the wet pond reduced the variability in effluent concentration
when compared against influent concentration variability.
Median TN, TP, and TSS effluent concentrations for the Museum pond were 0.40 mg/L, 0.11
mg/L, and 14 mg/L, respectively. This corresponded to excellent water quality levels for TN and
good water quality for TP. Additionally, effluent concentrations met the 25 mg/L TSS threshold.
Before retrofitting with floating wetland islands, the ponds were performing better than expected,
meeting or exceeding most effluent concentration targets as well as the NCDENR pollutant
removal credit for wet ponds.
Table 4. Pre-retrofit monitoring period water quality results. Sampling Location Statistic TKN
(mg/L) NO2-3-N (mg/L)
TN (mg/L)
TAN (mg/L)
ON (mg/L)
OP (mg/L)
PBP (mg/L)
TP (mg/L)
TSS (mg/L)
DOT Inlet Median 0.80 0.15 1.05 0.03 0.98 0.06 0.06 0.15 215
Mean (Standard Deviation)
1.43 (2.21)
0.20 (0.17)
1.64 (2.21)
0.12 (0.23)
1.50 (2.04)
0.14 (0.21)
0.13 (0.15)
0.26 (0.33)
354 (365)
DOT Outlet
Median 0.60 0.05 0.65 0.07 0.63 0.09 0.04 0.13 26 Mean (Standard
Deviation) 0.97
(0.98) 0.08
(0.04) 1.05
(0.97) 0.11
(0.18) 0.93
(0.85) 0.12
(0.10) 0.05
(0.02) 0.17
(0.11) 230 (20)
Museum Inlet
Median 0.70 0.05 0.80 0.04 0.75 0.09 0.05 0.18 77 Mean (Standard
Deviation) 0.88
(0.78) 0.12
(0.16) 1.01
(0.81) 0.10
(0.13) 0.89
(0.79) 0.13
(0.11) 0.13
(0.14) 0.26
(0.20) 216
(249)
Museum Outlet
Median 0.35 0.05 0.40 0.03 0.34 0.07 0.03 0.11 14 Mean (Standard
Deviation) 0.35
(0.17) 0.06
(0.04) 0.41
(0.19) 0.05
(0.05) 0.34
(0.17) 0.07
(0.05) 0.04
(0.02) 0.11
(0.05) 24
(30) Note: Shaded cells of similar color show a statistically significant difference between influent and effluent concentrations. Effect of Loading Ratio on Pond Performance
The performance of wet detention ponds, or any SCM, as a function of design variables is critical
to both design engineers and the regulatory community. Sedimentation, which removes TSS
from stormwater, is the primary pollutant removal mechanism in wet ponds. Barrett et al. (2008)
found a significant relationship between influent and effluent TSS concentrations for wet ponds
(data from the International Stormwater BMP Database). A critical design variable for any SCM
You created this PDF from an application that is not licensed to print to novaPDF printer (http://www.novapdf.com)

25
is hydraulic loading ratio, or the ratio of catchment area to SCM surface area, which determines
the amount of land that must be dedicated to stormwater treatment. A relatively good
relationship between hydraulic loading and percent TSS removal was reported by Wu et al.
(1996) for three wet ponds in Charlotte, NC. Data from Wu et al. (1996), Greb and Bannerman
(1997), Mallin et al. (2002), Hathaway et al. (2007), and the DOT and Museum ponds (pre-
retrofit) were utilized to project pond efficiency for TSS removal against hydraulic loading
(Figure 9). A total of eight ponds with loading ratios from 13 to 167 were used in the analysis.
In general, an inverse relationship exists between hydraulic loading ratio and TSS removal
efficiency. However, this relationship is not nearly as clear-cut (R2 = 0.22) as what was shown
in Wu et al. (1996), perhaps owing to the fact that different climatic conditions and influent
concentrations existed across the eight ponds. Design factors, such as hydraulic retention time,
presence or absence of littoral shelves, and depth at normal pool, may also have impcted these
results.
Recent research (McNett et al. 2010) has suggested that meeting a target effluent concentration
might be preferable to percent reductions. Effluent concentration metrics for SCMs were
expected to be a better indicator of performance because they account for regional water quality
and “irreducible” concentrations. TSS mean effluent concentrations from the eight ponds were
regressed against loading ratio in Figure 9. They ranged in magnitude from 4 mg/L to 56 mg/L
with higher effluent concentrations resulting from greater loading ratios. A line of best fit was
able to explain 56% of the variability in the data, which is considered reasonably good
considering these were eight field monitored ponds located in two states and various ecoregions.
While past research has shown that TSS efficiency ratio varies as a function of loading ratio, the
review of available peer-reviewed studies conducted here showed a much stronger relationship
with TSS mean effluent concentration.
You created this PDF from an application that is not licensed to print to novaPDF printer (http://www.novapdf.com)

26
Note: Diamonds represent TSS efficiency ratio data, while hollow squares represent TSS effluent
concentration data.
Figure 9. Stormwater pond performance for TSS as a function of loading ratio.
Post-Retrofit Results
Mean pollutant concentrations for the fourteen month post-retrofit monitoring period are
presented in Table 5. During the post-retrofit period, the DOT pond significantly reduced
concentrations of TKN, NO2-3-N, TN, ON, OP, TP and TSS. Mean concentration reductions
were 48%, 39%, and 78%, respectively for TN, TP, and TSS. The NC TN reduction credit for
wet ponds of 25% was exceeded but the TP and TSS credits (40% and 85%) were not met during
the post-retrofit monitoring period. Median effluent concentrations of TN, TP, and TSS were
0.60 mg/L, 0.13 mg/L, and 18 mg/L, respectively. This corresponded to excellent water quality
for TN and fair water quality for TP. The pond met the target 25 mg/L TSS concentration. The
variability of effluent concentrations tended to be less for the effluent for TP and TSS during the
post-retrofit monitoring period; this was not the case for nitrogen species.
At the Museum site, concentrations of all nine analytes were significantly reduced between the
inlet and outlet of the wet pond. While reductions in some of the nitrogen species had been
inconsistent at the DOT pond during both monitoring periods and the Museum pond during the
pre-retrofit period, three large outliers for TKN (range 7.2-15.3 mg/L) and TAN (range 3.4-12.3
y = -0.1422x + 83.993R² = 0.2195
y = 0.2033x + 11.992R² = 0.5579
0
10
20
30
40
50
60
0
10
20
30
40
50
60
70
80
90
100
0 20 40 60 80 100 120 140 160 180
TSS
Mea
n Ef
fluen
t Con
cent
ratio
n (m
g/L)
TSS
Effic
ienc
y Ra
tio
(%)
Loading Ratio
You created this PDF from an application that is not licensed to print to novaPDF printer (http://www.novapdf.com)

27
mg/L) at the inlet probably aided in significant reduction of these species. They also resulted in
the large differences between mean and median nitrogen species values (Table 5). The influent
TP concentration was also much higher than any other monitoring period-pond combination,
suggesting that fertilizer use in the watershed occurred. Mean concentration reductions for TN,
TP, and TSS were 88%, 88% and 95%, respectively. These nutrient reductions were clearly
skewed by elevated influent concentrations. Median effluent concentrations for TN, TP, and
TSS were 0.45 mg/L, 0.04 mg/L, and 6 mg/L, respectively. These values corresponded to
excellent water quality for both TN and TP. The pond also easily met the 25 mg/L TSS target
effluent concentration.
Table 5. Post-retrofit monitoring period water quality results.
Sampling Location Statistic TKN
(mg/L) NO2-3-N (mg/L)
TN (mg/L)
TAN (mg/L)
ON (mg/L)
OP (mg/L)
PBP (mg/L)
TP (mg/L)
TSS (mg/L)
DOT Inlet Median 0.80 0.35 1.25 0.03 0.78 0.11 0.05 0.18 100
Mean (Standard Deviation)
0.84 (0.30)
0.34 (0.21)
1.17 (0.34)
0.11 (0.14)
0.72 (0.29)
0.12 (0.08)
0.07 (0.06)
0.19 (0.10)
101 (70)
DOT Outlet
Median 0.55 0.05 0.60 0.03 0.53 0.06 0.04 0.13 18
Mean (Standard Deviation)
0.55 (0.34)
0.06 (0.02)
0.61 (0.34)
0.05 (0.04)
0.50 (0.34)
0.07 (0.06)
0.05 (0.04)
0.12 (0.07)
22 (19)
Museum Inlet
Median 1.15 0.20 1.25 0.24 0.79 0.09 0.09 0.18 67
Mean (Standard Deviation)
3.32 (4.72)
0.17 (0.11)
3.49 (4.70)
1.60 (3.15)
1.72 (2.25)
0.24 (0.34)
0.17 (0.19)
0.41 (0.52)
252 (551)
Museum Outlet
Median 0.40 0.05 0.45 0.03 0.38 0.02 0.02 0.04 6
Mean (Standard Deviation)
0.37 (0.25)
0.06 (0.04)
0.43 (0.26)
0.04 (0.02)
0.33 (0.24)
0.02 (0.01)
0.03 (0.05)
0.05 (0.05)
13 (17)
Note: Shaded cells of similar color show a statistically significant difference between influent and effluent concentrations.
Comparisons Between Pre- and Post-Retrofit Results
Effluent Concentrations
Influent concentrations for the post-retrofit period at the DOT pond were similar to or less than
influent concentrations for the pre-retrofit period. Since lower influent concentrations are more
difficult to reduce {see irreducible concentration theory [Strecker et al. (2001)]}. Statistical tests
were run to compare influent concentrations pre- and post-retrofit at this pond; only NO2-3-N
You created this PDF from an application that is not licensed to print to novaPDF printer (http://www.novapdf.com)

28
concentrations were significantly higher in the post-retrofit period. This meant that direct
comparison of the effluent concentrations at this pond was reasonable. Mean effluent
concentrations at the DOT pond were 0.44 mg/L, 0.05 mg/L, and 8 mg/L lower for TN, TP, and
TSS, respectively when comparing the post-retrofit period to the pre-retrofit period. These
results suggest that plant uptake and microbial respiration processes resulted in lower pollutant
concentrations (and therefore loads) entering surface waters. While mean concentrations of key
pollutants were reduced, statistical tests to compare effluent concentrations during pre- and post-
retrofit periods resulted in no significantly different data sets. While the islands appeared to aid
in reducing effluent concentrations at the DOT pond, the reductions were not statistically
significant, potentially suggesting that greater than 9% floating island coverage is needed.
Additionally, an invasive aquatic weed (Creeping Water Primrose, Ludwigia hexapetala)
inhabited the DOT pond both pre- and post-retrofit which may have affected the results. During
the summer (at maximum primrose coverage), roughly 25% of the surface area of the pond was
covered by primrose pre-retrofit. The floating islands acted as footholds for the primrose, and 12
months after installation (during summer) about 60% of the pond surface was covered with
primrose (Figure 10). This is a potential confounding factor for the results from this pond.
Figure 10. Presence of Primrose around banks and floating wetland islands
(photo on August 8, 2011)
You created this PDF from an application that is not licensed to print to novaPDF printer (http://www.novapdf.com)

29
Mean influent concentrations of TN and TP at the Museum pond were 3.4 and 1.6 times higher,
respectively, during the post-retrofit period when compared to the pre-retrofit period. These
augmented nutrient concentrations suggested greater use of fertilizer in the watershed; however,
this could not be confirmed with maintenance crews. Mean influent TSS concentrations were
also modestly (16%) higher during the post-retrofit period. Statistical tests revealed differences
in TN and TAN influent concentration between pre- and post-retrofit monitoring periods. Since
influent concentrations of nitrogen species were divergent, comparisons between the two data
sets were more difficult. With that caveat, mean effluent concentrations from the post-retrofit
Museum pond were 0.02 mg/L higher for TN (essentially unchanged), 0.06 mg/L lower for TP,
and 11 mg/L lower for TSS when compared to the pre-retrofit period. The improvements in TP
and TSS effluent concentrations (which were statistically significant) suggest greater
sedimentation perhaps due to increased hydraulic resistance imparted by the islands themselves
and their root mats. Additionally, a significant improvement in OP was observed at the Museum
pond, suggesting that plant uptake occurred. The significant reductions in OP, TP, and TSS at
the Museum site (when comparing pre- to post-retrofit periods) seemed to suggest that the 18%
coverage provided better treatment of stormwater by the FWIs.
Efficiency Ratio
Another metric which may be used to evaluate BMP performance is an efficiency ratio (ER),
which is defined as:
ER = (influent concentration – effluent concentration)/influent concentration
To compare pre- and post-retrofit monitoring periods, efficiency ratios for the two ponds were
calculated (Table 6). In all cases except TSS at the DOT pond, efficiency ratios for TN, TP, and
TSS improved after installation of the floating wetland islands. These results suggest that the
addition of the FWIs does expand upon the unit processes which occur in a wet detention pond,
providing further treatment of stormwater. Conclusions when using the ER metric must be
tempered since this method is sensitive to changes in influent concentration. This was especially
the case for TN and TP at the Museum pond during the post-retrofit monitoring period, where
higher influent concentrations were observed.
You created this PDF from an application that is not licensed to print to novaPDF printer (http://www.novapdf.com)

30
Table 6. Efficiency ratios for pre- and post-retrofit monitoring periods.
Sampling Location
Efficiency Ratio
TN TP TSS DOT Pre Retrofit 0.36 0.36 0.92
DOT Post Retrofit 0.48 0.39 0.78
Museum Pre Retrofit 0.59 0.57 0.89
Museum Post Retrofit 0.88 0.88 0.95
Pollutant Load Performance
Pollutant loads, which are a product of event mean concentration and flow volume for each
storm event, are an excellent indicator of SCM performance since they account for concentration
improvements and infiltration and/or evapotranspiration. Pollutant loads were calculated on a
storm event basis and were normalized based on drainage area and rainfall depth (Table 7). Pre-
and post- retrofit pollutant load of TSS for the DOT and Museum ponds, respectively, was
reduced by 95%, 72%, 82%, and 93%. Summing the four data sets, the two ponds contributed to
an overall TSS load removal of 90%, which exceeded the credit awarded in NC by 5%. Effluent
loads of TSS were higher at the DOT pond and lower at the Museum pond during the post-
retrofit period when compared to the pre-retrofit period. Since the primary mechanism of
pollutant removal in ponds is through settling of particulate matter, it was not surprising that PBP
loads were reduced by greater than 42% during all monitoring periods. Load-based removal of
all pollutants occurred for all combinations of monitoring period, site, and analyte except for OP,
which tended to move through the ponds without treatment during the pre-retrofit period. OP
loads were reduced (29% and 82%) by the two ponds during the post-retrofit period.
Load reduction of TP varied from 15% to 76%. For both ponds, the post-retrofit period had
higher percent load reductions and lower effluent loads of TP than the pre-retrofit period. For
TN, load reduction for the two ponds varied from 35% to 78%, with both ponds performing
better for load reduction in the post-retrofit period. However, the influent loads of TN in the
post-retrofit period at the Museum pond were elevated by a factor of 3.9 when compared to the
You created this PDF from an application that is not licensed to print to novaPDF printer (http://www.novapdf.com)

31
pre-retrofit monitoring period. Since it is necessarily easier to reduce a greater load of
pollutants, the results from this pond for TN must be footnoted. The large influent loads of TN
during the post-retrofit period probably were the cause for the increased effluent load of TN from
this pond when comparing the post-retrofit to the pre-retrofit period. Effluent loads of TN were
lower in the post-retrofit period at the Museum site.
Table 7. Pollutant loads (kg/ha/yr) for the DOT and Museum ponds both pre- and post-retrofit.
DOT Pond Pollutant Load (kg/ha/yr)
Monitoring Location TKN NO2-3-N TN TAN ON OP PBP TP TSS Inlet Pre-Retrofit 8.5 1.2 9.6 1.7 8.0 0.7 0.8 1.5 4418
Outlet Pre-Retrofit 5.3 0.7 6.0 0.7 5.3 0.9 0.4 1.3 215 Inlet Post-Retrofit 7.4 2.5 9.9 0.7 6.7 1.1 0.7 1.8 842
Outlet Post-Retrofit 4.7 0.5 5.2 0.4 4.3 0.8 0.4 1.2 236 Museum Pond Pollutant Load (kg/ha/yr)
Monitoring Location TKN NO2-3-N TN TAN ON OP PBP TP TSS Inlet Pre-Retrofit 3.4 0.6 3.9 0.5 3.4 0.7 1.2 2.0 1210
Outlet Pre-Retrofit 2.1 0.4 2.5 0.3 2.2 0.7 0.3 1.0 213 Inlet Post-Retrofit 14.5 0.9 15.3 5.5 9.0 0.9 0.8 1.7 1532
Outlet Post-Retrofit 3.0 0.3 3.4 0.3 2.8 0.2 0.3 0.4 101
Turnover Volume Analysis
In theory, a stormwater pond works as a plug flow device which, when a storm event occurs,
releases cleaner water while detaining the first flush (runoff from 25.4 mm of precipitation). To
test this theory, an analysis of turnover volume versus effluent concentrations was completed.
Turnover volume is defined as the ratio of influent stormwater volume to pond storage volume.
We hypothesize that with greater turnover volumes, higher effluent pollutant concentrations will
be produced by the wet ponds. To test this theory, the Pearson Correlation Coefficient with a
Fisher Correction was calculated between turnover volume and the three major pollutants of
concern in NC: TN, TP, and TSS. Since there were four data sets (two sites, pre- and post-
retrofit), a total of 12 correlation coefficient’s were calculated, with statistical significance
calculated at an α = 0.05.
Of the 12 combinations of effluent concentration and turnover volume, none of the combinations
had a correlation coefficient that was large enough to be considered statistically significant. This
suggests that pollutant effluent concentration was not related to turnover volume. Perhaps this
You created this PDF from an application that is not licensed to print to novaPDF printer (http://www.novapdf.com)

32
can be explained by the fact that when turnover volume was less than unity (1.0), the ponds
captured the majority of the dirty influent, releasing relatively clean effluent. When turnover
volume was greater than unity, the effects of mixing and the capture of the first flush also
resulted in relatively clean effluent concentrations. Turnover volume, whether small or large,
had no impact on effluent concentrations leaving the ponds.
Wetland Plant Study Results
The mean plant biomass values for both sites are illustrated in Figure 11. It was observed that the
above mat biomass was greater than the below mat biomass for all species except Sedge. Sedge
was found to have large, wooly root systems (roughly 0.75 meters in length) in comparison to the
other species. It was the only species with a biomass ratio less than 1.0 at both sites (Figure 11).
All other plant species had biomass ratios greater than 1.0. The maximum biomass ratio was 6.3
(hibiscus) at the DOT pond and 2.7 (grass) at the Museum pond. At the DOT pond, hibiscus had
the largest total mean plant biomass, followed by sedge. The museum site, which had much
greater canopy cover from surrounding trees, had lower mean above and below mat biomass for
all species sampled when compared against the DOT pond. No trees were present at the DOT
pond. Sunlight is clearly an important factor in biomass accumulation on FWIs. The plant with
the largest mean plant biomass at the Museum pond was sedge.
Figure 11. Side-by-side comparison of the mean plant biomass values of the harvested plants at the DOT
and Museum sites. The error bars indicate standard error.
You created this PDF from an application that is not licensed to print to novaPDF printer (http://www.novapdf.com)

Overall the plant nutrient concentrations follow the same patterns for each species at both sites (Figure 12). Generally, nitrogen and
potassium concentrations were much greater in magnitude than the phosphorus concentrations for each species. At both sites, N and P
concentrations above the mat were less than or equal to 1% of plant biomass, while they were between 1-2% for the below mat
biomass. With the exception of sedge at the Museum site, the below mat nutrient concentrations were greater than the above mat
concentrations. The above mat potassium concentration (nearly 5%) for Pickerelweed at the DOT site was a substantial outlier.
(a) DOT site (b) Museum site
Figure 12. Mean plant tissue macro-nutrient concentrations recorded in the above and below mat biomass for the (a) DOT and (b) Museum sites.
Values below the x-axis indicate concentrations of the below mat biomass.
You created this PDF from an application that is not licensed to print to novaPDF printer (http://www.novapdf.com)
The total concentrations of macronutrients for each species were tabulated in Table 8. Juncus
had the highest nitrogen concentrations at both ponds with 3.1% and 2.8%. Pickerelweed
contained the most potassium at the DOT pond (not found at the Museum pond) with a total
concentration of 6.0%; where hibiscus contained the most at the Museum pond with 2.4%.
Phosphorus concentration did not specifically vary by plant species.
Table 8. Mean total (above + below) plant tissue macro-nutrient
concentrations for each species at both sites Plant
Species Nitrogen (%) Phosphorus (%)
Potassium (%)
DOT Site
Juncus 3.1 0.3 2.3
Sedge 1.9 0.2 1.8
Grass 2.3 0.2 1.6
Hibiscus 2.0 0.3 1.2
Pickeralweed 2.6 0.3 6.0 Museum Site
Juncus 2.8 0.2 1.7
Sedge 2.3 0.2 1.6
Grass 2.1 0.2 1.4
Hibiscus 2.5 0.3 2.4
Benthic Macroinvertebrate Sampling Results
At the DOT pond, the pre-retrofit sampling of benthic macroinvertebrates was successful in
identified 66 total specimens (Table 9). During post-retrofit sampling, a total of only 20
specimens were found, a decrease of 67%. Macroinvertebrate richness decreased from 10 to 5
from pre- to post-retrofit. Additionally, the diversity of the macroinvertebrate community was
greater during the pre-retrofit period (Shannon’s H’ of 1.56 pre-retrofit and 1.16 post-retrofit).
These H’ values were much less than those reported as the average of 20 wet ponds in North
Carolina, 1.97 (Moore and Hunt 2012). There may be two reasons for this apparent decline in
macroinvertebrate community health: (1) the proliferation of Primrose in the pond, which may
have provided shelter for small fish and other predators, and (2) the presence of mosquitofish
(Gambusia) in the pond. During the pre-retrofit sampling, the presence of Gambusia was not
You created this PDF from an application that is not licensed to print to novaPDF printer (http://www.novapdf.com)
35
noted; however, during post-retrofit sampling, they were found in three of the four sweep nets
performed.
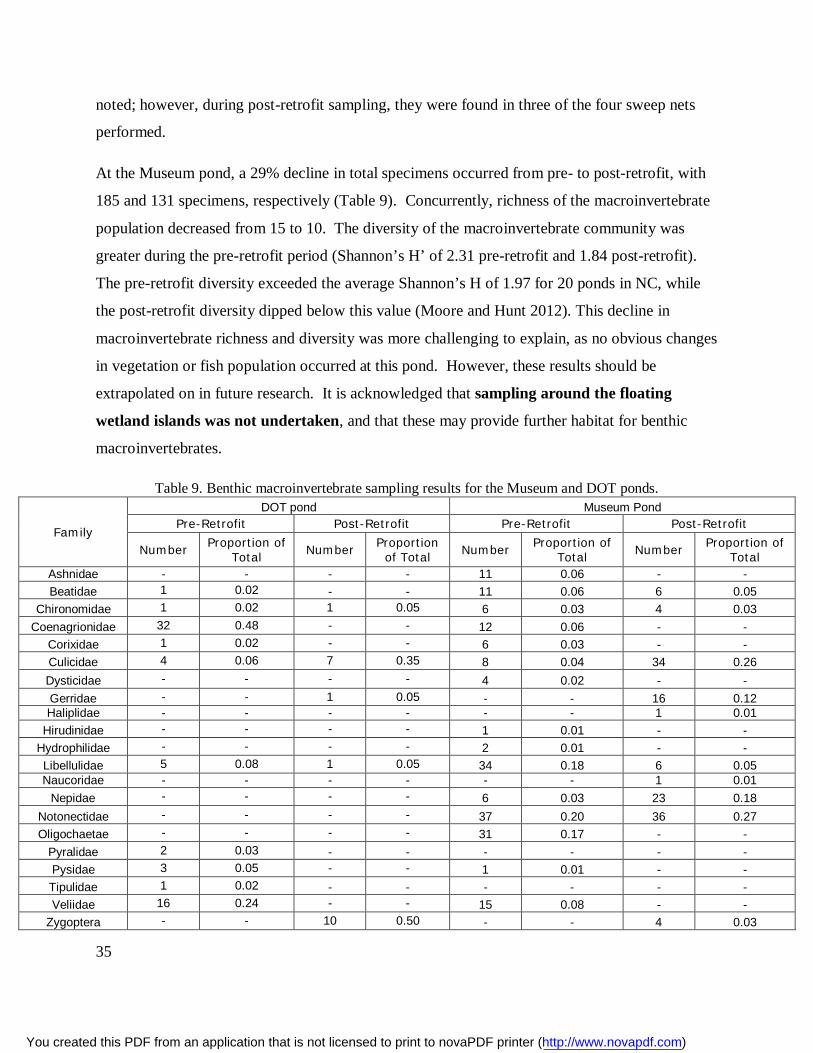
At the Museum pond, a 29% decline in total specimens occurred from pre- to post-retrofit, with
185 and 131 specimens, respectively (Table 9). Concurrently, richness of the macroinvertebrate
population decreased from 15 to 10. The diversity of the macroinvertebrate community was
greater during the pre-retrofit period (Shannon’s H’ of 2.31 pre-retrofit and 1.84 post-retrofit).
The pre-retrofit diversity exceeded the average Shannon’s H of 1.97 for 20 ponds in NC, while
the post-retrofit diversity dipped below this value (Moore and Hunt 2012). This decline in
macroinvertebrate richness and diversity was more challenging to explain, as no obvious changes
in vegetation or fish population occurred at this pond. However, these results should be
extrapolated on in future research. It is acknowledged that sampling around the floating
wetland islands was not undertaken, and that these may provide further habitat for benthic
macroinvertebrates.
Table 9. Benthic macroinvertebrate sampling results for the Museum and DOT ponds.
Family
DOT pond Museum Pond Pre-Retrofit Post-Retrofit Pre-Retrofit Post-Retrofit
Number Proportion of
Total Number
Proportion of Total
Number Proportion of
Total Number
Proportion of Total
Ashnidae - - - - 11 0.06 - - Beatidae 1 0.02 - - 11 0.06 6 0.05
Chironomidae 1 0.02 1 0.05 6 0.03 4 0.03 Coenagrionidae 32 0.48 - - 12 0.06 - -
Corixidae 1 0.02 - - 6 0.03 - - Culicidae 4 0.06 7 0.35 8 0.04 34 0.26 Dysticidae - - - - 4 0.02 - - Gerridae - - 1 0.05 - - 16 0.12 Haliplidae - - - - - - 1 0.01
Hirudinidae - - - - 1 0.01 - - Hydrophilidae - - - - 2 0.01 - - Libellulidae 5 0.08 1 0.05 34 0.18 6 0.05 Naucoridae - - - - - - 1 0.01
Nepidae - - - - 6 0.03 23 0.18 Notonectidae - - - - 37 0.20 36 0.27 Oligochaetae - - - - 31 0.17 - -
Pyralidae 2 0.03 - - - - - - Pysidae 3 0.05 - - 1 0.01 - - Tipulidae 1 0.02 - - - - - - Veliidae 16 0.24 - - 15 0.08 - -
Zygoptera - - 10 0.50 - - 4 0.03
You created this PDF from an application that is not licensed to print to novaPDF printer (http://www.novapdf.com)
36
Outcomes and Conclusions
Two wet detention ponds in Durham, NC, were evaluated for pollutant concentrations and load
improvement for fourteen months prior to and after retrofitting with floating wetland islands.
The following conclusions can be drawn from this study:
1. The pre-retrofit wet detention ponds performed favorably, reducing TN, TP, and TSS mean
concentrations by 36% and 59%, 36% and 57%, and 92% and 89%, respectively. These
concentration reductions compared well to previous field research on wet detention.
Additionally, the ponds met or exceeded the NC pollutant removal credit of 25% TN, 40% TP,
and 85% TSS without consideration for potential load reduction through evapotranspiration.
2. During the pre-retrofit period, the DOT pond significantly reduced concentrations of NO2-3-N,
PBP, and TSS. The Museum pond significantly reduced TKN, TN, TAN, ON, PBP, TP, and
TSS concentrations. Capture of TSS and sediment-bound pollutants was the dominant removal
mechanism.
3. Data were mined from six wet ponds in the literature and were combined with the two pre-
retrofit data sets. A negative linear relationship existed between hydraulic loading ratio and TSS
removal efficiency. However, a much stronger positive linear relationship existed between
loading ratio and mean effluent TSS concentrations. During engineering design, this relationship
could be used as a predictor of effluent concentrations from wet ponds.
4. During the post-retrofit monitoring period, the DOT pond significantly reduced concentrations
of seven of nine analytes studied (all except TAN and PBP), while the Museum pond with FWIs
significantly reduced concentrations of all pollutants studied. Mean effluent concentrations were
0.44 mg/L, 0.05 mg/L, and 8 mg/L for TN, TP, and TSS, respectively, at the DOT pond during
the post-retrofit period. Similar results were observed for TP (0.06 mg/L) and TSS (11 mg/L) at
the Museum pond. Efficiency ratios improved during the post-retrofit vis-à-vis pre-retrofit
period for TN and TP at both ponds and TSS at the Museum pond. When compared against the
pre-retrofit period, these results would suggest that a larger number of unit processes were
provided during the post-retrofit period, presumably due to the addition of the floating wetland
You created this PDF from an application that is not licensed to print to novaPDF printer (http://www.novapdf.com)

37
islands. The addition of the floating wetland islands also appeared to reduce variability in
effluent concentrations.
5. Statistical comparisons between pre- and post-retrofit effluent concentrations showed no
significant improvement in concentrations at the DOT site. At the museum site, OP, TP, and
TSS effluent concentrations were significantly lower in the post-retrofit period. This suggested
(1) that the benefit to pond performance with the addition of floating islands was modest and (2)
that the Museum pond, which had 18% surface area coverage, performed better than the DOT
site, which had 9% surface area coverage.
6. Pollutant load reductions occurred for every pollutant studied except OP. Sediment load
reductions in the pond were between 72-95% for the two ponds. In most cases, the post-retrofit
was lower than the pre-retrofit effluent load, suggesting treatment by the floating wetland
islands.
7. The differences in wetland plant biomass values between the two sites can be attributed to the
amount of sunlight received. The shaded Museum site had were overall less than those of the
DOT site which had full sunlight throughout the day.
8. Overall, the plant nutrient concentrations follow the same patterns for each species at both
sites. Nitrogen and potassium concentrations were much greater than the phosphorus
concentrations for each species. The concentrations of all nutrients were greater in the below mat
biomass in comparison to the above mat biomass.
Acknowledgements
The authors acknowledge the U.S. EPA (319h) program administered by the North Carolina
Department of Environment and Natural Resources and the City of Durham for funding this
study. The staff of the City of Durham, N.C. was indispensable during installation of the floating
wetland islands, especially Jacob Chandler and David Brown. N.C. Cooperative Extension
faculty and N.C. State University graduate students assisted with wetland island installation. The
authors appreciate Floating Islands Southeast for their aid with plant selection and installation
instructions. The authors are grateful for the water quality analysis performed by the City of
You created this PDF from an application that is not licensed to print to novaPDF printer (http://www.novapdf.com)

38
Durham wastewater treatment division. Finally, the authors gratefully acknowledge the City of
Durham’s supplying equipment and partially funding the purchase of the floating wetland
islands. The City was a fantastic cooperator.
References
Barrett, M. E., Lantin, A. & Austrheim-Smith, S. (2004). “Stormwater pollutant removal in roadside vegetated buffer strips.” Transportation Research Record. 1890, 129–140. Barrett, M.E. (2008). “Comparison of BMP performance using the International BMP Database.” Journal of Irrigation and Drainage Engineering, 134(5), 556–561. Batzer, D.P., Shurtleff, A.S., and Rader, R.B. (2001). “Sampling invertebrates in wetlands.” Bioassessment and Management of North American Freshwater Wetlands. R.B. Rader , D.P. Batzer, and S.A. Wissinger, eds., John Wiley & Sons, New York, New York, 339-354. Bean, E.Z. (2005). “A field study to evaluate permeable pavement surface infiltration rates, runoff quantity, runoff quality, and exfiltrate quality.” M.S. thesis, North Carolina State University, Raleigh, NC. DeLorenzo, M.E., Thompson, B., Cooper, E., Moore, J., and Fulton, M.H. (2012). “A long-term monitoring study of chlorophyll, microbial contaminants, and pesticides in a coastal residential stormwater pond and its adjacent tidal creek.” Environmental Monitoring and Assessment. 184, 343-359. Eaton, A. D., Clesceri, L. S., and Greenberg, A. R. (1995). Standard Methods for the Examination of Water and Wastewater. American Public Health Association. Washington, D.C. Gallagher, M.T., Snodgrass, J.W., Ownby, D.R., Brand, A.B., Casey, R.E., and Lev, S. (2011). “Watershed-scale analysis of pollutant distributions in stormwater management ponds.” Urban Ecosystems. 14, 469-484. Gilbert, R.O. (1987). “Estimating the mean and variance from censored data sets.” Statistical methods for environmental pollution monitoring. Van Nostrand Reinhold, New York, NY, USA. 177-178. Hancock, G.S., Holley, J.W., and Chambers, R.M. (2010). “A field-based evaluation of wet retention ponds: how effective are they at water quantity control.” Journal of the American Water Resources Association. 46(6), 1145-1158. Hathaway, J.M., Hunt, W.F., Smith, J.T., and Johnson, A. (2007). “City of Charlotte pilot BMP monitoring program: Pierson pond.” Final Monitoring Report. Available: http://www.bae.ncsu.edu/stormwater/PublicationFiles/CLT_PiersonPond_2007.pdf Hunt, W.F., Smith, J.T., Jadlocki, S.J., Hathaway, J.M., and Eubanks, P.R. (2008). “Pollutant removal by a bioretention cell in urban Charlotte, NC.” Journal of Environmental Engineering. 134(5), 403-408. Jones, M.P. and Hunt, W.F. (2010). “Effect of storm-water wetlands and wet ponds on runoff temperature in trout sensitive waters.” Journal of Irrigation and Drainage Engineering. 136(9), 656-661.
You created this PDF from an application that is not licensed to print to novaPDF printer (http://www.novapdf.com)

39
Mallin, M.A., Ensign, S.H., Wheeler, T.L., and Mayes, D.B. (2002). “Pollutant removal efficacy of three wet detention ponds.” Journal of Environmental Quality. 31, 654-660. Manning, R. (1891). “On the flow of water in open channels and pipes.” Transactions of the Institution of Civil Engineers of Ireland, 20, 161-207. McNett, J. K., Hunt, W. F. & Osborne, J. A. (2010). “Establishing stormwater BMP evaluation metrics based upon ambient water quality associated with benthic macro-invertebrate populations.” Journal of Environmental Engineering. 136 (5), 535–541. Moore, T.L.C. and Hunt, W.F. (2012). “Ecosystem service provision by stormwater wetlands and ponds – a means for evaluation.” Water Research. In press. Munter, R.C., Halverson, T.L., and Anderson, R.D. (1984). “Quality assurance for plant tissue analysis by ICP-AES.” Comm. Soil Sci. Plant Anal, 15(15),1285-1322. North Carolina Administrative Code. (2008). “Jordan Nutrient Strategy.” 15 NCAC 02B, Session Law 2009-216, and Session Law 2009-484. Raleigh, NC. North Carolina Dept. of Environment and Natural Resources. (2007). “Stormwater best management practices manual.” < http://portal.ncdenr.org/web/wq/ws/su/bmp-manual> (November 12, 2011). Passeport, E., and Hunt, W.F. (2009). “Asphalt parking lot nutrient characterization for eight sites in North Carolina, USA.” Journal of Hydrologic Engineering. 14(4), 352-361. SAS version 9.1.3 [computer software]. SAS Institute, Cary, NC. Strecker, E. W., Quigley, M. M., Urbonas, B. R., Jones, E. J., and Clary, J. K. (2001). “Determining urban storm water BMP effectiveness.” Journal of Water Resources Planning and Management, 127(3), 144–149. Tanner, C.C. and Headley, T.R. (2011). “Components of floating emergent macrophyte treatment wetlands influencing removal of stormwater pollutants.” Ecological Engineering. 37(3), 474-486. U.S. Environmental Protection Agency. (1983). “Methods of chemical analysis of water and waste.” EPA-600/4-79-020, Cincinnati, Ohio. U.S. Environmental Protection Agency (U.S. EPA). (2002). “Urban stormwater BMP performance monitoring: a guidance manual for meeting the national stormwater BMP database requirements.” EPA-821-B-02-001, Washington, DC. Van de Moortel, A.M.K, Meers, E., De Pauw, N., and Tack, F.M.G. (2010). “Effects of vegetation, season and temperature on the removal of pollutants in experimental floating treatment wetlands.” Water, Air, and Soil Pollution. 212, 281-297. Winston, R.J., Hunt, W.F., Kennedy, S.G., Wright, J.D., Lauffer, M.S. (2012). “Field evaluation of stormwater control measures for highway runoff treatment.” Journal of Environmental Engineering. 138(1), 101-111.
You created this PDF from an application that is not licensed to print to novaPDF printer (http://www.novapdf.com)

40
Wium-Andersen, T., Nielsen, A.H., Hvitved-Jakobsen, T., and Vollertsen, J. (2011). “Heavy metals, PAHs and toxicity in stormwater wet detention ponds. Water, Science, and Technology. 64(2), 503-511. Wu, J.S., Holman, R.E., Dorney, J.R. (1996). “Systematic evaluation of pollutant removal by urban wet detention ponds.” Journal of Environmental Engineering. 122(11), 983-988. Wu, J. S., Allan, C. J., Saunders, W. L., and Evett, J. B. (1998). “Characterization and pollutant loading estimation for highway runoff.” Journal of Environmental Engineering, 124(7), 584–592.
You created this PDF from an application that is not licensed to print to novaPDF printer (http://www.novapdf.com)

41
Budget
Line Item 319h
Allocated Funds
Match Notes
Personnel (Salary + Fringe) $42,357 $3,337 Shawn Kennedy & RJ Winston (NCSU-paid.
Supplies and Materials $42,208 $49,500 (City of Durham)
Purchase of FWI, Appurtenances and Plants
Mileage/ Motor Pool $1809 RT NCSU-Durham Chemical Analysis $9,000 Provided by City of Durham Equipment $10,000 Provided by City of Durham Forfeited Overhead/Other $14,941 17.3% difference in OH from 27.3%
NCSU requests & 10% 319 pays Subtotal $86,364 $86778 10% Overhead $8,636 $577 For match. Only applies to NCSU
salary Total $95,000 $87,355
You created this PDF from an application that is not licensed to print to novaPDF printer (http://www.novapdf.com)

42
Appendix A: Rainfall Data.
Table A.1. Rainfall data recorded during pre-retrofit monitoring period at the DOT site.
Event Number Date
Rainfall Depth
(in)
Rainfall Depth (mm)
1 12/22/2008 0.9 22.9 2 3/16/2009 2.26 57.4 3 5/26/2009 0.78 19.8 4 6/10/2009 4.55 115.6 5 7/14/2009 1.11 28.2 6 7/21/2009 0.3 7.6 7 7/24/2009 0.59 15.0 8 8/6/2009 0.68 17.3 9 8/21/2009 0.7 17.8
10 10/26/2009 0.44 11.2 11 11/2/2009 1.11 28.2 12 11/13/2009 5.88 149.4 13 11/20/2009 0.59 15.0 14 11/24/2009 1.33 33.8 15 2/23/2010 0.4 10.2 16 2/25/2010 0.28 7.1
Table A.2. Rainfall data recorded during post-retrofit monitoring period at the DOT site.
Event Number Date Rainfall
Depth (in)
Rainfall Depth (mm)
17 07/14/10 1.92 48.8 18 07/28/10 1.63 41.4 19 08/06/10 0.67 17.0 20 08/25/10 0.35 8.9 21 09/28/10 2.6 66.0 22 10/15/10 1.39 35.3 23 02/07/11 1.3 33.0 24 03/01/11 0.86 21.8 25 03/07/11 0.45 11.4 26 03/10/11 0.42 10.7 27 03/28/11 0.58 14.7 28 08/29/11 0.52 13.2 29 08/30/11 0.39 9.9 30 09/07/11 5.2 132.1
You created this PDF from an application that is not licensed to print to novaPDF printer (http://www.novapdf.com)

43
31 09/22/11 0.84 21.3 32 09/26/11 0.9 22.9
Table A.3. Rainfall data recorded during pre-retrofit monitoring period at the Museum site.
Event Number Date Rainfall
Depth (in)
Rainfall Depth (mm)
1 12/12/2008 1.76 44.7 2 12/22/2008 0.9 22.9 3 3/16/2009 2.31 58.7 4 6/10/2009 6.2 157.5 5 6/17/2009 0.57 14.5 6 7/14/2009 0.98 24.9 7 7/21/2009 0.51 13.0 8 8/6/2009 1.78 45.2 9 8/21/2009 0.51 13.0
10 10/26/2009 0.55 14.0 11 11/2/2009 1.25 31.8 12 11/13/2009 5.63 143.0 13 11/20/2009 0.47 11.9 14 11/24/2009 1.37 34.8 15 2/23/2010 0.38 9.7 16 2/25/2010 0.25 6.4
Table A.4. Rainfall data recorded during post-retrofit monitoring period at the Museum site.
Event Number Date Rainfall
Depth (in)
Rainfall Depth (mm)
17 07/14/10 1.92 48.8 18 07/28/10 2.21 56.1 19 08/06/10 0.6 15.2 20 08/25/10 0.46 11.7 21 09/28/10 2.34 59.4 22 10/15/10 1.1 27.9 23 10/26/10 0.87 22.1 24 02/07/11 1.38 35.1 25 03/01/11 0.85 21.6 26 03/07/11 0.45 11.4 27 03/10/11 0.46 11.7 28 03/28/11 0.59 15.0
You created this PDF from an application that is not licensed to print to novaPDF printer (http://www.novapdf.com)

44
29 04/06/11 0.41 10.4 30 08/30/11 0.29 7.4 31 09/07/11 3.78 96.0 32 09/22/11 0.49 12.4 33 09/26/11 0.86 21.8 34 09/28/11 0.3 7.6
Appendix B: Sampled Storm Events.
Table B.1. Summary of sampled storm events at DOT site.
Event Number Date
Pre- or Post-
Retrofit
Constituents Sampled
Basin Inlet
Constituents Sampled
Basin Outlet
1 12/22/2008 Pr
e P, TSS P, TSS
2 3/16/2009 N, P, TSS N, P, TSS 3 5/26/2009 N, P, TSS N, P 4 6/10/2009 N, P, TSS N, P, TSS 5 7/14/2009 N, P, TSS N, P, TSS 6 7/21/2009 N, P, TSS N, P, TSS 7 7/24/2009 N, P, TSS N, P, TSS 8 8/6/2009 N, P, TSS N, P, TSS 9 8/21/2009 N, P, TSS N, P, TSS
10 10/26/2009 N, P, TSS N, P, TSS 11 11/2/2009 N, P, TSS N, P, TSS 12 11/13/2009 N, P, TSS N, P, TSS 13 11/20/2009 N, P, TSS N, P, TSS 14 11/24/2009 N, P, TSS N, P, TSS 15 2/23/2010 N, P, TSS N, P, TSS 16 2/25/2010 N, P N, P 17 07/14/10
Post
N, P, TSS N, P, TSS 18 07/28/10 N, P, TSS N, P, TSS
19 08/06/10 N, P, TSS N, P, TSS
20 08/25/10 N, P N, P 21 09/28/10 N, P, TSS N, P, TSS 22 10/15/10 N, P, TSS N, P, TSS 23 02/07/11 N, P, TSS N, P, TSS 24 03/01/11 N, P, TSS N, P, TSS 25 03/07/11 N, P, TSS N, P, TSS 26 03/10/11 N, P, TSS N, P, TSS
You created this PDF from an application that is not licensed to print to novaPDF printer (http://www.novapdf.com)

45
27 03/28/11 N, P, TSS N, P, TSS 28 08/29/11 N, P, TSS N, P, TSS 29 08/30/11 N, P, TSS N, P, TSS 30 09/07/11 N, P, TSS N, P, TSS 31 09/22/11 N, P, TSS N, P, TSS 32 09/26/11 N, P, TSS N, P, TSS
Table B.2. Summary of sampled storm events at Museum site.
Event Number Date
Pre- or Post-
Retrofit
Constituents Sampled
Basin Inlet
Constituents Sampled
Basin Outlet
1 12/12/2008
Pre
N, P, TSS N, P, TSS 2 12/22/2008 N, P, TSS N, P, TSS 3 3/16/2009 N, P, TSS N, P, TSS 4 6/10/2009 N, P, TSS N, P, TSS 5 6/17/2009 N, P, TSS N, P, TSS 6 7/14/2009 N, P, TSS N, P, TSS 7 7/21/2009 N, P, TSS N, P, TSS 8 8/6/2009 N, P, TSS N, P, TSS 9 8/21/2009 N, P, TSS N, P, TSS
10 10/26/2009 N, P, TSS N, P, TSS 11 11/2/2009 N, P, TSS N, P, TSS 12 11/13/2009 N, P, TSS N, P, TSS 13 11/20/2009 N, P, TSS N, P, TSS 14 11/24/2009 N, P, TSS N, P, TSS 15 2/23/2010 N, P, TSS N, P, TSS 16 2/25/2010 N, P N, P 17 07/14/10
Post
N, P, TSS N, P, TSS 18 07/28/10 N, P, TSS N, P, TSS 19 08/06/10 N, P, TSS N, P, TSS 20 08/25/10 N, P N, P
21 09/28/10 N, P, TSS N, P, TSS
22 10/15/10 N, P, TSS N, P, TSS 23 10/26/10 N, P, TSS N, P, TSS 24 02/07/11 N, P, TSS N, P, TSS 25 03/01/11 N, P, TSS N, P, TSS 26 03/07/11 N, P, TSS N, P, TSS 27 03/10/11 N, P, TSS N, P, TSS
You created this PDF from an application that is not licensed to print to novaPDF printer (http://www.novapdf.com)

46
28 03/28/11 N, P, TSS N, P, TSS 29 04/06/11 N, P, TSS N, P, TSS 30 08/30/11 N, P, TSS N, P, TSS 31 09/07/11 N, P, TSS N, P, TSS 32 09/22/11 N, P, TSS N, P, TSS 33 09/26/11 N, P, TSS N, P, TSS 34 09/28/11 N, P, TSS N, P, TSS
Appendix C: Nutrient and Sediment Concentrations.
Table C.1. Pre-retrofit nutrient and sediment concentrations at the DOT basin inlet. Storm
No. Sample
Site Date TKN (mg/L)
NO2-3-N (mg/L)
TN (mg/L)
TAN (mg/L)
ON (mg/L)
OP (mg/L)
PBP (mg/L)
TP (mg/L)
TSS (mg/L)
1 Inlet 12/22/2008 No data 0.05 No data 0.11 No data 0.04 0.26 0.30 188 2 Inlet 3/16/2009 1.60 0.20 1.80 0.03 1.78 0.05 0.17 0.22 810 3 Inlet 5/26/2009 3.20 0.50 3.70 0.03 3.68 0.21 0.30 0.51 736 4 Inlet 6/10/2009 0.40 0.05 0.45 0.63 -0.18 0.06 0.06 0.12 1079 5 Inlet 7/14/2009 0.50 0.60 1.10 0.03 1.08 0.06 0.32 0.38 221 6 Inlet 7/21/2009 0.50 0.10 0.60 0.03 0.58 0.06 0.05 0.11 18 7 Inlet 7/24/2009 0.30 0.40 0.70 0.03 0.68 0.30 0.05 0.35 112 8 Inlet 8/6/2009 0.40 0.20 0.60 0.03 0.58 0.04 0.02 0.06 38 9 Inlet 8/21/2009 0.60 0.05 0.65 0.03 0.63 0.10 0.06 0.16 17
10 Inlet 10/26/2009 1.10 0.20 1.30 0.07 1.23 0.08 0.03 0.11 225 11 Inlet 11/2/2009 0.80 0.10 0.90 0.03 0.88 0.06 0.04 0.10 135 12 Inlet 11/13/2009 1.00 0.05 1.05 0.03 1.03 0.06 0.03 0.09 215 13 Inlet 11/20/2009 1.40 0.30 1.70 0.06 1.64 0.06 0.02 0.08 759 14 Inlet 11/24/2009 0.30 0.05 0.35 0.06 0.29 0.10 0.03 0.13 66 15 Inlet 2/23/2010 8.98 0.10 9.08 0.80 8.18 0.88 0.55 1.43 833 16 Inlet 2/25/2010 1.00 0.30 1.30 0.03 0.98 0.09 0.09 0.18 No data
Table C.2. Pre-retrofit nutrient and sediment concentrations at the DOT basin outlet.
Storm No.
Sample Site Date TKN
(mg/L) NO2-3-N (mg/L)
TN (mg/L)
TAN (mg/L)
ON (mg/L)
OP (mg/L)
PBP (mg/L)
TP (mg/L)
TSS (mg/L)
1 Outlet 12/22/2008 No data 0.10 No data 0.21 No data 0.03 0.04 0.07 17 2 Outlet 3/16/2009 0.05 0.20 0.25 0.03 0.22 0.02 0.07 0.08 49 3 Outlet 5/26/2009 1.10 0.05 1.15 0.03 1.13 0.05 0.11 0.16 No data 4 Outlet 6/10/2009 0.30 0.05 0.35 0.15 0.20 0.15 0.04 0.19 22 5 Outlet 7/14/2009 1.50 0.05 1.55 0.11 1.44 0.27 0.05 0.32 34 6 Outlet 7/21/2009 0.60 0.05 0.65 0.03 0.63 0.21 0.03 0.24 10 7 Outlet 7/24/2009 0.70 0.10 0.80 0.06 0.74 0.22 0.06 0.28 38 8 Outlet 8/6/2009 1.10 0.05 1.15 0.09 1.06 0.07 0.04 0.11 29 9 Outlet 8/21/2009 3.40 0.05 3.45 0.15 3.30 0.09 0.04 0.13 45
10 Outlet 10/26/2009 1.10 0.05 1.15 0.07 1.08 0.09 0.04 0.13 31 11 Outlet 11/2/2009 0.50 0.10 0.60 0.03 0.58 0.07 0.04 0.11 20 12 Outlet 11/13/2009 0.60 0.05 0.65 0.03 0.63 0.08 0.03 0.11 16 13 Outlet 11/20/2009 0.30 0.10 0.40 0.09 0.31 0.08 0.03 0.11 14
You created this PDF from an application that is not licensed to print to novaPDF printer (http://www.novapdf.com)

47
14 Outlet 11/24/2009 0.20 0.10 0.30 0.05 0.25 0.09 0.02 0.11 14 15 Outlet 2/23/2010 3.00 0.10 3.10 0.74 2.26 0.39 0.08 0.47 85 16 Outlet 2/25/2010 0.50 0.05 0.55 0.03 0.48 0.07 0.05 0.12 *
Table C.3. Post-retrofit nutrient and sediment concentrations at the DOT basin inlet.
Storm No. Sample Site Date TKN
(mg/L) NO2-3-N (mg/L)
TN (mg/L)
TAN (mg/L)
ON (mg/L)
OP (mg/L)
PBP (mg/L)
TP (mg/L)
TSS (mg/L)
17 Inlet 7/14/2010 0.83 0.30 1.13 0.08 0.75 0.11 0.14 0.25 155 18 Inlet 7/28/2010 0.79 0.40 1.19 0.13 0.66 0.05 0.22 0.27 142 19 Inlet 8/6/2010 0.60 0.40 1.00 0.19 0.41 0.14 0.04 0.18 55 20 Inlet 8/25/2010 1.00 0.30 1.30 0.03 0.98 0.09 0.09 0.18 No data 21 Inlet 9/28/2010 1.20 0.40 1.60 0.03 1.18 0.21 0.16 0.37 215 22 Inlet 10/15/2010 1.10 0.40 1.50 0.32 0.78 0.17 0.10 0.27 144 23 Inlet 2/7/2011 0.40 0.90 1.30 0.03 0.38 0.02 0.05 0.06 36 24 Inlet 3/1/2011 0.15 0.20 0.35 0.03 0.13 0.07 0.03 0.10 128 25 Inlet 3/7/2011 0.80 0.40 1.20 0.03 0.78 0.08 0.09 0.17 137 26 Inlet 3/10/2011 1.00 0.40 1.40 0.49 0.51 0.05 0.05 0.10 32 27 Inlet 3/28/2011 0.80 0.60 1.40 0.03 0.78 0.14 0.03 0.17 61 28 Inlet 8/29/2011 0.8 0.05 0.85 0.03 0.78 0.03 0.01 0.04 9 29 Inlet 8/30/2011 1.2 0.30 1.50 0.0 1.18 0.22 0.03 0.25 100 30 Inlet 9/7/2011 0.8 0.05 0.85 0.03 0.78 0.11 0.01 0.12 10 31 Inlet 9/22/2011 1.3 0.20 1.50 0.27 1.03 0.31 0.03 0.34 227 32 Inlet 9/26/2011 0.6 0.10 0.70 0.06 0.54 0.13 0.05 0.18 69
Table C.4. Post-retrofit nutrient and sediment concentrations at the DOT basin outlet.
Storm No. Sample Site Date TKN
(mg/L) NO2-3-N (mg/L)
TN (mg/L)
TAN (mg/L)
ON (mg/L)
OP (mg/L)
PBP (mg/L)
TP (mg/L)
TSS (mg/L)
17 Outlet 07/14/10 0.70 0.10 0.80 0.03 0.68 0.06 0.12 0.18 31 18 Outlet 07/28/10 0.94 0.05 0.99 0.12 0.82 0.22 0.06 0.28 79 19 Outlet 08/06/10 0.50 0.05 0.55 0.03 0.48 0.11 0.03 0.14 15 20 Outlet 08/25/10 0.50 0.05 0.55 0.03 0.48 0.07 0.05 0.12 No data 21 Outlet 09/28/10 0.15 0.05 0.20 0.03 0.13 0.09 0.04 0.13 11 22 Outlet 10/15/10 0.15 0.10 0.25 0.07 0.08 0.02 0.05 0.06 9 23 Outlet 02/07/11 0.60 0.05 0.65 0.03 0.58 0.02 0.05 0.06 21 24 Outlet 03/01/11 0.15 0.05 0.20 0.03 0.13 0.02 0.00 0.02 18 25 Outlet 03/07/11 0.40 0.05 0.45 0.11 0.29 0.02 0.05 0.06 18 26 Outlet 03/10/11 0.15 0.05 0.20 0.03 0.13 0.02 0.05 0.06 12 27 Outlet 03/28/11 1.40 0.05 1.45 0.05 1.35 0.02 0.17 0.18 26 28 Outlet 08/29/11 0.80 0.05 0.85 0.03 0.78 0.13 0.04 0.17 35 29 Outlet 08/30/11 0.70 0.05 0.75 0.03 0.68 0.02 0.04 0.05 4 30 Outlet 09/07/11 0.60 0.05 0.65 0.03 0.58 0.11 0.02 0.13 33 31 Outlet 09/22/11 0.80 0.05 0.85 0.14 0.66 0.12 0.03 0.15 18 32 Outlet 09/26/11 0.30 0.05 0.35 0.03 0.28 0.06 0.03 0.09 3
Table C.5. Pre-retrofit nutrient and sediment concentrations at the Museum basin inlet.
Storm No.
Sample Site Date TKN
(mg/L) NO2-3-N (mg/L)
TN (mg/L)
TAN (mg/L)
ON (mg/L)
OP (mg/L)
PBP (mg/L)
TP (mg/L)
TSS (mg/L)
You created this PDF from an application that is not licensed to print to novaPDF printer (http://www.novapdf.com)

48
1 Inlet 12/12/2008 1.10 0.05 1.15 0.23 0.92 0.19 0.49 0.68 354 2 Inlet 12/22/2008 0.15 0.05 0.20 0.22 -0.02 0.08 0.36 0.44 455 3 Inlet 3/16/2009 0.10 0.05 0.15 0.03 0.13 0.07 0.26 0.33 821 4 Inlet 6/10/2009 0.15 0.05 0.20 0.06 0.14 0.09 0.28 0.37 26 5 Inlet 6/17/2009 1.00 0.60 1.60 0.50 1.10 0.08 0.04 0.12 51 6 Inlet 7/14/2009 0.70 0.40 1.10 0.03 1.08 0.20 0.05 0.25 77 7 Inlet 7/21/2009 1.50 0.20 1.70 0.15 1.55 0.46 0.20 0.66 389 8 Inlet 8/6/2009 1.00 0.20 1.20 0.16 1.04 0.06 0.02 0.08 268 9 Inlet 8/21/2009 0.30 0.05 0.35 0.07 0.28 0.10 0.04 0.14 5
10 Inlet 10/26/2009 2.90 0.05 2.95 0.03 2.93 0.17 0.02 0.19 596 11 Inlet 11/2/2009 0.60 0.05 0.65 0.03 0.63 0.12 0.05 0.17 32 12 Inlet 11/13/2009 0.40 0.05 0.45 0.03 0.43 0.09 0.04 0.13 57 13 Inlet 11/20/2009 0.80 0.05 0.85 0.03 0.83 0.05 0.03 0.08 58 14 Inlet 11/24/2009 0.50 0.05 0.55 0.03 0.53 0.07 0.03 0.10 26 15 Inlet 2/23/2010 2.34 0.10 2.44 0.12 2.22 0.25 0.12 0.37 170 16 Inlet 2/25/2010 0.70 0.05 0.75 0.03 0.68 0.02 0.07 0.08 No Data
Table C.6. Pre-retrofit nutrient and sediment concentrations at the Museum basin outlet.
Storm No.
Sample Site Date TKN
(mg/L) NO2-3-N (mg/L)
TN (mg/L)
TAN (mg/L)
ON (mg/L)
OP (mg/L)
PBP (mg/L)
TP (mg/L)
TSS (mg/L)
1 Outlet 12/12/2008 0.50 0.10 0.60 0.22 0.38 0.19 0.01 0.20 64 2 Outlet 12/22/2008 0.15 0.05 0.20 0.13 0.07 0.07 0.02 0.09 14 3 Outlet 3/16/2009 0.15 0.10 0.25 0.03 0.23 0.05 0.10 0.15 117 4 Outlet 6/10/2009 0.15 0.05 0.20 0.03 0.18 0.13 0.04 0.17 31 5 Outlet 6/17/2009 0.40 0.05 0.45 0.09 0.36 0.10 0.05 0.15 27 6 Outlet 7/14/2009 0.50 0.05 0.55 0.03 0.53 0.02 0.04 0.05 11 7 Outlet 7/21/2009 0.30 0.05 0.35 0.03 0.33 0.02 0.03 0.04 5 8 Outlet 8/6/2009 0.15 0.05 0.20 0.03 0.18 0.06 0.02 0.08 14 9 Outlet 8/21/2009 0.30 0.05 0.35 0.03 0.33 0.08 0.03 0.11 11
10 Outlet 10/26/2009 0.40 0.05 0.45 0.03 0.43 0.09 0.06 0.15 10 11 Outlet 11/2/2009 0.30 0.05 0.35 0.03 0.33 0.09 0.04 0.13 3 12 Outlet 11/13/2009 0.40 0.05 0.45 0.03 0.43 0.07 0.03 0.10 5 13 Outlet 11/20/2009 0.50 0.05 0.55 0.05 0.50 0.06 0.06 0.12 6 14 Outlet 11/24/2009 0.60 0.05 0.65 0.03 0.63 0.09 0.02 0.11 29 15 Outlet 2/23/2010 0.13 0.05 0.18 0.05 0.08 0.04 0.01 0.05 20 16 Outlet 2/25/2010 0.60 0.20 0.80 0.03 0.58 0.02 0.08 0.09 No Data
Table C.7. Post-retrofit nutrient and sediment concentrations at the Museum basin inlet.
Storm No.
Sample Site Date TKN
(mg/L) NO2-3-N (mg/L)
TN (mg/L)
TAN (mg/L)
ON (mg/L)
OP (mg/L)
PBP (mg/L)
TP (mg/L)
TSS (mg/L)
17 Inlet 07/14/10 0.64 0.20 0.84 0.13 0.51 0.02 0.08 0.09 145 18 Inlet 07/28/10 0.62 0.30 0.92 0.06 0.56 0.09 0.14 0.23 97 19 Inlet 08/06/10 0.40 0.30 0.70 0.15 0.25 0.07 0.03 0.10 27 20 Inlet 08/25/10 0.70 0.05 0.75 0.03 0.68 0.02 0.07 0.08 No data 21 Inlet 09/28/10 1.40 0.05 1.45 0.20 1.20 0.02 0.03 0.04 55 22 Inlet 10/15/10 1.50 0.20 1.70 0.27 1.23 0.11 0.12 0.23 113
You created this PDF from an application that is not licensed to print to novaPDF printer (http://www.novapdf.com)

49
23 Inlet 10/26/10 1.00 0.05 1.05 0.03 0.98 0.08 0.15 0.23 46 24 Inlet 02/07/11 15.00 0.20 15.20 6.26 8.74 0.77 0.51 1.28 2215 25 Inlet 03/01/11 3.30 0.20 3.50 3.25 0.05 0.08 0.29 0.37 105 26 Inlet 03/07/11 6.10 0.05 6.15 3.43 2.67 0.50 0.37 0.87 124 27 Inlet 03/10/11 15.30 0.10 15.40 12.30 3.00 1.10 0.68 1.78 61 28 Inlet 03/28/11 2.70 0.20 2.90 0.38 2.32 0.14 0.07 0.21 38 29 Inlet 04/06/11 7.20 0.10 7.30 1.33 5.87 0.95 0.28 1.23 966 30 Inlet 08/30/11 1.30 0.40 1.70 0.50 0.80 0.12 0.03 0.15 33 31 Inlet 09/07/11 0.80 0.05 0.85 0.03 0.78 0.05 0.10 0.15 107 32 Inlet 09/22/11 0.70 0.20 0.90 0.09 0.61 0.07 0.02 0.09 40 33 Inlet 09/26/11 0.40 0.05 0.45 0.11 0.29 0.08 0.03 0.11 52 34 Inlet 09/28/11 0.70 0.30 1.00 0.28 0.42 0.11 0.01 0.12 67
Table C.8. Post-retrofit nutrient and sediment concentrations at the Museum basin outlet.
17 Outlet 07/14/10 0.80 0.05 0.85 0.06 0.74 0.02 0.21 0.22 67 18 Outlet 07/28/10 0.72 0.05 0.77 0.05 0.67 0.04 0.04 0.08 21 19 Outlet 08/06/10 0.40 0.05 0.45 0.03 0.38 0.02 0.00 0.02 6 20 Outlet 08/25/10 0.60 0.20 0.80 0.03 0.58 0.02 0.08 0.09 No data 21 Outlet 09/28/10 0.50 0.05 0.55 0.07 0.43 0.02 0.03 0.04 8 22 Outlet 10/15/10 0.15 0.05 0.20 0.03 0.13 0.02 0.03 0.04 4 23 Outlet 10/26/10 0.20 0.05 0.25 0.03 0.18 0.03 0.02 0.05 4 24 Outlet 02/07/11 0.20 0.05 0.25 0.06 0.14 0.02 0.00 0.02 3 25 Outlet 03/01/11 0.15 0.05 0.20 0.03 0.13 0.02 0.00 0.02 17 26 Outlet 03/07/11 0.15 0.05 0.20 0.08 0.07 0.02 0.02 0.03 6 27 Outlet 03/10/11 0.15 0.05 0.20 0.05 0.10 0.02 0.03 0.04 6 28 Outlet 03/28/11 0.40 0.05 0.45 0.03 0.38 0.02 0.00 0.02 3 29 Outlet 04/06/11 0.50 0.05 0.55 0.03 0.48 0.02 0.03 0.04 44 30 Outlet 08/30/11 0.60 0.05 0.65 0.03 0.58 0.02 0.02 0.03 4 31 Outlet 09/07/11 0.60 0.05 0.65 0.03 0.58 0.04 0.02 0.06 11 32 Outlet 09/22/11 0.50 0.05 0.55 0.03 0.48 0.02 0.03 0.04 4
33 Outlet 09/26/11 0.02
0.05 0.07 0.03 -0.01 0.02
0.00 0.02 3
34 Outlet 09/28/11 0.02 0.05 0.07 0.03 -0.01 0.02 0.00 0.02 3
You created this PDF from an application that is not licensed to print to novaPDF printer (http://www.novapdf.com)

Appendix D: Nutrient and Sediment Loads.
Table D.1. Nutrient and sediment loads for the pre-retrofit DOT pond inlet.
Storm No. Date Rainfall
(in) TKN
(kg/ha) NO2-3-N (kg/ha)
TN (kg/ha)
TAN (kg/ha)
ON (kg/ha)
OP (kg/ha)
PBP (kg/ha)
TP (kg/ha)
TSS (kg/ha)
1 12/22/2008 0.9 No Data 0.01 No Data 0.02 No Data 0.01 0.04 0.05 29 2 3/16/2009 2.26 0.76 0.09 0.85 0.01 0.84 0.02 0.08 0.10 384 3 5/26/2009 0.78 0.41 0.06 0.48 0.00 0.48 0.03 0.04 0.07 95
4 6/10/2009 4.55 0.41 0.05 0.47 0.65 -0.19 0.06 0.06 0.12 1118
5 7/14/2009 1.11 0.10 0.12 0.22 0.01 0.22 0.01 0.07 0.08 45 6 7/21/2009 0.3 0.02 0.00 0.02 0.00 0.02 0.00 0.00 0.00 1 7 7/24/2009 0.59 0.03 0.04 0.06 0.00 0.06 0.03 0.00 0.03 10 8 8/6/2009 0.68 0.04 0.02 0.06 0.00 0.06 0.00 0.00 0.01 4 9 8/21/2009 0.7 0.07 0.01 0.07 0.00 0.07 0.01 0.01 0.02 2
10 10/26/2009 0.44 0.06 0.01 0.08 0.00 0.07 0.00 0.00 0.01 13 11 11/2/2009 1.11 0.16 0.02 0.18 0.01 0.18 0.01 0.01 0.02 27 12 11/13/2009 5.88 1.37 0.07 1.44 0.03 1.40 0.08 0.04 0.12 294 13 11/20/2009 0.59 0.12 0.03 0.15 0.01 0.15 0.01 0.00 0.01 68 14 11/24/2009 1.33 0.08 0.01 0.09 0.02 0.07 0.03 0.01 0.03 17 15 2/23/2010 0.4 0.46 0.01 0.47 0.04 0.42 0.05 0.03 0.07 43 16 2/25/2010 0.28 0.03 0.01 0.04 0.00 0.03 0.00 0.00 0.01 No Data
Table D.2. Nutrient and sediment loads for the pre-retrofit DOT pond outlet.
Storm No. Date Rainfall
(in) TKN
(kg/ha) NO2-3-N (kg/ha)
TN (kg/ha)
TAN (kg/ha)
ON (kg/ha)
OP (kg/ha)
PBP (kg/ha)
TP (kg/ha)
TSS (kg/ha)
1 12/22/2008 0.9 No Data 0.02 No Data 0.03 No Data 0.00 0.01 0.01 3 2 3/16/2009 2.26 0.02 0.09 0.12 0.01 0.10 0.01 0.03 0.04 23 3 5/26/2009 0.78 0.14 0.01 0.15 0.00 0.15 0.01 0.01 0.02 No Data 4 6/10/2009 4.55 0.31 0.05 0.36 0.16 0.21 0.16 0.04 0.20 23 5 7/14/2009 1.11 0.30 0.01 0.31 0.02 0.29 0.05 0.01 0.07 7 6 7/21/2009 0.3 0.02 0.00 0.02 0.00 0.02 0.01 0.00 0.01 0
You created this PDF from an application that is not licensed to print to novaPDF printer (http://www.novapdf.com)

51
7 7/24/2009 0.59 0.06 0.01 0.07 0.01 0.07 0.02 0.01 0.02 3 8 8/6/2009 0.68 0.12 0.01 0.12 0.01 0.11 0.01 0.00 0.01 3 9 8/21/2009 0.7 0.38 0.01 0.39 0.02 0.37 0.01 0.00 0.01 5 10 10/26/2009 0.44 0.06 0.00 0.07 0.00 0.06 0.01 0.00 0.01 2 11 11/2/2009 1.11 0.10 0.02 0.12 0.01 0.12 0.01 0.01 0.02 4 12 11/13/2009 5.88 0.82 0.07 0.89 0.03 0.86 0.11 0.04 0.15 22 13 11/20/2009 0.59 0.03 0.01 0.04 0.01 0.03 0.01 0.00 0.01 1 14 11/24/2009 1.33 0.05 0.03 0.08 0.01 0.06 0.02 0.01 0.03 4 15 2/23/2010 0.4 0.15 0.01 0.16 0.04 0.12 0.02 0.00 0.02 4 16 2/25/2010 0.28 0.01 0.00 0.02 0.00 0.01 0.00 0.00 0.00 No Data
Table D.3. Nutrient and sediment loads for the post-retrofit DOT pond inlet.
Storm No. Date Rainfall
(in) TKN
(kg/ha) NO2-3-N (kg/ha)
TN (kg/ha)
TAN (kg/ha)
ON (kg/ha)
OP (kg/ha)
PBP (kg/ha)
TP (kg/ha)
TSS (kg/ha)
17 7/14/2010 1.92 0.32 0.12 0.44 0.03 0.29 0.04 0.05 0.10 61 18 7/28/2010 1.63 0.25 0.13 0.38 0.04 0.21 0.02 0.07 0.09 46 19 8/6/2010 0.67 0.06 0.04 0.11 0.02 0.04 0.01 0.00 0.02 6
20 8/25/2010 0.35 0.04 0.01 0.05 0.00 0.04 0.00 0.00 0.01 No Data
21 9/28/2010 2.6 0.67 0.22 0.89 0.01 0.65 0.12 0.09 0.21 120 22 10/15/2010 1.39 0.29 0.11 0.40 0.09 0.21 0.05 0.03 0.07 39 23 2/7/2011 1.3 0.10 0.22 0.32 0.01 0.09 0.00 0.01 0.01 9 24 3/1/2011 0.86 0.02 0.03 0.05 0.00 0.02 0.01 0.00 0.01 19 25 3/7/2011 0.45 0.05 0.02 0.07 0.00 0.05 0.00 0.01 0.01 8 26 3/10/2011 0.42 0.06 0.02 0.08 0.03 0.03 0.00 0.00 0.01 2 27 3/28/2011 0.58 0.07 0.05 0.12 0.00 0.07 0.01 0.00 0.01 5 28 8/29/2011 0.52 0.06 0.00 0.06 0.00 0.06 0.00 0.00 0.00 1 29 8/30/2011 0.39 0.06 0.01 0.07 0.00 0.06 0.01 0.00 0.01 5 30 9/7/2011 5.2 0.96 0.06 1.02 0.03 0.93 0.13 0.01 0.14 12 31 9/22/2011 0.84 0.19 0.03 0.21 0.04 0.15 0.04 0.00 0.05 32 32 9/26/2011 0.9 0.09 0.02 0.11 0.01 0.08 0.02 0.01 0.03 11
Table D.4. Nutrient and sediment loads for the post-retrofit DOT pond outlet.
You created this PDF from an application that is not licensed to print to novaPDF printer (http://www.novapdf.com)
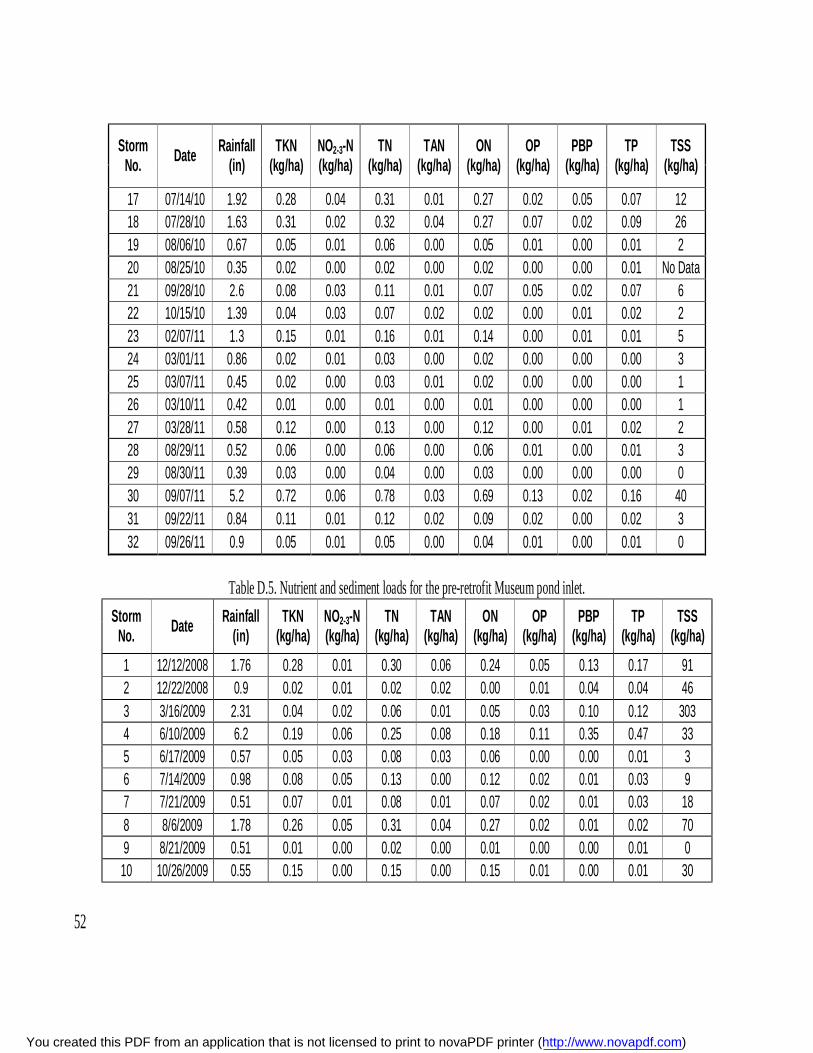
52
Storm No. Date Rainfall
(in) TKN
(kg/ha) NO2-3-N (kg/ha)
TN (kg/ha)
TAN (kg/ha)
ON (kg/ha)
OP (kg/ha)
PBP (kg/ha)
TP (kg/ha)
TSS (kg/ha)
17 07/14/10 1.92 0.28 0.04 0.31 0.01 0.27 0.02 0.05 0.07 12 18 07/28/10 1.63 0.31 0.02 0.32 0.04 0.27 0.07 0.02 0.09 26 19 08/06/10 0.67 0.05 0.01 0.06 0.00 0.05 0.01 0.00 0.01 2 20 08/25/10 0.35 0.02 0.00 0.02 0.00 0.02 0.00 0.00 0.01 No Data 21 09/28/10 2.6 0.08 0.03 0.11 0.01 0.07 0.05 0.02 0.07 6 22 10/15/10 1.39 0.04 0.03 0.07 0.02 0.02 0.00 0.01 0.02 2 23 02/07/11 1.3 0.15 0.01 0.16 0.01 0.14 0.00 0.01 0.01 5 24 03/01/11 0.86 0.02 0.01 0.03 0.00 0.02 0.00 0.00 0.00 3 25 03/07/11 0.45 0.02 0.00 0.03 0.01 0.02 0.00 0.00 0.00 1 26 03/10/11 0.42 0.01 0.00 0.01 0.00 0.01 0.00 0.00 0.00 1 27 03/28/11 0.58 0.12 0.00 0.13 0.00 0.12 0.00 0.01 0.02 2 28 08/29/11 0.52 0.06 0.00 0.06 0.00 0.06 0.01 0.00 0.01 3 29 08/30/11 0.39 0.03 0.00 0.04 0.00 0.03 0.00 0.00 0.00 0 30 09/07/11 5.2 0.72 0.06 0.78 0.03 0.69 0.13 0.02 0.16 40 31 09/22/11 0.84 0.11 0.01 0.12 0.02 0.09 0.02 0.00 0.02 3 32 09/26/11 0.9 0.05 0.01 0.05 0.00 0.04 0.01 0.00 0.01 0
Table D.5. Nutrient and sediment loads for the pre-retrofit Museum pond inlet.
Storm No. Date Rainfall
(in) TKN
(kg/ha) NO2-3-N (kg/ha)
TN (kg/ha)
TAN (kg/ha)
ON (kg/ha)
OP (kg/ha)
PBP (kg/ha)
TP (kg/ha)
TSS (kg/ha)
1 12/12/2008 1.76 0.28 0.01 0.30 0.06 0.24 0.05 0.13 0.17 91 2 12/22/2008 0.9 0.02 0.01 0.02 0.02 0.00 0.01 0.04 0.04 46 3 3/16/2009 2.31 0.04 0.02 0.06 0.01 0.05 0.03 0.10 0.12 303 4 6/10/2009 6.2 0.19 0.06 0.25 0.08 0.18 0.11 0.35 0.47 33 5 6/17/2009 0.57 0.05 0.03 0.08 0.03 0.06 0.00 0.00 0.01 3 6 7/14/2009 0.98 0.08 0.05 0.13 0.00 0.12 0.02 0.01 0.03 9 7 7/21/2009 0.51 0.07 0.01 0.08 0.01 0.07 0.02 0.01 0.03 18 8 8/6/2009 1.78 0.26 0.05 0.31 0.04 0.27 0.02 0.01 0.02 70 9 8/21/2009 0.51 0.01 0.00 0.02 0.00 0.01 0.00 0.00 0.01 0 10 10/26/2009 0.55 0.15 0.00 0.15 0.00 0.15 0.01 0.00 0.01 30
You created this PDF from an application that is not licensed to print to novaPDF printer (http://www.novapdf.com)

53
11 11/2/2009 1.25 0.10 0.01 0.10 0.00 0.10 0.02 0.01 0.03 5 12 11/13/2009 5.63 0.45 0.06 0.51 0.03 0.48 0.10 0.05 0.15 64 13 11/20/2009 0.47 0.03 0.00 0.03 0.00 0.03 0.00 0.00 0.00 2 14 11/24/2009 1.37 0.09 0.01 0.10 0.00 0.10 0.01 0.01 0.02 5 15 2/23/2010 0.38 0.07 0.00 0.07 0.00 0.07 0.01 0.00 0.01 5 16 2/25/2010 0.25 0.01 0.00 0.01 0.00 0.01 0.00 0.00 0.00 No data
Table D.6. Nutrient and sediment loads for the pre-retrofit Museum pond outlet.
Storm No. Date Rainfall
(in) TKN
(kg/ha) NO2-3-N (kg/ha)
TN (kg/ha)
TAN (kg/ha)
ON (kg/ha)
OP (kg/ha)
PBP (kg/ha)
TP (kg/ha)
TSS (kg/ha)
1 12/12/2008 1.76 0.13 0.03 0.15 0.06 0.10 0.05 0.00 0.05 16.42
2 12/22/2008 0.9 0.02 0.01 0.02 0.01 0.01 0.01 0.00 0.01 1.41 3 3/16/2009 2.31 0.06 0.04 0.09 0.01 0.08 0.02 0.04 0.06 43.18 4 6/10/2009 6.2 0.19 0.06 0.25 0.03 0.22 0.16 0.05 0.22 39.24 5 6/17/2009 0.57 0.02 0.00 0.02 0.00 0.02 0.01 0.00 0.01 1.42 6 7/14/2009 0.98 0.06 0.01 0.06 0.00 0.06 0.00 0.00 0.01 1.25 7 7/21/2009 0.51 0.01 0.00 0.02 0.00 0.01 0.00 0.00 0.00 0.23 8 8/6/2009 1.78 0.04 0.01 0.05 0.01 0.05 0.02 0.01 0.02 3.65 9 8/21/2009 0.51 0.01 0.00 0.02 0.00 0.01 0.00 0.00 0.00 0.50 10 10/26/2009 0.55 0.02 0.00 0.02 0.00 0.02 0.00 0.00 0.01 0.50 11 11/2/2009 1.25 0.05 0.01 0.06 0.00 0.05 0.01 0.01 0.02 0.48 12 11/13/2009 5.63 0.45 0.06 0.51 0.03 0.48 0.08 0.03 0.11 5.65 13 11/20/2009 0.47 0.02 0.00 0.02 0.00 0.02 0.00 0.00 0.00 0.24 14 11/24/2009 1.37 0.11 0.01 0.12 0.00 0.11 0.02 0.00 0.02 5.28 15 2/23/2010 0.38 0.00 0.00 0.01 0.00 0.00 0.00 0.00 0.00 0.61 16 2/25/2010 0.25 0.01 0.00 0.01 0.00 0.01 0.00 0.00 0.00 No Data
Table D.7. Nutrient and sediment loads for the post-retrofit Museum pond inlet.
Storm No. Date Rainfall
(in) TKN
(kg/ha) NO2-3-N (kg/ha)
TN (kg/ha)
TAN (kg/ha)
ON (kg/ha)
OP (kg/ha)
PBP (kg/ha)
TP (kg/ha)
TSS (kg/ha)
17 07/14/10 1.92 0.19 0.06 0.24 0.04 0.15 0.00 0.02 0.03 42
You created this PDF from an application that is not licensed to print to novaPDF printer (http://www.novapdf.com)

54
18 07/28/10 2.21 0.22 0.10 0.32 0.02 0.19 0.03 0.05 0.08 34 19 08/06/10 0.6 0.02 0.02 0.04 0.01 0.01 0.00 0.00 0.01 2 20 08/25/10 0.46 0.03 0.00 0.03 0.00 0.03 0.00 0.00 0.00 No Data 21 09/28/10 2.34 0.53 0.02 0.54 0.08 0.45 0.01 0.01 0.02 21 22 10/15/10 1.1 0.20 0.03 0.23 0.04 0.16 0.01 0.02 0.03 15 23 10/26/10 0.87 0.10 0.00 0.10 0.00 0.09 0.01 0.01 0.02 4 24 02/07/11 1.38 2.76 0.04 2.79 1.15 1.61 0.14 0.09 0.24 407 25 03/01/11 0.85 0.31 0.02 0.33 0.30 0.00 0.01 0.03 0.03 10 26 03/07/11 0.45 0.23 0.00 0.23 0.13 0.10 0.02 0.01 0.03 5 27 03/10/11 0.46 0.60 0.00 0.60 0.48 0.12 0.04 0.03 0.07 2 28 03/28/11 0.59 0.15 0.01 0.16 0.02 0.13 0.01 0.00 0.01 2 29 04/06/11 0.41 0.24 0.00 0.24 0.04 0.20 0.03 0.01 0.04 32 30 08/30/11 0.29 0.03 0.01 0.04 0.01 0.02 0.00 0.00 0.00 1 31 09/07/11 3.78 0.56 0.03 0.59 0.02 0.54 0.03 0.07 0.10 74 32 09/22/11 0.49 0.03 0.01 0.04 0.00 0.03 0.00 0.00 0.00 2 33 09/26/11 0.86 0.04 0.00 0.04 0.01 0.03 0.01 0.00 0.01 5 34 09/28/11 0.3 0.02 0.01 0.02 0.01 0.01 0.00 0.00 0.00 2
Table D.8. Nutrient and sediment loads for the post-retrofit Museum pond outlet.
Storm No. Date Rainfall
(in) TKN
(kg/ha) NO2-3-N (kg/ha)
TN (kg/ha)
TAN (kg/ha)
ON (kg/ha)
OP (kg/ha)
PBP (kg/ha)
TP (kg/ha)
TSS (kg/ha)
17 07/14/10 1.92 0.23 0.01 0.25 0.02 0.21 0.00 0.06 0.06 19 18 07/28/10 2.21 0.25 0.02 0.27 0.02 0.23 0.01 0.01 0.03 7 19 08/06/10 0.6 0.02 0.00 0.03 0.00 0.02 0.00 0.00 0.00 0 20 08/25/10 0.46 0.02 0.01 0.03 0.00 0.02 0.00 0.00 0.00 No Data 21 09/28/10 2.34 0.19 0.02 0.21 0.03 0.16 0.01 0.01 0.02 3 22 10/15/10 1.1 0.02 0.01 0.03 0.00 0.02 0.00 0.00 0.01 1 23 10/26/10 0.87 0.02 0.00 0.02 0.00 0.02 0.00 0.00 0.00 0 24 02/07/11 1.38 0.04 0.01 0.05 0.01 0.03 0.00 0.00 0.00 1 25 03/01/11 0.85 0.01 0.00 0.02 0.00 0.01 0.00 0.00 0.00 2 26 03/07/11 0.45 0.01 0.00 0.01 0.00 0.00 0.00 0.00 0.00 0 27 03/10/11 0.46 0.01 0.00 0.01 0.00 0.00 0.00 0.00 0.00 0 28 03/28/11 0.59 0.02 0.00 0.02 0.00 0.02 0.00 0.00 0.00 0
You created this PDF from an application that is not licensed to print to novaPDF printer (http://www.novapdf.com)

55
29 04/06/11 0.41 0.02 0.00 0.02 0.00 0.02 0.00 0.00 0.00 1 30 08/30/11 0.29 0.01 0.00 0.01 0.00 0.01 0.00 0.00 0.00 0 31 09/07/11 3.78 0.42 0.03 0.45 0.02 0.40 0.03 0.01 0.04 8 32 09/22/11 0.49 0.02 0.00 0.02 0.00 0.02 0.00 0.00 0.00 0 33 09/26/11 0.86 0.00 0.00 0.01 0.00 0.00 0.00 0.00 0.00 0 34 09/28/11 0.3 0.00 0.00 0.00 0.00 0.00 0.00 0.00 0.00 0
You created this PDF from an application that is not licensed to print to novaPDF printer (http://www.novapdf.com)

Appendix E: Cumulative Probability Plots.
Cumulative probability plots are presented below in Figures E.1-E.6. They are created by
ranking pollutant concentrations entering and leaving each SCM. Ranked concentrations are
then regressed against the relative probability of that data point occurring. They are an excellent
exploratory tool for water quality data, and provide an idea of the variation, range, and
distribution of the data. At cumulative probabilities below 20%, there appeared to be little
improvement in expected concentrations of TN, TP, and TSS due to potentially irreducible
influent concentrations. As influent pollutant concentrations increased, there was a better chance
of pollutant removal by the wet detention ponds. In general, about than 50% of the influent TN
samples exceed the water quality benchmark of 0.99 mg/L. This percentage was improved to
40% at the Museum site and 30% at the DOT site. TP concentrations in both ponds exhibited
little improvement until the influent concentration reached 0.20 mg/L. At the two sites, influent
concentrations met the 25 mg/L TSS benchmark between 10-25% of the sampled events. This
metric was met about 80% of the time by the effluent of the DOT pond and about 60% of the
time for the Museum pond. For all pollutants, ranked effluent concentrations during the post-
retrofit period were generally lower in magnitude than those from the pre-retrofit period,
suggesting some improvement from the addition of floating wetland islands.
Figure E.1. Cumulative probability plot for TN at the DOT site.
0.001.002.003.004.005.006.007.008.009.00
10.00
0 20 40 60 80 100
TN C
once
ntra
tion
(mg/
L)
Cumulative Probability (%)
DOT Inlet Pre DOT Outlet Pre DOT Inlet Post DOT Outlet Post
You created this PDF from an application that is not licensed to print to novaPDF printer (http://www.novapdf.com)

57
Figure E.2. Cumulative probability plots for TP at the DOT site.
Figure E.3. Cumulative probability plot for TSS at the DOT site.
0.00
0.20
0.40
0.60
0.80
1.00
1.20
1.40
1.60
0 20 40 60 80 100
TP C
once
ntra
tion
(mg/
L)
Cumulative Probability (%)
DOT Inlet Pre DOT Outlet Pre DOT Inlet Post DOT Outlet Post
0
200
400
600
800
1000
1200
0 20 40 60 80 100
TSS
Conc
entr
atio
n (m
g/L)
Cumulative Probability (%)
DOT Inlet Pre DOT Outlet Pre DOT Inlet Post DOT Outlet Post
You created this PDF from an application that is not licensed to print to novaPDF printer (http://www.novapdf.com)
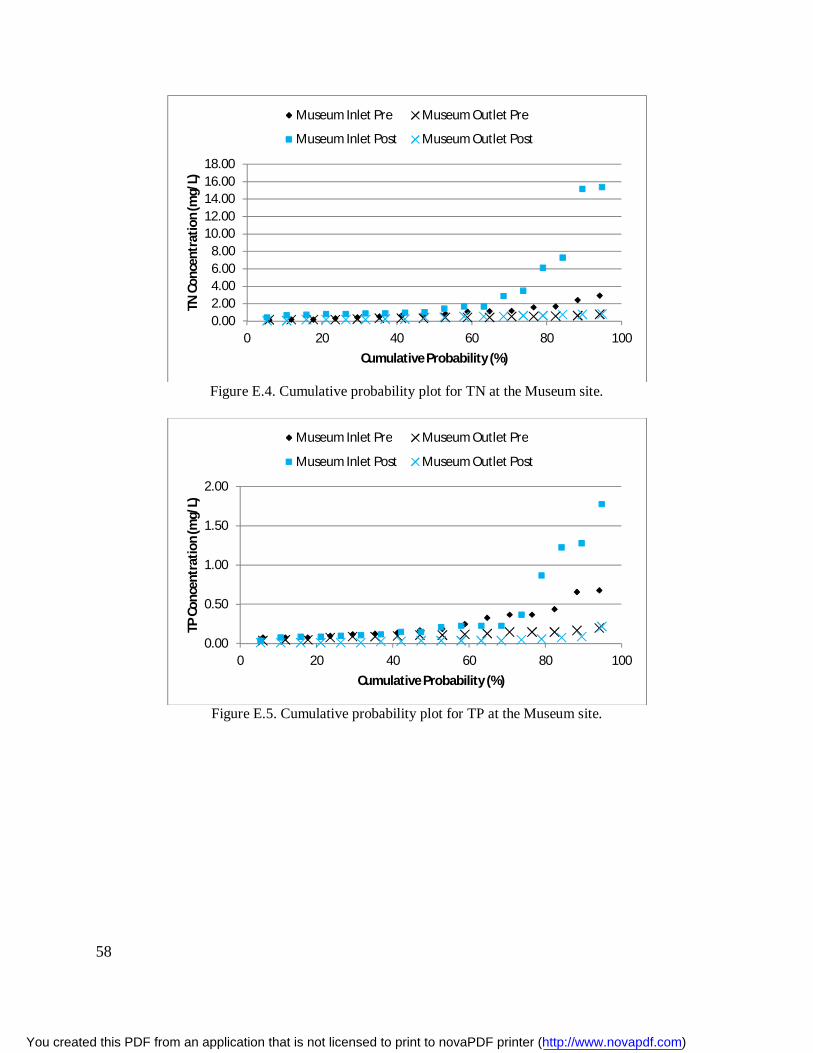
58
Figure E.4. Cumulative probability plot for TN at the Museum site.
Figure E.5. Cumulative probability plot for TP at the Museum site.
0.002.004.006.008.00
10.0012.0014.0016.0018.00
0 20 40 60 80 100
TN C
once
ntra
tion
(mg/
L)
Cumulative Probability (%)
Museum Inlet Pre Museum Outlet Pre
Museum Inlet Post Museum Outlet Post
0.00
0.50
1.00
1.50
2.00
0 20 40 60 80 100
TP C
once
ntra
tion
(mg/
L)
Cumulative Probability (%)
Museum Inlet Pre Museum Outlet Pre
Museum Inlet Post Museum Outlet Post
You created this PDF from an application that is not licensed to print to novaPDF printer (http://www.novapdf.com)

59
` Figure E.6. Cumulative probability plot for TSS at the Museum site.
0
500
1000
1500
2000
2500
0 20 40 60 80 100
TSS
Conc
entr
atio
n (m
g/L)
Cumulative Probability (%)
Museum Inlet Pre Museum Outlet Pre
Museum Inlet Post Museum Outlet Post
You created this PDF from an application that is not licensed to print to novaPDF printer (http://www.novapdf.com)

Appendix F: Wetland Island Plant Data.
Species Location Sample #
Roots or Shoots?
Dry Wt Biomass Before
Grinding (g)
Total Sample Wt (g) *Used
by lab
Sand Wt (g) *Found by lab
Biomass Wt (g) *Used for
analysis C N P K
Juncus DOT 1 Roots 43.0 2.5 0.382 2.118 31.21% 1.71% 0.21% 1.15% Juncus DOT 1 Shoots 60.4 2.5 2.500 45.34% 1.39% 0.14% 1.49% Juncus DOT 2 Roots 13.5 2.5 0.316 2.184 34.54% 1.81% 0.20% 1.06% Juncus DOT 2 Shoots 173.0 2.5 2.500 44.97% 1.22% 0.08% 0.76% Juncus DOT 3 Roots 78.5 2.5 0.544 1.956 30.50% 1.82% 0.22% 0.81% Juncus DOT 3 Shoots 85.5 2.5 2.500 45.77% 1.27% 0.14% 1.50% Juncus Museum 1 Roots 29.5 2.5 0.206 2.294 39.54% 1.91% 0.18% 0.52% Juncus Museum 1 Shoots 57.0 2.5 2.500 46.03% 1.01% 0.05% 0.71% Juncus Museum 2 Roots 39.5 2.5 0.238 2.262 36.49% 1.57% 0.14% 1.04% Juncus Museum 2 Shoots 94.5 2.5 2.500 46.06% 1.12% 0.06% 0.94% Juncus Museum 3 Roots 56.0 2.5 0.203 2.297 37.49% 1.68% 0.14% 0.98% Juncus Museum 3 Shoots 47.0 2.5 2.500 46.25% 0.98% 0.05% 0.90% Sedge DOT 1 Roots 170.0 2.5 0.131 2.369 40.74% 0.97% 0.13% 0.87% Sedge DOT 1 Shoots 156.0 2.5 2.500 45.29% 0.90% 0.07% 0.80% Sedge DOT 2 Roots 271.0 2.5 0.582 1.918 27.83% 0.86% 0.12% 0.66% Sedge DOT 2 Shoots 288.5 2.5 2.500 45.33% 1.13% 0.09% 1.01% Sedge DOT 3 Roots 220.5 2.5 0.204 2.296 38.53% 0.93% 0.14% 0.98% Sedge DOT 3 Shoots 128.5 2.5 2.500 45.94% 0.86% 0.10% 1.13% Sedge Museum 1 Roots 225.5 2.5 0.036 2.464 43.82% 1.14% 0.09% 0.81% Sedge Museum 1 Shoots 75.5 2.5 2.500 44.91% 1.30% 0.07% 0.80% Sedge Museum 2 Roots 227.0 2.5 0.044 2.456 42.99% 1.06% 0.09% 0.94% Sedge Museum 2 Shoots 65.5 2.5 2.500 45.47% 1.31% 0.07% 0.79% Sedge Museum 3 Roots 131.5 2.5 0.049 2.451 44.35% 1.07% 0.09% 0.56%
You created this PDF from an application that is not licensed to print to novaPDF printer (http://www.novapdf.com)

61
Sedge Museum 3 Shoots 74.0 2.5 2.500 46.00% 1.10% 0.06% 0.86% Grass DOT 1 Roots 138.0 2.5 0.169 2.331 39.65% 1.14% 0.18% 0.80% Grass DOT 1 Shoots 63.0 2.5 2.500 44.62% 0.71% 0.06% 0.86% Grass DOT 2 Roots 38.5 2.5 0.139 2.361 41.05% 1.67% 0.15% 0.77% Grass DOT 2 Shoots 96.5 2.5 2.500 46.15% 0.82% 0.07% 0.49% Grass DOT 3 Roots 20.0 2.5 0.240 2.260 38.60% 1.82% 0.19% 0.74% Grass DOT 3 Shoots 318.5 2.5 2.500 44.38% 0.79% 0.07% 1.01% Grass Museum 1 Roots 46.5 2.5 0.159 2.341 38.48% 1.69% 0.15% 0.71% Grass Museum 1 Shoots 90.5 2.5 2.500 45.94% 0.36% 0.03% 0.61% Grass Museum 2 Roots 11.5 2.5 0.045 2.455 43.04% 1.53% 0.13% 0.71% Grass Museum 2 Shoots 123.0 2.5 2.500 46.22% 0.25% 0.01% 0.74% Grass Museum 3 Roots 34.0 2.5 0.165 2.335 40.45% 1.79% 0.16% 0.89% Grass Museum 3 Shoots 38.5 2.5 2.500 45.91% 0.71% 0.05% 0.68%
Hibiscus DOT 1 Roots 116.0 2.5 0.059 2.441 41.41% 1.76% 0.26% 0.99% Hibiscus DOT 1 Shoots 604.5 2.5 2.500 44.48% 0.35% 0.06% 0.53% Hibiscus DOT 2 Roots 51.5 2.5 0.073 2.427 42.01% 1.67% 0.21% 0.82% Hibiscus DOT 2 Shoots 512.0 2.5 2.500 46.46% 0.24% 0.02% 0.16% Hibiscus DOT 3 Roots 54.5 2.5 0.150 2.350 39.08% 1.78% 0.22% 0.69% Hibiscus DOT 3 Shoots 272.0 2.5 2.500 45.13% 0.34% 0.04% 0.46% Hibiscus Museum 1 Roots 40.5 2.5 0.029 2.471 42.51% 2.18% 0.23% 1.53% Hibiscus Museum 1 Shoots 80.5 2.5 2.500 44.15% 0.36% 0.02% 1.09% Hibiscus Museum 2 Roots 17.0 2.5 0.037 2.463 43.80% 2.29% 0.23% 1.22% Hibiscus Museum 2 Shoots 17.0 2.5 2.500 43.33% 0.40% 0.03% 1.13% Hibiscus Museum 3 Roots 74.0 2.5 0.025 2.475 43.55% 2.11% 0.25% 1.33% Hibiscus Museum 3 Shoots 125.5 2.5 2.500 44.71% 0.29% 0.02% 0.85% P-weed DOT 1 Roots 113.0 2.5 0.131 2.369 40.24% 1.56% 0.18% 0.97% P-weed DOT 1 Shoots 149.0 2.5 2.500 41.05% 0.95% 0.13% 4.51%
You created this PDF from an application that is not licensed to print to novaPDF printer (http://www.novapdf.com)

62
P-weed DOT 2 Roots 51.5 2.5 0.134 2.366 40.64% 1.59% 0.20% 0.87% P-weed DOT 2 Shoots 52.5 2.5 2.500 40.02% 1.01% 0.14% 5.78% P-weed DOT 3 Roots 8.5 2.5 0.099 2.401 39.74% 1.65% 0.20% 1.74%
P-weed DOT 3 Shoots 14.0 2.5 2.500 40.91% 1.15% 0.18% 4.23%
You created this PDF from an application that is not licensed to print to novaPDF printer (http://www.novapdf.com)

63
Appendix G: Pictorial Description of Floating Wetland Island Installation.
Large islands with pre-drilled holes move moveable by groups of 4 to 5 people.
You created this PDF from an application that is not licensed to print to novaPDF printer (http://www.novapdf.com)
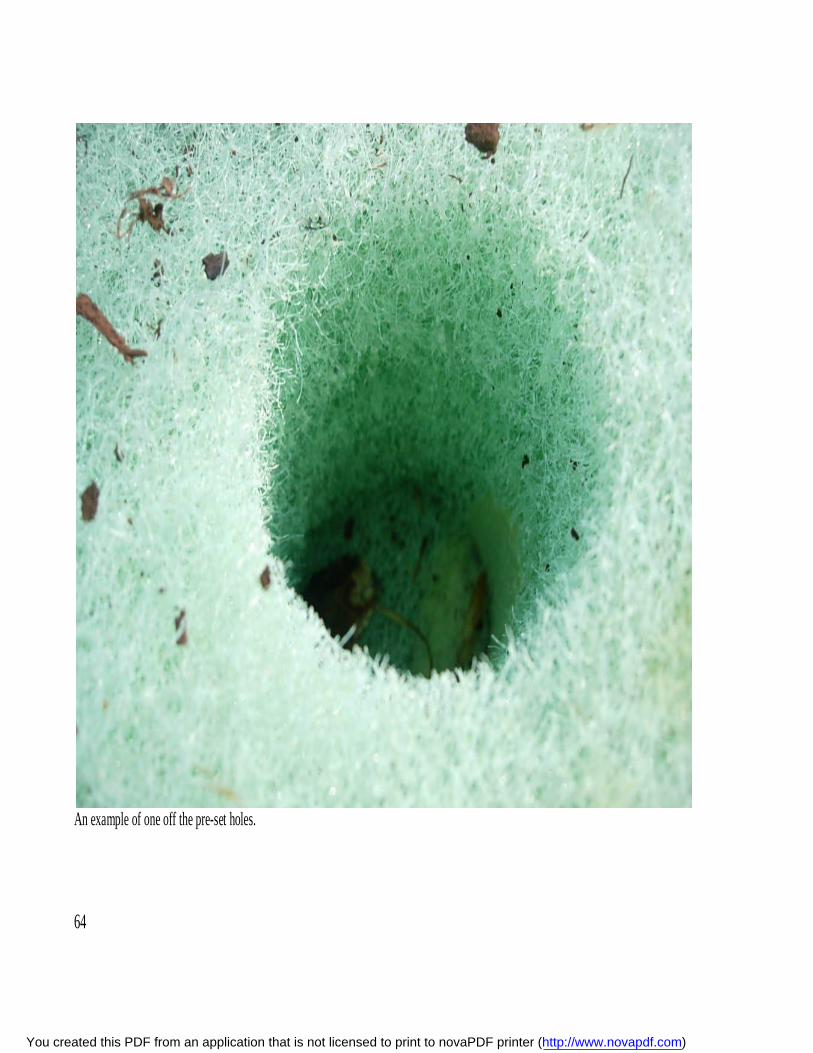
64
An example of one off the pre-set holes.
You created this PDF from an application that is not licensed to print to novaPDF printer (http://www.novapdf.com)

65
The holes were filled with peat moss to “jump start” plant growth.
You created this PDF from an application that is not licensed to print to novaPDF printer (http://www.novapdf.com)

66
Vegetation was able to easily slide into the available “slots.”
You created this PDF from an application that is not licensed to print to novaPDF printer (http://www.novapdf.com)

67
Floating the islands was relatively simple. They were anchored” using cinderblocks tethered to each corner of the island.
You created this PDF from an application that is not licensed to print to novaPDF printer (http://www.novapdf.com)

68
At the DOT pond, it was imperative to install goose fencing to deter goose predation. It did appear to thwart geese.
You created this PDF from an application that is not licensed to print to novaPDF printer (http://www.novapdf.com)
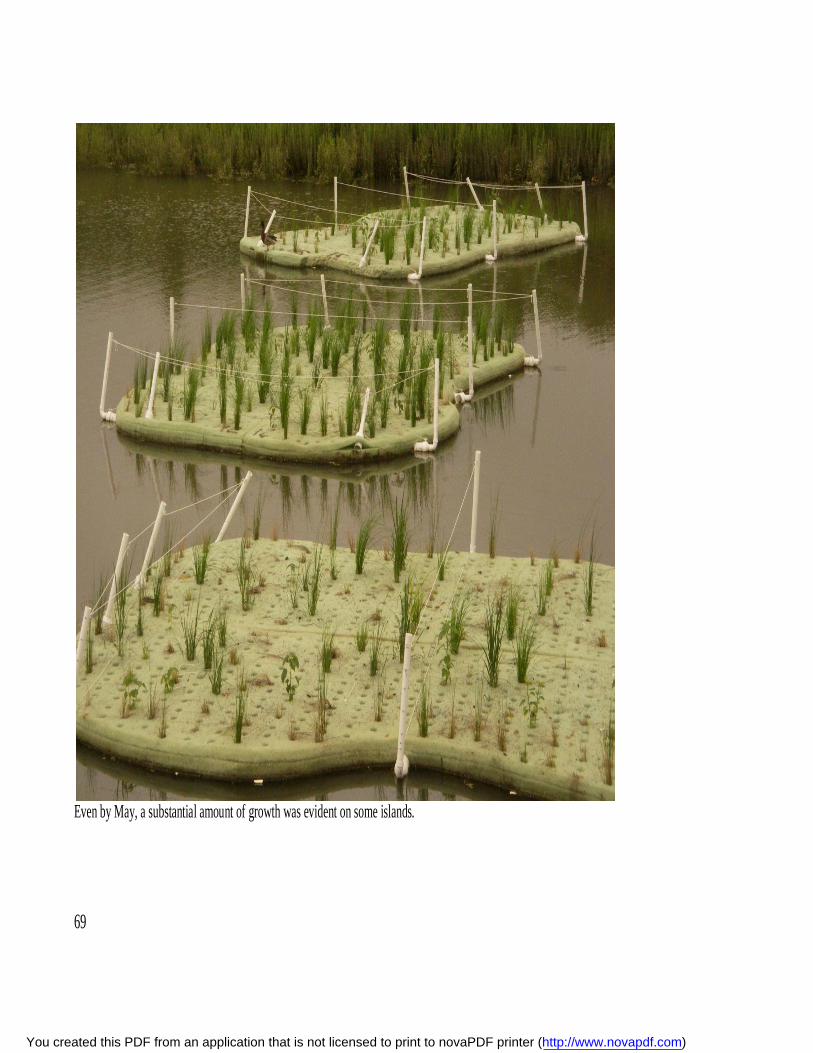
69
Even by May, a substantial amount of growth was evident on some islands.
You created this PDF from an application that is not licensed to print to novaPDF printer (http://www.novapdf.com)
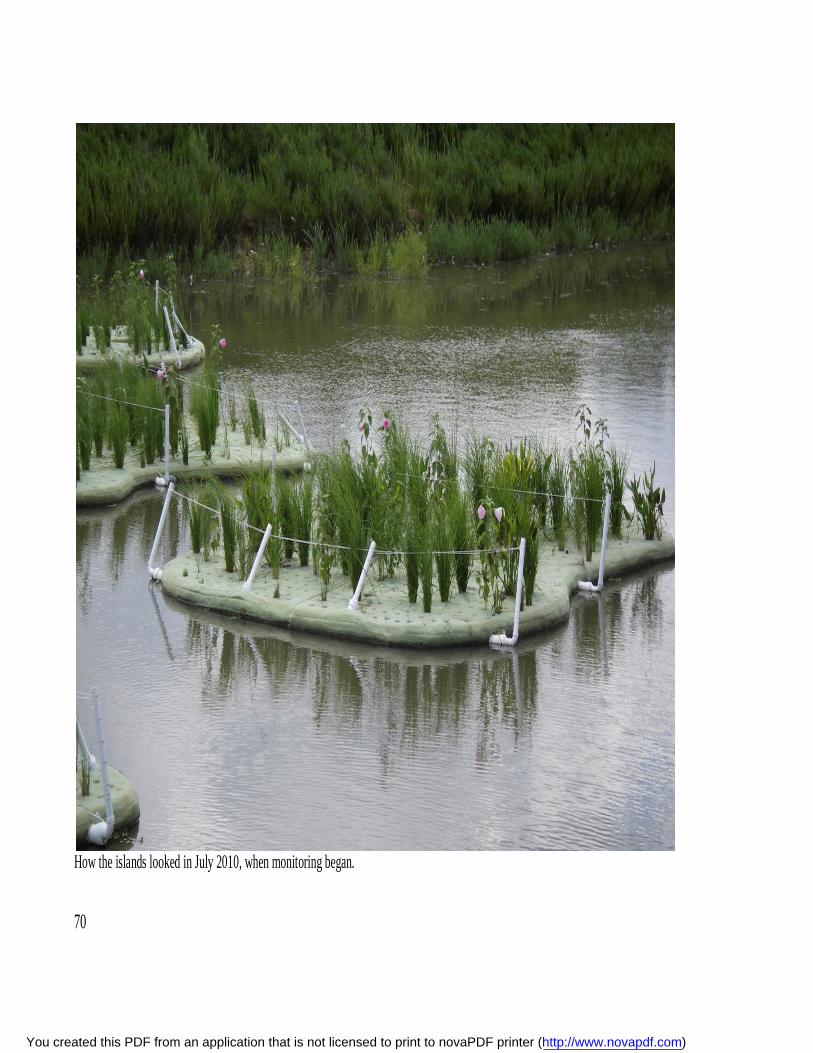
70
How the islands looked in July 2010, when monitoring began.
You created this PDF from an application that is not licensed to print to novaPDF printer (http://www.novapdf.com)

71
Islands 1 year after planting (April 2011).
You created this PDF from an application that is not licensed to print to novaPDF printer (http://www.novapdf.com)