final report - defense technical information … report anaerobic ... numerical modeling of system...
TRANSCRIPT

FINAL REPORT Anaerobic Biostimulation for the In Situ Precipitation and Long-Term
Sequestration of Metal Sulfides
SERDP Project ER-1373
APRIL 2009 Mary DeFlaun Jacquelyn Lanzon Michael Lodato Stephanie Henry Geosyntec Consultants Tullis E. Onstott Eric Chan Bamiedele Otemuyiwa Princeton University This document has been approved for public release.

Report Documentation Page Form ApprovedOMB No. 0704-0188
Public reporting burden for the collection of information is estimated to average 1 hour per response, including the time for reviewing instructions, searching existing data sources, gathering andmaintaining the data needed, and completing and reviewing the collection of information. Send comments regarding this burden estimate or any other aspect of this collection of information,including suggestions for reducing this burden, to Washington Headquarters Services, Directorate for Information Operations and Reports, 1215 Jefferson Davis Highway, Suite 1204, ArlingtonVA 22202-4302. Respondents should be aware that notwithstanding any other provision of law, no person shall be subject to a penalty for failing to comply with a collection of information if itdoes not display a currently valid OMB control number.
1. REPORT DATE APR 2009
2. REPORT TYPE N/A
3. DATES COVERED -
4. TITLE AND SUBTITLE Anaerobic Biostimulation for the In Situ Precipitation and Long-TermSequestration of Metal Sulfides
5a. CONTRACT NUMBER
5b. GRANT NUMBER
5c. PROGRAM ELEMENT NUMBER
6. AUTHOR(S) 5d. PROJECT NUMBER
5e. TASK NUMBER
5f. WORK UNIT NUMBER
7. PERFORMING ORGANIZATION NAME(S) AND ADDRESS(ES) Geosyntec Consultants
8. PERFORMING ORGANIZATIONREPORT NUMBER
9. SPONSORING/MONITORING AGENCY NAME(S) AND ADDRESS(ES) 10. SPONSOR/MONITOR’S ACRONYM(S)
11. SPONSOR/MONITOR’S REPORT NUMBER(S)
12. DISTRIBUTION/AVAILABILITY STATEMENT Approved for public release, distribution unlimited
13. SUPPLEMENTARY NOTES The original document contains color images.
14. ABSTRACT
15. SUBJECT TERMS
16. SECURITY CLASSIFICATION OF: 17. LIMITATION OF ABSTRACT
UU
18. NUMBEROF PAGES
175
19a. NAME OFRESPONSIBLE PERSON
a. REPORT unclassified
b. ABSTRACT unclassified
c. THIS PAGE unclassified
Standard Form 298 (Rev. 8-98) Prescribed by ANSI Std Z39-18

ER-1373-FR_PMa_Final i 9/10/09
TABLE OF CONTENTS
1. ACKNOWLEDGEMENTS .................................................................................. 1
2. EXECUTIVE SUMMARY .................................................................................. 2
3. OBJECTIVE ......................................................................................................... 5
4. BACKGROUND .................................................................................................. 7
5. MATERIALS AND METHODS.......................................................................... 9 5.1 Task 1: Site Selection and Collection of Aquifer Materials ........................ 9 5.2 Task 2: Construct and Operate Lab-Scale Column Experiments .............. 10 5.3 Task 3: Solids Characterization and As-Sulfide Stability ......................... 12 5.4 Task 4: Numerical Modeling of System Performance .............................. 15 5.5 Task 6: Field-Scale Pilot Study ................................................................. 16
6. RESULTS AND ACCOMPLISHMENTS ......................................................... 22 6.1 Task 1: Site Selection and Collection of Aquifer Materials. ..................... 22 6.2 Task 2: Construct and Operate Lab-Scale Column Experiments. ............. 22 6.3 Task 3: Solids Characterization and As-Sulfide Stability ......................... 24 6.4 Task 4: Numerical Modeling ..................................................................... 27 6.5 Task 5: Column Study Report ................................................................... 28 6.6 Task 6: Field Pilot ..................................................................................... 29
7. CONCLUSIONS ................................................................................................ 34
8. REFERENCES ................................................................................................... 36

ER-1373-FR_PMa_Final ii 9/10/09
LIST OF TABLES
Table 1: Field Parameters for Avon Park Well No. 43103-MW
Table 2: Geochemical Results of Well No. 43103-MW
Table 3: Sequential Extracts of Original Sediment and Sediment from Column #1
Table 4: Sequential Extracts of Column #1 Sediment Before and During Exposure to Aerobic Leaching Water
Table 5: Model Parameters
Table 6: Field Pilot Analytical Results
Table 7: Sequential Extracts of Sediment from MW-2
LIST OF FIGURES
Figure 1: Initial Groundwater Quality at Avon Park Air Force Range
Figure 2: Schematic of Column Setup
Figure 3: Pilot Test Layout
Figure 4: Arsenic Species Eh vs. pH Diagrams
Figure 5: Column Study Analytical Results
Figure 6: Phosphor Images of Column Sediment
Figure 7: SEM Images of Coatings
Figure 8: SEM Images of Mineral
Figure 9: First-derivative As XANES spectra of column #1 and column #2 sediments
Figure 10: Results of Direct Dissolution Experiment
Figure 11: Column Cross-Section Speciation
Figure 12: Groundwater Reductive Potential During Field Pilot Study
Figure 13: Arsenic Concentration During Field Pilot Test
Figure 14: Sulfate/Sulfide and Total Iron Concentration During Field Pilot Test
Figure 15: Sodium Concentration During Field Pilot Test
Figure 16: Sequential Extraction of in situ sand bags

ER-1373-FR_PMa_Final iii 9/10/09
LIST OF APPENDICES
Appendix A: Supporting Data
Appendix A-1: Photo Log for Column and Field Pilot Studies
Appendix A-2: Pilot Test Well Construction Logs
Appendix A-3: Tracer Test Supporting Information
Appendix A-4: Material Safety Data Sheets for Groundwater
Amendments
Appendix A-5: Column Study Analytical Results
Appendix A-6: Slug Test Supporting Information
Appendix A-7: Sequential Extracts of Sediment from Field Pilot Study
Appendix B: List of Technical Publications
Appendix C: Other Technical Material
Appendix C-1: Field Sampling Procedures for the Anaerobic Collection of Groundwater and Saturated Zone Soil
Appendix C-2: Field Sampling Procedures for the Collection of Groundwater for Pilot Study Analysis

ER-1373-FR_PMa_Final iv 9/10/09
LIST OF ACRONYMS
As Arsenic
AsO43- Arsenate
AsOS23- Dithioarsenite
AsS Realgar
As2S3 Orpiment
Br Bromide
Dx Latitudinal dispersivity
Dy Longitudinal dispersivity
DI Deionized
DO Dissolved Oxygen
DoD Department of Defense
Fe Iron
FeAsS Arsenopyrite
FeS2 Pyrite
FDEP Florida Department of Environmental Protection
g/L Grams per liter
gpm Gallon per minute
HCl Hydrochloric Acid
H2AsO3S- Thioarsenate

ER-1373-FR_PMa_Final v 9/10/09
KBr Potassium Bromide
kg Kilogram
L Liter
MSDS Material Safety Data Sheet
µm Micrometer
NaBr Sodium Bromide
NaOH Sodium Hydroxide
(NH4)2PO4 Diammonium Phosphate
ORP Oxidation-Reduction Potential
PI Principal Investigator
PTWP Pilot Test Work Plan
PVC Polyvinyl Chloride
ppb Parts per billion
S0 Sulfur
S-2 Free Sulfide
S2O32- Thiosulfate
SERDP Strategic Environmental Research and Development Program
TDS Total Dissolved Solids
TOC Total Organic Carbon
UIC Underground Injection Control

ER-1373-FR_PMa_Final 1 9/10/09
1. ACKNOWLEDGEMENTS
This research was supported wholly by the U.S. Department of Defense (DoD), through the Strategic Environmental Research and Development Program (SERDP).
The laboratory bench study was performed at Princeton University by T. C. Onstott, Eric Chan, and Bamiedele Otemuyiwa with field sampling performed by Mike Lodato and staff from Geosyntec’s Tampa, Florida office. Management and support was provided by the Principal Investigator (PI), Mary DeFlaun, Ph.D.
Field support for the pilot study was provided by staff from Geosyntec’s Tampa, Florida office (Joseph Terry, Stephanie Henry, Mike Lodato), Geosyntec’s Boston, Massachusetts office (Carl Elder), and Geosyntec’s Princeton, New Jersey office (Jackie Lanzon, Mary DeFlaun). Laboratory analyses of pilot study samples were performed by Eric Chan and Bamidele Otemuyiwa under the oversight of T. C. Onstott at Princeton University. Additional laboratory support was provided by Accutest Laboratories of Tampa, Florida. Site access and logistical issues were coordinated through Mike Stevens, Roger Grebing, and Steve Galloway of the Avon Park Air Force Range. Additional assistance with waste staging/classification and sampling support was provided by Innovative Technical Solutions, Incorporated’s (ITSI) Merritt Island, Florida office (Ralph Archangeli, John England).

ER-1373-FR_PMa_Final 2 9/10/09
2. EXECUTIVE SUMMARY
The precipitation of dissolved metals in groundwater under anaerobic conditions has been the subject of numerous studies, but there has been very limited research on the mineralogy and the stability of these precipitates under variable geochemical conditions. Examining the mineralogy and establishing the rate of dissolution of precipitates under aerobic conditions is the subject of this SERDP supported research. A field research site was established at Site No. ST-65, a former refueling area at the Avon Park Air Force Range in Florida. Site ST-65 had high concentrations of arsenic (As) in shallow groundwater within a sandy, naturally anaerobic aquifer. Sediment and groundwater were collected from the area with the highest concentration of As in groundwater (1800 parts per billion [ppb]) and were used to construct four flow-through columns for a bench-scale laboratory study conducted at Princeton University. In these experiments, indigenous sulfate reducing bacteria were stimulated with injections of sodium lactate, ethanol, ferrous iron and sulfate over a period of several months under strictly anaerobic conditions. Analysis of the sediments from one column indicated the presence of As-bearing sulfides, including arsenopyrite and realgar, at ten times the concentration of the natural sediments. Aerobic water was then passed through one of these columns for 115 days. Analyses of the dissolved As concentrations over this time when compared to the total As in the analyzed sediments suggested that only 2% of the sequestered As was dissolved after 116 pore volumes of aerobic groundwater had passed through the column. Analyses of the As concentration of sediments in 15 mL column experiments leached by the same water over the same time period, which was equivalent to 11,600 pore volumes, yielded an As loss rate which agreed within error with the results of the larger column experiment. A scale-up of the column study model using the measured ground water flow velocity indicates that 98% of As would be retained in the solid phase after sixteen years of fully oxygenated conditions in the groundwater, and that the dissolved As concentration would average ~1 μM (75 ppb) at the source. The results of the modeling indicates that the key to successful sequestration ofAs under anaerobic, sulfate-reducing conditions is the co-precipitation of FeS which consumes O2 during oxidation, thus reducing the O2 available to dissolve arsenopyrite, and produces Fe3+ hydroxides, which act to adsorb dissolved As, and the co-precipitated Fe and Ca phosphate, which may act to further shield As sulfides from oxidation and may incorporate As into their crystal structure. For many subsurface environments the groundwater is naturally anaerobic and sulfidic, and for these environments the sequestration of As would be an effective and permanent solution.

ER-1373-FR_PMa_Final 3 9/10/09
For aquifers that are naturally aerobic or where the anaerobic conditions are temporary due to a high organic load, the transition to fully aerobic conditions would be gradual and would not be expected to cause a significant release of As.
Success of the column study led to the implementation of a small-scale field pilot demonstration for this technology at ST-65 in January 2008. The field pilot was a scaled up version of the column study which was performed in situ at ST-65 over a 30 ft by 30 ft target zone in the area of highest As concentrations. Four monitoring wells, one injection well, and one recovery well were installed in January 2008. Measurements of background geochemical parameters in Site groundwater indicated that groundwater is naturally reducing. A slug test and tracer test were performed to assess aquifer characteristics to aid in recirculation system design. Upon evaluation of these parameters, a recirculation system was constructed to induce groundwater flow and provide amendments to stimulate indigenous sulfate reducing bacteria.
Injections of sodium lactate, ferrous sulfate, diammonium phosphate, and ethanol began in April 2008. Subsequent measurements performed over the course of the study period indicated that a gradual shift towards more reducing conditions occurred after initiation of amendment injections. Adjustments to the amendment mixture resulted in further reduction of site geochemical parameters to within the sulfate-reducing range. The final amendment mixture consisted of sodium lactate, sodium sulfate, and diammonium phosphate.
Results from groundwater sampling and analyses indicated that As concentration decreased by up to two orders of magnitude to ~0.01 μM (1.4 ppb) between March and September 2008. The concentrations were two orders of magnitude lower than attained in the laboratory column experiments. The effectiveness of the amendment injection in altering the groundwater geochemistry is also clearly represented by a reduction in total iron, total sulfate, and total sulfide concentrations observed over the study period. Between March and September 2008, total iron, total sulfate, and total sulfide concentrations decreased by up to 85%, 94%, and 91%, respectively, reflecting a significant decrease in reduction potential and subsequent precipitation of iron with sulfide. In addition, sodium concentrations increased significantly, indicating successful distribution of sodium lactate and sodium sulfate, two of the amendments that were injected at the Site. Sequential extraction analyses of sediment pouches, which had been deployed in each monitoring well at the outset of the field study, during the course of the experiment confirmed increasing concentrations of solid phase As as associated with higher Fe, S and P concentrations. At the end of the experiment the

ER-1373-FR_PMa_Final 4 9/10/09
total As concentration in the sediment was up to three times that of the original sediment These results are in agreement with the outcome of the column study and demonstrate a proof-of-concept of this anaerobic biostimulation technology under field conditions.

ER-1373-FR_PMa_Final 5 9/10/09
3. OBJECTIVE
Recent studies have shown that As-sulfide precipitates can be formed under the appropriate conditions by in situ biostimulation of sulfate-reducing bacteria using ethanol and/or lactate as electron donors (White and Gadd, 1996; Waybrant et al., 1998; Saunders et al., 2001). Although the precipitation of these metals under anaerobic conditions has been the subject of numerous studies, there has been very limited research on the mineralogy and the stability of these precipitates under variably suboxic to oxic geochemical conditions. Evangelou (1995) proposed that the rate of pyrite oxidation under oxic conditions could be reduced by coating the pyrite with Fe phosphates, but this approach had not been applied microbially precipitated Fe and As sulfides. Examining the mineralogy, testing the procedure of Evangelou (1995) on, and establishing the rate of dissolution of these precipitates under aerobic conditions was the subject of this SERDP supported research. If the stability of these As sulfide precipitates in the lab indicated that they would be stable in the field over decadal time scales, then this technology was considered viable for development of a remedial strategy. In this case, the additional goal of this research was to develop of an anaerobic biostimulation technology for the precipitation of As from groundwater as a stable metal sulfide precipitate.
To achieve this goal, the study was carried out in several tasks and subtasks, as follows:
• Task 1: Site Selection and Collection of Aquifer Materials.
• Task 2: Construct and Operate Lab-Scale Column Experiments.
o Task 2.1: Construct columns
o Task 2.2: Establish column hydraulics
o Task 2.3: Stimulate microbial sulfate reduction
o Task 2.4: Test various As removal formulas
o Task 2.5: Adding 35S Tracer to identify As-S Precipitates
• Task 3: Solids Characterization and As-Sulfide Stability
o Task 3.1: Mineralogical and Chemical Characterization of As Precipitates
o Task 3.2: Apply Fe-phosphate Coating Technology

ER-1373-FR_PMa_Final 6 9/10/09
o Task 3.3: Direct Aerobic Leaching Experiment of Coated and Uncoated Sediment in Columns and in mini-syringe columns
o Task 3.4: Post-Leaching Sediment Characterization
• Task 4: Thermodynamic and Reactive Transport and Kinetic Redox Reaction Modeling
• Task 5: Column Study Report
• Task 6: Field Pilot
o Task 6.1: Installation and Instrumentation of the Field Pilot
o Task 6.2: Baseline Characterization
o Task 6.3: Biostimulation and Performance Monitoring
Each of these tasks and subtasks have been successfully completed, the results of which are discussed in Section 6 of this report.

ER-1373-FR_PMa_Final 7 9/10/09
4. BACKGROUND
A report by the U.S. Army Corps of Engineers (Williford et al., 2002) cites 7,300 sites at 1,800 Department of Defense (DoD) installations with dissolved heavy metals contamination in groundwater. Given this level of groundwater contamination, development of new, cost-effective technologies for heavy metal remediation is critically needed. The five most frequently cited metals in the Williford report were arsenic, lead, cadmium, chromium and mercury. Of these, arsenic, lead, cadmium and mercury have been shown to precipitate as stable metal sulfides under highly reducing conditions.
The recently lowered drinking water standard for As (from 50 to 10 ppb in January 2001) has added significantly to the costs of remediating this particular dissolved metal contaminant. As consumable groundwater becomes an increasingly scarce resource, the cost of conventional treatment to meet water standards will increase dramatically. In addition to arsenic, this technology may be applicable to several metals of concern at DoD and private industry sites (e.g. cadmium and lead).
The most common method of remediating soluble metals is pump-and-treat, which can take decades to remove contamination because of subsurface heterogeneities and adsorption of metal species to the aquifer solids. The long time frame for pump-and-treat and the cost for off-site disposal of metals extracted from the groundwater make this a very expensive remedial option.
This research investigated an in situ strategy for precipitating As (and potentially other heavy metals) as stable metal sulfides and testing the long-term sequestration of these metals under changing geochemical conditions. Unlike organic contaminants, heavy metals cannot be destroyed. Existing groundwater and soil remediation technologies generally focus on in situ immobilization, in situ transformation to a less toxic form, or extraction and ex situ treatment. The appropriate application of any remediation technology for a heavy metal or radionuclide depends on a thorough understanding of the behavior of that metal, particularly its speciation and mobility in different environments. In anaerobic environments the mobility of heavy metals can be directly influenced by bacterial sulfate reduction, a process that is ubiquitous when sulfate and carbon substrates are available. Recent studies have shown that As-sulfide precipitates, e.g. orpiment or realgar (O’Day et al. 2004) and arsenopyrite (Saunders et al. 2008), can be formed under the appropriate conditions by in situ biostimulation using ethanol

ER-1373-FR_PMa_Final 8 9/10/09
and/or lactate as electron donors. However, there has been very limited research on the mineralogy and the stability of these precipitates under variable geochemical conditions. A study by Thomson et al. (2001) suggested that these precipitates are relatively stable at low pH and under oxidizing conditions. In situ redox conditions suitable for enhancing metals precipitation and stabilization can be promoted through several means, including stimulation of the anaerobic microbial community through the addition of inexpensive carbon-based electron donors (a relatively common process in site remediation). However, questions remain regarding the stability of the ensuing metal-sulfide complexes. The research conducted for this project tested the efficacy of the technology in treating dissolved metals in groundwater and addressed the issue of stability of these precipitates. The focus was on As as opposed to other candidate heavy metals for two reasons: 1) the USEPA lowered the standard for As in groundwater from 50 to 10 ppb in 2001, which has raised the level of concern about appropriate technologies to treat dissolved As; and 2) As is one of the most common groundwater contaminants at DoD sites.
The technical objectives of this project were to:
1. Demonstrate the ability to promote microbial activity to form stable As-sulfide minerals from sulfate and dissolved As in aquifer materials.
2. Characterize the As-sulfide minerals formed during precipitation.
3. Assess the stability of As-sulfide minerals and the potential for As re-mobilization following treatment to determine operating parameters and constraints for full-scale technology deployment for controlling As migration in groundwater.
4. Test an additional stabilization step of Evangelou (1995) for promoting long-term sequestration of As under oxidizing conditions.
5. Demonstrate this technology for anaerobic in situ precipitation and sequestration of As in groundwater in a small-scale, proof-of-concept field pilot demonstration.

ER-1373-FR_PMa_Final 9 9/10/09
5. MATERIALS AND METHODS
The six tasks defined for this study may be grouped into two main categories: Tasks 1 through 5 were performed as part of the bench-scale laboratory study, and Task 6 was the field-scale pilot study. Task 5, Column Study Report, encompasses reporting of Tasks 1 through 4 and as such is not separately discussed in this section.
Laboratory analyses of samples from both the column and pilot study were performed mainly by Princeton University using the analytical methods described in Section 5.2. Confirmatory analyses were performed by Accutest Laboratories of Tampa, Florida for As using Method SW-846 6010B.
5.1 Task 1: Site Selection and Collection of Aquifer Materials
Site Selection
More than twenty sites were reviewed in the process of site selection. Several criteria were considered, including but not limited to:
• As concentrations;
• Depth of contamination;
• Complexity of hydrogeology; and
• Size of As plume.
Collection of Aquifer Materials
All groundwater and sediment samples collected for use in bench-scale testing were collected according to standard field sampling methods as detailed in the Field Sampling Plan (Appendix C-1). Samples were collected adjacent to well 43103-MW as shown on Figure 1. Ten kilograms (kg) of site sediments were collected with a direct push rig equipped with a Dual Wall Split Spoon Sampler. Discrete samples, 2 ft in length, were collected in clear poly-vinyl chloride (PVC) liners, and the liners were subsequently capped and stored on ice for immediate shipping. Forty liters (L) of groundwater were collected in 4 L cubitainers. The cores were sealed along with the groundwater and were shipped in coolers to Princeton University where they were transferred to an anaerobic glove bag.

ER-1373-FR_PMa_Final 10 9/10/09
5.2 Task 2: Construct and Operate Lab-Scale Column Experiments
Task 2.1: Construct Columns
Four columns were constructed from opaque, ¼” thick PVC, 5” in diameter and 50 cm long. Six sampling ports were constructed along the side of each column (see Appendix A-1 for photographs, Figure 2 for setup schematic). Opaque materials were used in all components to inhibit photo-oxidation of As species. The columns were sterilized with bleach and rinsed with filtered deionized (DI) water and then placed in an anaerobic glove bag filled with 10% H2/90% N2 gas mixture. In the glove bag the columns were packed with sediment removed from the core liners shipped from the Avon Park site. The columns were capped using Nylon mesh and screw on PVC end caps and then connected by tubing to the groundwater reservoir.
When injections were performed, the columns were disconnected from the return groundwater reservoir and connected to a fraction collector (Spectra-Chrom CF-1) setup by fitting the outlet tubes on top of the columns to the fraction collector’s drip nozzles. Samples for cation and anion analyses were taken daily while pH, Eh and conductivity readings were taken every 48 hours. Additional samples were collected from the side ports by slowly pulling 3 mL of water through 0.22 µm syringe filters using 5 mL syringes. A total of 3 mL per side port were collected per day, which is equivalent to approximately 1.5% of the total pore volume of the column.
Task 2.2: Establish Column Hydraulics
A peristaltic pump (Masterflex) pushed natural groundwater from one 4L cubitainer (groundwater reservoir) upwards through all four columns simultaneously and back into a second 4L cubitainer which was connected to the first. The first 4 L cubitainer, which was used to mix amendments into the natural groundwater, was continuously stirred by a magnetic stirrer. All amendments were first sparged with nitrogen gas and subsequently degassed in the glove bag 24 hours prior to use. The groundwater was circulated through the columns for 24 hours during which trapped gases were removed from the columns by pulling water from the side ports. Additional sediment was added to the top of the columns after the sediment had settled. The natural groundwater was then circulated through each column at a flow rate of 4 to 8 mL hr-1 for one month by which time the pH, ORP and conductivity values matched those observed in the field (Table 1).

ER-1373-FR_PMa_Final 11 9/10/09
Task 2.3: Column Metals Removal Testing
Analytical Procedures
Anion analyses were performed on an ICMS (Dionex 320 with AS15 IONPAC 2mm Column AG15 IONPAC Guard Column 10-60 mM KOH and ThermoFinigan Electrospray Quadrupole mass spectrometer). The anion detection limits and calibration procedures are the same as those reported by Onstott et al. (2006). The detection limit of AsO4
3- by IC ECD analyses was 0.1 µM. Thioarsenic compounds were synthesized following the procedures of Schwedt and Rieckhoff (1996) and utilized to calibrate the ICMS.
Cation analyses were performed on an ICP AES (Perkin Elmer). For analyses of the sequential extracts the Fe, Mn, S and As standards were prepared using the same reagents as used in the extraction step. The cation detection limits and calibration procedures are the same as those reported by Onstott et al. (2006). The detection limit for As by ICP analyses was 0.5 µM. Sulfide samples were quantified by UV spectroscopy following the method of Cord-Ruwisch (1985). Ethanol concentrations were determined by measurement of the absorbance at 340 nm for 10 minutes with a UV spectrophotometer. The detection limit for ethanol with this assay was 0.17 mM.
Injection Procedure
Five injections were performed over an interval of 4 months. The ingredients for the amendments were degassed and stored in the anaerobic glove bag. They were combined in a 15 mL centrifuge tube prior to pouring it into the 4L cubitainer reservoir. The goal of the injections was the promotion of sulfate reduction and As precipitation, and they were carried out as follows:
Injection 1: Na-Sulfate, ethanol, lactate and diammonium phosphate [(NH-
4)2PO4] were added to the 8 liter reservoirs and the pH adjusted to 7 with
hydrochloric acid (HCl) or sodium hydroxide (NaOH). Sodium bromide (NaBr) was added as a conservative tracer. This first injection was monitored for 2 weeks with the eluent collected by a fraction collector. The conductivity was recorded in order to observe the rate at which the amended solution was moving through the columns and the bromide was measured in the eluent samples to determine the porosity of the columns at a flow rate of ~10 ml min-1.

ER-1373-FR_PMa_Final 12 9/10/09
Injection 2: Starting with fresh GW, Na-Sulfate, ethanol, lactate, and (NH4)2PO4
were added to the 8 liter reservoir and the pH adjusted to 7 with HCl or NaOH. NaBr was added as a conservative tracer. This was monitored for 2 weeks.
Injection 3: Starting with fresh GW, Na-Sulfate , ethanol, lactate, (NH4)2PO4 and Arsenate were added to the 8 liter reservoir and the pH adjusted to 7 with HCl or NaOH. Arsenate was added to increase As concentrations in a controlled manner in order to meet method detection limits for analysis of column sediment and effluent. NaBr was added as a conservative tracer. This was monitored for 2 weeks. FeCl2
was also added to the reservoir until the sulfide was greatly diminished.
Injection 4: Starting with fresh GW, Na-Sulfate, ethanol, lactate , (NH4)2PO4, FeCl2 and Arsenate were added to the 8 liter reservoir and the pH adjusted to 7 with HCl or NaOH. The system was monitored for 3 weeks during which time additional FeCl2
was added.
Injection 5: Starting with fresh GW, Na-Sulfate , ethanol, lactate, (NH4)2PO4 ,
FeCl2 and Arsenate were added to the 8 liter reservoir and the pH adjusted to 7 with HCl or NaOH. In addition, a radioactive tracer, 35SO4 was added to each column from the side ports to identify the location within each column of high concentrations of sulfide precipitation using phosphor imaging (subtask 2.4).
5.3 Task 3: Solids Characterization and As-Sulfide Stability
Task 3.1: Mineralogical and Chemical Characterization of As Precipitates
The final injection was monitored until lactate and sulfate had diminished, after which all of the columns were disconnected from the peristaltic pump and the pore water drained prior to closing the valves at the inlet and outlet ends. One column, column #1, was removed from the glove bag, stored at -20oC until frozen, and then split along its axis. Epoxy was added to one half of the column and polished thin sections were prepared. Samples from the other half of the column were mounted on SEM stubs with double sided tape. The thin sections and the SEM stubs were exposed to a phosphor image screen (Molecular Dynamics Tritium Storage Phosphor Screen) and the distribution of the 35S was mapped using a Molecular Dynamics Storm 860 phosphor imager. The thin sections and SEM stubs were examined using a Phillips XL30 FEG SEM with EDS utilizing the phosphor images to locate the 35S bearing sulfide minerals

ER-1373-FR_PMa_Final 13 9/10/09
produced by microbial SO42- reduction. The sediments in the areas identified by the phosphor images were used to determine the mineralogy of the precipitates and to determine whether the Aswas concentrated at sulfide rich sites. These sediments were also used to pack six 5 mL syringes to be utilized in the aerobic leaching phase of the experiment (subtask 3.2). Six 7 to 10 gram samples from the other half of column #1 were collected along the column axis for sequential extractions to determine the distribution of Fe, Mn, S and As in the column as described in the following section.
Sequential Extraction Procedure
1. Sequential extractions were performed on the sediment samples from column #1 and on the original sediment in accordance with the procedure of LaForce et al. (La Force et al., 1999). The sequential extraction procedure was performed as follows: Adsorbed species - Samples were placed in 50 mL centrifuge tubes and 50 mL of 1 M MgSO4 was added, shaken for 1 hour, centrifuged, the supernatant filtered and stored at 4°C. The residual solid was washed with 50 mL of DI water and the rinse water filtered and stored at 4°C. The residual solid was dried, weighed and saved for the next step of the extraction procedure.
1. Organic species - Sediment was placed in 100 mL serum vials and 50 mL of 6% NaOCl was added and then capped. These samples were heated for 1 hour at 95+5°C in a water bath while N2 gas was purging the serum vials. Solids were then transferred to 50 mL centrifuge tubes, centrifuged, rinsed, dried, weighed and saved. The leachate was filtered and stored as in the first extraction step. NaOCl extraction was done twice and the extracts combined before moving onto the next step.
2. Carbonate species – Fifty mL of 1 M Na-acetate/acetic acid at pH 5 was added to the solids in their 50 mL centrifuge tubes and shaken for 3 hours. Solids were then centrifuged, rinsed, dried, weighed and saved and the leachate filtered and stored as in the first extraction step.
3. Amorphous Fe oxide phase - Fifty mL of 0.2 M ammonium oxalate was added to the solids in their 50 mL centrifuge tubes wrapped in Al foil and shaken in the dark for 4 hours. Solids were then centrifuged, rinsed, dried, weighed and saved and the leachate filtered and stored as in the first extraction step.
4. Crystallized Fe oxide phase - Fifty mL of 1M hydroxylamine/HCl solution in 25% v/v acetic acid was added to the solids in 100 mL serum vials, sealed and heated for 6 hours at 95+ 5°C. Solids were then transferred to 50 mL centrifuge tubes, centrifuged, rinsed, dried, weighed and saved and the leachate filtered and stored as in the first extraction step.

ER-1373-FR_PMa_Final 14 9/10/09
5. Sulfide phase - Fifty mL of aqua regia (3-1-2 v/v solution of HCL-HNO3-H2O) was added to the solids in 100 mL serum vials and heated for 1 hour at 95+5°C. Solids were then centrifuged, rinsed and saved and the leachate filtered and stored as in the first extraction step. The leachate was diluted 1:10 with DI H2O prior to analyses.
Steps 1 through 5 were performed anaerobically. Sequential extractions were performed on duplicate samples and the analyses averaged. All leachates were analyzed by ICP. Fe, Mn, S and As standards were prepared for each extraction step using the same reagents used in the extraction step.
Six 5 mL syringe samples were analyzed during the course of the aerobic leaching experiment (subtask 3.2). The total As was measured first in the sediments from the syringes, followed by sequential extraction analyses, which were performed aerobically during the leaching experiment. The procedure was modified to follow that of Keon et al. (2001), whereby MgCl2 was substituted for the first reagent, MgSO4, in order to enable the determination of the SO4
2- concentrations in the extractions. The high As concentrations associated with the ammonium oxalate and hydroxylamine/HCl extractions in column #1 (see Section 6.3) may have reflected oxides formed during oxidation of fine-grained sulfides during the NaOCl step. For this reason the NaOCl step was excluded from the sequential extraction analyses of the syringe samples.
Task 3.2: Aerobic LeachingExperiment
Column #2 was removed from the anaerobic glove bag and along with the H2O2/K2HPO4 treated column #3 (see subtask 3.3) was connected to the reservoir of natural groundwater. The groundwater reservoir was equilibrated with the atmosphere by stirring for 24 hours prior to beginning the experiment. Dissolved O2 measurements taken with a Chemetrics CHEMet colorimetric kit confirmed that the water was air saturated. Two sets of six 5 mL syringes, one set from the untreated column #1 and one set from the H2O2/K2HPO2 treated column #4, were also connected with drip tubes to the same reservoir using the same peristaltic pump. The aerobic water was pumped through the columns at a rate of 8 mL hr-1 for the first 4,560 minutes. Aerobic groundwater passed simultaneously through the twelve 5 mL syringes at a rate of 4 mL hr-1, which, given the smaller pore volumes of the 5 mL syringes, is equivalent to ~100 times the flow rate of the columns.
Leaching of column #3 5 mL syringes was discontinued at 4,560 minutes because As concentrations in the eluent were much higher than those of column #2, clearly

ER-1373-FR_PMa_Final 15 9/10/09
indicating that the H2O2/K2HPO2 treatment had no beneficial effect. The flow rate through column #2 was then increased to 10 mL hr-1 for the remainder of the experiment as this gave a more reliable flow rate, which is ~50 times the groundwater flow rate at the field site. After 8,640 minutes, the reservoir was switched to an artificial groundwater that did not contain any As in order to increase the sensitivity of determining the As release rate. After 83,400 minutes of aerobic leaching, the reservoir was switched to artificial groundwater with 10 mM K2HPO4 to determine if this would promote precipitation of strengite (FePO4:2H2O), and further reduce the As release rate. After 103,560 minutes of aerobic leaching, 10 mL of pH 6 to 7, 2.8 M Al(OH)3 colloidal solution was injected into the lower 5 side ports of column #2 to determine if this reduced the rate of As release by increasing the adsorbing hydroxide phase. Aerobic leaching of column #2 was stopped at 165,480 minutes.Artificial groundwater was fabricated using DI H2O with CaCO3, NaCl and CaSO4. The pH of the artificial water was adjusted to neutral (pH = 7-8) using concentrated HCl.
Task 3.3: As-Precipitate Stabilization Experiments
Columns #3 and #4 were removed from the glove bag and connected to a cubitainer (reservoir) containing natural groundwater which was circulated aerobically through the columns at 8 mL hr-1. The natural groundwater was then amended with KPO4 and H2O2 following the coating procedure of Evangelou (Evangelou, 1995) and the amended water circulated through columns #3 and #4 for 2 weeks. After the coating procedure was complete, column #4 was disconnected and sampled for geochemical parameters. Sediments from this column were also used to pack the six 5 mL syringes used in the direct dissolution experiment as described in the previous section. This coating procedure was expected to increase the stability of As precipitates during dissolution experiments.
5.4 Task 4: Numerical Modeling of System Performance
Reaction path models were calculated with the REACT program of the GEOCHEMIST’S WORKBENCH 7.02 STANDARD (Bethke, 2008) modeling package (Rockware Inc., Golden CO) with the Lawrence Livermore National Laboratory thermodynamic database (Delany and Lundeen, 1990) augmented with thermodynamic data for As species from Nordstrom and Archer (2003), for thioarsenite species from Wilkin et al. (2003), and for As(OH)3, AsO(OH)3, and Fe sulfoarsenide species from Perfetti et al. (2008). PHREEQC (Parkhurst and Appelo, 1999) was used

ER-1373-FR_PMa_Final 16 9/10/09
to model the sorption, transport and oxidation of As, S, PO4 and Fe aqueous and solid species within the columns during the aerobic leaching phase of the experiment and to predict behavior at the field scale flow rate. The sorption constants for As species reported by Dixit and Hering (2003) were used. Fe, S and As species were treated as uncoupled in the PHREEQC model and the measured ORP vlues of the groundwater or the column experiments were not used to constrain the relative abundance of these species.
5.5 Task 6: Field-Scale Pilot Study
The field pilot test was conducted in an approximately 30 foot by 30 foot area in the vicinity of former well 43103-MW, approximately 15 ft south of ST-65-MW23 and within the dissolved As plume (Figure 1).
Task 6.1: Installation and Instrumentation of the Field Pilot
An active recirculation system was used to control groundwater movement and deliver amendments to groundwater in the field test plot. The recirculation system consisted of one extraction well located at the downgradient end of the test plot and one injection well located approximately 30 feet upgradient of the extraction well (Figure 3). A network of four monitoring wells constructed using the hollow-stem auger drilling method were installed between the injection and extraction wells to monitor the pilot test. Two monitoring wells were evenly spaced 10 ft apart along the transect between the injection and extraction wells, and the other two monitoring wells were positioned in the center of the eastern and western treatment areas (Figure 3). The injection and extraction wells were constructed using 4-inch diameter PVC well casing. The screened interval of all monitoring wells corresponded to the targeted treatment zone, from just below the water table (about 2 to 3 feet below land surface [BLS]) to 15 ft BLS. The injection well was screened from 5-15 ft BLS in order to prevent surfacing of the amendments, and the extraction well was screened from 3-15 ft BLS. Well construction logs are provided in Appendix A-2.
A well vault was constructed around the extraction well (RW-1) to house the 1” Schedule 40 PVC intake line for easy access. The length of the intake line from the well vault to an equipment housing unit located atop the injection well (INJ-1) was buried approximately 2 feet BLS. A Flotec continuous duty centrifugal pump was

ER-1373-FR_PMa_Final 17 9/10/09
installed in the equipment housing unit to power the groundwater recirculation system. The pump was fitted with two valves to meter flow, one to choke the outlet down and the other to direct flow back to the pump if needed. A totalizing flow meter, twist-lock receptacles, and hour meters were installed for both the recirculation and metering pumps. Installation of additional safeguards included: (1) a general purpose GFI receptacle to prevent electric shock; (2) a float switch that would shut the system down if the water table rose to 1 foot BLS; (3) pressure gauges to monitor back pressure and pressure at the injection wellhead. System photographs are provided in Appendix A-1.
Task 6.2: Baseline Characterization
Preliminary testing including baseline sampling, slug tests, and a bromide tracer test was performed prior to initiation of the groundwater amendment injections. Sampling procedures for baseline and subsequent monitoring are described as part of subtask 6.3.
Slug Testing
The hydraulic conductivity of the aquifer unit identified at the Site was tested using a mechanical slug device. An In Situ LevelTroll® 700 data logger was used to record the well response during the slug test. Generally, 1 to 2 feet of vertical displacement was introduced to the well water to allow for sufficient recovery time to occur.
The water level data collected during the slug test was plotted and analyzed using the Hvorslev Method (1951), according to the following equation:
( )0
2
2lnLT
rLrK =
Where:
r (ft) = Radius of the well casing L (ft) = Length of the screened interval To (min) = Elapsed time from start of slug test K (ft/d) = Hydraulic Conductivity
Hydraulic conductivity was calculated twice at each well. The results were averaged to provide a Site-wide general value.

ER-1373-FR_PMa_Final 18 9/10/09
Bromide Tracer Test
A conservative tracer study was implemented in order to more accurately determine the extent of amendment dispersion and travel times through the aquifer to targeted downgradient areas.
Conductivity trolls were set in monitoring wells MW-2 and MW-3 as well as extraction well RW-1 for a period of approximately one month prior to injection of the potassium bromide (KBr) tracer. The trolls recorded water level and conductivity continuously at 5 minute intervals, providing data prior to and throughout the tracer test. The groundwater recirculation system was operated continuously for ten days prior to KBr injection.
A total mass of 1.5 kg of KBr was mixed with 4 L of water to form a concentrated stock solution of approximately 250 grams per liter (g/L) of bromide (Br). This stock solution was poured into the injection well to achieve an initial in situ concentration of approximately 170 g/L of Br. The injection of concentrated stock was achieved via a funnel connected to poly tubing set to a depth of approximately l1 feet below top of casing.
At MW-2, the well closest to the injection point, groundwater was sampled for laboratory bromide analysis at 2, 4, 7, 8, 9 and 24 hours after the injection. Wells MW-4 and RW-1 were sampled 24 hours after the injection.
Two weeks after the injection, the conductivity trolls were removed from the wells and downloaded.
Results of the tracer test were fit to a two-dimensional model to determine the values for longitudinal (Dy) and latitudinal (Dx) dispersion as follows:
( )( )( ) ( )
⎟⎟⎠
⎞⎜⎜⎝
⎛ −−
−−−=
tDyy
tDtvxx
DDtAC
tyxCyx
x
yx 44exp
4),,(
20
20
2/10
π
Where:
x
t
vxR
t =

ER-1373-FR_PMa_Final 19 9/10/09
And: C0 = Initial concentration = 250,000 mg/L A = Source surface area = area of well = π r2 = 0.342 ft2 = 0.03177 m2 x0 = Initial lateral distance from source = 0 m x = Lateral distance from source = 3.05 m for MW-2 y0 = Initial transverse distance from source = 0 m y = Transverse distance from source = 0 m for MW-2 vx = Velocity in x-direction = gradient = 2.003 m/d Rt = Retardation coefficient = 1
C(x,y,t) = Final concentration (direct measurement) t = Travel time (d) Values for Dx and Dy were then utilized to assess the effect of dispersion on amendment concentrations within the target treatment zone. These effects were considered and applied to stock solution calculations in the form of a factor of safety as described in Section 6.6. Additional details including graphs of data from the conductivity trolls, laboratory data packages, calculation sheets, etc. are provided in Appendix A-3. Task 6.3 Biostimulation and Performance Monitoring
Amendment Injection Strategy
Groundwater was pumped from the extraction well at approximately one gallon per minute (gpm) using an electric pump, was passed through 50 micrometer (µm) and 5 µm filters in series, and amended with metered injections of a concentrated stock prior to re-injection at INJ-1. Photographs of the system are provided in Appendix A-1.
Injections were performed continuously using two different amendment stock solutions over an interval of 4 months. The ingredients for the amendments were mixed with Site groundwater and stored in drums housed in secondary containment, open to the atmosphere within an equipment housing unit. The goal of the injections was the promotion of sulfate reduction and As precipitation, and they were carried out as follows:
Amendment Stock Solution 1: Sodium lactate, ethanol, ferrous sulfate, and diammonium phosphate were added to one 55-gallon stock drum, and one liter

ER-1373-FR_PMa_Final 20 9/10/09
of stock was injected daily. This injection was monitored via collection of geochemical parameters for approximately 4 weeks.
The frequency of injections was then increased to deliver eight liters of stock per day in order to further reduce the groundwater geochemistry. This strategy was implemented for one day prior to equipment failure. Interim daily injections of two liters of pure sodium lactate were conducted for approximately 4 weeks during system repair activities.
Amendment Stock Solution 2: The oxidation of the Fe2+ to Fe3+ lead to the precipitation of Fe3+ phosphates and sulfates which clogged the injection system. These components were subsequently separated into two stock solution and injected separately and out of phase with each other. Sodium lactate and sodium sulfate were added to stock drum #1, and (NH4)2PO4
was added to stock drum #2. Fourteen liters of stock #1 and approximately 3.6 liters of stock #2 were injected daily. This injection was monitored via collection of geochemical and laboratory parameters for approximately 2 months.
The addition of electron donor (lactate and ethanol) to the aquifer was expected to facilitate biological sulfate reduction. The addition of sodium sulfate was expected to provide a source of sulfate in groundwater. The diammonium phosphate was added as a nutrient to enhance microbial activity, biological sulfate reduction, and the production of sulfide. The laboratory experiments had already shown that the amendment also produced fine-grained phosphate minerals associated with the sulfides. Material Safety Data Sheets (MSDS) for each of the amendments are provided in Appendix A-4.
The system pumped water between the extraction and injection wells continuously to establish a consistent flow path and distribute amendments within the field plot. Groundwater was amended only periodically to reduce the potential for biofouling at the injection well. Dispersion diluted the amendment pulses to their target groundwater concentrations.
Groundwater Performance Monitoring
The performance of the pilot test system was monitored for a period of five months following startup of the recirculation system, or four months following initiation of the amendment injections. Groundwater samples were collected using the low flow method

ER-1373-FR_PMa_Final 21 9/10/09
for analysis of field parameters, total and dissolved metal(s) of concern including iron and arsenic, sulfate and sulfide, dissolved methane and carbon dioxide, electron donor concentrations, volatile fatty acids (as a measure of fermentation products of the electron donors), chloride, total dissolved solids (TDS), total organic carbon (TOC), petroleum hydrocarbons, and cations (i.e. calcium, magnesium, and sodium). Samples were collected and preserved according to procedures adapted from those utilized during the laboratory study. Field sampling procedures are provided as Appendix C-2. Samples were analyzed by Princeton University according to the methods described in Section 5.2.

ER-1373-FR_PMa_Final 22 9/10/09
6. RESULTS AND ACCOMPLISHMENTS
6.1 Task 1: Site Selection and Collection of Aquifer Materials.
A field research site was successfully established at Site No. ST-65, a former refueling area at the Avon Park Air Force Range in Florida. The anaerobic geochemistry, straightforward hydrogeology, and elevated concentrations of As at this site led to its selection for detailed study. Since Site sediments and groundwater are equilibrated with a reducing environment, an induced switch to aerobic conditions in the column study would represent the worst-case scenario for As re-mobilization.
Concentrations of As in the groundwater in this area were as high as 1800 ppb at the time of sample collection in July 2005 (Table 2). A vertical profile of field-measured parameters (DO, ORP, temperature, pH, specific conductance) was performed in the well with the highest groundwater concentrations of As (43103-MW-see Figure 1). Results of this profiling indicated anaerobic conditions from 2 to 12 ft bgs with a pH of approximately 6.5 (Table 1). Site sediments and groundwater were collected and packaged to exclude oxygen and transferred to an anaerobic chamber at Princeton University where they were further characterized.
The groundwater at Well No. 43103-MW was low in salinity, contained low sulfate, moderately high sulfide and was As rich with a distinctive yellowish tinge (Tables 1 and 2). According to the measured pH and Eh, the principal As species should be arsenate (Figure 4). However, the greater concentration of dissolved total As versus arsenate suggests that a significant portion of the dissolved As was another species, perhaps thioarsenate (Stauder et al., 2005). The sediment is comprised of fine-grained quartz sands with minor feldspar and ilmenite. Sequential extraction analyses of the sediment indicated that of the total As, 143 µmol kg-1 (Table 3), 28% was trapped in carbonate or perhaps phosphate, 25% occurred as sulfides, 22% occurred in organic matter or perhaps fine-grained sulfide, 16% was incorporated in oxides and amorphous hydroxides. Approximately 2% of the Fe and 8% of the As was present as adsorbed species.
6.2 Task 2: Construct and Operate Lab-Scale Column Experiments.
Tasks 2.1 and 2.2: Construct columns and Establish Column Hydraulics

ER-1373-FR_PMa_Final 23 9/10/09
Four flow-through columns were successfully constructed as described in Section 5.2 to examine both the stability and the mineralogy of the As precipitates, as well as additional processes that assist in precipitate stabilization (see photographs in Appendix A-1). Stable geochemical conditions similar to those measured at the Site were achieved prior to initiation of amendment injections.
Tasks 2.3 and 2.4: Column Metals Removal Testing and Adding Radioactive Tracer for As-S Precipitation
Lactate, ethanol, phosphate, and sulfate were added to the groundwater flowing through the columns for a period of 4 months to promote the precipitation of arsenic. A radioactive tracer, 35S, was introduced during the final phases of injection to facilitate phosphor imaging of sulfide precipitates.
During the first and second injections of SO42- reducing amendments, total As
concentrations dropped in all 4 columns by a factor of ten in less than 5 days at a rate of ~10-8 moles min-1. This reduction in As concentrations coincided with decreasing concentrations of SO4
2-, ethanol, and lactate, and increasing concentrations of HS- (Figure 5). In addition, the pH increased to 8.5 and Eh fell from 350 to -350 to -400 mV, well within the sulfate reducing range. Most importantly, no significant release of dissolved As was observed during these injections although trace amounts (~1-2 µM) of thioarsenate (AsO3S3
-) or dithioarsenite (AsOS23-) were detected in samples where
thiosulphate (S2O32-) also appeared.
When FeCl2 was added to the amendments, a black precipitate appeared in the groundwater solutions. The concentrations of As initially decreased by a factor of 100 to 500 times at a rate of ~5x10⁻⁸ mol min-1 and then rose slightly. Ca and Mn concentrations also declined (data not shown), consistent with precipitation of Mn sulfide. The effluent As concentrations one week after each of the injections were ~1 to 5 µM, which is two orders of magnitude lower than starting concentrations of ~100 µM. The As concentration of the black precipitate was 0.56 mmol kg-1, approximately 5 grams of which formed after the last three injections when FeCl2 was added to the groundwater..
Influent and effluent concentrations of As were used to determine when sufficient precipitation had taken place in the columns. Further discussion of metals removal is provided in Section 6.5.

ER-1373-FR_PMa_Final 24 9/10/09
Two of the columns were sacrificed to study the stability of these precipitates, and the other two columns were used to test an additional stabilization step using a phosphate coating prior to examining stability under aerobic conditions. Aerobic natural and artificial water was then passed through one of each of these columns for a period of five months. Results from these anaerobic flow-through column studies were used to make a go/no go decision to perform a field-scale pilot test as discussed in Section 6.5.
6.3 Task 3: Solids Characterization and As-Sulfide Stability
Task 3.1: Mineralogical and Chemical Characterization of As Precipitates
Upon completion of the metals removal testing, the estimated As deposited in each sample from column #1 was approximately 0.42 to 0.55 mmol kg-1, which is 3 to 4 times the As in the original sediment (Table 3).
The bottom of the column #1 sediment, where the amended groundwater entered, was blackened relative to the tawny color of the upper portion of the core. The topmost section of column #1, where the groundwater exited, was slightly blackened. This discoloration correlates with the higher concentrations of Fe and As observed in the sequential extraction profile of column #1. Approximately 57% of the As in column #1 was deposited in the lowermost 7 cm and the concentration was ten times that of the original sediment. The Fe concentration in this section was ~25 times that of the original sediment (Table 3). The S and P concentrations in this section were 70 and 24 mmol kg-1, respectively, values that are ~50 times that of the original sediment. Most of the As was released during sequential extraction in the NaOCl step (Table 3), whereas most of the Fe was released in the Ammonium oxalate and the Hydroxylamine/HCl steps. Relative to the original sediment, no significant As was found in the final aqua regia step, although a significant amount of Fe (~12%) was released in this step.
35S maps of the core and of the sediment grains revealed that the highest 35S activity occurred in the blackened portions of the core where localized concentrations of 35S approximately 100-400 µm in size were observed forming between the detrital grains (Figure 6). SEM analyses revealed that these hot spots are related to euhedral So crystals deposited on the surface of the detrital quartz grains. SEM analyses also detected the presence of phosphate and calcite precipitates associated with some of these So crystals. The As was found to be associated with fine-grained precipitates containing Fe, S, P, Ca, C and Na (Figures 7 and 8). The So crystals and these fine-grained coatings were only found associated with the 35S hotspots. Speciation by

ER-1373-FR_PMa_Final 25 9/10/09
XANES spectroscopy of the blackened sediments from column #1 suggested that these As-bearing fine-grained precipitates were primarily As-bearing sulfides, including arsenopyrite (FeAsS) with minor realgar (AsS) (Figure 9). Based upon the analyses of the extracts, the maximum amount of FeS deposited in the blackened bottom of column #1 was 0.5 wt%. Complete analytical results are provided in Appendix A-5.
Tasks 3.2 and 3.3: Direct Dissolution Experiment and As-Precipitate Stabilization Experiments
The As and SO42- concentrations in the eluent from the H2O2/K2HPO2 treated column
#3 were 3 to 10 times greater than those of the untreated column #2 (Figure 10), which is why the aerobic leaching of column #3 was terminated earlier than that of column #2. The concentration of As in the natural groundwater entering column #2 was observed to be greater than that leaving column #2, indicating additional formation of precipitates, whereas that leaving column #3 peaked at a concentration close to that of natural groundwater (Figure 10). The total concentration of SO4
2- leaving both columns, however, was greater than the total concentration of SO4
2- and HS- in the natural groundwater entering the columns (Figure 10). Increases in the As and SO4
2- concentrations coincided with a decline in Cl- and breakthrough of the natural groundwater. Switching to As-free, pH 7.5 artificial groundwater with a similar SO4
2- concentration as the natural groundwater after 8,640 minutes had no significant affect on either the As or SO4
2- concentrations of the eluent, but it did increase the pH to 7.5 (Figure 10). Amending the artificial groundwater composition with K2HPO4 at 83,400 minutes appeared to reduce the As concentration in the effluent by 10 times but doubled the SO4
2- concentration in the effluent (Figure 10). The addition of colloidal Al(OH)3 after 103,560 minutes temporarily increased the As concentration by 10 times, tripled the SO4
2- concentration (Figure 10) and produced a slight dip in the pH. Sequential extraction analyses of the syringe column sediments suggested a decline in the As, Fe and S concentrations with time (Table 4), although the correlation is scattered by the compositional heterogeneity of the sediments (R2 < 0.2). The temporal trend corresponds to a loss rate of ~4x10⁻⁶ mmol kg-1 min-1 for As. Complete analytical results are provided in Appendix A-5.
After completion of the aerobic leaching experiment, column #2 was frozen and split open to reveal blackened regions located in the same locations as column #1 with no visible signs of oxidation. Sequential extraction analyses of column #2 also revealed that the As and Fe concentration profiles were very similar to the unleached column #1 results (Figure 11). S and P concentrations tracked that of Fe. The molar concentration

ER-1373-FR_PMa_Final 26 9/10/09
of S was slightly greater than that of Fe in both columns. Although the As, Fe, S and P concentrations of the bottom-most dark region of column #2 were very similar to that of column #1, the As and Fe concentrations in the higher parts of the core were significantly less. The average As concentration was 0.36 mmol kg-1 or 86% of that of column #1. The average Fe concentration of column #2 was 14 mmol kg-1 versus the 26 mmol kg-1 for column #1, suggesting loss of Fe, but these averages are not significantly different at the 95% confidence level. XANES analyses of column #2 solid-phases indicated that As was found mostly in FeAsS, but, unlike column #1, AsS was less abundant and AsO4
3- was also detected (Figure 9). Al-rich precipitates that formed during the injection of Al(OH)3 colloids into column #2 also contained traces of As (Figure 7).
The coating procedure of Evangelou (1995) failed to provide greater protection to the Fe and As-bearing sulfide in column #3 relative to that of the untreated column #2 probably because the dilute H2O2 solution was too powerful an oxidant for fine-grained sulfide species. The 35S analysis of column #4 sediments, which had also been treated by the Evangelou (1995) coating procedure, failed to detect reduced 35S-bearing sulfides (Figure 6) that should have formed during the SO4
2- reduction phase of the experiment. The SO4
2- concentrations observed eluting from column #2 are consistent with the amount of O2 entering the column, indicating the column was O2 limited. To explain the higher SO4
2- concentrations observed eluting from the treated column #3 at the beginning of the leaching process, therefore, requires the presence of initial higher SO4
2- concentrations at the end of the treatment process. The analyses of the dissolved As concentrations from the column #2 eluent indicate that after 165,480 hours of aerobic water leaching, ~2% of the As had been leached from the sediment in column #2. After correcting for the relative difference in pore volume flow rates, the estimated As loss rate for the syringe column would be -4x10⁻⁸ mmols kg-1 min-1, which after 165,480 minutes corresponds to 1% of the initial As in the syringe column, in agreement with observations of dissolved As concentrations of column #2 eluent. XANES analyses of column #2 sediment were critical to demonstrating that As was present both as AsO4
3- and as FeAsS/AsS, thereby confirming the existence of an oxidized As species that was undetectable prior to the aerobic leaching (Figure 9). The presence of As associated with the Al(OH)3 colloids also is consistent with the presence of adsorbed AsO4
3- in the column (Figure 7). The groundwater flow velocity at the Avon Park site is ~ 1 cm day-1. The flow velocity in the column aerobic leaching experiments was ~50 cm day-1, and the release rate of the As was limited by the rate of O2 entering the column and the proportion of this O2 which oxidized FeS. If at the end of 115 days or 0.3 years of aerobic leaching ~98% of

ER-1373-FR_PMa_Final 27 9/10/09
the As remained in the column, then ~98% of any FeAsS precipitated in situ at Avon Park should remain after ~15 years of air saturated groundwater flow. The observed dissolved As concentrations also suggest that at least a 20 times reduction in the As concentration downstream of the biostimulation site is attainable. Since aerobic conditions are not expected to exist for such an extended period of time at the Site, this represents a worst-case scenario.
6.4 Task 4: Numerical Modeling
The PHREEQC model predicts that much of the As that enters the column with the natural groundwater was adsorbed to Fe(OH)3, explaining why the eluting As concentration was less than the 21 µM input (Figure 10). This is because the model assumed that the Fe(OH)3 had equilibrated with the 1.8 µM dissolved As in the column during the SO4
2- reduction phase. It is quite possible this assumption is not valid for all the sediment in the column, in which case the extent of AsO4
3- and AsO33- adsorption to
Fe(OH)3 would be variable and partial breakthrough of the input AsO33- could occur in
the eluent. Model input parameters are summarized in Table 5. Assuming that the initial abundance and spatial distribution of As in column #2, both as solid phase FeAsS and as a adsorbed species on the Fe3+ hydroxides, were the same as that determined for column #1 (Table 3), the PHREEQC model indicates that as the natural groundwater flowed through it for the first 8,640 minutes ~1% more As was added to the column as adsorbed As. After passing artificial groundwater with no As through the column for an additional 156,840 minutes, the model predicts that 3% of the As would be removed from the column (Figure 10). The PHREEQC model also indicates that substantial amounts of Fe2+ were adsorbed to the Fe3+ hydroxide phases during the FeCl2 portion of the SO4
2- reduction. This is consistent with sequential extraction analyses of the original sediment and that of the syringe column sediment. The model predicts that this Fe2+ is oxidized to produce newly formed Fe(OH)3, but the amount is insignificant when compared to that which occurs naturally in the sediment. The modeled concentrations for As and SO4
2- leaving column #2 represent a combination of competitive oxidation reactions of Fe2+ to Fe(OH)3, AsO3
3- to AsO43-
and HS- to SO42-, as well as adsorption of AsO3
3-, AsO4 3- and SO42- to Fe(OH)3 under
varying pH and transport. Varying the reaction rates for AsO33- to AsO4
3- and HS- to SO4
2-, which are not well established, had little effect, however, on the modeled AsO43-
and SO42- release rates, because O2 was limited. The abundant Fe bearing sulfide
precipitated during microbial SO42- reduction, therefore, plays a key role in limiting O2
in this system and thus limiting the oxidation of FeAsS and As sulfides. The Fe also plays a key role in the formation of new Fe(OH)3 sites and lowering the pH below 8,

ER-1373-FR_PMa_Final 28 9/10/09
both of which enhance the adsorption of both AsO33- and AsO4 3- (Dixit and Hering,
2003). The identification of P bearing precipitates by SEM is consistent with reaction path modeling of PO4
3- concentrations, which indicated that apatite and vivianite would be precipitated with co-injection of Fe2+. The PHREEQC model also indicates that with the breakthrough of the aerobic groundwater vivianite becomes under-saturated and strengite would become supersaturated. The slower release rate of PO4
3- during leaching when compared to that predicted by the PHREEQC reactive transport model indicates dissolution of a phosphate mineral phase must be taking place. Whether apatite, vivianite or strengite act to protect the solid phase As associated either with sulfide or hydroxides from dissolving cannot be determined from these experiments, but its presence confirms that the (NH4)3PO4 amendment utilized to stimulate SRB also precipitates phosphate minerals. Finally, the addition of PO4
3- to the leaching water had little effect on the dissolved As concentrations (Figure 10). The groundwater flow velocity at the Avon Park site is ~ 1 cm day-1. The flow velocity in the column aerobic leaching experiments was ~50 cm day-1 and the release rate of the As was limited by the rate of O2 entering the column and the proportion of this O2 that oxidized FeS. If at the end of 115 days or 0.3 years of aerobic leaching ~98% of the As remained in the column, then ~98% of any FeAsS precipitated in situ at Avon Park should remain after ~15 years of air saturated groundwater flow (worst case scenario). The observed dissolved As concentrations also suggest that at least a 20 times reduction in the As concentration downstream of the biostimulation site is attainable.
6.5 Task 5: Column Study Report
The addition of electron donors SO42-, FeCl2 and (NH4)3PO4 led to a reduction of
dissolved As concentrations with no significant release of soluble As species. Subtracting the measured dissolved As concentrations and the amount of As present in the black precipitate from the total amount of As added to the groundwater during the injections indicates that a total of ~6.4 mmols of As should have been deposited in the four columns and that the average As concentration in each column should have been ~0.56 mmol kg-1. The total As concentration and the As concentration summed from the sequential extractions of column #1 were 0.42 to 0.64 mmol kg-1 (Table 3), respectively, which is comparable to that estimated from the total amount of dissolved As injected into the columns. XANES analysis of column sediments was consistent with the recent thermodynamic data of Perfetti et al. (2008) (Figure 9). AsS does not appear to represent the principle solid state sink for As, as was observed by O’Day et al. (2004), however the pH in our

ER-1373-FR_PMa_Final 29 9/10/09
column experiments were considerably higher than theirs. The slightly higher molar abundance of S with respect to Fe in column #2 is consistent with the observed presence of So in the 35S hot spots. The formation of this So may be through abiotic reduction of Fe3+ hydroxides by HS- as examined by Poulton et al. (2004). The Fe, S and P concentrations in the blackened portion of column #1, however, are consistent with the precipitation of FeS and vivianite, Fe3(PO4)2. This association was consistent with SEM analyses of column #1 that detected As-bearing overgrowth of Fe, S, Ca and P. The crystal sizes were too small for analyses to identify the mineral phase, but the platy morphology of some the Fe-rich co-precipitates suggest that they were Fe3+ hydroxides (Figure 8). With continued SO4
2- reduction, a slow increase in dissolved As occurred after its initial decline during the stimulation. This behavior mirrors the As spike observed by Keimowitz et al. (2007) during their SO4
2- reduction experiments, which the authors suggested was due to the formation of trithionate (AsS3
-1). Our observations clearly indicate, however, that the slight increase in total As with continued SO4
2- reduction is primarily attributable to the slow increase in AsO4
3- concentrations, not thioarsenite concentrations. This increase in AsO4
3- concentrations might be due to desorption of AsO4
3- from Fe3+ hydroxides that are being reductively dissolved by HS-. These results indicate that microbial sulfate reduction was established in all four columns, resulting in the precipitation of the As within the column sediments. The reduction of sulfate to sulfide by sulfate reducing bacteria, which are ubiquitous in aquifers, promoted the precipitation of the arsenic. Success of the column study led to the decision to proceed with plans for a field demonstration at Avon Park Air Force Base.
6.6 Task 6: Field Pilot
A Pilot Test Work Plan (PTWP) was submitted to the Florida Department of Environmental Protection (FDEP) on 1 October 2007 and approved on 4 October 2007. This document was required to satisfy Underground Injection Control (UIC) Program requirements.
Installation of monitoring, injection, and recovery wells was completed in January 2008. Well construction records are provided as Appendix A-2. Slug testing and baseline sampling were performed in January 2008 upon completion of well installation and stabilization activities. Slug testing in the test plot indicated that the target

ER-1373-FR_PMa_Final 30 9/10/09
treatment zone consists of permeable soils (an average hydraulic conductivity of 9 ft/day) with a fairly low hydraulic gradient (0.002 ft/ft). Additional materials including sample spreadsheets and figures related to slug testing activities are included in Appendix A-6. Delivery of amendments using a recirculation scheme was expected to provide the most cost effective, rapid and complete distribution of amendments throughout the impacted area.
System construction and deployment of clean sediment pouches was completed in February 2008. The sediment pouches were deployed in each of the four monitoring wells for periodical collection throughout the pilot test to characterize As precipitates (see Site photos in Appendix A-1). Transducers set to measure background conductivity and water level were deployed in wells RW-1, MW-2, and MW-3 on 26 February 2008 in preparation for the conservative tracer test. However, subsequent quality assurance tests performed to verify system integrity led to the detection of leaks in the system. These leaks caused aeration of the groundwater and excessive precipitation of iron within well screens and system pipelines. Construction details were re-evaluated to pinpoint and address the problem.
Conservative Tracer Test
Upon completion of troubleshooting and system adjustment activities, the system was continuously operated for ten days prior to initiation of a bromide tracer test. A concentrated solution of KBr was poured as a single slug into INJ-1 on 1 April 2008. Modeling of results indicated that values for longitudinal dispersion (Dx) and latitudinal dispersion (Dy) are approximately 9.7 and 0.97 m2/day, respectively. These values were then applied to the same two-dimensional dispersion model as described in Section 5.5 to predict concentrations of amendments in Site groundwater based on stock concentrations. Modeling results indicated that the use of a factor of safety equal to 2 when calculating stock concentrations should result in the achievement of amendment concentration targets in Site groundwater. Additional calculation details and figures are provided in Appendix A-3.
Amendment Injections
Amendment stock concentrations were calculated based on results of the tracer test and on target concentrations utilized during the column study. Initial injection of a stock

ER-1373-FR_PMa_Final 31 9/10/09
containing sodium lactate, ferrous sulfate, ethanol, and diammonium phosphate began on 17 April 2008. Monitoring of geochemical parameters following the initial injection period indicated general uniformity Site-wide (Figure 12). However, conditions were characteristic of the methane-reducing range and were not reductive enough to be considered within the sulfate-reducing range.
As a result, amendment stock concentrations were increased approximately 10-fold. Upon mixing batches of this more concentrated stock, it was discovered that stock ingredients were reacting with one another to form solid precipitates within the mixing tank. Injections were suspended for approximately one month while bench-scale mix tests were performed to determine the source of the precipitation problem. Mix tests indicated that the sodium lactate was reacting with the ferrous sulfate to form sodium jarosite. In addition, solubility of powdered amendments was inhibited by the presence of ethanol.
Results of bench-scale mix tests led to the elimination of ethanol as an amendment, the replacement of ferrous sulfate with sodium sulfate, and to the separation of amendments into two batches. Beginning 10 July 2008, Batch 1 (sodium lactate, sodium sulfate, and water) and Batch 2 (diammonium phosphate and water) were injected intermittently and out of phase with each other in eight and four daily pulses, respectively.
Geochemical monitoring following implementation of the new injection strategy indicated the achievement of sulfate-reducing conditions throughout most of the Site (Figure 12). This injection strategy was continuously implemented for the remainder of the pilot test. Periods of heavy rains in the late summer led to automatic system shutdown via a float switch installed at INJ-1. System down time is reflected by a shift in geochemistry in August and September 2008. The system was shut down in November 2008 and decommissioned in December 2008 since study objectives had been achieved.
Results
Groundwater was monitored periodically during the course of injections for geochemical field parameters, total and dissolved metals of concern including iron and arsenic, sulfate and sulfide and carbon dioxide, electron donor concentrations, volatile fatty acids (as a measure of fermentation products of the electron donors), chloride, total dissolved solids, total organic carbon, and cations (e.g.calcium, magnesium, manganese, and sodium). Results of these analyses are provided in Table 6.

ER-1373-FR_PMa_Final 32 9/10/09
The concentrations of dissolved As began to decrease between March and June 2008 with more significant reductions seen after the injection strategy change in July 2008 (Figure 13). Total As concentrations had decreased by96% by September 2008, with no indication of re-mobilization during system down time when site geochemistry returned to near-background conditions. Because there are higher concentrations of As both up and downgradient of the system, and the recirculation system pulls in groundwater from both these areas, it was anticipated that even if all of the As within the test plot were precipitated, there would still be dissolved As entering the test plot through the recirculation system. Even with additional As inputs, samples taken in September 2008 indicated that the concentration of As was non-detect in three out of the four monitoring wells. This is consistent with the observations from the aerobic leaching experiments where the eluent As concentration was at least 1/20th of the dissolved As entering the column. The model predicts that this effect is due to the adsorption of As on Fe3+ hydroxides created by the oxidation of Fe sulfide minerals. Further evidence of precipitation was seen in the sediment bags that were collected in September. The sediment had turned black, indicative of the precipitation of Fe bearing sulfides. These concentrations were up to two orders of magnitude lower that the results obtained in column experiments.
The effectiveness of the amendment injection in altering the groundwater geochemistry is also clearly demonstrated by the reduction in total iron concentrations observed over the study period. Between March and September 2008, total iron concentrations decreased by up to 87%, reflecting a significant decrease in reduction potential and subsequent precipitation of iron with sulfide (Figures 14A and 14B). In addition, sodium concentrations increased significantly, indicating successful distribution of sodium lactate and sodium sulfate, two of the amendments being injected at the site (Figure 15).
Sequential extraction analyses of the sediment samples indicate that the total As was up to three times that of the quartz-rich sand used for the sediment bags (Table 7, Appendix A-7). The proportion of As that was adsorbed to the sediment varied from 0 to 4%, which is less than the 7% adsorbed As from the sand used for the sediment bags and the 8% adsorbed As of the site sediment. This is also consistent with the much lower dissolved As concentrations observed at the end of the simulation. This proportion of adsorbed As did not change significantly from March to September. The Fe sulfide and amorphous Fe3+ hydroxides increased from 2 to 11 and from 2 to 5 mmols kg-1, respectively, from March to September. Approximately 77 to 90% of the

ER-1373-FR_PMa_Final 33 9/10/09
As in the sediment bags appears to have been precipitated as a sulfide, although some may also be precipitated as a trace constituent in phosphate minerals. Up to 0.4 wt% FeS was precipitated in the sediment bags from the September sampling (Figure 16). Half of the sediment bags contained Fe3+ hydroxide coated grains (the A bags and Control B in Appendix A-7) which enabled us to determine the effect of Fe3+ hydroxides on As sequestration. The total Fe in the sediment bags and the Fe associated with the hydroxides were observed to both decrease and increase from March to September. This suggest that mobilization of Fe took place during microbial sulfate reduction but with no detectable deleterious effects on the dissolved As concentration in the water. This is most likely because the system was always poised for sulfate reduction during this time interval.
ER-1373-FR_PMa_Final 34 9/10/09
7. CONCLUSIONS
The results of both the column and field pilot studies demonstrate successful sequestration of As under anaerobic, sulfate-reducing conditions, and that precipitated As is resistant to dissolution under aerobic or less reductive conditions. XANES analyses of sediments from the column and field pilot studies demonstrated successful precipitation of stable As sulfide forms including realgar and arsenopyrite.
The results from the large column and the mini-syringe column aerobic leaching experiments indicate that 1 to 2% of the solid phase As was leached by 116 pore volumes of aerobic groundwater. Switching from As-bearing groundwater to As-free artificial water did not increase the As release rate and indicates that the stimulation process creats net As sinkhole. Extrapolating to the slower groundwater flow rates of the field site suggests that the only 1 to 2% of the precipitated As assemblage would dissolve over the course of 16 years. We would expect even less of the sequestered As to dissolve in the field during this time period because the groundwater recharging the aquifer is not saturated with O2 and because of the heterogeneity in the distribution of As sulfide phases and Fe3+_ hydroxides. This expectation is supported by field pilot results which show a less than 0.01% increase in dissolved As concentrations after a shift in redox potential toward less reducing conditions of approximately -150 mV from -250 to -350 mV.
Success of this technology at APAFR may lead to successful implementation as a remediation measure at other dissolved metals impacted sites. Sites with higher concentrations of metals in groundwater will likely be amenable via this bio-precipitation technology since excess As was artificially introduced and successfully precipitated during the column studies. As much arsenic as possible was sequestered so that the As species could be detected by SEM and EDS, therefore, in addition to the concentration of As in the natural groundwater (26 μM), 50 times this concentration was introduced into the columns. The indigenous sulfate reducing bacteria population were capable of reducing this concentration to <1 μM. For many subsurface environments the groundwater is naturally anaerobic and sulfidic and for these environments the sequestration of As would be an effective and permanent solution. For aquifers that are naturally aerobic or where the anaerobic conditions are temporary due to a high organic load, the transition to fully aerobic conditions will be

ER-1373-FR_PMa_Final 35 9/10/09
gradual and are not expected to cause a significant amount of As release in the presence of sulfate.
Several unanticipated setbacks related to system construction and operational maintenance led to the expenditure of monies in excess of original estimates during the field pilot study. It is recommended that future implementations of this technology be performed via direct injection of amendments using GeoprobeTM direct push technology. Direct injection would eliminate amendment mixing issues, biofouling concerns, and labor intensive construction and maintenance of a groundwater recirculation system. This method would also facilitate amendment delivery at larger sites and at sites with more complex hydrogeology, though passive distribution would need to be assessed on a site-by-site basis to determine whether the natural gradient is high enough to distribute amendments within the desired timeframe.

ER-1373-FR_PMa_Final 36 9/10/09
8. REFERENCES
Achtnich, C., F. Bak, and R. Conrad. 1995. Competition for Electron Donors Among Nitrate Reducers, Ferric Iron Reducers, Sulfate Reducers, and Methanogens in Anoxic Paddy Soil. Biol. Fertil. Soils 19: 65-72. Bethke, C. M., 2008. Geochemical and Biogeochemcial Reaction Modeling. Cambridge 4 University Press, Cambridge, pp. 543. Castro, J.M., B.W. Wielinga, J.E. Gannon, and J.N. Moore. 1999. Stimulation of sulfate-reducing bacteria in lake water from a former open-pit mine through addition of organic wastes. Water Environment Research 71: 218-223. Cord-Ruwisch, R., 1985. A quick method for the determination of dissolved and precipitated sulfides in cultures of sulfate-reducing bacteria. Journal of Microbiological Methods 4, 33-36. Delany, J., Lundeen, S., 1990. The LLNL thermochemical database. Lawrence Livermore National Laboratory Report UCRL-21658, Dixit, S., Hering, J. G., 2003. Comparison of Arsenic(V) and Arsenic(III) Sorption onto Iron Oxide Minerals: Implications for Arsenic Mobility. Environ Sci Technol 37, 4182-4189. Ehrlich, H.L. 1996. Geomicrobiology. 3 ed. Marcel Dekker, Inc. Gurian, P.L., M.J. Small, J.R. Lockwood, and M.J. Schervish, 2001. Addressing Uncertainty and Conflicting Cost Estimates in Revising the Arsenic MCL. Environ. Sci. Technol., 35: 4414-4420.
Evangelou, V.P. (1995) Potential Microencapsulation of Pyrite by Artificial Inducement of Ferric Phosphate Coatings. Journal of Environmental Quality 24: 535-542.
Hvorslev, M.J., 1951. Time Lag and Soil Permeability in Ground-Water Observations, Bull. No. 36, Waterways Exper. Sta. Corps of Engrs, U.S. Army, Vicksburg, Mississippi, pp. 1-50.
Keimowitz, A. R., Mailloux, B. J., Cole, P., Stute, M., Simpson, H. J., Chillrud, S. N., 2007. Laboratory Investigations of Enhanced Sulfate Reduction as a Groundwater Arsenic Remediation Strategy. Environ Sci Technol 41, 6718-6724.

ER-1373-FR_PMa_Final 37 9/10/09
Keon, N.E., Swartz, C.H., Brabander, D.J., Harvey, C., and Hemond, H.F. (2001) Validation of an Arsenic Sequential Extraction Method for Evaluating Mobility in Sediments. Environ. Sci. Technol. 35: 2778-2784.
Labrenz, M., G.K. Druschel, T. Thomsen-Ebert, B. Gilbert, S.A. Welch, K.M. Kemner, G.A. Logan, R.E. Summons, G. De Stasio, P.L. Bond, B. Lai, S.D. Kelly, and J.F. Banfield. 2000. Formation of sphalerite (ZnS) deposits in natural biofilms of sulfate-reducing bacteria. Science 290: 1744-1747. La Force, M.A., Fendorf, S., Guangchou, L., and Rosenzweig, R.F. (1999) Redistribution of trace elements from Contaminated Sediments from Lake Coeur d' Alene during Oxygenation. Journal of Environmental Quality 28: 1195-1200.Nordstrom, D.K., and Archer, D.G. (2003) In Arsenic in Goundwater. Welch, A.H., and Stollenwerk, K.G. (eds). Boston: Kluwer, pp. 1–25.
O’Day, P.A., Vlassopoulos, D., Root, R., and Rivera, N. (2004) The influence of sulfur and iron on dissolved arsenic concentrations in the shallow subsurface under changing redox conditions. Proceeding of the National Academy of Sciences 101: 13703–13708.
Onstott, T. C., Lin, L.-H., Davidson, M., Mislowack, B., Borcsik, M., Hall, J., Slater, G. F., Ward, J., Sherwood Lollar, B., Lippmann-Pipke, J., Boice, E., Pratt, L. M., Pfiffner, S. M., Moser, D. P., Gihring, T., Kieft, T. L., Phelps, T. J., van Heerden, E., Litthaur, D., DeFlaun, M., Rothmel, R., 2006. The origin and age of biogeochemical trends in deep fracture water of the Witwatersrand Basin, South Africa. Geomicrobiology Journal 23, 369-414.
Parkhurst, D.L., and Appelo, C.A.J. (1999) USER’S GUIDE TO PHREEQC (VERSION 2)—A COMPUTER PROGRAM FOR SPECIATION, BATCH-REACTION, ONE-DIMENSIONAL TRANSPORT, AND INVERSE GEOCHEMICAL CALCULATIONS. In Water-Resources Investigations Report 99-4259. Denver, CO: U.S. GEOLOGICAL SURVEY, p. 312.
Perfetti, E., Pokrovski, G. S., Ballerat-Busserolles, K., Majer, V., Gibert, F., 2008. Densities and heat capacities of aqueous arsenious and arsenic acid solutions to 350°C and 300 bar, and revised thermodynamic properties of As(OH)3 (aq), AsO(OH)3 (aq) and iron sulfarsenide minerals. Geochim Cosmochim Acta 72, 713–731.

ER-1373-FR_PMa_Final 38 9/10/09
Poulton, S. W., Krom, M. D., Raiswell, R., 2004. A revised scheme for the reactivity of iron (oxyhydr)oxide minerals towards dissolved sulfide. Geochimica et Cosmochimica Acta, 68, 3703-3715.
Saunders, J.A., Lee, M.K., Whitmer, J.M., and Thomas, R.C. (2001) In Situ Bioremediation of Metals-Contaminated Groundwater Using Sulfate-Reducing Bacteria: A Case History. In: Bioremediation of Inorganic Compounds. In The Sixth International In Situ and On-Site Bioremediation Symposium. Leeson, A.e.a. (ed): Battelle Press, Richland, WA.
Schwedt, G., Rieckhoff, M., 1996. Separation of thio- and oxothioarsenates by capillary zone electrophoresis and ion chromatography. Journal of Chromatography A 736, 341-350.
Stauder, S., Raue, B., and Sacher, F. (2005) Thioarsenates in Sulfidic Waters. Environ. Sci. Technol. 39: 5933-5939.
Tebo, B.M., and A.Y. Obraztsova. 1998. Sulfate-reducing bacterium grows with Cr(VI), U(VI), Mn(VI), and Fe(III) as electron acceptors. FEMS Microbiol. Lett. 162: 193-198. Thomson, B.M., D.S. Simmonton, and L.L. Barton, 2001. Stability of Arsenic and Selenium Immobilized by In Situ Microbial Reduction. In: Proceedings of the 2001 Conference on Environmental Research, pp. 17-26. Waybrant, K.R., Blowes, D.W., and Ptacek, C.J. (1998) Selection of Reactive Mixtures for Use in Permeable Reactive Walls for Treatment of Mine Drainage. Environ. Sci. Technol. 32: 1972-1979.
White, C., and Gadd, G.M. (1996) A comparison of carbon/energy and complex nitrogen sources for bacterial sulphate-reduction: potential applications to bioprecipitation of toxic metals as sulphides. J. of Industrial Microbiology 17: 116-123.
Williford, W.W., R.M. Bricka, S.L. Ashby, L.L. Larson, and C. McGrath. 2002. Metals-contaminated Groundwater at U.S. Army Installations-Occurrence and Potential Remediation Techniques. Draft Report prepared for the U.S. Corps of Engineers, Washington, D.C.
ER-1373-FR_PMa_Final 39 9/10/09
Wilkin, R. T., Wallschlager, D., Ford, R. G., 2003. Speciation of arsenic in sulfdic waters. Geochemical Transactions 4, 1-7.

TABLES

Table 1. Field Parameters for Avon Park Well No. 43103-MW.
Depth (ft. bws)
Temperature (°C) pH
Conductance (µmhos)
Dissolved Oxygen (mg/L)
Oxidation Reduction Potential
(mV) Turbidity (NTU)
2.2 28.6 6.46 601 0.48 151.1 <1 4.2 28.1 6.44 628 0.45 146.3 <1 6.2 28.4 6.45 600 0.60 178.5 0 8.2 28.5 6.47 596 0.22 149.5 0 10.2 28.1 6.44 580 0.17 141.7 <1 10.2* 27.9 6.39 542 0.1 144.9 <1 11.2 28.0 6.44 579 0.17 151.1 <1
ft. bws--feet below water surface * after 40 L of water collected
Table 2. Geochemical Results of Well No. 43103-MW
Chemical Name µM F- 15.21Cl- 86.62PO4
3- 1.52SO4
2- 3.00HS- 15.42Total Sulfide <151.52Arsenate 11.29Dissolved Arsenic 23.87Total Arsenic 26.00 Benzene 23.08MTBE 0.66Ethylbenzene 7.91Isopropylbenzene 0.30Naphthalene 2.42N-Propylbenzene 0.49Styrene 0.07Toluene 7.271,2,4-Trimethylbenzene 6.731,3,5-Trimethylbenzene 1.73o-Xylene 5.43m,p-Xylenes 37.77
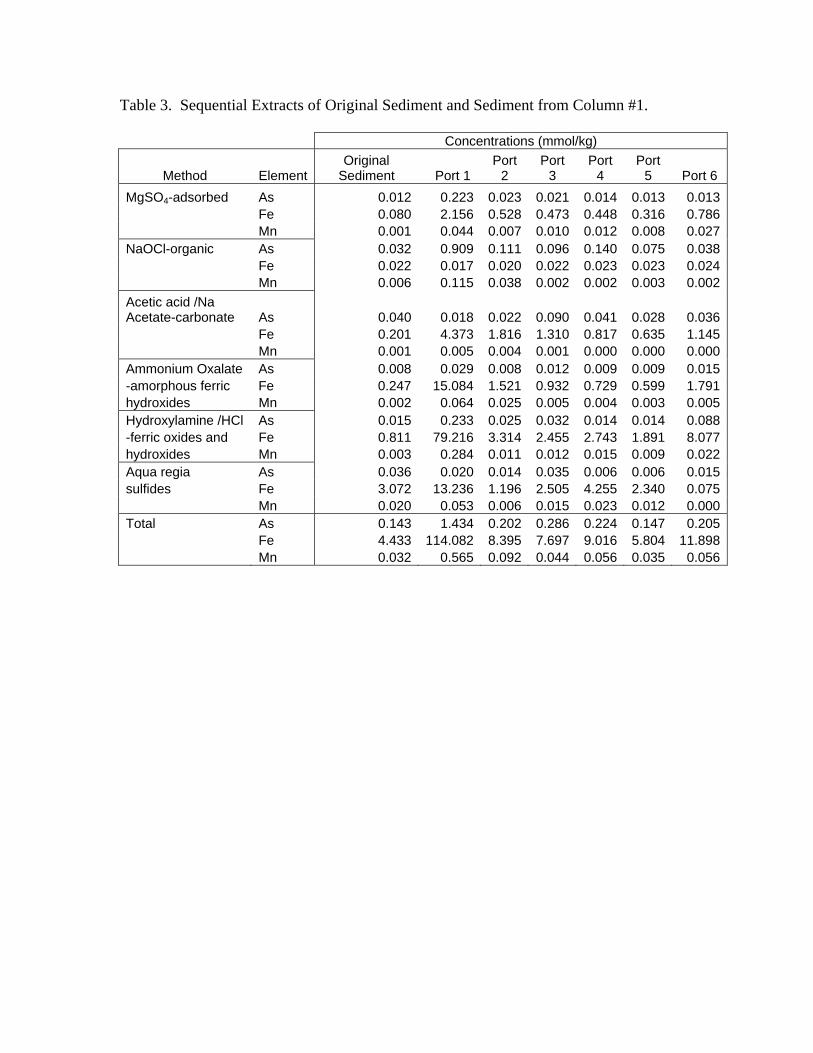
Table 3. Sequential Extracts of Original Sediment and Sediment from Column #1.
Concentrations (mmol/kg)
Method Element Original
Sediment Port 1 Port
2 Port
3 Port
4 Port
5 Port 6 MgSO4-adsorbed As 0.012 0.223 0.023 0.021 0.014 0.013 0.013 Fe 0.080 2.156 0.528 0.473 0.448 0.316 0.786 Mn 0.001 0.044 0.007 0.010 0.012 0.008 0.027NaOCl-organic As 0.032 0.909 0.111 0.096 0.140 0.075 0.038 Fe 0.022 0.017 0.020 0.022 0.023 0.023 0.024 Mn 0.006 0.115 0.038 0.002 0.002 0.003 0.002Acetic acid /Na Acetate-carbonate As 0.040 0.018 0.022 0.090 0.041 0.028 0.036 Fe 0.201 4.373 1.816 1.310 0.817 0.635 1.145 Mn 0.001 0.005 0.004 0.001 0.000 0.000 0.000Ammonium Oxalate As 0.008 0.029 0.008 0.012 0.009 0.009 0.015-amorphous ferric Fe 0.247 15.084 1.521 0.932 0.729 0.599 1.791hydroxides Mn 0.002 0.064 0.025 0.005 0.004 0.003 0.005Hydroxylamine /HCl As 0.015 0.233 0.025 0.032 0.014 0.014 0.088-ferric oxides and Fe 0.811 79.216 3.314 2.455 2.743 1.891 8.077hydroxides Mn 0.003 0.284 0.011 0.012 0.015 0.009 0.022Aqua regia As 0.036 0.020 0.014 0.035 0.006 0.006 0.015sulfides Fe 3.072 13.236 1.196 2.505 4.255 2.340 0.075 Mn 0.020 0.053 0.006 0.015 0.023 0.012 0.000Total As 0.143 1.434 0.202 0.286 0.224 0.147 0.205 Fe 4.433 114.082 8.395 7.697 9.016 5.804 11.898 Mn 0.032 0.565 0.092 0.044 0.056 0.035 0.056

Table 4. Sequential Extracts of Column #1 Sediment Before and During Exposure to Aerobic Leaching Water
Concentrations (mmol/kg) Method Element 0* 8300 13,000 20,000 36,000 51,000MgCl2 As 0.016 0.014 0.010 0.009 0.015 0.013 Fe 0.180 0.108 0.060 0.061 0.086 0.095 Mn 0.018 0.012 0.005 0.002 0.004 0.004 S 2.981 1.109 0.389 0.429 0.544 0.851Acetic acid /Na Acetate As 0.103 0.120 0.038 0.030 0.042 0.054 Fe 2.788 3.014 1.702 1.595 2.138 2.889 Mn 0.027 0.025 0.008 0.008 0.007 0.012 S 1.054 1.326 0.971 0.831 1.062 1.137Ammonium Oxalate As 0.092 0.073 0.034 0.028 0.057 0.062 Fe 6.756 4.842 3.047 2.613 4.547 5.311 Mn 0.011 0.009 0.003 0.002 0.005 0.007 S 0.175 0.137 0.073 0.050 0.169 0.152Hydroxylamine /HCl As 0.322 0.209 0.093 0.081 0.165 0.180 Fe 11.944 9.999 4.061 2.948 8.335 8.216 Mn 0.011 0.012 0.005 0.007 0.012 0.020 S 4.511 4.266 2.061 1.297 3.561 3.818Aqua regia As 0.016 0.015 0.011 0.010 0.016 0.013 Fe 0.188 0.112 0.061 0.062 0.089 0.097 Mn 0.018 0.013 0.005 0.002 0.004 0.004 S 3.108 1.143 0.396 0.436 0.561 0.877Total As 0.549 0.431 0.186 0.159 0.295 0.322 As** 0.447 0.317 0.159 0.116 0.231 0.248 Fe 21.857 18.076 8.932 7.278 15.194 16.609 Mn 0.085 0.071 0.026 0.021 0.033 0.046 S 11.830 7.980 3.891 3.043 5.896 6.836
*Leaching time in minutes at a flow rate of 4 mL hr-1.
**Arsenic concentration determined from separate total As analysis using aqua regia of a separate aliquot of the same sample.

Table 5. Model Parameters
Natural Groundwater Artificial
Groundwater Col.#2 Pore
water pH 6.4 8.64 7.5pe 12.5 -4 12.5O2 3.75x10⁻³ 3.13 x10⁻⁷ 3.75 x10⁻⁴
Na+ 1.00 x10⁻⁴ 3.91 x10⁻² 6.78 x10⁻⁵
Ca2+ 2.20 x10⁻³ 5.00 x10⁻⁴ 3.00 x10⁻⁴
Cl- 1.13 x10⁻⁴ 1.69 x10⁻² 4.59 x10⁻³
SO42- 1.87 x10⁻⁵ 6.87 x10⁻⁵ 2.20 x10⁻⁵
HS- 0.00 3.13 x10⁻⁵ 0.00HCO3
- 8.30 x10⁻³ 3.31 x10⁻³ 1.82 x10⁻⁴
PO43- 1.08 x10⁻⁶ 3.40 x10⁻³ 0.00
AsO43- 1.15 x10⁻⁵ 1.01 x10⁻⁶ 0.00
AsO33- 0.00 8.13 x10⁻⁸ 0.00
Fe2+ 0.00 5.45 x10⁻⁶ 0.00Fe3+ 0.00 1.09 x10⁻⁹ 0.00Surface Species Fe3+(OH)3 mol of sites/mol Fe m2/g g Hfdo_weak 0.2 600 0.288Hfdo_strong 0.005 600 0.288 mol of sites/mol Fe m2/mol Surfc_weak-OH 0.2 1.00x10⁵ Surfc_strong-OH 0.005 Reactions Rate (mol/s) Fe2+ + 0.25 O2 + H+ => Fe3+ + 0.5 H2O (2.91 x10⁻⁹ + 1.33 x10¹² x (OH-)^2 x pO2) * Fe2+ HS- +2O2 => H+ + SO4
2- (2.91 x10⁻⁹ + 1.33 x10¹² x (OH-)^2 x pO2) * HS- AsO3
3- + 0.5O2 => AsO43- (2.91 x10⁻⁹ + 1.33 x10¹⁴ x (OH-)^2 x pO2) * AsO33-
FeS + H2O => Fe2+ + HS- + OH-
10^(-9.14 + 4.00 + 0.67xLOG10(M/8.35x10-4) + 0.5*LOG10(O2) + -0.11*Log10(H+))
As2S3 + 6H2O => 2H3AsO3 + 3H2S
0.04x10^(-9.14 + 4.00 + 0.67xLOG10(M/8.35x10-4) + 0.5*LOG10(O2) + -0.11*Log10(H+))
Physical Parameters Porosity 0.18 Column Length (cm) 50 Column volume (cm3) 1.32x10³ Grain density(g/cm3) 2.66 Flow rate (mL/hr) 8-10 Longitudinal Dispersivity (m) 0.005 Diffusivity (m2/s) 3x10⁻¹⁰

TABLE 6
FIELD PILOT ANALYTICAL RESULTS
PILOT TEST STUDYAvon Park Air Force Range
Avon Park, Florida
Sample IDLab ID (VOCs, TPH)Lab ID (TDS, TOC)Sampling DateTime since injection (min)Matrix
2-Methylnaphthalene 1.50 I 1.70 I -- -- -- -- -- -- -- -- -- --Naphthalene 6.50 7.50 -- -- -- -- -- -- -- -- -- --Acetone -- -- -- -- -- -- -- -- -- -- -- --Benzene 31.80 32.60 -- -- -- -- -- -- -- -- -- --Carbon Disulfide -- -- -- -- -- -- -- -- -- -- -- --Ethylbenzene 47.30 45.80 -- -- -- -- -- -- -- -- -- --Tetrachloroethylene -- -- -- -- -- -- -- -- -- -- -- --Toluene 4.70 4.70 -- -- -- -- -- -- -- -- -- --Xylene (total) 191.00 186.00 -- -- -- 15.60 -- -- -- -- -- --
Total Dissolved Solids 447000 -- -- -- -- 439000 -- -- -- -- -- --Total Organic Carbon 82100 D -- -- -- 332000 28600 -- -- -- -- 85900 --Dissolved Inorganic Carbon (DIC) -- -- -- -- -- -- 412 -- 358 649 -- 788Total Petroleum Hydrocarbons 542 590 -- -- -- 279 -- -- -- -- -- --pH (laboratory) 9.77 -- -- -- -- 6.42 -- -- -- -- -- --
Volatile Organic Compounds (µg/L)
General Chemistry (µg/L)
-1.2E+051.6E+05 1.6E+05GroundwaterGroundwater Groundwater
--4/14/2008
INJ-1 (DUP)F55263-3
1/22/2008-4.3E+03
INJ-1 INJ-1 INJ-1--F55263-2
8/6/2008
INJ-1F59300-5
----
Groundwater
1/22/2008
Groundwater
3/31/2008F55341-2
--
-1.2E+05 -2.4E+04-1.2E+05
F55263-4 --MW-2 MW-2
F59300-2--
MW-2
1/22/2008 3/31/2008 4/14/2008
MW-2MW-2
F55341-4 ------
--
Groundwater
6/17/2008--
--MW-2
--
1.3E+058.8E+04-4.3E+03-2.4E+04Groundwater Groundwater Groundwater
MW-2----
9/4/2008
GroundwaterGroundwater
7/15/2008
Groundwater
8/6/20082.0E+05
Tables Jan08-Sept08.xls Page 1 of 9 3/24/2009

TABLE 6
FIELD PILOT ANALYTICAL RESULTS
PILOT TEST STUDYAvon Park Air Force Range
Avon Park, Florida
Sample IDLab ID (VOCs, TPH)Lab ID (TDS, TOC)Sampling DateTime since injection (min)Matrix
-1.2E+051.6E+05 1.6E+05GroundwaterGroundwater Groundwater
--4/14/2008
INJ-1 (DUP)F55263-3
1/22/2008-4.3E+03
INJ-1 INJ-1 INJ-1--F55263-2
8/6/2008
INJ-1F59300-5
----
Groundwater
1/22/2008
Groundwater
3/31/2008F55341-2
--
-1.2E+05 -2.4E+04-1.2E+05
F55263-4 --MW-2 MW-2
F59300-2--
MW-2
1/22/2008 3/31/2008 4/14/2008
MW-2MW-2
F55341-4 ------
--
Groundwater
6/17/2008--
--MW-2
--
1.3E+058.8E+04-4.3E+03-2.4E+04Groundwater Groundwater Groundwater
MW-2----
9/4/2008
GroundwaterGroundwater
7/15/2008
Groundwater
8/6/20082.0E+05
Total Arsenic 0.16 -- 0.0475 0.22 U 0.123 0.19 0.28 0.22 U 0.22 U 0.22 U 0.0406 0.0361Dissolved Arsenic 0.15 -- 0.0484 -- 0.119 0.16 0.08 -- 0.22 U 0.22 U 0.0418 --Total Iron 6.63 -- 2.1032 1.62 -- 7.44 6.97 4.43 2.62 1.07 -- 0.932Dissolved Iron 4.14 -- 1.5927 0.3995 -- 4.75 4.41 2.87 1.32 0.15 -- --Total Sulfur 3.20 -- 5.0118 11.91 -- 3.46 4.27 10.44 7.49 9.55 -- 3.22Dissolved Sulfur 3.39 -- 4.9514 9.5554 -- 3.44 5.29 9.04 7.15 8.03 -- --Total Sulfide (mmol/L) -- -- -- -- -- 0.12 0.04 -- 0.03 0.32 -- 2.75E-02Total Sulfide 3.56 -- -- -- -- 3.59 5.37 -- 1.10 10.20 -- 0.88Dissolved Sulfide 3.55 -- -- -- -- 3.82 -- -- -- -- -- --Total Calcium 99.55 -- 67.94 -- -- 113.04 79.93 -- 91.07 96.09 -- 24.82Dissolved Calcium 98.23 -- 69.099 -- -- 112.19 90.34 -- 67.84 96.84 -- --Total Sodium 3.33 -- 2.5745 2.58 -- 2.15 2.67 15.63 26.24 501.59 -- 75.34Dissolved Sodium 2.94 -- 2.7017 2.3918 -- 3.02 2.92 2.32 26.78 508.15 -- --Total Strontium 1.12 -- 1.1351 -- -- 1.03 1.12 -- -- -- -- 0.2 UDissolved Strontium 1.12 -- 1.1165 -- -- 1.01 1.28 -- -- -- -- --Total Potassium ND -- 7.7071 -- -- ND 7.94 -- -- -- -- 7.99Dissolved Potassium ND -- 7.671 -- -- ND 9.07 -- -- -- -- --Total Cobalt ND -- 0.001 -- -- ND 0.001 U -- -- -- -- 0.000345Dissolved Cobalt ND -- 0.001 -- -- ND 0.001 U -- -- -- -- --Total Zinc ND -- 0.2506 ND -- ND 0.32 ND 0.01 0.02 -- 0.295Dissolved Zinc ND -- 0.2564 ND -- ND 0.29 ND ND ND -- --Total Aluminum 0.16 -- 0.1925 0.07 -- ND 0.21 0.36 0.49 0.08 -- 0.0403Dissolved Aluminum ND -- 0.1804 0.191 -- 0.17 0.19 0.37 0.05 0.05 -- --Total Uranium 0.07 -- 0.1315 -- -- 0.08 0.10 -- -- -- -- 0.000032Dissolved Uranium 0.07 -- 0.144 -- -- 0.08 0.06 -- -- -- -- --Total Silicon 2.78 -- 1.962 2.41 -- 2.59 2.27 2.49 2.20 1.71 -- 1.95Dissolved Silicon 2.33 -- 1.8808 2.0122 -- 2.48 2.47 2.25 2.10 1.80 -- --Total Magnesium 12.22 -- 5.8351 7.7 -- 13.10 6.17 5.99 5.36 4.92 -- 4.1Dissolved Magnesium 12.10 -- 5.9027 6.4007 -- 13.14 7.00 6.15 5.09 0.68 -- --Total Manganese 0.80 -- 0.4477 0.81 -- 0.92 0.49 0.76 0.64 0.69 -- 0.1163Dissolved Manganese 0.79 -- 0.4515 0.7242 -- 0.91 0.54 0.52 0.65 -- -- --
Metals and Ions (mg/L)
Tables Jan08-Sept08.xls Page 2 of 9 3/24/2009

TABLE 6
FIELD PILOT ANALYTICAL RESULTS
PILOT TEST STUDYAvon Park Air Force Range
Avon Park, Florida
Sample IDLab ID (VOCs, TPH)Lab ID (TDS, TOC)Sampling DateTime since injection (min)Matrix
-1.2E+051.6E+05 1.6E+05GroundwaterGroundwater Groundwater
--4/14/2008
INJ-1 (DUP)F55263-3
1/22/2008-4.3E+03
INJ-1 INJ-1 INJ-1--F55263-2
8/6/2008
INJ-1F59300-5
----
Groundwater
1/22/2008
Groundwater
3/31/2008F55341-2
--
-1.2E+05 -2.4E+04-1.2E+05
F55263-4 --MW-2 MW-2
F59300-2--
MW-2
1/22/2008 3/31/2008 4/14/2008
MW-2MW-2
F55341-4 ------
--
Groundwater
6/17/2008--
--MW-2
--
1.3E+058.8E+04-4.3E+03-2.4E+04Groundwater Groundwater Groundwater
MW-2----
9/4/2008
GroundwaterGroundwater
7/15/2008
Groundwater
8/6/20082.0E+05
Total Copper ND -- 0.001 U -- -- ND 0.001 U -- -- -- -- 0.0018Dissolved Copper ND -- 0.001 U -- -- ND 0.001 U -- -- -- -- --Total Nickel 2.15 -- -- -- -- 2.05 -- -- -- -- -- 0.0022Dissolved Nickel 1.82 -- -- -- -- 1.98 -- -- -- -- -- --Total Barium 0.02 -- 0.06 -- -- 0.02 0.03 -- -- -- -- 0.0328Dissolved Barium 0.02 -- 0.06 -- -- 0.01 0.02 -- -- -- -- --Total Phosphorous ND -- 0.001 U ND -- ND 0.08 0.02 ND ND -- 0.742Dissolved Phosphorous ND -- 0.001 U ND -- ND 0.001 U 0.023 0.666 -- -- --Bromide -- -- -- -- -- -- -- 0.078 1.38 1.346 -- 0.465Fluoride* -- -- -- -- -- -- -- 0.0145 0.3371 0.3277 -- 0.391Chloride -- -- 5.557 -- -- -- 0.592 0.208 3.096 4.121 -- 1.53Sulfate (mmol/L) -- -- -- -- -- 0.06 0.158 0.003 0.252 0.034 -- 4.01E-03Sulfate -- -- 15.244 -- -- -- 15.330 0.248 24.437 3.289 -- 0.389Thiosulfate -- -- -- -- -- -- -- -- 0.344 8.051 -- 0.754Phosphate -- -- -- -- -- -- 1.596 -- 1.217 3.531 -- 2.97E+00Acetate -- -- -- -- -- -- -- 0.113 0.466 171.706 -- 2.32Lactate -- -- -- -- -- -- -- 0.036 0.173 1.104 -- 0.439Nitrate -- -- 7.288 -- -- -- 13.100 -- 2.780 ND -- NDNitrite -- -- -- -- -- -- -- -- ND 0.089 -- NDAmmonium -- -- -- -- -- -- -- -- 8.19 4.82 -- --Arsenite -- -- ND -- -- -- ND -- ND ND -- NDArsenate -- -- 0.315 -- -- -- 0.370 -- 0.001 U 0.001 U -- 0.0034TOTAL As ANIONS -- -- 0.315 -- -- -- 0.370 -- 0.001 U 0.001 U -- 0.0034TOTAL As CATIONS 0.16 -- 0.05 0.22 U 0.12 0.19 0.281 0.220 U 0.220 U 0.220 U 0.041 0.0361TOTAL As (Anions or Cations) 0.16 -- 0.181 0.220 U 0.120 0.19 0.326 0.220 U 0.001 U 0.001 U 0.0410 0.0361TOTAL As (Anions or Cations) (mol/L) 2.14E-06 -- 2.42E-06 2.94E-06 U 1.60E-06 2.54E-06 4.35E-06 2.94E-06 U 1.33E-08 U 1.33E-08 U 5.47E-07 4.82E-07
D = Result is from a diluted sampleI = Result is greater than the Minimum Detection Limit but less than the Reporting LimitNS = No Standard available for this analyteTICs = Tentatively Identified Compounds-- = Not Analyzed or No Data AvailableND = Not Detectedppm = parts per millionmg/kg = milligrams per kilogram
Tables Jan08-Sept08.xls Page 3 of 9 3/24/2009

TABLE 6
FIELD PILOT ANALYTICAL RESULTS
PILOT TEST STUDYAvon Park Air Force Range
Avon Park, Florida
Sample IDLab ID (VOCs, TPH)Lab ID (TDS, TOC)Sampling DateTime since injection (min)Matrix
2-MethylnaphthaleneNaphthaleneAcetoneBenzeneCarbon DisulfideEthylbenzeneTetrachloroethyleneTolueneXylene (total)
Total Dissolved SolidsTotal Organic CarbonDissolved Inorganic Carbon (DIC)Total Petroleum HydrocarbonspH (laboratory)
Volatile Organic Compounds (µg/L)
General Chemistry (µg/L)
5.70 -- -- -- -- -- 1 U -- -- -- -- --33.40 -- -- -- -- -- 1.2 U -- -- -- -- --11.00 I -- -- -- -- -- 10 U -- -- -- -- --83.00 -- -- -- -- -- 0.2 U -- -- -- -- --0.47 I -- -- -- -- -- 0.2 U -- -- -- -- --
95.00 -- -- -- -- -- 0.2 U -- -- -- -- --0.79 I -- -- -- -- -- 0.25 U -- -- -- -- --
16.40 -- -- -- -- -- 0.27 U -- -- -- -- --118.00 -- -- -- -- -- 0.56 U -- -- -- -- --
403000 -- -- -- -- -- 229000 -- -- -- -- --92000 D -- -- -- 42900 -- 103000 D -- -- -- 9700 --
-- 421 625 -- -- 1128 -- 391 219 199 -- 471782 -- -- -- -- -- 223 -- -- -- -- --6.66 -- -- -- -- -- 5.4 -- -- -- -- --
2.0E+051.6E+052.0E+051.6E+051.3E+058.8E+04GroundwaterGroundwater
1/23/2008-2.4E+04
Groundwater
7/15/2008-1.2E+05 1.3E+058.8E+04
GroundwaterGroundwater
--MW-1
1/22/2008F55341-3
--MW-1
----
9/4/20086/17/2008
MW-1F59300-1
--8/6/20087/15/2008
MW-1F55263-5
MW-1------
GroundwaterGroundwater
3/31/2008--
MW-1F59300-3
--
MW-3
----
MW-3 MW-3----
MW-3----
9/4/2008
MW-3--F55286-2
F55341-5 --
MW-3
GroundwaterGroundwaterGroundwater
8/6/2008
Groundwater
6/17/2008-2.4E+04-1.2E+053/31/2008
Groundwater
Tables Jan08-Sept08.xls Page 4 of 9 3/24/2009

TABLE 6
FIELD PILOT ANALYTICAL RESULTS
PILOT TEST STUDYAvon Park Air Force Range
Avon Park, Florida
Sample IDLab ID (VOCs, TPH)Lab ID (TDS, TOC)Sampling DateTime since injection (min)Matrix
Total ArsenicDissolved ArsenicTotal IronDissolved IronTotal SulfurDissolved SulfurTotal Sulfide (mmol/L)Total SulfideDissolved SulfideTotal CalciumDissolved CalciumTotal SodiumDissolved SodiumTotal StrontiumDissolved StrontiumTotal PotassiumDissolved PotassiumTotal CobaltDissolved CobaltTotal ZincDissolved ZincTotal AluminumDissolved AluminumTotal UraniumDissolved UraniumTotal SiliconDissolved SiliconTotal MagnesiumDissolved MagnesiumTotal ManganeseDissolved Manganese
Metals and Ions (mg/L)
2.0E+051.6E+052.0E+051.6E+051.3E+058.8E+04GroundwaterGroundwater
1/23/2008-2.4E+04
Groundwater
7/15/2008-1.2E+05 1.3E+058.8E+04
GroundwaterGroundwater
--MW-1
1/22/2008F55341-3
--MW-1
----
9/4/20086/17/2008
MW-1F59300-1
--8/6/20087/15/2008
MW-1F55263-5
MW-1------
GroundwaterGroundwater
3/31/2008--
MW-1F59300-3
--
MW-3
----
MW-3 MW-3----
MW-3----
9/4/2008
MW-3--F55286-2
F55341-5 --
MW-3
GroundwaterGroundwaterGroundwater
8/6/2008
Groundwater
6/17/2008-2.4E+04-1.2E+053/31/2008
Groundwater
0.56 0.42 0.22 U 0.22 U 0.0274 0.0198 0.18 0.13 0.22 U 0.22 U 0.0132 0.01550.33 0.07 0.22 U 0.22 U 0.0247 -- 0.16 0.03 0.22 U 0.22 U 0.0125 --5.22 7.31 8.57 3.91 -- 5.04 3.50 5.96 3.61 2.79 -- 3.814.85 2.38 5.38 2.08 -- -- 3.04 2.10 1.79 1.68 -- --3.59 3.45 92.03 2.89 -- 2.55 2.15 2.85 1.62 2.81 -- 3.953.64 3.22 86.68 3.01 -- -- 2.18 2.89 1.27 2.59 -- --
-- -- -- -- -- -- -- -- -- -- -- --3.88 50.40 4.20 3.70 -- 1.97 2.20 68.90 2.70 3.20 -- 0.664.11 -- -- -- -- -- 2.22 -- -- -- -- --
90.55 83.43 101.73 62.80 -- 27.15 58.04 77.84 53.24 52.90 -- 26.7891.21 82.01 94.44 64.01 -- -- 57.13 76.76 53.54 54.02 -- --5.22 2.42 210.36 71.70 -- 119.51 1.95 1.33 1.42 1.65 -- 2.376.13 2.49 199.14 73.71 -- -- 3.82 1.22 1.21 1.55 -- --1.12 1.15 -- -- -- 0.2 U 0.77 0.77 -- -- -- 0.2 U1.13 1.11 -- -- -- -- 0.76 0.75 -- -- -- --ND 9.92 -- -- -- 7.83 ND 5.34 -- -- -- 1.71ND 9.91 -- -- -- -- ND 5.28 -- -- -- --ND 0.001 U -- -- -- 0.000874 ND 0.001 U -- -- -- 0.000287ND 0.001 U -- -- -- -- ND 0.001 U -- -- -- --ND 0.54 0.33 ND -- 0.0282 ND 0.43 0.01 ND -- 0.0833ND 0.33 0.01 ND -- -- ND 0.30 ND ND -- --
0.19 0.26 0.33 0.09 -- 0.0681 0.40 0.23 0.08 0.05 -- 0.0324ND 0.23 0.51 0.04 -- -- ND 0.18 0.0047 0.04 -- --
0.09 0.15 -- -- -- 0.000064 0.07 0.11 -- -- -- 0.0000210.07 0.10 -- -- -- -- 0.07 0.12 -- -- -- --2.16 2.44 2.37 2.03 -- 2.25 5.12 2.59 2.41 1.81 -- 2.071.73 2.24 2.19 1.96 -- -- 2.27 2.42 2.12 1.77 -- --8.25 7.17 6.10 3.93 -- 3.97 4.82 5.09 3.35 2.59 -- 2.248.29 6.94 5.78 4.05 -- -- 4.80 5.15 2.97 2.56 -- --0.46 0.51 1.07 0.58 -- 0.0681 0.22 0.54 0.50 0.45 -- 0.39310.45 0.49 1.04 0.57 -- -- 0.21 0.54 0.45 0.45 -- --
Tables Jan08-Sept08.xls Page 5 of 9 3/24/2009

TABLE 6
FIELD PILOT ANALYTICAL RESULTS
PILOT TEST STUDYAvon Park Air Force Range
Avon Park, Florida
Sample IDLab ID (VOCs, TPH)Lab ID (TDS, TOC)Sampling DateTime since injection (min)MatrixTotal CopperDissolved CopperTotal NickelDissolved NickelTotal BariumDissolved BariumTotal PhosphorousDissolved PhosphorousBromideFluoride*ChlorideSulfate (mmol/L)Sulfate ThiosulfatePhosphateAcetateLactateNitrateNitriteAmmoniumArseniteArsenateTOTAL As ANIONSTOTAL As CATIONSTOTAL As (Anions or Cations)TOTAL As (Anions or Cations) (mol/L)
D = Result is from a diluted sampleI = Result is greater than the Minimum DetectioNS = No Standard available for this analyteTICs = Tentatively Identified Compounds-- = Not Analyzed or No Data AvailableND = Not Detectedppm = parts per millionmg/kg = milligrams per kilogram
2.0E+051.6E+052.0E+051.6E+051.3E+058.8E+04GroundwaterGroundwater
1/23/2008-2.4E+04
Groundwater
7/15/2008-1.2E+05 1.3E+058.8E+04
GroundwaterGroundwater
--MW-1
1/22/2008F55341-3
--MW-1
----
9/4/20086/17/2008
MW-1F59300-1
--8/6/20087/15/2008
MW-1F55263-5
MW-1------
GroundwaterGroundwater
3/31/2008--
MW-1F59300-3
--
MW-3
----
MW-3 MW-3----
MW-3----
9/4/2008
MW-3--F55286-2
F55341-5 --
MW-3
GroundwaterGroundwaterGroundwater
8/6/2008
Groundwater
6/17/2008-2.4E+04-1.2E+053/31/2008
GroundwaterND 0.02 -- -- -- 0.0069 ND 0.001 U -- -- -- 0.0052ND 0.00 -- -- -- -- ND 0.001 U -- -- -- --
1.70 -- -- -- -- 0.0028 3.99 -- -- -- -- 0.00171.34 -- -- -- -- -- 1.79 -- -- -- -- --0.12 0.09 -- -- -- 0.0268 0.02 0.02 -- -- -- 0.01710.12 0.06 -- -- -- -- 0.02 0.01 -- -- -- --ND 0.07 0.45 0.10 -- 0.431 ND 0.07 0.46 0.35 -- 0.2545ND 0.001 U 0.099 0.083 -- -- ND 0.001 U 0.092 0.079 -- --
-- -- 1.522 1.262 -- 0.707 -- -- 0.107 0.023 -- 0.0735-- -- 0.272 0.278 -- 0.499 -- -- 0.4942 0.5109 -- 0.4723-- 3.364 3.33 2.950 -- 2.06 -- 2.357 3.7643 1.1049 -- 0.6062-- -- -- -- -- -- -- -- -- -- -- ---- 10.16 290.7 1.112 -- 0.059 -- 7.538 2.812 0.665 -- 0.0431-- -- ND ND -- 0.0346 -- -- 0.044 0.048 -- 0.7629-- 1.210 0.040 0.2420 -- 0.148 -- 0.033 0.058 0.080 -- 0.0654-- -- 0.630 9.145 -- 1.344 -- -- 0.377 1.420 -- 1.0637-- -- 0.245 0.569 -- 0.34 -- -- 0.394 0.222 -- 2.1542-- 0.383 0.492 0.515 -- 0.058 -- 2.924 0.101 1.097 -- 0.0786-- -- 0.020 0.051 -- 0.0674 -- ND 0.044 0.038 -- 0.1615-- -- 20.47 6.77 -- -- -- -- 6.00 2.04 -- ---- ND ND ND -- ND -- ND ND ND -- ND-- 0.692 -- 0.537 -- 0.059 -- 0.294 0.001 U 0.001 U -- 0.001 U-- 0.692 -- 0.537 -- 0.059 -- 0.294 0.001 U 0.001 U -- 0.001 U
0.56 0.417 0.220 U 0.220 U 0.027 0.020 0.18 0.126 0.220 U 0.220 U 0.013 0.0160.56 0.555 0.220 U 0.220 0.027 0.0198 0.18 0.210 0.001 U 0.001 U 0.013 0.0160 U
7.47E-06 7.40E-06 2.94E-06 U 2.94E-06 U 3.60E-07 2.64E-07 2.40E-06 2.80E-06 1.33E-08 U 1.33E-08 U 1.74E-07 2.14E-07 U
Tables Jan08-Sept08.xls Page 6 of 9 3/24/2009

TABLE 6
FIELD PILOT ANALYTICAL RESULTS
PILOT TEST STUDYAvon Park Air Force Range
Avon Park, Florida
Sample IDLab ID (VOCs, TPH)Lab ID (TDS, TOC)Sampling DateTime since injection (min)Matrix
2-MethylnaphthaleneNaphthaleneAcetoneBenzeneCarbon DisulfideEthylbenzeneTetrachloroethyleneTolueneXylene (total)
Total Dissolved SolidsTotal Organic CarbonDissolved Inorganic Carbon (DIC)Total Petroleum HydrocarbonspH (laboratory)
Volatile Organic Compounds (µg/L)
General Chemistry (µg/L)
-- -- -- -- -- -- -- -- ---- -- -- -- -- -- -- -- ---- -- -- -- -- -- -- -- --
4.20 -- -- -- -- -- 16.50 -- ---- -- -- -- -- -- -- -- --
11.10 -- -- -- -- -- 2.70 -- ---- -- -- -- -- -- -- -- --
1.40 -- -- -- -- -- 0.82 I -- --75.10 -- -- -- -- -- 12.40 -- --
329000 -- -- -- -- -- 419000.00 -- --27000 -- -- -- 32600 -- 66900.00 D -- 20500
-- 419 450 424 -- 1122 -- -- --308 -- -- -- -- -- 329.00 -- --
5.64 -- -- -- -- -- 8.81 -- --
-1.2E+052.0E+051.6E+051.3E+058.8E+04-2.4E+04-1.2E+05GroundwaterGroundwaterGroundwaterGroundwater Groundwater Groundwater
--7/15/2008
MW-4F59300-4
--8/6/2008
MW-4--
MW-4F55286-1
6/17/2008
------
MW-4----
9/4/20081/23/2008F55341-6 --
3/31/2008
MW-4 MW-4
Groundwater Groundwater
--F55341-1 --8/6/20081/22/2008 3/31/20081.6E+05-2.4E+04
RW-1 RW-1F59300-6
RW-1--F55263-1
Groundwater
Tables Jan08-Sept08.xls Page 7 of 9 3/24/2009

TABLE 6
FIELD PILOT ANALYTICAL RESULTS
PILOT TEST STUDYAvon Park Air Force Range
Avon Park, Florida
Sample IDLab ID (VOCs, TPH)Lab ID (TDS, TOC)Sampling DateTime since injection (min)Matrix
Total ArsenicDissolved ArsenicTotal IronDissolved IronTotal SulfurDissolved SulfurTotal Sulfide (mmol/L)Total SulfideDissolved SulfideTotal CalciumDissolved CalciumTotal SodiumDissolved SodiumTotal StrontiumDissolved StrontiumTotal PotassiumDissolved PotassiumTotal CobaltDissolved CobaltTotal ZincDissolved ZincTotal AluminumDissolved AluminumTotal UraniumDissolved UraniumTotal SiliconDissolved SiliconTotal MagnesiumDissolved MagnesiumTotal ManganeseDissolved Manganese
Metals and Ions (mg/L)
-1.2E+052.0E+051.6E+051.3E+058.8E+04-2.4E+04-1.2E+05GroundwaterGroundwaterGroundwaterGroundwater Groundwater Groundwater
--7/15/2008
MW-4F59300-4
--8/6/2008
MW-4--
MW-4F55286-1
6/17/2008
------
MW-4----
9/4/20081/23/2008F55341-6 --
3/31/2008
MW-4 MW-4
Groundwater Groundwater
--F55341-1 --8/6/20081/22/2008 3/31/20081.6E+05-2.4E+04
RW-1 RW-1F59300-6
RW-1--F55263-1
Groundwater
0.15 0.24 0.22 U 0.22 U 0.0399 0.0333 0.17 0.10 0.2750.17 0.052 0.22 U 0.22 U 0.0429 -- 0.18 0.10 0.2545.71 6.7511 5.84 4.28 -- 5.35 7.09 7.70 --4.56 6.4084 4.4609 3.897 -- -- 6.71 6.69 --3.12 3.6861 12.48 3.03 -- 3.19 2.64 4.69 --3.02 3.177 9.4467 2.8429 -- -- 2.59 5.01 --0.10 8.69E-02 9.38E-02 2.50E-01 -- 4.13E-02 -- --3.27 2.78 3 8 -- 1.32 -- -- --3.27 -- -- -- -- -- 2.71 -- --
85.62 67.668 74.8 65.02 -- 24.86 2.81 -- --85.54 66.093 74.967 64.881 -- -- 73.60 78.39 --1.85 3.1255 28.16 61.74 -- 80.58 75.68 70.64 --2.96 3.0964 29.606 63.22 -- -- 2.16 2.95 --1.46 1.3461 -- -- -- 0.2 U 2.56 3.97 --1.43 1.2685 -- -- -- -- 1.07 1.09 --ND 8.0693 -- -- -- 6.95 1.08 1.14 --ND 7.7055 -- -- -- -- ND 8.09 --ND 0.001 U -- -- -- 0.000834 ND 8.34 --ND 0.001 U -- -- -- -- ND 0.001 U --ND 1.5584 ND ND -- 0.066 ND 0.001 U --ND 0.3663 ND ND -- -- ND 0.31 --
0.15 0.307 0.05 0.05 -- 0.0595 ND 0.38 --ND 0.2034 0.0333 0.0287 -- -- 0.25 1.52 --
0.07 0.118 -- -- -- 0.000089 ND 3.11 --0.07 0.1372 -- -- -- -- 0.07 0.13 --3.44 2.8249 2.34 1.6755 -- 2.45 0.07 0.11 --3.05 2.5442 2.0709 1.5954 -- -- 3.17 2.16 --9.39 6.9453 7.59 4.81 -- 3.62 2.47 2.23 --9.23 6.7118 6.0128 4.6879 -- -- 6.96 6.00 --0.40 0.3596 0.58 0.45 -- 0.3502 7.15 5.94 --0.40 0.3443 0.5257 0.4461 -- -- 0.59 0.53 --
Tables Jan08-Sept08.xls Page 8 of 9 3/24/2009

TABLE 6
FIELD PILOT ANALYTICAL RESULTS
PILOT TEST STUDYAvon Park Air Force Range
Avon Park, Florida
Sample IDLab ID (VOCs, TPH)Lab ID (TDS, TOC)Sampling DateTime since injection (min)MatrixTotal CopperDissolved CopperTotal NickelDissolved NickelTotal BariumDissolved BariumTotal PhosphorousDissolved PhosphorousBromideFluoride*ChlorideSulfate (mmol/L)Sulfate ThiosulfatePhosphateAcetateLactateNitrateNitriteAmmoniumArseniteArsenateTOTAL As ANIONSTOTAL As CATIONSTOTAL As (Anions or Cations)TOTAL As (Anions or Cations) (mol/L)
D = Result is from a diluted sampleI = Result is greater than the Minimum DetectioNS = No Standard available for this analyteTICs = Tentatively Identified Compounds-- = Not Analyzed or No Data AvailableND = Not Detectedppm = parts per millionmg/kg = milligrams per kilogram
-1.2E+052.0E+051.6E+051.3E+058.8E+04-2.4E+04-1.2E+05GroundwaterGroundwaterGroundwaterGroundwater Groundwater Groundwater
--7/15/2008
MW-4F59300-4
--8/6/2008
MW-4--
MW-4F55286-1
6/17/2008
------
MW-4----
9/4/20081/23/2008F55341-6 --
3/31/2008
MW-4 MW-4
Groundwater Groundwater
--F55341-1 --8/6/20081/22/2008 3/31/20081.6E+05-2.4E+04
RW-1 RW-1F59300-6
RW-1--F55263-1
GroundwaterND 0.001 U -- -- -- 0.009 0.63 0.51 --ND 0.001 U -- -- -- -- ND 0.02 --
2.68 -- -- -- -- 0.0033 ND 0.00 --2.40 -- -- -- -- -- 2.46 -- --0.05 0.0722 -- -- -- 0.03 1.94 -- --0.05 0.0697 -- -- -- -- 0.03 0.06 --ND 0.0054 0.35 0.26 -- 0.431 0.03 0.06 --ND 0.001 U 0.376 0.212 -- -- ND 0.001 U --
-- -- 1.6968 1.1073 -- 0.5601 ND 0.001 U ---- -- 0.3948 0.3147 -- 0.5987 -- -- ---- 2.315 3.1484 2.8517 -- 1.599 -- -- --
0.09 0.079 3.34E-01 2.29E-03 -- 0.000 -- -- ---- 7.667 32.437 0.222 -- 0.043 -- 3.773 ---- -- 0.2629 0.2646 -- 0.2659 -- -- ---- 0.415 0.0906 0.5907 -- 0.059 -- 12.500 ---- -- 0.3418 13.8157 -- 0.5171 -- -- ---- -- 0.309 0.6843 -- 0.2992 -- -- ---- 0.070 0.175 0.1169 -- 0.0995 -- 19.740 ---- -- 0.040 ND -- 0.136 -- -- ---- -- 14.10 7.27 -- -- -- -- ---- ND ND ND -- ND -- ND ---- 0.329 0.001 U 0.037 -- 0.002 -- 0.209 ---- 0.329 0.001 U 0.037 -- 0.002 -- 0.209 --
0.15 0.240 0.220 U 0.220 U 0.040 0.033 0.17 0.096 0.280.15 0.284 0.001 U 0.037 0.040 0.0330 0.17 0.152 0.280
2.00E-06 3.79E-06 1.33E-08 U 4.94E-07 U 5.34E-07 4.40E-07 2.27E-06 2.03E-06 3.74E-06
Tables Jan08-Sept08.xls Page 9 of 9 3/24/2009

TABLE 7
SEQUENTIAL EXTRACTS OF SEDIMENT FROM MW-2
PILOT TEST STUDYAvon Park Air Force Range
Avon Park, Florida
Iron Coated sandMW‐2 MW‐2 MW‐2
mmol/kg mmol/kg mmol/kg4/4/2008 9/4/2008 12/14/2008
MgCl2 As 74.92 0.0133516 0.0069551 0.00389125MgCl2 Fe 55.85 0.1972801 2.1427272 2.81987138M Cl2 M 54 94 0 0009708 0 0 00839362
Extraction ElementMW
(g/mol)
MgCl2 Mn 54.94 0.0009708 0 0.00839362MgCl2 S 32.06 0 0 0MgCl2 P 30.97 0.0562392 0.019545 0.03126992NaOH‐HOAc As 74.92 0.0123276 0.0406206 0.04164237NaOH‐HOAc Fe 55.85 4.6783227 12.867607 36.0118208NaOH‐HOAc Mn 54.94 0.0350945 0.0086565 0.05044454NaOH‐HOAc S 32.06 0.1544047 0.1207027 0.23313871NaOH HOAc S 32.06 0.1544047 0.1207027 0.23313871NaOH‐HOAc P 30.97 2.9160962 0.0939034 4.96352732AOD As 74.92 0.0453732 0.0807482 0.03827021AOD Fe 55.85 2.057957 5.2901405 8.55829193AOD Mn 54.94 0.059557 0.0413499 0.10983192AOD S 32.06 0 0 3.13239021AOD P 30.97 0.4694701 0.4323432 0.45559256Hydroxylamine HCL As 74.92 0.0039838 0.2142269 0.20032979Hydroxylamine HCL Fe 55.85 51.520878 0.1128087 57.7099451Hydroxylamine HCL Mn 54.94 0.3361337 0 0.32640807Hydroxylamine HCL S 32.06 3.003373 7.1219248 11.3182616Hydroxylamine HCL P 30.97 0.4694701 0 3.95347647Aquaregia As 74.92 0.0411277 0.0029677 0.03131359Aquaregia Fe 55 85 56 510678 2 760796 49 5659645Aquaregia Fe 55.85 56.510678 2.760796 49.5659645Aquaregia Mn 54.94 0.8244336 0.0471057 1.29896319Aquaregia S 32.06 0 6.9308998 30.7548461Aquaregia P 30.97 0.5588986 0 0TOTAL As 74.92 0.1161639 0.3455185 0.31544721TOTAL Fe 55.85 114.96512 23.174079 154.665894TOTAL Mn 54.94 1.2561897 0.0971121 1.79404135TOTAL S 32.06 3.1577777 14.173527 45.4386367TOTAL P 30.97 4.4701744 0.5457916 9.40386627
Sediments.xlsx Page 1 of 2 3/23/2009

TABLE 7
SEQUENTIAL EXTRACTS OF SEDIMENT FROM MW-2
PILOT TEST STUDYAvon Park Air Force Range
Avon Park, Florida
Uncoated SandMW‐2 MW‐2 MW‐2
mmol/kg mmol/kg mmol/kg4/4/2008 9/4/2008 12/14/2008
MgCl2 As 74.92 0.0150708 0 0.00387749M Cl2 F 55 85 0 1931775 1 5695404 1 61242696
Extraction Element MW
MgCl2 Fe 55.85 0.1931775 1.5695404 1.61242696MgCl2 Mn 54.94 0.0003848 0 0.0078361MgCl2 S 32.06 0 0 0MgCl2 P 30.97 0.0452753 0.0033709 0.0196733NaOH‐HOAc As 74.92 0.0576175 0.0269302 0.02111467NaOH‐HOAc Fe 55.85 20.944274 5.9715957 7.4367724NaOH‐HOAc Mn 54.94 0.0305443 0.0044879 0.00430329NaOH HOAc Mn 54.94 0.0305443 0.0044879 0.00430329NaOH‐HOAc S 32.06 0.2244234 0.1663394 0.1129991NaOH‐HOAc P 30.97 0.5765888 0.1662643 0.10018465AOD As 74.92 0.0358943 0.0452027 0.04784227AOD Fe 55.85 2.0159416 3.5986137 5.19966485AOD Mn 54.94 0.0223303 0.0380525 0.05170104AOD S 32.06 0 0 0AOD P 30.97 0.0901912 0.4475379 0.37954281Hydroxylamine HCL As 74.92 0.1729158 0.1548411 0.15290233Hydroxylamine HCL Fe 55.85 7.6970434 0.0534257 41.4651038Hydroxylamine HCL Mn 54.94 0.0034672 0 0.26723477Hydroxylamine HCL S 32.06 1.1639892 3.7191605 0.9711358Hydroxylamine HCL P 30.97 0.4555779 0 1.89393068Aquaregia As 74 92 0 0061468 0 0114421 0 00865468Aquaregia As 74.92 0.0061468 0.0114421 0.00865468Aquaregia Fe 55.85 2.480028 1.2475813 2.51404123Aquaregia Mn 54.94 0.0300759 0.0144236 0.03877292Aquaregia S 32.06 0.8727963 2.1506078 3.05203337Aquaregia P 30.97 0 0 0TOTAL As 74.92 0.2876452 0.2384162 0.23439145TOTAL Fe 55.85 33.330464 12.440757 58.2280093TOTAL Mn 54.94 0.0868025 0.056964 0.36984811TOTAL S 32.06 2.2612089 6.0361077 4.13616827TOTAL P 30.97 1.1676331 0.6171731 2.39333144
Sediments.xlsx Page 2 of 2 3/23/2009

FIGURES

Figure 1. Initial Groundwater Quality at Avon Park Air Force Range

Figure 2. Schematic of Column Setup

Figure 3. Pilot Test Layout

Figure 4. Arsenic Species Eh vs. pH Diagrams (top) Eh vs pH plot of As species for the As, S and Fe activities near the end the stimulation and (bottom) Eh vs pH plot of As species for the As, S and Fe activities at the beginning of the stimulation. Phase boundaries based upon the thermodynamic database published by O'Day et al. (2004).

Figure 5. Column Study Analytical Results Average concentrations of aqueous species from six side port samples during third injection into column #2.

Figure 6. Phosphor Images of Column Sediment. Phosphor images of A. thin section of untreated column #1 near inlet; B. of grain mounts 10from untreated column #1 and H2O2/K2HPO2treated column #4.

Figure 7. SEM images of Coatings (top) Secondary electron image of detrital quartz grain from column #1 displaying paritial cement coatings. (bottom) Magnified image of coating with EDS spectrum exhibiting calcium carbonate, Fe, S, P and As bearing minerals.

Figure 8. SEM images of Mineral (top) Secondary electron image and EDS spectrum of coating on same detrital quartz grain as in Fig. 6. Thin flaky Fe-rich mineral phase with distinctive As peak. (bottom) Secondary electron image and EDS spectrum of grains released by column #1 after the addition of Al(OH)3 colloidal solutions.

Figure 9. First-derivative As XANES spectra of column #1 and column #2 sediments. Black lines marking adsorption positions for arsenopyrite (FeAsS), realgar (AsS), orpiment (As2S3), arsenite (AsO3
3-), and arsenate (AsO43-) standards are depicted at 11867 eV, 11868 eV,
11869 eV, 11871 eV, and 11874 eV. Peaks are consistent with the formation of arsenopyrite, realgar and arsenate, indicating that stable As precipitates were formed during the column study (Onstott et al. 2009).

Figure 10. Results of Direct Dissolution Experiment AsO43- and SO4
2- concentrations versus time for aerobic leaching of untreated column #2 (open circles), H2O2/K2HPO2 treated column #3 (solid circles) and model results.

Figure 11. Column Cross-Section Speciation As, Fe, S and P concentrations for column #1 and column #2 after aerobic leaching experiment.

Figure 12. Groundwater Reductive Potential During Field Pilot Study

Figure 13. Arsenic Concentration During Field Pilot Test

Figure 14A/14B. Sulfate/Sulfide and Total Iron Concentration During Field Pilot Test
0.00
0.05
0.10
0.15
0.20
0.25
0.30
0.35
0.40
Jan-08 Feb-08 Apr-08 Jun-08 Jul-08 Sep-08 Oct-08
Con
cent
ratio
n (m
mol
/L)
Date
Sulfate/Sulfide
MW-2 SulfideMW-4 SulfideMW-2 SulfateMW-4 SulfateInjections Begin

Figure 15. Sodium Concentration During Field Pilot Test

Figure 16. Sequential Extraction of in situ sand bags. Sequential extractions of sediments from uncoated (plain quartz) in situ sand bags show co-precipitation of As with Fe and S over the course of the injection period. Sediment samples taken on 4/1/2008 are pre-injection samples which were allowed to equilibrate in situ in each monitoring well for two months prior to collection. An increase in S and As concentrations indicates successful sulfide generation and As-S precipitation. High concentrations of Fe naturally occurring in groundwater also aided in forming As precipitates.

APPENDIX A
Supporting Data

APPENDIX A-1
PHOTO LOG FOR COLUMN AND FIELD PILOT STUDIES

Site Photographs from System Installation
GEOSYNTEC CONSULTANTS Photographic Record
Client: SERDP Project Number: JR0018 Site Name: Avon Park Air Force Range Site Location: Avon Park Air Force Range Avon Park, FL
Photograph 1
Photo Description: Column set-up in anaerobic chamber

GEOSYNTEC CONSULTANTS Photographic Record
Client: SERDP Project Number: JR0018 Site Name: Avon Park Air Force Range Site Location: Avon Park Air Force Range Avon Park, FL
Photograph 2
Photo Description: Close-up of sediment pouch pair prior to deployment at field site

GEOSYNTEC CONSULTANTS Photographic Record
Client: SERDP Project Number: JR0018 Site Name: Avon Park Air Force Range Site Location: Avon Park Air Force Range Avon Park, FL
Photograph 3
Photo Description: RW-1 Well Vault construction during Pilot Study

GEOSYNTEC CONSULTANTS Photographic Record
Client: SERDP Project Number: JR0018 Site Name: Avon Park Air Force Range Site Location: Avon Park Air Force Range Avon Park, FL
Photograph 4
Photo Description: Piping from RW-1 for Pilot Study recirculation system

GEOSYNTEC CONSULTANTS Photographic Record
Client: SERDP Project Number: JR0018 Site Name: Avon Park Air Force Range Site Location: Avon Park Air Force Range Avon Park, FL
Photograph 5
Photo Description: Pilot Study recirculation system equipment housing unit

GEOSYNTEC CONSULTANTS Photographic Record
Client: SERDP Project Number: JR0018 Site Name: Avon Park Air Force Range Site Location: Avon Park Air Force Range Avon Park, FL
Photograph 6
Photo Description: Pilot Study recirculation system equipment housing unit, complete with amendment storage and overflow tanks

GEOSYNTEC CONSULTANTS Photographic Record
Client: SERDP Project Number: JR0018 Site Name: Avon Park Air Force Range Site Location: Avon Park Air Force Range Avon Park, FL
Photograph 7
Photo Description: 50 µm filter indicating sulfate reducing conditions (black precipitates)

GEOSYNTEC CONSULTANTS Photographic Record
Client: SERDP Project Number: JR0018 Site Name: Avon Park Air Force Range Site Location: Avon Park Air Force Range Avon Park, FL
Photograph 8
Photo Description: Split core from Column Study showing fractures at side-ports and predominance of dark sulfide-rich zones at the inlet end

GEOSYNTEC CONSULTANTS Photographic Record
Client: SERDP Project Number: JR0018 Site Name: Avon Park Air Force Range Site Location: Avon Park Air Force Range Avon Park, FL
Photograph 9
Photo Description: Split core from Column Study – close-up of black sulfide-rich zone

GEOSYNTEC CONSULTANTS Photographic Record
Client: SERDP Project Number: JR0018 Site Name: Avon Park Air Force Range Site Location: Avon Park Air Force Range Avon Park, FL
Photograph 10
Photo Description: Post-Pilot Study sediment pouches, indicating precipitation of sulfides (black color)

APPENDIX A-2
PILOT TEST WELL CONSTRUCTION LOGS


APPENDIX A-3
TRACER TEST SUPPORTING INFORMATION
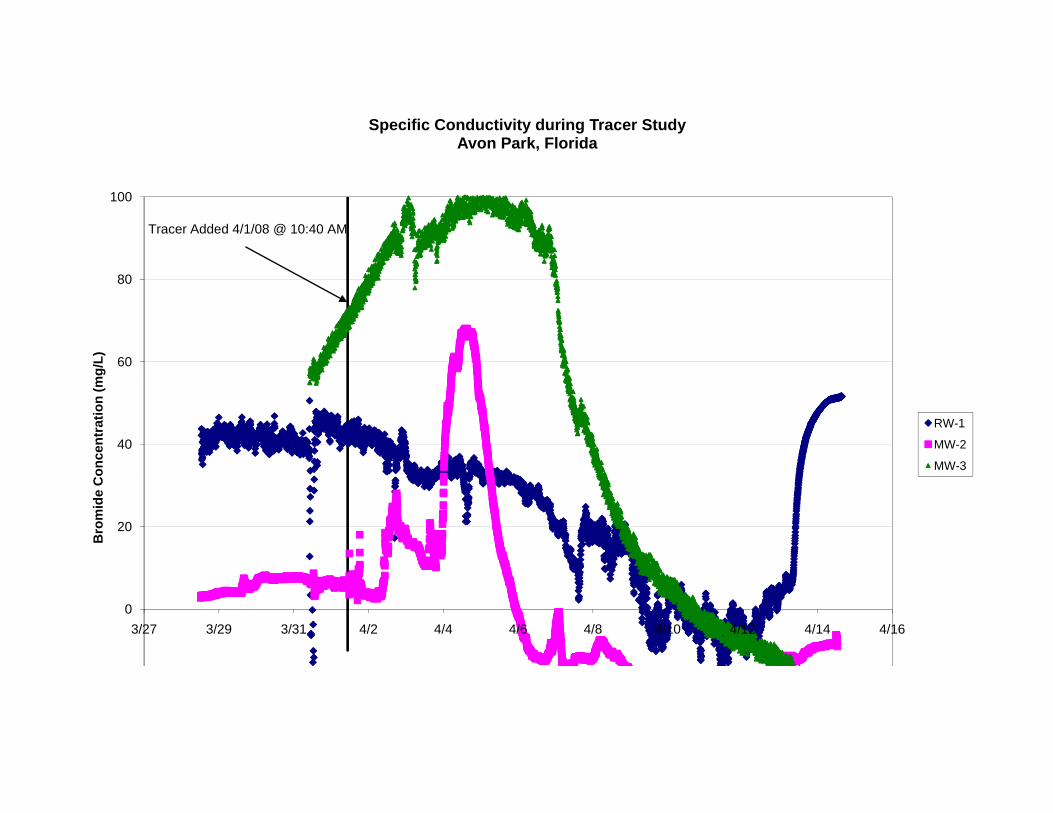
Specific Conductivity during Tracer StudyAvon Park, Florida
80
100
Tracer Added 4/1/08 @ 10:40 AM
60
mg/
L)
40
once
ntra
tion
(m
RW-1
MW-2
MW-3
20
Bro
mid
e C
o
03/27 3/29 3/31 4/2 4/4 4/6 4/8 4/10 4/12 4/14 4/16

Tracer Test Calculations
1. Combined all troll data into one spreadsheet (Avon Park Troll Data.xls), separated by tabs for each well
2. Subtracted background specific conductivity values and converted specific conductivity to bromide concentration based on calibration curves for each troll
3. Graphed bromide concentration vs. time for each well 4. Maximum Br concentration at MW-2 ~ 58 mg/L at t = 3.14 days 5. Dilution factor based on original concentration = 251,000 mg/L / 58 mg/L = 4,327 6. Dilution factor used in original calculations for stock concentration = 11,500 7. Played with original analytical model from Don but couldn’t get it to give realistic
values for the inputs 8. Used simplified 2-D model to calculated dispersion and retardation coefficients
(see columns X-AC in Copy of tracer_transport spreadsheet, breakthroughs worksheet). This model is for a pulse source:
( )( )( ) ( )
⎟⎟⎠
⎞⎜⎜⎝
⎛ −−
−−−=
tDyy
tDtvxx
DDtAC
tyxCyx
x
yx 44exp
4),,(
20
20
2/10
π
Where
x
t
vxR
t =
Inputs used: C0 = Initial concentration = 251,000 mg/L A = Source surface area = area of well = π r2 = 0.342 ft2 = 0.03177 m2 x = Lateral distance from source = 3.05 m for MW-2 vx = Velocity in x-direction = gradient = 2.003 m/d R = Retardation coefficient = 1
9. Iterated values for Dx (longitudinal dispersion) and Dy (latitudinal dispersion) to
calculate C (known to be ~58 mg/L) a. *Assumed relationship Dy = 0.1*Dx
10. Obtained values of Dx = 9.7, Dy = 0.97 11. Used calculated vales for Dx, Dy, Rt to calculate estimated concentrations of iron
stock constituent at wells RW-1 and MW-3 (using appropriate values for x and y distances from injection well)
12. Concentration in RW-1 estimated to be ~30 mg/L: below target concentration of 40 mg/L
13. Concentration in MW-3 estimated to be ~22 mg/L: below target concentration of 40 mg/L
14. Multiply stock concentration by 2: a. Concentration in RW-1 = 61 mg/L b. Concentration in MW-3 = 45 mg/L

APPENDIX A-4
MATERIAL SAFETY DATA SHEETS FOR GROUNDWATER AMENDMENTS

Material Safety Data Sheet Ammonium Phosphate, Dibasic, Reagent ACS (Powder)
ACC# 00219
Section 1 - Chemical Product and Company Identification MSDS Name: Ammonium Phosphate, Dibasic, Reagent ACS (Powder) Catalog Numbers: AC423370000, AC423370050, AC423375000 Synonyms: Diammonium Hydrogen Phosphate; Phosphoric Acid Diammonium Salt Company Identification: Acros Organics N.V. One Reagent Lane Fair Lawn, NJ 07410 For information in North America, call: 800-ACROS-01 For emergencies in the US, call CHEMTREC: 800-424-9300
Section 2 - Composition, Information on Ingredients
CAS# Chemical Name Percent EINECS/ELINCS
7783-28-0 Diammonium phosphate >99% 231-987-8
Section 3 - Hazards Identification
EMERGENCY OVERVIEW
Appearance: white solid. Caution! May cause eye and skin irritation. May cause respiratory and digestive tract irritation. Target Organs: None. Potential Health Effects Eye: Dusts may cause persistent eye irritation and conjunctivitis. Skin: May cause mild skin irritation. Ingestion: Causes gastrointestinal irritation with nausea, vomiting and diarrhea. Inhalation: May cause respiratory tract irritation. Chronic: Prolonged or repeated skin contact may cause dermatitis.
Section 4 - First Aid Measures

Eyes: Flush eyes with plenty of water for at least 15 minutes, occasionally lifting the upper and lower eyelids. Get medical aid. Skin: Flush skin with plenty of water for at least 15 minutes while removing contaminated clothing and shoes. Get medical aid if irritation develops or persists. Wash clothing before reuse. Ingestion: Do not induce vomiting. If victim is conscious and alert, give 2-4 cupfuls of milk or water. Never give anything by mouth to an unconscious person. Get medical aid. Inhalation: Remove from exposure and move to fresh air immediately. If not breathing, give artificial respiration. If breathing is difficult, give oxygen. Get medical aid. Notes to Physician: Treat symptomatically and supportively.
Section 5 - Fire Fighting Measures
General Information: As in any fire, wear a self-contained breathing apparatus in pressure-demand, MSHA/NIOSH (approved or equivalent), and full protective gear. During a fire, irritating and highly toxic gases may be generated by thermal decomposition or combustion. Extinguishing Media: Substance is noncombustible; use agent most appropriate to extinguish surrounding fire. Use water spray, dry chemical, carbon dioxide, or appropriate foam. Flash Point: Not applicable. Autoignition Temperature: Not applicable. Explosion Limits, Lower:Not available. Upper: Not available. NFPA Rating: (estimated) Health: 1; Flammability: 0; Instability: 0
Section 6 - Accidental Release Measures
General Information: Use proper personal protective equipment as indicated in Section 8. Spills/Leaks: Vacuum or sweep up material and place into a suitable disposal container. Avoid generating dusty conditions. Provide ventilation.
Section 7 - Handling and Storage
Handling: Use with adequate ventilation. Avoid contact with skin and eyes. Keep container tightly closed. Avoid ingestion and inhalation.

Storage: Store in a cool, dry, well-ventilated area away from incompatible substances. Keep containers tightly closed.
Section 8 - Exposure Controls, Personal Protection
Engineering Controls: Facilities storing or utilizing this material should be equipped with an eyewash facility and a safety shower. Use adequate ventilation to keep airborne concentrations low. Exposure Limits
Chemical Name ACGIH NIOSH OSHA - Final PELs
Diammonium phosphate
none listed none listed none listed
OSHA Vacated PELs: Diammonium phosphate: No OSHA Vacated PELs are listed for this chemical. Personal Protective Equipment Eyes: Wear appropriate protective eyeglasses or chemical safety goggles as described by OSHA's eye and face protection regulations in 29 CFR 1910.133 or European Standard EN166. Skin: Wear appropriate gloves to prevent skin exposure. Clothing: Wear appropriate protective clothing to prevent skin exposure. Respirators: Follow the OSHA respirator regulations found in 29 CFR 1910.134 or European Standard EN 149. Always use a NIOSH or European Standard EN 149 approved respirator when necessary.
Section 9 - Physical and Chemical Properties
Physical State: Solid Appearance: white Odor: ammonia-like - weak odor pH: 8.0 Vapor Pressure: Negligible. Vapor Density: Negligible. Evaporation Rate:Negligible. Viscosity: Not available. Boiling Point: Not available. Freezing/Melting Point:155 deg C Decomposition Temperature:155 deg C Solubility: 58g/100ml (10 C) Specific Gravity/Density: 1.619 Molecular Formula:(NH4)2HPO4 Molecular Weight:132.0478

Section 10 - Stability and Reactivity
Chemical Stability: Stable under normal temperatures and pressures. Conditions to Avoid: Incompatible materials, excess heat. Incompatibilities with Other Materials: Sodium hypochlorite. Hazardous Decomposition Products: Oxides of phosphorus, nitrogen oxides (NOx) and ammonia (NH3). Hazardous Polymerization: Has not been reported.
Section 11 - Toxicological Information
RTECS#: CAS# 7783-28-0 unlisted. LD50/LC50: Not available. Carcinogenicity: CAS# 7783-28-0: Not listed by ACGIH, IARC, NTP, or CA Prop 65. Epidemiology: No information available. Teratogenicity: No information available. Reproductive Effects: No information available. Mutagenicity: No information available. Neurotoxicity: No information available. Other Studies:
Section 12 - Ecological Information
Ecotoxicity: No data available. Fathead minnow LC50=155 ppm/96Hr. Environmental: No information available. Physical: No information available. Other: No information available.
Section 13 - Disposal Considerations
Chemical waste generators must determine whether a discarded chemical is classified as a hazardous waste. US EPA guidelines for the classification determination are listed in 40 CFR Parts 261.3. Additionally, waste generators must

consult state and local hazardous waste regulations to ensure complete and accurate classification. RCRA P-Series: None listed. RCRA U-Series: None listed.
Section 14 - Transport Information
US DOT Canada TDG
Shipping Name: Please contact Fisher Scientific for
shipping information No information available.
Hazard Class:
UN Number:
Packing Group:
Section 15 - Regulatory Information
US FEDERAL TSCA CAS# 7783-28-0 is listed on the TSCA inventory. Health & Safety Reporting List None of the chemicals are on the Health & Safety Reporting List. Chemical Test Rules None of the chemicals in this product are under a Chemical Test Rule. Section 12b None of the chemicals are listed under TSCA Section 12b. TSCA Significant New Use Rule None of the chemicals in this material have a SNUR under TSCA. CERCLA Hazardous Substances and corresponding RQs None of the chemicals in this material have an RQ. SARA Section 302 Extremely Hazardous Substances None of the chemicals in this product have a TPQ. SARA Codes CAS # 7783-28-0: acute. Section 313 No chemicals are reportable under Section 313. Clean Air Act: This material does not contain any hazardous air pollutants. This material does not contain any Class 1 Ozone depletors. This material does not contain any Class 2 Ozone depletors. Clean Water Act: None of the chemicals in this product are listed as Hazardous Substances under the CWA.

None of the chemicals in this product are listed as Priority Pollutants under the CWA. None of the chemicals in this product are listed as Toxic Pollutants under the CWA. OSHA: None of the chemicals in this product are considered highly hazardous by OSHA. STATE CAS# 7783-28-0 is not present on state lists from CA, PA, MN, MA, FL, or NJ. California Prop 65 California No Significant Risk Level: None of the chemicals in this product are listed. European/International Regulations European Labeling in Accordance with EC Directives Hazard Symbols: Not available. Risk Phrases: Safety Phrases: WGK (Water Danger/Protection) CAS# 7783-28-0: 1 Canada - DSL/NDSL CAS# 7783-28-0 is listed on Canada's DSL List. Canada - WHMIS WHMIS: Not available. Canadian Ingredient Disclosure List
Section 16 - Additional Information
MSDS Creation Date: 2/23/1999 Revision #2 Date: 3/18/2003 The information above is believed to be accurate and represents the best information currently available to us. However, we make no warranty of merchantability or any other warranty, express or implied, with respect to such information, and we assume no liability resulting from its use. Users should make their own investigations to determine the suitability of the information for their particular purposes. In no event shall Fisher be liable for any claims, losses, or damages of any third party or for lost profits or any special, indirect, incidental, consequential or exemplary damages, howsoever arising, even if Fisher has been advised of the possibility of such damages.

Material Safety Data SheetEthyl Alcohol, 70%
ACC# 91791
Section 1 - Chemical Product and Company Identification
MSDS Name: Ethyl Alcohol, 70% Catalog Numbers: S75119, S75120, S556CA4 Synonyms: Ethyl Alcohol; Ethyl Hydrate; Ethyl Hydroxide; Fermentation Alcohol; Grain Alcohol; Methylcarbinol; Molasses Alcohol; Spirits of Wine. Company Identification: Fisher Scientific 1 Reagent Lane Fair Lawn, NJ 07410 For information, call: 201-796-7100 Emergency Number: 201-796-7100 For CHEMTREC assistance, call: 800-424-9300 For International CHEMTREC assistance, call: 703-527-3887
Section 2 - Composition, Information on Ingredients
CAS# Chemical Name Percent EINECS/ELINCS
64-17-5 Ethyl alcohol 70 200-578-6
7732-18-5 Water 30 231-791-2
Hazard Symbols: F Risk Phrases: 11
Section 3 - Hazards Identification
EMERGENCY OVERVIEW
Appearance: colorless clear liquid. Flash Point: 16.6 deg C. Flammable liquid and vapor. May cause central nervous system depression. Causes severe eye irritation. Causes respiratory tract irritation. Causes moderate skin irritation. This substance has caused adverse reproductive and fetal effects in humans. Warning! May cause liver, kidney and heart damage. Target Organs: Kidneys, heart, central nervous system, liver.
Potential Health Effects
Eye: Causes severe eye irritation. May cause painful sensitization to light. May cause chemical conjunctivitis and corneal damage. Skin: Causes moderate skin irritation. May cause cyanosis of the extremities. Ingestion: May cause gastrointestinal irritation with nausea, vomiting and diarrhea. May cause systemic toxicity with acidosis. May cause central nervous system depression, characterized by excitement, followed by headache, dizziness, drowsiness, and nausea. Advanced stages may cause collapse, unconsciousness, coma and possible death due to respiratory failure. Inhalation: Inhalation of high concentrations may cause central nervous system effects characterized by nausea, headache, dizziness, unconsciousness and coma. Causes respiratory tract irritation. May cause narcotic effects in high concentration. Vapors may cause dizziness or suffocation. Chronic: May cause reproductive and fetal effects. Laboratory experiments have resulted in mutagenic effects. Animal studies have reported the development of tumors. Prolonged exposure may cause liver, kidney, and heart damage.
Section 4 - First Aid Measures
Eyes: Immediately flush eyes with plenty of water for at least 15 minutes, occasionally lifting the upper and lower eyelids. Get medical aid. Gently lift eyelids and flush continuously with water. Skin: Get medical aid. Flush skin with plenty of water for at least 15 minutes while removing contaminated clothing and shoes. Wash clothing before reuse. Flush skin with plenty of soap and water. Ingestion: Do NOT induce vomiting. If victim is conscious and alert, give 2-4 cupfuls of milk or water. Never give anything by mouth to an unconscious person. Get medical aid. Inhalation: Remove from exposure and move to fresh air immediately. If not breathing, give artificial respiration. If breathing is difficult, give oxygen. Get medical aid. Do NOT use mouth-to-mouth resuscitation.

breathing is difficult, give oxygen. Get medical aid. Do NOT use mouth-to-mouth resuscitation. Notes to Physician: Treat symptomatically and supportively. Persons with skin or eye disorders or liver, kidney, chronic respiratory diseases, or central and peripheral nervous sytem diseases may be at increased risk from exposure to this substance. Antidote: Replace fluid and electrolytes.
Section 5 - Fire Fighting Measures
General Information: Containers can build up pressure if exposed to heat and/or fire. As in any fire, wear a self-contained breathing apparatus in pressure-demand, MSHA/NIOSH (approved or equivalent), and full protective gear. Vapors may form an explosive mixture with air. Vapors can travel to a source of ignition and flash back. Will burn if involved in a fire. Flammable Liquid. Can release vapors that form explosive mixtures at temperatures above the flashpoint. Use water spray to keep fire-exposed containers cool. Containers may explode in the heat of a fire. Extinguishing Media: For small fires, use dry chemical, carbon dioxide, water spray or alcohol-resistant foam. For large fires, use water spray, fog, or alcohol-resistant foam. Use water spray to cool fire-exposed containers. Water may be ineffective. Do NOT use straight streams of water. Flash Point: 16.6 deg C ( 61.88 deg F) Autoignition Temperature: 363 deg C ( 685.40 deg F) Explosion Limits, Lower:3.3 vol % Upper: 19.0 vol % NFPA Rating: (estimated) Health: 2; Flammability: 3; Instability: 0
Section 6 - Accidental Release Measures
General Information: Use proper personal protective equipment as indicated in Section 8. Spills/Leaks: Absorb spill with inert material (e.g. vermiculite, sand or earth), then place in suitable container. Remove all sources of ignition. Use a spark-proof tool. Provide ventilation. A vapor suppressing foam may be used to reduce vapors.
Section 7 - Handling and Storage
Handling: Wash thoroughly after handling. Use only in a well-ventilated area. Ground and bond containers when transferring material. Use spark-proof tools and explosion proof equipment. Avoid contact with eyes, skin, and clothing. Empty containers retain product residue, (liquid and/or vapor), and can be dangerous. Keep container tightly closed. Avoid contact with heat, sparks and flame. Avoid ingestion and inhalation. Do not pressurize, cut, weld, braze, solder, drill, grind, or expose empty containers to heat, sparks or open flames. Storage: Keep away from heat, sparks, and flame. Keep away from sources of ignition. Store in a tightly closed container. Keep from contact with oxidizing materials. Store in a cool, dry, well-ventilated area away from incompatible substances. Flammables-area. Do not store near perchlorates, peroxides, chromic acid or nitric acid.
Section 8 - Exposure Controls, Personal Protection
Engineering Controls: Use explosion-proof ventilation equipment. Facilities storing or utilizing this material should be equipped with an eyewash facility and a safety shower. Use adequate general or local exhaust ventilation to keep airborne concentrations below the permissible exposure limits. Exposure Limits
Chemical Name ACGIH NIOSH OSHA - Final PELs
Ethyl alcohol 1000 ppm TWA 1000 ppm TWA; 1900 mg/m3 TWA 3300 ppm IDLH 1000 ppm TWA; 1900 mg/m3 TWA
Water none listed none listed none listed
OSHA Vacated PELs: Ethyl alcohol: 1000 ppm TWA; 1900 mg/m3 TWA Water: No OSHA Vacated PELs are listed for this chemical. Personal Protective Equipment Eyes: Wear appropriate protective eyeglasses or chemical safety goggles as described by OSHA's eye and face protection regulations in 29 CFR 1910.133 or European Standard EN166. Skin: Wear appropriate protective gloves to prevent skin exposure. Clothing: Wear appropriate protective clothing to prevent skin exposure. Respirators: A respiratory protection program that meets OSHA's 29 CFR 1910.134 and ANSI Z88.2 requirements or European Standard EN 149 must be followed whenever workplace conditions warrant a respirator's use.
Section 9 - Physical and Chemical Properties

Section 9 - Physical and Chemical Properties
Physical State: Clear liquid Appearance: colorless Odor: Mild, rather pleasant, like wine or whis pH: Not available. Vapor Pressure: 59.3 mm Hg @ 20 deg C Vapor Density: 1.59 Evaporation Rate:Not available. Viscosity: 1.200 cP @ 20 deg C Boiling Point: 78 deg C Freezing/Melting Point:-114.1 deg C Decomposition Temperature:Not available. Solubility: Miscible. Specific Gravity/Density:0.790 @ 20°C Molecular Formula:C2H5OH Molecular Weight:46.0414
Section 10 - Stability and Reactivity
Chemical Stability: Stable under normal temperatures and pressures. Conditions to Avoid: Incompatible materials, ignition sources, excess heat, oxidizers. Incompatibilities with Other Materials: Strong oxidizing agents, acids, alkali metals, ammonia, hydrazine, peroxides, sodium, acid anhydrides, calcium hypochlorite, chromyl chloride, nitrosyl perchlorate, bromine pentafluoride, perchloric acid, silver nitrate, mercuric nitrate, potassium-tert-butoxide, magnesium perchlorate, acid chlorides, platinum, uranium hexafluoride, silver oxide, iodine heptafluoride, acetyl bromide, disulfuryl difluoride, tetrachlorosilane + water, acetyl chloride, permanganic acid, ruthenium (VIII) oxide, uranyl perchlorate, potassium dioxide. Hazardous Decomposition Products: Carbon monoxide, irritating and toxic fumes and gases, carbon dioxide. Hazardous Polymerization: Will not occur.
Section 11 - Toxicological Information
RTECS#: CAS# 64-17-5: KQ6300000 CAS# 7732-18-5: ZC0110000 LD50/LC50:CAS# 64-17-5:Draize test, rabbit, eye: 500 mg Severe;Draize test, rabbit, eye: 500 mg/24H Mild;Draize test, rabbit, skin: 20 mg/24H Moderate;Inhalation, mouse: LC50 = 39 gm/m3/4H;Inhalation, rat: LC50 = 20000 ppm/10H;Oral, mouse: LD50 = 3450 mg/kg;Oral, rabbit: LD50 = 6300 mg/kg;Oral, rat: LD50 = 9000 mg/kg;Oral, rat: LD50 = 7060 mg/kg;
CAS# 7732-18-5:Oral, rat: LD50 = >90 mL/kg;
Carcinogenicity:CAS# 64-17-5: ACGIH: A4 - Not Classifiable as a Human Carcinogen CAS# 7732-18-5: Not listed by ACGIH, IARC, NIOSH, NTP, or OSHA. Epidemiology: Ethanol has been shown to produce fetotoxicity in the embry o or fetus of laboratory animals. Prenatal exposure to ethanol is associated with a distinct pattern of co ngenital malformations that have collecetively been termed the "fetal alcohol syndrome". Teratogenicity: Oral, Human - woman: TDLo = 41 gm/kg (female 41 week(s) after conception) Effects on Newborn - Apgar score (human only) and Effects on Newborn - other neonatal measures or effects and Effects on Newborn - drug dependence. Reproductive Effects: Intrauterine, Human - woman: TDLo = 200 mg/kg (female 5 day(s) pre-mating) Fertility - female fertility index (e.g. # females pregnant per # sperm positive females; # females pregnant per # females mated). Neurotoxicity: No information available. Mutagenicity: DNA Inhibition: Human, Lymphocyte = 220 mmol/L.; Cytogenetic Analysis: Human, Lymphocyte = 1160 gm/L.; Cytogenetic Analysis: Human, Fibroblast = 12000 ppm.; Cytogenetic Analysis: Human, Leukocyte = 1 pph/72H

gm/L.; Cytogenetic Analysis: Human, Fibroblast = 12000 ppm.; Cytogenetic Analysis: Human, Leukocyte = 1 pph/72H (Continuous).; Sister Chromatid Exchange: Human, Lymphocyte = 500 ppm/72H (Continuous). Other Studies: Standard Draize Test(Skin, rabbit) = 20 mg/24H (Moderate) S tandard Draize Test: Administration into the eye (rabbit) = 500 mg (Severe).
Section 12 - Ecological Information
Ecotoxicity: Fish: Rainbow trout: LC50 = 12900-15300 mg/L; 96 Hr; Flow-through @ 24-24.3°C Rainbow trout: LC50 = 11200 mg/L; 24 Hr; Fingerling (Unspecified) ria: Phytobacterium phosphoreum: EC50 = 34900 mg/L; 5-30 min; Microtox test When spilled on land it is apt to volatilize, biodegrade, and leach into the ground water, but no data on the rates of these processes could be found. Its fate in ground water is unknown. When released into water it will volatilize and probably biodegrade. It would not be expected to adsorb to sediment or bioconcentrate in fish. Environmental: When released to the atmosphere it will photodegrade in hours (polluted urban atmosphere) to an estimated range of 4 to 6 days in less polluted areas. Rainout should be significant. Physical: No information available. Other: No information available.
Section 13 - Disposal Considerations
Chemical waste generators must determine whether a discarded chemical is classified as a hazardous waste. US EPA guidelines for the classification determination are listed in 40 CFR Parts 261.3. Additionally, waste generators must consult state and local hazardous waste regulations to ensure complete and accurate classification. RCRA P-Series: None listed. RCRA U-Series: None listed.
Section 14 - Transport Information
US DOT IATA RID/ADR IMO Canada TDG
Shipping Name: ETHANOL No information available.
Hazard Class: 3
UN Number: UN1170
Packing Group: II
Section 15 - Regulatory Information
US FEDERAL
TSCA CAS# 64-17-5 is listed on the TSCA inventory. CAS# 7732-18-5 is listed on the TSCA inventory. Health & Safety Reporting ListNone of the chemicals are on the Health & Safety Reporting List. Chemical Test RulesNone of the chemicals in this product are under a Chemical Test Rule. Section 12bNone of the chemicals are listed under TSCA Section 12b. TSCA Significant New Use RuleNone of the chemicals in this material have a SNUR under TSCA. SARA
CERCLA Hazardous Substances and corresponding RQsNone of the chemicals in this material have an RQ. SARA Section 302 Extremely Hazardous SubstancesNone of the chemicals in this product have a TPQ. SARA CodesCAS # 64-17-5: acute, chronic, flammable. Section 313No chemicals are reportable under Section 313. Clean Air Act:This material does not contain any hazardous air pollutants. This material does not contain any Class 1 Ozone depletors. This material does not contain any Class 2 Ozone depletors. Clean Water Act:

Clean Water Act:None of the chemicals in this product are listed as Hazardous Substances under the CWA. None of the chemicals in this product are listed as Priority Pollutants under the CWA. None of the chemicals in this product are listed as Toxic Pollutants under the CWA. OSHA:None of the chemicals in this product are considered highly hazardous by OSHA. STATECAS# 64-17-5 can be found on the following state right to know lists: California, New Jersey, Pennsylvania, Minnesota, Massachusetts. CAS# 7732-18-5 is not present on state lists from CA, PA, MN, MA, FL, or NJ. WARNING: This product contains Ethyl alcohol, a chemical known to the state of California to cause birth defects or other reproductive harm. California No Significant Risk Level: None of the chemicals in this product are listed.
European/International RegulationsEuropean Labeling in Accordance with EC DirectivesHazard Symbols:F Risk Phrases:R 11 Highly flammable.
Safety Phrases:S 16 Keep away from sources of ignition - No smoking. S 33 Take precautionary measures against static discharges. S 7 Keep container tightly closed. S 9 Keep container in a well-ventilated place.
WGK (Water Danger/Protection)CAS# 64-17-5: 0 CAS# 7732-18-5: No information available. Canada - DSL/NDSLCAS# 64-17-5 is listed on Canada's DSL List. CAS# 7732-18-5 is listed on Canada's DSL List. Canada - WHMISThis product has a WHMIS classification of B2, D2A, D2B. Canadian Ingredient Disclosure ListCAS# 64-17-5 is listed on the Canadian Ingredient Disclosure List.Exposure LimitsCAS# 64-17-5: OEL-AUSTRALIA:TWA 1000 ppm (1900 mg/m3) OEL-BELGIUM:TWA 1000 ppm (1880 mg/m3) OEL-CZECHOSLOVAKIA:TWA 1000 mg/m3;STEL 5000 mg/m3 OEL-DENMARK:TWA 1000 ppm (1900 mg/m3) OEL-FINLAND:TWA 1000 ppm(1900 mg/m3);STEL 1250 ppm (2400 mg/m3) OEL-FRANCE:TWA 1000 ppm (190 0 mg/m3);STEL 5000 pp OEL-GERMANY:TWA 1000 ppm (1900 mg/m3) OEL-HUNGARY:TWA 1000 mg/m3;STEL 3000 mg/m3 OEL-THE NETHERLANDS:TWA 1000 ppm (1900 mg/m3) OEL-THE PHILIPPINES:TWA 1000 ppm (1900 mg/m3) OEL-POLAND:TWA 1000 mg/m3 OEL-RUSSIA:STEL 1000 mg/m3 OEL-SWEDEN:TWA 1000 ppm (1900 mg/m3) OEL-SWITZERLAND:TWA 1000 ppm (1900 mg/m3) OEL-THAILAND:TWA 1000 ppm (1900 mg/m3) OEL-TURKEY:TWA 1000 ppm (1900 mg/m3) OEL-UNITED KINGDOM:TWA 1000 ppm (1900 mg/m3) JAN9 OEL IN BULGARIA, COLOMBIA, JORDAN, KOREA check ACGIH TLV OEL IN NEW ZEALAND, SINGAPORE, VIETNAM check ACGI TLV
Section 16 - Additional Information
MSDS Creation Date: 4/17/2001 Revision #1 Date: 4/17/2001
The information above is believed to be accurate and represents the best information currently available to us. However, we make no warranty of merchantability or any other warranty, express or implied, with respect to such information, and we assume no liability resulting from its use. Users should make their own investigations to determine the suitability of the information for their particular purposes. In no event shall Fisher be liable for any claims, losses, or damages of any third party or for lost profits or any special, indirect, incidental, consequential or exemplary damages, howsoever arising, even if Fisher has been advised of the possibility of such damages.

Material Safety Data SheetFerrous sulfate heptahydrate MSDS
Section 1: Chemical Product and Company Identification
Product Name: Ferrous sulfate heptahydrate
Catalog Codes: SLF2029, SLF1228
CAS#: 7782-63-0
RTECS: OD5525000
TSCA: TSCA 8(b) inventory: No products were found.
CI#: Not available.
Synonym:
Chemical Name: Ferric Sulfate Heptahydrate
Chemical Formula: FeSO4.7H2O
Contact Information:
Sciencelab.com, Inc.14025 Smith Rd.Houston, Texas 77396
US Sales: 1-800-901-7247International Sales: 1-281-441-4400
Order Online: ScienceLab.com
CHEMTREC (24HR Emergency Telephone), call:1-800-424-9300
International CHEMTREC, call: 1-703-527-3887
For non-emergency assistance, call: 1-281-441-4400
Section 2: Composition and Information on IngredientsComposition:
Name CAS # % by Weight
Ferrous sulfate heptahydrate 7782-63-0 100
Toxicological Data on Ingredients: Ferrous sulfate heptahydrate: ORAL (LD50): Acute: 1520 mg/kg [Mouse].
Section 3: Hazards Identification
Potential Acute Health Effects: Hazardous in case of skin contact (irritant), of eye contact (irritant), of ingestion, of inhalation.
Potential Chronic Health Effects:CARCINOGENIC EFFECTS: Not available.MUTAGENIC EFFECTS: Mutagenic for bacteria and/or yeast.TERATOGENIC EFFECTS: Not available.DEVELOPMENTAL TOXICITY: Not available.The substance is toxic to liver.The substance may be toxic to kidneys, cardiovascular system, central nervous system (CNS).Repeated or prolonged exposure to the substance can produce target organs damage.
Section 4: First Aid Measures
Eye Contact:
p. 1

Check for and remove any contact lenses. In case of contact, immediately flush eyes with plenty of water for atleast 15 minutes. Cold water may be used. Get medical attention.
Skin Contact:In case of contact, immediately flush skin with plenty of water. Cover the irritated skin with an emollient. Removecontaminated clothing and shoes. Cold water may be used.Wash clothing before reuse. Thoroughly clean shoesbefore reuse. Get medical attention.
Serious Skin Contact:Wash with a disinfectant soap and cover the contaminated skin with an anti-bacterial cream. Seek immediatemedical attention.
Inhalation:If inhaled, remove to fresh air. If not breathing, give artificial respiration. If breathing is difficult, give oxygen. Getmedical attention.
Serious Inhalation: Not available.
Ingestion:Do NOT induce vomiting unless directed to do so by medical personnel. Never give anything by mouth to anunconscious person. If large quantities of this material are swallowed, call a physician immediately. Loosen tightclothing such as a collar, tie, belt or waistband.
Serious Ingestion: Not available.
Section 5: Fire and Explosion Data
Flammability of the Product: Non-flammable.
Auto-Ignition Temperature: Not applicable.
Flash Points: Not applicable.
Flammable Limits: Not applicable.
Products of Combustion: Not available.
Fire Hazards in Presence of Various Substances: Not applicable.
Explosion Hazards in Presence of Various Substances:Risks of explosion of the product in presence of mechanical impact: Not available.Risks of explosion of the product in presence of static discharge: Not available.Explosive in presence of heat.
Fire Fighting Media and Instructions: Not applicable.
Special Remarks on Fire Hazards: Not available.
Special Remarks on Explosion Hazards: Not available.
Section 6: Accidental Release Measures
Small Spill:Use appropriate tools to put the spilled solid in a convenient waste disposal container. Finish cleaning byspreading water on the contaminated surface and dispose of according to local and regional authorityrequirements.
Large Spill:Use a shovel to put the material into a convenient waste disposal container. Finish cleaning by spreading wateron the contaminated surface and allow to evacuate through the sanitary system. Be careful that the product is not
p. 2

present at a concentration level above TLV. Check TLV on the MSDS and with local authorities.
Section 7: Handling and Storage
Precautions:Keep locked up.. Do not ingest. Do not breathe dust. Wear suitable protective clothing. In case of insufficientventilation, wear suitable respiratory equipment. If ingested, seek medical advice immediately and show thecontainer or the label. Avoid contact with skin and eyes. Keep away from incompatibles such as oxidizing agents,alkalis.
Storage:Hygroscopic. Air Sensitive. Keep container tightly closed. Keep container in a cool, well-ventilated area. Do notstore above 24°C (75.2°F).
Section 8: Exposure Controls/Personal Protection
Engineering Controls:Use process enclosures, local exhaust ventilation, or other engineering controls to keep airborne levels belowrecommended exposure limits. If user operations generate dust, fume or mist, use ventilation to keep exposure toairborne contaminants below the exposure limit.
Personal Protection:Splash goggles. Lab coat. Dust respirator. Be sure to use an approved/certified respirator or equivalent.Gloves.
Personal Protection in Case of a Large Spill:Splash goggles. Full suit. Dust respirator. Boots. Gloves. A self contained breathing apparatus should be usedto avoid inhalation of the product. Suggested protective clothing might not be sufficient; consult a specialistBEFORE handling this product.
Exposure Limits:TWA: 1 CEIL: 2Consult local authorities for acceptable exposure limits.
Section 9: Physical and Chemical Properties
Physical state and appearance: Solid.
Odor: Not available.
Taste: Not available.
Molecular Weight: 278.01 g/mole
Color: Blue to blue-green. (Light.)
pH (1% soln/water): Not available.
Boiling Point: Not available.
Melting Point: Not available.
Critical Temperature: Not available.
Specific Gravity: 1.898 (Water = 1)
Vapor Pressure: Not applicable.
Vapor Density: Not available.
p. 3

Volatility: Not available.
Odor Threshold: Not available.
Water/Oil Dist. Coeff.: Not available.
Ionicity (in Water): Not available.
Dispersion Properties: See solubility in water.
Solubility: Soluble in cold water.
Section 10: Stability and Reactivity Data
Stability: The product is stable.
Instability Temperature: Not available.
Conditions of Instability: Incompatibles
Incompatibility with various substances:Reactive with oxidizing agents, alkalis.Slightly reactive to reactive with moisture.
Corrosivity: Not available.
Special Remarks on Reactivity:Hygroscopic. Oxidizes when in contact with mositure to form ferric sulfate.Air SensitiveIncompatible with alkalies, soluble carbonates, Au and Ag salts, Pb acetate, lime water, KI, K, and Na tartrate, NaBorate, tannin, vegetable astringent infusions and decoctions.
Special Remarks on Corrosivity: Not available.
Polymerization: Will not occur.
Section 11: Toxicological Information
Routes of Entry: Inhalation. Ingestion.
Toxicity to Animals: Acute oral toxicity (LD50): 1520 mg/kg [Mouse].
Chronic Effects on Humans:MUTAGENIC EFFECTS: Mutagenic for bacteria and/or yeast.Causes damage to the following organs: liver.May cause damage to the following organs: kidneys, cardiovascular system, central nervous system (CNS).
Other Toxic Effects on Humans: Hazardous in case of skin contact (irritant), of ingestion, of inhalation.
Special Remarks on Toxicity to Animals:Lowest Published Lethal DoseLDL [Rat] - Route: Oral; Dose: 1389 mg/kg
Special Remarks on Chronic Effects on Humans:May affect genetic material (mutagenic).It is excreted in maternal milk in animal.
Special Remarks on other Toxic Effects on Humans:Acute Potential Health Effects:
p. 4

Skin: May cause skin irritation.Eyes: May cause eye irritation.Inhalation: May cause respiratory tract irritation.Ingestion: Harmful if swallowed. May cause gastrointestinal tract distrubances and irritation with nausea,vomiting, colic, constipation, diarrhea, black stool. May also affect behavior/Central Nervous System (somnolence-general depressed activity), respiration, cardiovascular system, liver, kidneys (pink urine discoloration).Chronic Potential Health Effects: Repeated exposure via ingestion may increase iron levels in the liver, andspleen. Damage may occur to spleen and liver.
Section 12: Ecological Information
Ecotoxicity: Not available.
BOD5 and COD: Not available.
Products of Biodegradation:Possibly hazardous short term degradation products are not likely. However, long term degradation products mayarise.
Toxicity of the Products of Biodegradation: The products of degradation are less toxic than the product itself.
Special Remarks on the Products of Biodegradation: Not available.
Section 13: Disposal Considerations
Waste Disposal:Waste must be disposed of in accordance with federal, state and local environmentalcontrol regulations.
Section 14: Transport Information
DOT Classification: Not a DOT controlled material (United States).
Identification: Not applicable.
Special Provisions for Transport: Not applicable.
Section 15: Other Regulatory Information
Federal and State Regulations:Connecticut carcinogen reporting list.: Ferrous sulfate heptahydrateIllinois toxic substances disclosure to employee act: Ferrous sulfate heptahydrateNew York release reporting list: Ferrous sulfate heptahydratePennsylvania RTK: Ferrous sulfate heptahydrateMassachusetts RTK: Ferrous sulfate heptahydrateMassachusetts spill list: Ferrous sulfate heptahydrateNew Jersey spill list: Ferrous sulfate heptahydrateLouisiana spill reporting: Ferrous sulfate heptahydrateCERCLA: Hazardous substances.: Ferrous sulfate heptahydrate: 1000 lbs. (453.6 kg)
Other Regulations: OSHA: Hazardous by definition of Hazard Communication Standard (29 CFR 1910.1200).
Other Classifications:
WHMIS (Canada): Not controlled under WHMIS (Canada).
DSCL (EEC):
p. 5

R36/38- Irritating to eyes and skin.S2- Keep out of the reach of children.S46- If swallowed, seek medical adviceimmediately and show this container or label.
HMIS (U.S.A.):
Health Hazard: 2
Fire Hazard: 0
Reactivity: 0
Personal Protection: E
National Fire Protection Association (U.S.A.):
Health: 2
Flammability: 0
Reactivity: 3
Specific hazard:
Protective Equipment:Gloves.Lab coat.Dust respirator. Be sure to use anapproved/certified respirator orequivalent.Splash goggles.
Section 16: Other Information
References: Not available.
Other Special Considerations: Not available.
Created: 10/09/2005 05:33 PM
Last Updated: 10/09/2005 05:33 PM
The information above is believed to be accurate and represents the best information currently available to us. However, wemake no warranty of merchantability or any other warranty, express or implied, with respect to such information, and weassume no liability resulting from its use. Users should make their own investigations to determine the suitability of theinformation for their particular purposes. In no event shall ScienceLab.com be liable for any claims, losses, or damages of anythird party or for lost profits or any special, indirect, incidental, consequential or exemplary damages, howsoever arising, evenif ScienceLab.com has been advised of the possibility of such damages.
p. 6

WILCLEAR MSDS REPORT (1)
Status: Current Status Date; 08/08/2003 Product Name: WILCLEAR® SODIUM LACTATE 60% SOLUTION, U.S.P. Current Company Information:
JRW Bioremediation, LLC 14321 W. 96TH TERRACE LENEXA, KS 66215.
Fax: 913-438-5554 Emergency: 913-438-5544 MSDS Prepared: 12/07/1994 MSDS Revised: 08/08/2003 Formula: CH3-CHOH-COONa Keyword: ORGANIC ACID SALT Stock Item(s): S-110-2 ************************************************************************************************************************ Physical/Chemical Characteristics Boiling Point: 105 ˚C Specific Gravity: 1.323 H20=1 @ 20˚C Vapor Density: Air=1 NA Evaporation Rate: NA Melt/Freeze Point: NA pH: 6.5-7.5 % Volatile: NA Vapor Pressure: NA Pour Point: NA Viscosity: 100cP @ 20˚C Molecular weight: 112.07 Solubility In Water: SOLUBLE Appearance/Odor: CLEAR AND COLORLESS LIQUID, ODORLESS Physical State: Liquid
************************************************************************************************************************ FIRE AND EXPLOSION DATA: Closed Cup Flash Pt.: NA Open cup Flash Point: NA
Auto Ignition: NA Fire Point: NA
LEL/LFL: NA UEL/UFL: NA
************************************************************************************************************************ DOT INFORMATION: DOT hazard class: NA Label: NA Proper shipping Name: WilClear® SODIUM LACTATE 60%
Page 1

WILCLEAR MSDS REPORT (1)
************************************************************************************************************************ COMPOSITION/INFORMATION ON INGREDIENTS Component Name: SODIUM LACTATE Product: Yes Percent: 60 CAS No.: 72-17-3 Exposure Limits
Limit Note: OSHA PPM: NA \ ACGIH PPM: NA \ OSHA STEL PPM: NA Component Name: WATER Percent: 40 CAS No.: 7732-18-5 Exposure Limits
Limit Note: OSHA PPM: NA \ ACGIH PPM: NA \ OSHA STEL PPM: NA ************************************************************************************************************************ HAZARDOUS INGREDIENTS/IDENTITY INFORMATION Hazardous Components OSHA PEL ACGIH TLV Other Limits % Recommended (optional) Specific Chemical Identity: Common Name(s) . None ************************************************************************************************************************ FIRE AND EXPLOSION HAZARD DATA Flash Point: NA Flammable Limits: NA LEL: NA UEL: NA Extinguishing Media: Water, Carbon Dioxide or Dry chemical. Special Fire Fighting procedures: Wear self-contained breathing apparatus. Unusual Fire and Explosion Hazards: Fire may produce irritating or toxic fumes. ************************************************************************************************************************ REACTIVITY DATA Stability: Stable. Conditions to Avoid: NA Incompatibility (Materials to Avoid): NA Hazardous Decomposition or Byproducts; NA Hazardous Polymerization: Will not occur. ************************************************************************************************************************ HEALTH HAZARD DATA Route(s) of Entry: Inhalation? Yes Skin? NA Ingestion? Yes Health Hazards (Acute and chronic): No specific data. Low order of toxicity. The chemical, physical, and toxicological properties have not been thoroughly investigated. Carcinogenicity: NTP? NA IARC Monographs? NA OSHA Regulated? NA TSCA Registered? Yes Signs and symptoms of Exposure: NA Medical Conditions Generally Aggravated by Exposure: NA
Page 2

WILCLEAR
MSDS REPORT (1)
Emergency and First Aid Procedures:
SKIN: In case of contact with skin, immediately wash with soap and water while removing contaminated clothing. EYE: In case of contact with eyes, immediately flush eyes with water for at least 15 minutes, liftin9 eyelids during flushing to facilitate irrigation. Get medical attention if necessary. INHALATION: If inhaled, remove person from contaminated atmosphere to fresh air
INGESTION: If swallowed, get medical attention. ************************************************************************************************************************PRECAUTIONS FOR SAFE HANDLING AND USE Steps to Be Taken in Case Material is Released or Spilled: Contain spill and place material in drum for disposal. Dispose of according to all local, state and federal regulations at an approved waste treatment facility. Precautions to Be Taken in Handling and Storing: Store in cool, dry area to preserve product quality. Other Precautions: NA ************************************************************************************************************************ CONTROL MEASURES/PERSONAL PROTECTIVE EQUIPMENT Respiratory Protection (Specify Type): None. Ventilation: General Ventilation: Is recommended. Local Exhaust: Is recommended. Other: NA Protective Gloves: Are recommended. Eye Protection: Is recommended. Other Protective Clothing or Equipment: NA Work/Hygienic Practices: NA END OF REPORT.
Page 3

MSDS Number: P5587 * * * * * Effective Date: 08/20/08 * * * * * Supercedes: 10/19/05
POTASSIUM BROMIDE
1. Product Identification
Synonyms: Bromide salt of potassiumCAS No.: 7758-02-3Molecular Weight: 119.00Chemical Formula: KBrProduct Codes:J.T. Baker: 2961, 2998Mallinckrodt: 0500, 0505
2. Composition/Information on Ingredients
Ingredient CAS No Percent Hazardous --------------------------------------- ------------ ------------ --------- Potassium Bromide 7758-02-3 100% Yes
3. Hazards Identification
Emergency Overview--------------------------WARNING! HARMFUL IF SWALLOWED OR INHALED. AFFECTS CENTRAL NERVOUS SYSTEM,BRAIN AND EYES. MAY CAUSE IRRITATION TO SKIN, EYES, AND RESPIRATORY TRACT.
SAF-T-DATA(tm) Ratings (Provided here for your convenience)-----------------------------------------------------------------------------------------------------------Health Rating: 2 - Moderate (Life)Flammability Rating: 0 - NoneReactivity Rating: 1 - SlightContact Rating: 2 - ModerateLab Protective Equip: GOGGLES; LAB COAT; VENT HOOD; PROPER GLOVESStorage Color Code: Green (General Storage)
POTASSIUM BROMIDE http://www.jtbaker.com/msds/englishhtml/P5587.htm
1 of 6 1/28/2009 3:43 PM

-----------------------------------------------------------------------------------------------------------
Potential Health Effects----------------------------------
Inhalation:Dust may cause irritation to the respiratory tract. Symptoms may include coughing, sore throat, and shortness ofbreath.Ingestion:May cause nausea, vomiting and abdominal pain. Ingestions are usually promptly rejected by vomiting, butsufficient absorption may occur to produce central nervous system, eye and brain effects. Symptoms may includeskin rash, blurred vision and other eye effects, drowsiness, irritability, dizziness, mania, hallucinations, and coma.Skin Contact:Dry material may cause mild irritation. Solutions may cause irritation, redness, pain, and skin burns.Eye Contact:May cause irritation, redness and pain.Chronic Exposure:Repeated or prolonged exposure by any route may cause skin rashes (bromaderma). Repeated ingestion of smallamounts may cause central nervous system depression, including depression, ataxia, psychoses, memory loss,irritability, and headache.Aggravation of Pre-existing Conditions:Persons suffering from debilitation, depression, alcoholism, neurological or psychological disorders may be moresusceptible to the effects of this compound.
4. First Aid Measures
Inhalation:Remove to fresh air. If not breathing, give artificial respiration. If breathing is difficult, give oxygen. Call aphysician.Ingestion:Induce vomiting immediately as directed by medical personnel. Never give anything by mouth to an unconsciousperson. Call a physician.Skin Contact:In case of contact, immediately flush skin with plenty of water for at least 15 minutes. Remove contaminatedclothing and shoes. Wash clothing before reuse. Call a physician.Eye Contact:Wash eyes with plenty of water for at least 15 minutes. Call a physician.
5. Fire Fighting Measures
Fire:Not considered to be a fire hazard.Explosion:Not considered to be an explosion hazard.Fire Extinguishing Media:Use any means suitable for extinguishing surrounding fire.Special Information:In the event of a fire, wear full protective clothing and NIOSH-approved self-contained breathing apparatus withfull facepiece operated in the pressure demand or other positive pressure mode.
6. Accidental Release Measures
Ventilate area of leak or spill. Wear appropriate personal protective equipment as specified in Section 8. Spills:Sweep up and containerize for reclamation or disposal. Vacuuming or wet sweeping may be used to avoid dust
POTASSIUM BROMIDE http://www.jtbaker.com/msds/englishhtml/P5587.htm
2 of 6 1/28/2009 3:43 PM

dispersal.
7. Handling and Storage
Keep in a tightly closed container, stored in a cool, dry, ventilated area. Protect against physical damage.Separate from incompatibilities. Containers of this material may be hazardous when empty since they retainproduct residues (dust, solids); observe all warnings and precautions listed for the product.
8. Exposure Controls/Personal Protection
Airborne Exposure Limits:None established.Ventilation System:A system of local and/or general exhaust is recommended to keep employee exposures as low as possible. Localexhaust ventilation is generally preferred because it can control the emissions of the contaminant at its source,preventing dispersion of it into the general work area. Please refer to the ACGIH document, IndustrialVentilation, A Manual of Recommended Practices, most recent edition, for details.Personal Respirators (NIOSH Approved):For conditions of use where exposure to dust or mist is apparent and engineering controls are not feasible, aparticulate respirator (NIOSH type N95 or better filters) may be worn. If oil particles (e.g. lubricants, cuttingfluids, glycerine, etc.) are present, use a NIOSH type R or P filter. For emergencies or instances where theexposure levels are not known, use a full-face positive-pressure, air-supplied respirator. WARNING:Air-purifying respirators do not protect workers in oxygen-deficient atmospheres.Skin Protection:Wear protective gloves and clean body-covering clothing.Eye Protection:Use chemical safety goggles. Maintain eye wash fountain and quick-drench facilities in work area.
9. Physical and Chemical Properties
Appearance:White crystals.Odor:Odorless.Solubility:70g/100g water @ 25C (77F).Specific Gravity:2.75 @ 25CpH:Aqueous solution is neutral.% Volatiles by volume @ 21C (70F):0Boiling Point:1435C (2615F)Melting Point:730C (1346F)Vapor Density (Air=1):No information found.Vapor Pressure (mm Hg):No information found.Evaporation Rate (BuAc=1):No information found.
POTASSIUM BROMIDE http://www.jtbaker.com/msds/englishhtml/P5587.htm
3 of 6 1/28/2009 3:43 PM

10. Stability and Reactivity
Stability:Stable under ordinary conditions of use and storage.Hazardous Decomposition Products:Oxides of the contained metal and halogen, possibly also free, or ionic halogen.Hazardous Polymerization:Will not occur.Incompatibilities:For Potassium Bromide: Strong oxidizers, acids, and bromine trifluoride.Conditions to Avoid:Incompatibles.
11. Toxicological Information
Potassium bromide: oral rat LD50: 3070 mg/kg; investigated as a mutagen.
--------\Cancer Lists\------------------------------------------------------ ---NTP Carcinogen--- Ingredient Known Anticipated IARC Category ------------------------------------ ----- ----------- ------------- Potassium Bromide (7758-02-3) No No None
12. Ecological Information
Environmental Fate:No information found.Environmental Toxicity:No information found.
13. Disposal Considerations
Whatever cannot be saved for recovery or recycling should be managed in an appropriate and approved wastedisposal facility. Processing, use or contamination of this product may change the waste management options.State and local disposal regulations may differ from federal disposal regulations. Dispose of container and unusedcontents in accordance with federal, state and local requirements.
14. Transport Information
Not regulated.
15. Regulatory Information --------\Chemical Inventory Status - Part 1\--------------------------------- Ingredient TSCA EC Japan Australia ----------------------------------------------- ---- --- ----- --------- Potassium Bromide (7758-02-3) Yes Yes Yes Yes --------\Chemical Inventory Status - Part 2\--------------------------------- --Canada-- Ingredient Korea DSL NDSL Phil.
POTASSIUM BROMIDE http://www.jtbaker.com/msds/englishhtml/P5587.htm
4 of 6 1/28/2009 3:43 PM

----------------------------------------------- ----- --- ---- ----- Potassium Bromide (7758-02-3) Yes Yes No Yes --------\Federal, State & International Regulations - Part 1\---------------- -SARA 302- ------SARA 313------ Ingredient RQ TPQ List Chemical Catg. ----------------------------------------- --- ----- ---- -------------- Potassium Bromide (7758-02-3) No No No No --------\Federal, State & International Regulations - Part 2\---------------- -RCRA- -TSCA- Ingredient CERCLA 261.33 8(d) ----------------------------------------- ------ ------ ------ Potassium Bromide (7758-02-3) No No No Chemical Weapons Convention: No TSCA 12(b): No CDTA: NoSARA 311/312: Acute: Yes Chronic: Yes Fire: No Pressure: NoReactivity: No (Pure / Solid)
Australian Hazchem Code: None allocated.Poison Schedule: None allocated.WHMIS:This MSDS has been prepared according to the hazard criteria of the Controlled Products Regulations (CPR) andthe MSDS contains all of the information required by the CPR.
16. Other Information
NFPA Ratings: Health: 2 Flammability: 0 Reactivity: 0Label Hazard Warning:WARNING! HARMFUL IF SWALLOWED OR INHALED. AFFECTS CENTRAL NERVOUS SYSTEM,BRAIN AND EYES. MAY CAUSE IRRITATION TO SKIN, EYES, AND RESPIRATORY TRACT.Label Precautions:Avoid breathing dust.Keep container closed.Use with adequate ventilation.Avoid contact with eyes, skin and clothing.Wash thoroughly after handling.Label First Aid:If swallowed, induce vomiting immediately as directed by medical personnel. Never give anything by mouth toan unconscious person. If inhaled, remove to fresh air. If not breathing, give artificial respiration. If breathing isdifficult, give oxygen. In case of contact, immediately flush eyes or skin with plenty of water for at least 15minutes. In all cases call a physician.Product Use:Laboratory Reagent.Revision Information:No Changes.Disclaimer:************************************************************************************************Mallinckrodt Baker, Inc. provides the information contained herein in good faith but makes norepresentation as to its comprehensiveness or accuracy. This document is intended only as a guide to theappropriate precautionary handling of the material by a properly trained person using this product.Individuals receiving the information must exercise their independent judgment in determining itsappropriateness for a particular purpose. MALLINCKRODT BAKER, INC. MAKES NOREPRESENTATIONS OR WARRANTIES, EITHER EXPRESS OR IMPLIED, INCLUDING WITHOUTLIMITATION ANY WARRANTIES OF MERCHANTABILITY, FITNESS FOR A PARTICULARPURPOSE WITH RESPECT TO THE INFORMATION SET FORTH HEREIN OR THE PRODUCT TOWHICH THE INFORMATION REFERS. ACCORDINGLY, MALLINCKRODT BAKER, INC. WILLNOT BE RESPONSIBLE FOR DAMAGES RESULTING FROM USE OF OR RELIANCE UPON THIS
POTASSIUM BROMIDE http://www.jtbaker.com/msds/englishhtml/P5587.htm
5 of 6 1/28/2009 3:43 PM

INFORMATION.************************************************************************************************Prepared by: Environmental Health & SafetyPhone Number: (314) 654-1600 (U.S.A.)
POTASSIUM BROMIDE http://www.jtbaker.com/msds/englishhtml/P5587.htm
6 of 6 1/28/2009 3:43 PM

UNIVAR USA - MSDS file:///C:/Documents%20and%20Settings/jlanzon/Local%20Settings/Temporary%20Internet%...
1 of 7 7/2/2008 10:19 AM
Univar USA Inc.17425 NE Union Hill RoadRedmond, WA 98052(425) 889-3400
For Emergency Assistance involving chemicals call - CHEMTREC (800) 424-9300===============================================================================
The Version Date and Number for this MSDS is : 08/18/2006 - #006 PRODUCT NAME: SODIUM SULFATE ANHYDROUS MSDS NUMBER: MZS5018 DATE ISSUED: 6/12/2005 SUPERSEDES: 6/30/2003 ISSUED BY: 008614 MSDS MATERIAL SAFETY DATA SHEET CHEMTREC: 800-424-9300 (USA) ============================================================================== SODIUM SULFATE ANHYDROUS ============================================================================== 1. PRODUCT IDENTIFICATION SYNONYMS: DISODIUM SULFATE; SODIUM SULFATE ANHYDROUS; SULFURIC ACID, DISODIUM SALT; SODIUM SULFATE; SPEED-DRY CAS NO: 7757-82-6 MOLECULAR WEIGHT: 142.04 CHEMICAL FORMULA: NA2 SO4 Distributed by: Univar USA Inc. 17425 NE Union Hill Road Redmond, WA 98052 425-889-3400

UNIVAR USA - MSDS file:///C:/Documents%20and%20Settings/jlanzon/Local%20Settings/Temporary%20Internet%...
2 of 7 7/2/2008 10:19 AM
============================================================================== 2. COMPOSITION/INFORMATION ON INGREDIENTS INGREDIENT CAS NO PERCENT HAZARDOUS --------------------------------------- ------------ ----------- -------- SODIUM SULFATE 7757-82-6 90 - 100% YES ============================================================================== 3. HAZARDS IDENTIFICATION EMERGENCY OVERVIEW ------------------ AS PART OF GOOD INDUSTRIAL AND PERSONAL HYGIENE AND SAFETY PROCEDURE, AVOID ALL UNNECESSARY EXPOSURE TO THE CHEMICAL SUBSTANCE AND ENSURE PROMPT REMOVAL FROM SKIN, EYES AND CLOTHING. POTENTIAL HEALTH EFFECTS ------------------------ INHALATION: NOT EXPECTED TO BE A HEALTH HAZARD. INGESTION: MILDLY TOXIC BY INGESTION. SLOWLY ABSORBED FROM THE ALIMENTARY TRACT. BECAUSE OF OSMOTIC ACTIVITY, IT WILL DRAW WATER INTO THE LUMEN OF THE BOWEL AND MAY CAUSE PURGING, FLUID LOSS, BLOOD IN STOOLS, FALL OF BLOOD PRESSURE, AND HIGH SODIUM LEVELS IN THE BLOOD. SKIN CONTACT: NO ADVERSE EFFECTS EXPECTED. EYE CONTACT: NO ADVERSE EFFECTS EXPECTED BUT DUST MAY CAUSE MECHANICAL IRRITATION. CHRONIC EXPOSURE: NO INFORMATION FOUND. AGGRAVATION OF PRE-EXISTING CONDITIONS: NO INFORMATION FOUND. ============================================================================== 4. FIRST AID MEASURES INHALATION: NOT EXPECTED TO REQUIRE FIRST AID MEASURES. INGESTION: GIVE SEVERAL GLASSES OF WATER TO DRINK TO DILUTE. IF LARGE AMOUNTS WERE SWALLOWED, GET MEDICAL ADVICE.

UNIVAR USA - MSDS file:///C:/Documents%20and%20Settings/jlanzon/Local%20Settings/Temporary%20Internet%...
3 of 7 7/2/2008 10:19 AM
SKIN CONTACT: WASH EXPOSED AREA WITH SOAP AND WATER. GET MEDICAL ADVICE IF IRRITATION DEVELOPS. EYE CONTACT: WASH THOROUGHLY WITH RUNNING WATER. GET MEDICAL ADVICE IF IRRITATION DEVELOPS. ============================================================================== 5. FIRE FIGHTING MEASURES FIRE: NOT CONSIDERED TO BE A FIRE HAZARD. EXPLOSION: NOT CONSIDERED TO BE AN EXPLOSION HAZARD, BUT VIOLENT EXPLOSIONS OCCUR WHEN POTASSIUM SULFATE AND SODIUM SULFATE ARE MELTED WITH ALUMINUM. FIRE EXTINGUISHING MEDIA: USE ANY MEANS SUITABLE FOR EXTINGUISHING SURROUNDING FIRE. SPECIAL INFORMATION: USE PROTECTIVE CLOTHING AND BREATHING EQUIPMENT APPROPRIATE FOR THE SURROUNDING FIRE. ============================================================================== 6. ACCIDENTAL RELEASE MEASURES VENTILATE AREA OF LEAK OR SPILL. WEAR APPROPRIATE PERSONAL PROTECTIVE EQUIPMENT AS SPECIFIED IN SECTION 8. SPILLS: SWEEP UP AND CONTAINERIZE FOR RECLAMATION OR DISPOSAL. VACUUMING OR WET SWEEPING MAY BE USED TO AVOID DUST DISPERSAL. ============================================================================== 7. HANDLING AND STORAGE KEEP IN A TIGHTLY CLOSED CONTAINER, STORED IN A COOL, DRY, VENTILATED AREA. PROTECT AGAINST PHYSICAL DAMAGE. ISOLATE FROM INCOMPATIBLE SUBSTANCES. CONTAINERS OF THIS MATERIAL MAY BE HAZARDOUS WHEN EMPTY SINCE THEY RETAIN PRODUCT RESIDUES (DUST, SOLIDS); OBSERVE ALL WARNINGS AND PRECAUTIONS LISTED FOR THE PRODUCT. ============================================================================== 8. EXPOSURE CONTROLS/PERSONAL PROTECTION AIRBORNE EXPOSURE LIMITS:

UNIVAR USA - MSDS file:///C:/Documents%20and%20Settings/jlanzon/Local%20Settings/Temporary%20Internet%...
4 of 7 7/2/2008 10:19 AM
NONE ESTABLISHED. VENTILATION SYSTEM: IN GENERAL, DILUTION VENTILATION IS A SATISFACTORY HEALTH HAZARD CONTROL FOR THIS SUBSTANCE. HOWEVER, IF CONDITIONS OF USE CREATE DISCOMFORT TO THE WORKER, A LOCAL EXHAUST SYSTEM SHOULD BE CONSIDERED. PERSONAL RESPIRATORS (NIOSH APPROVED): FOR CONDITIONS OF USE WHERE EXPOSURE TO DUST OR MIST IS APPARENT AND ENGINEERING CONTROLS ARE NOT FEASIBLE, A PARTICULATE RESPIRATOR (NIOSH TYPE N95 OR BETTER FILTERS) MAY BE WORN. IF OIL PARTICLES (E.G. LUBRICANTS, CUTTING FLUIDS, GLYCERINE, ETC.) ARE PRESENT, USE A NIOSH TYPE R OR P FILTER. FOR EMERGENCIES OR INSTANCES WHERE THE EXPOSURE LEVELS ARE NOT KNOWN, USE A FULL-FACE POSITIVE-PRESSURE, AIR-SUPPLIED RESPIRATOR. WARNING: AIR-PURIFYING RESPIRATORS DO NOT PROTECT WORKERS IN OXYGEN-DEFICIENT ATMOSPHERES. SKIN PROTECTION: WEAR PROTECTIVE GLOVES AND CLEAN BODY-COVERING CLOTHING. EYE PROTECTION: USE CHEMICAL SAFETY GOGGLES. MAINTAIN EYE WASH FOUNTAIN AND QUICK-DRENCH FACILITIES IN WORK AREA. ============================================================================== 9. PHYSICAL AND CHEMICAL PROPERTIES APPEARANCE: BOILING POINT: FINE WHITE CRYSTALLINE GRANULES. NO INFORMATION FOUND. ODOR: MELTING POINT: ODORLESS. 844C (1551F) SOLUBILITY: VAPOR DENSITY (AIR=1): SOLUBLE IN APPROX. 3.6 PARTS NO INFORMATION FOUND. WATER, 1 IN 2 PARTS MAXIMUM @ 33C (91F). DENSITY: VAPOR PRESSURE (MM HG): 2.68 NO INFORMATION FOUND. PH: EVAPORATION RATE (BUAC=1): NO INFORMATION FOUND. NO INFORMATION FOUND. % VOLATILES BY VOLUME @ 21C (70F): 0 ============================================================================== 10. STABILITY AND REACTIVITY

UNIVAR USA - MSDS file:///C:/Documents%20and%20Settings/jlanzon/Local%20Settings/Temporary%20Internet%...
5 of 7 7/2/2008 10:19 AM
STABILITY: STABLE IN TIGHTLY CLOSED CONTAINERS UNDER NORMAL CONDITIONS OF STORAGE. HAZARDOUS DECOMPOSITION PRODUCTS: OXIDES OF SULFUR AND SODIUM MAY FORM WHEN HEATED TO DECOMPOSITION. HAZARDOUS POLYMERIZATION: WILL NOT OCCUR. INCOMPATIBILITIES: IN COMBINATION WITH SODIUM SULFATE, ALUMINUM AND MAGNESIUM WILL EXPLODE @ 800C (1472F); STRONG MINERAL ACIDS AND BASES. CONDITIONS TO AVOID: AIR, MOISTURE, AND INCOMPATIBLES. ============================================================================== 11. TOXICOLOGICAL INFORMATION NO LD50/LC50 INFORMATION FOUND RELATING TO NORMAL ROUTES OF OCCUPATIONAL EXPOSURE. INVESTIGATED AS A TUMORIGEN, MUTAGEN, REPRODUCTIVE EFFECTOR. --------/CANCER LISTS/----------------------------------------------------- ---NTP CARCINOGEN--- INGREDIENT KNOWN ANTICIPATED IARC CATEGORY ------------------------------------ ----- ----------- ------------ SODIUM SULFATE (7757-82-6) NO NO NONE ============================================================================== 12. ECOLOGICAL INFORMATION ENVIRONMENTAL FATE: WHEN RELEASED INTO THE SOIL, THIS MATERIAL IS EXPECTED TO LEACH INTO GROUNDWATER. THIS MATERIAL IS NOT EXPECTED TO SIGNIFICANTLY BIOACCUMULATE. ENVIRONMENTAL TOXICITY: THIS MATERIAL IS NOT EXPECTED TO BE TOXIC TO AQUATIC LIFE. THE LC50/96-HOUR VALUES FOR FISH ARE OVER 100 MG/L. THE EC50/48-HOUR VALUES FOR DAPHNIA ARE OVER 100 MG/L. ============================================================================== 13. DISPOSAL CONSIDERATIONS WHATEVER CANNOT BE SAVED FOR RECOVERY OR RECYCLING SHOULD BE MANAGED IN AN APPROPRIATE AND APPROVED WASTE DISPOSAL FACILITY. PROCESSING, USE OR CONTAMINATION OF THIS PRODUCT MAY CHANGE THE WASTE MANAGEMENT OPTIONS. STATE AND LOCAL DISPOSAL REGULATIONS MAY DIFFER FROM FEDERAL DISPOSAL

UNIVAR USA - MSDS file:///C:/Documents%20and%20Settings/jlanzon/Local%20Settings/Temporary%20Internet%...
6 of 7 7/2/2008 10:19 AM
REGULATIONS. DISPOSE OF CONTAINER AND UNUSED CONTENTS IN ACCORDANCE WITH FEDERAL, STATE AND LOCAL REQUIREMENTS. ============================================================================== 14. TRANSPORT INFORMATION NOT REGULATED. ============================================================================== 15. REGULATORY INFORMATION --------/CHEMICAL INVENTORY STATUS - PART 1/------------------------------- INGREDIENT TSCA EC JAPAN AUSTRALIA ----------------------------------------------- ---- --- ----- -------- SODIUM SULFATE (7757-82-6) YES YES YES YES --------/CHEMICAL INVENTORY STATUS - PART 2/------------------------------- --CANADA-- INGREDIENT KOREA DSL NDSL PHIL. ----------------------------------------------- ----- --- ---- ----- SODIUM SULFATE (7757-82-6) YES YES NO YES -------/FEDERAL, STATE & INTERNATIONAL REGULATIONS - PART 1/--------------- -SARA 302- ------SARA 313----- INGREDIENT RQ TPQ LIST CHEMICAL CATG ---------------------------------------- --- ----- ---- ------------- SODIUM SULFATE (7757-82-6) NO NO NO NO --------/FEDERAL, STATE & INTERNATIONAL REGULATIONS - PART 2/-------------- -RCRA- -TSCA- INGREDIENT CERCLA 261.33 8(D) ----------------------------------------- ------ ------ --- SODIUM SULFATE (7757-82-6) NO NO NO CHEMICAL WEAPONS CONVENTION: NO TSCA 12(B): NO CDTA: NO SARA 311/312: ACUTE: NO CHRONIC: NO FIRE: NO PRESSURE: NO REACTIVITY: NO (PURE / SOLID) AUSTRALIAN HAZCHEM CODE: NONE ALLOCATED. POISON SCHEDULE: NONE ALLOCATED. WHMIS: THIS MSDS HAS BEEN PREPARED ACCORDING TO THE HAZARD CRITERIA OF THE CONTROLLED PRODUCTS REGULATIONS (CPR) AND THE MSDS CONTAINS ALL OF THE INFORMATION REQUIRED BY THE CPR. ==============================================================================

UNIVAR USA - MSDS file:///C:/Documents%20and%20Settings/jlanzon/Local%20Settings/Temporary%20Internet%...
7 of 7 7/2/2008 10:19 AM
16. OTHER INFORMATION NFPA RATINGS: HEALTH: 1 FLAMMABILITY: 0 REACTIVITY: 0
For Additional Information:Contact: MSDS Coordinator - Univar USADuring business hours, Pacific Time - (425) 889-3400
NOTICEUnivar USA expressly disclaims all express or implied warranties of merchantibility and fitnessfor a particular purpose with respect to the product or information provided herein, and shallunder no circumstances be liable for incidental or consequential damages.
Do not use ingredient information and/or ingredient percentages in this MSDS as a productspecification. For product specification information refer to a Product Specification Sheet and/ora Certificate of Analysis. These can be obtained from your local Univar USA Sales Office.
All information appearing herein is based upon data obtained from the manufacturer and/orrecognized technical sources. While the information is believed to be accurate, Univar USAmakes no representations as to its accuracy or sufficiency. Conditions of use are beyond Univar USA's control. Therefore, users are responsible to verify this data under their own operatingconditions to determine whether the product is suitable for their particular purposes, and theyassume all risks of their use, handling, and disposal of the product or from the publication or useof, or reliance upon, information contained herein. This information relates only to the productdesignated herein and does not relate to its use in combination with any other material or in anyother process.
END OF MSDS

APPENDIX A-5
COLUMN STUDY ANALYTICAL RESULTS

APPENDIX A-5
COLUMN STUDY ANALYTICAL RESULTS
COLUMN STUDYAvon Park Air Force Range
Avon Park, Florida
Compound 11/15/2006 11/21/2006 11/23/2006 12/2/2006 12/7/2006 12/9/2006 12/12/2006 12/14/2006 11/15/2006 11/21/2006 11/23/2006 12/2/2006 12/7/2006 12/9/2006 12/12/2006 12/14/2006Sulfate 346.200 390.590 251.830 4.710 13.220 4.520 5.120 4.840 382.430 392.320 331.350 4.730 18.090 4.500 5.010 7.320Bromide 451.240 363.430 561.770 289.300 562.070 566.540 552.150 538.230 478.660 485.280 564.600 378.030 565.870 568.830 572.940 530.890Chloride 451.240 363.430 561.770 289.300 562.070 566.540 552.120 538.230 478.660 485.280 564.400 378.030 565.870 568.830 572.940 530.890Thiosulfate 0.000 0.000 0.514 2.946 0.000 0.000 0.000 0.000 0.000 0.000 0.454 4.250 0.000 0.000 0.000 0.000Arsenate 0.730 0.140 0.101 0.003 0.159 0.055 0.222 0.207 0.171 0.015 0.151 0.009 0.178 0.015 0.296 0.208Acetate 0.233 4.188 1.709 0.845 7.670 7.150 0.068 0.069 0.259 6.002 1.844 1.104 7.491 6.832 0.051 0.057
Compound 11/15/2006 11/21/2006 11/23/2006 12/2/2006 12/7/2006 12/9/2006 12/12/2006 12/14/2006 11/15/2006 11/21/2006 11/23/2006 12/2/2006 12/7/2006 12/9/2006 12/12/2006 12/14/2006Sulfate 391.900 392.860 269.630 4.940 8.560 4.480 5.290 6.690 387.080 393.110 240.910 4.870 7.090 6.490 7.250 6.490Bromide 497.510 402.760 565.740 192.420 565.490 569.910 556.000 533.240 493.710 360.100 566.400 229.540 566.530 573.330 556.570 539.910Chloride 497.510 402.760 565.740 192.420 565.490 569.910 556.000 533.240 493.710 360.100 566.400 229.540 566.530 573.330 556.570 539.910Thiosulfate 0.000 0.000 0.713 1.676 0.000 0.000 0.000 0.000 0.000 0.000 0.514 2.138 0.000 0.000 0.000 0.000Arsenate 0.070 0.016 0.118 0.034 0.145 0.016 0.182 0.229 0.035 0.016 0.071 0.062 0.235 0.013 0.176 0.184Acetate 0.229 4.567 1.791 0.768 7.084 7.256 0.035 0.048 0.292 4.329 1.651 1.154 6.622 6.982 0.036 0.061
Compound 11/15/2006 11/21/2006 11/23/2006 12/2/2006 12/7/2006 12/9/2006 12/12/2006 12/14/2006 11/15/2006 11/21/2006 11/23/2006 12/2/2006 12/7/2006 12/9/2006 12/12/2006 12/14/2006Sulfate 401.190 388.780 231.550 5.020 24.350 4.560 5.050 5.030 439.180 392.460 246.900 4.890 15.480 4.540 5.450 9.780Bromide 497.750 323.690 566.520 778.870 551.800 570.680 554.980 543.650 516.700 349.640 566.890 443.670 549.950 573.240 561.520 553.840Chloride 497.750 323.690 566.520 778.870 551.800 570.680 554.980 543.650 516.700 349.640 566.890 443.670 549.950 573.240 561.520 553.840Thiosulfate 0.000 0.000 12.277 0.000 0.000 0.000 0.000 0.000 0.000 0.650 7.558 0.000 0.000 0.000 0.000Arsenate 0.022 0.018 0.118 0.029 0.178 0.146 0.166 0.173 0.015 0.001 0.176 0.077 0.175 0.018 0.192 0.170Acetate 0.340 3.878 1.474 3.730 6.446 7.878 0.060 0.076 0.210 3.318 1.485 2.735 6.507 7.307 0.034 0.056
COL 1 ‐ Port 6
COL1 ‐ Port 1 COL 1 ‐ Port 2
COL 1 ‐ Port 3 COL 1 ‐ Port 4
COL 1 ‐ Port 5
Injection‐Leaching.xlsx Page 1 of 11 3/24/2009

APPENDIX A-5
AEROBIC LEACHING EXPERIMENT RESULTS - COLUMN 2
COLUMN STUDYAvon Park Air Force Range
Avon Park, Florida
Col 2 60 8.64 0.2114 ‐‐ ‐‐ 0.0005 336.1206 ‐‐ 0.140913 7.0574 603.6411 0.000070574 100.0Col 2 120 8.64 0.2186 0.0037 0.0027 ‐‐ 300.8796 0.0171 0.218951 12.8417 539.0613 0.000198991 100.0Col 2 180 8.64 0.198 ‐‐ ‐‐ ‐‐ 295.3017 0.0262 0.226315 14.016 520.7591 0.000339151 100.0Col 2 240 8.64 0.2179 ‐‐ 0.0007 ‐‐ 327.9158 0.5042 0.122438 1.4573 586.5031 0.000353724 100.0Col 2 300 8.64 0.2125 ‐‐ 0.0008 ‐‐ 323.7049 0.007 0.188319 6.6189 581.6449 0.000419913 100.0Col 2 360 8.64 0.218 ‐‐ ‐‐ ‐‐ 337.4518 0.0089 0.196075 5.5832 610.682 0.000475745 100.0Col 2 420 8.64 0.2123 ‐‐ 0.0013 ‐‐ 327.2628 0.6291 0.118037 0.258 593.562 0.000478325 100.0Col 2 480 8.64 0.2126 0.001 ‐‐ ‐‐ 314.4781 0.0283 0.209931 7.7506 572.4517 0.000555831 100.1Col 2 540 8.64 0.2116 ‐‐ ‐‐ ‐‐ 311.4237 0.3244 0.207535 5.1944 571.8644 0.000607775 100.1Col 2 600 8.64 0.1828 0.0002 0.002 ‐‐ 222.4213 0.3586 0.175161 7.7818 401.8953 0.000685593 100.1Col 2 660 8.64 0.2563 ‐‐ 0.0007 ‐‐ 301.1182 0.4737 0.201435 5.5177 554.2969 0.00074077 100.1Col 2 720 8.64 0.2396 ‐‐ ‐‐ ‐‐ 312.5335 0.5592 0.196598 3.6689 572.2894 0.000777459 100.1Col 2 780 8.64 0.2347 ‐‐ 0.0007 ‐‐ 301.4707 0.3297 0.208537 4.502 551.154 0.000822479 100.1Col 2 840 8.64 0.2189 ‐‐ 0.0008 ‐‐ 295.23 0.488 0.21211 4.639 539.8769 0.000868869 100.1Col 2 900 8.64 0.2763 ‐‐ 0.0009 ‐‐ 295.8182 0.5352 0.173418 11.2825 538.3082 0.000981694 100.1Col 2 960 8.64 0.269 ‐‐ 0.0006 ‐‐ 291.2252 1.3483 0.252806 13.1557 528.3678 0.001113251 100.1Col 2 1020 8.64 0.2168 ‐‐ 0.0007 ‐‐ 295.1432 0.376 0.253155 13.4463 533.7355 0.001247714 100.1Col 2 1080 8.64 0.2087 0.0007 ‐‐ ‐‐ 298.8781 0.6688 0.165793 12.7958 538.6943 0.001375672 100.1Col 2 1140 8.64 0.2093 ‐‐ 0.0005 ‐‐ 304.667 0.0382 0.162394 12.8382 547.9041 0.001504054 100.1Col 2 1200 8.64 0.2118 0.0003 0.0027 ‐‐ 266.4635 0.0228 0.460472 21.965 469.1438 0.001723704 100.1Col 2 1260 8.64 0.22 ‐‐ 0.0011 ‐‐ 311.2089 1.611 0.245443 5.9719 556.113 0.001783423 100.1Col 2 1320 8.64 0.2041 ‐‐ 0.0011 ‐‐ 303.4378 0.8139 0.024052 5.7333 541.0622 0.001840756 100.1Col 2 1380 8.64 0.2071 ‐‐ 0.0007 ‐‐ 292.0655 1.5372 0.118342 10.1716 507.2247 0.001942472 100.1Col 2 1440 8.64 0.1135 0.0012 0.0007 ‐‐ 193.5727 1.2442 0.132721 10.353 322.0613 0.002046002 100.2Col 2 1500 8.64 0.2718 0.0007 0.0046 ‐‐ 261.7411 1.4308 0.219343 6.8508 424.814 0.00211451 100.2Col 2 1560 8.64 0.2572 0.0007 0.006 ‐‐ 271.034 1.2753 0.209016 2.7859 433.2884 0.002142369 100.2Col 2 1620 8.64 0.2318 0.3108 ‐‐ 0.0051 258.1171 1.9127 0.146534 4.462 398.0684 0.002186989 100.2Col 2 1680 8.64 0.2002 0.3419 ‐‐ 0.0041 218.7988 1.3867 0.408055 19.7016 319.701 0.002384005 100.2Col 2 1740 8.67 0.2224 0.0039 0.0015 ‐‐ 243.7901 0.0068 0.510406 18.1456 347.995 0.002565461 100.2Col 2 1800 8.67 0.1979 0.0006 ‐‐ ‐‐ 242.8743 0.1296 0.299603 16.0301 331.6431 0.002725762 100.2Col 2 1860 8.67 0.2276 0.002 0.0012 ‐‐ 233.4249 0.0074 0.215029 15.8732 309.1522 0.002884494 100.2Col 2 1920 8.67 0.2073 ‐‐ 0.0011 ‐‐ 237.9784 ‐‐ 0.221522 15.4507 308.1212 0.003039001 100.2Col 2 1980 8.67 0.2283 0.0029 0.0018 ‐‐ 223.7861 0.0098 0.388534 16.0801 279.3281 0.003199802 100.2Col 2 2040 8.67 0.2162 0.0035 0.0014 ‐‐ 213.2935 0.3546 0.512323 21.371 261.5263 0.003413512 100.2Col 2 2100 8.67 0.2142 0.0019 0.0012 ‐‐ 208.4605 0.0094 0.415157 19.9782 243.2424 0.003613294 100.2Col 2 2160 8.67 0.2503 0.0069 0.0033 ‐‐ 196.738 0.0096 0.504698 23.4278 214.5569 0.003847572 100.2
Column #
Total Sulfate (g)Chloride (ppm)
Sulfate (ppm)
Arsenate (ppm)
Operational NotespH%As
remaining
Compound Name (units)
Time (mins.)
Fluoride (ppm)
Thiosulfate (ppm)
Phosphate (ppm)
Propionate (ppm)
Acetate (ppm)
Formate (ppm)
Injection‐Leaching.xlsx Page 2 of 11 3/24/2009

APPENDIX A-5
AEROBIC LEACHING EXPERIMENT RESULTS - COLUMN 2
COLUMN STUDYAvon Park Air Force Range
Avon Park, Florida
Column #
Total Sulfate (g)Chloride (ppm)
Sulfate (ppm)
Arsenate (ppm)
Operational NotespH%As
remaining
Compound Name (units)
Time (mins.)
Fluoride (ppm)
Thiosulfate (ppm)
Phosphate (ppm)
Propionate (ppm)
Acetate (ppm)
Formate (ppm)
Col 2 2220 8.67 0.2379 0.0034 0.0016 ‐‐ 210.5825 0.0136 0.208581 17.5596 223.5909 0.004023168 100.2Col 2 2280 8.67 0.2237 0.0026 0.0016 ‐‐ 202.7151 0.0149 0.190193 18.5258 202.0886 0.004208426 100.2Col 2 2340 8.67 0.2182 0.0026 0.0021 ‐‐ 181.0825 ‐‐ 0.225269 19.9792 169.4946 0.004408218 100.2Col 2 2400 8.67 0.2274 0.0009 0.0052 ‐‐ 195.9366 0.0724 0.230497 18.3923 184.5351 0.004592141 100.2Col 2 2460 8.67 0.2181 0.0039 0.0025 ‐‐ 141.7614 0.0611 0.286139 16.2363 123.9742 0.004754504 100.3Col 2 2520 8.67 0.224 0.0038 0.0031 ‐‐ 142.8056 0.0136 0.298819 18.2165 112.3345 0.004936669 100.3Col 2 2580 8.67 0.2356 0.0033 0.0037 ‐‐ 135.8709 0.0142 0.37067 20.8712 103.9202 0.005145381 100.3Col 2 2640 8.67 0.271 0.0053 0.0031 ‐‐ 182.7566 0.022 0.46313 29.2384 124.3074 0.005437765 100.3Col 2 2700 8.67 0.212 0.002 0.0016 ‐‐ 106.1497 0.0153 0.073158 18.8823 60.9336 0.005626588 100.3Col 2 2760 8.67 0.2391 0.0022 0.0025 ‐‐ 94.5762 0.0127 0.230454 17.3316 55.7491 0.005799904 100.3Col 2 2820 8.67 0.2088 0.0013 0.0018 ‐‐ 70.1694 0.0099 0.172764 13.1714 34.9526 0.005931618 100.3Col 2 2880 8.67 0.2182 0.0027 0.002 ‐‐ 67.1905 0.0088 0.313503 17.1077 30.9657 0.006102695 100.3Col 2 2940 8.67 0.2598 0.0037 0.0032 ‐‐ 90.7483 0.0163 0.255421 19.7539 39.8236 0.006300234 100.3Col 2 3000 8.67 0.252 0.0027 0.0029 ‐‐ 74.054 0.0103 0.205705 16.8775 33.2702 0.006469009 100.3Col 2 3120 8.59 0.3022 0.0007 0.0003 ‐‐ 98.297 0.0389 0.315594 23.0516 35.9104 0.006930041 100.3Col 2 3180 8.59 0.3197 0.0018 0.0009 ‐‐ 103.5317 0.0426 0.313503 23.7694 38.7107 0.007167735 100.3Col 2 3240 8.59 0.3099 ‐‐ ‐‐ ‐‐ 86.1204 0.0458 0.262523 21.6969 35.7424 0.007384704 100.3Col 2 3300 8.59 0.3011 ‐‐ ‐‐ ‐‐ 82.2402 0.0407 0.308797 23.5761 38.7814 0.007620465 100.3Col 2 3360 8.59 0.2289 ‐‐ ‐‐ ‐‐ 78.7485 0.033 0.362914 18.7511 34.5379 0.007807976 100.3Col 2 3420 8.59 0.2966 ‐‐ ‐‐ ‐‐ 76.806 0.0504 0.312806 23.8338 37.3911 0.008046314 100.3Col 2 3480 8.59 0.3012 ‐‐ ‐‐ ‐‐ 60.7931 0.0439 0.307969 23.5871 24.3259 0.008282185 100.4Col 2 3540 8.59 0.3166 ‐‐ ‐‐ ‐‐ 72.9795 0.0585 0.298993 22.1762 37.0532 0.008503947 100.4Col 2 3600 8.59 0.2998 ‐‐ ‐‐ ‐‐ 73.8023 0.0499 0.301172 22.8359 36.2602 0.008732306 100.4Col 2 3660 8.59 0.314 ‐‐ ‐‐ ‐‐ 72.4341 0.053 0.261129 22.4049 33.9919 0.008956355 100.4Col 2 3720 8.59 0.3173 ‐‐ ‐‐ ‐‐ 70.1726 0.0601 0.274854 21.8052 34.8886 0.009174407 100.4Col 2 3780 8.59 0.3022 ‐‐ ‐‐ ‐‐ 71.6421 0.0647 0.29908 22.4201 33.7321 0.009398608 100.4Col 2 3840 8.59 0.339 ‐‐ ‐‐ ‐‐ 69.4228 0.0768 0.283656 22.2893 31.8761 0.009621501 100.4Col 2 3900 8.59 0.3298 ‐‐ ‐‐ ‐‐ 66.8525 0.083 0.286967 22.546 31.4671 0.009846961 100.4Col 2 3960 8.59 0.3384 ‐‐ ‐‐ ‐‐ 67.0731 0.0926 0.266532 22.2699 28.885 0.01006966 100.4Col 2 4020 8.59 0.3297 ‐‐ ‐‐ ‐‐ 65.7338 0.0998 0.276946 22.6686 27.6457 0.010296346 100.4Col 2 4080 8.59 0.3604 ‐‐ ‐‐ ‐‐ 65.9308 0.1571 0.283133 22.4231 25.865 0.010520577 100.4Col 2 4140 8.59 0.1833 ‐‐ ‐‐ ‐‐ 62.2821 0.0521 0.287882 20.4678 24.5756 0.010725255 100.4Col 2 4200 8.59 0.3645 ‐‐ ‐‐ ‐‐ 64.4999 0.2013 0.258776 22.1628 22.7702 0.010946883 100.4Col 2 4260 8.59 0.3665 ‐‐ ‐‐ ‐‐ 37.2519 0.1717 0.268841 23.1939 8.6127 0.011178822 100.4Col 2 4320 8.59 0.362 ‐‐ ‐‐ ‐‐ 60.7758 0.0005 0.263961 24.1081 19.3836 0.011419903 100.4Col 2 4380 8.59 0.3323 ‐‐ ‐‐ ‐‐ 60.2804 0.2548 0.278645 23.9165 18.7193 0.011659068 100.4
Injection‐Leaching.xlsx Page 3 of 11 3/24/2009

APPENDIX A-5
AEROBIC LEACHING EXPERIMENT RESULTS - COLUMN 2
COLUMN STUDYAvon Park Air Force Range
Avon Park, Florida
Column #
Total Sulfate (g)Chloride (ppm)
Sulfate (ppm)
Arsenate (ppm)
Operational NotespH%As
remaining
Compound Name (units)
Time (mins.)
Fluoride (ppm)
Thiosulfate (ppm)
Phosphate (ppm)
Propionate (ppm)
Acetate (ppm)
Formate (ppm)
Col 2 4440 8.59 0.3746 ‐‐ ‐‐ ‐‐ 57.7403 0.4451 0.240127 20.3523 17.815 0.011862591 100.4Col 2 4500 8.59 0.3399 ‐‐ ‐‐ ‐‐ 55.9953 0.2158 0.258122 23.8455 16.9353 0.012101046 100.5Col 2 4560 8.59 0.3605 ‐‐ ‐‐ ‐‐ 53.2427 0.1449 0.169976 21.2862 13.8905 0.012313908 100.5 Switch from 8 mL/min. to 10 mL/min.Col 2 4680 8.41 0.2493 0.2549 ‐‐ ‐‐ 75.971 0.0579 0.331149 27.3005 54.7062 0.013132923 100.5Col 2 4800 8.41 0.2336 0.0105 ‐‐ ‐‐ 49.8878 0.0035 0.128059 12.9702 5.5114 0.013392327 100.5Col 2 4920 8.41 0.2479 0.0161 ‐‐ ‐‐ 73.9035 0.0384 0.220955 22.0054 8.2727 0.013832435 100.5Col 2 5040 8.41 0.29 0.0147 ‐‐ ‐‐ 58.0642 0.0426 0.160433 16.5054 6.38 0.014162543 100.5Col 2 5160 8.41 0.292 0.0129 ‐‐ ‐‐ 71.2566 0.0719 0.207012 21.097 7.6475 0.014584483 100.5Col 2 5280 8.41 0.2674 0.016 ‐‐ ‐‐ 49.036 0.0466 0.140608 14.4238 4.9778 0.014872959 100.6Col 2 5400 8.41 0.2886 0.0162 ‐‐ ‐‐ 68.6274 0.1172 0.203483 20.2965 6.3622 0.015278889 100.6Col 2 5520 8.41 0.2811 0.012 ‐‐ ‐‐ 65.8757 0.3382 0.209191 19.5816 6.0328 0.015670521 100.6Col 2 5640 8.41 0.2647 0.0136 ‐‐ ‐‐ 53.1267 0.938 0.155597 11.8797 4.4159 0.015908115 100.6Col 2 5760 8.41 0.2676 0.0091 ‐‐ ‐‐ 55.5239 1.244 0.167187 11.4956 4.6749 0.016138027 100.6Col 2 5880 8.41 0.2952 0.0124 ‐‐ ‐‐ 64.7808 1.3786 0.212938 9.0921 5.1767 0.016319869 100.6Col 2 6000 8.39 0.4759 0.023 ‐‐ ‐‐ 68.9747 ‐‐ 0.205531 25.7782 5.1228 0.016577651 100.7Col 2 6120 8.39 0.2486 0.0523 ‐‐ ‐‐ 68.2972 ‐‐ 0.24065 25.1803 4.9524 0.01733306 100.7Col 2 6240 8.39 0.2574 0.0026 ‐‐ ‐‐ 66.0857 0.0074 0.216162 24.6239 4.7228 0.017825538 100.7Col 2 6360 8.39 0.1963 0.0242 ‐‐ ‐‐ 64.5592 0.0048 0.231935 23.945 4.25 0.018304438 100.7Col 2 6480 8.39 0.1555 0.0067 ‐‐ ‐‐ 63.4612 0.0029 0.231325 23.6949 3.8975 0.018778336 100.7Col 2 6600 8.39 0.2701 0.0308 ‐‐ ‐‐ 62.0853 0.0094 0.183701 23.3294 3.6921 0.019244924 100.7Col 2 6720 8.39 0.2409 0.0093 ‐‐ ‐‐ 60.7974 ‐‐ 0.233722 22.3766 3.3693 0.019692456 100.7Col 2 6840 8.39 0.2051 0.0181 ‐‐ ‐‐ 59.2813 0.0205 0.22126 22.3947 3.0772 0.02014035 100.8Col 2 6960 8.39 0.2466 0.0506 ‐‐ ‐‐ 57.9642 0.0187 0.224877 21.862 2.8991 0.02057759 100.8Col 2 7080 8.39 0.2443 0.0589 ‐‐ ‐‐ 56.4137 0.0064 0.186228 21.8336 2.6633 0.021014262 100.8Col 2 7200 8.39 0.1944 0.0398 ‐‐ ‐‐ 55.6022 ‐‐ 0.22845 19.4601 2.4455 0.021403464 100.8Col 2 7320 8.39 0.0733 ‐‐ ‐‐ ‐‐ 48.2518 ‐‐ 0.219387 39.6711 2.2662 0.022196886 100.8Col 2 7440 8.39 0.2743 ‐‐ ‐‐ ‐‐ 52.2649 0.005 0.209539 15.379 2.1032 0.022504466 100.8Col 2 7560 8.53 0.5615 0.0336 ‐‐ ‐‐ 55.5542 0.0128 0.19869 21.883 1.9512 0.022723296 100.9Col 2 7680 8.53 0.2314 0.0353 ‐‐ ‐‐ 51.8416 0.0012 0.19821 21.3249 1.926 0.022936545 100.9Col 2 7800 8.53 0.1966 0.0329 ‐‐ ‐‐ 51.2344 ‐‐ 0.22479 21.4596 1.8244 0.023151141 100.9Col 2 7920 8.53 0.2397 ‐‐ ‐‐ ‐‐ 50.1763 0.0004 0.213417 21.5482 1.7236 0.023366623 100.9Col 2 8040 8.53 0.2676 0.0368 ‐‐ ‐‐ 49.8227 0.0056 0.223264 21.6756 1.6145 0.023583379 100.9Col 2 8160 8.53 0.1629 0.0447 ‐‐ ‐‐ 49.0895 0.0055 0.16283 21.8768 1.5625 0.023802147 100.9Col 2 8280 8.53 0.1438 0.03 ‐‐ ‐‐ 48.7882 0.001 0.18235 21.925 1.4943 0.024021397 101.0Col 2 8400 8.53 0.1881 0.0388 ‐‐ ‐‐ 49.0646 4.0779 0.223003 22.3799 1.5229 0.024245196 101.0Col 2 8520 8.53 0.2578 0.0336 ‐‐ ‐‐ 48.6398 0.1682 0.212415 22.2851 1.4593 0.024468047 101.0
Injection‐Leaching.xlsx Page 4 of 11 3/24/2009

APPENDIX A-5
AEROBIC LEACHING EXPERIMENT RESULTS - COLUMN 2
COLUMN STUDYAvon Park Air Force Range
Avon Park, Florida
Column #
Total Sulfate (g)Chloride (ppm)
Sulfate (ppm)
Arsenate (ppm)
Operational NotespH%As
remaining
Compound Name (units)
Time (mins.)
Fluoride (ppm)
Thiosulfate (ppm)
Phosphate (ppm)
Propionate (ppm)
Acetate (ppm)
Formate (ppm)
Col 2 8640 8.53 0.2482 0.0458 ‐‐ ‐‐ 48.3296 0.0042 0.221086 22.6423 1.2829 0.02469447 101.0 Switch to Artificial WaterCol 2 8760 8.53 0.1624 0.0625 ‐‐ ‐‐ 47.3783 0.0037 0.213461 23.2723 1.3581 0.024927193 101.0Col 2 8880 8.53 0.2538 0.0708 ‐‐ ‐‐ 47.4954 0.0151 0.199343 23.7602 1.3348 0.025164795 101.0Col 2 9000 8.53 0.2527 0.0071 ‐‐ ‐‐ 47.3063 0.0026 0.160302 24.6692 1.5849 0.025411487 101.0Col 2 9120 8.21 0.2997 0.0122 ‐‐ ‐‐ 56.1762 0.1532 0.222829 25.3848 0.4616 0.025665335 101.0Col 2 9240 8.21 0.2173 ‐‐ ‐‐ ‐‐ 46.2115 0.014 0.201565 23.9565 1.5629 0.026144465 101.0Col 2 9360 8.21 0.2335 ‐‐ ‐‐ ‐‐ 45.1052 0.0018 0.204223 23.2898 2.5925 0.026610261 101.0Col 2 9480 8.21 0.234 ‐‐ ‐‐ ‐‐ 43.3794 0.0267 0.190367 23.4825 4.0301 0.027079911 101.0Col 2 9600 8.21 0.2285 ‐‐ ‐‐ ‐‐ 40.2407 0.0168 0.180564 22.1714 4.9747 0.027523339 101.0Col 2 9720 8.21 0.2196 0.0055 ‐‐ ‐‐ 40.0812 0.0181 0.178777 20.5568 5.5781 0.027934475 101.0Col 2 9840 8.21 0.129 ‐‐ ‐‐ ‐‐ 40.844 0.0192 0.185836 21.3529 6.7114 0.028361533 101.0Col 2 9960 8.21 0.245 ‐‐ ‐‐ ‐‐ 42.2223 0.0344 0.181958 21.9653 7.517 0.028800839 101.0Col 2 10080 8.21 0.249 0.0092 ‐‐ ‐‐ 37.7757 0.0257 0.181261 21.2463 7.9354 0.029225765 101.0Col 2 10200 8.21 0.2437 0.0055 ‐‐ ‐‐ 34.0137 0.0723 0.14161 17.2813 7.1459 0.029571391 101.0Col 2 10320 8.21 0.247 0.0007 ‐‐ ‐‐ 35.0822 0.2816 0.175204 16.6386 8.7517 0.029904163 101.0Col 2 10440 8.21 0.2711 0.0013 ‐‐ ‐‐ 36.6742 0.6039 0.149497 14.838 9.5899 0.030200923 100.9Col 2 10560 8.21 0.2607 0.0104 ‐‐ ‐‐ 34.545 0.9457 0.215814 11.5922 9.4425 0.030432767 100.9Col 2 10680 8.14 0.2152 0.0059 ‐‐ ‐‐ ‐‐ ‐‐ 0.124748 24.3715 9.7972 0.031651342 100.9Col 2 10800 8.14 0.1135 ‐‐ ‐‐ ‐‐ ‐‐ ‐‐ 0.107188 24.5395 10.1128 0.032142132 100.9Col 2 10920 8.14 0.174 0.0115 ‐‐ ‐‐ ‐‐ ‐‐ 0.126621 25.3014 10.4167 0.03264816 100.9Col 2 11040 8.14 0.2206 0.0004 ‐‐ ‐‐ ‐‐ ‐‐ 0.156381 24.6145 10.6319 0.03314045 100.9Col 2 11160 8.14 0.236 0.0213 ‐‐ ‐‐ ‐‐ ‐‐ 0.174071 24.3142 10.9414 0.033626734 100.9Col 2 11280 8.14 0.2027 ‐‐ ‐‐ ‐‐ ‐‐ ‐‐ 0.152721 24.0922 11.1416 0.034108578 100.9Col 2 11400 8.14 0.2378 ‐‐ ‐‐ ‐‐ ‐‐ ‐‐ 0.12344 24.1937 11.3428 0.034592452 100.9Col 2 11520 8.14 0.2049 ‐‐ ‐‐ ‐‐ ‐‐ ‐‐ 0.175814 22.7752 10.4979 0.035047956 100.9Col 2 11640 8.14 0.235 0.0097 ‐‐ ‐‐ ‐‐ ‐‐ 0.17747 24.094 11.711 0.035529836 100.9Col 2 11760 8.14 0.2369 ‐‐ ‐‐ ‐‐ ‐‐ ‐‐ 0.185487 24.4164 11.7839 0.036018164 100.9Col 2 11880 8.14 0.245 ‐‐ ‐‐ ‐‐ ‐‐ ‐‐ 0.157035 24.6082 12.0781 0.036510328 100.9Col 2 16200 8.12 0.2711 0.0078 ‐‐ ‐‐ 29.0894 0.0759 0.08623 23.236 12.0416 0.036742688 100.9Col 2 16320 8.12 0.2003 ‐‐ ‐‐ ‐‐ 29.0803 0.0038 0.11063 23.2684 12.395 0.037208056 100.9Col 2 16440 8.12 0.1763 ‐‐ ‐‐ ‐‐ 29.2207 0.0007 0.10514 22.8197 12.4036 0.03766445 100.9Col 2 16560 8.12 0.2084 ‐‐ ‐‐ ‐‐ 28.7182 0.001 0.10331 22.735 12.6444 0.03811915 100.9Col 2 16680 8.12 0.1968 ‐‐ ‐‐ ‐‐ 28.1774 ‐‐ 0.102221 22.7969 12.7678 0.038575088 100.9Col 2 16800 8.12 0.2038 0.0014 ‐‐ ‐‐ 27.1802 0.0007 0.100347 22.0542 12.4025 0.039016172 100.9Col 2 16920 8.12 0.2015 0.0133 ‐‐ ‐‐ 26.7262 ‐‐ 0.089541 22.6287 12.6786 0.039468746 100.9Col 2 17040 8.12 0.165 ‐‐ ‐‐ ‐‐ 26.7566 ‐‐ 0.115902 22.2542 12.9161 0.03991383 100.9
Injection‐Leaching.xlsx Page 5 of 11 3/24/2009

APPENDIX A-5
AEROBIC LEACHING EXPERIMENT RESULTS - COLUMN 2
COLUMN STUDYAvon Park Air Force Range
Avon Park, Florida
Column #
Total Sulfate (g)Chloride (ppm)
Sulfate (ppm)
Arsenate (ppm)
Operational NotespH%As
remaining
Compound Name (units)
Time (mins.)
Fluoride (ppm)
Thiosulfate (ppm)
Phosphate (ppm)
Propionate (ppm)
Acetate (ppm)
Formate (ppm)
Col 2 17160 8.12 0.1911 ‐‐ ‐‐ ‐‐ 26.142 ‐‐ 0.099824 21.8937 12.7809 0.040351704 100.9Col 2 17280 8.31 0.2013 0.0011 0.0025 ‐‐ 17.2186 ‐‐ 0.074726 15.4733 11.4222 0.040815903 100.9Col 2 17340 8.31 0.2103 0.0056 0.0016 ‐‐ 17.8807 ‐‐ 0.112242 15.2305 12.1129 0.040968208 100.9Col 2 17400 8.31 0.209 0.0032 0.0012 ‐‐ 17.6024 ‐‐ 0.09063 15.2733 12.1661 0.041120941 100.9Col 2 17460 8.31 0.2119 0.0146 ‐‐ ‐‐ 17.9133 ‐‐ 0.081349 15.2608 12.1878 0.041273549 100.9Col 2 17520 8.31 0.2106 0.0051 0.0016 ‐‐ 17.6666 1.3126 0.089585 15.1123 12.1323 0.041424672 100.9Col 2 17580 8.31 0.2101 0.003 0.001 ‐‐ 17.5284 ‐‐ 0.082962 15.0914 12.1256 0.041575586 100.9Col 2 17640 8.31 0.2087 0.0029 ‐‐ ‐‐ 17.3319 ‐‐ 0.084574 15.0618 12.0692 0.041726204 100.9Col 2 17700 8.31 0.222 0.0084 ‐‐ ‐‐ 17.5639 ‐‐ 0.08087 15.0872 12.0845 0.041877076 100.9Col 2 17760 8.31 0.2146 0.0072 0.0021 ‐‐ 17.3357 ‐‐ 0.077036 14.4495 12.0324 0.042021571 100.9Col 2 17820 8.31 0.2128 0.0025 ‐‐ ‐‐ 16.9814 ‐‐ 0.080478 14.4779 12.0064 0.04216635 100.9Col 2 17880 8.31 0.2303 0.0112 ‐‐ ‐‐ 17.3913 ‐‐ 0.075075 14.5192 12.067 0.042311542 100.9Col 2 17940 8.31 0.2291 0.0047 0.0012 ‐‐ 17.0971 ‐‐ 0.082308 14.445 11.9877 0.042455992 100.9Col 2 18000 8.31 0.2084 0.0031 ‐‐ ‐‐ 16.942 ‐‐ 0.085925 14.5057 12.0389 0.042601049 100.9Col 2 18060 8.31 0.2153 0.0019 ‐‐ ‐‐ 17.0938 ‐‐ 0.07355 14.47 12.0585 0.042745749 100.9Col 2 18120 8.31 0.2083 0.0047 0.0013 ‐‐ 16.7381 ‐‐ 0.081567 14.5921 11.9329 0.04289167 100.9Col 2 18180 8.31 0.2207 0.0026 ‐‐ ‐‐ 16.4299 ‐‐ 0.073681 14.1148 11.9683 0.043032818 100.9Col 2 18240 8.31 0.2293 0.0126 ‐‐ ‐‐ 21.2246 ‐‐ 0.075554 13.7862 11.8647 0.04317068 100.9Col 2 18300 8.31 0.1517 ‐‐ ‐‐ ‐‐ 21.0334 ‐‐ 0.072504 13.8466 12.0372 0.043309146 100.9Col 2 18360 8.31 0.1794 0.0014 ‐‐ ‐‐ 20.992 ‐‐ 0.061698 13.8349 11.8492 0.043447495 100.9Col 2 18420 8.31 0.1402 0.014 ‐‐ ‐‐ 21.0735 ‐‐ 0.067624 13.9334 12.0218 0.043586829 100.9Col 2 18480 8.31 0.194 0.0071 ‐‐ ‐‐ 20.7336 ‐‐ 0.078212 13.8083 12.0412 0.043724912 100.9Col 2 18540 8.31 0.1703 0.006 ‐‐ ‐‐ 20.7088 ‐‐ 0.044967 14.0291 12.136 0.043865203 100.9Col 2 18600 8.31 0.1639 0.0104 ‐‐ ‐‐ 20.4934 ‐‐ 0.073681 13.6174 11.8381 0.044001377 100.9Col 2 21480 7.74 ‐‐ ‐‐ ‐‐ ‐‐ ‐‐ 0.0091 0.37738 12.8502 14.604 0.053253521 100.8Col 2 28680 7.6 ‐‐ ‐‐ ‐‐ ‐‐ ‐‐ 0.001 0.415244 10.5695 15.1678 0.068473601 100.5Col 2 31560 7.33 ‐‐ ‐‐ ‐‐ ‐‐ ‐‐ ‐‐ 0.361737 9.1538 14.5327 0.068656677 100.4Col 2 34440 7.28 ‐‐ ‐‐ ‐‐ ‐‐ ‐‐ ‐‐ 0.204006 13.3101 11.5522 0.075045525 100.3Col 2 38760 7.21 ‐‐ ‐‐ ‐‐ ‐‐ ‐‐ ‐‐ 0.188581 13.0503 11.5634 0.075437034 100.3Col 2 40200 7.32 ‐‐ ‐‐ ‐‐ ‐‐ ‐‐ ‐‐ 0.187709 12.4034 11.7969 0.07841385 100.2Col 2 41640 7.17 ‐‐ ‐‐ ‐‐ ‐‐ ‐‐ ‐‐ 0.16723 11.4161 11.716 0.081153714 100.2Col 2 43080 7.06 ‐‐ ‐‐ ‐‐ ‐‐ ‐‐ ‐‐ 0.151719 10.1351 11.6406 0.083586138 100.2Col 2 47400 6.83 ‐‐ ‐‐ ‐‐ ‐‐ ‐‐ 0.1635 0.098953 7.5725 27.0649 0.089038338 100.1Col 2 48840 6.19 ‐‐ ‐‐ ‐‐ ‐‐ 0.3536 ‐‐ 0.035991 4.1146 ‐‐ ‐‐ 100.1Col 2 50280 6.24 ‐‐ ‐‐ ‐‐ ‐‐ 0.3374 ‐‐ 0.042788 4.8063 ‐‐ ‐‐ 100.1Col 2 51720 6.31 ‐‐ ‐‐ ‐‐ ‐‐ 0.326 ‐‐ 0.027146 4.2732 ‐‐ ‐‐ 100.1
Injection‐Leaching.xlsx Page 6 of 11 3/24/2009

APPENDIX A-5
AEROBIC LEACHING EXPERIMENT RESULTS - COLUMN 2
COLUMN STUDYAvon Park Air Force Range
Avon Park, Florida
Column #
Total Sulfate (g)Chloride (ppm)
Sulfate (ppm)
Arsenate (ppm)
Operational NotespH%As
remaining
Compound Name (units)
Time (mins.)
Fluoride (ppm)
Thiosulfate (ppm)
Phosphate (ppm)
Propionate (ppm)
Acetate (ppm)
Formate (ppm)
Col 2 53160 6.39 ‐‐ ‐‐ ‐‐ ‐‐ 0.3467 ‐‐ 0.025577 3.265 ‐‐ ‐‐ 100.1Col 2 58920 6.41 ‐‐ ‐‐ ‐‐ ‐‐ 0.5624 ‐‐ 0.05891 4.6252 ‐‐ ‐‐ 100.1Col 2 60360 6.45 ‐‐ ‐‐ ‐‐ ‐‐ 0.5792 ‐‐ 0.071328 3.0319 ‐‐ ‐‐ 100.1Col 2 67560 6.45 ‐‐ ‐‐ ‐‐ ‐‐ 0.2609 ‐‐ 0.011503 2.1274 ‐‐ ‐‐ 100.1Col 2 69000 6.43 ‐‐ ‐‐ ‐‐ ‐‐ 0.1792 ‐‐ 0.207012 0.4532 ‐‐ ‐‐ 100.1Col 2 71880 6.48 ‐‐ ‐‐ ‐‐ ‐‐ 0.2108 ‐‐ 0.178559 0.8926 ‐‐ ‐‐ 100.0Col 2 73320 6.52 ‐‐ ‐‐ ‐‐ ‐‐ 0.1433 ‐‐ 0.16344 1.0211 ‐‐ ‐‐ 100.0Col 2 79080 6.55 ‐‐ ‐‐ ‐‐ ‐‐ 0.1669 ‐‐ 0.124399 0.2989 ‐‐ ‐‐ 99.9Col 2 80520 6.58 ‐‐ ‐‐ ‐‐ ‐‐ 0.1863 ‐‐ 0.132024 0.5988 ‐‐ ‐‐ 99.9Col 2 81960 6.59 ‐‐ ‐‐ ‐‐ ‐‐ 0.072 ‐‐ 0.11673 0.3854 ‐‐ ‐‐ 99.9Col 2 83400 6.6 ‐‐ ‐‐ ‐‐ ‐‐ 0.1783 ‐‐ 0.010109 0.281 ‐‐ ‐‐ 99.9 10mM of K2HPO4 addedCol 2 87720 6.59 ‐‐ ‐‐ ‐‐ ‐‐ 0.0594 ‐‐ 0.005316 2.6731 ‐‐ ‐‐ 99.9Col 2 89160 6.61 ‐‐ ‐‐ ‐‐ ‐‐ 0.0929 ‐‐ 0.020305 4.5348 ‐‐ ‐‐ 99.9Col 2 90600 6.64 ‐‐ ‐‐ ‐‐ ‐‐ 0.0878 ‐‐ 0.030544 4.9772 ‐‐ ‐‐ 99.9Col 2 92040 6.63 ‐‐ ‐‐ ‐‐ ‐‐ 0.0183 ‐‐ 0.033289 5.7483 ‐‐ ‐‐ 99.9Col 2 93480 6.69 ‐‐ ‐‐ ‐‐ ‐‐ 0.0088 ‐‐ 0.033202 6.0373 ‐‐ ‐‐ 99.9Col 2 103560 6.51 ‐‐ ‐‐ ‐‐ ‐‐ 0.2378 ‐‐ 0.016122 28.5053 ‐‐ ‐‐ 99.8 AlOH InjectionCol 2 107880 6.51 ‐‐ ‐‐ ‐‐ ‐‐ 0.203 ‐‐ 0.131327 7.3626 ‐‐ ‐‐ 99.8Col 2 110760 6.58 ‐‐ ‐‐ ‐‐ ‐‐ 0.1323 ‐‐ 0.118168 4.9567 ‐‐ ‐‐ 99.8Col 2 112200 6.55 ‐‐ ‐‐ ‐‐ ‐‐ 0.0247 ‐‐ 0.021263 4.4501 ‐‐ ‐‐ 99.8Col 2 113640 6.51 ‐‐ ‐‐ ‐‐ ‐‐ 0.1005 ‐‐ 0.010152 4.4405 ‐‐ ‐‐ 99.8Col 2 117960 6.61 ‐‐ ‐‐ ‐‐ ‐‐ 0.1116 ‐‐ 0.021176 4.7065 ‐‐ ‐‐ 99.7Col 2 120840 6.63 ‐‐ ‐‐ ‐‐ ‐‐ 0.1198 ‐‐ 0.018039 3.3125 ‐‐ ‐‐ 99.7Col 2 122280 6.55 ‐‐ ‐‐ ‐‐ ‐‐ 0.0678 ‐‐ 0.011677 4.6756 ‐‐ ‐‐ 99.7Col 2 123720 6.53 ‐‐ ‐‐ ‐‐ ‐‐ 0.038 ‐‐ 0.008366 4.7023 ‐‐ ‐‐ 99.7Col 2 128040 6.68 ‐‐ ‐‐ ‐‐ ‐‐ 0.0574 ‐‐ 0.011677 4.9666 ‐‐ ‐‐ 99.7Col 2 129480 5.76 ‐‐ ‐‐ ‐‐ ‐‐ 0.0911 ‐‐ 0.004793 4.2963 ‐‐ ‐‐ 99.7Col 2 130920 5.8 ‐‐ ‐‐ ‐‐ ‐‐ 0.035 ‐‐ 0.000349 3.9117 ‐‐ ‐‐ 99.7Col 2 133800 6.89 ‐‐ ‐‐ ‐‐ ‐‐ 0.0117 ‐‐ 0.001481 ‐0.4237 ‐‐ ‐‐ 99.7Col 2 135240 7.43 ‐‐ ‐‐ ‐‐ ‐‐ 8.1677 ‐‐ 0.237164 9.3218 ‐‐ ‐‐ 99.7Col 2 136680 7.19 ‐‐ ‐‐ ‐‐ ‐‐ 5.0405 ‐‐ 0.21211 6.282 ‐‐ ‐‐ 99.7Col 2 138120 7.15 ‐‐ ‐‐ ‐‐ ‐‐ 0.5795 ‐‐ 0.143919 6.6683 ‐‐ ‐‐ 99.7Col 2 139560 7.12 ‐‐ ‐‐ ‐‐ ‐‐ 0.2559 ‐‐ 0.144224 5.7012 ‐‐ ‐‐ 99.6Col 2 141000 7.04 ‐‐ ‐‐ ‐‐ ‐‐ 0.2622 ‐‐ 0.150455 5.6745 ‐‐ ‐‐ 99.6Col 2 145320 7.09 ‐‐ ‐‐ ‐‐ ‐‐ 0.1021 ‐‐ 0.117384 5.5173 ‐‐ ‐‐ 99.6Col 2 146760 7.55 ‐‐ ‐‐ ‐‐ ‐‐ ‐‐ ‐‐ 0.098081 4.1416 ‐‐ ‐‐ 99.6
Injection‐Leaching.xlsx Page 7 of 11 3/24/2009

APPENDIX A-5
AEROBIC LEACHING EXPERIMENT RESULTS - COLUMN 2
COLUMN STUDYAvon Park Air Force Range
Avon Park, Florida
Column #
Total Sulfate (g)Chloride (ppm)
Sulfate (ppm)
Arsenate (ppm)
Operational NotespH%As
remaining
Compound Name (units)
Time (mins.)
Fluoride (ppm)
Thiosulfate (ppm)
Phosphate (ppm)
Propionate (ppm)
Acetate (ppm)
Formate (ppm)
Col 2 148200 7.59 ‐‐ ‐‐ ‐‐ ‐‐ ‐‐ ‐‐ 0.106229 5.7072 ‐‐ ‐‐ 99.5Col 2 149640 7.57 ‐‐ ‐‐ ‐‐ ‐‐ ‐‐ ‐‐ 0.081001 6.3221 ‐‐ ‐‐ 99.5Col 2 151080 7.47 ‐‐ ‐‐ ‐‐ ‐‐ ‐‐ ‐‐ 0.056557 6.3585 ‐‐ ‐‐ 99.5Col 2 152520 7.55 ‐‐ ‐‐ ‐‐ ‐‐ ‐‐ ‐‐ 0.068931 6.5599 ‐‐ ‐‐ 99.5Col 2 153960 7.36 ‐‐ ‐‐ ‐‐ ‐‐ ‐‐ ‐‐ 0.05952 6.5544 ‐‐ ‐‐ 99.5Col 2 155400 7.32 ‐‐ ‐‐ ‐‐ ‐‐ ‐‐ ‐‐ 0.055075 6.7093 ‐‐ ‐‐ 99.5Col 2 156840 7.38 ‐‐ ‐‐ ‐‐ ‐‐ ‐‐ ‐‐ 0.065489 6.3156 ‐‐ ‐‐ 99.5Col 2 158280 7.4 ‐‐ ‐‐ ‐‐ ‐‐ ‐‐ ‐‐ 0.081698 7.2126 ‐‐ ‐‐ 99.5Col 2 162600 7.46 ‐‐ ‐‐ ‐‐ ‐‐ ‐‐ ‐‐ 0.17015 6.3219 ‐‐ ‐‐ 99.4Col 2 164040 7.44 ‐‐ ‐‐ ‐‐ ‐‐ ‐‐ ‐‐ 0.169671 6.2821 ‐‐ ‐‐ 99.4Col 2 165480 7.42 ‐‐ ‐‐ ‐‐ ‐‐ ‐‐ ‐‐ 0.162917 6.2219 ‐‐ ‐‐ 99.4
‐‐ = Not Analyzed
Injection‐Leaching.xlsx Page 8 of 11 3/24/2009

APPENDIX A-5
AEROBIC LEACHING EXPERIMENT RESULTS - COLUMN 3
COLUMN STUDYAvon Park Air Force Range
Avon Park, Florida
Column #Time
pHSulfate Nitrite Chloride Propionate Acetate Formate Fluoride
Compound Name (units)
% As Phosphate Thiosulfate Arsenate Bromide
Coll3 0 8.21 0.1991 ‐‐ ‐‐ ‐‐ 394.6 0.0138 0.325 4.5 559.5 0.000045 ‐‐ ‐‐ 100.0C l 3 60 8 64 0 1132 0 0006 0 0028 10 5271 1 406 84 0226 29 2179 0 01487767 100 0
Column #(mins.)
pH(ppm) (ppm)(ppm)(ppm)(ppm)(ppm)(ppm) remaining(ppm) (ppm) (ppm) Total Sulfate
(g)(ppm)
Col 3 60 8.64 0.1132 0.0006 0.0028 ‐‐ 10.5271 ‐‐ 1.406 84.0226 29.2179 0.01487767 ‐‐ ‐‐ 100.0Col 3 120 8.64 0.1233 0.0008 0.0285 0.0012 51.6079 ‐‐ 1.1433 74.3376 97.7732 0.01562105 6.7692 ‐‐ 100.0Col 3 180 8.64 0.1159 ‐‐ 0.0005 ‐‐ 27.9568 ‐‐ 1.2245 78.7133 55.8611 0.01640818 6.8453 ‐‐ 100.0Col 3 240 8 64 0 1122 0 0006 0 0006 ‐‐ 33 7718 ‐‐ 1 1344 76 9611 64 772 0 01717779 5 5794 ‐‐ 100 0Col 3 240 8.64 0.1122 0.0006 0.0006 ‐‐ 33.7718 ‐‐ 1.1344 76.9611 64.772 0.01717779 5.5794 ‐‐ 100.0Col 3 300 8.64 0.1185 0.0005 0.0006 ‐‐ 30.8728 0.0319 1.2849 80.4193 59.8963 0.01798199 6.3211 ‐‐ 100.0Col 3 360 8.64 0.1165 ‐‐ 0.0004 ‐‐ 31.2482 ‐‐ 1.1717 79.9034 60.3177 0.01878102 5.6702 ‐‐ 100.0Col 3 420 8.64 0.1127 0.0005 0.0005 ‐‐ 27.5045 ‐‐ 1.2277 78.9344 53.5775 0.01957036 5.9058 ‐‐ 100.0Col 3 480 8.64 0.0689 0.0021 0.0011 ‐‐ 47.7552 0.0757 0.3251 38.3216 93.9247 0.01995358 2.6851 ‐‐ 100.1Col 3 540 8.64 0.1093 0.0009 0.0007 ‐‐ 23.8088 ‐‐ 1.3167 79.8727 47.6897 0.02075231 5.5995 ‐‐ 100.1Col 3 600 8.64 0.1269 0.0008 0.0008 ‐‐ 70.635 0.0596 1.0513 68.7846 141.6387 0.02144015 4.2651 ‐‐ 100.1Col 3 660 8.64 0.1151 0.0007 0.0007 ‐‐ 43.9241 0.0433 0.9722 74.8662 84.5201 0.02218882 4.691 ‐‐ 100.1Col 3 720 8.64 0.1175 0.0008 0.0009 ‐‐ 39.7038 0.0523 0.9738 77.1089 77.4328 0.0229599 4.6711 ‐‐ 100.1Col 3 780 8.64 0.1187 0.001 0.0011 ‐‐ 25.2383 0.0425 1.0068 80.402 50.1804 0.02376392 4.2126 ‐‐ 100.1Col 3 840 8.64 0.1268 0.0014 0.0018 ‐‐ 26.4464 0.0226 1.0482 78.5916 53.0795 0.02454984 3.4986 ‐‐ 100.1Col 3 900 8.64 0.1112 0.0005 0.0016 ‐‐ 32.821 0.0422 1.192 81.9621 61.9432 0.02536946 3.019 ‐‐ 100.1Col 3 960 8.64 0.1269 0.0005 0.0017 ‐‐ 33.5819 0.0355 1.2795 83.1598 63.1257 0.02620106 2.2282 ‐‐ 100.1Col 3 1020 8 64 0 1197 0 001 0 0013 32 8334 0 0373 1 5031 84 8681 62 0837 0 02704974 1 2399 100 1Col 3 1020 8.64 0.1197 0.001 0.0013 ‐‐ 32.8334 0.0373 1.5031 84.8681 62.0837 0.02704974 1.2399 ‐‐ 100.1Col 3 1080 8.64 0.1167 0.0008 0.0026 ‐‐ 15.9543 ‐‐ 1.8106 89.8835 31.5913 0.02794858 0.7468 ‐‐ 100.0Col 3 1140 8.64 0.1211 0.0019 0.0015 ‐‐ 31.141 0.0192 1.9028 87.4077 58.6643 0.02882265 0.4183 ‐‐ 100.0Col 3 1200 8.64 0.1279 0.0019 0.0017 ‐‐ 38.6521 0.0107 1.9243 87.5264 71.6108 0.02969792 0.5462 ‐‐ 100.0Col 3 1200 8.64 0.1279 0.0019 0.0017 38.6521 0.0107 1.9243 87.5264 71.6108 0.02969792 0.5462 100.0Col 3 1260 8.64 0.1273 0.0015 0.0019 ‐‐ 34.4486 ‐‐ 2.0769 88.3269 64.2787 0.03058119 0.2975 ‐‐ 100.0Col 3 1320 8.64 0.117 0.0007 0.001 ‐‐ 30.1913 0.0392 2.11 88.5594 55.5692 0.03146678 0.2727 ‐‐ 100.0Col 3 1380 8.64 0.1288 0.0014 0.0018 ‐‐ 37.334 0.0589 1.7686 88.4144 68.2401 0.03235092 0.3092 ‐‐ 100.0Col 3 1440 8.64 0.1348 0.0012 0.0014 ‐‐ 70.7172 0.1661 1.4877 78.6381 131.8655 0.0331373 0.3981 ‐‐ 100.0Col 3 1500 8.64 0.909 0.0031 0.0032 ‐‐ 14.5481 0.0807 0.6655 90.1122 26.6794 0.03403843 ‐‐ ‐‐ 100.0Col 3 1560 8.64 0.1239 0.0018 0.0018 ‐‐ 20.3185 0.0432 1.273 88.4882 36.0704 0.03492331 0.2611 ‐‐ 100.0Col 3 1620 8.64 0.1167 0.0037 0.002 ‐‐ 20.4624 0.0581 1.4224 89.415 36.3787 0.03581746 0.3292 ‐‐ 100.0Col 3 1680 8.64 0.1233 0.0039 0.0023 ‐‐ 16.8679 0.0346 1.7951 90.4876 29.7615 0.03672233 0.0559 ‐‐ 100.0Col 3 1740 8.67 0.1179 0.0029 0.0023 ‐‐ 15.5847 0.0285 2.0197 91.604 29.4592 0.03763837 0.2912 ‐‐ 100.0C l 3 1800 8 67 0 1294 0 0018 0 0008 21 5411 2 248 88 7914 35 9177 0 03852629 0 3655 100 0Col 3 1800 8.67 0.1294 0.0018 0.0008 ‐‐ 21.5411 ‐‐ 2.248 88.7914 35.9177 0.03852629 0.3655 ‐‐ 100.0Col 3 1860 8.67 0.1305 0.0011 0.0007 ‐‐ 24.0464 ‐‐ 2.4594 87.3871 36.5591 0.03940016 0.3594 ‐‐ 100.0Col 3 1920 8.67 0.1283 0.0012 0.0012 ‐‐ 23.5365 ‐‐ 2.7421 85.2089 34.4868 0.04025225 0.3762 ‐‐ 100.0Col 3 1980 8 67 0 1219 0 0029 0 0013 ‐‐ 27 8821 ‐‐ 2 7695 82 0092 38 4962 0 04107234 0 3893 ‐‐ 100 0Col 3 1980 8.67 0.1219 0.0029 0.0013 ‐‐ 27.8821 ‐‐ 2.7695 82.0092 38.4962 0.04107234 0.3893 ‐‐ 100.0Col 3 2040 8.67 0.1277 0.0009 0.0016 ‐‐ 18.5225 ‐‐ 3.1981 83.4685 25.6004 0.04190703 0.3978 ‐‐ 100.0Col 3 2100 8.67 0.126 0.0018 0.0012 ‐‐ 30.5635 ‐‐ 2.9959 77.8948 40.1274 0.04268597 0.4364 ‐‐ 100.0
Injection‐Leaching.xlsx Page 9 of 11 3/24/2009

APPENDIX A-5
AEROBIC LEACHING EXPERIMENT RESULTS - COLUMN 3
COLUMN STUDYAvon Park Air Force Range
Avon Park, Florida
Column #Time
pHSulfate Nitrite Chloride Propionate Acetate Formate Fluoride
Compound Name (units)
% As Phosphate Thiosulfate Arsenate Bromide Column #
(mins.)pH
(ppm) (ppm)(ppm)(ppm)(ppm)(ppm)(ppm) remaining(ppm) (ppm) (ppm) Total Sulfate (g)
(ppm)
Col 3 2160 8.67 0.1231 0.0014 0.0024 ‐‐ 20.2771 ‐‐ 3.3973 79.2446 25.1127 0.04347842 0.4381 ‐‐ 100.0lCol 3 2220 8.67 0.1355 0.0017 0.0024 ‐‐ 18.5245 ‐‐ 3.525 79.4135 23.7139 0.04427255 0.3688 ‐‐ 100.0
Col 3 2280 8.67 0.1331 0.0054 0.0021 ‐‐ 42.4266 ‐‐ 3.2677 70.251 53.2591 0.04497506 0.4069 ‐‐ 99.9Col 3 2340 8.67 0.1262 0.0025 0.0017 ‐‐ 20.6961 ‐‐ 3.6086 74.7519 22.5896 0.04572258 0.4326 ‐‐ 99.9Col 3 2400 8 67 0 1461 0 0016 0 001 39 9649 3 0902 64 9409 42 7197 0 04637199 0 4503 99 9Col 3 2400 8.67 0.1461 0.0016 0.001 ‐‐ 39.9649 ‐‐ 3.0902 64.9409 42.7197 0.04637199 0.4503 ‐‐ 99.9Col 3 2460 8.67 0.1336 0.0016 0.0012 ‐‐ 19.0362 ‐‐ 2.1297 67.478 19.3918 0.04704677 0.366 ‐‐ 99.9Col 3 2520 8.67 0.1188 0.0009 0.0016 ‐‐ 12.0553 ‐‐ 0.5797 27.3012 9.884 0.04731978 0.2701 1.2692 99.9Col 3 2580 8.67 0.1357 0.0013 0.0022 ‐‐ 18.1737 0.0052 2.1554 61.9048 17.6113 0.04793883 0.3466 1.9512 99.9Col 3 2580 8.67 0.1357 0.0013 0.0022 18.1737 0.0052 2.1554 61.9048 17.6113 0.04793883 0.3466 1.9512 99.9Col 3 2640 8.67 0.1292 0.001 0.0012 ‐‐ 15.4443 ‐‐ 1.4808 42.8312 12.9858 0.04836714 0.2956 1.6641 99.9Col 3 2700 8.67 0.1239 0.0011 0.0042 ‐‐ 15.0504 ‐‐ 1.372 40.9825 12.1651 0.04877697 0.2804 1.4214 99.9Col 3 2760 8.67 0.1296 0.0024 0.0015 ‐‐ 16.6022 ‐‐ 1.5473 40.7448 12.5952 0.04918442 0.289 1.8023 99.9Col 3 2820 8.67 0.1308 0.0017 0.0013 ‐‐ 14.5335 ‐‐ 1.3695 35.5964 10.3411 0.04954038 0.2743 1.5184 99.9Col 3 2880 8.67 0.1297 0.0014 0.0015 ‐‐ 12.9998 0.0024 1.0227 31.1985 10.216 0.04985237 0.2246 1.3611 99.9Col 3 2940 8.67 0.1267 0.0013 0.0009 ‐‐ 13.3661 ‐‐ 1.1496 33.8117 11.2341 0.05019048 0.2513 2.0041 99.9Col 3 3000 8.67 0.1287 0.0013 0.0015 ‐‐ 13.5603 ‐‐ 1.0677 27.3649 8.5095 0.05046413 0.2502 1.3099 99.9Col 3 3060 8.59 0.1345 0.0007 0.0006 ‐‐ 16.2552 0.0149 1.4963 35.478 10.9111 0.05081891 0.2501 1.5397 99.9Col 3 3120 8.59 0.7363 0.0007 0.0018 ‐‐ 17.5524 0.0423 1.6415 23.0344 11.281 0.05104926 0.0668 1.6157 99.9C l 3 3180 8 59 0 1405 0 0042 0 0016 17 7643 1 6021 23 3124 11 5272 0 05128238 0 2515 1 6218 99 9Col 3 3180 8.59 0.1405 0.0042 0.0016 ‐‐ 17.7643 ‐‐ 1.6021 23.3124 11.5272 0.05128238 0.2515 1.6218 99.9Col 3 3240 8.59 0.9852 0.0007 0.0003 ‐‐ 16.3739 ‐‐ 1.5657 21.4877 11.225 0.05149726 0.2295 1.3344 99.9Col 3 3300 8.59 0.1467 ‐‐ ‐‐ ‐‐ ‐‐ ‐‐ 1.2662 19.5502 10.2239 0.05169276 0.0711 1.1788 99.9Col 3 3360 8 59 0 139 ‐‐ ‐‐ ‐‐ ‐‐ ‐‐ 1 4088 21 0164 10 2357 0 05190292 0 0721 1 3108 99 9Col 3 3360 8.59 0.139 1.4088 21.0164 10.2357 0.05190292 0.0721 1.3108 99.9Col 3 3420 8.59 0.1484 ‐‐ ‐‐ ‐‐ ‐‐ ‐‐ 1.0273 18.9501 8.5917 0.05209242 0.0595 1.1932 99.9Col 3 3480 8.59 0.1386 ‐‐ ‐‐ ‐‐ ‐‐ ‐‐ 1.117 19.566 8.5494 0.05228808 0.0576 1.0485 99.9Col 3 3540 8.59 0.1381 ‐‐ ‐‐ ‐‐ ‐‐ ‐‐ 0.9545 19.5671 8.4035 0.05248376 0.1849 1.3093 99.9Col 3 3600 8.59 0.147 ‐‐ ‐‐ ‐‐ ‐‐ ‐‐ 1.1323 20.0237 8.4374 0.05268399 0.0548 1.0359 99.9Col 3 3660 8.59 0.1504 ‐‐ ‐‐ ‐‐ ‐‐ ‐‐ 1.1165 20.9588 8.5367 0.05289358 0.0537 1.3463 99.9Col 3 3720 8.59 0.1436 ‐‐ ‐‐ ‐‐ ‐‐ ‐‐ 1.3249 23.1497 8.4451 0.05312508 0.2149 0.9987 99.9Col 3 3780 8.59 0.1417 ‐‐ ‐‐ ‐‐ ‐‐ 0.062 1.2845 21.825 8.1384 0.05334333 0.2083 1.0073 99.9Col 3 3840 8.59 0.1456 ‐‐ ‐‐ ‐‐ ‐‐ ‐‐ 1.1958 21.5682 7.3366 0.05355901 0.2267 0.7661 99.9Col 3 3900 8.59 0.1573 ‐‐ ‐‐ ‐‐ ‐‐ ‐‐ 1.262 24.6035 7.952 0.05380504 0.2263 0.7288 99.9C l 3 3960 8 59 0 1396 1 2537 22 0329 7 4568 0 05402537 0 184 0 6438 99 9Col 3 3960 8.59 0.1396 ‐‐ ‐‐ ‐‐ ‐‐ ‐‐ 1.2537 22.0329 7.4568 0.05402537 0.184 0.6438 99.9Col 3 4020 8.59 0.1518 ‐‐ ‐‐ ‐‐ ‐‐ ‐‐ 1.2507 22.6073 7.5421 0.05425145 0.1834 0.6858 99.9Col 3 4080 8.59 0.1441 ‐‐ ‐‐ ‐‐ ‐‐ ‐‐ 1.1356 21.8343 7.1162 0.05446979 0.1535 0.7025 99.9Col 3 4200 8 59 0 1444 1 0465 22 3483 6 6971 0 05469327 0 1853 1 019 99 9Col 3 4200 8.59 0.1444 ‐‐ ‐‐ ‐‐ ‐‐ ‐‐ 1.0465 22.3483 6.6971 0.05469327 0.1853 1.019 99.9Col 3 4260 8.59 0.1482 ‐‐ ‐‐ ‐‐ ‐‐ ‐‐ 0.8039 19.2242 6.1366 0.05488551 0.1944 0.7383 99.9Col 3 4320 8.59 0.1508 ‐‐ ‐‐ ‐‐ ‐‐ ‐‐ 1.062 21.8941 7.2723 0.05510446 0.1432 0.5347 99.9
Injection‐Leaching.xlsx Page 10 of 11 3/24/2009

APPENDIX A-5
AEROBIC LEACHING EXPERIMENT RESULTS - COLUMN 3
COLUMN STUDYAvon Park Air Force Range
Avon Park, Florida
Column #Time
pHSulfate Nitrite Chloride Propionate Acetate Formate Fluoride
Compound Name (units)
% As Phosphate Thiosulfate Arsenate Bromide Column #
(mins.)pH
(ppm) (ppm)(ppm)(ppm)(ppm)(ppm)(ppm) remaining(ppm) (ppm) (ppm) Total Sulfate (g)
(ppm)
Col 3 4380 8.59 0.1438 ‐‐ ‐‐ ‐‐ ‐‐ ‐‐ 0.6178 18.0738 5.5198 0.05528519 0.1817 0.8052 99.9lCol 3 4440 8.59 0.1443 ‐‐ ‐‐ ‐‐ ‐‐ 0.0048 2.6093 20.8574 6.1023 0.05549377 0.1556 ‐‐ 99.9
Col 3 4500 8.59 0.1572 ‐‐ ‐‐ ‐‐ ‐‐ ‐‐ 1.0169 22.4926 9.173 0.05571869 0.1751 1.2505 99.9Col 3 4560 8.59 0.1503 ‐‐ ‐‐ ‐‐ ‐‐ 0.0032 1.0527 22.9545 8.739 0.05594824 0.1899 1.2921 99.9
‐‐ = Not Analyzed
Injection‐Leaching.xlsx Page 11 of 11 3/24/2009

APPENDIX A-6
SLUG TEST SUPPORTING DATA

Hvorslev Slug Test Method
Field DataPositive Corrected
Et (sec) Pressure (ft H2O) Displacement, Ht t (min) Ht/H0
0 0.744 0.739 0 11.14 0.737 0.732 0.019 0.990527742.34 0.706 0.701 0.039 0.948579163 6 0 685 0 68 0 06 0 920162383.6 0.685 0.68 0.06 0.92016238
4.92 0.653 0.648 0.082 0.876860626.36 0.623 0.618 0.106 0.836265227.86 0.596 0.591 0.131 0.799729369.42 0.566 0.561 0.157 0.7591339611.1 0.541 0.536 0.185 0.72530447 Fitted Line T0 Line12.9 0.51 0.505 0.215 0.68335589 0.575
14 76 0 482 0 477 0 246 0 64546685 t Ht/H014.76 0.482 0.477 0.246 0.64546685 t Ht/H016.81 0.457 0.452 0.280167 0.61163735 0.1 0.852143789 0.575 1 0.1 0.3718.9 0.429 0.424 0.315 0.57374831 0.2 0.726149037 0.575 0.7 0.2 0.37
21.12 0.406 0.401 0.352 0.54262517 0.3 0.618783392 0.575 0.6 0.3 0.3723.52 0.378 0.373 0.392 0.50473613 0.4 0.527292424 0.575 0.5 0.4 0.3726.04 0.354 0.349 0.434 0.47225981 0.6 0.382892886 0.575 0.4 0.6 0.3728.68 0.336 0.331 0.478 0.44790257 0.8 0.2780373 0.575 0.3 0.8 0.3731 5 0 312 0 307 0 525 0 4154262531.5 0.312 0.307 0.525 0.41542625 1 0.201896518 0.575 0.2 1 0.3734.5 0.283 0.278 0.575 0.37618403 2 0.040762204 0.575 0 2 0.37
37.68 0.265 0.26 0.628 0.35182679 3 0.008229747 0.575 0 3 0.3741.039 0.242 0.237 0.683983 0.32070365 4 0.001661557 0.575 0 4 0.3744.64 0.225 0.22 0.744 0.29769959 6 6.77287E-05 0.575 0 6 0.3748.24 0.201 0.196 0.804 0.26522327 8 2.76077E-06 0.575 0 8 0.3752.44 0.185 0.18 0.874 0.2435724 10 1.12535E-07 0.575 0 10 0.3756 64 0 167 0 162 0 944 0 2192151656.64 0.167 0.162 0.944 0.21921516 12 4.58718E-09 0.575 0 10 0.37
60.84 0.152 0.147 1.014 0.1989174665.64 0.14 0.135 1.094 0.182679371.04 0.123 0.118 1.184 0.1596752475.84 0.105 0.1 1.264 0.13531881.84 0.096 0.091 1.364 0.1231393887.84 0.08 0.075 1.464 0.101488593.84 0.073 0.068 1.564 0.09201624
100.44 0.062 0.057 1.674 0.07713126107.64 0.045 0.04 1.794 0.0541272
115.439 0.049 0.044 1.923983 0.05953992123.24 0.028 0.023 2.054 0.03112314131.64 0.025 0.02 2.194 0.0270636140.64 0.019 0.014 2.344 0.01894452
150.239 0.013 0.008 2.503983 0.01082544159.84 0.005 0 2.664 0

CALCULATION OF HYDRAULIC CONDUCTIVITY (K) BY HVORSLEV METHOD
Hvorslev Equation:
H0 (ft) = 0.739 Maximum distance below static water levelHt (ft) = varies Distance below static water table at time = t
r (ft) = 0 167 Radius of the well casing 4" DIAMETER SCH 40 PVC WELL CASING
CALCULATION OF HYDRAULIC CONDUCTIVITY (K) BY HVORSLEV METHOD
K = r2 ln (L/r)2 L To
r (ft) = 0.167 Radius of the well casing 4" DIAMETER SCH 40 PVC WELL CASINGR (ft) = 0.300 Radius of the boreholeL (ft) = 10 Length of the screened interval hL/R = 33.33333333 Ho
T0 (min) = 0.575 8" DIAMETER HOLLOW STEM AUGER HOLEm = -1.6 Slope of Fit Line
K (ft/d ) 12 2 Hydraulic ConductivityK (ft/day) = 12.2 Hydraulic Conductivity
2r
1
TOP OF SCREEN INTERVAL= 5.0 FT BLS
L 1" FLUSH THREAD SCH 40 PVC 0.010 SLOTWELL SCREEN
BOTTOM OF SCREEN INTERVAL= 15.0 FT BLS
2R
0.1
Ht/H
0 Fit
To
0.37
MW-2
FIGURE NO.GEOSYNTEC CONSULTANTS PROJECT NO.
TITUSVILLE, FL DATE
0.010 1 2 3 4
time (min) FILE NO.time (min)

APPENDIX A-7
SEQUENTIAL EXTRACTS OF SEDIMENT FROM FIELD PILOT STUDY

APPENDIX A-7
SEQUENTIAL EXTRACTS OF SEDIMENT FROM FIELD PILOT STUDY
PILOT TEST STUDYAvon Park Air Force Range
Avon Park, Florida
Iron Coated sandMW‐1 MW‐1 MW‐1
mmol/kg mmol/kg mmol/kg4/4/2008 9/4/2008 12/14/2008
MgCl2 As 74.92 0.00335 0.007073 0.00668865MgCl2 Fe 55.85 0.48507 1.343979 1.68809761M Cl2 M 54 94 0 01282 0 011647 0 00928716
MW (g/mol)
ElementExtraction
MgCl2 Mn 54.94 0.01282 0.011647 0.00928716MgCl2 S 32.06MgCl2 P 30.97 0.03301 0.008826 0NaOH‐HOAc As 74.92 0.02646 0.044471 0.03963213NaOH‐HOAc Fe 55.85 3.48541 18.96264 21.3234272NaOH‐HOAc Mn 54.94 0.0322 0.027989 0.0231738NaOH‐HOAc S 32.06 0.05474 0.211488 0.35999838NaOH HOAc S 32.06 0.05474 0.211488 0.35999838NaOH‐HOAc P 30.97 2.37239 3.185947 3.71848416AOD As 74.92 0.05541 0.035347 0.04018667AOD Fe 55.85 2.02277 4.104441 3.61529681AOD Mn 54.94 0.07888 0.088306 0.11855286AOD S 32.06 0 0 2.22885941AOD P 30.97 0.42824 0.443428 0.43233281Hydroxylamine HCL As 74.92 0.01415 0.230541 0.21849286Hydroxylamine HCL Fe 55.85 39.1128 58.76907 59.9855646Hydroxylamine HCL Mn 54.94 0.25617 0.390244 0.37965998Hydroxylamine HCL S 32.06 0 6.332345 5.72587787Hydroxylamine HCL P 30.97 0.42824 3.932796 4.02477433Aquaregia As 74.92 0.0472 0.022336 0.02984159Aquaregia Fe 55 85 50 7475 52 9857 51 7398121Aquaregia Fe 55.85 50.7475 52.9857 51.7398121Aquaregia Mn 54.94 0.48784 0.909081 0.69196547Aquaregia S 32.06 0 7.359213 5.36558824Aquaregia P 30.97 0.98138 0.537121 0.82784455TOTAL As 74.92 0.14658 0.339767 0.33484189TOTAL Fe 55.85 95.8535 136.1658 138.352198TOTAL Mn 54.94 0.86791 1.427268 1.22263927TOTAL S 32.06 0.05474 13.90305 13.6803239TOTAL P 30.97 4.24326 8.108118 9.00343584
Sediments.xlsx Page 1 of 8 3/23/2009

APPENDIX A-7
SEQUENTIAL EXTRACTS OF SEDIMENT FROM FIELD PILOT STUDY
PILOT TEST STUDYAvon Park Air Force Range
Avon Park, Florida
Uncoated SandMW‐1 MW‐1 MW‐1
mmol/kg mmol/kg mmol/kg4/4/2008 9/4/2008 12/14/2008
MgCl2 As 74.92 0.00342 0.002159 0.01053129MgCl2 Fe 55.85 0.14712 0.682177 1.51887844M Cl2 M 54 94 0 0 0
MW (g/mol)
ElementExtraction
MgCl2 Mn 54.94 0 0 0MgCl2 S 32.06 0 0 0MgCl2 P 30.97 0.0198 0 0NaOH‐HOAc As 74.92 0.01511 0.032011 0.03257858NaOH‐HOAc Fe 55.85 19.0355 10.44195 14.06484NaOH‐HOAc Mn 54.94 0.02519 0.010462 0.0068378NaOH‐HOAc S 32.06 0.09657 0.110087 0.25601413NaOH HOAc S 32.06 0.09657 0.110087 0.25601413NaOH‐HOAc P 30.97 0.33739 0.216787 0.10263868AOD As 74.92 0.04712 0.055942 0.03910919AOD Fe 55.85 2.01581 2.962438 4.28545287AOD Mn 54.94 0.05956 0.04086 0.04619212AOD S 32.06 0 0 0AOD P 30.97 0.10565 0.450612 0.45973889Hydroxylamine HCL As 74.92 0.01601 0.167091 0.106714Hydroxylamine HCL Fe 55.85 8.5725 1.291688 0.48460454Hydroxylamine HCL Mn 54.94 0.00321 0.003501 0.00021304Hydroxylamine HCL S 32.06 0.77515 1.297085 1.82536935Hydroxylamine HCL P 30.97 0.4685 0 0Aquaregia As 74.92 0.01748 0.008484 0.00140326Aquaregia Fe 55 85 2 48458 3 500698 3 89049865Aquaregia Fe 55.85 2.48458 3.500698 3.89049865Aquaregia Mn 54.94 0.01891 0.051974 0.05532147Aquaregia S 32.06 1.52213 2.663361 4.30951212Aquaregia P 30.97 0 0 0TOTAL As 74.92 0.09914 0.265687 0.19033632TOTAL Fe 55.85 32.2555 18.87895 24.2442745TOTAL Mn 54.94 0.10687 0.106797 0.10856443TOTAL S 32.06 2.39385 4.070533 6.3908956TOTAL P 30.97 0.93134 0.667399 0.56237757
Sediments.xlsx Page 2 of 8 3/23/2009

APPENDIX A-7
SEQUENTIAL EXTRACTS OF SEDIMENT FROM FIELD PILOT STUDY
PILOT TEST STUDYAvon Park Air Force Range
Avon Park, Florida
Iron Coated sandMW‐2 MW‐2 MW‐2
mmol/kg mmol/kg mmol/kg4/4/2008 9/4/2008 12/14/2008
MgCl2 As 74.92 0.0133516 0.0069551 0.00389125MgCl2 Fe 55.85 0.1972801 2.1427272 2.81987138M Cl2 M 54 94 0 0009708 0 0 00839362
Extraction ElementMW
(g/mol)
MgCl2 Mn 54.94 0.0009708 0 0.00839362MgCl2 S 32.06 0 0 0MgCl2 P 30.97 0.0562392 0.019545 0.03126992NaOH‐HOAc As 74.92 0.0123276 0.0406206 0.04164237NaOH‐HOAc Fe 55.85 4.6783227 12.867607 36.0118208NaOH‐HOAc Mn 54.94 0.0350945 0.0086565 0.05044454NaOH‐HOAc S 32.06 0.1544047 0.1207027 0.23313871NaOH HOAc S 32.06 0.1544047 0.1207027 0.23313871NaOH‐HOAc P 30.97 2.9160962 0.0939034 4.96352732AOD As 74.92 0.0453732 0.0807482 0.03827021AOD Fe 55.85 2.057957 5.2901405 8.55829193AOD Mn 54.94 0.059557 0.0413499 0.10983192AOD S 32.06 0 0 3.13239021AOD P 30.97 0.4694701 0.4323432 0.45559256Hydroxylamine HCL As 74.92 0.0039838 0.2142269 0.20032979Hydroxylamine HCL Fe 55.85 51.520878 0.1128087 57.7099451Hydroxylamine HCL Mn 54.94 0.3361337 0 0.32640807Hydroxylamine HCL S 32.06 3.003373 7.1219248 11.3182616Hydroxylamine HCL P 30.97 0.4694701 0 3.95347647Aquaregia As 74.92 0.0411277 0.0029677 0.03131359Aquaregia Fe 55 85 56 510678 2 760796 49 5659645Aquaregia Fe 55.85 56.510678 2.760796 49.5659645Aquaregia Mn 54.94 0.8244336 0.0471057 1.29896319Aquaregia S 32.06 0 6.9308998 30.7548461Aquaregia P 30.97 0.5588986 0 0TOTAL As 74.92 0.1161639 0.3455185 0.31544721TOTAL Fe 55.85 114.96512 23.174079 154.665894TOTAL Mn 54.94 1.2561897 0.0971121 1.79404135TOTAL S 32.06 3.1577777 14.173527 45.4386367TOTAL P 30.97 4.4701744 0.5457916 9.40386627
Sediments.xlsx Page 3 of 8 3/23/2009

APPENDIX A-7
SEQUENTIAL EXTRACTS OF SEDIMENT FROM FIELD PILOT STUDY
PILOT TEST STUDYAvon Park Air Force Range
Avon Park, Florida
Uncoated SandMW‐2 MW‐2 MW‐2
mmol/kg mmol/kg mmol/kg4/4/2008 9/4/2008 12/14/2008
MgCl2 As 74.92 0.0150708 0 0.00387749M Cl2 F 55 85 0 1931775 1 5695404 1 61242696
Extraction ElementMW
(g/mol)
MgCl2 Fe 55.85 0.1931775 1.5695404 1.61242696MgCl2 Mn 54.94 0.0003848 0 0.0078361MgCl2 S 32.06 0 0 0MgCl2 P 30.97 0.0452753 0.0033709 0.0196733NaOH‐HOAc As 74.92 0.0576175 0.0269302 0.02111467NaOH‐HOAc Fe 55.85 20.944274 5.9715957 7.4367724NaOH‐HOAc Mn 54.94 0.0305443 0.0044879 0.00430329NaOH HOAc Mn 54.94 0.0305443 0.0044879 0.00430329NaOH‐HOAc S 32.06 0.2244234 0.1663394 0.1129991NaOH‐HOAc P 30.97 0.5765888 0.1662643 0.10018465AOD As 74.92 0.0358943 0.0452027 0.04784227AOD Fe 55.85 2.0159416 3.5986137 5.19966485AOD Mn 54.94 0.0223303 0.0380525 0.05170104AOD S 32.06 0 0 0AOD P 30.97 0.0901912 0.4475379 0.37954281Hydroxylamine HCL As 74.92 0.1729158 0.1548411 0.15290233Hydroxylamine HCL Fe 55.85 7.6970434 0.0534257 41.4651038Hydroxylamine HCL Mn 54.94 0.0034672 0 0.26723477Hydroxylamine HCL S 32.06 1.1639892 3.7191605 0.9711358Hydroxylamine HCL P 30.97 0.4555779 0 1.89393068Aquaregia As 74 92 0 0061468 0 0114421 0 00865468Aquaregia As 74.92 0.0061468 0.0114421 0.00865468Aquaregia Fe 55.85 2.480028 1.2475813 2.51404123Aquaregia Mn 54.94 0.0300759 0.0144236 0.03877292Aquaregia S 32.06 0.8727963 2.1506078 3.05203337Aquaregia P 30.97 0 0 0TOTAL As 74.92 0.2876452 0.2384162 0.23439145TOTAL Fe 55.85 33.330464 12.440757 58.2280093TOTAL Mn 54.94 0.0868025 0.056964 0.36984811TOTAL S 32.06 2.2612089 6.0361077 4.13616827TOTAL P 30.97 1.1676331 0.6171731 2.39333144
Sediments.xlsx Page 4 of 8 3/23/2009

APPENDIX A-7
SEQUENTIAL EXTRACTS OF SEDIMENT FROM FIELD PILOT STUDY
PILOT TEST STUDYAvon Park Air Force Range
Avon Park, Florida
Iron coated sandMW‐3 MW‐3 MW‐3
mmol/kg mmol/kg mmol/kg4/4/2008 9/4/2008 12/14/2008
MgCl2 As 74.92 0 0.0115622 0MgCl2 Fe 55.85 0.1753861 0.4208372 0.34367108MgCl2 Mn 54.94 0.0052093 0.0070869 0.00811113MgCl2 S 32.06 0 0 0MgCl2 P 30.97 0.0279485 0 0.10615147NaOH‐HOAc As 74.92 0.0171496 0.002982 0.02795241NaOH‐HOAc Fe 55.85 3.3011021 1.6951622 4.59257986NaOH‐HOAc Mn 54.94 0.0335346 0.0025353 0.02153838NaOH‐HOAc S 32.06 0.1275839 0 0.06966152NaOH‐HOAc P 30.97 1.9145293 0.0546169 3.36983781AOD As 74.92 0.0425062 0.0529208 0.03680098AOD Fe 55.85 2.0516963 2.4418577 2.19659467AOD Mn 54.94 0.0742408 0.0889397 0.12812926AOD S 32.06 0 0 0AOD P 30.97 0.4467695 0.4826211 0.29649944Hydroxylamine HCL As 74.92 0.0400331 0.2217048 0.16409248Hydroxylamine HCL Fe 55.85 79.453216 77.265876 41.0431621Hydroxylamine HCL Mn 54.94 0.6127949 0.56127 0.26734204Hydroxylamine HCL S 32.06 1.6601202 1.497982 0.64918198Hydroxylamine HCL P 30.97 0.4467695 3.3237422 1.88902862Aquaregia As 74.92 0.016907 0.0046149 0.01950358Aquaregia Fe 55.85 26.727772 41.001912 37.4978225Aquaregia Mn 54.94 0.3784241 0.9872893 0.39525555Aquaregia S 32.06 0 0 0.96699466Aquaregia P 30.97 0.2631124 0 0.78414333TOTAL As 74.92 0.1165959 0.2937848 0.24834945TOTAL Fe 55.85 111.70917 122.82565 85.6738302TOTAL Mn 54.94 1.1042038 1.6471212 0.82037638TOTAL S 32.06 1.7877041 1.497982 1.68583815TOTAL P 30.97 3.0991291 3.8609803 6.44566068
Extraction ElementMW
(g/mol)
Sediments.xlsx Page 5 of 8 3/23/2009

APPENDIX A-7
SEQUENTIAL EXTRACTS OF SEDIMENT FROM FIELD PILOT STUDY
PILOT TEST STUDYAvon Park Air Force Range
Avon Park, Florida
Uncoated SandMW‐3 MW‐3 MW‐3
mmol/kg mmol/kg mmol/kg4/4/2008 9/4/2008 12/14/2008
MgCl2 As 74.92 0.0041488 0.0125119 0.01393796MgCl2 Fe 55.85 0.1640235 0.2302112 0.27298111MgCl2 Mn 54.94 0.0003968 0 0.00899167MgCl2 S 32.06 0 0 0MgCl2 P 30.97 0.0393328 0.0647572 0.12058384NaOH‐HOAc As 74.92 0.0027456 0.014599 0.01672443NaOH‐HOAc Fe 55.85 20.280094 10.055528 12.487024NaOH‐HOAc Mn 54.94 0.0287959 0.0067164 0.008576NaOH‐HOAc S 32.06 0.1853065 0.107946 0.17348623NaOH‐HOAc P 30.97 0.4912407 0.5280956 1.1043187AOD As 74.92 0.0376323 0.037013 0.03486016AOD Fe 55.85 2.0066561 2.07543 2.14994842AOD Mn 54.94 0.0616856 0.0549049 0.10372708AOD S 32.06 0 0 0AOD P 30.97 0.4740117 0.4790211 0.41811084Hydroxylamine HCL As 74.92 0.2446123 0.2518047 0.15728774Hydroxylamine HCL Fe 55.85 11.553611 2.2580903 8.17185526Hydroxylamine HCL Mn 54.94 0.0144965 0.0062162 0.00984108Hydroxylamine HCL S 32.06 2.5723058 2.8625715 0.35017678Hydroxylamine HCL P 30.97 0.4740117 0 0.13487953Aquaregia As 74.92 0.0034011 0.009843 0.00879223Aquaregia Fe 55.85 2.1611446 2.7737203 7.85518658Aquaregia Mn 54.94 0.0283799 0.0528427 0.0430679Aquaregia S 32.06 0.6450808 0.7218432 2.14211843Aquaregia P 30.97 0 0 0TOTAL As 74.92 0.2925401 0.3257717 0.23160253TOTAL Fe 55.85 36.165529 17.39298 30.9369954TOTAL Mn 54.94 0.1337547 0.1206802 0.17420373TOTAL S 32.06 3.4026931 3.6923607 2.66578143TOTAL P 30.97 1.478597 1.0718739 1.7778929
ElementMW
(g/mol)Extraction
Sediments.xlsx Page 6 of 8 3/23/2009

APPENDIX A-7
SEQUENTIAL EXTRACTS OF SEDIMENT FROM FIELD PILOT STUDY
PILOT TEST STUDYAvon Park Air Force Range
Avon Park, Florida
Iron Coated sandMW‐4 MW‐4 MW‐4
mmol/kg mmol/kg mmol/kg4/4/2008 9/4/2008 12/14/2008
MgCl2 As 74.92 0.0116838 0.0132029 0.01185223MgCl2 Fe 55.85 0.2119464 1.2920468 2.52963549MgCl2 Mn 54.94 0.0067336 0.0079852 0.01109262MgCl2 S 32.06 0 0 0MgCl2 P 30.97 0.0656532 0.0001461 0.00918535NaOH‐HOAc As 74.92 0.0327519 0.0664478 0.08257942NaOH‐HOAc Fe 55.85 6.9676228 13.331417 18.2362005NaOH‐HOAc Mn 54.94 0.0363471 0.0222222 0.03596301NaOH‐HOAc S 32.06 0.2347797 0.2035046 0.22707905NaOH‐HOAc P 30.97 3.1833151 3.8622129 3.80850571AOD As 74.92 0.0409369 0.0493971 0.04714472AOD Fe 55.85 2.0688115 2.7195711 7.42207887AOD Mn 54.94 0.0799843 0.0808568 0.11409331AOD S 32.06 0 0 3.00920664AOD P 30.97 0.4967761 0.4208437 0.35526253Hydroxylamine HCL As 74.92 0.054913 0.2886926 0.33833273Hydroxylamine HCL Fe 55.85 82.5261 64.75754 58.4933341Hydroxylamine HCL Mn 54.94 0.6027626 0.4477738 0.39229222Hydroxylamine HCL S 32.06 3.1165059 9.7686358 7.33772902Hydroxylamine HCL P 30.97 0.4967761 4.1441545 3.7395513Aquaregia As 74.92 0.0685385 0.0320403 0.0369168Aquaregia Fe 55.85 28.696666 69.509368 51.535297Aquaregia Mn 54.94 0.5255536 1.8845656 0.93772187Aquaregia S 32.06 0 2.2579521 8.37409065Aquaregia P 30.97 0.1838257 0 0.07519816TOTAL As 74.92 0.2088241 0.4497807 0.51682589TOTAL Fe 55.85 120.47115 151.60994 138.216546TOTAL Mn 54.94 1.2513811 2.4434035 1.49116302TOTAL S 32.06 3.3512856 12.230093 18.9481054TOTAL P 30.97 4.4263461 8.4273571 7.98770306
Extraction ElementMW
(g/mol)
Sediments.xlsx Page 7 of 8 3/23/2009

APPENDIX A-7
SEQUENTIAL EXTRACTS OF SEDIMENT FROM FIELD PILOT STUDY
PILOT TEST STUDYAvon Park Air Force Range
Avon Park, Florida
Uncoated SandMW‐4 MW‐4 MW‐4
mmol/kg mmol/kg mmol/kg4/4/2008 9/4/2008 12/14/2008
MgCl2 As 74.92 0.002901 0 0.00858671MgCl2 Fe 55.85 0.1546551 1.1150235 1.19801718MgCl2 Mn 54.94 0 0 0MgCl2 S 32.06 0 0 0MgCl2 P 30.97 0.029924 0 0.05778743NaOH‐HOAc As 74.92 0.0110812 0.047675 0.03229367NaOH‐HOAc Fe 55.85 17.21815 6.8506175 4.63946299NaOH‐HOAc Mn 54.94 0.0223303 0.0071136 0.00380331NaOH‐HOAc S 32.06 0.2160618 0.2065252 0.30223755NaOH‐HOAc P 30.97 0.2943275 0.150665 0.09965287AOD As 74.92 0.0311399 0.053441 0.03931693AOD Fe 55.85 2.010609 3.0025426 5.39799726AOD Mn 54.94 0.0530531 0.0392604 0.05716157AOD S 32.06 0 0 0.79994293AOD P 30.97 0.4684346 0.4405846 0.36852606Hydroxylamine HCL As 74.92 0.1682433 0.143285 0.20693253Hydroxylamine HCL Fe 55.85 3.4314857 0.8731854 0.5725878Hydroxylamine HCL Mn 54.94 0.0086454 0.0021693 0.01784867Hydroxylamine HCL S 32.06 1.3586865 0.8368254 2.57660657Hydroxylamine HCL P 30.97 0.4684346 0 0Aquaregia As 74.92 0.0150178 0.0112546 0Aquaregia Fe 55.85 2.6779799 2.9514304 1.70665528Aquaregia Mn 54.94 0.0521917 0.0593502 0.02661412Aquaregia S 32.06 0.7987093 1.5019846 0.92393816Aquaregia P 30.97 0 0 0TOTAL As 74.92 0.2283832 0.2556556 0.28712984TOTAL Fe 55.85 25.49288 14.792799 13.5147205TOTAL Mn 54.94 0.1362206 0.1078936 0.10542767TOTAL S 32.06 2.3734576 2.5453352 4.60272521TOTAL P 30.97 1.2611206 0.5912495 0.52596636
ElementMW
(g/mol)Extraction
Sediments.xlsx Page 8 of 8 3/23/2009

APPENDIX A-7
SEQUENTIAL EXTRACTS OF SEDIMENT FROM FIELD PILOT STUDY
PILOT TEST STUDYAvon Park Air Force Range
Avon Park, Florida
Iron Coated SandCONTROL CONTROL CONTROL mmol/kg mmol/kg mmol/kg4/4/2008 9/4/2008 12/14/2008
MgCl2 As 74.92 0.00572506 0.00573 0.00573MgCl2 Fe 55.85 0.129631139 0.129631139 0.12963114MgCl2 Mn 54.94 0.003468154 0.003468154 0.00346815MgCl2 S 32.06 0 0 0MgCl2 P 30.97 0 0 0NaOH‐HOAc As 74.92 0.010912911 0.010912911 0.01091291NaOH‐HOAc Fe 55.85 1.745155079 1.745155079 1.74515508NaOH‐HOAc Mn 54.94 0.079629155 0.079629155 0.07962915NaOH‐HOAc S 32.06 0.048557051 0.048557051 0.04855705NaOH‐HOAc P 30.97 1.39486267 1.39486267 1.39486267AOD As 74.92 0.027147333 0.027147333 0.02714733AOD Fe 55.85 2.010872131 2.010872131 2.01087213AOD Mn 54.94 0.057314456 0.057314456 0.05731446AOD S 32.06 0 0 0AOD P 30.97 0.317262311 0.317262311 0.31726231Hydroxylamine HCL As 74.92 0.021516468 0.021516468 0.02151647Hydroxylamine HCL Fe 55.85 56.68589184 56.68589184 56.6858918Hydroxylamine HCL Mn 54.94 0.615162822 0.615162822 0.61516282Hydroxylamine HCL S 32.06 0 0 0Hydroxylamine HCL P 30.97 2.495027905 2.495027905 2.49502791Aquaregia As 74.92 0.004688383 0.004688383 0.00468838Aquaregia Fe 55.85 28.81336791 28.81336791 28.8133679Aquaregia Mn 54.94 0.615162822 0.615162822 0.61516282Aquaregia S 32.06 0 0 0Aquaregia P 30.97 2.495027905 2.495027905 2.49502791TOTAL As 74.92 0.069990155 0.069990155 0.06999015TOTAL Fe 55.85 89.38491809 89.38491809 89.3849181TOTAL Mn 54.94 1.370737409 1.370737409 1.37073741TOTAL S 32.06 0.048557051 0.048557051 0.04855705TOTAL P 30.97 6.702180792 6.702180792 6.70218079
Extraction Element MW
Sediments.xlsx Page 1 of 1 3/24/2009

APPENDIX B
List of Technical Publications

Onstott, T.C.; Chan, E.; Polizzotto, M.; DeFlaun, M. Precipitation of Arsenic Under Sulfate Reducing Conditions and Subsequent Leaching Under Aerobic Conditions. 2009. Applied Geochemistry. In Press

APPENDIX C
Other Technical Material

APPENDIX C-1
FIELD SAMPLING PROCEDURES FOR THE ANAEROBIC COLLECTION OF GROUNDWATER AND SATURATED ZONE SOIL

Prepared for:
Michael G. Stevens, P.G. Restoration Program Manager
Avon Park AFR, FL 33825
FIELD SAMPLING PROCEDURES FOR THE ANAEROBIC COLLECTION OF GROUNDWATER
AND SATURATED ZONE SOIL
Prepared by:
GEOSYNTEC CONSULTANTS Research Park
1 Airport Place, Suite 3 Princeton, New Jersey 08540
Project Number: JR0018 June 2005

This Page Intentionally Left Blank

2
G S CEO YNTEC ONSULTANTS
Field Sampling Procedures for the Anaerobic Collection of Groundwater and Saturated Zone Soil
Groundwater Collection
Groundwater will be sampled and collected using low-flow sampling methods. This methodology is best suited fur maintaining sample integrity by limiting hydraulic disturbances to they system while purging the well.
Pre-Sampling Procedures
Several steps are required before sampling the well. These steps ensure that instruments are functioning and properly calibrated, and that the necessary equipment has been supplied for efficient and accurate sampling.
1.1.1 Inventory
Sampling personnel will verify that they have the correct equipment, and that it is clean (decontaminated). Sampling containers will be inventoried to verify that the laboratory has provided the correct number of containers of the proper size and containing the correct preservative if required.
Field personnel will verify that they have the appropriate personal protective equipment and ancillary supplies (e.g., paper towels, decontamination solution) and that they have reviewed the site specific Health and Safety Plan. .
1.1.2 Calibration
Field personnel shall check the calibration of field probes consistent with the manufacturer’s specifications and the following requirements before sampling:
1. the pH probe will be calibrated using three points (pH = 4, 7, 10) using fresh calibration solution;
2. the dissolved oxygen (DO) meter calibration will be checked with moist air (100% saturation) and to zero DO using a saturated sodium bisulfite solution; and
3. the redox potential (ORP) meter calibration will be checked using Zobell 231 mV solution.
Calibration check data will be recorded on the field calibration record provided (see attached). Instruments will be recalibrated as necessary (e.g., when calibration checks do not come within + 10% of the expected value indicating incorrect operation) or a new instrument

3
G S CEO YNTEC ONSULTANTS
will be substituted to ensure accurate measurements, and all checks and recalibrations will be recorded on field calibration forms.
1.1.3 Well Purging and Sampling
Sampling is performed using a five-step procedure that will be followed upon arrival at each well:
• set-up;
• purging;
• measurement of field parameters and field testing;
• sampling; and
• clean-up and decontamination.
Detailed procedures for performing each of these steps are provided in the following subsections.
1.1.3.1 Set-up
All necessary equipment for purging, sampling and storage will be brought to the well before the well is opened. Equipment will be placed on a clean plastic sheet near the well. General parameters describing the well and field condition (e.g., well ID, depth, weather, date and time) will be documented on a field data sheet provided. Field personnel will review the sampling requirements for the well before proceeding. Sampling begins by opening the well and measuring the depth to the water surface. The tubing, peristaltic pump, field probes, and reservoir for purged water are then set-up.
1.1.3.2 Purging (Low Flow Protocol)
Wells are purged using the low flow/minimum drawdown protocol as described by Puls and Barcelona (1996). The general procedural requirements of low-flow purging are as follows.
• A pump that minimizes agitation in the well and contact of the water with air; typically a bladder pump is used. Due to the shallow depths being sampled at Avon Park Site ST-65, a peristaltic pump will be utilized.
• Minimize disturbance of the water column in the well by initiating pumping at a low rate.
• Begin pumping at a steady rate of 100 mL/min and measure the depth to water frequently (e.g., every minute for the first few minutes) to ensure that less than 0.1 m of drawdown occurs. The pumping may be increased if drawdown is less than 0.1 m, but the pumping rate will not exceed 500 mL/min.

4
G S CEO YNTEC ONSULTANTS
• Field parameters and depth to water will be recorded on field data sheets every 5 minutes while purging. Purging will persist until pH, temperature, conductivity, Eh, dissolved oxygen concentration, and turbidity stabilize, which is defined as:
1.2 ±0.1 units for pH
1.3 ±3% for conductivity
1.4 ±10 mV for Eh
1.5 ±10% for temperature
1.6 ±10% for turbidity and dissolved oxygen.
• Dissolved oxygen and turbidity tend to stabilize last and are better measures of sufficient purging. Drawdown will not exceed 0.1 m during purging or sampling.
• In the case that the above criteria for stabilization are not met before three well volumes have been pumped, then a total of five well volumes will be pumped before samples are taken. If, at any time during this additional purging the stabilization criteria are met for three consecutive data logging events, then samples are taken at that point.
Sampling equipment will consist of disposable polyethylene tubing installed in the well just prior to sampling. Typically, the tubing is placed in the well to insure that the intake is at the midpoint of the well screen. Placing the tubing into the midpoint of the well screen ensures that a representative water quality sample is collected from the formation rather than from potentially stagnant water within the well casing. At the wellhead, the peristaltic pump and discharge tubing will be connected to a low-flow sampling cell. The low-flow sampling cell is equipped with four water quality probes to monitor field parameters during the purge cycle.
At Avon Park well 43103-MW will be sampled. This well is screened from 2 to 12 feet bgs. A depth profile of the field parameters will be performed to assess the depth at which the lowest redox conditions occur. The depth profile will start at 4 feet bgs or at 1 foot below the current water table depth whichever is shallower. Once the parameters have stabilized at this location the tube will be lowered 2 feet and the operation repeated. This will continue every 2 feet until 11 feet bgs, or approximately one foot above the bottom of the screen. Water-levels will be measured during the low flow sampling procedure to document minimal drawdown. This qualitative check insures that the water quality sample collected represents formation water rather than stagnant water from the well casing. Prior to water-quality sample collection, well purging will continue until at least three consecutive rounds of field measured parameters agreed within 5% or until a total of five well volumes were pumped.

5
G S CEO YNTEC ONSULTANTS
Water quality samples for volatiles will be collected directly from the polyethylene tubing using reverse flow techniques. The groundwater filled purge tubing is removed from the well and the peristaltic pump is run in reverse to fill the sample containers. Inorganic parameters will be sampled directly through the pump head, with new pump-head tubing used at each well). All water-quality samples are immediately placed into a cooler with ice to maintain sample integrity and to preserve chain of custody. All sampling and decontamination activities are performed in general accordance with the FDEP Standard Operating Procedure (SOP)-001/01 (Field Procedures). Field analyses of ground water quality samples were acquired using dedicated single and multi-parameter instruments for the following parameters;
• dissolved oxygen (DO) via EPA Method 4500-0; • reduction-oxidation (redox) potential via EPA Method 2580 B; • hydrogen-ion concentration (pH) via EPA Method 4500-H+; • conductivity via EPA Method 2510 B; • temperature via EPA Method 2550 B; and • turbidity via EPA Method 2130 B.
The groundwater samples will be hand delivered to Xenco Laboratories, Inc. (Xenco) in
Tampa, Florida, for analysis of volatile organic compounds (VOCs) according to EPA Method 8260b and dissolved and total arsenic (EPA 200.7). Samples for sulfate (EPA 300.0) and sulfide (EPA 376.1) will also be collected.
Approximately 40 liters of ground will be collected by low-flow into 6-5 liter polyethylene bottles sealed with no headspace and taped closed. These will be shipped along with soil to Dr. T.C. Onstott at Princeton University. Soil Collection
Saturated zone soils will be collected from a location within approximately 5 ft. downgradient of well 43103-MW. Soil samples will be collected from the depth at which the lowest redox values were detected during groundwater field parameter measurements. Approximately 10 kg of soils will be needed for the column studies; the soils will be sent to Princeton University. These samples will be collected in a manner that will minimize exposure of the soils to the atmosphere in order to preserve the in situ geochemistry.

6
G S CEO YNTEC ONSULTANTS
Soil samples will be collected with a direct push rig equipped to collect subsurface soil
samples with a Dual Wall Split Spoon Sampler which will help to preserve the geochemical integrity of these samples.
The Dual Wall split spoon or window sheath sampler is loaded with the desired sample liner/liners and installed inside the outer casing. Simultaneously, the outer drive casing and inner split spoon sample barrel are advanced 2, 4, or 5 feet, depending on sampling system application. As these tools are advanced, the inner sampling barrel collects the soil core sample. This sampler is then retrieved while the outer casing remains in place, protecting the integrity of the hole. A new sampler is lowered into place, and advanced further to collect the next soil sample. This process continues until a desired depth has been reached. The dual wall sampling system also provides discrete depth soil and groundwater sampling. Using a locked drive point, the dual wall sampling system is advanced, displacing the soils until a desired depth has been reached. Discrete samples of 2 ft in length will be collected in a liner, capped, the cap will be taped on and the core is stored on ice for immediate shipping.

APPENDIX C-2
FIELD SAMPLING PROCEDURES FOR THE COLLECTION OF GROUNDWATER FOR PILOT STUDY ANALYSIS

FIELD SAMPLING PROCEDURES FOR THE ANAEROBIC COLLECTION OF GROUNDWATER
AND SATURATED ZONE SOIL
Prepared by:
3131Princeton Pike Building 1-B, Suite 205
Lawrenceville, New Jersey 08648
Project Number: JR0018 January 2008

AcOH Volume Test The cooler contains three sets of vials with which the Acetic Acid Concentration Test will be performed. Three separate wells will be sampled for this test: 1 upgradient, 1 mid-point monitoring well, and 1 downgradient. The procedure follows:
1. Each vial has been lab preserved with EDTA (solid) 2. Fill each vial with water sample to the 10mL mark on the Falcon tube 3. Add provided Acetic Acid in VARYING volumes to each tube using the auto
pipette and tips according to the following scheme (each vial is labeled accordingly):
a. Vial 1: NO Acetic Acid b. Vial 2: 10µL c. Vial 3: 25µL d. Vial 4: 50µL e. Vial 5: 75µL f. Vial 6: 100µL
4. Allow vials to sit in fridge overnight 5. On the next day, check the samples for signs of iron oxides (discoloration) 6. Record the LOWEST acetic acid volume used at which there is no evidence of
iron oxide formation 7. This volume of acetic acid will be used when preserving future dissolved arsenic
samples 8. Compare this value for acetic acid volume between wells to determine whether a
site-wide value is appropriate. NOTE: If, for example, two wells show that 10µL of acetic acid is sufficient and the other shows that 25µL is needed, 25µL may be applied to the entire site
9. Dispose of samples

Dissolved Arsenic
1. Vials are lab preserved with EDTA (solid) 2. Filter water sample through in-line 0.45µm filter into small, clean container 3. Pull up 10mL into disposable syringe 4. Attach 0.2µm syringe filter and push liquid through filter into vial 5. Add provided Acetic Acid at the volume determined by the previously performed
Acetic Acid volume test into vial 6. Label the vials with the Well ID and date collected 7. Store the vials in a freezer overnight 8. Ship frozen the next day to Princeton University (address provided on field form)
Anions
1. Vials are unpreserved 2. Filter samples according to steps 2-4 from Dissolved Arsenic protocol 3. Prepare samples for shipment according to steps 6-8 from Dissolved Arsenic
protocol
Sulfide
1. Vials are lab preserved with N2 gas 2. Collect water sample into small, clean container 3. Attach syringe needle to disposable syringe and pull up 10mL 4. Remove small metal piece from top of vial (middle of cap) 5. Pierce rubber stopper with syringe needle and inject water sample into vial 6. Repeat injections until fill line is reached (top of label on each vial) 7. If air pressure resists attempt to fill with water, vent the gas by piercing the
stopper with an empty syringe and pulling air out 8. Prepare samples for shipment according to steps 6-8 from Dissolved Arsenic
protocol
Cations, filtered
1. Vials are lab preserved with HNO3 2. Filter samples according to steps 2-4 from Dissolved Arsenic protocol 3. Label the vials with the Well ID and date collected 4. Store the vials in a cooler and maintain at 4°C 5. Ship samples on blue ice overnight
Cations, unfiltered
1. Vials are lab preserved with HNO3 2. Fill each vial with water sample to the 10mL mark on the Falcon tube 3. Prepare samples for shipment according to steps 3-5 from Cations, filtered
protocol

Methane/CO2
1. Vials are lab preserved with HgCl2 and N2 gas 2. Collect samples according to steps 2-7 from Sulfide protocol, but fill vial
completely, leaving NO headspace 3. Prepare samples for shipment according to steps 3-5 from Cations, unfiltered
protocol