final presentation zambia results
TRANSCRIPT
1
Zambia Health Results Based Financing (RBF) Project
Results from the Impact Evaluation
PresentersJed Friedman, Principal Investigator
Jumana Qamruddin, Task Team Leader

2
Results based financing in Zambia
1. Provider-Purchaser split – Quantity and Quality data verification– Steering Committees (SCs) as Independent Verifiers – Periodic External Verification
2. “Performance based financing” through public health sector contracting. One of the very few examples of “contracting-in”– “Fee-for-service” on a set of Maternal and Child Health indicators
3. Managerial and financial autonomy of health facilities
4. Nine (9) health facility indicators targeting improvements in MCH
5. Health centre quality indicators in 10 areas
6. Performance package at District Medical Office

3
Impact Evaluation: Design
Intervention (RBF)(10 Districts)
Control 1 (10 Districts)
Control 2 (10 Districts)
RBF program (including incentives) +EmONC
equipment
Enhanced financing (equal to RBF incentives) + EmONC equipment
Business-as-usual (status quo)
The IE seeks to determine the causal impact of HRBF on priority service provision and population health indicators

4
Three-arm experimental Study Design
30 districts matched in groups of three on key health systems and outcome indicators and randomly allocated to each arm: 10 districts per arm
o 10 Intervention Districts (RBF) o 10 Enhanced (Input-Based) Financing Districts (C1) o 10 Business-as-usual (status quo) Districts (C2)
• District triplets selected within each province by matching on:– geographical accessibility (i.e. rural and remoteness)– number and level of health facilities– average facility catchment population– proportion of staff in position– health services utilization rates
• Difference-in-difference estimator between matched districts in treatment and control groups estimates program impact

5
District Selection

6
Implementation & Learning Platforms
Baseline(Nov – Dec 2011)
Endline(Nov – Dec 2014)
Program Inception(April 2012)
Process Evaluation (May – June 2013)
Routine Performance Review (Quarterly) – Operational Data
Program Ends(Oct 2014)

7
Questions investigated
What is the causal effect of the RBF on targeted health indicators and other population outcomes of interest?
– What are the effects on coverage of health services?
– What are the effects on quality of care?
– What are the effects on health system functionality?

8
• Population representative survey of health behavior and health outcomes
• Baseline and endline data at community and household levels covering– 18 districts– 307 enumeration areas– 3064 households in BL and 3087 in EL
• After full community listing, random sample of all households with a pregnancy related outcome in the two years before survey
Data Source 1: Household Survey

9
• A comprehensive review of the structure, provision, and quality of care at facility level
• 213 facilities in both baseline and follow up• Instruments
– Facility checklist– Health worker tool (330 in BL; 402 in EL)
– Exit interview tool – ANC (900 in BL; 1256 in EL) child illness (1064 in BL; 1273 in EL)
• Data collected by independent contractor: University of Zambia
Data Source 2: Health Facility Survey

10
A review of the completeness, accuracy and validity of reporting at facility level • 140 facilities: 105 in RBF districts and 35 in C2 districts• Instruments
– Facility document review checklist– Client tracer tool
• Data collected by independent contractor: Zambia Institute for Policy Analysis and Research (ZIPAR)
Data Source 3: External Verification

11
To estimate the cost-effectiveness of RBF program in Zambia:
RBF versus status quo (C2) RBF versus enhanced financing (C1) C1 versus status quo (C2)
To assess the cost-effectiveness with and without adjustment for quality improvement over a broad number of MCH services
Data Source 4: Cost-effectiveness analysis

12
Outline 1. Healthcare coverage2. Quality of services3. Health systems (incl. HRH, Finance)4. Cost-effectiveness analysis
Results

13
Healthcare coverage
14
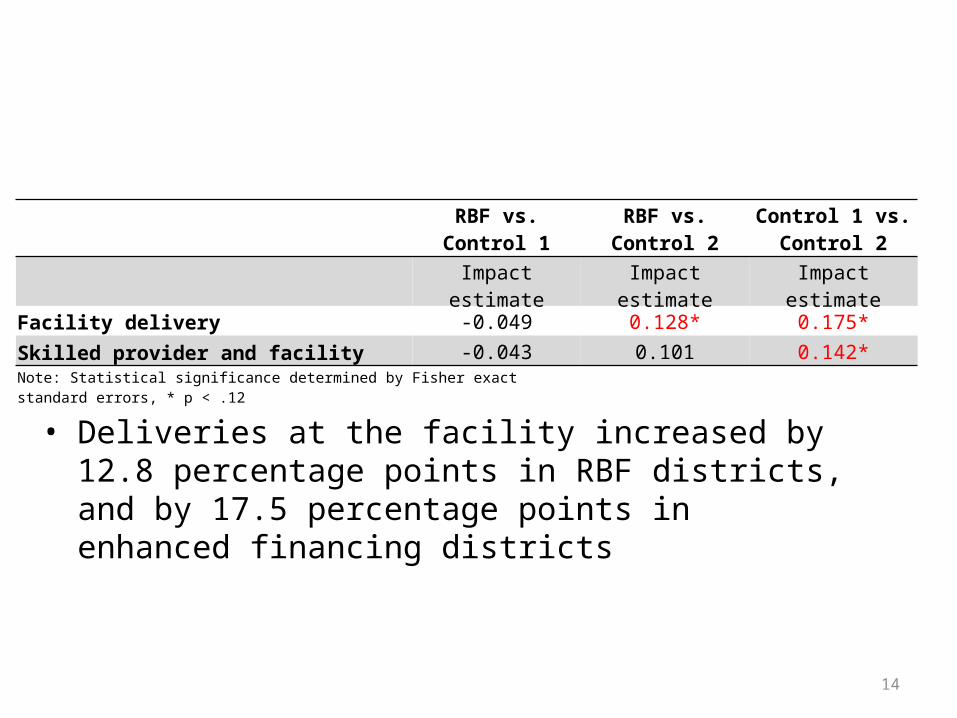
Institutional & Skilled Deliveries
• Deliveries at the facility increased by 12.8 percentage points in RBF districts, and by 17.5 percentage points in enhanced financing districts
RBF vs. Control 1 RBF vs. Control 2 Control 1 vs. Control 2
Impact estimate Impact estimate Impact estimate
Facility delivery -0.049 0.128* 0.175*
Skilled provider and facility -0.043 0.101 0.142*Note: Statistical significance determined by Fisher exact standard errors, * p < .12

15
Antenatal care coverage
• Many ANC indicators are already relatively well performing in Zambia before the RBF pilot period, and show little change as a result of the RBF program or enhanced financing
• However one important exception: pregnant women present significantly earlier for their first ANC visit in RBF districts as compared to the controls
RBF vs. Control 1 RBF vs. Control 2 Control 1 vs. Control 2
Impact estimate Impact estimate Impact estimate
Any ANC -0.015 -0.015 04 or more ANC visits -0.004 -0.034 -0.029
Timing of first ANC visit -0.372* -0.476* -0.108Note: Statistical significance determined by Fisher exact standard errors, * p < .12

16
Post-natal care coverage
RBF vs. Control 1 RBF vs. Control 2 Control 1 vs. Control 2
Impact estimate Impact estimate Impact estimate
Any PNC -0.051 0.082 0.132*Note: Statistical significance determined by Fisher exact standard errors, * p < .12
• Both RBF and especially C1 increase coverage relative to C2
17
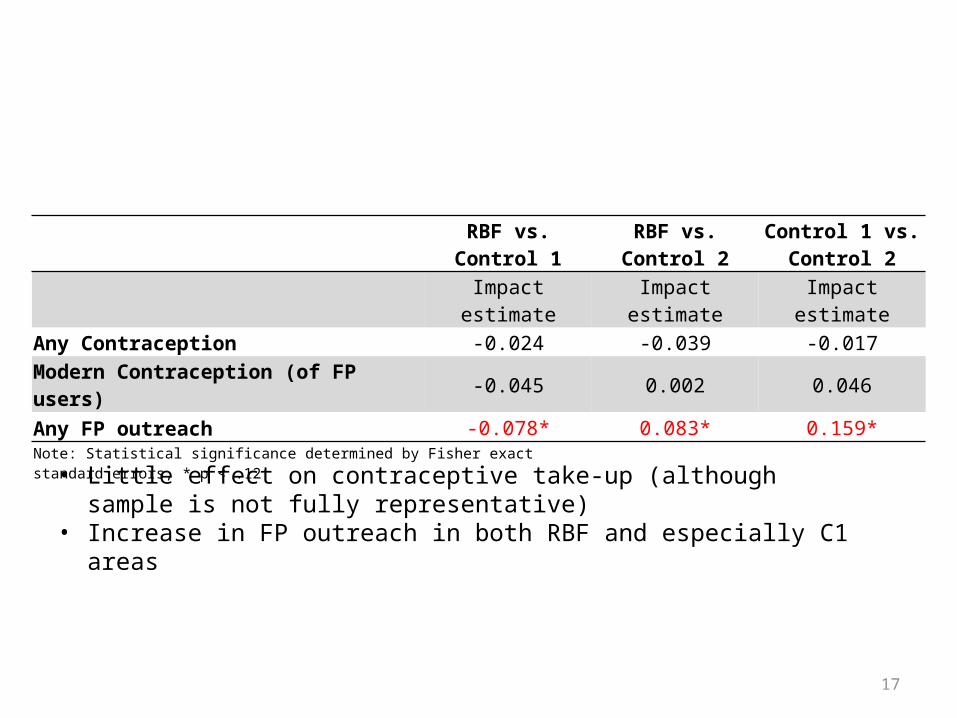
Family planning outcomes
RBF vs. Control 1 RBF vs. Control 2 Control 1 vs. Control 2
Impact estimate Impact estimate Impact estimate
Any Contraception -0.024 -0.039 -0.017
Modern Contraception (of FP users) -0.045 0.002 0.046
Any FP outreach -0.078* 0.083* 0.159*Note: Statistical significance determined by Fisher exact standard errors, * p < .12
• Little effect on contraceptive take-up (although sample is not fully representative)
• Increase in FP outreach in both RBF and especially C1 areas

18
Vaccination outcomes
• RBF performed better than C1 and C2 in fully vaccinated coverage but the impact estimates are not precise.
• For some of the other measures of immunization, both the RBF and C1 performed better than C2
RBF vs. Control 1 RBF vs. Control 2 Control 1 vs. Control 2
Impact estimate Impact estimate Impact estimate
Fully vaccinated 0.116 0.052 -0.046Any vaccinations -0.066 0.015 0.081*BCG inject ever received 0.031 0.07* 0.028DPT ever received -0.01 0.061* 0.056*Note: Statistical significance determined by Fisher exact standard errors, * p < .12

19
Quality of services

20
Structural QualityFacility infrastructure variables RBF vs. Control 1 RBF vs. Control 2
Impact estimate p-value Impact
estimatep-
valueFacility experiences no power outage -0.019 0.881 0.194 0.159Facility experiences no water outage 0.041 0.688 0.051 0.476Infrastructure index 0.195 0.470 0.483* 0.099
• Little change in individual measures of structural quality, however an aggregate index suggests gains in RBF compared with pure control districts
• Gains in structural quality of care-specific indices
RBF vs. Control 1 RBF vs. Control 2
Impact estimate p-value Impact estimate p-value
Curative Care 0.39 0.204 0.28** 0.042
Family planning 0.15 0.578 0.08 0.546
Delivery Room 0.61** 0.010 0.57*** 0.000

21
Availability of drugsRBF vs. Control 1 RBF vs. Control 2
Impact estimate p-value Impact estimate p-value
Iron tabs -0.03 0.722 -0.03 0.824Folic acid tabs -0.09 0.455 0.13 0.259
Artemisinin-Based Combination Therapy (ACT) 0.04 0.693 0.27*** 0.008Drug availability index -0.08 0.844 0.06 0.893
* p<0.1 ** p<0.05 *** p<0.01
• With the exception of ACT, little relative gain in drug availability for either RBF or enhanced financing

22
Availability of equipment
RBF vs. Control 1 RBF vs. Control 2
Impact estimate p-value Impact
estimate p-value
Tape measure 0.15* 0.097 0.11 0.399Baby scale (infant weighing scale) 0.05 0.643 0.22*** 0.007Forceps, artery 0.08 0.406 0.16** 0.011Needle holder -0.09 0.389 0.25*** 0.001Equipment availability index 0.03 0.917 0.37* 0.088
* p<0.1 ** p<0.05 *** p<0.01
• Select equipment for delivery and neo-natal care more available in RBF districts

23
Quality of ANC(Source: Exit interviews)
RBF vs. Control 1 RBF vs. Control 2
Impact estimate p-value Impact estimate
p-value
Weighed -0.02 0.632 0.06 0.251Blood pressure measured -0.03 0.809 0.08 0.452Abdomen measured 0.07 0.152 0.09* 0.063Abdomen palpated 0.00 0.987 0.12* 0.083Advice on diet 0.14*** 0.009 0.02 0.850Quality of ANC index 0.02 0.921 0.33 0.165
* p<0.1 ** p<0.05 *** p<0.01
• Process measures of ANC quality for a few measures are improved in RBF as compared to C1 and C2, but little gain in overall index

24
Quality of child health care(Source: Exit interviews)
RBF vs. Control 1 RBF vs. Control 2Impact
estimate p-value Impact estimate p-value
Asked age -0.01 0.880 0.02 0.776Weighed child -0.07 0.378 0.06 0.498Measured height -0.10 0.104 -0.02 0.577Physically examined -0.09 0.327 -0.08 0.350Quality of care index -0.09 0.669 0.14 0.565
* p<0.1 ** p<0.05 *** p<0.01
• No apparent gain in process quality of child health visit

25
Satisfaction on ANC(Source: Exit interviews)
RBF vs. Control 1 RBF vs. Control 2Impact
estimate p-value Impact estimate p-value
The health worker spent a sufficient amount of time with the patient 0.08* 0.067 0.08* 0.081You trust the health worker completely in this health facility 0.07* 0.066 0.03 0.569Satisfaction index 0.04 0.826 0.12 0.574
* p<0.1 ** p<0.05 *** p<0.01
• Higher levels of patient satisfaction in selected dimensions of ANC (but not all) in RBF as compared to the two controls
• Little apparent increase in overall satisfaction

26
Satisfaction on child health care(Source: Exit interviews)
RBF vs. Control 1 RBF vs. Control 2Impact
estimate p-value Impact estimate p-value
The amount of time you spent waiting to be seen by a health provider was reasonable -0.02 0.823 -0.06 0.477You trust the health worker completely in this health facility 0.11* 0.057 0.04 0.504Satisfaction index 0.09 0.617 0.04 0.858
• Little apparent increase in overall satisfaction for child care

27
Health systems

28
Level of RBF revenue, RBF vs C1
2012 2013 2014 Total -
500,000 1,000,000 1,500,000 2,000,000 2,500,000 3,000,000 3,500,000 4,000,000 4,500,000 5,000,000
0%10%20%30%40%50%60%70%80%90%
38%43%
78%
56%
RBFC1Funds disbursed to C1 in propotion to RBF
Amou
nt in
US$

29
Proportion of GRZ grant to RBF grant
2012 2013 2014
-50%
0%
50%
100%
150%
200%
250%
0%
5%
10%
15%
20%
25%
30%
230%
34%
171%
-18%
26%
21%
13%
Growth of RBF grant Growth of GRZ grantProportion of GRZ grant to RBF grant

30
Use of RBF Funds, and Proportion of RBF staff incentives to Govt. staff salaries
2012 2013 2014 Actual over Period
0.0%
10.0%
20.0%
30.0%
40.0%
50.0%
60.0%
70.0%
0%
14% 14%10%
1%
59%51%
47%
Proportion of RBF staff incentives to GRZ staff salariesProportion of RBF funds used for RBF staff incentives

31
Facility governanceRBF vs. Control 1 RBF vs. Control 2Impact
estimate p-value Impact estimate p-value
Number of Health Center Committee meetings held in the last 12 months 1.03 0.103 1.26* 0.093Number of visits made by a district hospital representative for supervision 0.82* 0.065 0.66 0.542Number of times performance of staff assessed internally 3.41*** 0.002 4.41*** 0.002Number of times performance of staff assessed externally 1.40** 0.046 2.33*** 0.003Number of times performance of the facility as a whole assessed externally 1.15 0.365 2.64** 0.022
• Increases in supervisory visits and performance assessments

32
Autonomy
RBF vs. Control 1 RBF vs. Control 2Impact
estimate p-value Impact estimate p-value
able to allocate my facility budget 0.022 0.873 0.092 0.147choice over who I allocate for what tasks. -0.067 0.565 0.035 0.556choice over what services are provided in the facility. 0.036 0.797 0.127* 0.055
Autonomy index 0.06 0.880 0.26** 0.037
* p<0.1 ** p<0.05 *** p<0.01
• Gains in some measures of facility autonomy in RBF compared with C2, but not C1 districts

33
Job Satisfaction
RBF vs. Control 1 RBF vs. Control 2
N β (s.e.) N β (s.e.)Work conditions 448 6.393 (5.121) 464 4.366* (2.183)
Compensation 448 8.639** (4.081) 464 3.880* (1.994)
Recognition 448 1.439 (2.842) 464 0.086 (1.324)
Opportunities 448 4.686 (4.183) 464 3.641* (2.004)
* p<0.1 ** p<0.05 *** p<0.01
• Dimensions of job satisfaction generally higher in RBF districts, especially as compared with C2

34
Accuracy of reporting
Indicator
proportion of control facilities under-reporting
services
Relative likelihood of RBF facilities underreporting
P-value of relative
likelihoodOut-patient visit 0.643 0.049 0.634Delivery 0.833 -0.154 0.100Ante-natal care 0.654 0.029 0.787HIV testing and counseling 0.655 -0.093 0.369PMTCT 0.875 -0.156 0.082
• Most services in general are underreported – even in RBF districts!• For select services, RBF appears to improve accuracy of reported information

35
Cost-effectiveness analysis

36
Incremental cost effectiveness ratios
Comparison
Cost/life saved (US$) Cost/QALY gained (US$)
Mid-point (lower bound; upper bound)
Mid-point (lower bound; upper bound)
RBF vs C1 (unadjusted) 35,802 (17,143; 594,308) 1,513 (724; 24,544)
RBF vs C1 (quality adjusted) 30,219 (14,882; 27,8582) 1,277 (628; 11,820)
RBF vs C2 (unadjusted) 24,423 (11,452; 52,626) 1,031 (484; 2,223)
RBF vs C2 (quality adjusted) 20,434 (10,233; 35,940) 863 (433; 1,518)
C1 vs C2 (unadjusted) 14,786 (7,461; 144,906) 624 (182; 5,482)
C1 vs C2 (quality adjusted) 12,280 (4,396; 310,513) 518 (168; 16,221)

37
Summary: Context, Coverage, Quality
• One of the first 3-armed IE designs in the portfolio• Project was implemented during a period of several changes
in GRZ leadership and ministry organization• RBF and C1 compared to C2 had considerable gains across a
number of indicators• RBF vs C1 on health care coverage indicators were
comparable• Structural quality: Results were mostly inconclusive but RBF
better than C2 on the status of infrastructure and medical equipment; and both controls on quality of delivery rooms
• Process quality: Minimal progress on process quality of maternal health care in RBF and C1 districts

38
Summary – HRH
• Few gains in client satisfaction except:
– Clients who visited RBF health facilities were more satisfied with the time that the health workers spent with them as compared to C1 and C2.
– Clients trusted health workers in RBF facilities more than those in C1 facilities for both maternal and child health services
• Job satisfaction and retention of health workers increased in both RBF and C1 but the gains were higher in RBF as compared to C1.

39
Summary: Cost Effectiveness Analysis
• RBF delivered greater health gains, in terms of lives saved or QALYs gained, than C1 when compared with C2.
• However these gains were supplied at a higher unit cost. In $/QALY, C1 is more cost-effective.
• Both interventions can be considered cost-effective when compared with the annual per-capita income for Zambia.
• However, cost-effectiveness analysis does not explicitly account for health system strengthening investments – certain dimensions of effectiveness with regards to RBF may have been missed by the analysis.

40
Summary: Incentives and RBF Grants
• RBF incentives as a percentage of staff salaries: equal to 10% of staff salaries by end of implementation period– Intended ratio was higher but GRZ increased staff salaries for all civil
servants ranging from 100% to 200%
– Low powered incentives likely result in reduced ability of RBF to affect targeted outcomes
• RBF grants as a percentage of operational expenditures: – At facility level, The RBF grant at facility level was spent more on
operational activities as compared to staff incentives
– Comparison to GRZ grants at facility level suggests that RBF grants may have played a substitutional role instead of being additional (as intended)

41
Summary: Provider Payment Mechanism
• RBF was being implemented in a health system that already had relatively high coverage in some indicators – implications for efficiency of spending
• Rather than fee-for-service paying for all services rendered, it may have been more effective to have used a target or coverage-based provider payment mechanism

42
Summary: Disbursement Mechanisms • By using two different mechanisms, the study was able to
measure the success of each system in terms of overall level of RBF funding disbursed and used by facilities.
• Disbursement of RBF performance grants directly to health facilities enabled fiscal decentralization and increased autonomy.
• Results show that health facilities in the C1 districts did not receive the same amount as the RBF districts due to delayed retirement and low absorptive capacity.
• By the end of the RBF program, the proportion of disbursement to C1 districts was only 56% of what the RBF districts had received. To note, health facilities in the RBF intervention group allocated 47% of the total RBF funds for staff incentives, and 53% for investment.

43
Conclusions
• Both the RBF and the C1 arms contributed to some very important health gains as compared to business-as-usual “C2”, and C1 at even lower $/QALY
• But the RBF observed relatively more gains in health systems governance, client perception, and health worker satisfaction
• The health systems gains under the RBF may translate into population and health gains over a period longer than the 2 year measured under the pilot
• Enhanced financing is not just money in a vacuum, involves signaling and direction. Better understanding the effectiveness of these mechanisms can inform policy and program development

44
Considerations and Implications
-Focusing RBF mechanisms on improving quality as the primary focus
-Design of National Health Insurance Scheme and other health sector priorities
-Setting agenda for next generation of learning/operational research
- Current IDA Lending operation: RBF component with a heavy process evaluation

45
Thank You!

46
Primary data collected from 18 districts
Districts sampled for household survey for Phase I QuestionsProvince Districts
Central Chibombo; Kapiri Mposhi; Mumbwa
Eastern Chadiza; Lundazi; Nyimba
Luapula Kawambwa; Milenge; Mwense
Northern Chinsali; Chilubi; Mporokoso
North-Western Chavuma; Mufumbwe; Mwinilunga
Southern Mazabuka; Namwala; Siavonga

47
Work Motivation
RBF vs. Control 1 RBF vs. Control 2
N β (s.e.) N β (s.e.)Teamwork 447 0.385 (3.132) 462 0.925 (1.429)Autonomy 448 0.822 (4.311) 463 1.314 (1.768)Changes in facilities 448 -2.096 (2.664) 463 1.026 (1.240)Work environment 448 -1.788 (2.597) 463 1.257 (1.260)Self-concepts 448 -0.727 (1.866) 463 0.774 (1.075)Recognition 448 -0.380 (3.282) 461 -0.837 (1.330)Well-being 450 1.100 (2.981) 465 2.418* (1.236)Leadership of facility 431 -3.075 (4.885) 446 1.210 (2.613)
* p<0.1 ** p<0.05 *** p<0.01
• Work motivation largely unchanged

48
Distribution of RBF program costs