final network assessment plan · 1 1.0 introduction the ventura county air pollution control...
TRANSCRIPT

VENTURA COUNTY AIR
POLLUTION CONTROL DISTRICT
2007 AMBIENT AIR
MONITORING NETWORK PLAN
August 2007
669 County Square Drive Ventura, CA 93003
Contact: Keith Duval

ii
Table of Contents 1.0 Introduction .................................................................................................................. 1
2.0 Overview of Network Operation.................................................................................. 2
2.1 Monitoring Objectives and Spatial Scales........................................................ 4
2.2 Minimum Monitoring Requirements................................................................ 6
2.2.1 Ozone............................................................................................... 7
2.2.2 PM2.5 ................................................................................................ 9
2.2.3 PM10............................................................................................... 10
2.2.4 Carbon Monoxide.......................................................................... 11
2.2.5 Nitrogen Dioxide........................................................................... 11
2.2.6 Sulfur Dioxide ............................................................................... 11
3.0 Recent or Proposed Modifications to Network .......................................................... 12
3.1 Review of Changes to PM2.5 Monitoring Network ........................................ 12
4.0 Data Submission Requirements.................................................................................. 13
Appendix A: Detailed Site Information
El Rio – Rio Mesa School #2 ....................................................................................A-2
Ojai – Ojai Avenue....................................................................................................A-6
Piru – Pacific Avenue................................................................................................A-9
Simi Valley – Cochran Street..................................................................................A-12
Thousand Oaks – Moorpark Road...........................................................................A-16
Ventura – Emma Wood State Beach...................................................................... A-19
List of Figures
Figure 1: Map of Ventura County APCD Air Monitoring Stations ................................... 3
Figure 2: Historical Eight-Hour Ozone Trends.................................................................. 8
List of Tables
Table 1: Ventura County APCD Air Monitoring Stations ................................................. 4
Table 2: Monitoring Objectives and Associated Spatial Scales......................................... 5
Table 3: Criteria Pollutant Objective and Spatial Scales.................................................... 6

iii
Table 4: Historical Ozone Values ...................................................................................... 7
Table 5: Minimum Monitoring Requirements for Ozone .................................................. 8
Table 6: Historical PM2.5 Values – 24-Hour Standard ....................................................... 9 Table 7: Historical PM2.5 Values – Annual Arithmetic Mean............................................ 9
Table 8: Minimum Monitoring Requirements for PM2.5.................................................. 10
Table 9: Historical PM10 Values ...................................................................................... 10
Table 10: Minimum Monitoring Requirements for PM10 ................................................. 11

iv
Definition of Terms AQS: ............ Air Quality System BAM ............ Beta Attenuation Monitor CFR ............. Code of Federal Regulations CMSA .......... Consolidated Metropolitan Statistical Area CO ............... Carbon Monoxide District: .......... Ventura County Air Pollution Control District EPA ............. U. S. Environmental Protection Agency FRM ............. Federal Reference Method NAAQS: ...... National Ambient Air Quality Standards NO2 ............. Nitrogen Dioxide O3 ................ Ozone PM ................. Particulate Matter PM2.5 ............. Particulates less than or equal to 2.5 microns in size PM10 .............. Particulates less than or equal to 10 microns in size SIP ............... State Implementation Plan SLAMS: ....... State and Local Air Monitoring Stations SO2 .............. Sulfur Dioxide VCAPCD:...... Ventura County Air Pollution Control District

1
1.0 Introduction
The Ventura County Air Pollution Control District’s 2007 Ambient Air Monitoring Network Plan is an examination and evaluation of the District’s network of air pollution monitoring stations. This annual review of the District’s air monitoring network is required by Title 40, Code of Federal Regulations, Part 58.10 (40 CFR 58.10). This report describes the network of ambient air quality monitors operated by the Ventura County Air Pollution Control District. It includes a review of actions taken during 2006 and plans for action in the year ahead. Recent changes to the Code of Federal Regulations require specific detailed monitoring network information be included in this report along with a 30-day public review period prior to submittal of the report to the U.S. Environmental Protection Agency (USEPA). The regulations require that the report be submitted to USEPA by July 1 of each year.

2
2.0 Overview of Network Operation The Ventura County Air Quality Control District operates six air monitoring sites within Ventura County. The District’s monitoring network has been designed to provide ozone, PM2.5 and PM10 monitoring coverage to the majority of the inhabited regions of the County. The District has conducted air monitoring for ozone or oxidants in Ventura County since 1963. The District’s air monitoring network has been designed to provide air monitoring to the following regions of Ventura County: Conejo Valley – an inland area, which includes the city of Thousand Oaks and the communities of Westlake Village and Newbury Park, covering 75 square miles and home to 138,000 people. The area is surrounded by foothills and low-lying mountains. The eastern edge of the Conejo Valley is the border between Ventura and Los Angeles Counties. There are no major stationary sources in its boundaries. Ojai Valley – an inland area including the City of Ojai and the communities of Oak View, and Meiners Oaks, which covers 102 square miles and is home to 30,000 people. The Ojai Valley is surrounded by mountain ranges. This are no major stationary sources within its boundaries, however, it may be influenced by oil production activities occurring to the south in the Ventura Coastal area. The area is impacted primarily by mobile sources. Oxnard Coastal Plain – a broad coastal area from the Pacific Ocean to several inland valleys, covering 290 square miles and home to 207,000 people. The Oxnard Coastal Plain area is a relatively flat plain area with foothills and mountains at its northern border. This area holds the majority of the County’s major sources, including two natural gas-fired electric generating units, two naval bases, a number of natural gas-fired cogeneration facilities, several oil and gas production and processing facilities, a paper manufacturing facility, a paper recycling facility and a magnetic tape manufacturing facility. The area is also home to considerable agricultural activities and a deepwater port. The area is impacted by marine shipping operations occurring off of the County’s coast and mobile sources. Santa Clara River Valley – an inland area, covering 204 square miles and home to 49,000 people. The Valley is surrounded by foothills and low-lying mountains. The eastern edge of the Santa Clara River Valley is the border between Ventura and Los Angeles Counties. The area is also home to considerable agricultural activities. There are oil production and processing activities occurring throughout the Valley. There are no major stationary sources in its boundaries. The area is impacted primarily by mobile sources. Simi Valley – an inland area, which covers the cities of Simi Valley and Moorpark, is 142 square miles and is home to 148,000 people. The Valley is surrounded by foothills and low-lying mountains. The eastern edge of the Simi Valley is the border between Ventura and Los Angeles Counties. There is one major stationary source in its boundaries. The area is impacted primarily by mobile sources.

3
Ventura Coastal - a coastal area, which covers 114 square miles and is home to 180,000 people. The northern boundary of the Ventura Coastal area is foothills. The area is also home to some agricultural activities. The area is impacted by marine shipping operations occurring off of the County’s coast and mobile sources. There are several major stationary sources in its boundaries. Figure 1 shows the locations of the monitoring sites. Table 1 lists the pollutants currently measured at each site and the assigned Air Quality System (AQS) identification number for each monitoring site.
Figure 1 Map of Ventura County APCD Air Monitoring Stations
4
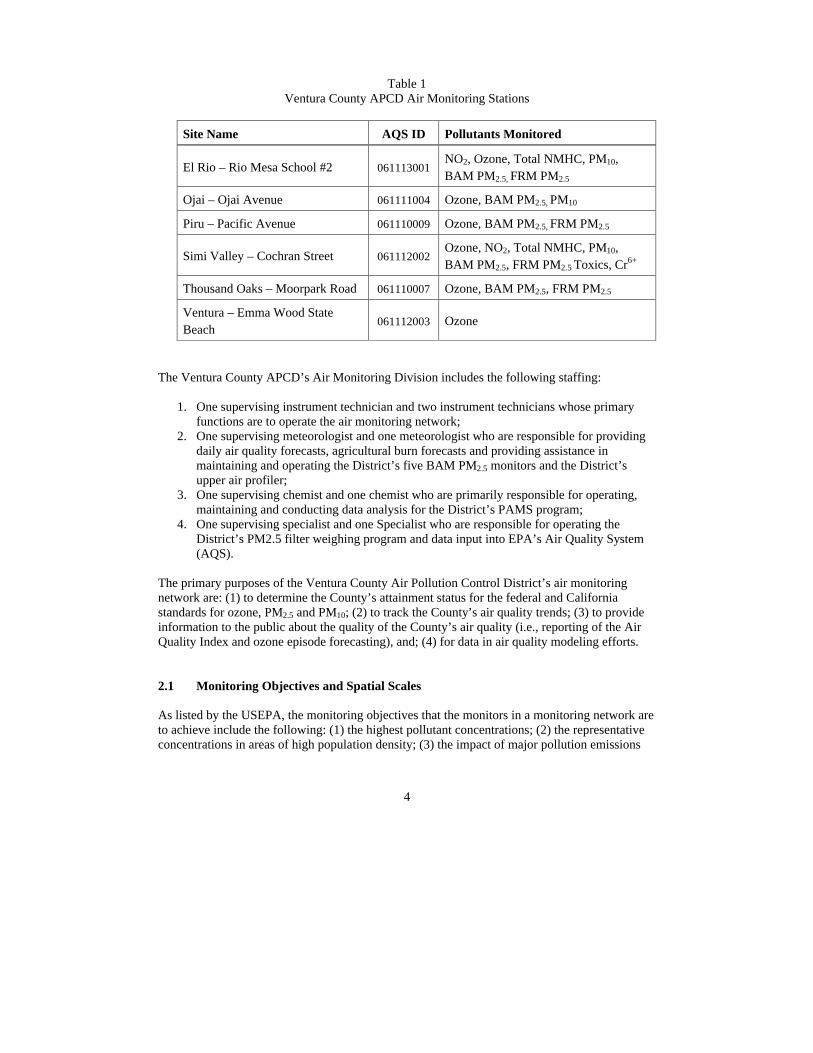
Table 1 Ventura County APCD Air Monitoring Stations
Site Name AQS ID Pollutants Monitored
El Rio – Rio Mesa School #2 061113001 NO2, Ozone, Total NMHC, PM10, BAM PM2.5, FRM PM2.5
Ojai – Ojai Avenue 061111004 Ozone, BAM PM2.5, PM10
Piru – Pacific Avenue 061110009 Ozone, BAM PM2.5, FRM PM2.5
Simi Valley – Cochran Street 061112002 Ozone, NO2, Total NMHC, PM10, BAM PM2.5, FRM PM2.5 Toxics, Cr6+
Thousand Oaks – Moorpark Road 061110007 Ozone, BAM PM2.5, FRM PM2.5
Ventura – Emma Wood State Beach
061112003 Ozone
The Ventura County APCD’s Air Monitoring Division includes the following staffing:
1. One supervising instrument technician and two instrument technicians whose primary functions are to operate the air monitoring network;
2. One supervising meteorologist and one meteorologist who are responsible for providing daily air quality forecasts, agricultural burn forecasts and providing assistance in maintaining and operating the District’s five BAM PM2.5 monitors and the District’s upper air profiler;
3. One supervising chemist and one chemist who are primarily responsible for operating, maintaining and conducting data analysis for the District’s PAMS program;
4. One supervising specialist and one Specialist who are responsible for operating the District’s PM2.5 filter weighing program and data input into EPA’s Air Quality System (AQS).
The primary purposes of the Ventura County Air Pollution Control District’s air monitoring network are: (1) to determine the County’s attainment status for the federal and California standards for ozone, PM2.5 and PM10; (2) to track the County’s air quality trends; (3) to provide information to the public about the quality of the County’s air quality (i.e., reporting of the Air Quality Index and ozone episode forecasting), and; (4) for data in air quality modeling efforts. 2.1 Monitoring Objectives and Spatial Scales
As listed by the USEPA, the monitoring objectives that the monitors in a monitoring network are to achieve include the following: (1) the highest pollutant concentrations; (2) the representative concentrations in areas of high population density; (3) the impact of major pollution emissions

5
sources; (4) the general background concentration levels; (5) the extent of pollutant transport, and (6) impacts on visibility, vegetation, and other welfare-based impacts. The physical siting of an air monitoring station must achieve a spatial scale of representativeness that is consistent with the monitoring objective of the monitor. The spatial scale results from the physical location of the site with respect to the pollutant sources. It estimates the size of the area surrounding the monitoring site that experiences uniform pollutant concentrations. Table 2, below, shows the different monitoring objectives and the appropriate spatial scale. Table 3 shows each of the District’s air monitoring stations and its criteria pollutant objective and spatial scales. The categories of spatial scale are: • Microscale - An area of uniform pollutant concentrations ranging from several meters up to
100 meters. • Middle Scale - Uniform pollutant concentrations in an area of about 100 meters to 0.5
kilometer. • Neighborhood Scale - An area with dimensions in the 0.5 to 4.0 kilometer range. • Urban Scale - Citywide pollutant conditions with dimensions ranging from 4 to 50
kilometers. • Regional Scale – A large area, usually rural, of the same general geography and without large
sources that extends from tens to hundreds of kilometers.
Table 2 Monitoring Objectives and Associated Spatial Scales
Monitoring Objective Appropriate Spatial Scale
Highest concentration Micro, Middle, Neighborhood
Population oriented Neighborhood or Urban
Source Impact Micro, middle, neighborhood
General/background levels Urban, regional
Regional transport Urban, regional
Welfare-related impacts Urban, regional

6
Table 3 Criteria Pollutant Objective and Spatial Scales
Monitoring Objective Spatial Scale HC – High concentrations MI - Microscale PO – Population exposure MS – Middle Scale IM – Source impact NS – Neighborhood Scale BL – General/Background US – Urban Scale WF – Welfare-based
Site Name O3 NO2 PM2.5 PM10
El Rio – Rio Mesa School #2 PO/US PO/US PO/NS PO/NS
Ojai – Ojai Avenue PO/US -- PO/NS PO/US
Piru – Pacific Avenue HC/US -- PO/NS PO/NS
Simi Valley – Cochran Street HC/US HC/US -- HC/NS
Thousand Oaks – Moorpark Road PO/US -- PO/NS --
Ventura – Emma Wood State Beach BL/NS -- --
2.2 Minimum Monitoring Requirements 40 CFR 58.10, Appendix D specifies the minimum requirements for air monitoring networks. As shown in Tables 2, through 8, the Ventura County APCD air monitoring network meets the minimum monitoring requirements for all ozone, PM2.5 and PM10. There are no minimum requirements for NO2, CO or SO2. For ozone, the Countywide 8-hour design value is 0.095 ppm, a decline from 0.132 ppm in 1985 (Draft Ventura County 2007 Air Quality Management Plan Revision1). The 1-hour design value in 2005 is 0.118 ppm, a decline from 0.19 ppm in 1985 (Draft Ventura County 2007 AQMP). In 2002 Ventura County attained the federal 1-hour ozone standard with a 1-hour ozone design of 0.124 ppm. For PM2.5, the Countywide 2006 annual design value is 10.3 µg/m3. The 2006 daily design value in is 28 µg/m3. The County has never exceeded either of these values. For PM10, the Countywide 2006 the maximum 24-hour average value in the years 2004 through 2006 is 119 µg/m3. The County has never exceeded either of these values.
1 Draft Ventura County 2007 Air Quality Management Plan Revision

7
2.2.1 Ozone The District operates ozone monitors at six air monitoring sites in the County. The County’s historical ozone data for the federal 8-hour standard are shown below in Table 2 and Figure 3. As shown in Table 3, the Ventura County APCD air monitoring network exceeds the minimum monitoring requirement set forth in 40 CFR Part 58.
Table 4 Historical Ozone Values
8-Hour Average National Standard = 0.08 Parts per million
Days > 8-Hour Average
Year 3 Year Average 4th High
Year Air Monitoring Site
2004 2005 2006 2004 2005 2006
El Rio 0 0 0 0.066 0.066 0.062 Ojai 13 4 6 0.094 0.090 0.090 Piru 4 2 5 0.088 0.087 0.084 Simi Valley 11 10 13 0.092 0.091 0.090
Thousand Oaks 4 0 0 0.084 0.083 0.079 Ventura 0 0 0 0.069 0.068 0.064

8
Figure 2
Historical Eight-Hour Ozone Trends Three Year Average of Fourth Highest Concentration
Table 5 Minimum Monitoring Requirements for Ozone
MSA Population (2000)
8-hour Design Value (2006)
Min. # Monitors Required
# Monitors Active
# Monitors Needed
Oxnard-Thousand Oaks-Ventura MSA
752,4452 0.09 23 6 0
2 2000 Census 3 40 CFR Part 58, Appendix D, Section 4.1 and Table D-2
Three Year Average of Fourth Highest Ozone Concentration, Truncated at Three Decimal Places. (Source: California Air Resources Board)
Federal Eight-hour Ozone Standard
0.06
0.07
0.08
0.09
0.1
0.11
0.12
0.13
0.14
0.15
1988
1990
1992
1994
1996
1998
2000
2002
2004
2006
Ozo
ne in
Par
ts p
er M
illio
n

9
2.2.2 PM2.5 The county’s historical PM2.5 data for the federal 24-hour and annual arithmetic mean standards are shown below in Tables 4 and 5. Table 6 shows that the Ventura County APCD air monitoring network exceeds the minimum monitoring requires set forth in 40 CFR Part 58 for PM2.5.
Table 6 Historical PM2.5 Values
24-Hour Standard National Standard = 35 µg/m3
Est. Days > 24-Hour Standard
Year 98th Percentile 24-Hour Value
Year Air Monitoring Site
2004 2005 2006 2004 2005 2006
El Rio 0 0 0 27 23.8 23.5 Piru 0 0 0 22.4 20.3 21.4 Simi Valley 0 0 0 36.7 26.3 27.6 Thousand Oaks 0 0 0 35.4 22.5 23.4
Table 7 Historical PM2.5 Values
Annual Arithmetic Mean National Standard = 15 µg/m3
Years > Annual Arithmetic
Mean Year
Annual Arithmetic Mean Year Air Monitoring
Site 2004 2005 2006 2004 2005 2006
El Rio 0 0 0 11.3 10.5 9.8 Piru 0 0 0 10.1 9.2 9.3
Simi Valley 0 0 0 12.5 11.2 10.3 Thousand Oaks 0 0 0 11.3 10.5 9.7

10
Table 8 Minimum Monitoring Requirements for PM2.5
MSA Population (2000)
Ann. Design Value (2006)
Daily Design Value (2006)
# Monitors Required4
# Monitors
Active
# Monitors Needed
Oxnard-Thousand Oaks-Ventura MSA
752,445 10.3 28 1 4 0
2.2.3 PM10 The County’s historical PM10 data for the federal 24-hour standard is shown below in Table 7. As shown in Table 8, the Ventura County APCD air monitoring network exceeds the minimum monitoring requires set forth in 40 CFR Part 58 for PM10.
Table 9 Historical PM10 Values
24-Hour Average National Standard = 150 µg/m3
Est. Days > 24-Hour Average
Year Maximum 24-Hour Average
Year Air Monitoring Site
2004 2005 2006 2004 2005 2006
El Rio 0 0 0 59.6 54 119.4 Ojai 0 0 0 43.8 60.4 46.4
Piru 0 -- -- 50.5 -- -- Simi Valley 0 0 0 48.7 76 56.9 Thousand Oaks 0 -- -- 68.6 -- --
4 40 CF Part 58, Appendix D, Section 4.7 and Table D-5

11
Table 10 Minimum Monitoring Requirements for PM10
MSA Population (2000)
Min. # Monitors Required
# Monitors Active
# Monitors Needed
Oxnard-Thousand Oaks-Ventura MSA
752,445 1 - 25 3 0
2.2.4 Carbon Monoxide The District previously operated monitors to measure levels of CO at the El Rio, Simi Valley and Ojai monitoring sites. Because of the low levels recorded, CO monitoring at these sites ceased in March and July 2004. 40 CFR 58, Appendix D, Section 4.2 states that there are no minimum requirements for the number of CO monitoring sites. There are no monitors required for SIP of Maintenance planning. 2.2.5 Nitrogen Dioxide The District previously operated monitors to measure levels of NO2 at the Ojai, Ventura and Thousand Oaks monitoring sites. Because of the low levels recorded, NO2 monitoring at these sites ceased in July 2004. The District currently monitors for NO2 at El Rio and Simi Valley monitoring sites. 40 CFR 58, Appendix D, Section 4.3 states that there are no minimum requirements for the number of NO2 monitoring sites. There are no monitors required for SIP of Maintenance planning. 2.2.6 Sulfur Dioxide The District previously operated a monitor to measure levels of SO2 at the El Rio monitoring site. Because of the low levels recorded, SO2 monitoring ceased in July 2004. 40 CFR 58, Appendix D, Section 4.4 states that there are no minimum requirements for the number of SO2 monitoring sites. There are no monitors required for SIP of Maintenance planning.
5 40 CFR Part 58, Appendix D, Section 4.6 and Table D-4

12
3.0 Recent or Proposed Modifications to Network. In 2003, District staff conducted an assessment of the Ventura County air monitoring network, in consultation with EPA, Region IX staff, in anticipation of the new requirements of 40 CFR Part 58. The District determined that the existing network should be reduced to prepare for anticipated future monitoring program increases. On June 24, 2004, EPA, Region IX approved the reductions to the County’s air monitoring network. Those reductions are shown below:
Parameter Location Shutdown Date PM10 Thousand Oaks – Moorpark Road July 22, 2004 Piru – Pacific Avenue July 27, 2004 Sulfur Dioxide El Rio – Rio Mesa School #2 July 28, 2004 Carbon Monoxide El Rio – Rio Mesa School #2 March 21, 2004 Simi Valley – Cochran Street March 28, 2004 Nitrogen Oxides Ojai – Ojai Avenue July 28, 2004 Ventura – Emma Wood State Beach July 29, 2004 Thousand Oaks – Moorpark Road July 22, 2004 Since 1999 the District has added continuous monitoring for PM2.5 at the Ojai, Piru, El Rio, Simi Valley and Thousand Oaks monitoring stations. Addition of continuous PM2.5 monitoring was to provide daily forecasts of PM2.5 levels and air quality index. The District is considering discontinuation monitoring operations of the Ventura (Emma Wood) monitoring station. The station sits within 200 yards of the ocean and the shelter is suffering from exposure to the elements. The site is also located within 200 yards of a major railroad line and within 300 yards of a major freeway. This site has not registered a violation of the federal eight-hour ozone standard since 1998. District staff believes that the coastal area of Ventura County can be equally served by the El Rio monitoring station. The District will work with EPA and ARB prior to discontinuing operation of the Ventura monitoring station. The public will be given a chance to provide comment on any such change. 3.1 Review of Changes to PM2.5 Monitoring Network. Ventura County APCD has designed its PM2.5 monitoring network to provide either continuous or FRM monitoring at five of its air monitoring stations. The only air monitoring station not equipped with either a continuous or FRM monitor is the station in Ventura (Emma Wood State Beach). The District has designed its PM2.5 monitoring network to provide coverage for a majority of the County’s population. As previously noted, since 1999 the District has installed continuous monitoring for PM2.5 at the Ojai, Piru, El Rio, Simi Valley and Thousand Oaks monitoring stations.

13
Through the California Air Resources Board the District will be requesting that the PM2.5 sampling frequency at the Thousand Oaks and Piru monitoring stations be reduced from a one-in-three schedule to a one-in-six schedule. The request will be made based upon the historically low concentrations measured at these stations. 4.0 Data Submission Requirements Precision reports submitted to EPA’s AQS on a monthly basis. Accuracy reports are submitted by the California Air Resources Board. The District’s annual data certification was submitted to EPA on June 26, 2007.

Appendix A
Detailed Site Information
A-2
Detailed Site Information El Rio – Rio Mesa School #2
The El Rio monitoring site is located 7 miles inland in the broad Oxnard Plain area, covering 290 square miles and home to 207,000 people (2000 Census data) – approximately 27.5 percent of the County’s population. The District currently operates samplers to collect ambient data for ozone, PM10, PM2.5, continuous PM2.5, nitrogen dioxide, non-methane hydrocarbons, volatile organic compounds (canisters), and carbonyls. The District also collects meteorological measurements at the site (wind speed, wind direction, temperature, relative humidity, and solar radiation). The District has conducted oxidant and ozone sampling in the Ventura/Oxnard Plain area since 1969. The District also has monitored for particulate matter in the Ventura/Oxnard Plain area since 1971 and has operated a Type 2 PAMS site at El Rio since 1994. Ozone Typically, this site records the lowest one- and eight-hour ozone levels in Ventura County. The eight-hour ozone design value for this area has been reduced from its peak of 11 pphm to 6.2 pphm in 2006, and the number of days on which the federal eight-hour ozone standard was exceeded has been reduced from 40 days per year in 1973 to none during 2006.
PM2.5 and PM10 This site has not exceeded the 24-hour or the annual standards for PM2.5. In 2006 the site’s annual design value for the 24-hour PM2.5 standard was 24 micrograms per cubic meter (µg/m3) and the annual arithmetic mean was 9.8 µg/m3. This site’s maximum 24-hour average PM10 has not exceeded the 24-hour PM10 standard. In 2006 the site’s maximum level for the 24-hour PM10 standard was 119 µg/m3.

A-3
Site Name El Rio – Rio Mesa School #2 AQS ID 061113001 Grid Coordinates Latitude: 34o 15’ 8” Longitude:119o 8’ 35” Location On school grounds Address 545 Central Ave, El Rio CA 93030 County Ventura County Location Type Suburban Dist. to road 75 meters Traffic count 5,000 vehicles/day Groundcover Paved/asphalt PEP audit? 11/9/2004, 02/22/2005, 03/022/2005, 05/22/2005 and 08/23/2005 NPAP audit? Date
Flow audit? Date Representative Area Oxnard Coastal Plain Pollutant Ozone BAM-PM2.5 PM10-SSI Monitor Designation PAMS/ SLAMS SLAMS Monitor objective Population exposure Population exposure Population exposure Spatial scale Urban Scale Neighborhood Urban Scale Sampling method API/Teledyne
400 Met One
1020 BAM Anderson SA1200
Analysis method Ultraviolet Absorption Beta Attenuation Size selective inlet Start date 01/01/1979 01/01/2005 04/03/1988 Operation schedule Continuous Continuous 1:6 Sampling season Year-round Year-round Year-round Probe height 4.3 meters 4.7 meters 5.5 meters Distance from supporting structure 1.2 meters 1.7 meters 1.9 meters
Distance from obstructions on roof None None None
Distance from obstructions not on roof
None None None
Distance from trees 15 meters 15 meters 15 meters Distance between collocated monitors N/A N/A N/A
Unrestricted airflow 360 degrees 360 degrees 360 degrees Probe material Borosilicate glass & FEP
Teflon N/A N/A
Residence time 7.5 seconds N/A N/A Will there be changes within the next 18 months?
No No No
Is it suitable for comparison against the annual PM2.5?
N/A N/A N/A

A-4
Pollutant FRM PM 2.5 Nitrogen Dioxide Monitor Designation SLAMS PAMS/SLAMS Monitor objective Population exposure Population exposure Spatial scale Neighborhood Urban Scale Sampling method Anderson
RAAS PM2.5 API 200A
Analysis method Size selective inlet Chemiluminescent Start date 01/01/1999 01/01/1980 Operation schedule 1:3 Continuous Sampling season Year-round Year-round Probe height 5.5 meters 4.3 meters Distance from supporting structure 1.9 meters 1.2 meters
Distance from obstructions on roof None None
Distance from obstructions not on roof
None None
Distance from trees Distance between collocated monitors N/A N/A
Unrestricted airflow 360 degrees 360 degrees Probe material N/A Borosilicate glass & FEP
Teflon Residence time N/A 9 seconds Will there be changes within the next 18 months?
No No
Is it suitable for comparison against the annual PM2.5?
Yes N/A

A-5

A-6
Detailed Site Information Ojai –Ojai Avenue
The Ojai air monitoring site is located 14 miles from the coast in the Ojai Valley area, which covers 102 square miles and is home to 30,000 people – approximately 4 percent of the County’s population. The District currently operates samplers to collect ambient ozone, PM2.5 and PM10 data. The District also collects meteorological measurements (wind speed, wind direction, temperature, relative humidity, solar radiation, and precipitation) at the site. The District has operated oxidant and ozone monitors in the Ojai Valley since 1970. (Oxidant sampling was also conducted in the Ojai Valley for a one-year period during the mid-1960s.) The District also has monitored for particulate matter in the Ojai Valley since 1973. Ozone Typically, this site records the second highest one- and eight-hour ozone levels in Ventura County, but recently has collected the highest eight-hour ozone concentrations. The one-hour ozone design value has been reduced from its peak of 0.22 ppm to 0.09 ppm in 2006. However, the site’s 2006 eight-hour ozone design value still exceeds the federal eight-hour ozone standard and is the same as Simi Valley’s design value. During 2006, eight-hour ozone concentrations at Ojai exceeded the level of the federal standard on six days. PM2.5 and PM10 This site’s maximum 24-hour average PM10 has not exceeded the 24-hour PM10 standard. In 2006 the site’s maximum level for the 24-hour PM10 standard was 46 µg/m3.

A-7
Site Name Ojai - Ojai Avenue AQS ID 061111004 Grid Coordinates Latitude: 34o 26’ 53” Longitude: 119o 13’ 53” Location In shed, on school, etc. Address 1201 Ojai Ave., Ojai CA 93023 County Ventura County Location Type Suburban Dist. to road 250 meters Traffic count 7,700 vehicles/day Groundcover Paved PEP audit? Date NPAP audit? Date Flow audit? Date Representative Area Ojai Valley Pollutant Ozone BAM PM2.5 PM10-SSI Monitor designation SLAMS SLAMS Monitor objective Population exposure Population exposure Population exposure Spatial scale Urban Neighborhood Urban
Sampling method API Teledyne 400 Met One 1020 BAM
Anderson SA1200
Analysis method Ultraviolet absorption Beta Attenuation Size Selective Inlet Start date 04/01/1996 05/17/2006 04/01/1996 Operation schedule Continuous Continuous 1:6 Sampling season Year-round Year-round Year-round Probe height 4.0 meters 4.1 meters 4.1 meters Distance from supporting structure 1.0 meters 1.5 meters 1.5 meters
Distance from obstructions on roof None None None
Distance from obstructions not on roof
None None None
Distance from trees 10.5 meters 10.5 meters 10.5 meters Distance between collocated monitors N/A N/A N/A
Unrestricted airflow 360 degrees 360 degrees 360 degrees
Probe material Borosilicate glass & FEP Teflon
N/A N/A
Residence time 7.8 seconds N/A N/A Will there be changes within the next 18 months?
No No No
Is it suitable for comparison against the annual PM2.5?
N/A N/A N/A

A-8

A-9
Detailed Site Information Piru – Pacific Avenue
This site is located 28 miles from the coast in the Santa Clara River Valley, covering 204 square miles and home to 49,000 people – approximately 15.4 percent of the County’s population. The District currently operates samplers to collect ambient ozone and PM2.5 data. The District also collects meteorological measurements at the site (wind speed, wind direction, temperature, relative humidity, solar radiation, and precipitation). The District has conducted oxidant and ozone sampling in the Santa Clara River Valley since 1972. The District also has monitored for particulate matter in the Santa Clara River Valley since 1973, with limited sampling for a one-year period during the mid-1960s. Ozone Typically, this site records the third or fourth highest one- and eight-hour ozone levels in Ventura County. The site’s eight-hour ozone design value of 0.084 ppm in 2006 is slightly lower than the federal eight-hour ozone standard. During 2006, ozone concentrations at the Piru monitoring site exceeded the level of the federal standard on five days. PM2.5 and PM10 This site has not exceeded the 24-hour or the annual standards for PM2.5. In 2006 the site’s annual design value for the 24-hour PM2.5 standard was 21 µg/m3 and the annual arithmetic mean was 9.3 µg/m3. Monitoring for PM10 at this site was discontinued in July 2004.

A-10
Site Name Piru – Pacific Avenue AQS ID 061110009 Grid Coordinates Latitude: 34o 24’ 16” Longitude: 118o 48’ 36” Location In shed, on school, etc. Address Pacific Ave., Piru CA County Ventura County Location Type Rural Dist. to road 100 meters Traffic count 22,000 vehicles/day Groundcover Gravel PEP audit? 02/22/2005 and 05/17/2005 NPAP audit? Date Flow audit? Date Representative Area Santa Clara River Valley Pollutant Ozone BAM PM2.5 FRM PM2.5 Monitor designation SLAMS SLAMS Monitor objective High concentration Population exposure Population exposure Spatial scale Urban scale Neighborhood Neighborhood
Sampling method API Teledyne 400 Met One 1020 BAM Anderson SA1200
Analysis method Ultraviolet absorption Beta Attenuation Size Selective Inlet Start date 11/03/2000 05/26/2006 11/01/2000 Operation schedule Continuous Continuous 1:36 Sampling season Year-round Year-round Year-round Probe height 3.8 meters 4.0 meters 4.0 meters Distance from supporting structure 1.4 meters 1.5 meters 1.5 meters
Distance from obstructions on roof None None None
Distance from obstructions not on roof
None None None
Distance from trees 28 meters 28 meters 28 meters Distance between collocated monitors N/A N/A N/A
Unrestricted airflow 360 degrees 360 degrees 360 degrees
Probe material Borosilicate glass & FEP Teflon N/A N/A
Residence time 9.9 seconds N/A N/A Will there be changes within the next 18 months?
No No See footnote
Is it suitable for comparison against the annual PM2.5?
N/A N/A Yes
6 The District will be requesting, trough the California Air Resources Board, that the sampling frequency be reduced to 1:6.

A-11

A-12
Detailed Site Information Simi Valley – Cochran Street
Simi Valley. The Simi Valley air monitoring site is located 34 miles from the coast in the Simi Valley area, which covers 142 square miles and is home to 148,000 people – approximately 20 percent of the County’s population. The site covers the cities of Simi Valley and Moorpark. The District currently operates samplers to collect ambient data for ozone, PM10, PM2.5, continuous PM2.5, speciated PM2.5, nitrogen dioxide, non-methane hydrocarbons, volatile organic compounds (canisters), and air toxics. In addition to sampling for gaseous and particulate air pollutants, the District collects meteorological measurements (wind speed, wind direction, temperature, relative humidity, solar radiation, and visibility) at the site. At the Simi Valley Upper Air Site, seven miles to the west, the District operates an atmospheric profiler, which collects wind and temperature data from 60 meters to 2,000 meters above the surface. At the surface, we collect additional meteorological data (wind speed, wind direction, temperature, relative humidity, solar radiation, precipitation, ultraviolet radiation, and atmospheric pressure). The District has continuously operated ozone monitors at the same location in Simi Valley since 1973. The District also has monitored for particulate matter at the same location since 1973, and has operated a Type 3 PAMS (Photochemical Assessment Monitoring Station) site since 1995. In addition, the site is designated a national fine particle speciation trends network site. Ozone This site typically records the highest one- and eight-hour ozone levels, the highest PM2.5 levels, and some of the highest PM10 levels in Ventura County. While the one-hour ozone design value has been reduced from its peak of 0.23 ppm to 0.121 ppm in 2006, its 2006 eight-hour ozone design value of 0.09 ppm still exceeds the federal eight-hour ozone standard. During 2006, ozone concentrations at Simi Valley exceeded the level of the federal eight-hour standard on 13 days. PM2.5 and PM10 This site has not exceeded the 24-hour or the annual standards for PM2.5. In 2006 the site’s annual design value for the 24-hour PM2.5 standard was 28 µg/m3 and the annual arithmetic mean was 10.3 µg/m3. In 2006 the site’s maximum level for the 24-hour PM10 standard was 22 µg/m3.

A-13
Site Name Simi Valley – Cochran Street AQS ID 061112002 Grid Coordinates Latitude: 34o 16’ 34” Longitude: 118o 41’ 1” Location On school grounds Address 5400 Cochran St., Simi Valley CA 93063 County Ventura County Location Type Suburban Dist. to road 140 meters Traffic count 10,000 vehicles/day Groundcover Gravel PEP audit? 02/22/2005 and 05/17/2005 NPAP audit? Date Flow audit? PM10 flow audit on 07/22/2005 Representative Area Simi Valley Pollutant Ozone Nitrogen Dioxide PM10-SSI Monitor designation PAMS/SLAMS PAMS/SLAMS SLAMS Monitor objective High concentrations High concentrations High concentrations Spatial scale Urban Urban Neighborhood Sampling method API Teledyne 400 API 200A Tisch PM10 Analysis method Ultraviolet Absorption Chemiluminescent Size Selective Inlet Start date 06/01/1985 06/01/1985 11/04/1986 Operation schedule Continuous Continuous 1:6 Sampling season Year-round Year-round Year-round Probe height 3.9 meters 3.9 meters 4.8 meters Distance from supporting structure 1.3 meters 1.3 meters 1.5 meters
Distance from obstructions on roof None None None
Distance from obstructions not on roof
None None None
Distance from trees 61 meters 61 meters 73 meters Distance between collocated monitors N/A N/A 3.5 meters
Unrestricted airflow 360 degrees 360 degrees 360 degrees
Probe material Borosilicate glass & FEP Teflon
Borosilicate glass & FEP Teflon N/A
Residence time 7.9 seconds 8.3 seconds N/A Will there be changes within the next 18 months?
No No No
Is it suitable for comparison against the annual PM2.5?
N/A N/A N/A

A-14
Pollutant BAM PM2.5 FRM PM2.5 Monitor designation SLAMS Monitor objective Population exposure High concentration Spatial scale Neighborhood Neighborhood
Sampling method Met One 1020 BAM
Anderson RAAS 2.5-300
Analysis method Beta Attenuation Size Selective Inlet Start date 01/01/2004 01/01/1999 Operation schedule Continuous 1:3 Sampling season Year-round Year-round Probe height 4.7 meters 4.7 meters Distance from supporting structure 1.4 meters 1.4 meters
Distance from obstructions on roof None None
Distance from obstructions not on roof
None None
Distance from trees 61 meters 73 meters Distance between collocated monitors N/A meters
Unrestricted airflow 360 degrees 360 degrees Probe material N/A N/A Residence time N/A N/A Will there be changes within the next 18 months?
No No
Is it suitable for comparison against the annual PM2.5?
N/A Yes

A-15

A-16
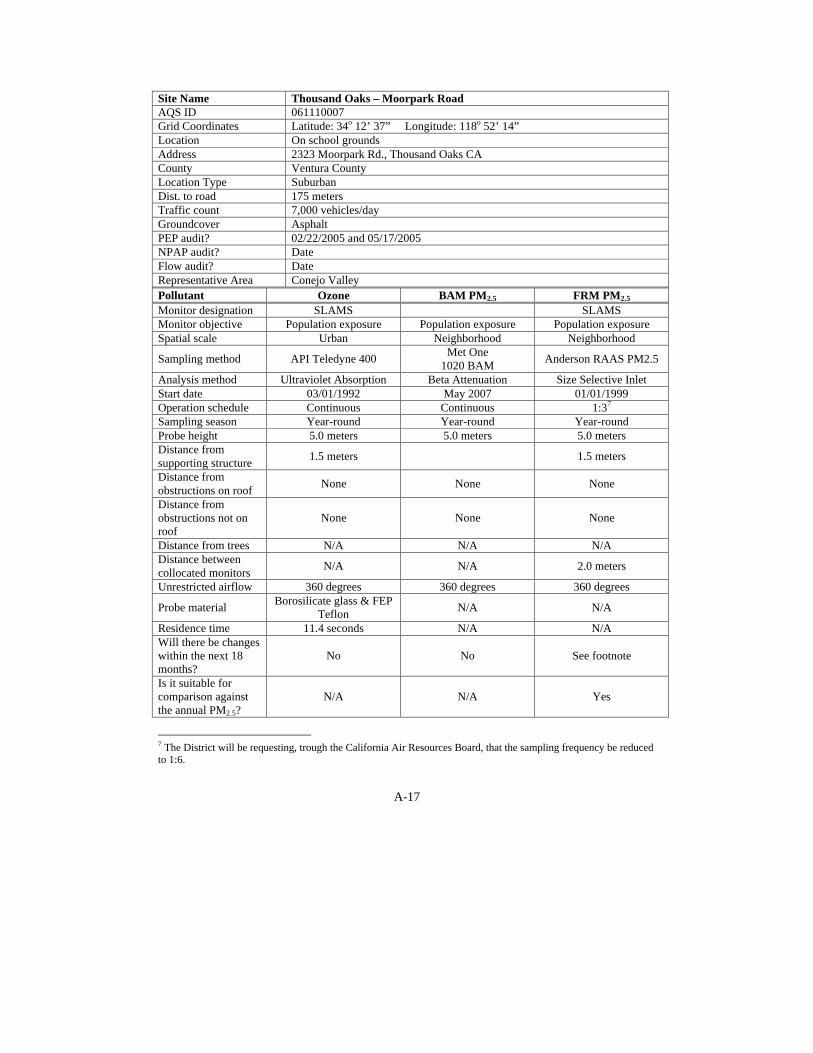
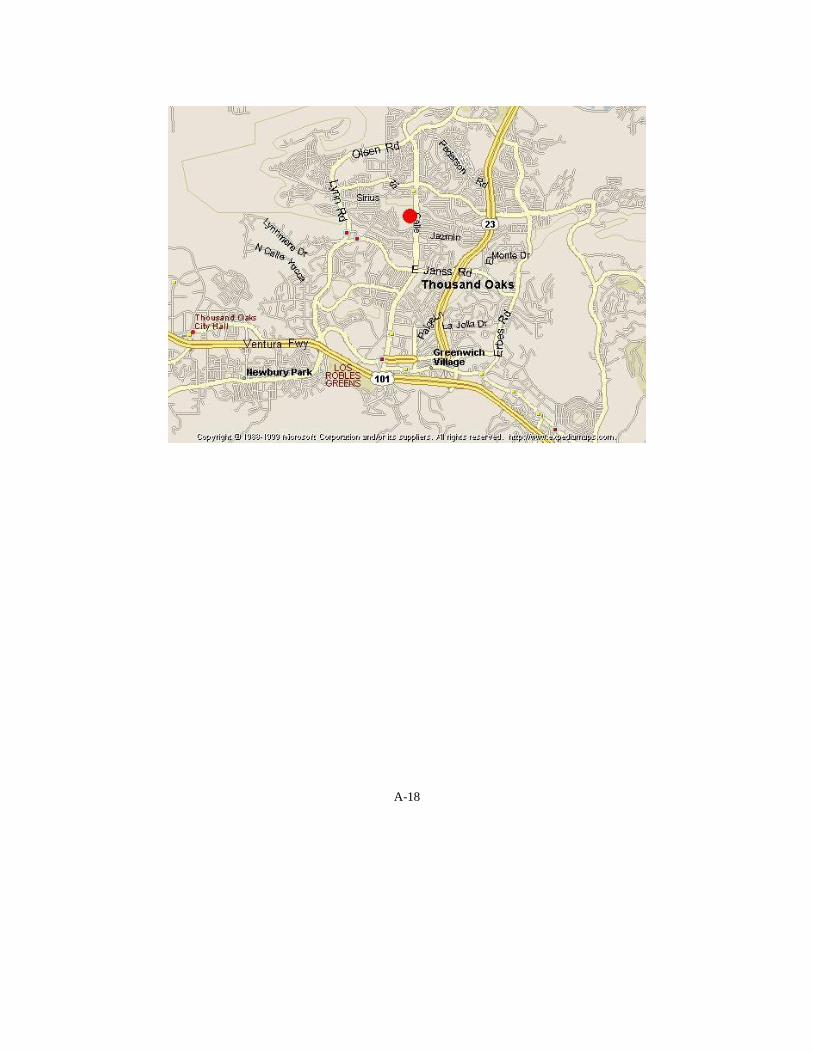
Detailed Site Information Thousand Oaks – Moorpark Road
This site is located 21 miles inland in the Conejo Valley, covering 75 square miles and home to 138,000 people – approximately 18.3 percent of the County’s population. The District currently operates samplers to collect ambient ozone and PM2.5 data. The District also collects meteorological measurements at the site (wind speed, wind direction, temperature, relative humidity, solar radiation, and precipitation). The District has conducted ozone sampling in the Conejo Valley since 1973. The District also has monitored for particulate matter in the Conejo Valley since 1979, with limited sampling prior to that. Ozone Typically, this site records the third or fourth highest one- and eight-hour ozone levels in Ventura County. The one-hour ozone design value has been reduced from its peak of 0.19 ppm to 0.104 ppm in 2004. The site’s eight-hour ozone design value of 0.079 ppm in 2006 attains the federal eight-hour ozone standard. With a maximum eight-hour ozone concentration of 0.083 ppm in 2006, the Thousand Oaks air monitoring station did not exceed the federal eight-hour standard. PM2.5 and PM10 This site has not exceeded the 24-hour or the annual standards for PM2.5. In 2006 the site’s annual design value for the 24-hour PM2.5 standard was 23 µg/m3 and the annual arithmetic mean was 10.1 µg/m3. Monitoring for PM10 at this site was discontinued in July 2004.
A-17
Site Name Thousand Oaks – Moorpark Road AQS ID 061110007 Grid Coordinates Latitude: 34o 12’ 37” Longitude: 118o 52’ 14” Location On school grounds Address 2323 Moorpark Rd., Thousand Oaks CA County Ventura County Location Type Suburban Dist. to road 175 meters Traffic count 7,000 vehicles/day Groundcover Asphalt PEP audit? 02/22/2005 and 05/17/2005 NPAP audit? Date Flow audit? Date Representative Area Conejo Valley Pollutant Ozone BAM PM2.5 FRM PM2.5 Monitor designation SLAMS SLAMS Monitor objective Population exposure Population exposure Population exposure Spatial scale Urban Neighborhood Neighborhood
Sampling method API Teledyne 400 Met One 1020 BAM Anderson RAAS PM2.5
Analysis method Ultraviolet Absorption Beta Attenuation Size Selective Inlet Start date 03/01/1992 May 2007 01/01/1999 Operation schedule Continuous Continuous 1:37 Sampling season Year-round Year-round Year-round Probe height 5.0 meters 5.0 meters 5.0 meters Distance from supporting structure 1.5 meters 1.5 meters
Distance from obstructions on roof None None None
Distance from obstructions not on roof
None None None
Distance from trees N/A N/A N/A Distance between collocated monitors N/A N/A 2.0 meters
Unrestricted airflow 360 degrees 360 degrees 360 degrees
Probe material Borosilicate glass & FEP Teflon N/A N/A
Residence time 11.4 seconds N/A N/A Will there be changes within the next 18 months?
No No See footnote
Is it suitable for comparison against the annual PM2.5?
N/A N/A Yes
7 The District will be requesting, trough the California Air Resources Board, that the sampling frequency be reduced to 1:6.
A-18

A-19
Detailed Site Information Ventura - Emma Wood State Beach
The Ventura monitoring site is located along the coast at Emma Wood State Beach, and represents a coastal area covering 114 square miles and home to 180,000 people – approximately 24 percent of the County’s population. The District operates samplers to collect ambient data for ozone, and volatile organic compounds (canisters). The District also collects meteorological measurements (wind speed, wind direction, temperature, relative humidity, and solar radiation). The District has conducted oxidant and ozone sampling in the coastal area since 1972 at locations ranging from Point Mugu to La Conchita. Most of the monitoring, however, has occurred at sites in the Ventura area. In addition, limited sampling for oxidants was conducted in the area during the mid- and late-1960s and early 1970s. The District also has operated a Type 1 PAMS site at the Emma Wood Beach site since 1996. The eight-hour ozone design value for the Ventura County coastal area has been reduced from its peak of 0.103 ppm to 0.064 ppm in 2006, and the number of days on which the federal eight hour ozone standard was exceeded has been reduced from 20 days per year in 1983 to none in 2006.

A-20
Site Name Ventura - Emma Wood State Beach AQS ID 061112003 Grid Coordinates Latitude: 34o 16’ 50” Longitude: 119o 18’ 55” Location State Park Address Emma Wood State Beach, Ventura CA County Ventura County Location Type Suburban Dist. to road 90 meters Traffic count 175,000 vehicles/day Groundcover Grass and vegetation PEP audit? Date NPAP audit? Date Flow audit? Date Representative Area Ventura Coastal Pollutant Ozone Monitor designation PAMS/SLAMS Monitor objective General/Background Spatial scale Neighborhood Sampling method API/Teledyne 400 Analysis method Ultraviolet Absorption Start date 03/01/1984 Operation schedule Continuous Sampling season Year-round Probe height 4.0 meters Distance from supporting structure 1.0 meters
Distance from obstructions on roof None
Distance from obstructions not on roof None
Distance from trees N/A Distance between collocated monitors N/A
Unrestricted airflow 360 degrees Probe material Borosilicate glass & FEP Teflon Residence time 10.5 seconds Will there be changes within the next 18 months?
The District is considering whether to discontinue operation of this site. Prior to taking such action, the District will work with EPA and ARB. The public will be given a chance to provide comment on any such change.

A-21

A-22
Detailed Site Information Simi Valley – Upper Air Monitoring Station
Site Name Simi Valley – Upper Air Monitoring Station AQS ID 061110008 Grid Coordinates Latitude: 34o 17’ 28”
Longitude: 118o 47’ 51” Location At Simi Valley Landfill Address 2801 Madera Rd., Simi Valley CA County Ventura County