final fuel availability study report 04142008 · 1.1 purpose of the fuel availability study ... 6.0...
TRANSCRIPT

FINAL REPORT
LOW-SULFUR MARINE FUEL AVAILABILITY STUDY
Prepared for
PORT OF LONG BEACH and PORT OF LOS ANGELES
By
Tetra Tech, Inc.
3475 E. Foothill Blvd. Pasadena, CA 91107
and
UltraSystems Environmental Incorporated
100 Pacifica, Suite 250, Irvine CA 92618
April 14, 2008

DISCLAIMER
Reference herein to any specific commercial products, process, or service by trade name, trademark, manufacturer, or otherwise, does not necessarily constitute or imply its endorsement, recommendation, or favoring by the authors. The views and opinions of authors expressed herein do not necessarily state or reflect those of the Ports of Long Beach and Los Angeles and shall not be used for advertising or product endorsement purposes.

ACRONYMS & ABBREVIATIONS
APL/MOL American President Lines/Mitsui O.S.K. Lines, Ltd. ARB California Air Resource Board bpd barrels per day CAAP San Pedro Bay Ports Clean Air Action Plan DMA Distillate Marine Oil Type A DNVPS DNV Petroleum Services DWT Deadweight Ton E.U. European Union IFO Intermediate Fuel Oil IMO International Maritime Organization ISO International Organization for Standardization MARPOL Marine Pollution MDO Marine Diesel Oil MGO Marine Gas Oil MPA Maritime and Port Authority of Singapore OGV Ocean Going Vessel POLA Port of Los Angeles POLB Port of Long Beach PZ Precautionary Zone RO Residual Oil SECA Sulfur Oxides Emission Control Area TEUs Twenty-foot Equivalent Units ULO Used lubricating oil U.S. United States USD U.S. Dollar USEPA United States Environmental Protection Agency VSR Vessel Speed Reduction Program

TABLE OF CONTENTS
Acknowledgement
Executive Summary ......................................................................................................................... i
1.0 Introduction........................................................................................................................1
1.1 Purpose of the Fuel Availability Study....................................................................1 1.2 Other Fuel Availability Investigations.....................................................................1 1.3 Current Study Approach ..........................................................................................2 1.4 Outline of the Report ...............................................................................................2
2.0 Background ........................................................................................................................3
2.1 Information on Marine Fuel Types ..........................................................................3 2.1.1 Major Fuel Types.........................................................................................3 2.1.2 Marine Gas Oil (DMA)................................................................................3 2.1.3 Other Definitions .........................................................................................5
2.2 Regulatory Activity..................................................................................................5 2.2.1 International .................................................................................................5 2.2.2 U.S. Environmental Protection Agency.......................................................6 2.2.3 California Air Resource Board ....................................................................7 2.2.4 Other States..................................................................................................8
2.3 San Pedro Bay Ports’ Clean Air Action Plan...........................................................9 2.3.1 OGV3 (OGV Auxiliary Engine Fuel Standards) .........................................9 2.3.2 OGV4 (OGV Main Engine Fuel Standards)..............................................10
3.0 Fuel Demand Estimates ...................................................................................................11
4.0 Availability Investigation ................................................................................................15
4.1 Overall Approach...................................................................................................15 4.2 Bunkering Port Survey...........................................................................................15
4.2.1 Identification of Bunkering Ports...............................................................15 4.2.2 Ocean Carrier Survey Methods..................................................................15
4.3 Bunker Supplier Survey.........................................................................................18 4.3.1 Identification of Bunker Suppliers.............................................................18 4.3.2 Survey Forms and Methods .......................................................................19 4.3.3 Bunker Survey Response ...........................................................................19
4.4 Refinery Survey .....................................................................................................19 4.4.1 Objective ....................................................................................................19 4.4.2 Identification of Refiners ...........................................................................20

4.4.3 Survey Forms and Methods .......................................................................20 4.4.4 Refinery Survey Response.........................................................................20
5.0 Availability Assessment ...................................................................................................21
5.1 General Findings....................................................................................................21 5.1.1 Bunker Supplier Survey Results ................................................................21 5.1.2 Analysis of Fuel Sulfur Content Data........................................................24 5.1.3 Petroleum Refinery Survey Results ...........................................................27 5.1.4 Alternative Estimate of Low-Sulfur Fuel Availability ..............................27
5.2 Port-by-Port Assessment........................................................................................29 5.2.1 North American Ports ................................................................................29 5.2.2 Asian/Oceania Ports...................................................................................34 5.2.3 European Ports ...........................................................................................44 5.2.4 Latin American and Carribean Ports..........................................................46 5.2.5 Middle East and Other ...............................................................................48 5.2.6 Summary of Fuel Availability Assessment for Survey Ports ....................49
5.3 Overview of World Refinery Capacity ..................................................................53 5.3.1 Refinery Basics ..........................................................................................53 5.3.2 Crude Oil Grades, Refinery Processes, and Product Yields ......................54 5.3.3 Current Status.............................................................................................56 5.3.4 Assessment of Future Expansion for Low-Sulfur Distillate Production ...59 5.3.5 Refining Capacity Conclusions..................................................................60
6.0 Comparison of Demand with Supply .............................................................................62
6.1 Near-Term (2008 and 2009) ..................................................................................62 6.1.1 Estimation of Regional Demand for Low-Sulfur DMA ............................63 6.1.2 Estimation of Regional Supply of Low-Sulfur Fuel ..................................67
6.2 Comparision of Demand With Supply...................................................................68 6.2.1 Regional Demand Estimate Based upon Ocean Carrier Survey Data .......68 6.2.2 Regional Demand Estimate Based Upon Vessel Calls Data .....................70 6.2.3 Summary of Comparison of Regional Demand With Supply ...................72
6.3 Longer Term (2010 and Beyond) ..........................................................................75
7.0 Fuel Cost Comparison .....................................................................................................76
7.1 Survey Results .......................................................................................................76 7.2 Additional Price Information .................................................................................76
8.0 Discussion and Conclusions ............................................................................................78
8.1 Survey Methodology and Response Rate ..............................................................78

8.2 Identification of Bunkering Ports...........................................................................78 8.3 Low-Sulfur Bunker Fuel Demand and Supply ......................................................79 8.4 Price Differential....................................................................................................80 8.5 Changes in Overall Fuel Market ............................................................................80
8.5.1 IFO versus Low-Sulfur DMA....................................................................81 8.5.2 Competition with On-road Diesel..............................................................81
8.6 Global and Regional Supply ..................................................................................81
Appendices Appendix A Ocean Carrier Survey Form Appendix B Bunker Supplier Survey Form Appendix C Refinery Survey Form Appendix D Fuel Consumption Study Conducted by Starcrest Consulting Group, LLC
Tables
2-1 Definition of Distillate Fuels Per ISO 2817 (2005) .............................................................4
3-1 Engine Types Active in Geographic Areas Analyzed .......................................................11
3-2 Estimated Consumption by Ocean-Going Vessels Visiting San Pedro Bay Ports in 2005....................................................................................................................................12
3-3 OGV3 and OGV4 Lease-Based Penetration Factors .........................................................13
3-4 Projected Consumption of Low-Sulfur MGO Assuming Implementation of OGV1, OGV3, and OGV4 Through Terminal Leases ...................................................................13
3-5 Fuel Consumption for 2005 Vessels with Breakwater at San Pedro Bay Ports.................14
4-1 Ocean Carriers that Identified Bunkering Ports.................................................................16
4-2 Bunkering Ports Identified by Ocean Carriers’ Survey .....................................................17
4-3 Summary of Response to Bunker Supply Survey..............................................................20
5-1 Summary of Survey Sample ..............................................................................................21
5-2 Quantities of DMA and Low-Sulfur DMA Recorded by Survey Sample .........................22
5-3 Extrapolation of Availability of Low-Sulfur DMA, by Region ........................................23
5-4 Reported Low-Sulfur DMA Stem Values, by Region .......................................................23
5-5 Vessel Types and Typical Marine Diesel Oil Stem Values...............................................24

5-6 Results of Analysis of DNV Sulfur Content Data .............................................................26
5-7 Estimated Low-Sulfur DMA Sales in 2006 and 2007, by Region.....................................28
5-8 Qualitative Low-Sulfur MGO Fuel Availability Assessment Survey ...............................51
5-9 Crude Oil Types and Product Yields .................................................................................55
5-10 Refinery Process and Production Yields............................................................................55
5-11 U.S. Refinery Utilization and Capacity, 1996-2006 ..........................................................56
5-12 Total and Operating Refineries in the U.S., 1994-2004 ....................................................57
5-13 World Refinery Population and Capacity, 2007................................................................58
5-14 World Refinery Capacity Trend, 1997-2007 .....................................................................58
5-15 World Apparent Consumption of Selective Refined Petroleum Products, 2004...............59
5-16 Worldwide Hydrotreating and Desulfurization Construction, 2007..................................60
6-1 Reported Bunkering Port Statistics....................................................................................64
6-2 Fuel Demand by Region Using Reported Bunkering Ports ...............................................65
6-3 Vessel Call Statistics..........................................................................................................66
6-4 Fuel Demand by Region Using Vessel Calls Data ............................................................66
6-5 Estimated Low-Sulfur DMA Sales in 2007, by Region Using DNV Fuel Data................67
6-6 Comparison of 2007 Reported Sales from Bunker Supplier Survey with Regional Demand ..............................................................................................................................68
6-7 Comparison of 2007 Sales From Stem Values with Regional Demand ............................69
6-8 Comparison of 2007 Capacities with Regional Demand...................................................69
6-9 Comparison of 2007 Reported Sales with Regional Demand ...........................................71
6-10 Comparsion of 2007 Sales From Stem Values With Regional Demand ...........................71
6-11 Comparison of 2007 Capacities with Regional Demand...................................................72
6-12 Summary of Low-Sulfur DMA Regional Demand and Supply Analyses.........................74
7-1 Reported Price Differentials Between Low-Sulfur DMA and IFO 180 and IFO 380 .......77
7-2 Price Premiums for Low-Sulfur Fuel in European Market in 2006………………...........77
Figures
5-1 Error Bounds for Fraction of Sulfur Analysis With < 0.2% Sulfur ...................................27
5-2 Geographical Locations of Ports Surveyed........................................................................52
5-3 Basic Refinery Processes ...................................................................................................54
6-1 Low-Sulfur Fuel Demand and Supply Evaluation Matrix.................................................63

ACKNOWLEDGEMENT Tetra Tech and UltraSystems would like to thank the staff of the Ports of Long Beach and Los Angeles for their direction and support during the course of this study. Carter Atkins Betsy Foley Thomas Jelenic Christopher Patton Heather Tomley This report would not have been possible without the important information provided by the following companies and organizations: Akron Trade and Transport FZE Alaska Tanker Company Associated Bunkeroil Contractors BV Barwil agent for Wallenius Wilhelmsen Logistics Bomin Bunker Oil Bominflot BV (Antwerp, Rotterdam) BP Marine BP Shipping Bunker House Petroleum Chimbusco, China (Beijing, Shanghai, Guangzhou) CMA CGM America Coastal Oil Holdings ConocoPhillips (Portland, San Francisco, Long Beach) Consort Bunkers COSCO Container Lines Americas DNV Petroleum Services Dolphin Marine Fuels Inc. Eastern Car Lines (Americas) Enjet Inc. ExxonMobil Marine Fuels (Antwerp, Rotterdam) FAL Energy Ltd. (UK) Fuel and Marine Marketing Antilles Ltd. Fuel and Marine Marketing BV Fuel and Marine Marketing LLC. Gas Trade Global Energy Trading Hanjin Shipping Company Ltd. Houston Marine Services Inc.
Itochu Petroleum Japan Ltd. J.A.M. Marine Services LLC. Kanematsu Corp K Line America, Inc. LauritzenCool (USA) Inc. Matrix Marine Fuels L.P. Matson Mediterranean Shipping Company Monjasa A/S O.W. Bunker China Ocean Bunkering Services Pan Nation Peninsula Petroleum Ltd. Petro-Diamond Inc. Rainier Petroleum Sentek Marine Shell Hong Kong Shell-Polypetroles Shell SA SinoTrans Shipping Agency Soaring Dragon Enterprise Starcrest Consulting Group, LLC. Sumitomo Corp. Tesoro Refining & Marketing Co. (Portland, Seattle and Houston) The Jankovich Company Toko Kaiun Kaisha, Ltd. ToyoFuji Shipping Co. Ltd. Trac Tide Marine Corp. Vermont Bunkering Westport Petroleum Inc. Zim American Integrated Shipping Co.

Project Manager: Eddy Huang, Ph.D., Tetra Tech, Inc. Principal Authors: Michael Rogozen, D.Env., UltraSystems Environmental, Inc.
Charng-Ching Lin, Ph.D., Tetra Tech, Inc.
Surveys: Kelly Trainor, Tetra Tech, Inc. Shannon Feeney, Tetra Tech, Inc. Tina Wun, Tetra Tech, Inc. Adrina McDonald, UltraSystems Environmental, Inc. Edith Kunihiro, UltraSystems Environmental, Inc. Howard Chang, UltraSystems Environmental, Inc.
Technical Editors: Mark Bell, Tetra Tech, Inc.
Michael Grossman, Tetra Tech, Inc. Tunisia Hardy, Tetra Tech, Inc.

i
EXECUTIVE SUMMARY
The objective of this study was to determine whether enough low-sulfur marine distillate fuel, at the major bunkering ports used by vessels calling at the San Pedro Bay ports, will be available to implement Clean Air Action Plan (CAAP) measures OGV3 and OGV4. OGV3 (OGV Auxiliary Engine Fuel Standards) and OGV4 (OGV Main Engine Fuel Standards) require ocean going vessels (OGVs) to burn distillate fuel having a mass-to-mass sulfur content ≤ (less than or equal to) 0.2% when they are transiting within 20 to 40 nautical miles of Point Fermin, maneuvering through the harbors, and at berth. In this report, “bunkering” refers to the loading of fuel onto OGVs, whether for use in main (propulsion) engines or on-board auxiliary engines. The main types of marine fuels discussed in this report are residual oil (RO), marine gas oil (MGO), intermediate fuel oil (IFO), and marine diesel oil (MDO). RO is the heaviest fraction of the distillation of crude oil. MGO is pure distillate oil and has the lowest sulfur content. IFO is a mix of residual oil and distillate oil.1 MDO consists of distillate oil with a trace of residual oil. This study focuses on MGO because CAAP measures OGV3 and OGV4 specify MGO or distillate oil. This report also refers frequently to this fuel as “DMA.” The European Commission defines DMA as any marine fuel that meets certain viscosity or density criteria enumerated in International Organization for Standardization (ISO) 8217. In this report, the term “distillate fuel” is used interchangeably with “MGO” and “DMA,” and “low-sulfur DMA” is defined as marine distillate fuel with a sulfur content ≤ 0.2% by weight.2 Finally, a stem is the amount of fuel delivered to a ship in the course of one ship loading at one port. Supply and demand in 2008 and 2009 were estimated by bunkering region for three implementation scenarios: 1) through conditions on lease renewals; 2) through requiring all vessels to use low-sulfur DMA up to 40 nautical miles from Point Fermin; and 3) requiring all vessels to use low-sulfur DMA within the ports’ breakwaters. The breakwater zone includes harbor maneuvering, at-berth hotelling and at-anchorage hotelling. The lease renewal scenario would be gradual, since it would be implemented only as the current leases expire. The all-vessels within 40 miles of Point Fermin option would be more immediate, as it would apply to all OGVs calling on the ports. The within-breakwater requirement would also apply immediately to all OGVs. The majority of fuel consumption within the breakwaters would be for at-berth hotelling. The availability of low-sulfur DMA by bunkering region was estimated through two surveys and an analysis of fuel sulfur data. First, a survey of ocean carriers that visit the San Pedro Bay ports was conducted to identify the names of the ports where ships belonging to the survey sample obtain fuel immediately before sailing to POLA or POLB. The survey also gathered information on the decision-making process for determining where and when OGVs obtain their fuel; factors
1 The two main IFOs mentioned in this report are IFO 180, which is a mix of 98 percent of residual oil and 2
percent of distillate oil; and IFO 380, which is a mix of 88 percent of residual oil and 12 percent of distillate oil. 2 The term “low sulfur fuel” is used occasionally in this report to mean a marine fuel whose sulfur content has been
reduced in response to regulatory requirements. To avoid misunderstanding, the term “low-sulfur DMA” always means a marine distillate fuel with a sulfur content ≤ 0.2% by weight.

ii
entering into the decision on which bunkering port(s) to visit; awareness of sources of low-sulfur DMA; the need to install dedicated tanks for low-sulfur DMA on board; and quantities of low-sulfur DMA loaded onto an OGV, including maintaining a reserve supply. The survey, which was conducted by email and telephone, identified 37 ports in 16 countries. To obtain data on low-sulfur DMA capacity and on sales of this fuel in 2006 and 2007, 237 bunkering companies that provide marine fuel directly to OGVs were surveyed by email and telephone. These firms met at least one of the following criteria: bunker suppliers at POLA or POLB; suppliers at known major bunkering ports (e.g. Rotterdam); bunker suppliers where fuel analysis data (see below) indicated a high percentage of distillate fuel stems with sulfur content ≤ 0.2%; the 20 highest-volume bunker suppliers at the Port of Singapore; 16 bunker suppliers at the Port of Hong Kong that claim to comply completely with MARPOL Annex VI requirements;3 and bunker suppliers at additional ports identified by the ocean carrier survey. Thirty-five complete responses and 15 partial responses were received from the bunker suppliers. Finally, a telephone survey of the four oil companies with the highest production in the world was conducted: British Petroleum (BP), ExxonMobil, Royal Dutch Shell (Shell), and ChevronTexaco. Because of concerns over the possibility of release of sensitive business information, the four refineries declined to participate in the survey. Therefore, “off-the-record” interviews were conducted with refinery personnel to learn about their firms’ possible reactions to increasing demand for low-sulfur DMA, such as future expansion or construction of new refinery and/or desulfurization units. Nineteen bunker suppliers reported that they sold ≤ 0.2% sulfur DMA to OGVs. Of these, only nine provided sales data. Sales data comprise highly sensitive business information that few companies are willing to share. Capacity and/or sales data were received from bunker suppliers in Central and South America, China, Japan, the Middle East, North America-Gulf Coast and North America-West Coast. No low-sulfur DMA sales or capacity data were obtained for four regions (Australia/South Pacific, Europe, North America-East Coast, and “Other Asia”). Estimation from the survey results suggested that worldwide low-sulfur DMA capacity was 2,524,200 metric tons (tonnes). Reported sales in 2006 and 2007 were 411,000 and 402,200 tonnes respectively. Because relatively few bunker suppliers provided data, and since no data were received from Europe (a known major source of low-sulfur DMA), these totals are minimal. From bunker supplier survey results and literature information on fuel tank capacities, an average stem size of 240 tonnes was estimated. In addition to the surveys of ocean carriers and bunker suppliers, the sulfur content results for 4,704 DMA fuel analyses conducted by DNV Petroleum Services (DNVPS) at 25 ports, from December 3, 2005 to December 16, 2007, were reviewed. Each data record included the name of the country, the name of the port, the date of the stem sample collection, and the sulfur content as a weight percent. From this information, the percentage of stems with ≤ 0.2% sulfur at each port, 3 “MARPOL Annex VI,” which implements part of the International Maritime Organization’s (IMO’s) 1973
“International Convention for the Prevention of Pollution from Ships,” includes provisions allowing for “SOx Emission Control Areas” (SECAs) to be established. In those areas (currently limited to the North Sea and the Baltic Sea), the sulfur content of marine fuel oil must not exceed 1.5%.

iii
as well as the median sulfur percent at each port, were determined. Eleven ports in all regions except the Middle East had a median sulfur content of ≤ 0.2%. For 17 ports, the percentage of annual stems having sulfur content of ≤ 0.2% increased from 2006 to 2007. To obtain an alternative estimate of the availability of low-sulfur DMA and to increase the number of bunkering supply regions for the analysis, the average stem value of 240 tonnes was multiplied by the number of DNVPS sulfur content analyses in which the sulfur content was ≤0.2% DMA. The results were then divided by 0.7 since DNVPS estimates that it analyzes 70 percent of the stems delivered worldwide. The estimated low-sulfur DMA sales in 2006 and 2007 were 227,657 and 320,571 tonnes respectively.
Also conducted was a qualitative evaluation of the ports that had been identified by ocean carriers to be refueling locations for San Pedro Bay-bound OGVs. At each refueling port, information about the potential for low-sulfur DMA supply was obtained. Information sources included the ports, trade journals, and correspondence with bunker suppliers. The final step in the supply evaluation was a review of the status of the world petroleum industry, emphasizing information potentially relevant to low-sulfur distillate availability. The conclusions of this review were the following:
• Refineries will gear up to produce higher-value products to meet the demand, therefore limiting the production of residual fuel;
• New refineries in developed countries produce very small fractions (10 percent in the
U.S.) of residual fuel;
• Because of high demand for low-sulfur fuel in Europe and North America, the residual fuel produced in these regions will eventually be shipped to regions such as Asia and Middle East for consumption, which will impact the global distribution and pricing of residual fuel;
• Because of stringent environmental requirements in developed countries, new refineries
will most likely be built in developing countries with technology out-sourced from developed countries to capture low labor cost and lower overall production costs;
• Low-sulfur marine fuel, such as low-sulfur DMA, carries a high premium; and
• If the price of low-sulfur DMA is comparable to fuels used by on-road mobile vehicles,
there might be an incentive for refineries to produce or to reformulate the product to meet the demand, creating market competition between on-road and marine fuel use.
In summary, the world supply of low-sulfur DMA to meet the increasing demand is not likely a technical issue, but rather an economic one. It is anticipated that the demand for low-sulfur DMA is more likely to be met by world refineries as long as there is a strong economic incentive.

iv
As a separate task, Starcrest Consulting Group, LLC (Starcrest) estimated the total OGV demand for < 0.2% sulfur MGO for OGVs calling on the Ports of Long Beach and Los Angeles from 2008 to 2011, assuming phased implementation of OGV3 and OGV4. Starcrest also estimated the total demand, assuming that the two control measures were implemented immediately for all vessels operating within the ports’ breakwaters and for all vessels operating up to 40 nautical miles from Point Fermin. The total demand under implementation through leases would be 948 and 11,104 tonnes in 2008 and 2009 respectively. Under all vessel requirement options, the 2005 vessel fuel consumption within breakwater (including harbor maneuvering, at-berth and anchorage hotelling) was estimated to be 152,610 tonnes, and the total demand for operations up to 40 nautical miles from Point Fermin would be 241,306 tonnes. Two approaches were used to estimate the regional distribution of the total demand for low-sulfur DMA. The first approach was based upon information provided by the respondents to this study’s ocean carrier survey. It was assumed that the frequency with which bunkering ports were mentioned represents the regional fuel demand distribution. The limitation of this approach is that while the frequency of bunkering ports reported by ocean carriers is known, the number of actual fueling events at a particular bunkering port is not. The second approach was based upon a compilation of OGV vessel calls to and from the San Pedro Bay ports that was prepared for the 2005 Port-wide Emission Inventory. Similarly, it was assumed that the vessel calls to and from San Pedro Bay represents the regional fuel demand distribution. The limitation of this approach is that it is not known which of the originating ports were bunkering ports. Each of the two regional demand estimates was compared with each of the three supply estimates for each of the four implementation scenarios (lease-based in 2008, lease-based in 2009, all vessels within the breakwaters and all vessel operations out to 40 nautical miles from Point Fermin). The main conclusions of this report’s surveys and availability analyses are as follows:
• Regional supply is likely to be sufficient to meet the demand for low-sulfur DMA in 2008 and 2009 if OGV3 and OGV4 are implemented through lease conditions. This conclusion pertains to all regions if the analysis is based on the supply estimated from the DNVPS stem data. For supply estimates based upon reported sales or capacity, the data are insufficient to make this conclusion for Australia & South Pacific, Korea, Singapore, Asia-Others, Europe, and North America-Others., Supplementary information (i.e. data not obtained through this study’s surveys) indicates, however, that supplies may be adequate even in the regions for which sufficient survey results were not obtained;
• If OGV3 and OGV4 are implemented immediately for all vessels operating within the
breakwaters, and the supply estimate is based upon the DNVPS stem data, then most Asian ports and Central and South American ports will have difficulty meeting the demand, and there will be moderate short supply in North America-West Coast;
• If OGV3 and OGV4 are implemented immediately for all vessels operating up to 40
nautical miles from Point Fermin, then obtaining low-sulfur DMA could be a problem in

v
China, Japan, Korea, Central & South America, and North America-West Coast in 2008 and 2009;
• The uncertainty in availability of low-sulfur DMA in a region, or even an actual
deficiency, could be mitigated if OGVs obtain most of their fuel at POLA and/or POLB. Several respondents to the ocean carrier survey reported that they do or could maintain sufficient low-sulfur DMA on board their vessels to have a sufficient supply for their approaches, berthing, and departures from POLA and/or POLB. When they refuel, they do it at the San Pedro Bay Ports; and
• The median reported price difference between low-sulfur DMA and IFO 180 and IFO 380
is $377.50 and $395.00 per tonne respectively. Most ocean carriers have a dedicated department handling the bunkering business for ships in their fleets. They constantly monitor the bunker fuel spot market for fuel availability, quality, and price. In most cases, ocean carriers will purchase fuel in advance when the fuel price is favorable. Therefore, even though there are indications that several bunkering ports might have a significantly short supply of low-sulfur DMA, the ocean carriers should be able to plan and schedule their routes in advance so their vessels can be refueled at certain ports to maintain sufficient quantities of low-sulfur DMA prior to arriving at the San Pedro Bay ports. The demand for low-sulfur DMA will increase as more leases are renewed and more OGVs are subject to OGV3 and OGV4 requirements. The Starcrest report estimated that “worst-case” incremental demand would be 26,620 tonnes in 2010 and 39,785 tonnes in 2011. It was beyond the scope of this study to forecast availability beyond 2009. Nevertheless, it is reasonable to expect that bunker fuel producers will increase their supply to keep up with demand. Finally, current, future, and proposed low-sulfur fuel regulations at all levels of government, domestic and international, may create competition for the low-sulfur DMA needed to implement OGV3 and OGV4. In territorial waters of the European Union, the sulfur content of MGO is limited to 0.1%; in 2010 this limit will apply to ships in inland waters and at berth in ports. Currently before the U.S. Congress is the “Marine Vessel Emissions and Reduction Act of 2007” (H.R. 2548 and S. 1499), which would require all vessels (domestic and foreign) to burn fuel with a sulfur content ≤ 0.1% within 200 nautical miles of the U.S. coast as of December 31, 2010. If fuel with 0.1% sulfur is unavailable at that time, then the interim limit will be ≤ 0.2% sulfur. An ARB regulation currently requires OGVs operating within 24 nautical miles of the coastline to use MDO or MGO with a sulfur content ≤ 0.5% in their auxiliary engines. On January 1, 2010, the sulfur limit drops to 0.1%. The U.S. Ninth Circuit Court of Appeals recently upheld a permanent injunction against enforcement of this regulation, but the State of California is continuing to enforce it pending an appeal to the U.S. Supreme Court; its future is uncertain. A similar regulation covering OGV main engines is under development and, given the outcome of the auxiliary engine fuel case, its future also is uncertain.

1
1.0 INTRODUCTION
1.1 Purpose of the Fuel Availability Study In November 2006, the Ports of Long Beach and Los Angeles jointly adopted the landmark San Pedro Bay Ports Clean Air Action Plan,4 known as the “CAAP.” The CAAP outlines the ports’ five-year goals and strategies for reducing air pollutant emissions from ocean going vessels (OGVs), harbor craft, cargo handling equipment, railroad locomotives, and on-road heavy-duty vehicles. Some of its control measures are more stringent than those adopted by the California Air Resources Board (ARB), while others implement regulatory control measures on an accelerated schedule. This study focused on two CAAP measures: OGV3 (OGV Auxiliary Engine Fuel Standards) and OGV4 (OGV Main Engine Fuel Standards). Both measures require OGVs to burn distillate fuel having a mass-to-mass sulfur content ≤ (less than or equal to) 0.2% when they are transiting within 20 to 40 nautical miles of Point Fermin, maneuvering through the harbors, and at berth. For this study, Tetra Tech, Inc. (Tetra Tech) and its subcontractor UltraSystems Environmental Incorporated (UltraSystems) were tasked with examining if enough low-sulfur distillate fuel5 will be available for the vessels that will need it at the major bunkering ports used by vessels calling at the Ports of Long Beach and Los Angeles. 1.2 Other Fuel Availability Investigations A similar examination was conducted in a 2005 study for the Port of Los Angeles (POLA), Evaluation of Low Sulfur Marine Fuel Availability – Pacific Rim,6 although not with reference to the CAAP. The 2005 study focused on the availability of low-sulfur distillate fuel for containerships and was based primarily upon literature reviews and evaluation of economic data. Among the findings in 2005 were the following:
• Low-sulfur marine distillate was available upon request at some ports but usually in limited volumes because worldwide shipping demand for those fuels was low;
• Marine distillate fuel with a sulfur content ≤ 0.2% was readily available only in Europe;
and
4 Final 2006 San Pedro Bay Ports Clean Air Action Plan. Technical Report. Prepared by the Port of Los
Angeles and the Port of Long Beach, California with the participation and cooperation of the U.S. Environmental Protection Agency, the California Air Resources Board, and the South Coast Air Quality Management District (November 2006).
5 In this report “low-sulfur distillate fuel” will always mean marine gas oil (MGO) designated as “DMA” by ISO 8217 and having a sulfur content ≤ 0.2% by mass; see Section 2.1.2.
6 Evaluation of Low Sulfur Marine Fuel Availability – Pacific Rim. Prepared by Starcrest Consulting Group, LLC, Poulsbo, Washington, for the Port of Los Angeles, ADPO #030507-513 (July 2005).

2
• In several areas, including some major ports in Asia, low-sulfur distillate oil was simply not available.
In developing a new regulation limiting the sulfur content of fuel used by OGV main (propulsion) engines, the California Air Resources Board (ARB) currently is conducting a survey of fuel suppliers. The results of that survey were unavailable at the time this report was written. 1.3 Current Study Approach This study relies to the greatest extent possible on information obtained directly from ocean carriers and bunker suppliers at ports where OGVs take on fuel before coming to the Port of Los Angeles (POLA) and Port of Long Beach (POLB). It also includes a statistical analysis of more than 4,700 fuel samples that were analyzed for sulfur content at 25 major ports worldwide. This direct information was supplemented by a review of current bunkering business news and discussions with several major petroleum refining companies who produce marine fuels. At the Ports’ request, fuel availability was quantitatively evaluated in detail for 2008 and 2009. Availability in later years was examined more qualitatively. Note that this study solely focuses on evaluating low-sulfur marine fuel quality and availability. This particular analysis does not consider infrastructural limitations such as potential cross-contamination during the storage, transfer, and delivery of fuel, which ultimately can affect the composition of fuel sulfur content and therefore the availability of the low-sulfur fuel. Future low-sulfur marine fuel availability studies should also include evaluations of dedicated storage and delivery equipment for low-sulfur marine fuel. 1.4 Outline of the Report Section 2 provides background information, including definitions of fuel types, and a summary of International, Federal, State and Local regulations that may affect the demand for and availability of low-sulfur distillate fuels. Section 3 summarizes the results of a 2007 estimate by Starcrest Consulting Group, LLC of the demand for low-sulfur distillate fuel. The survey approach is described in Section 4. The section also identifies the ports where OGVs obtain fuel before sailing to POLA and POLB. Section 5 presents the results of the surveys, including an estimate of low-sulfur DMA sales in 2006 and 2007, and the potential supply of that fuel by region. Estimated demand and supply are examined in Section 6. The reported price differentials between low-sulfur DMA and residual fuels and between low-sulfur DMA and higher-sulfur DMA are presented and discussed in Section 7. Finally, the study’s conclusions are presented in Section 8. The appendices to this report include the survey questions used for soliciting information from ocean carriers, bunker supplies and refineries, as well as the fuel consumption study conducted by Starcrest Consulting Group, LLC.

3
2.0 BACKGROUND
2.1 General Information on Bunkering In this report, “bunkering” refers to the loading of fuel onto OGVs, whether for use in main (propulsion) engines or for on-board auxiliary engines. Although the term “bunker” is sometimes used to describe particular classes of residual oils, in this report it is a general reference to all marine fuels. 2.1.1 Major Fuel Types The main types of marine fuels are as follows:
Residual Oil (RO) is the heaviest fraction of the distillation of crude oil. Because of its high viscosity, heating is necessary for the fuel to flow properly. It tends to have high concentrations of pollutants, including sulfur, and produces dark smoke when burned. It is also the cheapest liquid fuel on the market.
Marine Gas Oil (MGO) is pure distillate oil and has the lowest sulfur content.
Intermediate Fuel Oil (IFO) 180 is a mix of 98 percent of residual oil and 2 percent of distillate oil.
IFO 380 is a mix of 88 percent of residual oil and 12 percent of distillate oil. Because of its higher distillate oil content, IFO 380 is more expensive than IFO 180.
MDO (Marine Diesel Oil) consists of distillate oil with a trace of residual oil. MDO has a lower sulfur content than residual oil, IFO 180, and IFO 380 but has a higher sulfur content than MGO.
2.1.2 Distillate Fuels This study focuses on MGO because CAAP measures OGV3 and OGV4 specify MGO or distillate oil. This report also refers frequently to this fuel as “DMA.” The European Commission defines DMA as any marine fuel that has a viscosity or density falling within the ranges of viscosity or density defined for DMX and DMA grades in Table I of ISO 8217.7 DMX fuel is used primarily for life-boats, not for a ship’s engines (due to its low flashpoint).8 Table 2-1 of this report summarizes the properties of DMA and other distillate fuels per ISO 8217. In this report,
7 “Directive 2005/33/EC Of The European Parliament and of the Council of 6 July 2005 amending Directive
1999/32/EC as Regards the Sulphur Content of Marine Fuels.” Official Journal of the European Union (July 22, 2005).
8 Email from Hauk Wahl, DNV Petroleum Services, Houston, Texas, to Michael Rogozen, UltraSystems Environmental Incorporated, Irvine, California (October 17, 2007).

4
the term “distillate fuel,” is used interchangeably with “MGO” and “DMA,” and “low-sulfur DMA” is defined as marine distillate fuel with a sulfur content ≤ 0.2% by weight (wt).
Table 2-1 DEFINITION OF DISTILLATE FUELS PER ISO 8217 (2005)
Parameter Unit Limit DMX DMA DMB DMC
Density at 15 °C kg/m³ Max - 890 900 920 Viscosity at 40 ° C mm²/s Max 5.5 6 11 14 Viscosity at 40 °C mm²/s Min 1.4 1.5 - - Micro Carbon Residue at 10% Residue % m/m Max 0.3 0.3 - - Micro Carbon Residue % m/m Max - - 0.3 2.5 Water % V/V Max - - 0.3 0.3
Sulfur a % (m/m) Max 1 1.5 2 2 Total Sediment Existent % m/m Max - - 0.1 0.1 Ash % m/m Max 0.01 0.01 0.01 0.05 Vanadium mg/kg Max - - - 100 Aluminum + Silicon mg/kg Max - - - 25 Flashpoint °C Min 43 60 60 60 Pour point, Summer °C Max - 0 6 6 Pour point, Winter °C Max - -6 0 0 Cloud point °C Max -16 - - - Calculated Cetane Index Min 45 40 35 - Appearance Clear & Bright - - Zinc b mg/kg Max - - 15 Phosphorus b mg/kg Max - - 15 Calcium b mg/kg Max - - 30
Notes
a A sulfur limit of 1.5% m/m will apply in SOx Emission Control Areas designated by the International Maritime Organization, when its relevant Protocol comes into force. There may be local variations. The Fuel shall be free of used lubricating oil (ULO).
b A Fuel is considered to be free of ULO if one or more of the elements are below the limits. All three elements shall exceed the limits before deemed to contain ULO.
The other two grades of distillate oil shown in Table 2-1, DMB and DMC, are similar to DMA but have higher sulfur contents and higher viscosity. They are often referred to as MDO.

5
2.1.3 Other Definitions for this Study A stem is a parcel of crude or product made available by a supplier. When a delivery is made by the supplier, the contract document has a "stem confirmation" to ensure that the delivery amount is accurate and is agreed upon by both parties. In this report, “stem” generally means the amount of fuel delivered to a ship in the course of one ship loading at one port. The term x-pipe, as a mode for fuel delivery, is defined as direct loading from fuel storage, as opposed to delivery through an intermediate medium such as a barge. 2.2 International, Federal, California, and Other State Regulatory Activity This section summarizes the regulatory setting for use of marine fuels by OGVs. CAAP measures OGV3 and OGV4 are the main focus for this study. Fuel-content requirements of other jurisdictions (especially ARB regulations that will become effective in about 2010), however, will also generate a demand for low-sulfur DMA. Therefore, being cognizant of the regulatory-driven competition for low-sulfur fuel is important. 2.2.1 International MARPOL The most important international convention regulating and preventing marine pollution by ships is the International Maritime Organization’s (IMO) 1973 “International Convention for the Prevention of Pollution from Ships,” as modified by the Protocol of 1978 relating thereto (MARPOL 73/78). It covers accidental and operational oil pollution as well as pollution by chemicals, goods in packaged form, sewage, garbage and air pollution.9 In 1997, the IMO adopted “Annex VI - Regulations for the Prevention of Air Pollution from Ships,” which is commonly known as “MARPOL Annex VI.” The rules in MARPOL Annex VI, which went into effect in 2005, limit sulfur oxide and nitrogen oxide emissions from ship exhaust and prohibit deliberate emissions of ozone depleting substances.10 MARPOL Annex VI also set a global cap of 4.5% m/m11 on the sulfur content of fuel oil and called on the IMO to monitor the worldwide average sulfur content of fuel once the Protocol came into force. Annex VI contains provisions allowing for special "SOx Emission Control Areas" (SECAs) to be established. In these areas, the sulfur content of marine fuel oil must not exceed 1.5%. As an alternative, ships may use an exhaust gas cleaning system or other technological method to limit SOx emissions to what they would be if the fuel had 1.5% sulfur. As of this writing, SECAs have been established for the Baltic Sea and the North Sea. The ARB has been designated as the lead
9 International Maritime Organization (www.imo.org). 10 “International Convention for the Prevention of Pollution from Ships, 1973, as modified by the Protocol of 1978
relating thereto (MARPOL 73/78),” International Maritime Organization (www.imo.org). 11 The initials “m/m” mean “mass-to-mass” or “by mass” to describe the concentration of a substance in a mixture
or solution.

6
agency for establishing a SECA for the Pacific Coast. Technical studies to support an application are underway.12 United States Proposal to IMO The U.S. has submitted a formal proposal to the IMO to adopt uniform emissions-based standards that would apply within 200 nautical miles of any coastline in the world.13 Ocean carriers could burn low-sulfur distillate oil, use exhaust gas emission control technology, or use a combination of approaches. The distillate fuel sulfur content whose use would achieve the desired emission limit would be 0.1%. The proposal is under review. European Union European Council Directive 93/12/EEC limited the sulfur content of marine gas oil used in member territories to 0.2% as of October 1, 1994.14 Directive 99/32/EC further reduced the limit to 0.1%, effective January 1, 2008. Finally, Directive 2005/33/EC requires that from January 1, 2010 all inland waterway vessels and ships berthing any community ports must not use marine fuels with a sulfur content exceeding 0.1% per mass.15 2.2.2 U.S. Environmental Protection Agency The U.S. Environmental Protection Agency (USEPA) currently regulates emissions from new “Category 3” marine diesel engines, which have a displacement > (greater than or equal to) 30 liters per cylinder. The regulation also covers “Category 1” and “Category 2” marine engines, which have a displacement between 2.5 and 30 liters per cylinder. Category 3 engines are used for propulsion on OGVs, while Category 1 and 2 engines are used for propulsion on smaller vessels and for auxiliary electrical power generation on many types of vessels. The regulation applies only to vessels flagged or registered in the United States (U.S.).16 The NOx emission standards are equivalent to those of MARPOL Annex VI. The 2003 USEPA regulation does not cover particulate emissions and does not include limitations on fuel sulfur.17 In 2004, the USEPA issued an advance notice of proposed rulemaking to control air pollutant emissions from new locomotive and marine compression-ignition engines with < (less than) 30
12 “SOx Emission Control Area (SECA).” California Air Resources Board. (www.arb.ca.gov/research/seca/seca.htm (June 20, 2007). 13 “Review of MARPOL Annex VI and the NOx Technical Code. Development of Standards for NOx, PM and SOx.”
Submitted by the United States to the International Maritime Organization, Sub-Committee on Bulk Liquids and Gases, 11th Session, Agenda Item 5 (February 9, 2007).
14 “Council Directive 93/12/EEC of 23 March 1993 Relating to the Sulphur Content of Certain Liquid Fuels.” Official Journal of the European Union (March 23, 1993), pp. 81-83.
15 “Directive 2005/33/EC Of The European Parliament and of the Council of 6 July 2005 amending Directive 1999/32/EC as Regards the Sulphur Content of Marine Fuels.” Official Journal of the European Union (July 22, 2005).
16 “Regulatory Announcement. Emission Standards Adopted for New Marine Diesel Engines.” U.S. Environmental Protection Agency, Office of Transportation and Air Quality, EPA420-F-03-001 (January 2003).
17 Final Support Document: Control of Emissions from New Marine Compression-Ignition Engines at or Above 30 Liters per Cylinder. U.S. Environmental Protection Agency, Office of Air and Radiation, EPA420-R-03-004 (January 2003).

7
liters per cylinder.18 In the notice, the USEPA mentioned the likelihood of limits on the sulfur content of the fuels used in these engines. This likelihood became definite in the latest evolution of the proposed rulemaking, which was issued in April 2007.19 The USEPA is proposing near-term emission standards, referred to as Tier 3 standards, for newly-built marine engines. These standards would reflect the application of technologies to reduce engine-out PM and NOx emissions and would phase-in starting in 2009. The USEPA also is proposing long-term emissions standards, referred to as Tier 4, for newly-built locomotives and marine diesel engines. These standards are based on the application of exhaust cleanup technology that requires fuel having a sulfur content < 15 parts per million (0.0015%). They would phase in for marine diesel engines beginning in 2014. The regulation assumes that these extremely low-sulfur fuels would be available by 2012, as required by the 2004 non-road engine rule. Finally, two companion bills (H.R. 2548 and S. 1499), each called the “Marine Vessel Emissions Reduction Act of 2007,” were introduced in Congress in May 2007. Both domestic- and foreign-flagged OGVs entering and leaving U.S. ports would be required to burn fuel with a sulfur content < 0.1% within 200 nautical miles of the coast. The limit would become effective December 31, 2010, unless the USEPA determines that it is not feasible. If the USEPA determines that the 0.1% limit is not feasible, it must set an interim limit of 0.2% until the 0.1% limit can be put into practice. At the time this report was completed, the bills have been referred to committee, with no further action. 2.2.3 California Air Resources Board (ARB) Auxiliary Engine Rule (Adopted) In December 2006, the ARB adopted regulations limiting the sulfur content of fuel used in auxiliary engines of OGVs operating within 24 nautical miles of the coastline.20,21 Since January 1, 2007, OGV auxiliary engines have been required to use MDO or MGO with a sulfur content ≤ 0.5%. A higher-sulfur fuel may be used if emissions control equipment also is used. The control equipment must reduce emissions to the level that would have been achieved with use of the low-sulfur fuel. Beginning January 1, 2010, the sulfur limit drops to 0.1%. In 2010, the statewide requirement would preempt the requirements of the CAAP.22 (See Section 2.3.2.)
18 U.S. Environmental Protection Agency, “Advance Notice of Proposed Rulemaking: Control of Emissions of Air
Pollution from New Locomotive Engines and New Marine Compression-Ignition Engines Less Than 30 Liters per Cylinder.” 69 F.R. 39275-39289 (June 29, 2004).
19 U.S. Environmental Protection Agency. “Proposed Rule. Control of Emissions of Air Pollution From Locomotive Engines and Marine Compression-Ignition Engines Less Than 30 Liters per Cylinder.” 72 F.R. 15937-1651 (April 3, 2007).
20 “Final Regulation Order. Emission Limits and Requirements for Auxiliary Diesel Engines and Diesel-Electric Engines Operated on Ocean-Going Vessels Within California Waters and 24 Nautical Miles of the California Baseline,” California Air Resources Board, Sacramento, California (December 6, 2006).
21 “Final Regulation Order. Airborne Toxic Control Measure for Auxiliary Diesel Engines and Diesel-Electric Engines Operated on Ocean-Going Vessels Within California Waters and 24 Nautical Miles of the California Baseline,” California Air Resources Board, Sacramento, California (December 6, 2006).
22 Personal communication from Heather Tomley, Port of Long Beach, California, to Michael Rogozen, UltraSystems Environmental Incorporated, Irvine, California (January 24, 2008).

8
Immediately after the regulations were adopted, the Pacific Merchant Shipping Association sought an injunction in Federal court, claiming that the regulations are preempted by Federal law and/or are unconstitutional. On August 30, 2007, a federal district court issued a permanent injunction against enforcing the regulations, unless and until the USEPA granted the State authorization.23 Nevertheless, the ARB filed an appeal with the Federal Ninth Circuit Court of Appeals and requested a stay of the injunction pending the outcome of the appeal.24 The stay was granted on October 23, 2007, and the regulations were temporarily enforced. A hearing before the Ninth Circuit Court was held on February 12, 2008.25 On February 27, 2008 the Ninth Circuit Court ruled that the auxiliary engine fuel regulation is preempted by federal law and will require USEPA’s authorization.26 ARB is continuing to enforce the regulation pending an appeal to the Supreme Court.27 Propulsion Engine Rule (Proposed) The ARB is currently developing a rule that would limit the sulfur content of fuel used in OGV main engines and auxiliary boilers.28 The limits would be phased in as follows:
(1) Beginning July 1, 2009, use MGO with ≤ 1.5% sulfur or MDO having a sulfur content < 0.5%; and
(2) Beginning January 1, 2012, use MGO or MDO having a sulfur content < 0.1 to 0.2%.
This regulation would not apply to boilers for steamship propulsion and currently is expected to be brought before the ARB Board for consideration in April 2008. 2.2.4 Other States Fuel oil regulations in other states were reviewed because their implementation could result in competition with San Pedro Bay-bound OGVs for low-sulfur fuel. 23 Pacific Merchant Shipping Association v. Thomas A. Cackette, No. Viv S-06-2791-WBS-KJM (August 30,
2007). 24 “ARB to Resume Enforcement of the Ocean-Going Vessel Auxiliary Diesel Engine Regulation.” California Air
Resources Board, Sacramento, California (http://www.arb.ca.gov/ports/marinevess/documents/auxenforce102407.pdf) (October 24, 2007).
25 Personal communication from Paul Milkey, Staff Air Pollution Specialist, California Air Resources Board, Sacramento, California to Michael Rogozen, UltraSystems Environmental Incorporated, Irvine, California (January 30, 2008).
26 Los Angeles Times, “Court Rejects California Limits on Ship Emissions.” (February 28, 2008). 27 “California to Continue Enforcement of the Ocean-Going Vessel Auxiliary Diesel Engine Regulation.”
California Air Resources Board, Sacramento California, (http://www.arb.ca.gov/ports/marinevess/documents/auxenforce031008.pdf) (March 10, 2008).
28 “Proposed Regulation. Fuel Sulfur and Other In-Use Operational Requirements for Main Propulsion Diesel Engines and Auxiliary Boilers Operated on Ocean-Going Vessels Within California Waters and 24 Nautical Miles of the California Baseline.” California Air Resources Board, Sacramento, California. (http://www.arb.ca.gov/ports/marinevess/documents/030508/030508draftreg.pdf). (March 5, 2008).

9
Northwest Ports Clean Air Strategy The Northwest Ports Clean Air Strategy (Strategy), adopted in January 2008, is an effort to reduce port-related emissions in the Pacific Northwest.29 Participating ports include Seattle and Tacoma in Washington State and the Vancouver Port Authority30 in British Columbia, Canada. By 2010, all vessels calling in the Pacific Northwest will be required to use distillate fuels with a maximum sulfur content of 0.5% for all idling auxiliary engine operations. These vessels will be required to use fuel with a maximum sulfur content of 1.5% in all hotelling main engine operations. By 2015, all ships will need to comply with the IMO fuel requirements that are in force at that time. As discussed in Section 2.2.1, the U.S. has proposed to the IMO that distillate fuel with 0.1% sulfur content be required. Hawaii A bill currently before the State of Hawaii House of Representatives would prohibit cruise ships from burning “bunker fuel oil” with a sulfur content greater than 0.1% within a half-mile radius of Nawiliwili Harbor (Island of Kauai).31,32 The term “bunker fuel oil” is defined loosely enough in the bill to encompass MDA. The bill would take effect December 31, 2008. A similar bill in the Hawaii Senate would take effect on December 31, 2010.33 2.3 San Pedro Bay Ports’ Clean Air Action Plan As stated earlier in this report, the San Pedro Bay Ports Clean Air Action Plan (CAAP) includes two measures that limit the sulfur content of fuel consumed by OGVs: OGV3 (OGV Auxiliary Engine Fuel Standards) and OGV4 (OGV Main Engine Fuel Standards). These measures will be implemented through requirements in new and renewed leases, tariff changes, and mitigation measures in negative declarations and environmental impact reports under the California Environmental Quality Act (CEQA). CAAP measures OGV3 and OGV4 are described below. 2.3.1 OGV3 (OGV Auxiliary Engine Fuel Standards) This measure seeks to reduce particulate emissions by requiring the use of low-sulfur distillate fuels in the auxiliary engines of OGVs within 20 nautical miles of Point Fermin and while at berth. The low-sulfur fuel requirement would be extended to 40 nautical miles when vessel tracking issues are resolved. The specified sulfur limit is ≤ 0.2% by weight. This measure would
29 Northwest Ports Clean Air Strategy. Port of Seattle, Port of Tacoma, Vancouver Port Authority (December
2007). 30 The Vancouver Port Authority, Fraser River Port Authority and the North Fraser Port Authority are expected to
merge into one entity, the Vancouver Fraser Port Authority, in 2008. 31 “A Bill for an Act Relating to Air Pollution Control.” State of Hawaii, House of Representatives, 24th
Legislature, H.B. No. 2919 (www.capital.hawaii.gov/session2008/Bills/HB2919_.htm). 32 H.B. 2919 was recently amended to be effective only when the cruise ships are at berth and to increase the sulfur
limit to 0.5%. (http://www.savekauai.org/state/amendments-made-cruise-ship/air-pollution-bill). Accessed February 16, 2008.
33 “Hawaiian Move to Ban Residual Fuel Close to Port,” Hellenic Shipping News (January 29, 2008). (Available at www.hellenicshippingnews.com).

10
be implemented through terminal lease conditions, with consideration of implementation via immediate all vessel requirement. 2.3.2 OGV4 (OGV Main Engine Fuel Standards) This measure seeks to reduce particulate emissions by requiring the use of low-sulfur distillate fuels in the main propulsion engines of OGVs during arrivals to and departures from the San Pedro Bay ports. It applies to OGV operations within 20 nautical miles of Point Fermin initially, with an extension out to 40 nautical miles of Point Fermin. This extension is expected in early 2008. The specified sulfur limit is < 0.2% by weight. This measure would be implemented through terminal lease conditions, with consideration of implementation via all vessel requirement option, pending legal review.

11
3.0 FUEL DEMAND ESTIMATE
Starcrest Consulting Group, LLC (Starcrest) estimated the OGV demand for < 0.2% sulfur MGO at the Ports of Long Beach and Los Angeles from 2008 to 2011, assuming phased implementation of OGV3 and OGV4. This section summarizes Starcrest’s findings. Please refer to the Starcrest report (Appendix D) for detailed information on assumptions and results.34 The fuel consumption estimates are based on OGV activities as described in the 2005 air emissions inventories for the two San Pedro Bay ports. The study evaluated fuel demand to 40 nautical miles under a few different implementation scenarios, including an assumption of immediate participation by all vessels or participation based upon phase-in through terminal lease schedules. Fuel consumption was calculated for five discrete geographic study areas, which are shown in Table 3-1. The three main geographical areas were Precautionary Zone (PZ) to 40 nautical miles from Point Fermin, the Precautionary Zone, and Within Breakwater. “Within Breakwater” was further divided into harbor maneuvering, at berth and anchorage hotelling areas.
Table 3-1 ENGINE TYPES ACTIVE IN GEOGRAPHIC AREAS ANALYZED
Geographical Area Main Auxiliary Boiler
PZ to 40 nm from Pt. Fermin Precautionary Zone (PZ)
Harbor Maneuvering Hotelling - Berth Within Breakwater Hotelling - Anchorage
Source: Starcrest Consulting Group, LLC.
The first step was to identify the engine types that were active in each of the five geographic areas. The next step was to determine fuel consumption rates for each combination of geographic area, engine type, and fuel (“residual” or “distillate”). These specific fuel consumption rates (in grams per kilowatt-hour) for each engine type were obtained from an Entec report prepared for the European Commission.35 For the main engines, the fuel consumption rates vary with vessel speed. Two speed scenarios, sea speed and average speed, were analyzed. First, fuel consumption was estimated at sea speeds in the 20 to 40 nautical mile zone; however, this may overestimate fuel consumption since vessels reduce their speed as they approach the 20 nautical mile point. The second scenario used actual average speed using data recorded by the Marine Exchange in early 2001, prior to implementing the vessel speed reduction (VSR) program.
34 San Pedro Bay Ports 2005 OGV Fuel Consumption Estimates. Prepared by Starcrest Consulting Group, LLC,
Poulsbo, Washington, for the Port of Long Beach and the Port of Los Angeles (January 2008). 35 Quantification of Emissions from Ships Associated with Ship Movements between Ports in the European
Community, Final Report. Prepared by Entec for the European Commission (July 2002); cited by Starcrest (2008).

12
In addition to fuel consumption rates, it is necessary to know the number of vessel calls in and out of the ports, the population of engines by power rating, and the time in each operational mode. This information is not presented in the report but presumably was used in developing the energy requirements (in kilowatt-hours) and subsequently the fuel use.
The analysis also took into account fuel consumption at federal anchorages, which are located offshore in fixed locations and, with few exceptions, not within port boundaries. When at anchorage, the main engines are turned off, but the auxiliaries keep running, similar to hotelling at dockside.
Table 3-2 summarizes the report’s estimates of marine fuel consumption for the Ports of Long Beach and Los Angeles in 2005, including fuel consumption breakdowns for within harbor maneuvering, at-berth, and anchorage with an explanation that fuel consumption in the various zones was conducted to show engine and boiler consumption rates under operations in the different areas.
Table 3-2 ESTIMATED FUEL CONSUMPTION BY OCEAN-GOING VESSELS
VISITING SAN PEDRO BAY PORTS IN 2005 WITHIN 40 NAUTICAL MILES OF POINT FERMIN
(Consumption in Tonnes36)
Main Engines Auxiliary Engines Total Port Sea
Speed Average Speed
Sea Speed
Average Speed
BoilersMaximum Minimum
Los Angeles 36,804 30,042 44,830 45,482 27,974 109,608 103,496
Long Beach 39,464 33,765 50,445 50,863 33,823 123,732 118,451
Anchorages 3,592 3,406 2,712 2,718 1,661 7,965 7,785 Totals 79,859 67,212 97,987 99,062 63,458 241,306 229,734 Source: Based upon Table 12 of the Starcrest Report (2008).
The report also estimated fuel consumption in 2006 assuming only sea speed for main engines. This analysis was conducted to determine if changes in the make-up of the vessel fleet and port growth from 2005 to 2006 resulted in significantly increased fuel consumption rates. Although fuel consumption between the precautionary zone and 20 nautical miles from Point Fermin decreased, there was an overall increase in consumption. The decrease in the 20 nautical mile point to the precautionary zone may be caused largely by implementing more extensively the VSR program, while the overall increase may be due to an increase in vessel calls and a shift to larger vessels. The 2005 and 2006 consumption values (considering sea speed only) were 241,306 and 251,647 tonnes, respectively; these values represent an increase of about 4 percent.
36 1 tonne or metric ton equals 2,205 pounds (lbs).
13
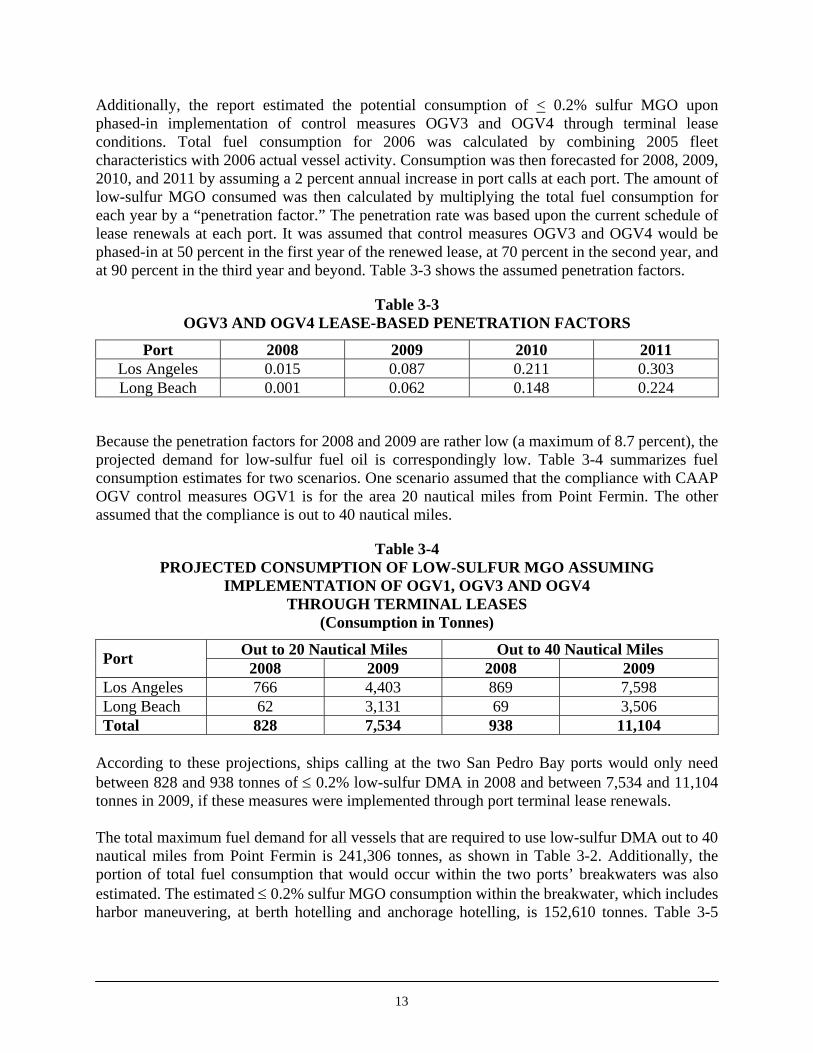
Additionally, the report estimated the potential consumption of < 0.2% sulfur MGO upon phased-in implementation of control measures OGV3 and OGV4 through terminal lease conditions. Total fuel consumption for 2006 was calculated by combining 2005 fleet characteristics with 2006 actual vessel activity. Consumption was then forecasted for 2008, 2009, 2010, and 2011 by assuming a 2 percent annual increase in port calls at each port. The amount of low-sulfur MGO consumed was then calculated by multiplying the total fuel consumption for each year by a “penetration factor.” The penetration rate was based upon the current schedule of lease renewals at each port. It was assumed that control measures OGV3 and OGV4 would be phased-in at 50 percent in the first year of the renewed lease, at 70 percent in the second year, and at 90 percent in the third year and beyond. Table 3-3 shows the assumed penetration factors.
Table 3-3 OGV3 AND OGV4 LEASE-BASED PENETRATION FACTORS
Port 2008 2009 2010 2011 Los Angeles 0.015 0.087 0.211 0.303 Long Beach 0.001 0.062 0.148 0.224
Because the penetration factors for 2008 and 2009 are rather low (a maximum of 8.7 percent), the projected demand for low-sulfur fuel oil is correspondingly low. Table 3-4 summarizes fuel consumption estimates for two scenarios. One scenario assumed that the compliance with CAAP OGV control measures OGV1 is for the area 20 nautical miles from Point Fermin. The other assumed that the compliance is out to 40 nautical miles.
Table 3-4 PROJECTED CONSUMPTION OF LOW-SULFUR MGO ASSUMING
IMPLEMENTATION OF OGV1, OGV3 AND OGV4 THROUGH TERMINAL LEASES
(Consumption in Tonnes)
Out to 20 Nautical Miles Out to 40 Nautical Miles Port 2008 2009 2008 2009 Los Angeles 766 4,403 869 7,598 Long Beach 62 3,131 69 3,506 Total 828 7,534 938 11,104
According to these projections, ships calling at the two San Pedro Bay ports would only need between 828 and 938 tonnes of ≤ 0.2% low-sulfur DMA in 2008 and between 7,534 and 11,104 tonnes in 2009, if these measures were implemented through port terminal lease renewals. The total maximum fuel demand for all vessels that are required to use low-sulfur DMA out to 40 nautical miles from Point Fermin is 241,306 tonnes, as shown in Table 3-2. Additionally, the portion of total fuel consumption that would occur within the two ports’ breakwaters was also estimated. The estimated ≤ 0.2% sulfur MGO consumption within the breakwater, which includes harbor maneuvering, at berth hotelling and anchorage hotelling, is 152,610 tonnes. Table 3-5

14
shows the estimated vessel fuel consumption within the breakwater area, by port, engine type, and activity.
Please note the fuel consumption estimate for anchorage hotelling included vessel anchorage both within and outside the breakwater. It is, therefore, a conservative estimate. Furthermore, the dominant fuel demand within the breakwater is at-berth hotelling, representing approximately 83% of total fuel consumption in this zone, which could impose the greatest burden on fuel availability for this area.
TABLE 3-5 FUEL CONSUMPITON FOR 2005 VESSELS WITHIN BREAKWATER
AT SAN PEDRO BAY PORTS
Fuel Consumption, Tonnes Port Engine Type Harbor
Maneuvering Berth
Hotelling Anchorage Hotelling
Total (sea speed)
Main Engine 933 0 0 933Auxiliary Engine 3,708 34,077 1,518 39,303Los Angeles Auxiliary Boiler 765 26,000 1,209 27,974
Subtotal – Los Angeles 5,406 60,077 2,727 68,210Main Engine 984 0 0 984Auxiliary Engine 3,078 36,688 5,761 45,527Long Beach Auxiliary Boiler 694 29,601 3,529 33,824
Subtotal – Long Beach 4,756 66,289 9,289 80,334Total Long Angeles/Long Beach 10,161 126,366 12,017 148,544
Main Engine 10 0 0 10Auxiliary Engine 22 0 2,373 2,395Anchorage Auxiliary Boiler 10 0 1,652 1,662
Total Anchorage 42 0 4,025 4,067Grand Total (LA+LB+Anchorage) 10,203 126,366 16,041 152,610
Source: Based upon Table 12 of the Starcrest Report (2008).

15
4.0 AVAILABILITY INVESTIGATION
4.1 Overall Approach This section summarizes the methods used to obtain information on the availability of low-sulfur DMA fuel. The investigation included a literature review and a set of surveys. This discussion focuses on the latter. The best sources of information on low-sulfur DMA were presumed to be the companies that deliver the fuel to the ships. Ocean carriers were surveyed to identify ports at which San Pedro Bay-bound OGVs take on fuel. 4.2 Identification of Bunkering Ports 4.2.1 Objective The purpose of this portion of the investigation was to identify ports at which OGVs refuel before sailing to the San Pedro Bay ports. It was assumed that at least some of these OGVs would take on fuel at the world’s largest bunker fuel supply centers, including Singapore and Rotterdam. Additional bunkering ports were identified through a survey of ocean carriers. 4.2.2 Ocean Carrier Survey Methods A survey of ocean carriers that call at the Ports of Long Beach and Los Angeles was conducted to identify the names of the ports where ships belonging to the survey sample obtain fuel immediately before sailing to POLA or POLB. A copy of the ocean carriers’ questionnaire is provided in Appendix A. The survey included brief questions on the following topics:
• Decision process for determining where and when OGVs obtain their fuel;
• Factors entering into the decision on which bunkering port(s) to visit;
• Awareness of sources of low-sulfur DMA;
• The need to install dedicated tanks for low-sulfur DMA on board; and
• Quantities of low-sulfur fuel loaded onto a OGV, including maintenance of a reserve supply.
Tetra Tech and Starcrest divided the responsibilities for administering the survey. Tetra Tech surveyed the ocean carriers that call only on POLB terminals, while Starcrest surveyed the ocean carriers that call only on POLA terminals.37 Contact information for the POLB carriers was obtained from the 2007-2008 Port Directory38 and from carrier company web sites. Contact information for the POLA carriers already had been obtained for previous similar studies. Ocean 37 Tetra Tech contacted some of the carriers serving both ports. 38 Delgado, R. (Ed.), 2007-2008 Port Directory. The Port of Long Beach, Trade Relations & Port Operations
Bureau, Trade Relations Division, Marketing Section, Long Beach, California (2007).

16
carriers were contacted by telephone and most were sent emails that included the survey questions as an attachment. For the two Chilean carriers (CSAV and CCNI), the email and survey were translated into Spanish and sent to their headquarters in Chile. Survey status and responses were tracked by a Microsoft Access™ database developed for this project. Table 4-1 consists of 37 ocean carriers who provided information on bunkering ports for vessels that bunkered prior to calling on the POLA and/or POLB. The identified bunkering ports are listed in Table 4-2. Note that several ocean carriers reported only countries or regions where bunkering was conducted instead of specific ports. These locations include: the Caribbean, China, Hawaii, Japan, Korea, New York, the Persian Gulf, and West Africa.
Table 4-1 OCEAN CARRIERS THAT IDENTIFIED BUNKERING PORTS
Alaska Tanker Company Mediterranean Shipping Company Geneva American President Lines/American Ship Management
Mitsui OSK Lines, Ltd. (MOL)
BP Shipping Norwegian Cruise Line Chevron Shipping Company, Ltd. NYK Containers China Shipping North America NYK Cool CMA CGM America Orient Overseas Container Line (OOCL) Compañía Chilena de Navegación Interoceánica (CCNI)
Princess Cruises
COSCO Container Lines Americas Royal Caribbean Cruises CSAV (Compañía Sud Americana de Vapores) (Norasia Liner Services)
Sinotrans Shipping Agency
Eastern Car Liner (Americas) Star Shipping Evergreen Shipping Agency (America) STX Pan Ocean Shipping Hamburg Sud North America, Inc. Toko Kaiun Kaisha. Ltd. Hanjin Shipping Company Ltd. ToyoFuji Shipping Company, Ltd. Hapag-Lloyd (CP Ships) US Lines Horizon Lines Wallenius Wilhelmsen Logistics K-Line America Wan Hai Lines LauritzenCool (USA) Inc. Yang Ming Marine Transport AP Moeller-Maersk Zim America Integrated Shipping Company Matson

17
Table 4-2
BUNKERING PORTS IDENTIFIED BY OCEAN CARRIERS SURVEY Region Country Port Count Percent (%) of Response
Australia Melbourne 1 0.8 French Polynesia Papeete 1 0.8
Shanghai 4 3.3 Yantian 4 3.3 China Hong Kong 13 10.6 Kobe 1 0.8 Nagoya 2 1.6 Osaka 2 1.6 Tahara 1 0.8 Tokyo 3 2.4 Toyohashi 1 0.8 Yokkaichi 1 0.8
Japan
Yokohama 3 2.4 Malaysia Port Klang 1 0.8 Singapore Singapore 5 4.0
Busan 9 7.3 South Korea Gwangyang 1 0.8
Asia
Taiwan Kaohsiung 5 4.0 Jamaica Kingston 1 0.8 Caribbean Netherlands Antilles Curacao 1 0.8 Ecuador Guayaquil 4 3.3 Guatemala Puerto Quetzal 3 2.4
Balboa 3 2.4 Central America
Panama Cristóbal 2 1.6 South America Chile Valparaiso 4 3.3
Belgium Antwerp 1 0.8 Europe The Netherlands Rotterdam 3 2.4 Middle East United Arab Emirates Fujairah 1 0.8
Canada Vancouver 5 4.0 Mexico Manzanillo 1 0.8
Honolulu 7 5.7 Long Beach 3 2.4 Los Angeles 3 2.4 Oakland 5 4.0 New York 2 1.6 Port Angeles 1 0.8 Portland 4 3.3 San Francisco 3 2.4 San Antonio 1 0.8 Savannah 2 1.6 Seattle 4 3.3
North America United States
Tacoma 1 0.8

18
4.3 Bunker Supplier Survey 4.3.1 Identification of Bunker Suppliers The sampling frame39 for the survey consisted of all bunkering companies that provide marine fuel directly to OGVs, excluding fuel brokering companies. In most cases, supplying fuel “directly” meant that the bunker supplier had a terminal or an office at the port and physically delivered the fuel via barges or pipelines. A few companies did not meet this definition exactly but were nevertheless included in the survey. Examples included the following:
• Companies that have a central storage facility where barges are sent to other ports for fuel delivery to OGVs; and
• Companies that deliver fuel to OGVs at specific ports but manage all activities from a headquarters or regional office.
For the second example, if a company had one office but had facilities at three ports, it was counted as three bunker suppliers. An initial list of 415 bunker suppliers was obtained from individual port pages on the Portworld website.40 Because of time limitations, it was not possible to contact all the bunker suppliers. Instead, the survey focused upon the following bunker locations:
• Bunker suppliers at the Ports of Long Beach and Los Angeles;
• Bunker suppliers at known major bunkering ports (Singapore, Rotterdam, etc.);
• Bunker suppliers at ports where the DNV analyses of fuel stems41 had indicated a high percentage of stems with a sulfur content < 0.2%;
• The 20 highest-volume bunker suppliers, as identified by the Port of Singapore42;
• A list of 16 bunker suppliers that have assured the Port of Hong Kong that they comply
fully with MARPOL Annex VI requirements43; and
• Bunker suppliers at other ports identified by the ocean carriers’ survey.
39 A “sampling frame” consists of all companies, persons, etc., who meet criteria for inclusion in a survey. A
“potential sample” consists of those companies, persons, etc., that one tries to include in a survey. Finally, a “sample” consists of those who actually participate in the survey.
40 Directory is at www.portworld.com/directory/. 41 The DNV fuel sulfur data are discussed in Section 5.1.2. 42 http://www.singaporemaritimeportal.com/bi/servlet/BI.BI_supListTop20. 43 “Hong Kong Register of Local Suppliers of Fuel Oil for Ships (as [of] 30 October 2007).”
(http://www.mardep.gov.hk/en/msnote/pdf/oilsupreg.pdf).

19
Names and detailed contact information (job title, telephone and fax numbers, cell phone numbers and email addresses) of bunker suppliers were obtained through the POLB’s subscription to Bunkerworld.com, which is a portal to Portworld.com. The contact data were stored in a Microsoft Access™ database developed for this project. All companies that were not actual bunker suppliers or were out of business were eliminated from the survey. The final survey potential sample consisted of 237 bunkering companies. 4.3.2 Survey Forms and Methods An email containing a list of questions was sent to the contact person at each bunker company and followed by a phone call to explain the survey and request cooperation. A script with a list of questions was prepared as a guide for the phone interview of bunker suppliers. The questions were revised several times during the survey to refine the data requests. A copy of the latest version of the survey is located in Appendix B. The questions were translated into Spanish and Chinese for contacts in Latin America and China respectively. Non-responding bunker suppliers and those who provided insufficient information were called back and/or sent emails requesting further clarification. In addition, in January 2008, bunker suppliers at six U.S. ports were contacted for additional information on minimum and typical stem values. 4.3.3 Bunker Survey Response Table 4-3 summarizes the responses to the bunker supplier survey. Fifty bunker suppliers (21 percent of the potential sample) provided complete or partial information. 44 Of these 50 companies, 35 provided complete information. The response rate by region ranged from about 11 percent in Latin America and the Caribbean to 38 percent in North America. These response rates are considered reasonable for a survey of this type., Note, however that several known major DMA suppliers either declined to participate at all or gave no information on low-sulfur DMA capacity and/or sales information. Therefore, as will be discussed in Section 5, the low-sulfur bunkering data obtained from the survey probably underestimates the actual value. 4.4 Refinery Survey 4.4.1 Objective Petroleum refining is the most important component in the entire marine fuel supply chain. A survey of refinery capacity is critical in assessing marine fuel supply availability, particularly for low-sulfur DMA. This portion of the study focused on existing refineries and their capacities, as well as on future expansion to produce low-sulfur DMA. 44 As will be discussed in Section 5.1.1, 42 of the 50 responding facilities provided at least some useful information
for assessing the availability of low-sulfur DMA. These totals do not include the January 2008 follow-up calls to U.S. bunker suppliers to obtain additional information on stem values.

20
Table 4-3 SUMMARY OF RESPONSE TO BUNKER SUPPLY SURVEY
Responded
Region Contacted Declined
To Responda Complete Partial
Response Rate (%)
North America 45 6 12 5 38 Asia and Oceania 109 20 16 5 19 Europe 44 6 2 5 16 Latin America and the Caribbean 19 3 2 0 11
Middle East 20 2 3 0 15 Totals 237 37 35 15 21
aExplicitly refused to respond. 4.4.2 Identification of Refineries A quick survey of the U.S and international major oil companies was conducted to identify subjects for interviews. The survey’s potential sample consisted of the four oil companies with the highest production in the world. These are, in decreasing order of annual production: British Petroleum (BP), ExxonMobil, Royal Dutch Shell (Shell), and ChevronTexaco. All four companies have refineries both in the U.S. and abroad. 4.4.3 Survey Forms and Methods Emails were sent to the local contact person at each refinery to explain the survey and request his or her cooperation in an upcoming telephone call. Accompanying each email was a list of questions about the refinery’s operational capacity and future plans. Follow-up phone calls were made if an email response was not received within two weeks. The most current version of the refinery survey is in Appendix C. 4.4.4 Refinery Survey Response Concerns about confidentiality and the possibility of releasing sensitive business information, such as sales volumes, production capacities and future expansion plans, the four refineries mentioned above declined to participate in the survey. Therefore, unofficial interviews were conducted with refinery personnel to obtain the refineries’ reaction, such as future expansion or new construction of refinery and/or desulfurization units, to meet the increasing demand for low-sulfur DMA.

21
5.0
AVAILABILITY ASSESSMENT
5.1 General Findings 5.1.1 Bunker Supplier Survey Results Fuel Volumes Responses with at least some useful data were received from 42 marine fuel suppliers. The responses are tallied by region as shown in Table 5-1.45 Because the primary concern of this investigation was to assess DMA supply and supply of low-sulfur DMA in particular, the survey sample is characterized in the table by the fuel types of interest.
Table 5-1 SUMMARY OF SURVEY SAMPLE
Region No. of Useful Responses
No. Who Did Not Supply
DMA
No. Who Supplied DMA
No. Who Supplied
Low-S DMA North America 13 2 11 6 Asia and Oceania 20 0 20 7 Europe 4 2 2 2 Latin America and Caribbean 2 0 2 2
Middle East 3 0 3 2 Totals 42 4 38 19
Of the 19 marine fuel suppliers who supply low-sulfur DMA, only nine provided sales volume data, the other ten fuel suppliers cited confidentiality and declined to respond to the questions in the survey. Table 5-2 summarizes the quantities of DMA and low-sulfur DMA reported, by region. The reported low-sulfur DMA capacity worldwide was 207,500 tonnes per month, or about 2,490,000 tonnes per year. Worldwide reported sales of DMA in 2006 and 2007 through mid-December 46 were 411,000 and 402,200 tonnes respectively. The main reason for the discrepancy between the annual estimate based on reported capacity and the reported sales is that many survey respondents, including some major suppliers, declined to reveal their sales data. In interpreting Table 5-2, please note that none of the survey respondents in Australia/South Pacific, Europe, East Coast of North America, Other Asia, or Singapore provided information on low-sulfur DMA capacity. Additionally, some major Gulf Coast suppliers refused to provide sales data. Bearing that in mind, the largest reported low-sulfur DMA capacity is located on the Gulf
45 To avoid identifying bunker suppliers in locations having few bunker facilities, this report classifies the
responses by broad geographic regions. 46 No attempt was made to extrapolate sales to a full year.

22
Coast and West Coast of North America. The largest reported sales of low-sulfur DMA were in Central and South America and the West Coast of North America.
Table 5-2 QUANTITIES OF DMA AND LOW-SULFUR DMA REPORTED BY SURVEY SAMPLE
(in Tonnes)
Annual Total DMA Sales Reported
Annual Low-Sulfur DMA Sales Reported Region
Maximum Monthly
DMA Supply Capacity
Maximum Monthly
Low-Sulfur DMA
Supply Capacity
2006 2007 2006 2007
Australia/South Pacific No Data Received From Bunker Suppliers
Central and South America
12,000 12,000 144,000 144,000 144,000 144,000
China 23,000 – 24,000 5,500 97,000 97,000 60,000 60,000 Europe No Data Received From Bunker Suppliers Japan 6,000 – 10,000 8,000 100,000 65,000 102,000 60,000 Middle East 20,000 3,000 190,000 200,000 15,000 20,000 North America – East Coast No Data Received From Bunker Suppliers
North America – Gulf Coast
135,141 135,000 1,697 1,697 No Data No Data
North America – West Coast
79,800 44,000 514,380 429,360 90,000 118,200
Other Asia No Data Received From Bunker Suppliers Singapore 27,000 – 28,000 No Data 510,992 294,500 No Data No Data Totals 302,941-308,441 207,500 1,558,069 1,231,557 411,000 402,200
Table 5-3 shows the estimated availability of low-sulfur DMA by region. For most regions, the annual supply capacity was assumed to be 12 times the maximum monthly value. Some bunker suppliers, however, reported annual sales that exceeded 12 times their reported monthly capacities. In those cases, annual capacity was set equal to the highest of reported 2006 and 2007 sales. It appears that at least about 2.5 million tonnes of low-sulfur DMA would be available at the 12 ports from which low-sulfur DMA data were received. An alternative estimate of low-sulfur DMA availability, based on data received from DNV Petroleum Services (DNVPS), is presented in Section 5.1.3.

23
Table 5-3 EXTRAPOLATION OF AVAILABILITY OF LOW-SULFUR DMA
BY REGION (BASED ON SURVEY DATA)
Region Estimated Annual Capacity (Tonnes)
Central and South America 144,000 China 66,000 Japan 102,000 Middle East 36,000 North America - Gulf Coast 1,620,000 North America - West Coast 556,200 Totals 2,524,200
Stem Values Nineteen bunker suppliers in the survey reported minimum and maximum low-sulfur DMA stem values, either that they delivered, or that were known to be typical at their ports. An additional 13 suppliers at U.S. ports provided follow-up values. Because many of the ranges of stem values were quite wide (e.g., 20 to 5,000 tonnes), two metrics were used to characterize the survey results for each region. A conservative estimate was obtained by calculating the geometric means of all the lows and highs. The second estimate was calculated using the arithmetic average for each region. These are shown by region in Table 5-4.
Table 5-4 REPORTED LOW-SULFUR DMA STEM VALUES, BY REGION
Reported Stem Values
(Tonnes) Region Geometric Mean Arithmetic Average
Australia/South Pacific 500 500 Central and South America 423 933 China 622 2,550 Europe 158 1,833 Japan 22 44 North America – Gulf Coast 372 1,760 North America – West Coast 464 1,750
A subsequent review of the survey responses, however, revealed that several of the reported stem values exceeded the physical capacity of most auxiliary engine fuel tanks. It was concluded that the survey respondents who reported these “outliers” may not have clearly understood this survey question when disclosing their low-sulfur DMA delivery volumes. They probably provided total DMA or IFO stem values, which are higher than what should be expected. Upon further research,

24
it was determined that the appropriate range for low-sulfur DMA fuel capacity is 117 to 387 metric tons, as shown in Table 5-5. Therefore, an average of 240 metric tons was used in the supply estimation.
Table 5-5 VESSEL TYPES AND TYPICAL MARINE DIESEL OIL STEM VALUES47
Tankers DWT HFO in m3 HFO in Tonnes MDO in m3 MDO in
Tonnes Panamax 50,000 1,700 1,685 220 198 Aframax 90,000 2,900 2,874 320 288 Suezmax 150,000 3,800 3,766 370 333 VLCC 285,000 7,500 7,433 400 360
Containership 750 TEU 9,000 700 694 130 117 1500 TEU 20,000 2,000 1,982 200 180 Panamax 45,000 5,600 5,550 330 297 Post-Panamax 75,000 7,600 7,532 430 387
Bulk Carrier Handysize 30,000 1,300 1,288 130 117 Panamax 70,000 2,200 2,180 270 243 Capesize 160,000 4,000 3,964 300 270 Delivery Mode Thirty-seven bunker suppliers reported the mode by which they delivered DMA (including low-sulfur DMA) to OGVs. All but two use barges, either exclusively, or as one of two or three options. The other modes reported were Ex-pipeline (“X-pipe”) and trucks. As noted in Section 1.3, a thorough explanation of dedicated storage and delivery equipment was beyond the scope of this study. 5.1.2 Analysis of Fuel Sulfur Content Data On December 20, 2007, DNVPS provided, in electronic form, the sulfur content results for 4,704 DMA fuel analyses at 25 ports, from December 3, 2005 to December 16, 2007.48 Each data record included the name of the country, the name of the port, the date of the stem sample collection, and the sulfur content as a weight percent. The lowest weight percentages were reported as “<0.05.” Therefore, it was assumed that the detection limit of the analyses was
47 Keith Michel and Thomas S. Winslow, "Cargo Ship Bunker Tanks: Designing to Mitigate Oil Spillage",
Presented at the Society of Naval Architects and Marine Engineers, Joint California Sections Meeting, May 14, 1999.
48 Wahl, H. Email communication of sulfur analysis data from DNV Petroleum Services, Houston, Texas, to Eddy Huang, Tetra Tech, Inc., Pasadena, California (December 20, 2007).

25
apparently 0.05% by weight. For each port, the proportion of sulfur content ≤ 0.2% was calculated for each calendar quarter of 2006 and 2007.49
Because the stem values associated with the analyses were not reported (or known) by DNVPS, the DNVPS data alone could not be used to determine the volume of ≤ 0.2% sulfur DMA at any given port. Regardless, the number of low-sulfur DMA analyses was useful in identifying ports that would be likely candidates of low-sulfur DMA sources for San Pedro Bay-bound ships. In addition, they were used with the stem values reported in Table 5-4 to obtain an alternative estimate of fuel sales. (See Section 5.1.3.) Table 5-6 shows the results of the analysis of the DNVPS data. Trends were determined by comparing each quarter of 2006 with the corresponding quarter of 2007. For each port, an increase in fuel sulfur percentage was given a rating of +1, a decrease was given a rating of -1, and no change was given a rating of zero. If the sum of the four ratings was greater than zero, the trend was considered to be upward, and if it was negative, then the trend was considered to be downward. While two years of data may not be sufficient to forecast a long-term trend, it was believed that this evaluation provided an indication of potential trends. Table 5-6 also includes the median of the fuel sulfur content values for each port. The median is a more realistic measure of the sulfur content than is the mean, because in many ports many values were reported as inequalities (< 0.05%). The 11 ports highlighted in Table 5-6 are those having a median sulfur content ≤ 0.2%. The two-year average percentage of DMA analyses showing ≤ 0.2% sulfur ranged from 0 (Osaka) to 100 (Melbourne, Tokyo and Valparaíso). Note that the three “100-percent” ports represented only 1 percent of the fuel sulfur analyses provided by DNVPS. To obtain an idea of the uncertainty in this study’s analysis of the DNVPS data, a subset of the ports was examined. This subset consisted of ports from which there were at least 49 samples and for which at least half of the stems analyzed had a sulfur content ≤ 0.2%. Figure 5-1 shows the 95 percent confidence intervals for the percentage of stems having ≤ 0.2% sulfur.
49 Values for December 2005 were included with the data for the first quarter of 2006. Results for the fourth quarter
of 2007 are based on analyses through December 16, 2007.

26
Table 5-6 RESULTS OF ANALYSES OF DNV SULFUR CONTENT DATA
No. of Analyses
Percent of Analyses With ≤0.2% Sulfur
(%)
Change 2006-2007
(Points) Region Port
2006 2007 2006 2007 2006-2007
Median Sulfur
Percent (%)
2006-2007 Change in
Percent With ≤0.2% Sulfur
Honolulu 17 21 23.5 14.3 -9.2 0.30 Down Houston 76 74 22.4 55.4 33.0 0.27 Up Steeply Long Beach 113 204 94.7 98.5 3.8 <0.05 Up
Los Angeles 66 110 95.5 98.2 2.7 0.09 Up
New York 24 25 41.7 80.0 38.3 0.20 Up Steeply Portland, OR 4 6 50.0 83.3 33.3 <0.05 Up Steeply
North America (U.S.)
Seattle 11 17 18.2 23.5 5.3 0.28 Up Busan 28 78 3.6 33.3 29.8 0.52 Up Steeply Hong Kong 155 136 1.3 0 -1.3 0.44 Down Kaohsiung 25 30 0 3.3 3.3 0.50 Up (07-Q4) Kobe 2 2 50 100 50 <0.05 Up Steeply Melbourne 11 20 100 100 0 <0.05 Even Nagoya 3 6 33.3 50.0 16.7 0.42 Up Osaka 3 6 0 0 0 0.93 Even Port Klang 61 40 39.3 62.5 23.2 0.22 Up Shanghai 23 41 73.9 92.7 18.8 0.16 Up Singapore 728 850 4.1 4.4 0.2 0.44 Up Tokyo 0 2 0 100 100 <0.05 Up Steeply
Asia/South Pacific
Yokohama 8 11 25.0 63.6 38.6 0.25 Up Steeply Antwerp 193 166 77.7 88.6 10.8 0.15 Up Europe Rotterdam 265 260 69.8 78.8 9.0 0.19 Up Balboa 61 89 27.9 16.9 -11.0 0.28 Down Cristóbal 44 52 4.5 1.9 -2.6 0.44 Down
Latin America
Valparaíso 7 8 100 100 0 <0.05 Even Middle East
Fujairah 250 278 3.6 5.8 2.2 0.65 Up

27
Figure 5-1
ERROR BOUNDS FOR FRACTION OF SULFUR ANALYSES WITH ≤ 0.2% SULFUR
0%
10%
20%
30%
40%
50%
60%
70%
80%
90%
100%
Long Beach Los Angeles Shanghai Antwerp Rotterdam New York
Perc
ent o
f DM
A S
tem
s With
Sul
fur
Con
tent
At o
r L
ess T
han
0.2
%
5.1.3 Alternative Estimate of Low-Sulfur Fuel Availability The estimates of low-sulfur DMA availability shown in Table 5-3 were based upon reported capacities. Actual sales would be expected to be lower. Unfortunately, only a few bunker suppliers reported sales data. To obtain an alternative estimate of the availability of low-sulfur DMA, it was assumed that the number of low-DMA stems reported by DNVPS represent a minimum number of refuelings. The average stem value of 240 metric tons (as discussed in section 5.1.1) was multiplied by the number of DNVPS sulfur content analyses. The results are shown in Table 5-7. The estimated low-sulfur DMA sales in 2006 and 2007, solely based on DNVPS stem data without extrapolating to worldwide scale,50 were 159,360 and 224,400 tonnes respectively. 5.1.4 Petroleum Refinery Survey Results All four major refineries identified in Section 4.4 of this study declined to be included in the study, under advice from their corporate legal counsels. The four refineries cited concerns over releasing business-sensitive information. Therefore, the following discussion is based solely on personal communications with refinery personnel.
50 Extrapolation to worldwide sales levels is presented in Section 6.1.2.

28
Table 5-7
ESTIMATED LOW-SULFUR DMA SALES IN 2006 AND 2007, BY REGION
Region 2006 (Tonnes)
2007 (Tonnes)
Australia/South Pacific 2,640 4,800 Central and South America 6,240 5,760 China 4,560 9,360 Japan 960 3,360 Korea 240 6,240 Singapore 7,200 8,880 Asia-Other 5,760 6,000 Europe 80,400 84,480 Middle East 2,160 3,840 North America – West Coast 42,720 77,040 North America - Other 6,480 14,640 Totals 159,360 224,400
Refineries are generally located near major consumption areas to enable them to respond to regional and seasonal or weather-related demand and to maximize the value of their petroleum product mix. For example, one company indicated that it plans to expand its low-sulfur DMA production facility in Western Europe to meet the new demand created by the MARPOL Annex VI SECA requirements and by European Council directives (See Section 2.2.1.). Other companies revealed that new refinery units are to be built in the Middle East (e.g., Qatar) and Southeast Asia (e.g., Indonesia). Not clear was whether the latter expansion will be for overall refinery capacity or specifically for low-sulfur DMA production. As far as the local supply is concerned, because of stringent environmental requirements (i.e., environmental impact assessment and permitting) in the State of California and associated economic and financial concerns, many refineries do not plan to expand their operations in California. Instead, refineries plan to expand their production capacity in other states, such as Texas, and supply fuel to California. One company indicated that it does not supply any low-sulfur DMA in any U.S. ports. Nevertheless, several California refineries do produce low-sulfur marine distillate, but their capacities and sales volumes were not provided, to preclude revelation of trade secrets. As for the marine distillate supply chain, many refineries only supply their own bunkering service business unit, whereas other refineries supply both their own bunkering business unit as well as other bunker suppliers. An overview of world refinery capacity will be presented in Section 5.3.

29
5.2 Port-by-Port Assessment To supplement the ocean carrier and bunker supplier survey data, refueling locations for San Pedro Bay-bound OGVs were identified. At each of these refueling ports information about the potential for low-sulfur DMA supply was obtained. Information sources included the ports, trade journals, and correspondence with bunker suppliers. 5.2.1 North American Ports 5.2.1.1 United States Long Beach Founded in 1911, the 3,200-acre Port of Long Beach is one of the world’s busiest seaports and a leading gateway for trade between the U.S. and Asia. It is the second busiest container port in the U.S. and the 12th largest container port in the world.51 Container cargo is often expressed in twenty-foot equivalent units (TEUs); an equivalent unit is a measure of containerized cargo capacity equal to one standard 20-foot (length) by 8-foot (width) container. In 2007, the Port handled more than 7.3 million containers TEUs and 5,300 vessels calls.52 The survey identified ten bunker fuel suppliers at the Port of Long Beach:
• Apex Oil Company • Chemoil Energy Corporation • Chevron Global Marine Products (USA) • Dolphin Marine Fuels Inc. • Fuel and Marine Marketing LLC. • General Petroleum, Inc. • Jankovich Company • Petro-Diamond, Inc. • Trac Tide Marine Corporation • Westport Petroleum, Inc.
About 97 percent of the 317 stems analyzed by DNV in 2006-2007 had sulfur content ≤ 0.2%, and the trend toward lower sulfur was increasing. The median DMA sulfur content was < 0.05%. The results of this survey indicate that Long Beach is likely to be able to supply low-sulfur DMA. Los Angeles The Port of Los Angeles was founded in 1907 and today is known as a gateway for international commerce. Encompassing 7,500 acres, the Port annually handles almost 190 million tonnes of cargo and 3,000 vessel arrivals.53 It is the busiest container port in the U.S. and the tenth-ranked
51 Cargo Systems. “Cargo Systems Top 100 Container Ports 2007.”
(http://www.cargosystems.net/freightpubs/cs/top100supplement.htm). (Accessed January 16, 2008). 52 Long Beach Port Authority, www.polb.com. Accessed on February 7, 2008. 53 The Port of Los Angeles, http://www.portoflosangeles.org/. Accessed on January 8, 2008.

30
container port in the world.54 In 2007, the Port handled more than 8.4 million TEUs.55 The Port also is home to the “World Cruise Center,” the busiest cruise passenger complex on the West Coast of the US. The survey identified ten bunker supply facilities at the Port of Los Angeles:
• Apex Oil Company • Chevron Global Marine Products (USA) • ConocoPhillips (USA) • Dolphin Marine Fuels Inc. • Fuel and Marine Marketing LLC. • General Petroleum, Inc. • Jankovich Company • Petro-Diamond, Inc. • Trac Tide Marine Corporation • Westport Petroleum, Inc.
About 97 percent of the 176 stems analyzed by DNV in 2006-2007 had sulfur content ≤ 0.2%, and the trend toward lower sulfur was increasing. The median DMA sulfur content was 0.09%. The results of this survey indicate that the Port of Los Angeles is likely to be able to supply low-sulfur DMA. Corpus Christi Founded in 1926, the Port of Corpus Christi is the fifth largest port in the US in terms of total tonnage. In 2006, the Port handled nearly 90 million short tonnes of cargo and 7,000 vessel calls.56 In addition to its commercial handlings, the Port also acts as a strategic deployment seaport for U.S. military forces.57 Five local refineries produce fuel oil,58 but Enjet Inc. appears to be the only known bunker supplier at this port.59 DNV did not provide any fuel sulfur data for Corpus Christi. The near-term availability of low-sulfur DMA at this port cannot be determined from the information available. Honolulu Honolulu Harbor is the main seaport of Hawaii, handling over 11 million tonnes of cargo per year. It is administered by the Hawaii State Department of Transportation’s Harbors Division. About 18 percent of the 38 DMA stems analyzed by DNV in 2006-2007 had a sulfur content ≤ 0.2%, and the trend was steady. The median sulfur content was 0.30%. Tesoro Refining & Marketing Company apparently is the only bunker supplier at this port.
54 Cargo Systems, Op. Cit. 55 The Port of Los Angeles, http://www.portoflosangeles.org/. Accessed on January 22, 2008. 56 The Port of Corpus Christi, www.portofcorpuschristi.com/. Accessed on January 8, 2008. 57 Global Security, http://www.globalsecurity.org/military/facility/corpus-christi-port.htm. Accessed on
January 8, 2008. 58 Fearnley Consultants, 2003. Panama Bunker Market Study. Prepared for the Panama Canal Authority
(February), p. 67. 59 At this writing, there is a possibility that there is more than one bunker supplier at this port; the matter will be
resolved by the final report.

31
Houston The Port of Houston is made up of the Port of Houston Authority and more than 150 private industrial companies. It is ranked tenth in the world and second in the U.S. in total tonnage handled. This status is confirmed by the more than 200 million tonnes of cargo moved through the Port in 2006.60 The survey identified 13 bunker supply companies at this port:
• Bominflot Bunker Oil Corporation • BP Marine Fuels • Chemoil Energy Corporation • Chevron Fuel & Marine Marketing • Difco Fuel Systems • ExxonMobil Marine Fuels Ltd. • Houston Marine Services Inc. • J.A.M. Marine Services LLC • Matrix Marine Fuels L.P. • Ocean Energy Inc. • O'Rourke Marine Services • Shell Marine Products US Company • Sun Coast Resources Inc.
Analysis of the DNV data showed that about 39 percent of the 150 DMV stems delivered at Houston in 2006-2007 had a sulfur content < 0.2%. The growth in the use of low-sulfur DMA has been dramatic. In each of the last two quarters of 2007, 80 percent of the DMA stems were of low-sulfur DMA. The median sulfur content decreased from 0.35% in 2006 to 0.16% in 2007. The data indicates that Houston is potentially an important source of low-sulfur DMA. New York The Port of New York is managed by the Port Authority of New York and New Jersey and is the largest port complex on the East Coast of the U.S.61 In 2006, the Port of New York handled over 31 million tonnes of cargo.62 The survey identified 11 bunker supply facilities at this port:
• BP Marine Fuels • Chemoil Energy Corporation • Continental Fuels Inc. • Fuel and Marine Marketing LLC - East Coast • Global Partners LP • Harbor Petroleum Inc. • Hess Corporation
60 Port of Houston Authority, www.portofhouston.com/index.html. Accessed on January 8, 2008. 61 The Port Authority of New York and New Jersey, www.panynj.gov/. Accessed on January 8, 2008. 62 Teterboro Airport, http://www.teb.com/DoingBusinessWith/seaport/pdfs/16-year-stats-06-rev1.pdf. Accessed
on January 16, 2008.

32
• Isbrandtsen Marine Services Inc. • Plaza Marine Inc. • Westport Petroleum Inc. • ConocoPhillips (USA)
About 61 percent of the DNV DMA samples analyzed in 2006-2007 had a sulfur content < 0.2%, and there was a trend towards lower sulfur content. The median sulfur content for the two years was 0.2%, and in 200763 it was 0.18%. The results of this survey indicate that the Port of New York may be able to supply low-sulfur DMA. Oakland The Port of Oakland, established in 1927, is fourth among U.S. ports and 41st in the world in annual container traffic. When the Port first began building terminals for containerships, it became the second largest seaport in the world in terms of container tonnage, second only to New York. In 2007, the Port handled 2.4 million TEUs of container traffic.64 The survey identified five bunker supply facilities at this port:65
• Chemoil Energy Corporation • Chevron Global Marine Products (USA) • ConocoPhillips (USA) • General Petroleum Inc. • The Jankovich Company
No bunker suppliers at the Port of Oakland responded to this survey. DNV did not provide any fuel sulfur data for this port. The near-term availability of low-sulfur DMA at Oakland cannot be determined from the information available. Portland The Port of Portland, created in 1891 by the Oregon state legislature, is the governmental public authority that is responsible for Portland’s general aviation and marine activities. The Port was ranked the 29th largest US port in 2005 by the U.S. Army Corps of Engineers, with 11.8 million short tons66 in domestic traffic and 16.4 million short tons in foreign traffic.67 In 2006, the Port reported that nearly 800 OGVs called on its four terminals and almost 464,000 autos, namely Hyundai, Honda, and Toyota, were imported into the U.S. via the Port.68 Much of the fuel supply that is provided to OGVs at Portland comes from the Seattle area. So, given the additional transportation cost, bunker prices tend to be higher than for the Port of Seattle.69 The survey identified five bunker supply companies at Portland:
63 DNV provided results through October 21, 2007 for the Port of New York. 64 The Port of Oakland, http://www.portofoakland.com/. Accessed on February 7, 2008. 65 The bunker suppliers listed for Oakland serve several ports in and around San Francisco Bay. 66 1 short ton equals 2,000 pounds (lbs.) 67 U.S. Army Corps of Engineers. http://www.usace.army.mil/ Fact Card 2006. Accessed on November 30, 2007. 68 Port of Portland. www.portofportland.com. Accessed on November 30, 2007. 69 Fearnley Consultants, Op.Cit., p. 69.

33
• Tesoro Refining & Marketing Company • ConocoPhillips (USA) • Fuel and Marine Marketing LLC - West Coast • Pacific Coast Marine Fuels LLC • Rainier Petroleum
DNV analyzed only ten DMA stems in 2006-2007, and seven of them had a sulfur content ≤ 0.2%. The median sulfur content was < 0.05%. The availability of low-sulfur DMA at Portland may be seasonal, in that local bunker volumes are at a peak from October to February, serving grain exporting.70 During these five months, there is an increased fuel demand for marine fuels. Seattle The Port of Seattle was created in 1911 and is known as one of the world’s leading centers for trade and tourism. In 2006, the Port handled nearly 2 million TEUs of cargo and saw more than 1,300 vessels.71 The survey identified three bunker supply companies at Seattle:
• ConocoPhillips (USA) • Tesoro Refining & Marketing Company • The Jankovich Company
About 21 percent of the DMA stems analyzed in 2006-2007 had a sulfur content < 0.2%, and the median sulfur content was 0.28%. The survey results do not indicate that Seattle would be a major source of low-sulfur DMA. 5.2.1.2 Canada Vancouver The Port of Vancouver is the largest port in Canada and is ranked number one in total foreign exports in North America. In 2006, the Port handled almost 80 million tonnes of cargo.72 Four bunker fuel suppliers in Vancouver were identified:
• ExxonMobil Marine Fuels Ltd. • ICS Petroleum Ltd • Imperial Oil Ltd. • Marine Petrobulk Ltd.
DNV did not provide any sulfur analysis data for this port. Information to determine the availability of low-sulfur DMA at Vancouver is insufficient. Nevertheless, the demand for
70 Ibid., p. 70. 71 Port of Seattle, www.portseattle.org. Accessed on January 8, 2008. 72 Port of Vancouver, www.portvancouver.com/. Accessed on January 14, 2008.

34
low-sulfur fuels at Vancouver is likely to increase because the Port is discounting its harbor dues for OGVs that use fuel with ≤ 0.2% sulfur.73,74 5.2.1.3 Mexico Manzanillo The Port of Manzanillo was founded in the 1500’s as a shipbuilding site; wood from the manzanillo tree was used to erect the vessels. Today, it is the largest shipping port on the western side of Mexico.75 Mexico has drawn up a National Infrastructure Program, calling for the construction of five new ports and the modernization of 22 others, including Manzanillo.76 Two bunker supply ports were identified:
• Bunkers Marinos Del Noroeste S.A. de C.V. • Marinoil Servicios Marítimos SA. de CV
DNV did not provide any sulfur analysis data for this port. Information to determine the availability of low-sulfur DMA at Manzanillo, Mexico is insufficient. 5.2.2 Asian/Oceania Ports 5.2.2.1 China Along the more than 10,000 miles of coastline in eastern China are many seaports that are active in the international ocean freight trade. For purposes of this study, the focus was on eight key ports: Dalian, Guangzhou, Ningbo, Qingdao, Xiamen, Shanghai, Shenzhen, and Tianjin. These eight ports were among the top 30 container ports in 2007, according to a Cargo Systems survey77: Port World Rank Port World Rank Shanghai 3 Guangzhou 15 Shenzhen 4 Tianjin 17 Qingdao 11 Xiamen 22 Ningbo 13 Dalian 28
73 “Vancouver’s Harbor Dues Based on Emission Levels.” Environmental Leader,
http://www.environmentalleader.com/2007/04/05/vancouvers-harbor-dues-based-on-emission-levels/ (April 5, 2007).
74 “Updates and Clarifications for VPA Harbour Dues Air Emissions Standards.” Port of Vancouver, http://www.portvancouver.com/shipping_trade/docs/Updates_and_Clarifications_for_Harbour.pdf (March 27, 2007).
75 Mexico Connect, www.mexconnect.com. Accessed on January 14, 2008. 76 Zin, C.T., “Mexico draws up 'ambitious' master-plan.” Portworld,
http://www.portworld.com/news/2007/11/69786 (November 19, 2007). 77 Cargo Systems 2007, Op. Cit.

35
Notably, Shanghai and Shenzhen are the top two ports in China in terms of ocean trade with Northern American ports. In China, a government or state-owned bunker supplier has monopolized the marine fuel market for three decades. China Marine Bunker Supply Company or Chimbusco, with sales of 3 million tons of bunker fuel in 2007, was a state-owned business established in 1972. The company was reorganized in 2003 as a business entity with two partners – China Ocean Shipping Group Company (or COSCO) and PetroChina Company Ltd. Marine fuel supply in China contains two sectors – taxed (domestic) and bonded (or duty free, no custom or import duty) fuel. For OGVs in the international ocean freight business, shipowners purchase bonded fuel to take advantage of the duty exemption. Chimbusco’s monopoly of the domestic marine fuel market was dissolved in 2005 when the Chinese government granted several local fuel oil companies entry into the market to promote a free economy and an open competitive environment. The Chinese government granted four local companies (China Shipping and Sinopec Suppliers Company - an equal-share joint venture with China Shipping and Sinopec; Sinopec Group Zhoushan Branch; Sinopec Changjiang Fuel Oil Company – Sinopec owns 50 percent share of the three companies; and the privately-owned Shangzhen Guanhui Group or Brightoil Company) to enter the bonded fuel oil market on June 12, 2006. China Shipping and Sinopec Suppliers delivered the first batch of 500 tons of bonded fuel oil to the China Shipping “New Yangshan” containership by a Chimbusco-Shanghai’s tanker on August 7, 2007. Brightoil made the first delivery of bunker fuel to Shanghai Port in January 2008. On November 12, 2007 the Chinese government granted Shell Marine Fuel the permission to supply Chimbusco with bonded bunker fuels for foreign vessels in Shanghai Port. China’s demand for fuel oils, including marine fuel oil, has skyrocketed after rapid economic growth during the last two decades. Despite the domestic supply of fuel oils, China imports more than 60 percent of its fuel oil from overseas sources. Key suppliers of China marine fuel include Korea, Japan, Singapore, Taiwan, Russia, Thailand, the Philippines, the Middle East, and the U.S. West Coast. Fuel oil imports to China almost doubled, from 14 million tons in 1999 to 24 million tons in 2003. The annual consumption of bonded marine fuel oil in China is estimated at approximately 12 million tons. As of 2007, Chimbusco only delivered 3 million tons of bonded marine fuel oil to China. It is evident that China will continue importing bonded marine fuel to power the ocean freight trade in the future. Hong Kong Because of its turnaround time of 13 hours for container ship operations, the Port of Hong Kong is known as one of the world’s busiest and most efficient ports. In 2006, the Port handled 23.5 million TEUs, giving it the title of world’s busiest container port for the 11th time in the past 14 years. In 2007, Hong Kong was the second busiest container port, behind Singapore.78 The Port 78 Cargo Systems 2007, Op. Cit.

36
also serves as the entry-port to the Mainland of China while also providing service to the South Asian Pacific region.79 The survey identified 34 bunker supply firms at the Port of Hong Kong. The following are the high-priority bunker firms that were surveyed:80
• Bomin Bunker Oil Ltd. • BP Hong Kong Ltd. • Callany Limited • Caltex Oil Hong Kong Ltd. • Coastal Oil Holdings Ltd. • Feoso Oil • Frisol Bunkering • O.W. Bunker China Ltd. • Shell Hong Kong Ltd. • Soaring Dragon Enterprise Ltd. • Vermont Marine Bunkering Ltd. • Hong Kong Fuels Ltd. • Pan Nation Petro-Chemical Co Ltd. • South Horizons International Petroleum Ltd. • United Bunkering & Trading (HK) Ltd.
Out of 291 DMA stems analyzed by DNV in 2006-2007, only two had sulfur content < 0.2%. The median sulfur content was 0.44%. None of the Hong Kong respondents to the bunker supplier survey reported selling low-sulfur DMA, citing lack of demand for it. From the information obtained through this study, it does not appear that Hong Kong will be an important source of low-sulfur DMA in the near future. Shanghai The Port of Shanghai, the largest port open to international navigation in China, is situated in the east of China and at the midpoint of China's coast line, where east-west waterborne transportation converges. The Port has 140 public productive berths, in which 68 are for vessels of over 10,000 deadweight tons (DWT).81 Ninety-nine percent of Shanghai's foreign trade goods are handled by this port; its annual passenger traffic and cargo throughput rank first in China. Shanghai has established trade relations with about 160 countries and regions worldwide and is served by 20 international shipping lines.82 About 86 percent of the 64 DMA stems analyzed by DNV in 2006-2007 had a sulfur content < 0.2%. The trend toward low-sulfur DMA is increasing; in 2007 the low-sulfur DMA constituted 93 percent of the total stems analyzed. The median sulfur content of the DMA in the 2006-2007 DNV data set was 0.16%. In 2007 the median sulfur content of the DMA was 0.15%. The survey data indicates that Shanghai is a potentially important supplier of low-sulfur DMA in the near future.
79 Marine Department of the Hong Kong Special Administrative Region.
www.gov.hk/en/abouthk/factsheets/docs/port.pdf. Accessed on November 30, 2007. 80 See Section 4.3.1. 81 Deadweight tonnage is a measure of the capacity of a cargo ship. 82 China in Brief, http://www.asiatradehub.com/china/shanghai.asp

37
5.2.2.2 French Polynesia Papeete The Port of Papeete, located in Tahiti, was opened as a public establishment in 1962.83 The survey identified four bunker fuel suppliers at this port:
• ExxonMobil Marine Fuels (Singapore) • Shell-Polypetroles Shell S.A. • Total Oil Asia-Pacific Pte Ltd. • Total Polynésie
DNV did not provide any sulfur analysis data. The survey did not yield enough information to determine whether Papeete would be an important location for refueling with low-sulfur DMA.
5.2.2.3 Japan The following discussion is summarized from a 2003 study prepared for the Panama Canal Authority,84 with some recent updates. Japan has a relatively large bunkering capacity and can supply all grades of good quality marine fuel. Almost all of the marine fuel comes from domestic refineries.85 Despite the readily available fuel, two factors make the prices of refueling at Japanese ports relatively expensive. One is the strong demand by domestic non-marine sources, such as power plants. The other is the fuel delivery systems at the ports. The majority of deliveries are by barge, and one barge is allowed to service only one ship. Anti-pollution measures are strict. For example, booms are mandatory during bunkering. These practices can cause delays and congestion during busy periods, and buyers must make fueling arrangements well in advance. Short notice (24-hour) deliveries are almost impossible at some ports. Finally, non-Japanese ships have to compete with Japanese-flagged vessels, many of which have company affiliations with local suppliers. The Japanese government is concerned that Japanese ports are at risk of becoming feeder points for transshipment hubs outside of the country.86 The country’s expensive distribution costs and handling delays have been blamed for this situation. In 2004, however, Japan launched a long-term project to expand and improve efficiency at three of its main port clusters: Tokyo-Yokohama, Nagoya-Yakkaichi and Osaka-Kobe. The Japanese ports of Osaka, Kobe and Sakai-Senboku Amagasaki-Nishinomiya-Ashiya are to be merged into the new Hanshin Port, which was scheduled to begin operations in December 2007. The goal of the merger is to win business by having one port tariff to cover several calls at separate terminals. This new ‘super-port’ will have a total container throughput of at least 4.3
83 Port of Papeete, www.portdepapeete.pf/. Accessed on January 14, 2008. 84 Fearnley Consultants, 2003. Op.Cit. 85 Some fuel is imported from Korea. Japan also exports bunker fuel to other countries. 86 Zin, C.T., 2007. “Osaka, Kobe and other Japanese Ports Merge, “Portworld (November 23)
(http://www.portworld.com/news/2007/11/69845).

38
million TEUs per year, making it Japan’s busiest and largest container port, ahead of Tokyo, Yokohama and Nagoya.87 Kobe What is now called the Port of Kobe was inaugurated in 1868, although it has served as an international port for more than 1,000 years.88 The port was seriously damaged by an earthquake in 1995 and essentially rebuilt in two years. In 2006, ships carried 21.9 million and 26.8 million tons of exports and imports, respectively, in and out of Kobe. Trade with the U.S. comprised only about 18 percent of this traffic.89 Eleven bunker fuel suppliers at this port were identified:
• Cosmo Oil Company Ltd. • Daitoh Trading Company Ltd. • Idemitsu Kosan Company Ltd. • Itochu Petroleum Japan Ltd. • Japan Energy Corporation • Kanematsu Corporation • Marubeni Petroleum Company Ltd. • Petro-Diamond Japan Corporation (PDJ) • Showa Shell Sekiyu KK • Sinanen Company Ltd. • Sumitomo Corporation
Three of the four DNV DMA sulfur analyses had < 0.2% sulfur, and the median value was < 0.05%. This information is insufficient to judge Kobe’s ability to supply low-sulfur DMA in significant amounts. Nevertheless, because this study’s bunker supplier survey found low-sulfur DMA to be available at several Japanese ports, Kobe should be investigated in future surveys. Nagoya The Port of Nagoya, founded in November 1907, is among the largest trading ports in Japan, accounting for about 10 percent of the total trade value of Japan. Nagoya is the largest automobile exporting center in Japan and is the port from which Toyota Motor Corporation exports most of the cars it manufactures in Japan. The Port has 292 available berths. In 2006, the Port handled almost 3 million TEUs of cargo, international and domestic combined.90 This survey identified 11 bunker suppliers in Nagoya:
• Cosmo Oil Company Ltd. • Daitoh Trading Company Ltd. • Idemitsu Kosan Company Ltd.
87 Ibid. 88 “History.” Port & Urban Projects Bureau Kobe City Government
(http://www.city.kobe.jp/cityoffice/39/port/data/rekishi_e1.htm) 89 “Statistics for Dec. 2006. 4. Foreign Cargo Traffic by Principal Countries,” Port & Urban Projects Bureau Kobe
City Government (http://www.city.kobe.jp/cityoffice/39/port/data/tokei/ad-18-12-3e.pdf). 90 Port of Nagoya, www.port-of-nagoya.jp/english/2007_monthly.pdf. Accessed on January 16, 2008.

39
• Itochu Petroleum Japan Ltd. • Japan Energy Corporation • Kanematsu Corporation • Kawasho Corporation • Marubeni Petroleum Company Ltd. • Nissho Iwai Corporation • Sinanen Company Ltd. • Sumitomo Corporation
About 44 percent of the nine DMA stems analyzed in 2006-2007 had a sulfur content < 0.2%, and the median sulfur content was 0.42%. This information is insufficient to judge Nagoya’s ability to supply low-sulfur DMA in significant amounts. Nevertheless, because this study’s bunker supplier survey found low-sulfur DMA to be available at several Japanese ports, and Nagoya is a major source of San Pedro Bay-bound auto exports, Nagoya should be investigated in future surveys. Osaka The Port of Osaka, also known as “Japan’s Gatekeeper,” plays an important role as an overall hub for sea, land, and air transportation. More than 185 berths are available with 72 earmarked for international trade and 113 used domestically. It services 4,200 container vessels annually.91 This survey identified 12 bunker suppliers in Osaka:
• Cosmo Oil Company Ltd. • Daitoh Trading Company Ltd. • ExxonMobil Marine Fuels (Singapore) • Idemitsu Kosan Company Ltd. • Itochu Petroleum Japan Ltd. • Japan Energy Corporation • Kanematsu Corporation • Kawasho Corporation • Marubeni Petroleum Company Ltd. • Nissho Iwai Corporation • Sinanen Company Ltd. • Sumitomo Corporation
All three of the DMA samples analyzed by DNV in Osaka in 2006-2007 had a sulfur content > 0.2%. The median sulfur concentration was 0.93%, which is the highest of all the ports in the DNV data set. Nevertheless, because this study’s bunker supplier survey found low-sulfur DMA to be available at several Japanese ports, Osaka should be investigated in future surveys. Tokyo
91 Osaka Port Corporation. www.optc.or.jp/en/. Accessed on November 30, 2007.

40
The Port of Tokyo, founded in May 1941, is a commercial port, handling food, paper products, building materials, and other cargoes. Because of its use as a base for passenger ships, the Port of Tokyo is visited by more OGVs and cruise lines than any other Japanese port. According to a 2005 Record of Performance, the Port welcomed 32,180 vessels and handled over 92 million tonnes of cargo. The Tokyo Metropolitan Government plans to increase the competitiveness of the Port.92 Tokyo is scheduled to add three terminals, each with a draft of 15 to 16 meters in an effort to handle the latest generation of container ships. According to the Tokyo Metropolitan government’s Port and Harbor Bureau, Japan plans to privatize its port operations at the Tokyo Port Terminal Public Corporation by April 2008.93 This survey identified 17 bunker suppliers in Tokyo:
• Cosmo Oil Company Ltd. • Daitoh Trading Company Ltd. • ExxonMobil Marine Fuels (Singapore) • Fuji Kosan Company Ltd • Idemitsu Kosan Company Ltd. • Itochu Petroleum Japan Ltd. • Japan Energy Corporation • Kanematsu Corporation • Kawasho Corporation • Kyushu Oil Company Ltd • Marubeni Petroleum Company Ltd. • Nissho Iwai Corporation • Petro-Diamond Japan Corporation (PDJ) • Showa Shell Sekiyu KK. • Sinanen Company Ltd. • Sumitomo Corporation • Total France SA
Two DMA stems were analyzed by DNV in 2006-2007 (both in 2007), and they each had sulfur content < 0.05%. This information is insufficient to judge Tokyo’s ability to supply low-sulfur DMA in significant amounts. Nevertheless, because this study’s bunker supplier survey found low-sulfur DMA to be available at several Japanese ports, Tokyo should be investigated in future surveys. Yokohama The Port of Yokohama is one of the leading Japanese trade ports. The Port first opened on June 2, 1859, and because of its successful construction projects in 1889, is now called the “doorway to Japan.” In 2006, nearly 43,000 vessels called on the Port and approximately 139 million tonnes of cargo were handled. 94 This survey identified only one bunker supplier in Yokohama:
92 Bureau of Port and Harbor Tokyo Metropolitan Government, www.kouwan.metro.tokyo.jp. Accessed on
January 16, 2008. 93 Zin, C.T., 2007, Op. Cit. 94 Port and Harbor Bureau. www.city.yokohama.jp/en/. Accessed on November 30, 2007.

41
Petro-Diamond Japan Corporation (PDJ). About 47 percent of the 19 DMA stems analyzed by DNV in 2006-2007 had sulfur content ≤ 0.5%. The trend toward low-sulfur DMA is increasing. In 2007, the low-sulfur analyses comprised 64 percent of the total, and the median sulfur content for that year was < 0.05%. 5.2.2.4 Korea The main bunkering ports in Korea are currently Busan,95 Yosu, and Inchon. In early 2007, bunker fuel demand decreased at Korean ports because prices increased (IFO 380 was $50 more per tonne than in Singapore). The reason for the higher prices was a shortage of fuel due to internal demand (e.g. power plants). The internal demand started to decrease as of January 25, 2007, and therefore bunker supply was expected to increase and prices were expected to decrease.96 Nevertheless, shortages were still serious as of December 2007.97 Busan Busan recently opened the Busan New Port container facility, making it the world’s fifth largest container port. The Port is considering developing a new bunkering base to provide competitive bunkering services. This is part of a general program to create a multifunctional port, rather than one that specializes solely in cargo handling. Bunker suppliers in Busan identified by this survey include the following:
• GS Caltex Corporation • Hyundai Oil Refinery Company Ltd. • Inchon Oil Refinery Company Ltd. • Korea Ocean Energy Company Ltd. • LG International Corporation • S-Oil Corporation • SK Corporation
In 2006-2007, only about 26 percent of the 106 DMA stems analyzed by DNV had a sulfur content of ≤ 0.2%. The proportion of stems having low-sulfur DMA, however, increased rapidly from 2006 to 2007. Still, the median sulfur content in 2007 was 0.46%. The survey data does not indicate that Busan will be a significant source of low-sulfur DMA in the near future. 5.2.2.5 Malaysia Port Klang Port Klang is the one of the main ports of Malaysia, located in the district of Klang in the State of Selangor. It serves the Klang Valley, including the federal capital Kuala Lumpur and the federal administrative capital, Putrajava. Port Klang was originally known as Port Swettenham when it
95 Also known as Pusan. 96 Jameson, N., 2007. “Fundamentals to shift in Korean market,” Bunkerworld (January 25). 97 See Bunkerworld 12-28-07.

42
was founded under British colonial rule in 1893. Official opening of the Port was on September 15, 1901. The Port Klang Authority, established July 1, 1963, administers the three ports in the Port Klang area: Northport, Southpoint, and West Port. The Port served 16,404 vessels in 2006.98 Bunker suppliers in Port Klang identified by this survey include the following:
• G-Synergy Holding Sdn Bhd. • BP Malaysia Sdn. Bhd. • GEM Resources Sdn. Bhd. • Petroliam Nasional Bhd. (Petronas) • Dickson Marine Company Sdn Bhd. • Nam Hoe Diesel • Ban Hoe Leong Marine Supplies Sdn. Bhd.
About 49 percent of the 101 DMA stems analyzed by DNV in 2006-2007 had sulfur content ≤ 0.2%, and the trend was toward lower sulfur content. For the two-year period, the median sulfur content was 0.22%. In 2007, that value had dropped to 0.17%. Because no survey responses were received from Malaysian ports, there is uncertainty about the ability of Port Klang to supply low-sulfur DMA. Nevertheless, the increasing number of low-sulfur DMA results reported by DNV data suggests that this port should be explored further. 5.2.2.6 Singapore The Port of Singapore was founded in the late 13th Century. Today, it is the world’s busiest port in terms of tonnage handled. According to the Maritime and Port Authority of Singapore (MPA),99 approximately 140,000 OGVs call on Singapore in any given year. In 2006, nearly 29,000,000 tonnes were recorded in bunker sales.100 Ninety-one marine fuel suppliers are located at the Port of Singapore, the most of any port in this study. The top 20 suppliers, identified by the Port, are the following:
• Alliance Trading Company • BP Singapore • Bunker House Petroleum • Consort Bunkers • Equatorial Marine Fuel Management Services • ExxonMobil Marine Fuels • Gas Trade • Global Energy Trading • Golden Island Diesel Oil Trading • Lukoil Asia Pacific • Northwest Resources • Ocean Bunkering Services
98 Port Klang Authority, http://www.pka.gov. Accessed January 14, 2008. 99 Singapore MPA, 2008. “Port Statistics: Bunker Sales.” (www.mpa.gov.sg/infocentre/pdfs/bunker- sales.pdf). 100 MPA. http://www.mpa.gov.sg/infocentre/portstatistics/portstats.htm. Accessed on November 30, 2007.

43
• O.W. Bunker Far East • Petrobras Singapore • Searights Maritime Services • Sentek Marine & Trading Shell International Eastern Trading Company • Singamas Petroleum Trading • Singapore Petroleum Ltd. • SK Energy Asia • Titan Bunkering
All of the Singapore survey respondents reported that only barges were used to supply fuel to OGVs. Total bunker sales at Singapore in 2005 and 2006 were about 25.5 and 28.4 million tonnes, respectively, while sales were expected to exceed 30 million tonnes in 2007.101 Sales of MGO over the past few years have been lower than their peak of 1,752,000 tonnes in 2002. This study’s analysis of data published by the Singapore MPA102 indicates that the MGO sales have been a decreasing share of total sales in 2006 and 2007, dropping from approximately 5.6 to 4.5 percent of total sales. Demand for low-sulfur fuel in Singapore to date has been “extremely thin,” perhaps because of the great distances from the current SECA areas. If demand should dictate, suppliers will obtain sufficient product to meet requirements. According to Bunkerworld, Petrobras Singapore Pte Ltd. supplies all the low-sulfur fuel oil in Singapore.103 According to the DNV data, Singapore is not currently a good source of low-sulfur DMA. Of the 1,578 DMA stems analyzed in 2006-2007, only 67 (about 4 percent) had sulfur content ≤ 0.2%. Furthermore, there was a slight downward trend during the two years. The median sulfur content was 0.44%. The survey data indicates that Singapore will not be a major supplier of low-sulfur DMA in the near future. 5.2.2.7 Taiwan Kaohsiung The Port of Kaohsiung was founded during the era of Emperor Chiaching of the Ming Dynasty, from 1522 to 1566. Since the Port encompasses five container terminals, it can handle 10 million TEUs annually.104 In December 2007, it surpassed 10 million TEUs when Evergreen Marine Corporation unloaded more than 5,000 containers. The Port was the sixth largest container port in the world until the Port of Rotterdam overtook it in November 2007.105 The survey identified four bunker suppliers at Kaohsiung:
• Chinese Petroleum Corporation (CPC) • Singapore Petroleum Co. Ltd. (Singapore)
101 Hughes, D., 2007. “Singapore Keeps Growing,” World Bunkering Online 12(4):47 (November). 102 Singapore MPA, Op. Cit. 103 Liang, L.H. “Singapore low-sulphur demand on the rise.” Bunkerworld (December 27, 2007). 104 Port of Kaohsiung, www.khb.gov.tw/english/index.htm. Accessed on January 14, 2008. 105 See Portworld, Kaohsiung news 12-26-07.
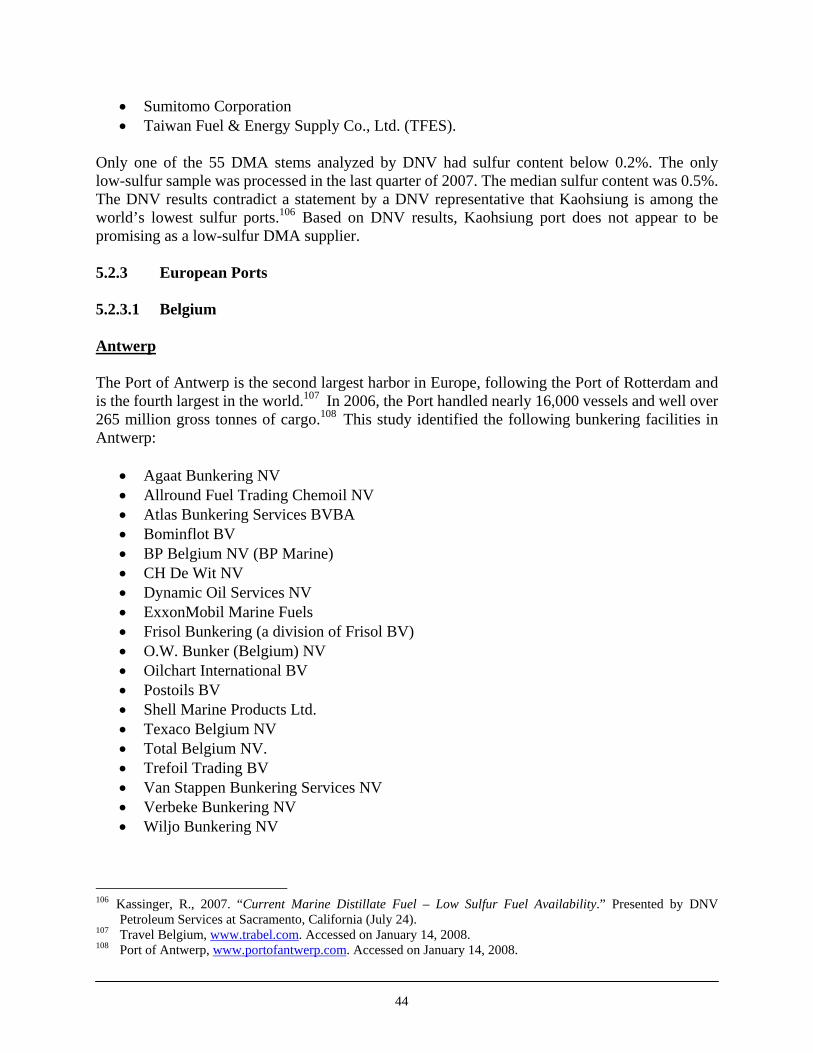
44
• Sumitomo Corporation • Taiwan Fuel & Energy Supply Co., Ltd. (TFES).
Only one of the 55 DMA stems analyzed by DNV had sulfur content below 0.2%. The only low-sulfur sample was processed in the last quarter of 2007. The median sulfur content was 0.5%. The DNV results contradict a statement by a DNV representative that Kaohsiung is among the world’s lowest sulfur ports.106 Based on DNV results, Kaohsiung port does not appear to be promising as a low-sulfur DMA supplier. 5.2.3 European Ports 5.2.3.1 Belgium Antwerp The Port of Antwerp is the second largest harbor in Europe, following the Port of Rotterdam and is the fourth largest in the world.107 In 2006, the Port handled nearly 16,000 vessels and well over 265 million gross tonnes of cargo.108 This study identified the following bunkering facilities in Antwerp:
• Agaat Bunkering NV • Allround Fuel Trading Chemoil NV • Atlas Bunkering Services BVBA • Bominflot BV • BP Belgium NV (BP Marine) • CH De Wit NV • Dynamic Oil Services NV • ExxonMobil Marine Fuels • Frisol Bunkering (a division of Frisol BV) • O.W. Bunker (Belgium) NV • Oilchart International BV • Postoils BV • Shell Marine Products Ltd. • Texaco Belgium NV • Total Belgium NV. • Trefoil Trading BV • Van Stappen Bunkering Services NV • Verbeke Bunkering NV • Wiljo Bunkering NV
106 Kassinger, R., 2007. “Current Marine Distillate Fuel – Low Sulfur Fuel Availability.” Presented by DNV
Petroleum Services at Sacramento, California (July 24). 107 Travel Belgium, www.trabel.com. Accessed on January 14, 2008. 108 Port of Antwerp, www.portofantwerp.com. Accessed on January 14, 2008.

45
About 83 percent of the 359 DMA stems analyzed by DNV in 2006-2007 had sulfur content ≤ 0.2%, and the median sulfur content was 0.15%. The trend from 2006 to 2007 was toward a higher percentage of stems with low-sulfur content. Although this study did not obtain any survey responses from Antwerp, the DNV data suggests that Antwerp will be a significant supplier of low-sulfur DMA in the near future. 5.2.3.2 Netherlands Rotterdam Rotterdam began as a small fishing village on the Rotte River in the 14th century. Six centuries later it became Europe’s most important and largest port. In 2006, the Port handled nearly 300,000 tonnes of incoming cargo.109 This survey has identified the following bunker suppliers at Rotterdam:
• Argos Ceebunkers BV. • Associated Bunkeroil Contractors BV • Atlas Bunkering Services BV • Atlas Bunkering Services BVBA. • Bominflot BV • BP Marine • Chemoil Europe BV • Cosa Trading & Oil Supply • ExxonMobil Marine Fuels • Frisol Bunkering (a division of Frisol BV) • Fuel and Marine Marketing BV • Gulf Oil Nederland BV • Lukoil Benelux BV • NIOC Bunkering BV • North Sea Petroleum BV • Ocean Energy SAM • Oilchart International BV • O.W. Bunker (Netherlands) BV • Petroval Bunker International BV • Postoils BV • Shell Marine Products Ltd • Total Belgium NV • Trefoil Trading BV • Verbeke Bunkering NV • Visserijcoöperatie Urk • Wiljo Bunkering NV
109 Port of Rotterdam, www.portofrotterdam.com. Accessed on January 14, 2008.

46
About 74 percent of the DMA stems analyzed by DNV in 2006-2007 had a sulfur content < 0.2%. The median sulfur content was 0.19%. The Rotterdam respondents to the bunker supplier survey declined to provide information on low-sulfur DMA capacity or sales. Nevertheless, given the large number of the low-sulfur stems reported by DNV and the significance of Rotterdam as Europe’s largest port, the potential for availability of low-sulfur DMA at this port is high. 5.2.4 Latin American and Caribbean Ports 5.2.4.1 Chile Although bunker fuel is available at most of Chile’s 24 ports, the most likely candidate for low-sulfur DMA is the nation’s largest, Valparaíso. It was the only Chilean port mentioned in the ocean carrier survey. The dominant marine fuel supplier is Compañía de Petróleos de Chile S.A. (COPEC), which accounts for more than 60 percent of the bunker market.110 Seven out of ten vessels that load fuel in Chilean ports use COPEC’s Fuel Marine Service. Valparaíso The Port of Valparaíso is an important hub for shipping container freight and for exporting wine, copper, and fresh fruit. The port also is a destination for cruise ships and is home to the Chilean Navy. In addition to COPEC, the only other bunker fuel provider identified is ExxonMobil Marine Fuels Ltd. The analysis of the DNV data found that in 2006-2007 all 15 DMA stems analyzed had a sulfur content < 0.2%. The median sulfur content was < 0.05%. Although no responses to the bunker supplier survey were received, the DNV data indicate that Valparaíso could be a source of low-sulfur DMA in the near future. 5.2.4.2 Ecuador Guayaquil Guayaquil is the largest city and chief port of Ecuador. Opened in 1964, the port handles 93 percent of container traffic in and out the country and 62 percent of total import-export cargo, representing 453,000 TEUs and 5.1 million tons respectively. Guayaquil is ranked as the 13th largest port in Latin America and the Caribbean. Port facilities include a container terminal with three 185-meter berths and 290,879 square meters of paved area for containers. The Port also has a bulk terminal with one 155-meter pier, three silos, belt conveyors, three warehouses, and four liquid product tanks. This survey has identified the following bunker suppliers:
• Disequacorp SA • Marzam CIA Ltda. • Navipac SA • Servamain-Corpetrolsa • Vepamil SA • COPEC SA - Compañía de Petróleos de Chile SA
110 Fearnley Consultants, Op.Cit., p. 100.

47
• Maritima de Comercio SA. • Petro Ecuador
DNV did not provide any sulfur analysis data for Guayaquil, and no bunker supplier in Ecuador responded to the survey. Therefore, the ability of this port to supply low-sulfur DMA cannot be assessed at this time. 5.2.4.3 Panama Balboa The Port of Balboa is operated by Panama Ports Company, which is a member of Hutchinson Port Holdings.111 The Port handled 0.8 million TEUs in 2006, a 40 percent increase in cargo handling from 2005. When Maersk and the APL/MOL Alliance increased their transfer cargo, a Port-wide expansion was necessary.112 The survey identified the following nine bunker suppliers at Balboa:
• Chemoil Energy Corporation • Chemoil Latin America • Fuel and Marine Marketing Antilles Ltd. • Oldemar Trading Services • Peninsula Petroleum Ltd. • Petrocosta CI Ltda. • Repsol YPF Trading y Transporte SA. (RYTTSA) • Shell Marine Products U.S. Company • Triton Energy of Panama Corporation
About 21 percent of the 150 DMA stems analyzed by DNV in 2006-2007 had sulfur content ≤ 0.2%; the median sulfur content was 0.28%. The trend for the two years appears to be toward higher sulfur content. The bunker supplier responses indicated that Balboa is a potentially important source of low-sulfur DMA. Cristóbal The Port of Cristóbal is also operated by Panama Ports Company. The Port’s operations began in 1851 when the first wooden wharfs were built to unload workers and materials for the construction of a railroad. The Port can handle over 1.5 million TEUs of cargo per year.113 The following bunker facilities at Cristóbal were identified:
• Fuel and Marine Marketing Antilles Ltd. • Peninsula Petroleum Ltd. • Shell Marine Products U.S. Company
111 Panama Ports Company, www.hph.com.hk/business/ports/america/panama.htm. Accessed on January 15, 2008. 112 Business Panama, http://businesspanama.com/investing/opportunities/ports_maritime.php. Accessed on January
15, 2008. 113 Panama Ports Company, www.ppc.com.pa/cristobal.php. Accessed January 15, 2008.

48
Only about 3 percent of the DMA stems analyzed by DNV in Cristóbal had a sulfur content < 0.2%, and the median sulfur content was 0.44%. The bunker supplier responses indicated that Cristóbal is a potentially important source of low-sulfur DMA. 5.2.5 Middle East and Other 5.2.5.1 Australia Melbourne The Port of Melbourne, governed by the Port of Melbourne Corporation, is Australia’s largest port, handling nearly 38 percent of the country’s container trade and accepting 3,500 vessel calls annually. In 2006, the Port handled 2.1 million TEUs of cargo.114 The following are its bunker suppliers:
• Australia Bunkering Pty Ltd. • BP Australia Pty. Ltd. • Caltex Australia Ltd. • ExxonMobil Marine Fuels (Singapore) • Shell Australia Ltd.
All 31 DMA stems analyzed by DNV at Melbourne in 2006-2007 were < 0.2% sulfur, with a median sulfur concentration < 0.05%. No bunker supplier survey responses were received for this port, so it is necessary to rely solely on the DNV results. It appears that Melbourne may be a source of low-sulfur DMA in near future. 5.2.5.2 United Arab Emirates Fujairah Construction began at the Port of Fujairah in 1978, and operations began in 1983. Today, it is the largest port of the United Arab Emirates, an oil-rich nation.115 In 2006, the Port handled 15.5 million tons of bulk cargo, 29.5 million tons of oil, and more than 2,400 vessel calls.116 The Port of Fujairah is one of the top three bunkering facilities in the world, behind Rotterdam and Singapore. The following bunker supply companies at Fujairah were identified:
• Aegean Marine Petroleum LLC • Aegean Marine Petroleum SA • Akron Trade and Transport FZE • Avin International Bunkers Supply SA • Bominflot Fujairah LLC
114 Port of Melbourne, www.portofmelbourne.com. Accessed January 15, 2008. 115 Port of Fujairah, www.fujairahport.ae/overview/overview.cfm. Accessed on January 16, 2008. 116 Fujairah Government Portal, www.fujairah.ae/english/statistics.php. Accessed on January 16, 2008.

49
• ENOC Bunkering (Fujairah) LLC. • FAL Energy (UK) Ltd. FAL Energy Company Ltd. • Fuel and Marine Marketing Middle East Ltd. • Fujairah National Bunkering Company LLC • International Bunkering Middle East DMCC • International Supply • Khorkalba Marine Services • Monjasa A/S • MultiFlora Commodities Ltd. • Ocean Marine Services Inc. • Oil Marketing & Trading International LLC • Scandinavian Bunkering AS • Tameem Shipping LLC • Trident Energy LLC (Europe) • United Seas Marine Services.
Only about 5 percent of the 528 DMA stems analyzed by DNV at Fujairah in 2006-2007 had sulfur content ≤ 0.2%. The median sulfur content was 0.65%. Two of the three Fujairah bunker suppliers that responded to the survey indicated that they supply low-sulfur DMA. Given these contradictory results, availability of low-sulfur DMA at Fujairah is uncertain. 5.2.6 Summary of Fuel Availability Assessment for Surveyed Ports As discussed earlier, not all bunker suppliers in the survey were willing to provide actual sales volumes of low-sulfur DMA in 2007. They were concerned about sharing their sensitive market data with potential competitors. Table 5-8 summarizes the potential of low-sulfur DMA availability at each surveyed bunkering port. This summary table is based on the port-by-port assessment results and an extensive review of world fuel oil news, such as Bunker World News, World Bunkering, Sustainable Shipping, Reuters News Wire, and Energy Commodity Market News, etc. Factors considered in this qualitative assessment, in priority order, included the following:
• Number of low-sulfur DMA analyses from DNV PS fuel analysis data in 2006 and 2007;
• Median fuel sulfur percent values < 0.2% sulfur;
• Changes of low-sulfur DMA analyzed from 2006 to 2007; and
• Supplementary information showing potential supply of low-sulfur DMA to a particular port, assessment of local inventory, lead-time required for delivery, additional storage and delivery (e.g., barge) capacities.
Each port is assigned with a qualitative—high, medium or low—probability. High availability potential is defined as bunker supplier(s) who can easily provide fuels using either on-site

50
inventory or timely delivery. Low availability potential is assigned to suppliers who probably do not have any inventory and will require a long lead time for delivery. Medium availability potential is assigned for suppliers who are in between high and low probabilities. The result is shown in Table 5-8. The result indicates that European and North American ports surveyed might have better potential of providing low-sulfur DMA to ships, followed by Asian and Central American ports. The Middle East ports have a relative low availability. It should be noted that Brazilian Petrobras started providing low-sulfur DMA in Singapore in late 2007. Furthermore, China, Russia and India are gearing up to enter the world bunker market, even though information regarding these countries is still scarce due to their unique political systems. A world map of bunkering ports showing their relative locations to the San Pedro Bay Ports is provided in Figure 5-2.
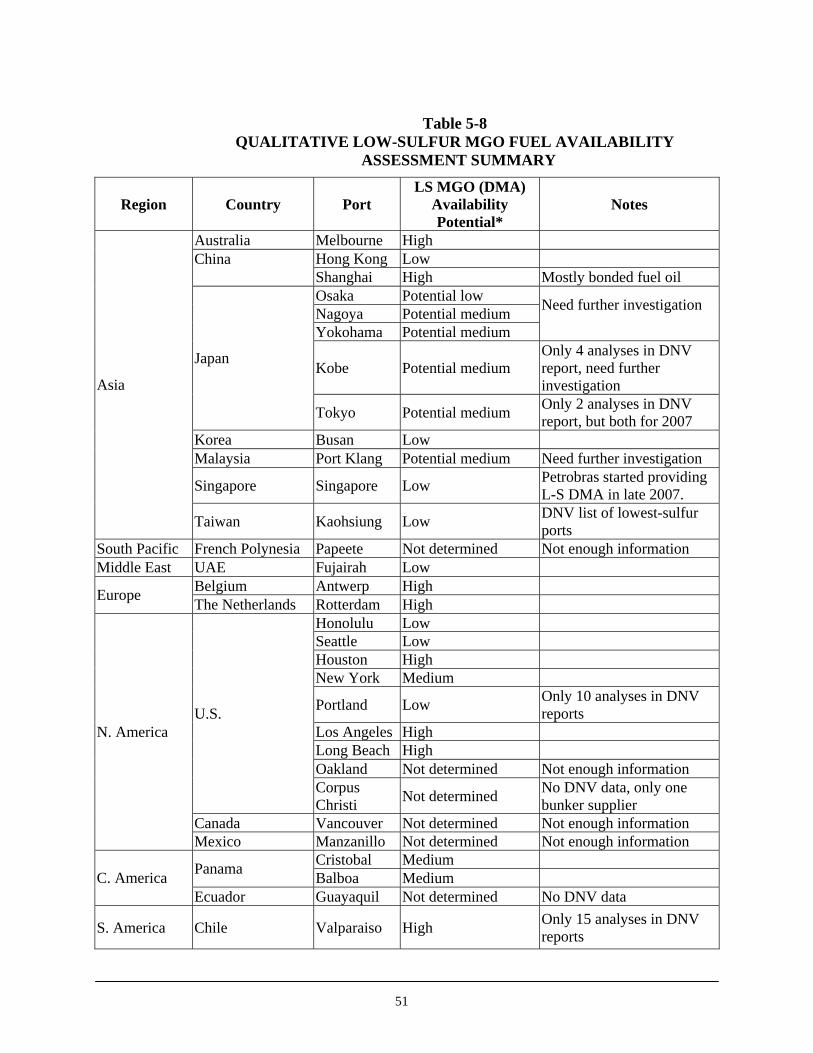
51
Table 5-8
QUALITATIVE LOW-SULFUR MGO FUEL AVAILABILITY ASSESSMENT SUMMARY
Region Country Port LS MGO (DMA)
Availability Potential*
Notes
Australia Melbourne High Hong Kong Low China
Shanghai High Mostly bonded fuel oil Osaka Potential low Nagoya Potential medium Yokohama Potential medium
Need further investigation
Kobe Potential medium Only 4 analyses in DNV report, need further investigation
Japan
Tokyo Potential medium Only 2 analyses in DNV report, but both for 2007
Korea Busan Low Malaysia Port Klang Potential medium Need further investigation
Singapore Singapore Low Petrobras started providing L-S DMA in late 2007.
Asia
Taiwan Kaohsiung Low DNV list of lowest-sulfur ports
South Pacific French Polynesia Papeete Not determined Not enough information Middle East UAE Fujairah Low
Belgium Antwerp High Europe The Netherlands Rotterdam High Honolulu Low Seattle Low Houston High New York Medium
Portland Low Only 10 analyses in DNV reports
Los Angeles High Long Beach High Oakland Not determined Not enough information
U.S.
Corpus Christi Not determined No DNV data, only one
bunker supplier Canada Vancouver Not determined Not enough information
N. America
Mexico Manzanillo Not determined Not enough information Cristobal Medium Panama Balboa Medium C. America
Ecuador Guayaquil Not determined No DNV data
S. America Chile Valparaiso High Only 15 analyses in DNV reports

52
Figure 5-2 GEOGRAPHICAL REPRESENTATION OF BUNKERING PORTS SURVEYED

53
5.3 Overview of World Refinery Capacity To assess the demand and supply relationships of low-sulfur DMA or MGO in the implementation of the CAAP OGV fuel standard control measures, one needs to look beyond the capacities of existing refineries and bunker suppliers. The MARPOL Annex VI SECA requirements, USEPA and California marine fuel rules, and the CAAP marine fuel requirements are expected to increase the demand for low-sulfur DMA substantially and to put a stress on the existing refinery system. Although the decision to adopt a uniform low-sulfur marine fuel requirement is still being debated in Europe, recent developments indicate that the IMO is inclined to adopt a world standard of switching to marine distillate from residual fuel to reduce emissions close to shore.117 Refineries and bunker fuel suppliers in Europe have claimed that they are ready to supply low-sulfur marine fuel to meet the demand created by the EU’s directives.118 Yet, this new demand may not be met in a timely fashion because an expansion or upgrade of any refinery unit normally takes four to five years from conceptual design to actual operation.119 Additionally, the overall investment for refineries to meet this demand is estimated at approximately $126 billion. 120 Therefore, an assessment of world refinery capacity is important to provide a worldwide perspective of the supply and demand relationships of low-sulfur marine fuel. This section will discuss existing world refinery capacity and future expansion. Refineries are generally located near major consumption areas. This enables them to respond to regional and seasonal (mostly weather-related) demands, maximizing the value of their petroleum products. Crude oil production is concentrated in the Middle East region, but the bulk of refining activities are located in the U.S., Europe, and Asia. Petroleum refining is a very complex industry. The configuration of each refinery depends upon its local or regional market needs. In most developed countries, refineries are maximizing their gasoline and low-sulfur diesel fuel outputs and minimizing output of lower-value products, such as residual fuel and petroleum coke.121 In the developing countries (e.g., China, Indonesia, Middle East and Russia), refineries tend to use straight-run distillation and produce relatively larger fractions of residual fuel.
5.3.1 Refinery Basics Figure 5-3 illustrates basic refinery concepts.122 Petroleum refining consists of a straightforward distillation process. Highly complex processing units, however, are normally required to convert intermediates to high-value final products. These processes include hydrotreating to remove sulfur and other impurities; catalytic, thermal or hydrocracking processes to separate light end products from heavy fractions; coking to convert vacuum residuals such as gas oil and coke 117 Bunker World News, “Refiners Face Immense Problems” March 29, 2007. 118 Bunker World News, “Europe Getting Ready For Low Sulfur Limit ”, December 21, 2007 119 Your Shipbuilding News. “US$67 Billion Price Tag for Switching Ships to Distillates-Only” September 25, 2007 120 Lloyd’s List. “IMP Panel Report Sees Big Role for Distillate” January 18, 2008 121 Bunker World News, “BP to Invest $130 Million in s Production” April 20, 2005 122 Rich Macrogliese, “Refining 101 – Refinery Basic Operation, Refining 201 – Solvent Deasphalting and
Reformers/CCRs”, Valero Corp. Management Presentation, January 14, 2008.

54
distillate to gasoline; visbreaking to convert atmospheric tower residuals to distillate and tar; and desulfurization to remove sulfur from final products.
Figure 5-3 BASIC REFINERY PROCESSES
5.3.2 Crude Oil Grades, Refinery Processes and Product Yields Crude oil is the major feedstock for all oil refineries. As shown in Table 5-9, different grades of crude produce different yields for each product category: gas, gasoline, distillate and heavy fuel oil, and other fractions.123 Refiners in the developed countries (e.g. U.S.) normally upgrade their facilities to produce higher value products (i.e., 49 percent gasoline yield). These processes (cracking, coking, etc.) can further refine intermediate products to high-value end products. More complex and sophisticated refining processes produce a higher yield of value-added products (gasoline and distillate) versus lower value products (heavy fuel and residual oil). Table 5-10 shows the product yields for different processes.
123 Ibid.

55
Table 5-9
CRUDE OIL TYPE AND PRODUCT YIELDS Crude Types Characteristics Yields 2006 U.S. Production
Light Sweet Crude (e.g., WTI, LLS, Brent)
>34 API Gravity <0.7% Sulfur 35% Demand Most expensive
Gas: 3% Gasoline: 32% Distillate: 30% Heavy fuel oil and others: 35%
Medium Sour Crude (e.g., Mars, Arab Light, Arab Medium, Urals)
24-34 API Gravity >0.7% Sulfur 50% Demand Less expensive
Gas: 2% Gasoline: 24% Distillate: 26% Heavy fuel oil and others: 48%
Heavy Sour Crude (e.g., Maya, Cerro Negro, Cold Lake, Western Canadian Select)
<244 API Gravity >0.7% Sulfur 15% Demand Least expensive
Gas: 1% Gasoline: 15% Distillate: 21% Heavy fuel oil and others: 63%
Gas: 8% Gasoline: 49% Distillate: 33% Heavy fuel oil and others: 10%
Table 5-10 REFINERY PROCESS AND PRODUCTION YIELDS
Refinery Process (% Yield) Product Hydroskimming/
Toppinga Crackingb Catalytic
Cracking / Deasphalting
Cokingc / Residual
DestructionPropane/Butane 4 8 9 7 Gasoline 30 45 56 58 Distillate 34 27 29 28 Heavy Fuel Oil and Other 32 24 11 15 Totald 100 104 105 108 a Hydroskimming refineries include hydrotreating (distillate desulfurizer) and catalytic-reforming units to improve the output of high value fuels such as distillate and gasoline. b Cracking refinery including and vacuum distillation, catalytic cracking, alkylation units in addition to
hydroskimming process. c Coking refineries extend the cracking refinery by adding hydrogen process, hydrocracker and delayed coking units to enhance the conversion of fuel oil into distillates. d Total yield greater than 100 percent is due to volumetric gain from these processes.

56
5.3.3 Current Status United States Refining Capacity Review of data published by the U.S. Department of Energy’s Energy Information Administration shows that the U.S. refinery capacity has exceeded 15 million barrels per day (bpd) for the last ten years, with a slightly increasing trend.124 As shown in Table 5-11, the U.S. refinery utilization rate was approximately 93 percent, indicating that spare operable capacity in the country was minimal.
Table 5-11 U.S. REFINERY UTILIZATION AND CAPACITY 1996-2006
Year
U.S. Gross Inputs to Refineries
(1000 Barrels Per
Day)
U. S. Operable Crude Oil Distillation Capacity
(1000 Barrels per Day)
U. S. Operating Crude Oil Distillation Capacity
(1000 Barrels per Day)
U. S. Idle Crude Oil Distillation Capacity
(1000 Barrels per Day)*
U.S. Percent Utilization of
Refinery Operable Capacity
(Percent)** 1996 14,337 15,239 15,066 173 94 1997 14,838 15,594 15,373 221 95 1998 15,113 15,802 15,596 207 96 1999 15,080 16,282 16,105 177 93 2000 15,299 16,525 16,251 274 93 2001 15,352 16,582 16,320 262 93 2002 15,180 16,744 16,457 287 91 2003 15508 16,748 16,667 80 93 2004 15,783 16,974 16,891 83 93 2005 15,578 17,196 16,763 432 91 2006 15,602 17,385 16,946 439 90 Average 15,243 16,461 16,221 240 93
* Idle Capacity: The component of operable capacity that is not in operation and not under active repair, but capable of being placed in operation within 30 days; and capacity not in operation but under active repair that can be completed within 90 days. ** Operable Capacity: The amount of capacity that, at the beginning of the period, is in operation; not in operation and not under active repair, but capable of being placed in operation within 30 days; or not in operation but under active repair that can be completed within 90 days. Operable capacity is the sum of the operating and idle capacity and is measured in barrels per calendar day or barrels per stream day. The number of refineries in the U.S. decreased from 179 in 1994 to 149 in 2004, a 17 percent reduction. (See Table 5-12.) Nevertheless, the operating crude oil distillation capacity remained fairly steady at 15 million bpd, indicating that the refineries were operating more efficiently.125 To meet any additional fuel demands, the refineries will need to invest in new construction. Currently, several companies are expanding their refining capacity in the U.S., including British
124 Energy Information Administration, Department of Energy, “U.S. Refinery Utilization and Capacity 1986-2006”
September 30, 2007. See also: http://tonto.eia.doe.gov/dnav/pet/pet_pnp_unc_dcu_nus_a.htm 125 Energy Information Administration, Department of Energy, “U.S. Refinery and Refining Capacity 1987-2004”
August 2004. See also: http://www.eia.doe.gov/emeu/finance/usi&to/downstream/update/#tab4

57
Petroleum (BP), Frontier, Marathon, Motiva, Sunoco, Tesoro, etc. Chevron does not have any plans to invest in new refinery construction.126
Table 5-12
TOTAL AND OPERATING REFINERIES IN THE U.S. 1994-2004 Number of Operable Refineries
Year Total Operating Percent 1994 179 171 96 1995 175 165 94 1996 170 162 95 1997 164 159 97 1998 164 n.a. - 1999 162 n.a. - 2000 158 155 98 2001 155 150 97 2002 153 144 94 2003 149 145 97 2004 149 146 98
Note: n.a. – data not available.
World Refining Capacity Table 5-13 shows the distribution of refineries and production by region. There are currently 681 refineries in the world. The total output of crude distillation is approximately 85 million barrels per calendar day127 (or approximately 4.5 billion tons per year).128 North America (e.g., Canada, Mexico and U.S.) has about 26 percent of the world’s refineries. The U.S. alone has 22 percent. Europe and North America combined represent 46 percent of the world’s refinery capacity. Refineries in three regions, North America, Europe and Asia/Oceania, represent 70 percent of the crude oil distillation, 83 percent of the catalytic cracking, 75 percent of the thermal cracking, and 76 percent of the world’s reforming capacity. Table 5-14 shows that the world refinery capacity increased over the last decade and is stabilized at around 85 million bpd capacity. Without any major investments in new refineries in the near future, this trend is very unlikely to change.
126 World Refining & Fuel Today, “List of Refinery Project Worldwide”. October 17, 2006. 127 Barrels per Calendar day: The amount of input that a distillation facility can process under usual operating
conditions. The amount is expressed in terms of capacity during a 24-hour period and reduces the maximum processing capability of all units at the facility under continuous operation to account for the limitations that may delay, interrupt, or slow down production, such as downstream processing units cannot absorb the output of upstream processing facilities, changes in types of grades of inputs to be processed, environmental constraints, scheduled downtime for routine inspection, maintenance and repair, and unscheduled downtime, such as mechanical problems.
128 Energy Information Administration, Department of Energy, “World Crude Refining Capacity, January 2006” August 6, 2007

58
TABLE 5-13
WORLD REFINERY POPULATION AND CAPACITY, 2007 1000 barrels per calendar day
Region/Country Number
of Refineries
Percent(%) Crude Oil
DistillationCatalytic Cracking
Thermal Cracking Reforming
North America 176 26 21,040 6,813 2,544 4,320 Central & South America 67 10 6,616 1,314 403 408 Europe 135 20 17,103 2,581 1,630 2,458 Eurasia 61 9 8,117 599 550 1,180 Middle East 42 6 7,034 360 537 652 Africa 45 7 3,230 211 71 476 Asia & Oceania 155 23 22,206 2,646 438 1,927 World Total 681 - 85,345 14,524 6,174 11,421
Table 5-14
WORLD REFINERY CAPACITY TREND, 1997-2007
Year Thousand Barrels per Calendar Day 1997 75,986 1998 78,030 1999 80,084 2000 81,529 2001 81,316 2002 81,444 2003 81,995 2004 82,258 2005 82,795 2006 85,345 2007 85,355
U.S. Versus European Fuel Use
To assess the worldwide capacity for producing low-sulfur marine distillate, it is important to recognize the difference in fuel consumption patterns of the two major world markets—the U.S. and Europe. As shown in Table 5-15, the U.S. market was clearly gasoline dominated in 2004, whereas the European Union (E.U.) had a more balanced fuel demand.129 Additionally, Asia and Oceania regions consumed more residual fuel oil (34 percent) than the North American (14 percent) and European (20 percent) regions. The U.S. consumed only 8.6 percent of world residual fuel oil. This difference has significant implication on the world’s refining industry.
U.S. refineries are more likely to use catalytic cracking to meet domestic gasoline demand. European refineries tend to include the hydrocracking process in their configuration to produce 129 Energy Information Administration, Department of Energy, “World Crude Oil Distillation Capacity,
1997-2007” June 29, 2007

59
middle distillate to meet their needs. European gasoline and diesel have a uniform sulfur content requirement (i.e. < 10 ppm). Despite the difference in fuel sulfur content in the U.S. and Europe, the demand for low-sulfur fuel creates additional demand for light or sweet crude oil supply, which is already in short supply and carries a high premium.130 Furthermore, increasing fuel demands from both China and India due to their recent economic growth will put additional pressure on the supply of world crude oil and refined products.
Table 5-15 WORLD APPARENT CONSUMPTION OF SELECTED REFINED PETROLEUM
PRODUCTS, 2004
Thousand Barrels per Day
Region/Country Motor Gasoline
Percent (%)
Distillate Fuel Oil
Percent (%)
Residual Fuel Oil
Percent (%)
United States 9,105.41 43.64 4,058.26 18.02 864.71 8.58 North America 10,431.63 49.99 4,923.24 21.86 1,412.71 14.01 Central & South America 1,013.56 4.86 1,646.69 7.31 816.22 8.10 Europe 2,876.33 13.78 6,230.44 27.67 2,036.82 20.21 Eurasia 937.86 4.49 854.96 3.80 673.52 6.68 Middle East 1,075.00 5.15 1,391.80 6.18 1,250.60 12.41 Africa 650.71 3.12 924.30 4.10 458.40 4.55 Asia & Oceania 3,880.87 18.60 6,546.50 29.07 3,432.07 34.05 World Total 20,865.96 22,517.93 10,080.34
5.3.4 Assessment of Future Expansion for Low-Sulfur Distillate Production To produce low-sulfur distillate, processes such as hydrotreating and hydrodesulfurization are required to remove sulfur from crude distillate. New construction of hydrotreating or hydrodesulfurization processes will provide an indication of the future capacity to produce low- sulfur marine fuel. The Oil and Gas Journal’s worldwide construction update for 2008 shows that most new hydrotreating and Desulfurization units will be built in Europe (Spain, Germany, Greece, Italy, and UK); Brazil; and the U.S.; and many will begin operating in 2009.131 Notably, the Brazilian Petrobras is a supplier of low-sulfur marine fuel in Asia. Currently, Petrobras supplies about 30,000 to 50,000 tonnes a month in addition to supplying other grades of low-sulfur fuel oils to regional utilities such as Taiwan.132 Therefore, the future supply of low-sulfur marine distillate will most likely come from these regions. Table 5-16 lists future worldwide construction of hydrotreating and desulfurization units.
130 Oxford-Princeton Newsletter, 2005. See also: http://www.osfordprinceton.com/newsletter/newsletter0205.html. 131 Oil and Gas Journal, “2007 World Refining Survey” and “Worldwide Construction Update”, December 24, 2007 132 Reuters News, “Brazil Petrobras to Lease Singapore Oil Storage”. December 3, 2007.

60
TABLE 5-16 WORLDWIDE HYDROTREATING AND DESULFURIZATION CONSTRUCTION,
2007
Country Project Added capacity(1000 bpd) Status* Expected
Completion Note
Spain Hydrodesulfurization 3357 E 2007 New and Revamp
United Kingdom Hydrotreater & Hydrodesulfurization 854 U 2009 New
Germany Desulfurization 800 P 2009 New Brazil Hydrodesulfurization 446 P & E 2009 Upgrade and New United States Hydrotreater 400 E 2007/2010 New Bangladesh Hydrotreater 270 P 2009 New Colombia Hydrodesulfurization 76 E 2009 Upgrade United Arab Emirates Hydrodesulfurization 70 U 2007 Upgrade
Kuwait Kerosene Hydrotreater & Naphtha Hydrotreater
64 E 2009 New
Taiwan Hydrotreater 50 P 2008 New Lithuania Hydrotreater 37 E 2007 Expansion China Hydrotreater 36 E 2011 New Bulgaria Hydrotreater 33 E 2009 New
Japan Naphtha Desulfurization 30 U 2007 New
Vietnam Hydrotreater 29 E 2009 New Turkey Hydrodesulfurization 28 U 2007 New Greece Hydrodesulfurization 27 E 2007 New Italy Desulfurization 12 E 2007 Expansion Belarus Hydrotreater 12 P 2009 New
Peru Naphtha Desulfurization 11 P 2012 New
Czech Republic Hydrodesulfurization 8 e 2007 New New Zealand Hydrotreater 7 E 2009 Expansion * E: Engineering, P: Planning, U: Under-construction 5.3.5 Refining Capacity Conclusions
• Refineries will gear up to produce higher-value products to meet the demand, therefore limiting the production of residual fuel;
• New refineries in the developed countries produce a small fraction (10 percent in the U.S.)
of residual fuel;
• Because of high demand for low-sulfur fuel in both Europe and North America, the residual fuel produced in these regions will be shipped eventually to regions such as Asia and Middle East for consumption, which will impact the global distribution and pricing of residual fuel;

61
• Because of stringent environmental requirements in developed countries, new refineries
are expected be built in developing countries with technology out-sourced from developed countries to capture low labor cost and lower overall production costs;
• Low-sulfur marine fuel, such as low-sulfur DMA, carries a very high premium; and
• If the price of low-sulfur DMA is comparable to fuels used by on-road mobile vehicles,
there might be an incentive for refineries to produce or to reformulate the product to meet the demand, creating a market competition between on-road and marine fuel use.
In summary, the world supply of low-sulfur DMA to meet the increasing demand is not likely to be a technical issue, but rather an economic one. The demand for low-sulfur DMA is more likely to be met by world refineries as long as there is a strong economic incentive.

62
6.0
COMPARISON OF DEMAND WITH SUPPLY
6.1 Near-Term (2008 and 2009) As discussed in Section 3, ships calling at the two San Pedro Bay ports would need between 828 and 938 tonnes of < 0.2% sulfur DMA in 2008 and between 7,534 and 11,104 tonnes in 2009, if the CAAP measures are implemented through a lease-based strategy up to 40 nautical miles from Point Fermin. If fuel requirements out to 40 nautical miles from Point Fermin are placed immediately on all vessels calling at the San Pedro Bay Ports up to 40 nautical miles (if implementation is through tariff or regulation), fuel demand will be as much as 229,734 to 241,306 tonnes. If low-sulfur DMA requirements are implemented immediately only for vessels within breakwater areas (mainly at-berth hotelling), fuel demand will be 152,610 tonnes. It was assumed that the low-sulfur DMA supply estimated in Section 5 will already be committed in 2009. Therefore, suppliers will have to increase their sales to satisfy the additional demand created by CAAP measures OGV3 and OGV4. The distribution of OGV trips to and from the San Pedro Bay ports is not geographically uniform. Therefore, the most meaningful comparison of demand with supply should be regionally specific. Ocean carriers constantly monitor the bunker spot market and select bunkering ports based on their ship routes, cargo loads, fuel prices and fuel availability. Ideally, information on the levels of regional marine fuel demand would be obtained from the ocean carriers, who have specific information on the types of fuel, specific bunkering ports and stem values for each ship in their fleets prior to arriving at the San Pedro Bay Ports in a given year. However, these data are rather sensitive and difficult to collect. Therefore, attempts were made to analyze the regional demand using data collected in the present study. Given the limited amount of data from this study’s surveys and from other sources, every approach considered for this regional demand allocation has some degree of uncertainty. Two available data sets were used: bunkering ports reported by the ocean carrier survey respondents and a compilation of vessel calls in 2005. For each data set a frequency distribution by pre-defined geographic region was determined. Regional fuel demands were estimated by multiplying total fuel demand (as reported in Section 3) by each region’s fraction of mentions or vessel calls. For estimating regional supply potentials, three data sets were used: 2007 sales volumes obtained from the survey of bunker suppliers; stem values, as discussed in Section 5.1.3; and regional sales capacities estimated from bunker supplier survey responses. Figure 6-1 illustrates the evaluation matrix for the six supply and demand scenarios. For each of the six scenarios, the four implementation options mentioned above were evaluated: lease-based in 2008; lease-based in 2009; required for all vessels out to the port breakwater; and required for all vessels out to 40 nautical miles from Point Fermin. These four demand (or implementation) options were selected to provide information that the ports can use in developing future program implementation options.

63
Figure 6-1 LOW-SULFUR FUEL DEMAND AND SUPPLY EVALUATION MATRIX
HOW DEMAND WAS ALLOCATED
By Numbers of Times Port Mentioned in Ocean Carrier Survey
By 2005 Vessel Calls from Port of Origin
Sales Reported in Bunker Supplier Survey � �
DNVPS Numbers of Stems Multiplied by Average
Stem Volume � �
SUPP
LY
EST
IMA
TE
B
ASI
S
Capacity Reported in
Bunker Supplier Survey � �
6.1.1 Estimation of Regional Demand for Low-Sulfur DMA The low-sulfur DMA demand forecasts cited in Section 3 are for the total annual fuel requirements for OGV3 and OGV4, and do not specify the regional distribution of this demand. Two approaches were used to estimate the regional distribution. The first approach was based upon information provided by the respondents to this study’s ocean carrier survey. It was assumed that the frequency with which bunkering ports were mentioned represents the regional fuel demand distribution. Forecasting from this approach is limited since the frequency of bunkering ports by ocean carries is known but the number of fueling events at a particular bunkering port is not The second approach was based upon a compilation of OGV vessel calls to and from the San Pedro Bay ports that was prepared for the 2005 POLA and POLB emission inventories. It was assumed that the vessel calls to and from ports represent the regional fuel demand distribution. The limitation of this approach is that only the originating ports are known; the actual bunkering ports are not.
2008
Lease -Based
2009
Lease-Based
Required for All Vessels Out to Port
Breakwater
Required for All Vessels Out to 40
Nautical Miles from Point Fermin

64
Although using either vessel calls or reported bunkering ports from the survey to estimate the regional demand distribution is not ideal, it does provide some insights into the regional fuel demand distribution. Given the lack of regional demand data and limited time available, these are considered the most practical options to provide useful analyses for comparing regional fuel demand and supply. To obtain consistent comparisons of fuel demand and supply, all bunkering ports were assigned to a region or country. For example, China included Hong Kong and Taiwan in addition to other Chinese ports. Indonesia, Malaysia, and the Philippines were placed in the “Asia-Others” region. The North American-West Coast region included ports on the west coast of the U.S. (including Alaska and Honolulu), Canada, and Mexico. Gulf coast and eastern ports of the U.S., Canada, and Mexico were under the “North-America-Others” region. Caribbean ports were under the Central and South America region. Estimate Based Upon Ocean Carrier Survey Data The ocean carriers that responded to the survey listed the ports where they refuel before coming to Los Angeles and/or Long Beach (see Table 6-1). The forecast for demand in 2008 and 2009 was apportioned to each foreign port in proportion to the number of times a specific port was reported in the survey responses.
Table 6-1
REPORTED BUNKERING PORTS STATISTICS
Region / Sub-region Number of Ports Percent of Ports Reported
Australia + South Pacific 2 2 China 26 21 Japan 14 11 Korea 10 8 Singapore 5 4 Asia-Others 1 1 Central America 10 8 South America 8 7 Middle East 1 1 Europe 5 4 North America - West Coast 37 30 North America – Others 4 3 Sum 123 100
Table 6-2 shows the regional demand estimated by this approach for the 2008 and 2009 lease-based scenarios and the two all-vessels-requirement scenarios.

65
Table 6-2 REGIONAL FUEL DEMAND ALLOCATION BASED UPON
NUMBER OF REPORTED BUNKERING PORTS
Demand in Tonnes
Region 2008
Lease-Based 2009
Lease-Based All Vessels to Breakwater
All Vessels to 40 nm
Australia + South Pacific 15 181 2,481 3,924China 198 2,347 32,259 51,008Japan 107 1,264 17,370 27,466Korea 76 903 12,407 19,618Singapore 38 451 6,204 9,809Asia-Others 8 90 1,241 1,962Central and South America 137 1,625 22,333 35,313Middle East 8 90 1,241 1,962Europe 38 451 6,204 9,809North America - West Coast 282 3,340 45,907 72,588North America - Others 31 361 4,963 7,847Sum 938 11,104 152,610 241,306 Estimate Based Upon Vessel Call Data In the second approach, the frequency of vessel calls by region of origin was calculated for POLA and POLB from a 2005 port-of-call data set from Marine Exchange that was used to support the 2005 POLA and POLB air emission inventories.133 The ports were placed into the regions as shown in Table 6-3. The number of port calls within a designated region was divided by the total number of calls to POLA/POLB to derive regional percentages. The distribution of combined vessels calls to POLA and/or POLB from each region was used to estimate regional demand. It was assumed that vessels approaching POLA/POLB obtained 50% of their required fuel in their originating regions and that all departing vessels refueled in San Pedro Bay Ports. The resulting demand by region is shown in the column labeled “Percent of Fuel” in Table 6-3. In effect, this approach established a weighted fuel demand distribution, with a higher weight for North America-West Coast. The total demand forecasts in Section 3 were then allocated to each region in proportion to that region’s weighted percentage of port calls. Table 6-4 shows the regional fuel demand distribution based upon vessel calls data.
133 Email transmittal of data from Heather Tomley, Port of Long Beach, California to Michael Rogozen,
UltraSystems Environmental Incorporated, Irvine, California, and Eddy Huang, Tetra Tech, Inc., Pasadena, California (February 21, 2008).

66
Table 6-3 VESSEL CALLS STATISTICS
POLA POLB Combined Region Vessel
Calls From
Percent of Calls
(%)
Vessel Calls From
Percent of Calls
(%)
Vessel Calls From
Percent of Calls
(%)
Percent of Fuel*
Australia/South Pacific 50 2 55 2 105 2 1.0China 575 22 392 14 967 18 9.1Japan 274 11 302 11 576 11 5.4Korea 264 10 340 12 604 11 5.7Singapore 51 2 7 0 58 1 0.5Asia Other 10 0 7 0 17 0 0.2Central and South America 310 12 330 12 640 12 6.1Middle East 7 0 9 0 16 0 0.2Europe 23 1 13 0 36 1 0.3North America-West Coast 962 37 1,059 39 2,021 38 69.1North America-Others 40 2 208 8 248 5 2.3Totals 2,566 100 2,722 100 5,288 100 100*It was assumed that departing vessels refueled in San Pedro Bay Ports (50% of fuel) and that vessels approaching POLA/POLB obtained fuel in their originating regions (the other 50%).
Table 6-4
FUEL DEMAND BY REGION USING VESSEL CALLS DATA
Demand (Tonnes) Region 2008
Lease-Based2009
Lease-BasedAll Vessels to Breakwater
All Vessels to 40 nm
Australia/South Pacific 9 110 1,515 2,396China 86 1,015 13,954 22,063Japan 51 605 8,312 13,142Korea 54 634 8,716 13,781Singapore 5 61 837 1,323Asia Other 2 18 245 388Central and South America 57 672 9,235 14,602Middle East 1 17 231 365Europe 3 38 519 821North America West Coast 648 7,672 105,468 166,719North America Other 22 262 3,579 5,704Totals 938 11,104 152,610 241,306

67
6.1.2 Estimation of Regional Supply of Low-Sulfur Fuel Regional supplies of low-sulfur fuel were estimated using the following information:
1. Low-sulfur DMA sales reported by bunker suppliers in this study; 2. Fuel sulfur analysis data obtained from DNVPS and average stem values; and 3. Low-sulfur DMA sales capacity reported by bunker suppliers in this study.
The first approach used the 2007 sales in each region, as reported by the bunker supplier survey respondents. Worldwide annual sales were 402,200 tonnes (see Table 5-2). One weakness of this approach is that low-sulfur DMA sales data were reported for only five of the eleven regions analyzed. Therefore, the projected overall supply amount is likely underestimated. The second approach used the fuel sulfur analysis data provided by DNV Petroleum Services. Each analysis represents one bunkering episode. For each region, the number of low-sulfur stems analyzed in that region’s ports was multiplied by an average stem value (240 tonnes). Based upon this approach, the estimated worldwide low-sulfur DMA supply was 224,400 tonnes. Since DNVPS only conducted about 70 percent of worldwide fuel sulfur content analyses, worldwide low-sulfur DMA sales were estimated by extrapolating the estimated tonnage from 70 percent to 100 percent. After scaling, the resulting estimate of worldwide supply is 320,571 tonnes (see Table 6-5).
Table 6-5 ESTIMATED LOW-SULFUR DMA SALES IN 2007 BY REGION USING DNV FUEL
DATA AND STEM VALUES
Region 2007 (Tonnes)
Adjusted 2007 (Tonnes)
Australia/South Pacific 4,800 6,857 China 9,360 13,371 Japan 3,360 4,800 Korea 6,240 8,914 Singapore 8,880 12,686 Asia-Other 6,000 8,571 Central and South America 5,760 8,229 Middle East 3,840 5,486 Europe 84,480 120,686 North America – West Coast 77,040 110,057 North America - Other 14,640 20,914 Totals 224,400 320,571
The third approach relied upon the low-sulfur DMA capacities reported by this study’s survey of bunker suppliers (Table 5-3). As discussed in Section 5.1.1, in certain cases sales were used instead of reported capacities.

68
6.2 Comparison of Demand with Supply 6.2.1 Regional Demand Estimate Based Upon Ocean Carrier Survey Data Regional demand estimated from the ocean carriers’ survey data is compared with regional supply estimates based on three types of information:
1. Low-sulfur DMA sales reported by respondents to the bunker suppliers survey; 2. Fuel supply estimated using DMVPS fuel sulfur analysis data and stem values; and 3. Low-sulfur DMA sales capacity reported by respondents to the bunker suppliers survey.
In the following tables, the relation between fuel demand and fuel supply is illustrated in color. Green designates a region that will need to increase its current supply by less than 50% to meet anticipated demand; yellow designates a required increase of more than 50% but less than 100%; and red denotes a region that will need to increase its current supply by more than 100% to meet projected demand. The following three tables compare regional demand under the 2008 lease-based, 2009 lease-based, and two all-vessel requirement scenarios with projected regional supply estimates based upon reported sales volumes (Table 6-6), total stem values (Table 6-7) and reported capacity data (Table 6-8). The metric for each comparison of supply with demand is the required percentage increase in supply over the demand in 2007.
Table 6-6 COMPARISON OF 2007 REPORTED SALES FROM BUNKER SUPPLIER SURVEY
WITH REGIONAL DEMAND
2008 Lease-based 2009 Lease-based All Vessels to Breakwater All Vessels to 40 nm
Region Supply (Tonnes) Regional
Demand (Tonnes)
Demand /
Supply
Regional Demand (Tonnes)
Demand /
Supply
Regional Demand (Tonnes)
Demand /
Supply
Regional Demand (Tonnes)
Demand /
Supply
Australia and South Pacific n.a. 15 n.a. 181 n.a. 2,481 n.a. 3,924 n.a.
China 60,000 198 0.33% 2,347 3.91% 32,259 53.77% 51,008 85.01% Japan 60,000 107 0.18% 1,264 2.11% 17,370 28.95% 27,466 45.78% Korea n.a. 76 n.a. 903 n.a. 12,407 n.a. 19,618 n.a. Singapore n.a. 38 n.a. 451 n.a. 6,204 n.a. 9,809 n.a. Asia - Others n.a. 8 n.a. 90 n.a. 1,241 n.a. 1,962 n.a. Central and South America 144,000 137 0.10% 1,625 1.13% 22,333 15.51% 35,313 24.52%
Middle East 20,000 8 0.04% 90 0.45% 1,241 6.20% 1,962 9.81% Europe n.a. 38 n.a. 451 n.a. 6,204 n.a. 9,809 n.a. North America - West Coast 118,200 282 0.24% 3,340 2.83% 45,907 38.84% 72,588 61.41%
North America - Others n.a. 31 n.a. 361 n.a. 4,963 n.a. 7,847 n.a.
Sum 402,200 938 11,104 152,610 241,306

69
TABLE 6-7 COMPARISON OF 2007 SALES FROM STEM VALUES WITH REGIONAL DEMAND
2008 Lease-based 2009 Lease-based All Vessels to
Breakwater All Vessels to 40 nm
Region Supply (Tonnes) Regional
Demand (Tonnes)
Demand /
Supply
Regional Demand (Tonnes)
Demand /
Supply
Regional Demand (Tonnes)
Demand /
Supply
Regional Demand (Tonnes)
Demand /
Supply Australia and South Pacific 6,857 15 0.22% 181 2.63% 2,481 36.19% 3,924 57.22%
China 13,371 198 1.48% 2,347 17.55% 32,259 241.25% 51,008 381.47% Japan 4,800 107 2.22% 1,264 26.33% 17,370 361.88% 27,466 572.20% Korea 8,914 76 0.86% 903 10.13% 12,407 139.18% 19,618 220.08% Singapore 12,686 38 0.30% 451 3.56% 6,204 48.90% 9,809 77.32% Asia - Others 8,571 8 0.09% 90 1.05% 1,241 14.48% 1,962 22.89% Central and South America 8,229 137 1.66% 1,625 19.75% 22,333 271.41% 35,313 429.13%
Middle East 5,486 8 0.14% 90 1.65% 1,241 22.62% 1,962 35.76% Europe 120,686 38 0.03% 451 0.37% 6,204 5.14% 9,809 8.13% North America - West Coast 110,057 282 0.26% 3,340 3.03% 45,907 41.71% 72,588 65.95%
North America - Others 20,914 31 0.15% 361 1.73% 4,963 23.73% 7,847 37.52%
Sum 320,571 938 - 11,104 - 152,610 - 241,306 -
Table 6-8
COMPARISON OF 2007 ESTIMATED CAPACITIES WITH REGIONAL DEMAND
2008 Lease-based 2009 Lease-based All Vessels to Breakwater All Vessels to 40 nm
Region Supply (Tonnes) Regional
Demand (Tonnes)
Demand /
Supply
Regional Demand (Tonnes)
Demand /
Supply
Regional Demand (Tonnes)
Demand /
Supply
Regional Demand (Tonnes)
Demand /
Supply Australia and South Pacific n.a. 15 n.a. 181 n.a. 2,481 n.a. 3,924 n.a.
China 66000 198 0.30% 2,347 3.56% 32,259 48.88% 51,008 77.28% Japan 102000 107 0.10% 1,264 1.24% 17,370 17.03% 27,466 26.93% Korea n.a. 76 n.a. 903 n.a. 12,407 n.a. 19,618 n.a. Singapore n.a. 38 n.a. 451 n.a. 6,204 n.a. 9,809 n.a. Asia - Others n.a. 8 n.a. 90 n.a. 1,241 n.a. 1,962 n.a. Central and South America
144000 137 0.10% 1,625 1.13% 22,333 15.51% 35,313 24.52%
Middle East 36000 8 0.02% 90 0.25% 1,241 3.45% 1,962 5.45% Europe n.a. 38 n.a. 451 n.a. 6,204 n.a. 9,809 n.a. North America - West Coast
556200 282 0.05% 3,340 0.60% 45,907 8.25% 72,588 13.05%
North America - Others
1620000 31 0.00% 361 0.02% 4,963 0.31% 7,847 0.48%
Sum 2,524,200 938 - 11,104 - 152,610 - 241,306 -

70
Please note that the survey-based supply estimates in Tables 6-6 and 6-8 were not made for Korea, Singapore, Asia-Others, and Europe because survey respondents did not report low-sulfur DMA sales or capacities for ports in those regions. In all three supply estimation scenarios, the projected supply appears to be adequate to meet regional demand for both the 2008 lease-based and 2009 lease-based cases. In the case in which all vessels within the breakwater were required to comply, however, China would be in slightly short supply when supply is based on projected sales volume. (See Table 6-6.) For the case in which all vessels would be required to comply within 40 nautical miles of Point Fermin, both China and North-America-West Coast will be in slightly short supply. For the two all-vessel requirement scenarios, combined with stem value-based supply estimates (Table 6-7), significant short supplies could occur for China, Japan, Korea, and Central and South America. Furthermore, for the all-vessel requirement out to 40 nautical miles, regions such as Australia and South Pacific, Singapore, and North America-West Coast would be in moderate short supply. Comparing demand with reported capacity-based supply (Table 6-8) shows that only China may have a moderate short supply. This may be significant since many vessels calling San Pedro Bay Ports originate from Asian and Central and South American ports.
6.2.2 Regional Demand Estimate Based Upon Vessel Calls Data Regional demand estimates based upon vessel calls data are compared with regional supplies for the aforementioned three supply scenarios. Projections of required region-specific supply increases over 2007 reported sales volumes, total stem values and capacity using vessel calls data for the 2008 lease-based, 2009 lease-based, and two all-vessel requirements demands are shown in Tables 6-9 through 6-11. The projected supplies appear to be adequate to meet regional demand for all the 2008 lease-based and 2009 lease-based cases and for the within-breakwater case of the capacity-based supply scenario. For the within-breakwater supply scenario based on survey sales (Table 6-9), there would be a moderate shortage in North America-West Coast. For the within-breakwater supply scenario based on DNVPS stem data (Table 6-10), there would be moderate shortages in Korea and in North America-West Coast and serious shortages in China, Japan, Central America, and South America. For all-vessel implementation out to 40 nautical miles from Point Fermin, supply would be adequate for demand in all regions only when the supply is estimated from capacities reported by the survey respondents. When supply estimates are based upon reported sales volumes, there would be a serious shortage in North America-West Coast (Table 6-9). When supply estimates are based upon DNVPS stem data, there would be serious supply shortages in China, Japan, Korea, Central America, South America, and North America-West Coast (Table 6-10).

71
Table 6-9
COMPARISON OF 2007 REPORTED SALES WITH REGIONAL DEMAND
2008 Lease-based 2009 Lease-based All Vessels to Breakwater All Vessels to 40 nm
Region Supply (Tonnes) Regional
Demand (Tonnes)
Demand /
Supply
Regional Demand (Tonnes)
Demand /
Supply
Regional Demand (Tonnes)
Demand /
Supply
Regional Demand (Tonnes)
Demand /
Supply Australia and South Pacific n.a. 9 n.a. 110 n.a. 1,515 n.a. 2,396 n.a.
China 60,000 86 0.14% 1,015 1.69% 13,954 23.26% 22,063 36.77% Japan 60,000 51 0.09% 605 1.01% 8,312 13.85% 13,142 21.90% Korea n.a. 54 n.a. 634 n.a. 8,716 n.a. 13,781 n.a. Singapore n.a. 5 n.a. 61 n.a. 837 n.a. 1,323 n.a. Asia - Others n.a. 2 n.a. 18 n.a. 245 n.a. 388 n.a. Central and South America 144,000 57 0.04% 672 0.47% 9,235 6.41% 14,602 10.14%
Middle East 20,000 1 0.01% 17 0.08% 231 1.15% 365 1.83% Europe n.a. 3 n.a. 38 n.a. 519 n.a. 821 n.a. North America - West Coast 118,200 648 0.55% 7,672 6.49% 105,468 89.23% 166,719 141.05%
North America - Others n.a. 22 n.a. 262 n.a. 3,579 n.a. 5,704 n.a.
Sum 402,200 938 - 11,104 - 152,610 241,306 -
Table 6-10
COMPARISON OF 2007 SALES FROM STEM VALUES WITH REGIONAL DEMAND
2008 Lease-based 2009 Lease-based All Vessels to Breakwater All Vessels to 40 nm
Region Supply (Tonnes) Regional
Demand (Tonnes)
Demand /
Supply
Regional Demand (Tonnes)
Demand /
Supply
Regional Demand (Tonnes)
Demand /
Supply
Regional Demand (Tonnes)
Demand /
Supply Australia and South Pacific 6,857 9 0.14% 110 1.61% 1,515 22.10% 2,396 34.94%
China 13,371 86 0.64% 1,015 7.59% 13,954 104.35% 22,063 165.00% Japan 4,800 51 1.06% 605 12.60% 8,312 173.16% 13,142 273.80% Korea 8,914 54 0.60% 634 7.11% 8,716 97.77% 13,781 154.60% Singapore 12,686 5 0.04% 61 0.48% 837 6.60% 1,323 10.43% Asia - Others 8,571 2 0.02% 18 0.21% 245 2.86% 388 4.53% Central and South America 8,229 57 0.69% 672 8.17% 9,235 112.23% 14,602 177.45%
Middle East 5,486 1 0.03% 17 0.31% 231 4.21% 365 6.65% Europe 120,686 3 0.00% 38 0.03% 519 0.43% 821 0.68% North America - West Coast 110,057 648 0.59% 7,672 6.97% 105,468 95.83% 166,719 151.48%
North America - Others 20,914 22 0.11% 262 1.26% 3,579 17.11% 5,704 27.27%
Sum 320,571 938 - 11,104 - 152,610 - 241,306 -

72
Table 6-11 COMPARISON OF 2007 CAPACITIES WITH REGIONAL DEMAND
2008 Lease-based 2009 Lease-based All Vessels to
Breakwater All Vessels to 40 nm
Region Supply (Tonnes) Regional
Demand (Tonnes)
Demand /
Supply
Regional Demand (Tonnes)
Demand /
Supply
Regional Demand (Tonnes)
Demand /
Supply
Regional Demand (Tonnes)
Demand /
Supply Australia and South Pacific n.a. 9 n.a. 110 n.a. 1,515 n.a. 2,396 n.a.
China 66,000 86 0.13% 1,015 1.54% 13,954 21.14% 22,063 33.43% Japan 102,000 51 0.05% 605 0.59% 8,312 8.15% 13,142 12.88% Korea n.a. 54 n.a. 634 n.a. 8,716 n.a. 13,781 n.a. Singapore n.a. 5 n.a. 61 n.a. 837 n.a. 1,323 n.a. Asia - Others n.a. 2 n.a. 18 n.a. 245 n.a. 388 n.a. Central and South America 144,000 57 0.04% 672 0.47% 9,235 6.41% 14,602 10.14%
Middle East 36,000 1 0.00% 17 0.05% 231 0.64% 365 1.01% Europe n.a. 3 n.a. 38 n.a. 519 n.a. 821 n.a. North America - West Coast 556,200 648 0.12% 7,672 1.38% 105,468 18.96% 166,719 29.97%
North America - Others 1,620,000 22 0.00% 262 0.02% 3,579 0.22% 5,704 0.35%
Sum 2,524,200 938 - 11,104 - 152,610 - 241,306 -
6.2.3 Summary of Comparison of Regional Demand With Supply Table 6-12 summarizes the results of the low-sulfur DMA regional demand and supply analysis. Each region was assigned a rank and a specific color for easy comparison (e.g., 3 and green means additional demand is less than 50% of existing supply; 2 and yellow means between 50% to 100%; and 1 and red means >100%). Table 6-12 also shows that regional supply is likely to be sufficient to meet the demand for low-sulfur DMA in 2008 and 2009 for CAAP measures OGV3 and OGV4 that are implemented through lease conditions. This conclusion pertains to all regions if the analysis is based on the supply estimated from the DNV stem data. For supply estimates based upon reported sales or capacity, the data are insufficient to conclude this for Australia & South Pacific, Korea, Singapore, Asia-Others, Europe, and North America-Others. Nevertheless, supplementary information (i.e. data not obtained through this study’s surveys) indicates that supplies may be adequate even in the regions where survey results were insufficient. For example, the E.U. requires that all marine vessels use MGO with a sulfur content < 0.1%, starting January 1, 2008. Therefore, supply is expected to rise to meet demand.134 In addition, companies such as the Brazilian refiner Petrobras started providing low-sulfur DMA in Singapore in late 2007.
134 “Europe getting ready for lower sulphur limit” Bunkerworld News (December 21, 2007).

73
If OGV3 and OGV4 are implemented immediately and simultaneously for all vessels, whether to 40 nautical miles from Point Fermin or to the breakwater, through tariffs, then obtaining low-sulfur DMA could be a problem in China, Japan, Korea, Central America, South America, and North America-West Coast in 2008 and 2009. The uncertainty in availability of low-sulfur DMA in a region, or even an actual deficiency, could be mitigated if OGVs obtain most of their fuel at POLA and/or POLB. Several respondents to the ocean carrier survey reported that they do or could maintain sufficient low-sulfur DMA on board their vessels to have a sufficient supply for their approaches, berthing, and departures from POLA and/or POLB. They refuel at the San Pedro Bay Ports. Furthermore, most ocean carriers have a dedicated department handling the bunkering business for ships in their fleet. They constantly monitor the bunker fuel spot market for fuel availability, quality, and price. In most cases, ocean carriers will purchase fuel in advance when the fuel price is favorable. Therefore, the ocean carriers should be able to plan and schedule their routes so that their vessels can be refueled at certain ports to maintain sufficient quantities of low-sulfur DMA before they arrive at the San Pedro Bay ports.

74
Table 6-12 SUMMARY OF LOW-SULFUR DMA REGIONAL DEMAND AND SUPPLY ANALYSES
2008 lease-based 2009 lease-based All Vessels to Breakwater All Vessels to 40 nm
Region Projected Supplies* Reported
Sales
DNV Sales
Volume
Capacity Based
Reported Sales
DNV Sales
Volume
Capacity Based
Reported Sales
DNV Sales
Volume
Capacity Based
Reported Sales
DNV Sales
Volume
Capacity Based
A n.a. 3 n.a. n.a. 3 n.a. n.a.. 3 n.a.. n.a. 2 n.a. Australia & South Pacific B n.a. 3 n.a. n.a. 3 n.a. n.a. 3 n.a. n.a. 3 n.a.
A 3 3 3 3 3 3 2 1 3 2 1 2 China B 3 3 3 3 3 3 3 1 3 2 1 3 A 3 3 3 3 3 3 3 1 3 3 1 3 Japan B 3 3 3 3 3 3 3 1 3 3 1 3 A n.a. 3 n.a. n.a. 3 n.a. n.a. 1 n.a. n.a. 1 n.a. Korea B n.a. 3 n.a. n.a. 3 n.a. n.a. 2 n.a. n.a. 1 n.a. A n.a. 3 n.a. n.a. 3 n.a. n.a. 3 n.a. n.a. 2 n.a. Singapore B n.a. 3 n.a. n.a. 3 n.a. n.a. 3 n.a. n.a. 3 n.a. A n.a. 3 n.a. n.a. 3 n.a. n.a. 3 n.a. n.a. 3 n.a. Asia-Others B n.a. 3 n.a. n.a. 3 n.a. n.a. 3 n.a. n.a. 3 n.a. A 3 3 3 3 3 3 3 1 3 3 1 3 Central & South
America B 3 3 3 3 3 3 3 1 3 3 1 3 A 3 3 3 3 3 3 3 3 3 3 3 3 Middle East B 3 3 3 3 3 3 3 3 3 3 3 3 A n.a. 3 n.a. n.a. 3 n.a. n.a. 3 n.a. n.a. 3 n.a. Europe B n.a. 3 n.a. n.a. 3 n.a. n.a. 3 n.a. n.a. 3 n.a. A 3 3 3 3 3 3 3 3 3 2 2 3 North America -
West Coast B 3 3 3 3 3 3 2 2 3 1 1 3 A n.a. 3 3 n.a. 3 3 n.a. 3 3 n.a. 3 3 North America -
Others B n.a. 3 3 n.a. 3 3 n.a. 3 3 n.a. 3 3 * Projected Supplies: A – Reported Bunkering Ports; B – Vessel Calls
75
6.3 Longer-Term (2010 and Beyond) The demand for low-sulfur DMA will increase as more leases are renewed and more OGVs are subject to OGV3 and OGV4 requirements. The Starcrest report, discussed in Section 3, estimated that “worst-case” incremental demand135 under the lease-based strategy would be 26,620 tonnes in 2010 and 39,785 tonnes in 2011. Although this demand would be a relatively small fraction of 2007 worldwide capacity and sales, additional demand is expected to be created by the ARB’s marine auxiliary engine regulation, which, if reinstated, requires using < 0.1% sulfur MGO by January 1, 2010. In addition, the proposed ARB main engine rule, as proposed in September 2007 and amended in March 2008, would limit fuel sulfur content as follows:
(1) Beginning July 1, 2009, use MGO with ≤ 1.5% sulfur or MDO having a sulfur content < 0.5%; and
(2) Beginning January 1, 2012, use MGO or MDO having a sulfur content < 0.1 to 0.2%.
Because the ARB’s regulation would apply to OGV operations in all State waters, non-CAAP-driven demand would increase and must be addressed for 2010 and beyond. It was beyond the scope of this study to forecast availability beyond 2009. It is reasonable, however, to expect that bunker fuel producers will increase their supply to keep up with demand, especially in Europe. After January 1, 2010, < 0.1% sulfur MGO cannot be marketed legally by suppliers in any member state of the E.U., per European Council directive 99/32/EC (See Section 2.2.1.).
135 Assuming that vessel speed reduction and use of low-sulfur DMA would be required out to 40 nautical miles
from Point Fermin.

76
7.0 FUEL COST ANALYSIS
7.1 Survey Results For this study, during November 2007 - January 2008, bunker suppliers were asked to report the price difference between low-sulfur DMA and IFO 180 and/or IFO 360. Twenty-four bunker suppliers answered this question, either as a single value or as a range. The responses were categorized into two groups by price range. For one group, which comprised the great majority of the responses, the minimum differential estimates were about $300 per tonne. For the other group, all the minima were below $100 per tonne and were as low as $14 per tonne. Follow-up calls were made to all the bunker facilities in the low-value group. In some cases, it turned out that the values had been reported incorrectly, and the survey result records were corrected accordingly. In the rest of the low-value cases, the survey respondent insisted that the reported value was correct. In every low-value case, a response was received from another bunkering facility in the same port or in the same country that was in the higher-value group. A possible explanation for the low values is that the responding bunker facility mistakenly reported the difference in price between IFO 180 and IFO 360. This value has recently been about $14 to $24 per tonne. Table 7-1 reports the price differentials that were considered valid. Thirteen of the 18 reported ranges (about 72 percent) were between $300 and $500 per tonne. Price differentials tended to be lower in the Middle East and higher in Europe. Using the midpoints of each range as an indicator of the average differential price, the median for IFO 180 and IFO 380 is $377.50 and $395.00 per tonne respectively. 7.2 Additional Price Information Additional information was obtained from a study of the relationship between sulfur content and marine fuel prices in Europe in 2006.136 In that year, the average IFO and low-sulfur DMA prices were $350 and $500 per tonne, respectively; the differential was about $150 per tonne. As seen in Table 7-1, the differential in Europe in 2007 was about $400 to $460 per tonne.137 Thus, not only have absolute prices of IFO and low-sulfur DMA increased, but also has the difference between them. Table 7-2 provides additional information from the 2006 European price study. Please note that this price differential is based on switching from 2.7% sulfur residual oil to lower sulfur residual oil (RO) or marine diesel oil (MDO), which is different from low-sulfur DMA. As expected, the price differential is slightly lower than that of switching to low-sulfur DMA. Additionally, the study was conducted in 2006, when bunkering fuel prices were generally much lower (approximately $300/tonne for IFO and $500/tonne for MDO) than current prices (approximately $500/tonne for IFO and $900/tonne for MGO).
136 European Commission, “Analysis of Policy Measures to Reduce Ship Emissions in the Context of the Revision of
the National Emissions Ceilings Directive” April 2007 137 With recent marine fuel price surges, European IFO and low-sulfur DMA prices have reached record highs of
$450 and $900 per tonne respectively.

77
Table 7-1 REPORTED PRICE DIFFERENTIALS BETWEEN LOW-SULFUR DMA AND IFO 180 AND IFO 380
Price Premiums in USD/Tonne Region IFO 180 IFO 380
Low High Low High 365.00 390.00 365.00 390.00 Central and South
America 365.00 390.00 365.00 390.00 300.00 500.00 300.00 500.00 China 400.00 400.00 400.00 400.00 400.00 450.00 400.00 450.00 440.00 460.00 440.00 460.00 Europe 440.00 460.00 440.00 460.00
Japan 400.00 500.00 400.00 500.00 294.00 294.00 Middle East 305.00 305.00 314.00 314.00
180.00 180.00 285.00 285.00 300.00 400.00 385.00 385.00 385.00 385.00
North America - West Coast
450.00 450.00
285.00 395.00 395.00 450.00
285.00 395.00 395.00 450.00
340.00 340.00 340.00 340.00 Singapore 350.00 400.00 350.00 400.00 Median Values 365.00 395.00 395.00 400.00
Table 7-2
PRICE PREMIUMS FOR LOW-SULFUR FUELS ON EUROPEAN MARKET IN 2006
(Switching from 2.7% Sulfur Content)
Sulfur Content Scenario Price Premium
(USD/ton) 1.5% MARPOL (for SECAs) 13 1.5% EU Directive 21 1.5% Residual marine fuel 28 0.5% Residual marine fuel 58 0.2% MDO (Switching from RO to MDO) 164 0.1% MDO (Switching from RO to MDO) 193
RO: Residual Oil; MDO: Marine diesel oil.

78
8.0 DISCUSSION AND CONCLUSIONS
This section discusses the survey methodology used in this study and potential measures to improve response rates; the assessment of bunkering ports identified; demand and supply of low-sulfur marine fuel; price differential and potential impacts; changes in the overall fuel market; and global and regional supply. 8.1 Survey Methodology and Response Rate In addition to literature reviews, this study designed and used a survey methodology that identified bunker suppliers by interviewing ocean carriers visiting the ports of Long Beach and Los Angeles. This approach provided key information on bunkering ports and bunker suppliers specifically related to the two ports. Furthermore, this study employed survey questionnaires and telephone interviews to obtain required information. It was a labor intensive process, but the surveyed companies did provide valuable and critical information about their operations. The survey contacted 37 ocean carriers and identified 37 bunkering ports. Questionnaires were provided to 237 bunkering companies at the identified bunkering ports, and interviews were conducted with many of them. Fifty bunkering companies responded to the survey, by email and/or by telephone interview, for a 21 percent response rate. A brief review of the survey literature found that email is considered to be an easy and popular communication tool for surveying, but typical response rates have been declining (from 62 percent in 1986 to 24 percent in 2000).138 The literature also indicated that the number of follow-up contacts has the most influence on response rates. Numerous attempts were made to follow up on non-responding companies in this study’s surveys. In the end, the 21 percent response rate for the bunkering facilities survey was consistent with this type of survey. Many respondents expressed concerns about providing what they considered to be sensitive business information, such as sales volume, capacity, pricing and future expansion plans. To reduce the reluctance of the companies participating in the survey, a confidentiality statement was prepared and submitted to the potential sample. This statement eased concerns for some, but not for all. For future studies, a statement regarding how to safeguard the collected information should be prepared before the actual survey/interview. Additionally, prior notification of the survey should be issued to the selected participants by the Ports or by the consultant on behalf of the Ports. The notification would give the potential respondents time to verify the legitimacy of the survey and to assemble information for their responses. 8.2 Identification of Bunkering Ports The bunkering ports listed in Table 4-2 were identified by the ocean carriers that were interviewed. Thus the survey’s findings were based upon actual operating practices. As a check on the list, information about the vessel boarding program used in the 2005 air emission inventory
138 Kim Sheehan, School of Journalism and Communication, University of Oregon, “Journal of Computer-Mediated
Communication: Email Survey Response Rate: A Review,” January 2001. See also: http://jcmc.indiana.edu/vol6/issue2/sheehan.html

79
update was reviewed. The inventory document indicated that the majority of the vessels interviewed had their vessels refueled in Los Angeles and Long Beach.139 The remaining bunkering ports included Balboa, Busan, Cristóbal, Oakland, Seattle/Tacoma, Singapore, Tokyo, and Yokohama. By comparing this list of ports with the bunkering ports identified in the present study, it is seen that the results reported in Table 4-2 are consistent with those of vessel staff interviews in the vessel boarding program. 8.3 Low-Sulfur Bunker Fuel Demand and Supply As discussed in Sections 3.0 and 6.0, the maximum short-term (2008/2009) incremental fuel demands (based on lease-based implementation of OGV3 and OGV4) are 828 and 938 tonnes of 0.2% sulfur DMA in 2008 and between 7,534 and 11,104 tonnes in 2009. These demands represent an increase of approximately 0.4 percent of worldwide capacity over 2007 levels based on the surveyed capacity. Moreover, the estimated 2005 vessel fuel consumption within the breakwater, which includes harbor maneuvering, at-berth hotelling and anchorage hotelling, for both ports is 152,610 tonnes. The majority of within-breakwater fuel consumption is for at-berth hotelling. A comparison of regional supply and demand indicates that the lease-based demand in 2008 and 2009 can probably be met by supply in all regions of the world. If, however, OGV3 and OGV4 are implemented immediately for all vessels up to 40 nautical miles from Point Fermin, then there could be supply shortfalls in China, Japan, Korea, Singapore, Central and South America, and North America-West Coast. There could be fuel shortages in these regions as well, if all vessels within the breakwater are required to use low-sulfur DMA. Under any demand scenario, the survey data indicate that Europe would have sufficient supply to meet the demand for ocean carriers visiting the San Pedro Bay ports. European-San Pedro Bay ship traffic, however, is expected to constitute a very small portion of the total. Data from the vessel boarding program indicate that almost all shipping lines prefer to refuel in the Long Beach/Los Angeles areas because of favorable prices and reliable quality. Additionally, most vessels departing from POLA and POLB will minimize their ballast water and bunker to increase carrying capacity. During the returning trip, the vessels can take up bunkers with a relatively low price as ballast to balance the empty container for stability consideration. Understanding the process by which ocean carriers determine where to refuel is important. This is, in fact, a major challenge for any shipping company. Many factors (price, fuel quality, local supply, lead time, route, cargo loading, ballast and vessel stability, geopolitical situations, etc.) will affect the final decision. Some shipping lines have a dedicated staff to assist vessel captains in selecting a bunkering port. One North American ocean carrier has voluntarily been using low-sulfur DMA within California waters. Its vessels normally refuel in Long Beach, Los Angeles, and Oakland with low-sulfur DMA because of favorable prices, good fuel quality, and availability. They normally carry sufficient fuel to make a round trip for their journey. Low-sulfur DMA has been available in 139 Starcrest Consulting Group, LLC. “Ports of Long Beach and Los Angeles – Vessel Calls Analysis”, October 25,
2007.

80
Japanese and European ports but normally has carried a very high premium. Furthermore, it has been difficult to obtain low-sulfur DMA in Singapore and Hong Kong.140 In the short term (2008–2009), vessels visiting the San Pedro Ports are likely to be refueled in North American ports such as Long Beach and Los Angeles. The additional demand for low-sulfur DMA created by OGV3 and OGV4 can be met by local refinery capacity or from out-of-state refineries. It is extremely difficult, if not impossible, however, to predict long-term fuel availability or supply and demand. Fuel availability is influenced not only by relatively predictable operational conditions (e.g., normal production, scheduled maintenance, etc.) but also by other less predictable conditions such as industrial accidents, shortage of feedstock, market and economic fluctuations, seasonal changes, consumer behavior, geopolitical influences, and political incidents (local, regional, and global). In future fuel availability studies, the focus should be to conduct in-depth consultation with local and/or regional bunkering suppliers and refineries to understand the long term demand and supply relationships when the CAAP OGV3 and OGV4 are implemented fully. 8.4 Price Differential Currently, it is estimated that the fuel cost is approximately 40 percent to 60 percent of a vessel’s overall operating cost. As noted in Section 7.2, European IFO and low-sulfur DMA have reached record highs of approximately $450/tonne and $900/tonne respectively. This price surge has almost doubled the fuel cost for shipping companies within a six-month period. Many ship owners have already imposed a surcharge on their customers to recover fuel price increases. Other companies are contemplating the idea of passing the additional cost of using low-sulfur DMA onto their customers as well. The European study described in Section 7.2 found that the price ratio between low-sulfur DMA and IFO in 2006 was about 1.5. In 2007, that ratio increased to about 2. As discussed in Section 7.1, the bunker supplier survey responses showed a worldwide average price differential of $379 to $395 per tonne between IFO and low-sulfur DMA. The historical price data indicate that the price differential between IFO and low-sulfur DMA may continue to widen with time. Therefore, $400/tonne will be a reasonable price differential between IFO and low-sulfur DMA to benchmark and to plan any financial impacts. This estimate should be reevaluated and updated periodically, however. 8.5 Changes in the Overall Fuel Market As discussed earlier, refiners are located typically at major consumption areas. Nevertheless, marine fuels can be shipped to any port of the world by a network of fuel traders, bunker suppliers, port facilities, and barge and tanker operators, if the price is favorable.
140 Personal communication between Ms. Lee Kingberg of Maersk and Mr. Howard Cheng of Ultrasystems on
October 29, 2007.

81
8.5.1 IFO versus Low-Sulfur DMA It is expected that residual fuel or IFO use will be reduced in North America and much of Europe in the near future. Although residual production by refineries in these two regions is small as compared to other parts of the world, the excess residual fuel will have to be sold to regions like Asia, unless the refiners will use it as feedstock to produce more refined products. The former case could force the market price downward due to its relative abundance. This shift could, in turn, impact the willingness of ship owners departing Asian bunkering ports to adopt low-sulfur DMA requirements, which carry a much higher premium. 8.5.2 Competition with On-Road Diesel Even though flashpoint is a concern for vessels using on-road low-sulfur diesel to replace IFO, on-road diesel could be a source of supply for marine vessels. Fuel reformers can blend the proper portion of different fuels to provide low-sulfur diesel with the required flashpoint. This may create a competition with on-road use of low-sulfur diesel. The discussion of actual impact of this competition is beyond the scope of this study, but it is important to know that the petroleum product market is stratified. When considering the supply and demand relationship, the market must be analyzed as a whole. 8.6 Global and Regional Supply As discussed in earlier sections, one of the key components in the marine fuel supply chain is refinery capacity. Industry experts understand that a complete changeover from RO to low-sulfur DMA in Europe and North America will pose a difficult challenge to refiners. From recent trade news and European refiners’ responses, however, the production changes will occur as long as there is a demand for them. Furthermore, from analyzing the existing refinery capacity and future expansion, clearly Brazilian, European, and Russian refiners are ready to provide low-sulfur DMA to meet the local demand. Unclear, however, is whether the local refiners in North America will expand their capacity to produce low-sulfur DMA in the near future due to stringent environmental requirements and lucrative gasoline markets. New refineries are expected be built in developing countries (e.g., Asian countries such as China, India, Indonesia, and Malaysia) with technology out-sourced from developed countries to capture lower labor and overall production costs. Additionally, low-sulfur DMA carries a very high premium. If the price of low-sulfur DMA is comparable to that of fuels used by on-road mobile vehicles, there might be an incentive for refineries to produce or to reformulate the product to meet the demand. This may create a market competition between on-road and marine fuel use, however,. In conclusion, implementing the proposed control measures and/or regulatory rules will definitely drive higher demand of low-sulfur DMA. World refineries will then consider expanding their capacity to meet such demand if there is a proper financial incentive, such as higher fuel premium. Therefore, meeting the increasing regional and global demand of low-sulfur DMA does not appear to be a technical issue but rather an economic one.

Appendix A:
Ocean Carrier Survey

QUESTIONS FOR OCEAN CARRIERS
First, at which port or ports do your ships typically visit bunkering facilities immediately before coming to Los Angeles or Long Beach? Who decides where and when the ships obtain their fuel; how much in advance of the trip is this decided? Are specific bunkering ports chosen primarily because:
They require the least travel time?
Their prices are best?
Both?
Other?
At each port before the ship arrives at Long Beach, what are the names of the bunkering facilities you use? Do you ever purchase distillate oil? If so, where? How much per visit? To your knowledge, at what ports is distillate fuel with a sulfur content of 0.2% or below available? If you were required to burn low-sulfur distillate, would you install dedicated tanks on your vessels? If so, would you load only enough for one trip to Los Angeles or Long Beach, or maintain a reserve supply? * If unsure please provide a person to contact regarding the matter. Thank you in advance for your prompt response.

Appendix B:
Bunker Supplier Survey

QUESTIONS FOR BUNKER SUPPLIERS
1. Do you supply fuel to ocean-going ships (Circle Yes or No)? Yes No If “No,” then you are done. Please email back this survey.
2. By any chance, did you respond to the October 2007 California Air Resources Board “Low Sulfur Marine Distillate Fuel Availability Survey?” Yes No
If “Yes,” please forward us a copy of your response.
3. What is your total storage capacity for marine fuels of all types (in tonnes)?
4. What are your typical monthly fuel deliveries for all fuels (in tonnes)?
5. How do you deliver fuel to ships (from dock to barge and from barge to ship, etc.)?
6. Once an order is placed what is the lead time until the fuel is supplied?
7. Do you provide distillate oil (MGO or DMA) to ocean-going vessels?
8. Do you provide distillate oil (MGO or DMA) with sulfur content less than or equal to 0.2% by weight (Low-Sulfur DMA) to ocean-going vessels?
9. If so, what is your maximum sales capacity for the following fuel types? 1) All DMA: per day _______ per month _______ 2) Low-sulfur DMA: per day _______ per month _______
10. If so, how much of the following fuel types did you sell to ocean-going vessels in 2006? 1) All DMA 2) Low-sulfur DMA
11. If so, what were your monthly sales in 2007 to date for the following fuel types? 1) All DMA 2) Low-sulfur DMA

12. What is the range of stem values (amount loaded per ship) when you sell low-sulfur MGO?
13. Is it necessary to build special facilities (tanks, pumps, piping, etc.) for the lower sulfur MGO?
14. What is the price premium (versus IFO 180 and/or IFO 380) for the 0.2% sulfur MGO?
15. Who supplies you with the fuel(s) that you sell to ocean carriers? (List suppliers by type of fuel)
16. If you do not supply DMA or DMA with less than 0.2% S, then what are the obstacles preventing you from doing so?

Appendix C:
Refinery Survey

QUESTIONS FOR REFINERS
What is your current worldwide “annual production capacity” for MGO (worldwide)? If you have overseas production facilities, can you break it down by regions (i.e., Asia-Pacific, Middle East, Europe and Americas)? What is the approximate breakdown of your MGO “sales” by region of the world? Do you supply MGO directly or through one or more other parties? Please describe the supply chain and sales percentages (i.e., direct sales vs. sale to bunkering facilities). Do you have plans to produce 0.2% S (by weight) MGO in the near future? If so, when will units come on line and at what designed production capacity (tons/day or barrels/day)? If not, what sulfur content of MGO, i.e., 1%; 0.5%, will you produce or not at all? Are you aware of the CARB ship auxiliary and main engine rules (which requires the use of <0.5% S (w/w) marine fuel effective in 2007 and the use of <0.1% S marine fuel in 2010), and European Union Directive 2005/33/EC (which will require the use of < 0.1% sulfur fuel for ships at dockside in EU countries starting in 2010)? Does your company have any plan to invest in major infrastructure improvements, such as additional production and/or Desulfurization units, storage tanks, pumps, pipelines, to produce low sulfur marine fuels to meet the demand by regulation? If so, when? Would you need to locate certain source of crude oil to produce 0.2% or lower S (w/w) MGO? What is the typical time from the decision to start a very low-sulfur line to full-scale production? Is there any other information you can provide to assist us completing this study? * If unsure please provide a person to contact regarding the matter.

Appendix D:
Fuel Consumption Study

SAN PEDRO BAY PORTS 2005
OGV FUEL CONSUMPTION ESTIMATES
January 2008
Prepared by:
Starcrest Consulting Group, LLC P.O. Box 434
Poulsbo, WA 98370

SAN PEDRO BAY PORTS 2005 OGV FUEL CONSUMPTION ESTIMATES
Starcrest Consulting Group, LLC January 2008
TABLE OF CONTENTS
Ocean-Going Vessel Fuel Consumption Estimation ...................................................................... 1
FUEL CONSUMPTION METHODOLOGY.................................................................................. 1 FUEL CONSUMPTION SUMMARY TABLES ............................................................................. 3
LIST OF FIGURES
Figure 1: Geographical Area ................................................................................................... 1
LIST OF TABLES Table 1: Matrix of Power Plant versus Mode of Operation ....................................................2 Table 2: Break Specific Fuel Consumption Values, g/kW-hr ...............................................3 Table 3: Main Engine Fuel Consumption for 2005 Port of Los Angeles OGV, metric tons .4 Table 4: Auxiliary Engine Fuel Consumption for 2005 Port of Los Angeles OGV, MT .......5 Table 5: Auxiliary Boiler Fuel Consumption for 2005 Port of Los Angeles OGV, metric tons...................................................................................................................................................6 Table 6: Main Engine Fuel Consumption for 2005 Port of Long Beach OGV, metric tons..7 Table 7: Auxiliary Engine Fuel Consumption for 2005 Port of Long Beach OGV, MT........8 Table 8: Auxiliary Boiler Fuel Consumption for 2005 Port of Long Beach OGV, metric tons...................................................................................................................................................9 Table 9: Main Engine Fuel Consumption for 2005 Anchorages Not Associated with San Pedro Bay Ports, metric tons................................................................................................... 10 Table 10: Auxiliary Engine Fuel Consumption for 2005 Anchorages Not Associated with San Pedro Bay Ports, metric tons ............................................................................................ 11 Table 11: Auxiliary Boilers Fuel Consumption for 2005 Anchorages Not Associated with San Pedro Bay Ports, metric tons ............................................................................................ 12 Table 12: Summary of Fuel Consumption for 2005 Vessels at San Pedro Bay Ports, metric tons........................................................................................................................................... 13 Table 13: Comparison of Fuel Consumption for 2005 and 2006 Vessels at San Pedro Bay Ports, metric tons..................................................................................................................... 14 Table 14: 0.2% Sulfur MGO Fuel Consumption OGV-1, 3, & 4 (20 nm), metric tons ......... 14 Table 15: 0.2% Sulfur MGO Fuel Consumption OGV-1, 3, & 4 (40 nm), metric tons ......... 15

SAN PEDRO BAY PORTS 2005 OGV FUEL CONSUMPTION ESTIMATES
Starcrest Consulting Group, LLC 1 January 2008
OCEAN-GOING VESSEL FUEL CONSUMPTION ESTIMATION The purpose of this study was to estimate fuel consumed by ocean-going vessels within the greater San Pedro Bay area for the vessels that called the San Pedro Bay Ports in 2005 in order to understand local vessel fuel demand. The results of the analysis are presented as fuel consumption for vessels operating within discrete geographic areas, as follows:
• At berth
• Anchorage
• Harbor (within breakwater)
• Precautionary Zone (PZ)
• PZ to 20 nm from Point Fermin
• 20 nm to 40 nm
The figure shows the fairway in white which is the zone that is up to 40 nm from Point Fermin. The small grey area near the land is the precautionary zone (PZ). The anchorage is located outside the breakwater. The berths for each Port are located inside the breakwater.
Figure 1: Geographical Area
Fuel Consumption Methodology The method was to utilize power and energy estimates already developed for the 2005 Inventory of Air Emissions, and then apply them to specific fuel consumption factors. The following matrix was used to define power plant and mode of operation:

SAN PEDRO BAY PORTS 2005 OGV FUEL CONSUMPTION ESTIMATES
Starcrest Consulting Group, LLC 2 January 2008
Table 1: Matrix of Power Plant versus Mode of Operation
Geographical Area Main Aux Boiler PZ to 40 nm from Pt. Fermin Precautionary Zone (PZ) Harbor Maneuvering Hotelling - Berth Hotelling - Anchorage
No auxiliary boiler emissions are assumed during the at-sea modes (40 nm to the harbor gate) since vessels are equipped with an exhaust gas recovery system or economizer that uses main engine exhaust gas for heating. Maneuvering includes mostly movements within the harbor although a few movements between the anchorages and the inner harbor were included. Boilers are used at reduced speeds, such as during maneuvering and when the vessels are at Port and the main engines are shut down. Hotelling was divided into dockside (berth) and anchorage. Fuels were taken into account with Entec factors and data gathered during the vessel boarding program (VBP). In general, Entec distinguishes between residual oil and marine distillates, where distillates may be of any kind. Care was taken so that ships having alternative means of power (AMP, or “cold ironing”) would be set to zero for all berth hotelling. The following table summarizes the specific fuel consumption values found in Entec Report141 (Tables 2.8-2.10).
141 Entec, Quantification of Emissions from Ships Associated with Ship Movements between Ports in the European Community, Final Report, July 2002. Prepared for the European Commission.

SAN PEDRO BAY PORTS 2005 OGV FUEL CONSUMPTION ESTIMATES
Starcrest Consulting Group, LLC 3 January 2008
Table 2: Break Specific Fuel Consumption Values, g/kW-hr
Engine Type Fuel Type Main Engine Main Engine Auxiliary EngineAt Sea Maneuvering
Slow Speed Distillate 185 204 naSlow Speed Residual 195 215 naMedium Speed Distillate 203 223 217Medium Speed Residual 213 234 217Gas Turbine Distillate 290 319 naGas Turbine Residual 305 336 naSteamship Distillate 290 319 naSteamship Residual 305 336 na
Specific Fuel Consumption
All of the calculations included in this analysis underwent a Q/A and Q/C review. This review verified that there would be zero fuel consumed where there were no checkmarks as indicated in Table 1. Also, maximum and average values were analyzed to verify if any outliers or mistakes may have been present. A few VSR speeds provided by MarEx (less than 12 records) were identified as having ship speed of over 100 knots possibly due to encoding error and were reset to a default of 12 knots. Fuel Consumption Summary Tables Total fuel consumption (metric tons) for the ocean going vessels that called each Port in 2005 by vessel type, engine type and geographical area are provided separately and summarized in Tables 3 through 8 by Port and engine type. Each engine table includes two columns for the 20 to 40 nm fuel consumption estimates due to use of two different speed scenarios. The first scenario highlighted in grey is fuel consumption using sea speed in the 20 to 40 nm zone which is an overestimate since vessels reduce/increase speed over the 20 nm to the desired speed. The second scenario uses averages from actual speeds recorded by MarEx in early 2001 prior to the implementation of the vessel speed reduction (VSR) program. Both estimates are provided because actual speeds are not currently monitored in the 20 to 40 nm zone. The conservative analysis, using sea speed, has been used previously for the ports’ baseline emissions inventory work, however, the actual speeds from the survey may provide a more realistic fuel consumption estimate.

SAN PEDRO BAY PORTS 2005 OGV FUEL CONSUMPTION ESTIMATES
Starcrest Consulting Group, LLC 4 January 2008
Due to port congestion, awaiting orders to dock, bunkers, repairs, hold cleaning, and inspection many ships arrived and departed from the federal anchorage. When at anchorage, the main engines are turned off but the auxiliaries keep running, similar to hotelling at dockside. It is important to track activity, emissions, and fuel consumption separately for the anchorages, since they are located offshore in fixed locations and with few exceptions, not within port boundaries. To the extent possible, these anchorage events are associated to a berth, terminal, and port using next or last berth visit logic. These Port associated anchorage events are included in Tables 3-8. However in some instances, a ship call cannot be associated with a berth simply because it arrived, anchored, and departed back out to sea without visiting a port berth. (Additional data representing power demand or energy consumption in kW-hrs corresponding to the below tables (Tables 3– 8) can be found in Appendix A.)
Table 3: Main Engine Fuel Consumption for 2005 Port of Los Angeles OGV, metric tons
Vessel Type 20 to 40 nm 20 to 40 nm PZ to 20 nm PZ Harbor Berth Anchorage
(sea speed) (avg speed) Maneuvering Hotelling HotellingAuto Carrier 267 247 281 24 19 0 0Bulk - General 776 772 861 125 49 0 0Bulk - Heavy Load 8 8 8 1 0 0 0Bulk Wood Chips 12 13 16 2 1 0 0Container - 1000 935 997 444 119 32 0 0Container - 2000 1,410 1,206 1,199 142 63 0 0Container - 3000 2,333 1,849 1,726 230 119 0 0Container - 4000 4,013 2,578 2,253 317 167 0 0Container - 5000 2,439 1,475 1,171 184 105 0 0Container - 6000 1,763 1,088 885 136 80 0 0Container - 7000 806 494 561 59 30 0 0Container - 8000 15 9 10 1 2 0 0Cruise 4,553 1,973 1,310 459 154 0 0General Cargo 274 274 317 39 17 0 0Ocean Tugs 200 200 229 37 12 0 0Miscellaneous 21 15 14 3 1 0 0Reefer 275 200 92 25 10 0 0RoRo 20 14 13 2 1 0 0Tanker - General 349 321 330 50 21 0 0Tanker - Chemical 138 128 163 21 7 0 0Tanker - Crude - Aframax 30 28 27 4 3 0 0Tanker - Crude - Handyboat 74 73 62 12 4 0 0Tanker - Crude - Panamax 68 69 52 10 5 0 0Tanker - Oil Products 454 444 534 76 30 0 0Total 21,236 14,474 12,557 2,077 933 0 0
Fuel Consumption, Metric Tons

SAN PEDRO BAY PORTS 2005 OGV FUEL CONSUMPTION ESTIMATES
Starcrest Consulting Group, LLC 5 January 2008
Table 4: Auxiliary Engine Fuel Consumption for 2005 Port of Los Angeles OGV, MT
Vessel Type 20 to 40 nm 20 to 40 nm PZ to 20 nm PZ Harbor Berth Anchorage(sea speed) (avg speed) Maneuvering Hotelling Hotelling
Auto Carrier 15 16 33 11 44 200 8Bulk - General 37 37 51 20 82 1,369 274Bulk - Heavy Load 0 0 0 0 1 12 1Bulk Wood Chips 1 1 1 0 1 37 4Container - 1000 40 39 37 22 88 785 63Container - 2000 52 57 113 32 186 1,437 66Container - 3000 87 97 239 57 383 2,985 103Container - 4000 137 171 395 100 636 5,198 58Container - 5000 104 133 369 78 534 7,700 36Container - 6000 73 93 258 55 401 4,462 21Container - 7000 32 40 98 24 149 1,822 9Container - 8000 1 1 2 0 10 40 0Cruise 1,009 1,546 932 620 947 5,038 3General Cargo 15 15 20 8 37 502 93Ocean Tugs 3 3 5 2 8 51 18Miscellaneous 1 1 2 1 2 29 1Reefer 19 23 14 13 55 793 48RoRo 1 1 1 0 2 16 1Tanker - General 35 36 42 19 49 514 295Tanker - Chemical 14 14 21 8 15 151 30Tanker - Crude - Aframax 2 2 3 1 4 26 100Tanker - Crude - Handyboat 8 8 9 5 10 121 30Tanker - Crude - Panamax 5 5 5 3 8 112 29Tanker - Oil Products 38 38 55 22 55 677 228Total 1,726 2,377 2,703 1,098 3,708 34,077 1,518
Fuel Consumption, Metric Tons

SAN PEDRO BAY PORTS 2005 OGV FUEL CONSUMPTION ESTIMATES
Starcrest Consulting Group, LLC 6 January 2008
Table 5: Auxiliary Boiler Fuel Consumption for 2005 Port of Los Angeles OGV, metric tons
Vessel Type20 to 40
nmPZ to 20
nm PZHarbor
ManeuveringBerth
HotellingAnchorage Hotelling
Auto Carrier 0 0 0 15 138 5Bulk - General 0 0 0 15 505 102Bulk - Heavy Load 0 0 0 0 8 0Bulk Wood Chips 0 0 0 0 14 2Container - 1000 0 0 0 48 1,191 103Container - 2000 0 0 0 52 1,107 51Container - 3000 0 0 0 92 1,985 69Container - 4000 0 0 0 120 2,738 30Container - 5000 0 0 0 67 2,674 13Container - 6000 0 0 0 43 1,341 6Container - 7000 0 0 0 15 503 3Container - 8000 0 0 0 1 11 0Cruise 0 0 0 150 1,004 1General Cargo 0 0 0 22 603 110Ocean Tugs 0 0 0 0 0 0Miscellaneous 0 0 0 1 37 1Reefer 0 0 0 22 441 30RoRo 0 0 0 0 3 0Tanker - General 0 0 0 34 3,700 281Tanker - Chemical 0 0 0 12 1,126 31Tanker - Crude - Aframax 0 0 0 2 164 89Tanker - Crude - Handyboat 0 0 0 8 938 31Tanker - Crude - Panamax 0 0 0 5 672 24Tanker - Oil Products 0 0 0 41 5,096 229Total 0 0 0 765 26,000 1,209
Fuel Consumption, Metric Tons
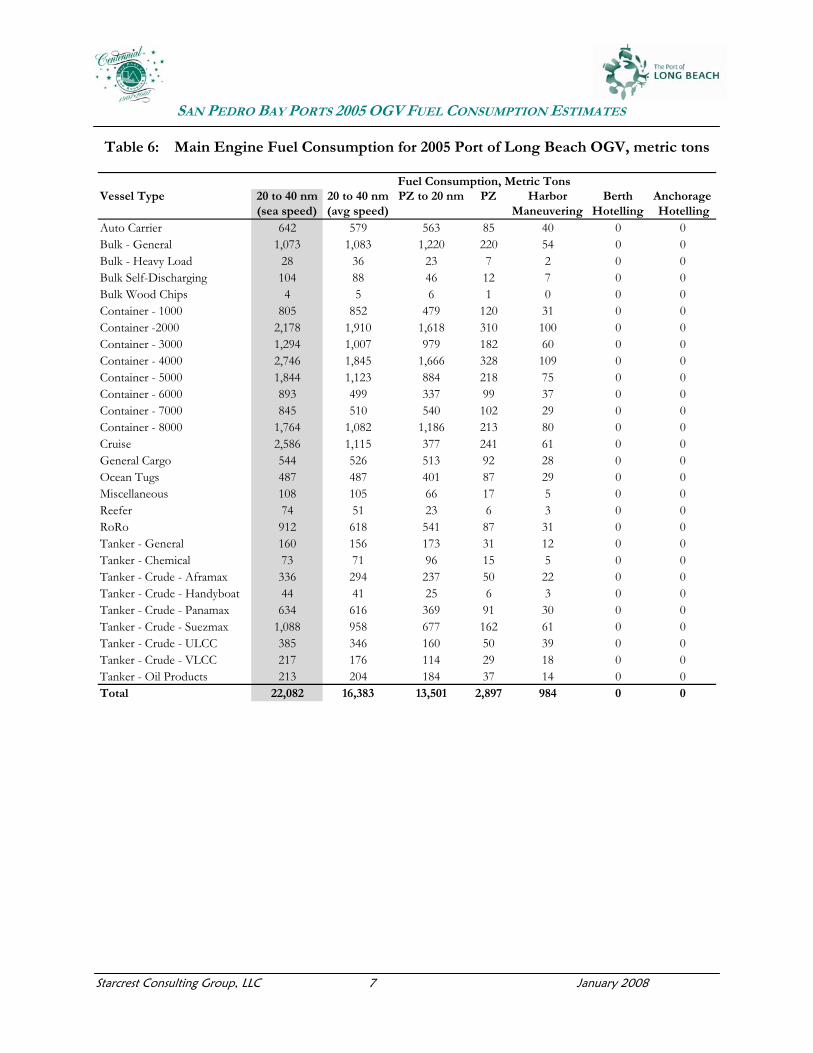
SAN PEDRO BAY PORTS 2005 OGV FUEL CONSUMPTION ESTIMATES
Starcrest Consulting Group, LLC 7 January 2008
Table 6: Main Engine Fuel Consumption for 2005 Port of Long Beach OGV, metric tons
Vessel Type 20 to 40 nm 20 to 40 nm PZ to 20 nm PZ Harbor Berth Anchorage(sea speed) (avg speed) Maneuvering Hotelling Hotelling
Auto Carrier 642 579 563 85 40 0 0Bulk - General 1,073 1,083 1,220 220 54 0 0Bulk - Heavy Load 28 36 23 7 2 0 0Bulk Self-Discharging 104 88 46 12 7 0 0Bulk Wood Chips 4 5 6 1 0 0 0Container - 1000 805 852 479 120 31 0 0Container -2000 2,178 1,910 1,618 310 100 0 0Container - 3000 1,294 1,007 979 182 60 0 0Container - 4000 2,746 1,845 1,666 328 109 0 0Container - 5000 1,844 1,123 884 218 75 0 0Container - 6000 893 499 337 99 37 0 0Container - 7000 845 510 540 102 29 0 0Container - 8000 1,764 1,082 1,186 213 80 0 0Cruise 2,586 1,115 377 241 61 0 0General Cargo 544 526 513 92 28 0 0Ocean Tugs 487 487 401 87 29 0 0Miscellaneous 108 105 66 17 5 0 0Reefer 74 51 23 6 3 0 0RoRo 912 618 541 87 31 0 0Tanker - General 160 156 173 31 12 0 0Tanker - Chemical 73 71 96 15 5 0 0Tanker - Crude - Aframax 336 294 237 50 22 0 0Tanker - Crude - Handyboat 44 41 25 6 3 0 0Tanker - Crude - Panamax 634 616 369 91 30 0 0Tanker - Crude - Suezmax 1,088 958 677 162 61 0 0Tanker - Crude - ULCC 385 346 160 50 39 0 0Tanker - Crude - VLCC 217 176 114 29 18 0 0Tanker - Oil Products 213 204 184 37 14 0 0Total 22,082 16,383 13,501 2,897 984 0 0
Fuel Consumption, Metric Tons

SAN PEDRO BAY PORTS 2005 OGV FUEL CONSUMPTION ESTIMATES
Starcrest Consulting Group, LLC 8 January 2008
Table 7: Auxiliary Engine Fuel Consumption for 2005 Port of Long Beach OGV, MT
Vessel Type 20 to 40 nm 20 to 40 nm PZ to 20 nm PZ Harbor Berth Anchorage(sea speed) (avg speed) Maneuvering Hotelling Hotelling
Auto Carrier 37 39 84 39 94 388 27Bulk - General 51 51 73 35 89 2,372 910Bulk - Heavy Load 1 1 2 1 3 38 43Bulk Self-Discharging 7 7 4 3 13 94 4Bulk Wood Chips 0 0 0 0 0 22 1Container - 1000 29 29 40 19 75 397 61Container -2000 93 99 167 75 338 2,518 131Container - 3000 50 57 120 48 202 1,722 93Container - 4000 92 112 232 93 407 3,604 87Container - 5000 76 97 259 88 370 5,533 133Container - 6000 33 44 129 41 167 3,294 2Container - 7000 33 42 107 39 140 2,204 51Container - 8000 65 83 206 76 346 5,885 105Cruise 580 884 689 330 385 2,516 0General Cargo 27 29 37 20 54 500 116Ocean Tugs 10 10 13 6 22 232 75Miscellaneous 5 5 4 2 7 460 0Reefer 6 7 4 4 18 337 13RoRo 32 39 54 29 77 1,902 25Tanker - General 17 17 22 12 24 227 71Tanker - Chemical 7 7 10 5 9 68 29Tanker - Crude - Aframax 17 18 20 11 26 374 239Tanker - Crude - Handyboat 4 4 3 2 5 71 49Tanker - Crude - Panamax 48 49 36 25 50 657 467Tanker - Crude - Suezmax 48 51 59 30 59 460 873Tanker - Crude - ULCC 22 23 18 11 50 333 1,600Tanker - Crude - VLCC 14 16 17 9 20 135 381Tanker - Oil Products 19 19 19 12 26 345 173Total 1,423 1,841 2,430 1,066 3,078 36,688 5,761
Fuel Consumption, Metric Tons

SAN PEDRO BAY PORTS 2005 OGV FUEL CONSUMPTION ESTIMATES
Starcrest Consulting Group, LLC 9 January 2008
Table 8: Auxiliary Boiler Fuel Consumption for 2005 Port of Long Beach OGV, metric tons
Vessel Type20 to 40
nmPZ to 20
nm PZHarbor
ManeuveringBerth
HotellingAnchorage Hotelling
Auto Carrier 0 0 0 32 266 18Bulk - General 0 0 0 16 872 335Bulk - Heavy Load 0 0 0 1 44 45Bulk Self-Discharging 0 0 0 2 27 1Bulk Wood Chips 0 0 0 0 8 0Container - 1000 0 0 0 49 715 111Container -2000 0 0 0 91 1,876 99Container - 3000 0 0 0 48 1,145 61Container - 4000 0 0 0 77 1,895 46Container - 5000 0 0 0 49 2,019 46Container - 6000 0 0 0 17 933 1Container - 7000 0 0 0 14 609 14Container - 8000 0 0 0 36 1,709 29Cruise 0 0 0 62 533 0General Cargo 0 0 0 33 621 146Ocean Tugs 0 0 0 0 0 0Miscellaneous 0 0 0 4 601 0Reefer 0 0 0 6 172 7RoRo 0 0 0 6 236 5Tanker - General 0 0 0 17 1,611 64Tanker - Chemical 0 0 0 7 531 30Tanker - Crude - Aframax 0 0 0 16 2,331 199Tanker - Crude - Handyboat 0 0 0 3 543 44Tanker - Crude - Panamax 0 0 0 30 4,107 385Tanker - Crude - Suezmax 0 0 0 31 1,954 630Tanker - Crude - ULCC 0 0 0 18 1,211 819Tanker - Crude - VLCC 0 0 0 7 417 210Tanker - Oil Products 0 0 0 19 2,613 181Total 0 0 0 694 29,601 3,529
Fuel Consumption, Metric Tons

SAN PEDRO BAY PORTS 2005 OGV FUEL CONSUMPTION ESTIMATES
Starcrest Consulting Group, LLC 10 January 2008
Tables 9 through 11 lists the fuel consumption for the anchorages not associated with either San Pedro Bay Port. Table 9: Main Engine Fuel Consumption for 2005 Anchorages Not Associated with
San Pedro Bay Ports, metric tons
Vessel Type 20 to 40 nm 20 to 40 nm PZ to 20 nm PZ Harbor Berth Anchorage(sea speed) (avg speed) Maneuvering Hotelling Hotelling
Auto Carrier 14 13 7 1 0 0 0Bulk - General 425 431 354 75 2 0 0Bulk - Heavy Load 4 3 1 1 1 0 0Bulk Self-Discharging 11 9 9 2 0 0 0Container - 1000 4 5 4 1 0 0 0Container - 2000 113 98 67 14 0 0 0Container - 3000 21 15 8 2 0 0 0Container - 4000 5 3 2 1 0 0 0General Cargo 34 33 25 5 0 0 0Miscellaneous 17 13 10 2 0 0 0Reefer 86 57 63 8 0 0 0Tanker - General 44 42 37 7 0 0 0Tanker - Chemical 32 32 25 5 0 0 0Tanker - Crude - Aframax 134 112 63 17 0 0 0Tanker - Crude - Handyboat 17 16 14 3 0 0 0Tanker - Crude - Panamax 54 56 69 13 1 0 0Tanker - Crude - Suezmax 337 305 308 67 1 0 0Tanker - Crude - ULCC 338 291 113 40 3 0 0Tanker - Crude - VLCC 151 126 74 19 1 0 0Tanker - Oil Products 79 75 105 19 1 0 0Total 1,919 1,733 1,359 304 10 0 0
Fuel Consumption, Metric Tons

SAN PEDRO BAY PORTS 2005 OGV FUEL CONSUMPTION ESTIMATES
Starcrest Consulting Group, LLC 11 January 2008
Table 10: Auxiliary Engine Fuel Consumption for 2005 Anchorages Not Associated with San Pedro Bay Ports, metric tons
Vessel Type 20 to 40 nm 20 to 40 nm PZ to 20 nm PZ Harbor Berth Anchorage
(sea speed) (avg speed) Maneuvering Hotelling HotellingAuto Carrier 1 1 1 1 1 0 5Bulk - General 19 19 21 11 4 0 204Bulk - Heavy Load 0 0 0 0 2 0 10Bulk Self-Discharging 1 1 1 0 0 0 2Container - 1000 0 0 0 0 0 0 1Container - 2000 5 5 7 3 1 0 37Container - 3000 1 1 1 1 1 0 13Container - 4000 0 0 1 0 1 0 1General Cargo 4 3 3 2 1 0 77Miscellaneous 1 1 1 1 0 0 9Reefer 7 9 9 6 0 0 56Tanker - General 5 5 6 3 1 0 70Tanker - Chemical 3 4 3 2 0 0 14Tanker - Crude - Aframax 6 7 5 3 1 0 308Tanker - Crude - Handyboat 2 2 2 1 0 0 66Tanker - Crude - Panamax 4 4 6 3 1 0 74Tanker - Crude - Suezmax 20 21 33 16 1 0 466Tanker - Crude - ULCC 17 19 13 9 4 0 641Tanker - Crude - VLCC 7 8 7 4 1 0 191Tanker - Oil Products 6 6 13 6 2 0 129Total 109 115 135 73 22 0 2,373
Fuel Consumption, Metric Tons

SAN PEDRO BAY PORTS 2005 OGV FUEL CONSUMPTION ESTIMATES
Starcrest Consulting Group, LLC 12 January 2008
Table 11: Auxiliary Boilers Fuel Consumption for 2005 Anchorages Not Associated with San Pedro Bay Ports, metric tons
Vessel Type20 to 40
nmPZ to 20
nm PZHarbor
ManeuveringBerth
HotellingAnchorage Hotelling
Auto Carrier 0 0 0 0 0 3Bulk - General 0 0 0 1 0 76Bulk - Heavy Load 0 0 0 1 0 12Bulk Self-Discharging 0 0 0 0 0 1Container - 1000 0 0 0 0 0 1Container - 2000 0 0 0 0 0 28Container - 3000 0 0 0 0 0 12Container - 4000 0 0 0 0 0 0General Cargo 0 0 0 0 0 97Miscellaneous 0 0 0 0 0 10Reefer 0 0 0 0 0 30Tanker - General 0 0 0 0 0 55Tanker - Chemical 0 0 0 0 0 14Tanker - Crude - Aframax 0 0 0 0 0 268Tanker - Crude - Handyboat 0 0 0 0 0 69Tanker - Crude - Panamax 0 0 0 1 0 63Tanker - Crude - Suezmax 0 0 0 1 0 336Tanker - Crude - ULCC 0 0 0 2 0 327Tanker - Crude - VLCC 0 0 0 1 0 117Tanker - Oil Products 0 0 0 1 0 132Total 0 0 0 10 0 1,652
Fuel Consumption, Metric Tons
Table 12 summarizes the 2005 fuel consumption by engine type for vessels that called San Pedro Bay Ports and the anchorage calls not associated with either Port.

SAN PEDRO BAY PORTS 2005 OGV FUEL CONSUMPTION ESTIMATES
Starcrest Consulting Group, LLC 13 January 2008
Table 12: Summary of Fuel Consumption for 2005 Vessels at San Pedro Bay Ports, metric tons
Port Engine Type 20 to 40 nm 20 to 40 nm PZ to 20 nm PZ Harbor Berth Anchorage Total Total(sea speed) (avg speed) Maneuvering Hotelling Hotelling (sea speed) (avg speed)
LA Main Engine 21,236 14,474 12,557 2,077 933 0 0 36,804 30,042LA Auxiliary Engine 1,726 2,377 2,703 1,098 3,708 34,077 1,518 44,830 45,482LA Auxiliary Boiler 0 0 0 0 765 26,000 1,209 27,974 27,974Total LA 22,962 16,852 15,261 3,176 5,406 60,077 2,727 109,608 103,498
LB Main Engine 22,082 16,383 13,501 2,897 984 0 0 39,464 33,765LB Auxiliary Engine 1,423 1,841 2,430 1,066 3,078 36,688 5,761 50,445 50,863LB Auxiliary Boiler 0 0 0 0 694 29,601 3,529 33,823 33,823Total LB 23,505 18,223 15,931 3,963 4,756 66,289 9,289 123,732 118,451
Total LA and LB 46,467 35,075 31,192 7,139 10,161 126,366 12,017 233,341 221,949
Anchorage Main Engine 1,919 1,733 1,359 304 10 0 0 3,592 3,406Anchorage Auxiliary Engine 109 115 135 73 22 0 2,373 2,712 2,718Anchorage Auxiliary Boiler 0 0 0 0 10 0 1,652 1,661 1,661Total Anchorage 2,028 1,848 1,493 377 42 0 4,024 7,965 7,785
Total LALB+Anchorage 48,495 36,923 32,685 7,516 10,203 126,366 16,041 241,306 229,734
Fuel Consumption, Metric Tons
Table 13 compares the 2005 fuel consumption for vessels that called San Pedro Bay Ports and the anchorage calls not associated with either Port to the 2006 fuel consumption by geographical area. The fuel consumption increased in 2006 by 10% for 20 to 40 nm zone; 20% in precautionary zone; 8% at berth, and 10% at anchorage. The fuel consumption increases are due to increase in vessel calls in 2006. The fuel decreased in 2006 by 25% from the precautionary zone to 20 nm from Point Fermin. This decrease in fuel may be due to greater vessel speed reduction (VSR) program compliance in 2006.
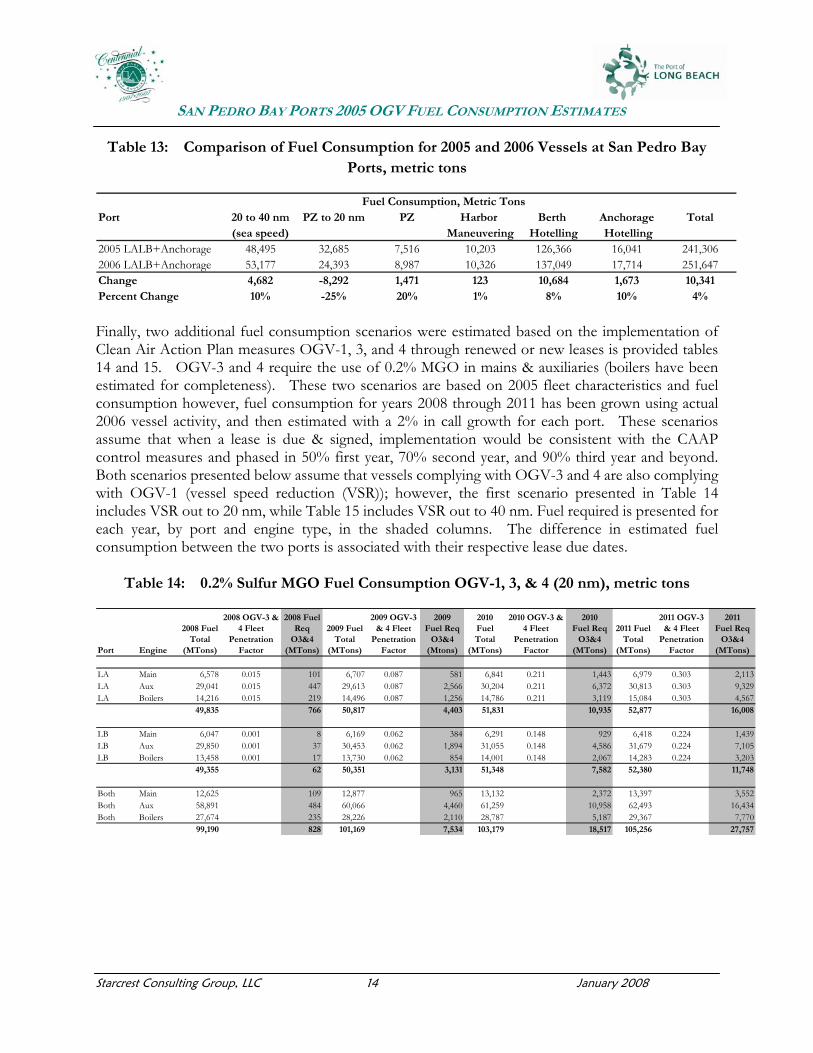
SAN PEDRO BAY PORTS 2005 OGV FUEL CONSUMPTION ESTIMATES
Starcrest Consulting Group, LLC 14 January 2008
Table 13: Comparison of Fuel Consumption for 2005 and 2006 Vessels at San Pedro Bay Ports, metric tons
Port 20 to 40 nm PZ to 20 nm PZ Harbor Berth Anchorage Total(sea speed) Maneuvering Hotelling Hotelling
2005 LALB+Anchorage 48,495 32,685 7,516 10,203 126,366 16,041 241,3062006 LALB+Anchorage 53,177 24,393 8,987 10,326 137,049 17,714 251,647Change 4,682 -8,292 1,471 123 10,684 1,673 10,341Percent Change 10% -25% 20% 1% 8% 10% 4%
Fuel Consumption, Metric Tons
Finally, two additional fuel consumption scenarios were estimated based on the implementation of Clean Air Action Plan measures OGV-1, 3, and 4 through renewed or new leases is provided tables 14 and 15. OGV-3 and 4 require the use of 0.2% MGO in mains & auxiliaries (boilers have been estimated for completeness). These two scenarios are based on 2005 fleet characteristics and fuel consumption however, fuel consumption for years 2008 through 2011 has been grown using actual 2006 vessel activity, and then estimated with a 2% in call growth for each port. These scenarios assume that when a lease is due & signed, implementation would be consistent with the CAAP control measures and phased in 50% first year, 70% second year, and 90% third year and beyond. Both scenarios presented below assume that vessels complying with OGV-3 and 4 are also complying with OGV-1 (vessel speed reduction (VSR)); however, the first scenario presented in Table 14 includes VSR out to 20 nm, while Table 15 includes VSR out to 40 nm. Fuel required is presented for each year, by port and engine type, in the shaded columns. The difference in estimated fuel consumption between the two ports is associated with their respective lease due dates.
Table 14: 0.2% Sulfur MGO Fuel Consumption OGV-1, 3, & 4 (20 nm), metric tons
Port Engine
2008 Fuel Total
(MTons)
2008 OGV-3 & 4 Fleet
Penetration Factor
2008 Fuel Req
O3&4 (MTons)
2009 Fuel Total
(MTons)
2009 OGV-3 & 4 Fleet
Penetration Factor
2009 Fuel Req
O3&4 (Mtons)
2010 Fuel Total
(MTons)
2010 OGV-3 & 4 Fleet
Penetration Factor
2010 Fuel Req
O3&4 (MTons)
2011 Fuel Total
(MTons)
2011 OGV-3 & 4 Fleet
Penetration Factor
2011 Fuel Req
O3&4 (MTons)
LA Main 6,578 0.015 101 6,707 0.087 581 6,841 0.211 1,443 6,979 0.303 2,113LA Aux 29,041 0.015 447 29,613 0.087 2,566 30,204 0.211 6,372 30,813 0.303 9,329LA Boilers 14,216 0.015 219 14,496 0.087 1,256 14,786 0.211 3,119 15,084 0.303 4,567
49,835 766 50,817 4,403 51,831 10,935 52,877 16,008
LB Main 6,047 0.001 8 6,169 0.062 384 6,291 0.148 929 6,418 0.224 1,439LB Aux 29,850 0.001 37 30,453 0.062 1,894 31,055 0.148 4,586 31,679 0.224 7,105LB Boilers 13,458 0.001 17 13,730 0.062 854 14,001 0.148 2,067 14,283 0.224 3,203
49,355 62 50,351 3,131 51,348 7,582 52,380 11,748
Both Main 12,625 109 12,877 965 13,132 2,372 13,397 3,552Both Aux 58,891 484 60,066 4,460 61,259 10,958 62,493 16,434Both Boilers 27,674 235 28,226 2,110 28,787 5,187 29,367 7,770
99,190 828 101,169 7,534 103,179 18,517 105,256 27,757
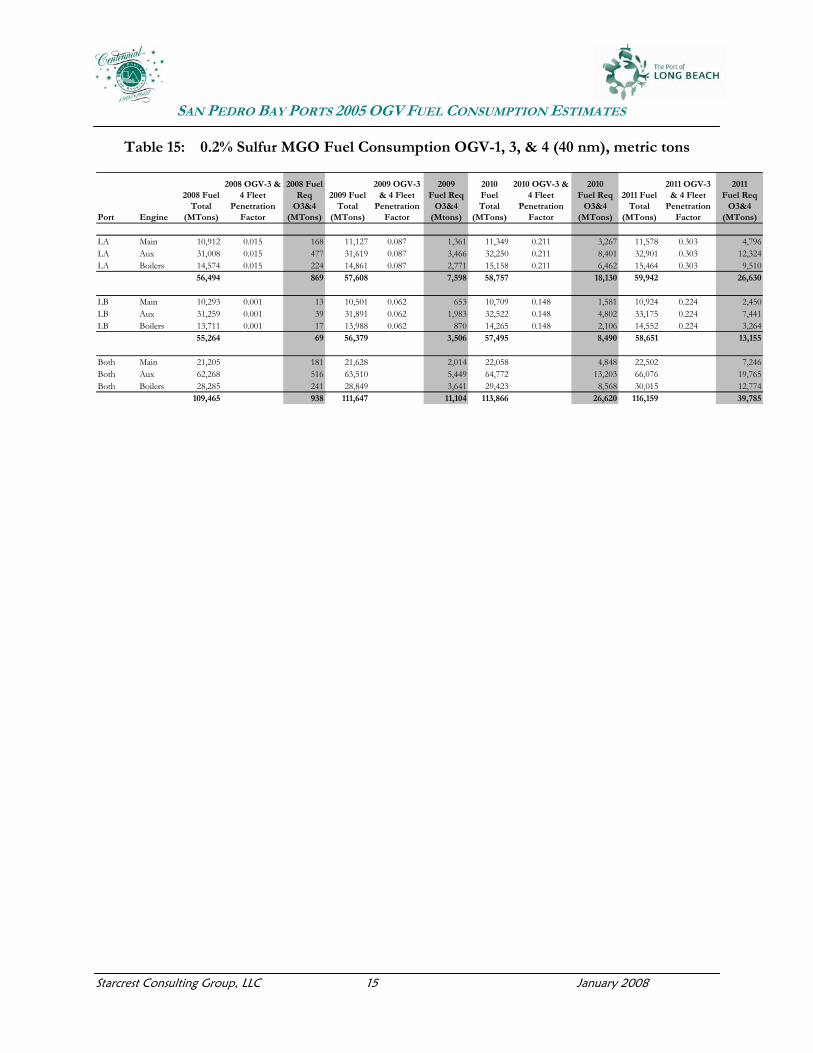
SAN PEDRO BAY PORTS 2005 OGV FUEL CONSUMPTION ESTIMATES
Starcrest Consulting Group, LLC 15 January 2008
Table 15: 0.2% Sulfur MGO Fuel Consumption OGV-1, 3, & 4 (40 nm), metric tons
Port Engine
2008 Fuel Total
(MTons)
2008 OGV-3 & 4 Fleet
Penetration Factor
2008 Fuel Req
O3&4 (MTons)
2009 Fuel Total
(MTons)
2009 OGV-3 & 4 Fleet
Penetration Factor
2009 Fuel Req
O3&4 (Mtons)
2010 Fuel Total
(MTons)
2010 OGV-3 & 4 Fleet
Penetration Factor
2010 Fuel Req
O3&4 (MTons)
2011 Fuel Total
(MTons)
2011 OGV-3 & 4 Fleet
Penetration Factor
2011 Fuel Req
O3&4 (MTons)
LA Main 10,912 0.015 168 11,127 0.087 1,361 11,349 0.211 3,267 11,578 0.303 4,796LA Aux 31,008 0.015 477 31,619 0.087 3,466 32,250 0.211 8,401 32,901 0.303 12,324LA Boilers 14,574 0.015 224 14,861 0.087 2,771 15,158 0.211 6,462 15,464 0.303 9,510
56,494 869 57,608 7,598 58,757 18,130 59,942 26,630
LB Main 10,293 0.001 13 10,501 0.062 653 10,709 0.148 1,581 10,924 0.224 2,450LB Aux 31,259 0.001 39 31,891 0.062 1,983 32,522 0.148 4,802 33,175 0.224 7,441LB Boilers 13,711 0.001 17 13,988 0.062 870 14,265 0.148 2,106 14,552 0.224 3,264
55,264 69 56,379 3,506 57,495 8,490 58,651 13,155
Both Main 21,205 181 21,628 2,014 22,058 4,848 22,502 7,246Both Aux 62,268 516 63,510 5,449 64,772 13,203 66,076 19,765Both Boilers 28,285 241 28,849 3,641 29,423 8,568 30,015 12,774
109,465 938 111,647 11,104 113,866 26,620 116,159 39,785

SAN PEDRO BAY PORTS 2005 OGV FUEL CONSUMPTION ESTIMATES
Starcrest Consulting Group, LLC 16 January 2008
APPENDIX A SUPPORTING SUMMARY DATA

SAN PEDRO BAY PORTS 2005 OGV FUEL CONSUMPTION ESTIMATES
Starcrest Consulting Group, LLC 17 January 2008
POWER DEMAND Power demand or energy consumption is estimated in the 2005 emissions inventories on a per-vessel by vessel basis. The following tables provide the energy consumption (in kW-hrs) by vessel type, zone, engine/boiler type, and by port. Again, sea speed represents all ships transiting at their sea speed 20 to 40 nm and avg speed represents traveling at slower speeds based on preliminary VSR data (as explained in the main text). It should be noted that fuel types were mixed in the main and auxiliary engines so direct correlation between break specific fuel consumption factors presented in Table 1 of the main text is not appropriate, as there was a range of fuel types identified. Table A1: Main Engine Energy Consumption for 2005 Port of Los Angeles OGV, kW-hrs
Vessel Type 20 to 40 nm 20 to 40 nm PZ to 20 nm PZ Harbor Berth Anchorage
(sea speed) (avg speed) Maneuvering Hotelling HotellingAuto Carrier 1,367,473 1,266,625 1,440,642 124,092 95,142 0 0Bulk - General 3,980,754 3,957,554 4,414,711 641,992 252,026 0 0Bulk - Heavy Load 41,247 42,011 40,716 5,895 1,213 0 0Bulk Wood Chips 60,194 67,985 83,980 12,377 4,035 0 0Container - 1000 4,548,518 4,847,672 2,157,175 577,349 156,346 0 0Container - 2000 6,608,587 5,649,903 5,618,160 663,280 292,979 0 0Container - 3000 11,962,401 9,480,774 8,852,363 1,181,063 612,530 0 0Container - 4000 20,578,658 13,219,741 11,552,583 1,624,377 857,909 0 0Container - 5000 12,508,669 7,563,072 6,006,459 942,631 539,741 0 0Container - 6000 9,042,290 5,579,128 4,540,505 696,523 408,024 0 0Container - 7000 4,134,206 2,534,787 2,877,271 305,085 154,465 0 0Container - 8000 78,032 46,573 51,955 4,761 10,881 0 0Cruise 23,064,091 9,994,171 6,635,591 2,326,110 778,697 0 0General Cargo 1,406,013 1,403,382 1,625,623 198,305 89,193 0 0Ocean Tugs 1,078,797 1,078,797 1,234,178 197,428 64,579 0 0Miscellaneous 108,283 76,516 69,571 13,664 7,222 0 0Reefer 1,409,710 1,024,294 472,165 128,037 53,556 0 0RoRo 105,089 71,762 65,909 8,024 4,790 0 0Tanker - General 1,662,098 1,529,416 1,572,493 237,084 102,292 0 0Tanker - Chemical 707,397 657,468 833,704 106,581 37,493 0 0Tanker - Crude - Aframax 154,030 144,442 137,681 22,434 13,004 0 0Tanker - Crude - Handyboat 381,442 374,616 317,518 64,077 18,812 0 0Tanker - Crude - Panamax 351,126 352,699 264,664 53,567 23,612 0 0Tanker - Oil Products 2,163,996 2,114,346 2,545,841 359,901 144,279 0 0Total 107,503,100 73,077,734 63,411,459 10,494,637 4,722,820 0 0
Energy Consumption, kW-hrs

SAN PEDRO BAY PORTS 2005 OGV FUEL CONSUMPTION ESTIMATES
Starcrest Consulting Group, LLC 18 January 2008
Vessel Type 20 to 40 nm 20 to 40 nm PZ to 20 nm PZ Harbor Berth Anchorage(sea speed) (avg speed) Maneuvering Hotelling Hotelling
Auto Carrier 68,855 71,733 145,109 47,143 193,839 891,566 34,593Bulk - General 161,314 162,282 223,215 89,897 360,302 6,042,409 1,210,355Bulk - Heavy Load 1,755 1,759 1,824 1,108 2,964 55,029 3,412Bulk Wood Chips 2,517 2,388 5,338 1,478 4,990 163,353 18,327Container - 1000 176,347 171,154 162,803 95,838 389,671 3,486,687 281,756Container - 2000 232,398 251,737 500,913 141,440 828,367 6,381,653 292,530Container - 3000 392,617 439,230 1,077,752 254,930 1,727,418 13,449,199 463,460Container - 4000 623,314 779,574 1,801,763 454,016 2,900,840 23,696,400 265,256Container - 5000 462,312 593,600 1,644,751 345,902 2,382,220 34,329,967 159,215Container - 6000 335,890 427,143 1,180,200 250,907 1,835,438 20,420,359 97,706Container - 7000 145,515 185,580 450,088 109,721 687,619 8,396,022 43,493Container - 8000 2,581 3,340 8,399 1,596 42,641 175,977 0Cruise 4,442,964 6,810,875 4,105,393 2,729,622 4,171,306 22,195,705 11,267General Cargo 64,118 64,615 89,019 35,758 161,307 2,209,654 407,580Ocean Tugs 14,698 14,698 20,760 7,176 36,449 234,654 80,917Miscellaneous 4,145 5,242 6,654 2,835 10,331 128,871 2,891Reefer 82,683 100,143 62,240 55,583 240,198 3,493,910 209,887RoRo 2,724 3,296 5,228 1,958 8,707 69,564 3,637Tanker - General 152,271 158,687 185,309 84,853 214,044 2,266,441 1,300,659Tanker - Chemical 61,268 63,782 91,465 35,679 68,191 664,482 133,902Tanker - Crude - Aframax 8,077 8,370 13,227 4,540 17,827 115,338 442,132Tanker - Crude - Handyboat 33,613 33,988 39,751 20,076 45,447 534,156 130,302Tanker - Crude - Panamax 23,512 23,546 20,299 12,285 36,936 491,391 128,332Tanker - Oil Products 166,428 168,704 244,258 96,814 244,336 2,980,918 1,003,586Total 7,661,916 10,545,467 12,085,757 4,881,153 16,611,386 152,873,707 6,725,198
Energy Consumption, kW-hrs
Table A2: Auxiliary Engine Energy Consumption for 2005 Port of Los Angeles OGV, kW-hrs

SAN PEDRO BAY PORTS 2005 OGV FUEL CONSUMPTION ESTIMATES
Starcrest Consulting Group, LLC 19 January 2008
Table A3: Auxiliary Boiler Energy Consumption for 2005 Port of Los Angeles OGV, kW-hrs
Vessel Type 20 to 40 nm
PZ to 20 nm PZ
Harbor Maneuvering
Berth Hotelling
Anchorage Hotelling
Auto Carrier 0 0 0 48,974 452,324 17,681Bulk - General 0 0 0 48,749 1,655,129 333,022Bulk - Heavy Load 0 0 0 793 25,989 783Bulk Wood Chips 0 0 0 678 45,080 5,106Container - 1000 0 0 0 155,765 3,906,312 339,328Container - 2000 0 0 0 169,802 3,630,175 167,470Container - 3000 0 0 0 302,858 6,507,890 226,490Container - 4000 0 0 0 394,547 8,978,513 99,785Container - 5000 0 0 0 219,497 8,768,638 41,295Container - 6000 0 0 0 142,250 4,395,533 20,710Container - 7000 0 0 0 48,673 1,650,122 8,910Container - 8000 0 0 0 3,158 36,207 0Cruise 0 0 0 492,303 3,293,007 1,670General Cargo 0 0 0 70,818 1,977,295 359,147Ocean Tugs 0 0 0 0 0 0Miscellaneous 0 0 0 4,796 120,721 2,708Reefer 0 0 0 70,531 1,447,403 98,622RoRo 0 0 0 679 9,325 483Tanker - General 0 0 0 110,957 12,130,780 920,036Tanker - Chemical 0 0 0 37,927 3,690,408 102,435Tanker - Crude - Aframax 0 0 0 8,102 538,170 290,568Tanker - Crude - Handyboat 0 0 0 25,199 3,075,450 100,720Tanker - Crude - Panamax 0 0 0 16,129 2,203,560 78,684Tanker - Oil Products 0 0 0 134,478 16,708,550 749,227Total 0 0 0 2,507,663 85,246,580 3,964,879
Energy Consumption, kW-hrs

SAN PEDRO BAY PORTS 2005 OGV FUEL CONSUMPTION ESTIMATES
Starcrest Consulting Group, LLC 20 January 2008
Table A4: Main Engine Energy Consumption for 2005 Port of Long Beach OGV, kW-hrs
Vessel Type 20 to 40 nm 20 to 40 nm PZ to 20 nm PZ Harbor Berth Anchorage(sea speed) (avg speed) Maneuvering Hotelling Hotelling
Auto Carrier 3,292,724 2,971,785 2,886,198 435,149 203,638 0 0Bulk - General 5,501,676 5,553,290 6,253,870 1,128,425 275,397 0 0Bulk - Heavy Load 141,835 186,791 119,686 37,447 10,866 0 0Bulk Self-Discharging 532,955 451,553 235,025 61,898 36,764 0 0Bulk Wood Chips 21,312 24,735 31,907 6,078 906 0 0Container - 1000 4,126,497 4,371,246 2,456,787 617,642 159,863 0 0Container -2000 11,127,017 9,758,625 8,263,443 1,585,215 511,676 0 0Container - 3000 6,633,383 5,163,989 5,018,658 931,239 307,138 0 0Container - 4000 14,083,987 9,461,031 8,544,173 1,679,698 561,240 0 0Container - 5000 9,458,246 5,757,925 4,532,751 1,115,824 382,758 0 0Container - 6000 4,578,629 2,556,617 1,728,251 505,602 191,380 0 0Container - 7000 4,332,593 2,612,852 2,767,013 522,256 150,048 0 0Container - 8000 9,046,245 5,548,043 6,081,410 1,092,947 408,576 0 0Cruise 13,263,106 5,720,109 1,934,677 1,235,710 312,431 0 0General Cargo 2,788,756 2,699,438 2,632,685 473,636 141,993 0 0Ocean Tugs 2,608,813 2,608,813 2,147,024 464,597 155,965 0 0Miscellaneous 562,604 547,212 344,088 88,240 27,284 0 0Reefer 380,654 261,654 115,839 29,922 15,216 0 0RoRo 4,131,464 2,798,023 2,451,727 395,850 138,991 0 0Tanker - General 796,178 776,442 860,549 154,074 59,139 0 0Tanker - Chemical 376,606 363,826 489,952 74,766 25,706 0 0Tanker - Crude - Aframax 1,432,064 1,253,498 1,012,465 214,559 94,241 0 0Tanker - Crude - Handyboat 226,449 208,420 130,079 32,011 14,340 0 0Tanker - Crude - Panamax 3,252,588 3,158,644 1,890,409 468,221 152,482 0 0Tanker - Crude - Suezmax 4,385,074 3,861,266 2,730,384 651,026 246,786 0 0Tanker - Crude - ULCC 1,976,479 1,772,376 819,846 257,193 198,014 0 0Tanker - Crude - VLCC 1,115,325 905,126 582,682 146,623 89,777 0 0Tanker - Oil Products 1,062,257 1,015,918 913,516 182,722 70,575 0 0Total 111,235,516 82,369,244 67,975,092 14,588,572 4,943,191 0 0
Energy Consumption, kW-hrs

SAN PEDRO BAY PORTS 2005 OGV FUEL CONSUMPTION ESTIMATES
Starcrest Consulting Group, LLC 21 January 2008
Vessel Type 20 to 40 nm 20 to 40 nm PZ to 20 nm PZ Harbor Berth Anchorage(sea speed) (avg speed) Maneuvering Hotelling Hotelling
Auto Carrier 165,279 174,309 373,617 171,354 417,793 1,718,023 119,960Bulk - General 225,753 225,247 319,740 156,355 393,868 10,453,294 4,012,707Bulk - Heavy Load 4,149 3,960 10,113 3,243 13,635 165,534 188,535Bulk Self-Discharging 28,898 31,260 17,789 14,744 57,319 414,730 19,004Bulk Wood Chips 858 797 1,685 671 1,971 97,988 4,008Container - 1000 131,554 128,411 179,817 85,386 336,429 1,780,537 275,813Container -2000 409,960 438,667 738,311 331,986 1,489,783 11,115,969 577,571Container - 3000 220,252 250,433 527,869 212,326 890,880 7,587,184 408,418Container - 4000 406,398 495,822 1,029,926 411,439 1,802,678 15,975,924 387,863Container - 5000 332,647 425,773 1,140,434 386,836 1,630,267 24,373,838 587,025Container - 6000 145,752 195,164 568,900 181,411 740,526 14,575,629 11,006Container - 7000 143,280 184,503 471,994 172,322 615,961 9,709,938 225,351Container - 8000 285,459 364,645 908,031 335,439 1,524,352 25,924,759 464,465Cruise 2,554,946 3,893,596 3,033,243 1,452,863 1,697,208 11,085,861 0General Cargo 120,857 126,038 165,062 86,342 238,788 2,201,219 509,134Ocean Tugs 45,720 45,720 61,160 29,229 102,860 1,062,148 342,159Miscellaneous 21,144 21,971 17,938 11,204 30,695 2,061,255 0Reefer 26,263 32,299 19,152 16,481 77,270 1,486,612 58,935RoRo 143,188 176,194 244,320 129,139 344,616 8,566,061 113,954Tanker - General 74,707 75,930 97,320 51,543 106,859 999,343 311,955Tanker - Chemical 31,941 32,398 46,058 23,039 41,353 299,727 128,192Tanker - Crude - Aframax 76,495 81,166 86,798 48,022 116,655 1,647,824 1,052,292Tanker - Crude - Handyboat 18,783 19,561 15,418 10,234 21,163 314,387 214,288Tanker - Crude - Panamax 213,039 217,083 157,470 110,796 218,537 2,896,399 2,057,984Tanker - Crude - Suezmax 216,532 231,458 264,783 136,448 267,499 2,070,761 3,931,494Tanker - Crude - ULCC 95,951 101,166 78,220 50,547 221,024 1,467,785 7,050,422Tanker - Crude - VLCC 61,807 68,883 74,582 39,489 89,402 593,124 1,678,288Tanker - Oil Products 83,084 85,221 85,229 51,317 112,635 1,520,527 760,141Total 6,284,698 8,127,673 10,734,980 4,710,203 13,602,026 162,166,382 25,490,964
Energy Consumption, kW-hrs
Table A5: Auxiliary Engine Energy Consumption for 2005 Port of Long Beach OGV, kW-hrs

SAN PEDRO BAY PORTS 2005 OGV FUEL CONSUMPTION ESTIMATES
Starcrest Consulting Group, LLC 22 January 2008
Table A6: Auxiliary Boiler Energy Consumption for 2005 Port of Long Beach OGV, kW-hrs
Vessel Type 20 to 40 nm
PZ to 20 nm PZ
Harbor Maneuvering
Berth Hotelling
Anchorage Hotelling
Auto Carrier 0 0 0 105,041 870,499 60,439Bulk - General 0 0 0 53,457 2,859,190 1,099,036Bulk - Heavy Load 0 0 0 4,564 144,845 148,477Bulk Self-Discharging 0 0 0 5,848 89,169 4,787Bulk Wood Chips 0 0 0 269 26,968 1,103Container - 1000 0 0 0 160,692 2,345,323 363,260Container -2000 0 0 0 298,280 6,151,953 324,655Container - 3000 0 0 0 158,972 3,753,467 199,625Container - 4000 0 0 0 253,820 6,213,543 152,245Container - 5000 0 0 0 161,505 6,620,210 151,295Container - 6000 0 0 0 55,928 3,058,623 2,290Container - 7000 0 0 0 45,623 1,997,782 46,365Container - 8000 0 0 0 116,792 5,602,057 96,340Cruise 0 0 0 203,113 1,746,877 0General Cargo 0 0 0 109,329 2,036,635 479,618Ocean Tugs 0 0 0 0 0 0Miscellaneous 0 0 0 14,214 1,971,877 0Reefer 0 0 0 20,558 562,317 21,912RoRo 0 0 0 20,911 773,943 15,258Tanker - General 0 0 0 55,167 5,282,580 209,293Tanker - Chemical 0 0 0 23,295 1,742,260 99,355Tanker - Crude - Aframax 0 0 0 52,346 7,644,250 652,985Tanker - Crude - Handyboat 0 0 0 11,411 1,779,770 144,709Tanker - Crude - Panamax 0 0 0 98,235 13,466,100 1,261,963Tanker - Crude - Suezmax 0 0 0 102,851 6,407,162 2,066,194Tanker - Crude - ULCC 0 0 0 58,592 3,969,480 2,684,697Tanker - Crude - VLCC 0 0 0 21,334 1,366,800 688,471Tanker - Oil Products 0 0 0 62,477 8,567,830 594,933Total 0 0 0 2,274,624 97,051,511 11,569,305
Energy Consumption, kW-hrs