final draft_britain's valuable property credentials - bpf report_withalledits
TRANSCRIPT

TOSCAFUND December 2015
Authors: Dr Savvas Savouri, Toscafund Chief Economist, and Professor Richard Jackman, London School of Economics
Research Assistants: Boris But, Nas Christodoulopoulos, Katie Orlandi and Vikram Lopez Y Royo
BRITAIN’S
PROPERTY CREDENTIALS
A British Property Federation commissioned report
prepared by TOSCAFUND
TOSCAFUND BRITAIN’s PROPERTY CREDENTIALS
2 December 2015
The report was commissioned by the British Property Federation (BPF) and prepared by
Toscafund Asset Management LLP (Toscafund).
The BPF is the membership organisation for the UK real estate industry. It represents all those involved in real estate
ownership and investment. It works with Government and regulatory bodies to help the real estate industry grow and
thrive, to the benefit of its members and the economy as a whole.
Toscafund, based in London, is a leading multi-asset management firm founded in 2000. Toscafund currently manages
over $3bn on a fully discretionary basis in a variety of strategies that include Commercial Real Estate.
Authors
Dr Savvas P. Savouri Chief Economist – Toscafund Asset Management
Since 2008 Savvas Savouri has been a partner and chief economist at Toscafund Asset Management, having headed
economics and strategy departments at a number of investment banks. Before entering financial services Savvas taught
at the LSE, Oxford University and Moscow State University. Savvas was awarded a doctorate in Econometrics and
Mathematical Economics from the LSE where he also obtained masters and bachelor degrees in the same discipline.
Professor Emeritus Richard Jackman Professor of Economics – London School of Economics and Political Science
Professor Richard Jackman joined the LSE teaching staff in 1968 after his MA in Economics from Cambridge University.
Richard has co-authored four books and has over 80 articles in refereed journals. During his time at the LSE, Richard’s also
been a visitor Professor in Economics at the University of Iowa and worked as a consultant with the World Bank. He has
worked with the London Boroughs’ Association (now known as London Councils) and the Department of the
Environment in connection with its studies on local government finance.

TOSCAFUND BRITAIN’s PROPERTY CREDENTIALS
3 December 2015
Executive Summary
� We believe that the conventional ways of quantifying Commercial Real Estate (CRE) are ineffective, and that the
‘economic’ definition of CRE is wider and more complex. Nor is it correct to identify CRE with the Blue Book category
‘non-residential property’ as some non-residential property is not commercial, while some CRE is classed as ‘other
structures’.
� Our current estimate of CRE is £1,662bn, which is just over 20% of net wealth, in 2014.
� In this report we define CRE as property whose main function is to generate income for its owner. Therefore we
consider the Private Rental Sector (such as buy-to-let, student hostels, etc) as an integral part, contributing £42bn
market rent in our estimate for 2014.
� According to conventional national income accounting procedures, the contribution of CRE to GDP is measured by
the rent (actually paid or implicit) generated by such properties. This amounts to around £94bn or 5% of GDP in
2014.
� For comparative purposes we have included the yield for 10 year Gilts, the most conventionally used risk-free or
swap rate for CRE.
Chart A: Capital Values of CRE and PRS Chart B: Yield comparison between CRE and 10 year Gilt
Source: VOA, Scottish Assessors (Scottish Government statistics), IPD (MSCI), DCLG (ONS), Stats Wales, NI Housing Executive, Wriglesworth Consultancy (part of Instinctif Partners), LSL
Property Services, Bloomberg, Toscafund
� Whilst all this income percolates down to households, much of it is hidden rather than apparent. For example, most
pension funds are invested mainly in equities, but the value of equities derives to a large extent from the CRE that
they finance.
� The main contribution of CRE to economic welfare lies not in its contribution to GDP, but in its contribution to the
built environment, to employment and to economic development.
� The growth of real wages depends on the growth of capital, of which CRE forms a large part, at least keeping pace
with the growth of population. This requires substantial investment in CRE over the coming years.
� The greater flexibility of CRE means that it is no longer so much of a barrier to the revival of depressed regions: new
industries can flourish in premises vacated by the old.
� CRE is much more heavily taxed than other factors of production or types of wealth. One consequence of this is that
some buildings are left empty or remain in unproductive use. Notably, the tax on CRE is much higher than the tax on
dwellings, in particular owner occupied housing. This leads to a correspondingly enormous misallocation of savings,
which is poured into domestic housing rather than productive investment.
0.0
0.2
0.4
0.6
0.8
1.0
1.2
1.4
1.6
1.8
2005 2009 2010 2011 2012 2013 2014
Tri
llio
ns
Commercial real estate Private Rented Sector
0
1
2
3
4
5
6
7
2005 2009 2010 2011 2012 2013 2014
%
CRE yield 10 year Gilt yield

TOSCAFUND BRITAIN’s PROPERTY CREDENTIALS
4 December 2015
Preface
In the second part an orderly sequence is followed as we try to establish quantitative values for what Britain’s Commercial
Real Estate (CRE) means to the economy. Ahead of that, Part 1 of this research paper covers an assortment of topics,
issues and themes relating to the UK’s CRE. Since the section's elements do not flow in a sequential narrative we have
opted to present the contents page rather differently from the convention, using a circle rather than a table (we return to
tradition in Section 2).
The use of a circle makes the point that whilst sections can indeed be followed around the ‘circumference’ in THAT
sequence, readers may wish instead to shift across the diameter, or indeed travel to the centre and then move radially in
whichever direction their thematic interest may choose to take them.
The over-arching point of Section 1 is that the UK’s CRE is a cornerstone (sic) asset, not a sector per se, as it is all too often
narrowly seen. Just as our manufacturers and exporters demand built space to function so to do our business service
sectors. For its part agriculture has been transformed by CRE, green houses amongst an assortment of buildings which
have improved our productive capacity and freed up labour and land for other productive uses, for which property once
more has been an essential element. Across in residential markets the expansion once more in the Private Rental Sector
(PRS) is contributing to the UK having a more mobile labour force with all the positive economic and indeed social
externalities which follow from this. As well as we perform productive functions CRE is essential for us during recreational
time, with of course recreational time for some productive and commercial valuable time for others; our vignette on the
use of CRE for the manufacture of goods facing one another on our contents clock.
To reiterate CRE is a crucial factor input without which the UK economy could not possibly function, and without whose
continuous development the UK would not have the economy it has today. This is not hyperbole but an irrefutable
axiom. Moreover this is not to say that certain sectors and industries do not directly ‘serve’ the UK’s commercial space;
construction and maintenance activity, building product making, property services and agency sectors, just a handful. In
fact were we to collect together these, and other sectors which are recognised as serving the UK's CRE, we would come to
the ‘conventional’ conclusion its CRE only somehow represents a rather modest c2% of the UK’s GDP. The reality is that
were one to fully account for all its tangible contributions, the figure would, in fact, rise to over 5%. Moreover, even this
figure does not do proper justice to the wider economic importance of CRE. The crucial point is that NO other sector
contributing to the UK’s GDP could function without the nations CRE which also contributes to large parts of the UK
balance sheet. To repeat we should cease to view CRE as a sector and instead honour it as one of the pillars (sic) of the UK
economy. It is a crucial factor input working alongside our nation’s human capital. Indeed, we should see property as we
do labour as over-arching all elements of the economy, not a particular ‘segment’ within it.
In Section 2 the point is made more formally that the ‘economic value’ of CRE should be viewed from the perspective of it
as a factor input and provider of balance sheet wealth and income extensively across the UK. This first section is instead
made up of vignettes relating to CRE, presenting ideas surrounding its often overlooked contribution to our lives and
how exactly it impacts us. It also tries to expose misunderstandings which often arise concerning the contribution of CRE.
Section 1 is in no way exhaustive of these, simply illustrative. And to repeat the topics, issues and themes covered in
Section 1 are not presented in a top-table manner, where sections are sequenced in some inviolate order, but as a ‘round
table’, where all face one another as complements and part of a whole, or put different illustrating that its CRE is not
simply part of the UK's economy but the latter is nothing without it.

TOSCAFUND BRITAIN’s PROPERTY CREDENTIALS
5 December 2015
Contents
Introduction 7
Part 1. Evolution of Britain’s CRE sector 8
1.1 The externalities (social benefits) of Britain’s CRE 8
1.1.1 The ‘direct’ externalities of CRE 8
1.2 Infrastructure and transport 9
1.2.1 Construction and the Growth of GDP 9
1.2.2 Bringing derelict CRE back to economic life 10
1.2.3 Britain’s CRE is better connected 11
1.2.4 King’s Cross Central: A case study in inclusive regeneration 13
1.2.5 CRE: Walking on water 14
1.2.6 CRE flying high 15
1.3 Offices and IT 16
1.3.1 CRE in the clouds 16
1.3.2 CRE and the internet 16
1.3.3 Google: search for a real presence 17
1.3.4 Sometimes developing Britain's CRE does not quite reach The Pinnacle 17
1.3.5 Global purpose & competitiveness 18
1.3.6 A real second home in Britain 19
1.3.7 A Central Point: CRE unchanging on the outside but evolving within 20
1.4 Educating CRE 21
1.4.1 British universities 21
1.4.2 An educated CRE case study: The University of Buckingham 21
1.4.3 Britain's Real Commercial Education Industry 22
1.4.4 Education, Education & Education 23
1.4.5 Case Study: Students, UNITE-d 23
1.5 Great retail developments 24
1.5.1 The Amazon story: Reading between the real estate lines 24
1.5.2 CREacting commercial space in a flash 25
1.5.3 All change: The moving story of Aldwych Station 25
1.5.4 CREating new Markets from old 26
1.5.5 Gateshead's MetroCentre; A Real development turning point 26
1.5.6 Ring in positive change: Birmingham's Bull Ring Centre story 27
1.5.7 High street Real estate, the butcher, and baker and... 28
1.5.8 Betting on a continued real estate need 28
1.6 Hospitality & Leisure 30
1.6.1 Center Parcs building its fifth British resort, creating 2,700 jobs 30
1.6.2 Licensed to change 30
1.6.3 Hotels: A home from home 31
1.6.4 Who could have accurately pictured that? 31
1.6.5 Britain's built ReCREational space 32
1.6.6 A Real Olympian effort 32
1.6.7 Giving CRE a Sporting Chance 33
1.6.8 Britain’s winning CREw 34
1.7 Private Rental Sector 36
1.7.1 Britain's Modern Work Houses 36
1.7.2 The welcome growth of commercial residential (née private rental) 37
1.8 Manufacturing CREativity 38
1.8.1 Real estate’s Food for thought 38
1.9 Flexibility 38
1.9.1 Property arriving from above 38
1.9.2 Protean property 39
1.9.3 Our future is in the clouds but still very real 39
1.9.4 The regeneration of Nine Elms & Battersea: a case study in regeneration and relocation 40
1.9.5 Time to open up Britain's CRE 41
1.9.6 Mixed and change of use property: all for the better 41
1.9.7 Productive Property 42
1.9.8 Self-contained property 42
1.9.9 Moving buildings: It's elementary 43
1.9.10 Britain's sustainably eco-friendly built-scape 44

TOSCAFUND BRITAIN’s PROPERTY CREDENTIALS
6 December 2015
Part 2. Analytics of Britain’s CRE sector: concepts and numbers 45
2.1 Definition and Value 45
2.1.1 Definition 45
2.1.2 Some taxing concerns over CRE taxonomy 46
2.1.3 Valuation 47
2.2 Rental Value (Contribution to GDP) 49
2.2.1 The Value of “Non-Domestic” CRE 49
2.2.2 The Value of Private Rental Housing 51
2.2.3 CRE and the generation of household income 53
2.3 The Asset Value of CRE (CRE as an investment class) 54
2.3.1 The value of Britain's CRE: AcCREdited and AcCREtive 54
2.3.2 The Asset Value of CRE 54
2.3.3 CRE as a proportion of national wealth 56
2.3.4 Who owns Britain’s CRE? 58
2.3.5 Ownership – the significance of foreign capital 59
2.3.6 Understanding the reason for foreign capital 60
2.4 Employment 62
2.4.1 A CREator of jobs 62
2.4.2 ‘Multiplier’ externalities 63
2.4.3 The employment value Britain's CRE construction 64
2.5 CRE and Taxation 66
2.5.1 The burden of taxation on CRE relative to other factors of production 66
Appendix 1 – England & Wales rating list, VOA, as of Sept 2014 67

TOSCAFUND BRITAIN’s PROPERTY CREDENTIALS
7 December 2015
Introduction
In this report, we argue that commercial real estate (CRE) makes a great, if not always fully recognised, contribution to
Britain’s economy, its environment and to the well-being of its people. But that contribution could, and should be
greater. The report identifies some factors hindering CRE from achieving its full potential, in particular fiscal arrangements
that discourage investment and thereby reduce its contribution to economic activity and growth.
We define CRE as property that generate income for its owner. This is not, however, the only function – on the contrary,
CRE makes an important contribution to the environment, to employment and to economic development – but we
suggest that without income generation real estate cannot be defined as ‘commercial’. This definition, based on function,
is wider than those sometimes used and includes, for example, property such as airports and buy-to-let housing. We
argue that the best measure of the contribution of CRE to GDP is the market rent generated by commercial property. In
2014, this amounted to just over £94bn in the UK - about 5.4% of GDP, or around one-quarter of the contribution of ‘non-
human’ inputs to national output.
But the economic value of CRE is not just an input to current production; it also constitutes a significant component of
marketable wealth. We estimate the current market value of CRE at around £1,658bn, which represents 20.6% of total net
wealth. Often, commercial development is financed through debt, equity or other financial instruments that are
themselves held by pension funds, banks or other intermediaries, so the claims on the income generated by CRE are
much more widely dispersed than might otherwise be expected.
Whilst income generation is a crucial part of the puzzle, CRE brings value in other ways too. Our towns and cities are
largely made of CRE, and confer wider benefits on the community. These wider benefits are, known as ‘externalities’.
There are other effects on the wider economy too. The construction and maintenance of CRE is a significant sector of
economic activity that contributes to the range of employment opportunities. CRE also contributes a substantial amount
of tax revenue. Indeed this report argues that, being immobile, CRE is an easy target for taxation and in consequence is
overtaxed relative to other factors of production.
The report is structured as follows. Part 1 illustrates CRE’s contribution with some striking examples taken from different
sectors, some better known such as the great developments in retail, hotels and leisure, but also many less obvious
where CRE has played a crucial role including transport and infrastructure, professional services and IT, universities and
private rented housing. From this wide range of examples we draw out a number of themes, for example flexibility,
allowing buildings designed for one purpose to be easily converted into another.
Part 2 turns from illustrations to statistics. We provide detailed information and sources for the estimates and claims
made in this introduction. We set out our definition of CRE and show how it can be measured using Valuation Office
Agency data on rateable values and housing data, and indicate why it differs from measures used elsewhere (for example
the Office for National Statistics’ Blue Book category of ‘non-residential buildings’). We derive estimates of the asset value
of CRE from these rental values. We note that despite all this, remarkably, the value of CRE has lagged behind that of
other assets such as dwellings. So lastly in this section we investigate the burden of taxation on commercial property. In
the UK the tax system is somewhat unbalanced and imposes higher rates of taxation on commercial property than on
other forms of investment, in particular owner-occupied housing (which now constitutes the bulk of the nation’s stock of
wealth).

TOSCAFUND BRITAIN’s PROPERTY CREDENTIALS
8 December 2015
Part 1. Evolution of Britain’s CRE sector
1.1 The externalities (social benefits) of Britain’s CRE Let us begin by considering forms of property that, whilst only existing to facilitate the flow of people and materials –
bridges and tunnels – are a crucial built part of Britain’s commercial economy. After all, there can be no denying these
built features contribute towards GDP and that without them GDP would be materially lower, but by how much? The
answer lies in the realm of measurement of which good Jeremy Bentham termed felitous calculus. Before we begin our
attempt to quantify the value of property, we must illustrate its essential worth.
1.1.1 The ‘direct’ externalities of CRE
Whilst the concept of externality is widely recognised, there are disputes as to what should be included, and how such
elements should be measured. Our focus in this section is on the latent economic value of built infrastructure, and in
particular, the role of CRE.
There is considerable debate surrounding the cost-benefits of HS2. Whilst its critics argue that HS2 cannot possibly justify
the economic and environmental costs, its supporters present an argument based on the benefits of improved
connectivity and capacity, externalities which whilst impossible to precisely measure, will prove considerable all the
same. The argument behind HS2 is that the whole rail link, including new stations, will produce both a direct commercial
return along with much more important externality benefits. We will look at the HS2 project later in Part 1.2.3.
Externalities exist where some activity leads to direct benefits to some third party from which the person providing the
activity cannot or does not receive any payment, such as a silencer fitted to a car exhaust where the manufacturer cannot
recoup the cost from all the people who experience the less noisy environment. When considering CRE, there are two
major types of externality, which might be termed ‘amenity’ externalities and agglomeration externalities. Amenity
externalities exist when CRE creates a more pleasant built environment and thus enhances the quality of life for people
living and working in that area. These externalities are difficult to measure but clearly important: every developer knows
that local planning committees require a high quality of design in any new development and indeed the visual impact of
new buildings can play an important role in the regeneration of an area. Of course, the developer can hope for a higher
price for a more attractive building but much of the benefit accrues to local residents and those working in the area, who
cannot be made to pay for it. In Part 1 of this report we describe many examples of commercial development leading to
the regeneration of an area, from the refurbishment of the Victorian station hotels at King’s Cross and St Pancras to
Birmingham’s Bullring.
Externalities can also be created through relationships between firms rather than from firms to consumers. These are
known as ‘agglomeration economies‘, they exist when the productivity of one enterprise is increased by the proximity of
others. An example near to hand is London’s ‘silicon roundabout’, at the junction of Old Street and City Road. As with
California’s ‘silicon valley’, having a large number of small firms enables each to benefit from the ideas and developments
of others so that all are more productive but none is able to charge for the benefits it provides for the others. London
provides many examples of agglomeration of more traditional professional services also, such as the lawyers in the Inns
of Court.
We can also identify ‘co-ordination externalities’, which arise when businesses provide complementary services near to
each other, for example coffee shops and cafes located in shopping streets or in retail parks. Each contributes to the
overall experience, the cafes benefit from the trade brought in by shoppers, while at the same time providing rest and
refreshment to enable the shoppers to keep going for longer.
In all these cases, the economic contribution of the particular property may exceed the rent the landlord can charge.
Large-scale developments can sometimes ‘internalise’ a part of these externalities, most often however, it is not feasible.
In some cases, there will be insufficient investment by the developer in activities generating positive externalities
because much of the benefit goes to third parties. With commercial developments, much of the potential development
gain in land values can be effectively taxed away by planning authorities wanting to ensure as large as possible benefit to
the community as a whole from the commercial investment.
While specific examples can convey the importance of these effects, actual measures are more difficult to obtain. One
approach is to measure the appreciation of local property prices, in particular of housing, on the basis that if a
development improves an area people are willing to pay more to live there. Again this has to be done on a case study
basis.

TOSCAFUND BRITAIN’s PROPERTY CREDENTIALS
9 December 2015
1.2 Infrastructure and transport Before looking at examples of CRE, we must look at the physical and organisational structure of the UK. Without
investment in this key area, there will be bottlenecks as the growth of UK’s production and distribution of goods and
services increases. In this section, we consider transport hubs and their networks.
1.2.1 Construction and the Growth of GDP
Economic growth depends on investment but investment takes many forms, not only physical capital but also research
and development and the education and training of the workforce. Within tangible physical capital we see investment in
plant and machinery, vehicles and infrastructure as well as into commercial and residential property. After years of
stagnation following the financial crash of 2008, growth has returned to the UK economy and with it, we will argue, the
need for greatly increased investment in CRE. Consider just one example: airports. Most major airports in the UK are now
privately owned (albeit heavily regulated) and generate profits for their owners. The VOA rateable values for England &
Wales for airports come to £0.5bn (0.8% of the total, current prices, as of September 2014). According to our definitions
we have characterised Britain’s airports as elements of its CRE asset base. The gross income they generate derives from
charging airlines for landing slots (and in charging retailers for retail sites in the terminals) and their contribution to GDP
consists of these rents or charges less any material input costs (such as heating and lighting). In all these respects they are
equivalent to other commercial companies and thus properly part of CRE.
And clearly airports play a crucial role in economic growth. Every day we hear from business leaders how economic
growth is being held back by lack of airport capacity and this is even though passenger figures for Heathrow and Gatwick,
for instance, are regularly breaking new highs. In fact, between them these airports catered for well over 110m
passengers in 2014. Whilst terminals have enjoyed considerable investment, runway capacity has been slow to increase.
Rising passenger numbers are edging Britain’s main airports towards their capacity, with the Department for Transport
forecasting that London’s main airports could be “full” by 2025.
Keenly-interested observers such as the CBI suggest that lack of investment in runway capacity has restricted growth in,
for instance, Heathrow (53%) to one-third the rate enjoyed by Paris Charles de Gaulle (142%) over the past 20 years, and
slower also that the 84% recorded by Frankfurt. The inference is that failure to increase airport capacity damages Britain’s
competitiveness. The CBI cited a survey of large multinationals in which 85% considered air connections to both
established and emerging markets a significant factor in their decision over where to invest.
The 2014 CBI report which examined airport activity warned “Our network offers spare capacity where there is little
demand [for flights to emergent nations] and no capacity where demand is greatest”. It concluded that “a hub airport
with spare capacity offers the greatest chance of new routes to emerging markets. UK businesses want to see additional
hub capacity prioritised as the best prospect for supporting new trade”. The CBI was categorical in its statement that once
the Davies Commission had published their report, “it is imperative that the government of the day acts immediately to
create the necessary planning policy statement and statutory instruments to get building by the end of the parliament”.
Addressing the Commission directly, the CBI report pleaded “it must balance the economic imperative with
environmental considerations and logistical realities to serve the government with a politically deliverable solution”.
For an open-economy capitalising on mobility into and out of it by people and goods airports have, in our view, to be
considered crucial factor in economic growth. In the UK, investment in terminals must now make way for investment in
infrastructure, that is runways, to raise capacity for international travel.
While airports are a clear example of the importance of one type of CRE to economic growth, the commercial sector as a
whole is sometimes characterised as being rather less exciting. Of course people need buildings to work in, but some say
new technologies can manage without it, or at least diminish its importance. In our view this conclusion is misleading.
This report includes examples, from cloud technology to the Post Office, where technological change has led not to a
reduced demand for CRE but a change in the way we use it, the technology leading to new services and different types of
use and with them a demand for different types of CRE.
But nor should one ignore the continuing demand for traditional types of CRE such as offices, shops and hotels. We have
already seen that CRE accounts for a large proportion (more than a quarter) of the capital stock, and leaving aside
dwellings, non-residential CRE accounts for an even larger proportion (close on 30%) of ‘commercial capital’. As the
quantity and quality of CRE improves, work will become more productive and job opportunities, and wages, will increase.
The UK economy is expected to experience growth in the labour force over the medium term; only if this is matched by a
more rapid growth in other inputs including CRE can wages grow and employment opportunities improve.
Our leading example though carries a warning sign. The growth of airports has been restricted largely by planning
controls, which are of course understandable in the case of airports because of their adverse environmental effects (noise
and air pollution). Equally for many other types of CRE, the environmental effects are positive and indeed a major part of
the contribution a new development makes to economic welfare.

TOSCAFUND BRITAIN’s PROPERTY CREDENTIALS
10 December 2015
1.2.2 Bringing derelict CRE back to economic life
Its new name is no accident, for the St Pancras Renaissance Hotel (which opened its doors in 2011) has delivered an
economic boost to an area blighted for decades because large parts of its real estate remained derelict. Whilst this
particular Renaissance is one of many which have been seen over time, Britain is still home to a great deal of once
economic active real estate which is now moribund. There is great potential for such assets to be brought back to
commercial life and to deliver economic benefits through restoration and then subsequent operation.
The Renaissance has been an impressive restoration of The Midland Grand Hotel designed by George Gilbert Scott and
which fully opened in 1873, only to close in 1935. From 1935, until work began on its revival, the building was largely
derelict and if anything an economic liability. Now with its 211 rooms, 34 suites, numerous restaurants and bars, it is an
impressive and economically-enhancing asset.
In close proximity, neighbouring King’s Cross station stands The Great Northern Hotel, designed by Lewis Cubitt, a
building which pre-dates The Midland Grand Hotel, opening for business in 1854. Like its neighbour and indeed other
grand and more modest station hotels across Britain, the fortunes of the Midland Grand suffered during the period in
which rail passenger numbers fell. The consequences of this decline would ripple out to all those businesses which had
come to rely in some way on its guests.
Having been closed for 12 years – but fallen into a state of near dereliction for a period before – The Midland Grand has
recently re-opened its doors and come back to commercial life and generating considerable economic multipliers. Just as
its fortunes had previously moved in tandem with rail travel so it is again, now benefiting moreover from its proximity to
the Eurostar.
Chart 1: Rail passenger miles on franchised operators’ services, quarterly
Source: ONS (Office of Rail Regulation), Toscafund
Over in Holborn is the Rosewood London Hotel boasting 262 rooms, 44 suites, three restaurants and a handful of bars.
Originally completed in 1914 to a design by Percy Monckton, the building was not intended to be a hotel, but rather as
the headquarters of Pearl Assurance Company. In 1989, Pearl relocated their HQ from Chancery Court to Peterborough,
leaving the building unoccupied and economically idle. This idleness would end as redevelopment began in earnest in
the late 1990s and a hotel opening in 2000. Then in 2013, after £85mn of investment, the Grade II listed building re-
opened as a luxury five star hotel.
Not far away from the Rosewood Hotel is the now idle Bow Street Magistrates Court, a building finished in 1881. Over
time, high profile defendants have passed through the doors including the Pankhurst sisters, Oscar Wilde and Dr Crippen.
The building was finally vacated in 2006 having been sold to Irish developers hoping to convert it into a boutique hotel,
the plan derailed by events of 2008. As long as it remains economically inactive, the opportunity costs of its idleness
increase. Those unsure of the practicalities in converting a court house to a hotel need only look across from Covent
Garden to Soho, where the Grade II listed building which was once Great Marlborough Street Magistrates Court – where
Oscar Wilde was also a defendant, as were John Lennon and Mick Jagger - is now a 112-room hotel.
We could go on and map the locations across the length and breadth of Britain of imposing buildings that once provided
employment and economic multipliers which now lie inactive. One wonders whether the economic benefits of a
commercial revival of dormant or idle real estate are appreciated, or whether the mounting opportunity cost of real
estate inactivity is fully understood.
0
2
4
6
8
10
'02
-03
'03
-04
'04
-05
'05
-06
'06
-07
'07
-08
'08
-09
'09
-10
'10
-11
'11
-12
'12
-13
'13
-14
'14
-15
'15
-16
Ra
il p
ass
en
ge
rs o
n f
ran
ch
ise
d o
pe
rato
rs' se
rvic
es,
bn
mil
es
Long distance operators London and South East operators Regional operators
TOSCAFUND BRITAIN’s PROPERTY CREDENTIALS
11 December 2015
1.2.3 Britain’s CRE is better connected
In an age of rapidly-advancing technology, it might seem that the commercial benefits of businesses locating in
proximity to one another are lessening. After all, where once front, mid-and back-office functions demanded closeness,
now the ability to communicate and transmit information instantaneously over large distances has allowed these roles to
be unshackled. Indeed, even in areas of modern engineering the importance of research and development has lessened
the need to actually move goods physically along supply chains. For Britain’s CRE, this unshackling does not make an easy
tale.
For a period, off-shoring was as familiar a sign of the country’s loss of purpose as it was contentious; from call-centres to
manufacturing, it seemed as though Britain was it being evacuated (spurred on by differentials in cost). However, whilst
instances still exist of service providers and manufacturers opting to shift operations from Britain, these are now being
overshadowed by a combination of growing capacity elsewhere as a form of expansion, not substitution. Interestingly,
we are witnessing the return of off-shore capacity, and looking ahead we can anticipate continued ‘near-shoring’ with
firms locating in Britain’s regions, rather than the capital, as cost differentials that are actually favourable to Britain are
exploited. There is also the added benefit of familiar legal and regulatory environments and general infrastructure, very
often absent with once popular off-shore locations. This process is already occurring – for example, Deutsche Bank’s
offices in Birmingham (April 2014), whilst Santander has relocated its call centres to Leeds from India. All this accepted,
one can still argue a pressing need to improve how Britain’s real estate connects across a raft of geographic dimensions;
connecting people with work and businesses with one another.
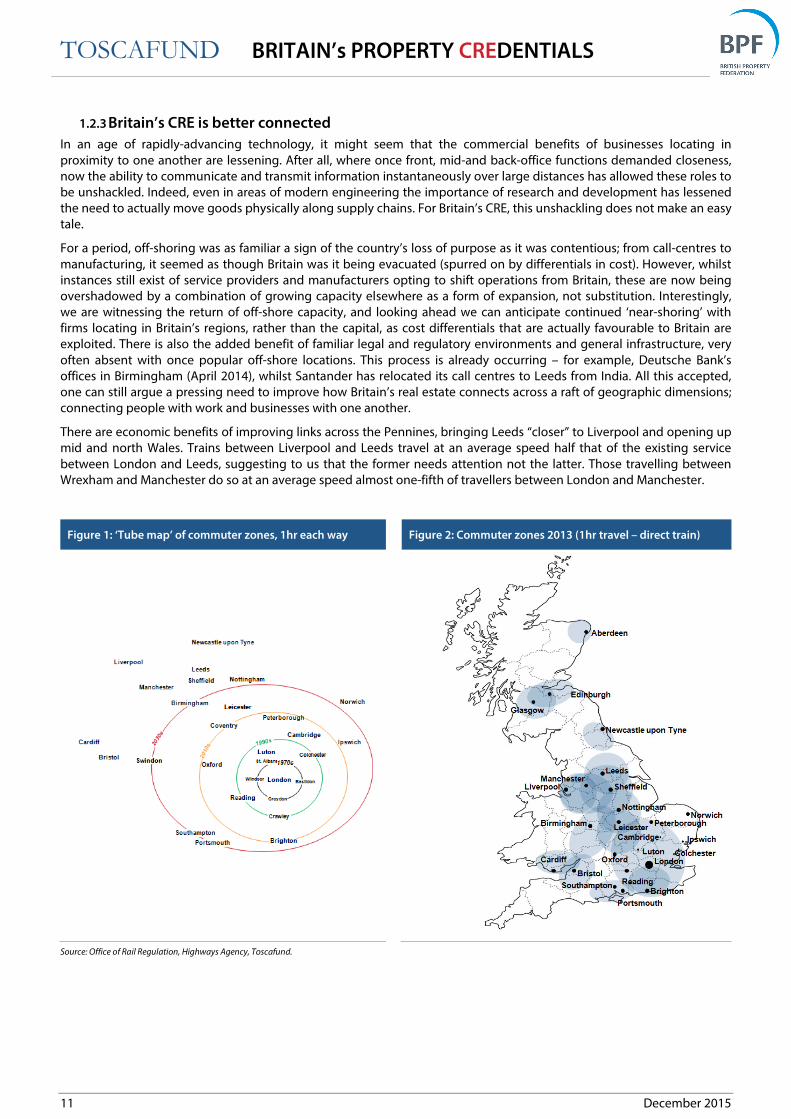
There are economic benefits of improving links across the Pennines, bringing Leeds “closer” to Liverpool and opening up
mid and north Wales. Trains between Liverpool and Leeds travel at an average speed half that of the existing service
between London and Leeds, suggesting to us that the former needs attention not the latter. Those travelling between
Wrexham and Manchester do so at an average speed almost one-fifth of travellers between London and Manchester.
Figure 1: ‘Tube map’ of commuter zones, 1hr each way Figure 2: Commuter zones 2013 (1hr travel – direct train)
Source: Office of Rail Regulation, Highways Agency, Toscafund.

TOSCAFUND BRITAIN’s PROPERTY CREDENTIALS
12 December 2015
Figure 3: HS2 & HS3 plans Table 1: Statistics for selective rail journey across Britain
Time
(hr:min)
Average
Speed (mph)
HS2 Av
Speed
London Manchester 02:07 90.3 169
London Leeds 02:12 84.4 134
London Sheffield 02:05 77.7 123
London Birmingham 01:22 76.3 128
London Nottingham 01:44 72.9 111
Birmingham Bristol 01:21 69.3 Newcastle Manchester 02:23 65.1
London Southampton 01:14 63.2
Middlesbrough Sheffield* 01:56 52.8
Manchester Sheffield 00:48 52.4
Manchester Leeds 00:49 51.9
Birmingham Swansea* 03:01 51.8
Cardiff Liverpool* 03:16 50.6
Glasgow Inverness 03:50 48.4
Manchester Nottingham 01:49 46.7
Edinburgh Aberdeen 02:50 46.0
Middlesbrough Liverpool* 03:36 43.7
Leeds Liverpool 01:50 41.0
Lincoln Manchester* 02:20 39.8
Birmingham Wrexham* 02:09 34.0
Manchester Wrexham* 02:37 21.9
Source: HS2 website, Toscafund. Note: Black line signifies 70mph – National Speed Limit applies - *No direct trains, 1 or 2 stops required.
The table above highlights marked differences in average train travel speeds between regional hubs, some journeys all
the slower because they require passengers to change train. Of course, plans exist to improve the rail network
independently from HS2. The Chancellor, as recently as March 2015, has championed a HS3 high-speed rail link between
Manchester and Leeds, which he argued would reduce the travel time between these cities from 50 to 30 minutes and
help create a “northern global powerhouse”. Following on from George Osborne’s encouragement for improved links
across the Pennines, five cities across the North of England – Leeds, Liverpool, Manchester, Newcastle and Sheffield -
issued a joint report entitled ‘One North’ making the case for major investment in both rail and road links east to west to
improve the economic fortunes of the north by better connecting them. The reality is that the better connection being
encouraged is between commercial centres, and therefore CRE.
Some will throw back at us the argument made earlier that with mobile technology there should be no such thing as
“idle” travelling time. Others will point to “speedy” road links between locations otherwise poorly served by rail. Some will
claim there is no 'commercial' need for rail upgrades to the routes, for example between Wrexham and Manchester. The
argument is that these centres do not have much in the way of a “commercial connection”. Our response is: ‘forge a
reliable and speedy rail link between these, and their commercial connection will become real enough, by far better
commercially connecting their CRE’.
If Britain is to become a truly connected national economy then it demands 21st century links across its length and
breadth, boasting average travel speeds broadly in line across all its regional dimensions. This achievable ambition
should be the foremost aim of spending on transport infrastructure.
TOSCAFUND BRITAIN’s PROPERTY CREDENTIALS
13 December 2015
1.2.4 King’s Cross Central: A case study in inclusive regeneration
From the middle of the 19th century, the Great Northern Railway (GNR) began to develop an east coast mainline service,
with the King’s Cross area of Camden the embarkation point from London. In 1852, the Lewis Cubitt designed King’s
Cross station began operating and two years later the Great Northern Hotel opened its doors. In 1873, the George Gilbert
Scott designed Midland Grand Hotel opened a mile or so from the Great Northern Hotel. The Midland Grand
complemented the newly built St Pancras Station which was the London terminus for the Midland Railway (MR) which
had opened in 1868, boasting the largest single-span roof in the world at the time.
As it was for all their rivals developing railway lines fanning out of London, GNR and MR became voracious buyers of land
to develop real estate assets close to their termini. Both, after all, required goods yards and engine depots and the other
assorted buildings essential for carrying passenger and freight in volumes that seemed destined to only increase with
time. Coal was key to the freight business, arriving into London by rail and then being distributed around London using
the canal network which ran past King’s Cross and not far from St Pancras stations. Added to the area’s real estate was a
gas works. At their height the stations, hotels and related CRE provided the working class neighbourhoods around them
with employment and the ability to earn from the freight and people coming into them. What had seemed to some as an
unrelenting increase in rail traffic was to however not to be the case.
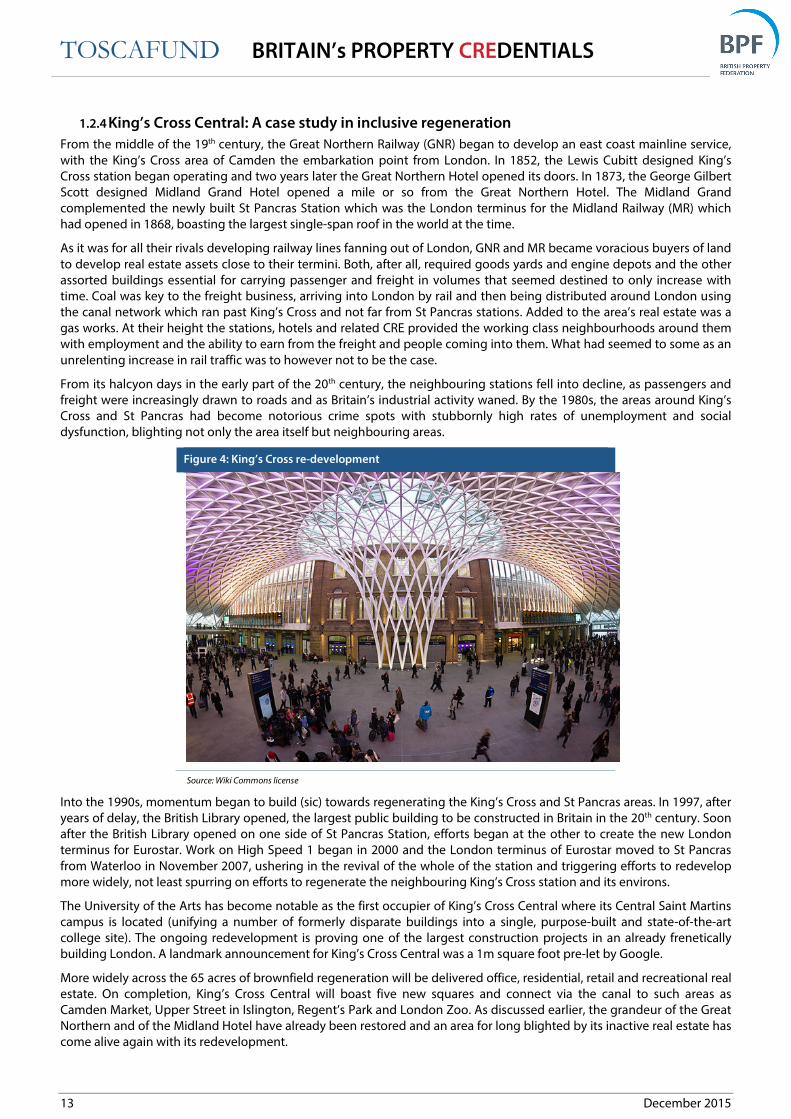
From its halcyon days in the early part of the 20th century, the neighbouring stations fell into decline, as passengers and
freight were increasingly drawn to roads and as Britain’s industrial activity waned. By the 1980s, the areas around King’s
Cross and St Pancras had become notorious crime spots with stubbornly high rates of unemployment and social
dysfunction, blighting not only the area itself but neighbouring areas.
Figure 4: King’s Cross re-development
Source: Wiki Commons license
Into the 1990s, momentum began to build (sic) towards regenerating the King’s Cross and St Pancras areas. In 1997, after
years of delay, the British Library opened, the largest public building to be constructed in Britain in the 20th century. Soon
after the British Library opened on one side of St Pancras Station, efforts began at the other to create the new London
terminus for Eurostar. Work on High Speed 1 began in 2000 and the London terminus of Eurostar moved to St Pancras
from Waterloo in November 2007, ushering in the revival of the whole of the station and triggering efforts to redevelop
more widely, not least spurring on efforts to regenerate the neighbouring King’s Cross station and its environs.
The University of the Arts has become notable as the first occupier of King’s Cross Central where its Central Saint Martins
campus is located (unifying a number of formerly disparate buildings into a single, purpose-built and state-of-the-art
college site). The ongoing redevelopment is proving one of the largest construction projects in an already frenetically
building London. A landmark announcement for King’s Cross Central was a 1m square foot pre-let by Google.
More widely across the 65 acres of brownfield regeneration will be delivered office, residential, retail and recreational real
estate. On completion, King’s Cross Central will boast five new squares and connect via the canal to such areas as
Camden Market, Upper Street in Islington, Regent’s Park and London Zoo. As discussed earlier, the grandeur of the Great
Northern and of the Midland Hotel have already been restored and an area for long blighted by its inactive real estate has
come alive again with its redevelopment.
TOSCAFUND BRITAIN’s PROPERTY CREDENTIALS
14 December 2015
1.2.5 CRE: Walking on water
It is unlikely that many of those walking along the Thames Embankment will be aware it was once marsh land. For it was
only in 1862, after a great many previous attempts had been thwarted, that the Sir Joseph Bazalgette project began.
On the completion of the Embankment, it had reclaimed a total of 22 acres of land from the Thames. Reclaimed too were
the Victoria - again along the north bank of the Thames - and Albert - along its south - Embankments. The embanking of
the Thames was, of course, far from the only way its natural landscape has been complemented over time by man-built
landscape.
We argue that a bridge or a tunnel should be considered Commercial Real Estate. Let us consider this with some actual
instances.
Over the years, bridges and tunnels have been added so as to connect the north and south sides of a rapidly expanding
London. Along the stretch where the Thames passes through the capital, the first fixed crossing was built by the Romans,
where London Bridge now straddles.
More bridges have been added to the London stretch of The Thames quite recently, the Millennium and Jubilee
pedestrian bridges in 2002. There is even talk of a Garden Bridge beginning near Temple Station linked to the Southbank
Centre. In a moment, we will consider another scheme being hotly debated, but before we do, let us return to those
bridges added in the 19th century.
A railway bridge across the Thames was opened in 1864 by St Paul’s (later renamed Blackfriars). This carried trains of the
London, Chatham and Dover Railway line. Alongside this bridge a second St Paul’s bridge would open in 1886, becoming
Blackfriars Bridge in 1937. The original St Paul’s bridge would however be removed in 1985 with its rail traffic taken
instead by Waterloo Station. Its southern abutment and a series of imposing piers would remain testament to its
existence, and from 1985 until 2009 the piers would remain curiosities to those walking across – the second – Blackfriars
Bridge. They were reclaimed by the railway when a state of the art station was opened in 2012.
The piers of the original Blackfriars (nee St Paul’s) Bridge now support the world’s first station with platforms that span a
river. It is also the world’s largest solar bridge, providing 50% of the station’s energy needs. Whilst we can debate whether
railways stations and tracks constitute CRE, many of those travelling to, through or from Blackfriars Station will be doing
so for commercial good. It is also instructive to reflect on how bridges across the Thames were once lined by shops and
homes with tolls commonly levied on those crossing them.
This section began by reflecting on a particular instance where marsh land has been reclaimed to create London’s
impressive Embankment. We suggested that few of those walking or driving along it would know it was not “natural”, just
as many today may be unaware of other instances of land reclamation around us; for instance the Fenns. With this in
mind and in wondering where else land will be reclaimed it is impossible not to think of the Thames Estuary Airport,
which is part of a far larger reclamation plan for the Thames Gateway.
Much like the Embankment before it, the Estuary Airport idea has been talked about for some time, the first proposals
dating to the 1970s. Most recently those supporting the idea of an island airport point to successful precedents: the
airports in Osaka, Japan and Hong Kong. Proponents also present figures suggesting the value of the economic and
commercial benefits to areas in and around the new airport, bringing windfalls first in its construction and then
operation.
What cannot be in any doubt is the very real London Gateway development at Thurrock in Essex. This ambitious project is
forecast to last another 10 years and generate tens of thousands of jobs as DP World invest upwards of £1.5bn in the
scheme to create 2,700 metres of quay. Alongside the port infrastructure will sit considerable commercial real estate, the
distribution part alone occupying a 300 hectare site with planning permission for 10 million square feet of developed
space across its logistics park. The project comprises, amongst other elements one of the world’s largest deep-water
ports to handle the biggest container ships, a port complemented by one of Europe’s largest logistics parks and another
instance of overseas capital (in this instance from the UAE) entering the UK and targeting commercial infrastructure
projects.

TOSCAFUND BRITAIN’s PROPERTY CREDENTIALS
15 December 2015
1.2.6 CRE flying high
As affordable air travel took off, so too did an increasing number of holidaying Britons, and as the airports swelled with
those opting to travel abroad, the effects were felt at home. From coastal guest houses and holiday camps, to the
restaurants, bars and entertainment venues which relied heavily on seasonable tourism, a section of British commercial
real estate fell into decline, property which by its nature was regionally concentrated, blighting entire towns.
Although Britons continue to travel abroad with growing frequency and rising numbers, Britain’s tourist industry has
more recently enjoyed a renaissance, doing so as both Britons themselves opt to spend part of their leisure time on their
own shores and as a rising number of international tourists enter the country. Indeed, Britain is now the world’s eighth
most popular destination, with a historic high of 33 million visits1 in 2013, this growth being spurred on by arrivals from
emerging markets.
Tourists coming to Britain bring with them considerable windfalls to the economy, not least to our external account in
delivering valuable foreign income. Improved CRE has been a major contributor to this revival, bringing improvements to
hotel and recreational real estate but also to the transport network, including the development of regional airports.
Indeed, the budget airline model which at first proved so damaging to the fortunes of Britain’s domestic holiday sector is
now contributing strongly to its revival. For along with road and rail travel, affordable internal air travel is allowing visitors
to spend their time in Britain in a variety of different locations.
Budget airlines are also allowing Briton’s to travel around their country more affordably for both leisure and work. Indeed,
entirely new commuter classes have been created and so too inventive new acronyms; notably WILLIE – Work In London,
Live In Edinburgh. As we have already emphasised, such mobility can only help improve the growth mix across Britain,
and improvements to CRE is the structural element that makes this possible.
1 The figures relate to the number of completed visits, not the number of visitors. Anyone entering or leaving more than once in the same period is counted on each visit. The count of visits relates to UK residents returning to this country and to overseas residents
leaving it.

TOSCAFUND BRITAIN’s PROPERTY CREDENTIALS
16 December 2015
1.3 Offices and IT Despite the impact of technology in creating a virtual economic dimension, built space remains essential not only for
“traditional” activity but for the virtual world to function effectively. Offices currently account for a quarter of all
commercial real estate.
1.3.1 CRE in the clouds
As its traditional manufacturing has made way for a wide range of services, Britain’s CRE has been filled less and less by
plant and machinery and more and more by telephonic equipment, computers and all the servers and IT backups
essential to their operations. At first, the spatial demands of this kit was considerable, noisy “comms” rooms, which whilst
sometimes relatively small, often take up a not insignificant share of scarce and costly office space. However, as
equipment became more powerful, it began to shrink, and improved software required smaller hardware. More recently,
cloud computing has proven transformational, growing at 50% annually.
By utilising “The Cloud”, an ever growing number of businesses across Britain are able to do away with a large amount of
their individual computing infrastructure, thus releasing them from hardware which is expensive in both monetary and
floor-space terms. Whilst these changes within offices are relatively small, they are just one of a great many changes seen
across Britain’s CRE, and consequently leads us to another, the growth of data centres.
Across Britain, there are now 210 data centres. These provide their clients with a range of services including data storage,
security and business continuity. The choice of location for these relies on a range of requirements including proximity to
power grids and telecommunication infrastructure. Furthermore, there has to be consideration of transport links and
closeness of emergency services, since these will affect risk and security. In terms of their management, whilst Data
Centres are labour un-intensive, what staffing is demanded is highly specialist and carefully selected.
Just as the internet is altering how we shop, so too does virtual data storage and management. Just as the internet is far
from eliminating the need for retail CRE across Britain but instead changing the precise configuration of property
required to deal with “click and collect” spending, so too with virtual data storage. In place of its proliferated “comms
rooms”, Britain, faster than almost any other economy, is seeing the development of a relatively new type of CRE, Data
Centres. Whilst some may carry the title Cloud Centres, these are all very much Real Estate that the modern British
economy could not possibly function without.
1.3.2 CRE and the internet
To satisfy their durable, consumable and particularly food needs, Britons once almost exclusively visited stores to scan
shelves from which we would pick the goods that the customer would then transport home. Now we are increasingly
scanning websites to simply click for delivery. The implications of this behavioural change are proving as profound on the
CRE market as they are being misinterpreted. Whilst the nature of the ongoing shift is unprecedented, it is wrong to
imagine that the built landscape for retail is being altered for the first time or necessarily for 'the worse'.
The ongoing migration of footfall retail custom to the internet is having a profound influence on Britain's CRE. However,
far from reducing the precise floor space required by the grocery and non-food sectors, it is altering the nature of the
property needed, where it is needed to be and what form it needs to be in.
In place of CRE to display wares for shoppers to consider, Britain has a growing need for large central sheds from which to
distribute goods clicked from websites. In some cases these act as large hubs for more local distribution centres.
Behavioural shifts in retail are far from unknown, the superstores and retail parks that we are now so familiar with date
(for the most part) from the 1990s, and just as the development of these formats required an entirely new property
profile, so too do the new generation with the rise of internet-based sales and home delivery. British households are
changing their patterns of consumption and the impact on its CRE has not been confined to goods but services.
Consider the travel agents that were once ubiquitous on high streets. Whilst still present, their numbers have fallen
markedly. There has been a migration of the sector's property requirement, rather than its total elimination. Where staff
occupied relatively small high street travel agencies, they now sit in large call centres, and where once bookings were
almost entirely for travel abroad, Britain is seeing a growth in vacationing on its own shores, ushering yet more change to
its CRE landscape as holiday parks expand to meet this need.

TOSCAFUND BRITAIN’s PROPERTY CREDENTIALS
17 December 2015
1.3.3 Google: search for a real presence
Google has dramatically altered how we behave and is a service that we can connect to practically everywhere, two
million searches are made in Britain. With £3.4bn and £70.8m in UK revenue and profit respectively, Google directly
employs 52,069 workers around the world and only 1,835 in Britain.
For a time, Google became the symbol of all the threats to Britain's CRE. Many saw a business so dominant across virtual
space that it would confine itself to only a modest physical presence, and concerns over the real estate take-up of Google
and the growing numbers of other web-accessed businesses led to talk of a 'paradigm shift in the need for CRE across
Britain. This idea was summarily quashed when, on 17 January 2013, it was revealed that Google had pre-let a staggering
one million square feet of space at London's King’s Cross.
The Google/King’s Cross letting announcement was made all the more remarkable by the fact that Argent, the
developers behind the area's 2.4-acre regeneration, planned on restricting any single occupier to one 10th of what will be
delivered to Google. From being the epitome all the challenges to Britain's CRE, Google was recast as a role model for all
the benefits that the virtual world can offer the real estate world.
1.3.4 Sometimes developing Britain's CRE does not quite reach The Pinnacle
The development of The Shard and redevelopment of King’s Cross Central in London and Birmingham's Bullring Centre
stand up as examples of Britain's modern CRE being enhanced by perseverance and innovative design combined with
capital and even occupiers from overseas. However, not all planned developments have progressed as relatively
smoothly as these.
Plans for The Bishopsgate Tower were submitted in June 2005 and approved within a year, with demolition of existing
property beginning 12 months later. Preparation for construction started in May 2008, and within six months it was
announced that the originally speculative building had won two pre-lets, one for 80,000 square feet of office space and
the other for the restaurant intended to top the 945 foot, 63-floor tower (scaled down from 1,007 feet because of Civil
Aviation Authority concerns). Even at its reduced height the building, on being topped out, would be the highest in The
City of London and second tallest across the EU. Funding for the project was sourced from Saudi Arabia's Economic
Development Corporation and Arab Investments.
Even after the financial crisis struck work continued on what had by this time been renamed The Pinnacle, but whose
curling design led to it more fondly become known as The Helter Skelter. By the beginning of 2012 the Pinnacle's core
had reached the sixth floor and even uncertainty over continued funding seemed to have ended. Then work stopped, for
reasons, so it was suggested, ranging from a funding shortfall to problems with pre-lets because of the building’s
unconventional and impractical interior specifications. Construction has been suspended since, with speculation at one
point that the part built structure would be levelled and a less ambitious scheme undertaken. More recent talk has
suggested that when the project does resume, following approval of its re-design, it will be with the same eye-catching
exterior but much altered interior floor plans.
The experience of The Bishopgate Tower/The Pinnacle/Helter Skelter, blends a great many themes covered in this report.
The ambition to upgrade 'underbuilt' office CRE with a mix-use skyscraper funded from overseas, built speculatively and
with a wholly unusual and controversial design. It also perfectly illustrates how “events” over the inevitable drawn-out
development time line which large projects demand, can derail and delay. The reality all the same is that this unfinished
building happens to be located at the heart of the City of London’s thriving commercial underwriting and insurance
district, where other proximate schemes, 20 Fenchurch Street (the “Walkie-Talkie”) and 122 Leadenhall Street (The
“Cheesegrater”) having both proven that it is always possible to deal successfully with “events”.

TOSCAFUND BRITAIN’s PROPERTY CREDENTIALS
18 December 2015
1.3.5 Global purpose & competitiveness
To ensure its success, a large part of Britain's commercial property estate has to compete with international rivals. In this
brief section, we explain why Britain's commercial property estate holds a privileged position explained by a range of
factors. Some are exogenous to the property estate per se, such as Britain occupying a time zone positioned favourably
for around the clock activity for those in the Americas as much as those across Asia. In addition, Britain’s real estate is
located in an English-speaking economy with a long tradition of being home, for some an adopted home, to a highly
educated and skilled work force. Other factors are, however, very much endogenous, such as quality of build and
provenance of ownership. Most important of all, has been the pragmatism needed to deliver the type of property
essential for success even if this has meant a degree of development upheaval, and nowhere has this been more in
evidence than in London and in particular the “Square Mile”.
Around the City, one can identify place names that trace the Gates that once allowed access through the defensive
“London Wall”, and within the historic City of London, there are institutions that have occupied the same “premises” for
centuries. From the imposing Bank of England on Threadneedle Street, to the seemingly timeless George and Vulture
chop house in Castle Court, many date from the 18th century and some from long before. The idea, however, that the City
of London is unchanging is not something one familiar at close quarters with it would accept. For all its apparent
timelessness, the City of London has in fact been in constant evolution, with its buildings replaced with almost indecent
haste according to some.
Few aspects of the City’s architecture have seemed beyond limits: a large part of the original Bank of England styled by Sir
John Soane was demolished to make way for the Sir Herbert Baker creation present today. Even the “City institution” that
is the George and Vulture restaurant has come close to demolition. The reality is that whilst the names of its streets have
become timeless symbols of its position in global finance, the City of London’s architecture has not simply matched
contemporary design, but defined it. From the “Nat West Tower” opened in 1980, to the Lloyds Building first unveiled in
1986, to the “Gherkin”, 18 years later, London’s skyline has been in constant flux, a rate of change which has only
accelerated over time, creating a sense, in some cases, of architectural disposability. With each new construction comes a
new group of tenants, often including those who could not have been anticipated even a handful of years earlier, hence,
there is a natural evolution in the occupational character of London’s office space.
London is in the throes of delivering noticeable improvements to its transport infrastructure. It can look forward to
Crossrail and other upgrades to under and over-ground rail systems. By 2020, London will boast a number of impressive
new business districts, centred on the transport hubs of Paddington, London Bridge and King’s Cross, the latter being the
embarkation and disembarkation point for Eurostar.
The delivery of HS2, Crossrail, the Northern line extension and other transport improvements are all part of London’s
future. Returning our focus to its past, one could chronicle the City of London’s history in global finance back many
centuries, over which the nature and origin of its occupiers has changed and changed again and so too its property
estate.
TOSCAFUND BRITAIN’s PROPERTY
19
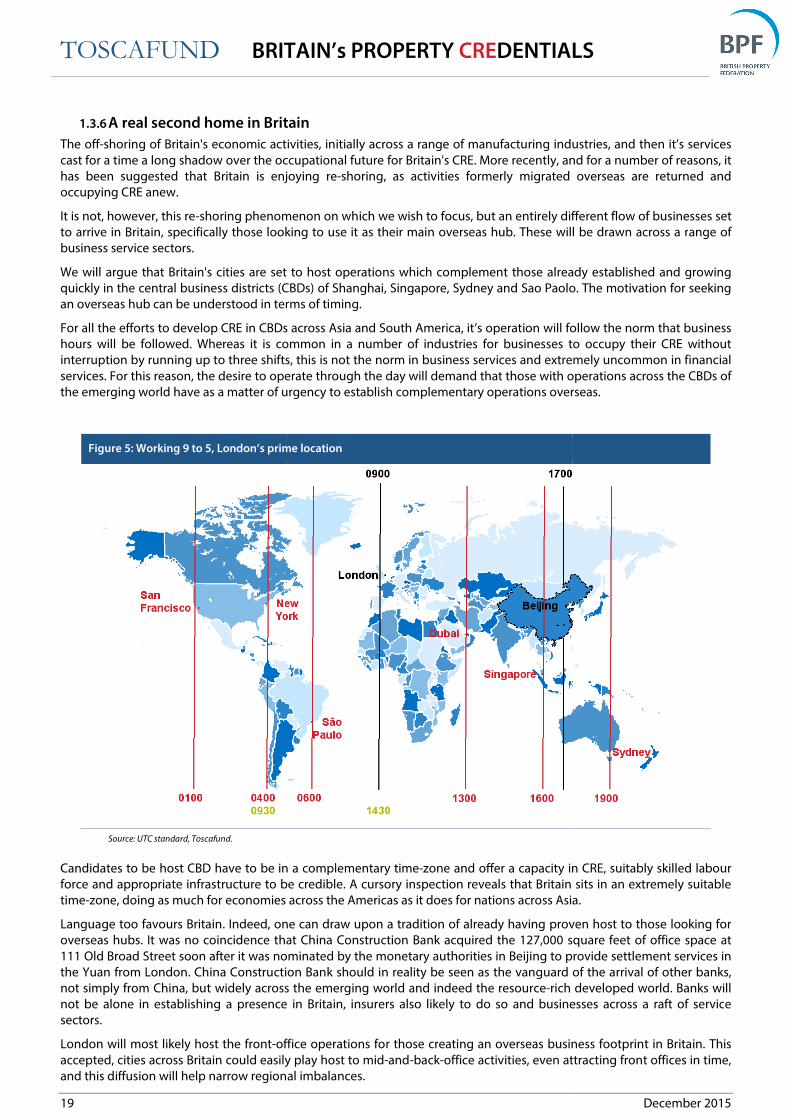
1.3.6 A real second home in Britain
The off-shoring of Britain's economic activities, initially across a range of manufacturing industries, and then i
cast for a time a long shadow over the occupational future for Britain's CRE. More recently, and for a number of reasons,
has been suggested that Britain is enjoying re
occupying CRE anew.
It is not, however, this re-shoring phenomenon on which we wish to focus, but an entirely different flow of businesses set
to arrive in Britain, specifically those looking to use it as their main overseas hub. These will be drawn across a r
business service sectors.
We will argue that Britain's cities are set to host operations which complement those already established and growing
quickly in the central business districts (CBDs) of Shanghai, Si
an overseas hub can be understood in terms of timing.
For all the efforts to develop CRE in CBDs across Asia and South America, it’s operation will follow the norm that business
hours will be followed. Whereas it is common in a number of
interruption by running up to three shifts, this is not the norm in business services and extremely uncommon in financial
services. For this reason, the desire to operate through the day will demand tha
the emerging world have as a matter of urgency to establish complementary operations overseas
Figure 5: Working 9 to 5, London’s prime location
Source: UTC standard, Toscafund.
Candidates to be host CBD have to be in a complementary time
force and appropriate infrastructure to be credible. A cursory inspection reveals that Britain sits in an extremely suitable
time-zone, doing as much for economies acr
Language too favours Britain. Indeed, one can draw upon a tradition of already having proven host to those looking for
overseas hubs. It was no coincidence that China Construction Bank acquired the 127,0
111 Old Broad Street soon after it was nominated by the monetary authorities in Beijing to provide settlement services in
the Yuan from London. China Construction Bank should in reality be seen as the vanguard of the arriv
not simply from China, but widely across the emerging world and indeed the resource
not be alone in establishing a presence in Britain, insurers also likely to do so and businesses across a raft of servic
sectors.
London will most likely host the front-office operations for those creating an overseas business footprint in Britain. This
accepted, cities across Britain could easily play host to mid
and this diffusion will help narrow regiona
BRITAIN’s PROPERTY CREDENTIALS
A real second home in Britain
shoring of Britain's economic activities, initially across a range of manufacturing industries, and then i
cast for a time a long shadow over the occupational future for Britain's CRE. More recently, and for a number of reasons,
Britain is enjoying re-shoring, as activities formerly migrated overseas are returned and
shoring phenomenon on which we wish to focus, but an entirely different flow of businesses set
to arrive in Britain, specifically those looking to use it as their main overseas hub. These will be drawn across a r
We will argue that Britain's cities are set to host operations which complement those already established and growing
quickly in the central business districts (CBDs) of Shanghai, Singapore, Sydney and Sao Paolo.
an overseas hub can be understood in terms of timing.
For all the efforts to develop CRE in CBDs across Asia and South America, it’s operation will follow the norm that business
hours will be followed. Whereas it is common in a number of industries for businesses to occupy their CRE without
interruption by running up to three shifts, this is not the norm in business services and extremely uncommon in financial
services. For this reason, the desire to operate through the day will demand that those with operations across the CBDs of
the emerging world have as a matter of urgency to establish complementary operations overseas
Figure 5: Working 9 to 5, London’s prime location
to be in a complementary time-zone and offer a capacity in CRE, suitably skilled labour
force and appropriate infrastructure to be credible. A cursory inspection reveals that Britain sits in an extremely suitable
zone, doing as much for economies across the Americas as it does for nations across Asia.
Language too favours Britain. Indeed, one can draw upon a tradition of already having proven host to those looking for
overseas hubs. It was no coincidence that China Construction Bank acquired the 127,000 square feet of office space at
111 Old Broad Street soon after it was nominated by the monetary authorities in Beijing to provide settlement services in
the Yuan from London. China Construction Bank should in reality be seen as the vanguard of the arriv
not simply from China, but widely across the emerging world and indeed the resource-rich developed world. Banks will
not be alone in establishing a presence in Britain, insurers also likely to do so and businesses across a raft of servic
office operations for those creating an overseas business footprint in Britain. This
accepted, cities across Britain could easily play host to mid-and-back-office activities, even attracting front offices i
onal imbalances.
DENTIALS
December 2015
shoring of Britain's economic activities, initially across a range of manufacturing industries, and then it’s services
cast for a time a long shadow over the occupational future for Britain's CRE. More recently, and for a number of reasons, it
shoring, as activities formerly migrated overseas are returned and
shoring phenomenon on which we wish to focus, but an entirely different flow of businesses set
to arrive in Britain, specifically those looking to use it as their main overseas hub. These will be drawn across a range of
We will argue that Britain's cities are set to host operations which complement those already established and growing
ngapore, Sydney and Sao Paolo. The motivation for seeking
For all the efforts to develop CRE in CBDs across Asia and South America, it’s operation will follow the norm that business
industries for businesses to occupy their CRE without
interruption by running up to three shifts, this is not the norm in business services and extremely uncommon in financial
t those with operations across the CBDs of
the emerging world have as a matter of urgency to establish complementary operations overseas.
zone and offer a capacity in CRE, suitably skilled labour
force and appropriate infrastructure to be credible. A cursory inspection reveals that Britain sits in an extremely suitable
oss the Americas as it does for nations across Asia.
Language too favours Britain. Indeed, one can draw upon a tradition of already having proven host to those looking for
00 square feet of office space at
111 Old Broad Street soon after it was nominated by the monetary authorities in Beijing to provide settlement services in
the Yuan from London. China Construction Bank should in reality be seen as the vanguard of the arrival of other banks,
rich developed world. Banks will
not be alone in establishing a presence in Britain, insurers also likely to do so and businesses across a raft of service
office operations for those creating an overseas business footprint in Britain. This
office activities, even attracting front offices in time,

TOSCAFUND BRITAIN’s PROPERTY CREDENTIALS
20 December 2015
The reality is that Britain stands poised to be chosen as the preferred overseas hub for a raft of businesses from across the
emerging world. These promise to deliver wide ranging wealth benefits and generate considerable economic multipliers.
For Britain to welcome such arrivals, an expansion in its CRE capacity will be crucial, not simply in London but widely
across all its cities.
1.3.7 A Central Point: CRE unchanging on the outside but evolving within
One of the first skyscrapers in London, Centre Point has slid down the list to become the city's joint 27th tallest building.
This said it dominates the sky line from much of central London, and since 1995 can boast Grade II listed status. Centre
Point is an intriguing example of how so much has changed since its completion in 1966. The 385-ft office tower,
designed by Richard Seifert, stood empty for five years having been built speculatively. Its developer, the controversial
Harry Hyams, hoped for a single occupier for Centre Point, and stubbornly rejected offers to lease individual floors. On
finally receiving tenants, it has seen an evolution in occupiers which illustrates the changing nature of Britain's economy.
From July 1980 to March 2014, the building was the headquarters of the Confederation of British Industry (CBI). Occupiers
now in the building include US talent agency William Morris Agency; the state-owned national oil company of Saudi
Arabia, Aramco; Chinese oil company Petrochina; and electronic gaming company EA Games, a range of tenants who are
notable for being multinational, as much as multi-sector.
As well as a varied group of office occupiers, Centre Point is home to Paramount which opened in 2008, initially operating
as a private members club, this was changed in 2010 with Paramount opening to the general public. Occupying the top
three floors of the building, Paramount includes event space on the 31st floor, a bar and restaurant on 32nd and a 360-
degree viewing gallery on the 33rd floor – the top floor of the building.
In February 2013, the global members club for creative industries, ‘Apartment 58’, launched APT58 at Centre Point. The
members club, on the lower floors of the building, features a night club, meeting rooms, a locker and mail service and a
lounge. The venue also includes a late-license ground floor street-food concept restaurant.
Having passed through a series of owners since Hyams, Centre Point is now in the hands of Almacantar. It has received
planning permission to further refurbish the building. Its occupancy profile will change again, with plans for its
redevelopment into 82 luxury apartments, a pool, spa and gymnasium and 42,000 square feet of retail and restaurant
space.
With Centre Point, we have another example of British CRE unchanging on the outside and for periods economically
inactive on the inside, and whose occupation has evolved rapidly over recent years, spurred on by overseas tenants and
their capital, producing positive economic multipliers and externalities to commercial and indeed residential real estate
around it. These changes have been spurred on too by improvements to transport infrastructure in the vicinity of the real
estate.

TOSCAFUND BRITAIN’s PROPERTY CREDENTIALS
21 December 2015
1.4 Educating CRE Education is one of the UK’s most property hungry “commercial” sectors, we reflect on the recent and prospective
growth.
1.4.1 British universities
There may be some curiosity as to why Britain still has a predominance of non-profit making Universities and other
institutions of higher education, which we have identified as quasi-CRE? After all, the enhancement they provide to the
human capital of their students will associate in general with a long-term gain which should attract commercial and
entrepreneurial interest. The reality is that there are many privately and very commercially operated colleges across
Britain serving the needs of students originating mostly from overseas. Their reputations are, almost without exception,
inferior, precisely because of suspicions over their motivation. There is certain to be a suspicion that the motivation
behind the college is less about improving the human capital of students than about raising the financial capital of its
operators. It is for this reason, where reputation concerns are either real or imagined, that so many HEIs remain
stubbornly within the realms of quasi CRE rather than morphing into its direct form.
The University of Buckingham is an institution holding a Royal Charter and has a strong reputational standing, but it
operates with a funding structure outside of the norm; a HEI which could rightly be considered to be in the private sector.
The University of Buckingham operates with charitable status, but it’s model is nonetheless commercial. Looking ahead,
we would not be surprised if established HEIs begin to alter their models to move closer to the funding practice of the
University of Buckingham, and so overcoming reputational risk as they become “more commercial”.
1.4.2 An educated CRE case study: The University of Buckingham
The University of Buckingham’s size should not distract from the growth that it has achieved and the potential it
promises, more than doubling its student body in five years, and investing generously to maintain this momentum.
Whilst it may operate with charitable status as a non-profit making body dedicated to education and research, it can
boast being Britain's first independently funded University holding a Royal Charter. It is also unique in offering two year
full-time degree programmes. Its behaviour and experiences perfectly capture how refurbishing existing and building
entirely new CRE is at the core of successful ‘business’ growth.
Whilst we have illustrated elsewhere how a bridge can be economically empowering (in Part 1.2.5), and so be very
commercial indeed, The University of Buckingham has only quite recently shown just how this illustration can be made
very real.
Consider this extract from its annual report and financial statement for the year to December 31st 2012: “we will be
building a bridge this year over the river to link the six acres of the right bank that we now own, to the main campus. We
are applying for planning permission to start the development of the right bank.”
Here we have evidence of investing in property infrastructure being at the forefront of the development of revenue
generating CRE.
We have also reflected on the power of Britain's CRE to generate foreign earnings. With one-third of the student body
originating outside the EU and absolute numbers growing, here again The University of Buckingham provides a real
instance of this favourable trend.
Consider also the idea that refurbishment and refocusing can bring property back into economic life. Let us draw again
from the University of Buckingham's most recent annual report, where the Vice-Chancellor reflects on property:
“We have refurbished all of the Tanlaw Mill, from top to bottom, and it has been transformed as students' building and as
a Students Union. And to further improve the recreational spaces for the students, we are completing the refurbishment
of the cellars in the Franciscan Building. Meanwhile the newly-refurbished Radcliffe Centre, a converted church which
provides a 150-seat venue for lectures, performances and community events, has added significantly to the capacities of
the University. The refurbishment of Prebend House and of its gardens has now been completed [which we] are using as
the postgraduate centre of the School of Humanities, which speaks of our general commitment to upgrading research
within the University.”
In this one passage, we see evidence of a church conversion, cellars being made useful as “recreational spaces” and
evidence further of investment to attract undergraduates by improving the quality of their experience, whilst also
capitalising on how postgraduates can engage (often very commercially) with academics in research. On this note, the
Vice-Chancellor was keen to that that “much of the growth of the University can be attributed to the growth of the
Business School, which now has twice as many students as four years ago. We continue to be proud of our Business
Enterprise programme, which currently has students running a number of intriguing businesses”.
The following extract gives some idea of the University of Buckingham's growth ambition, “we are working with the
Milton Keynes Hospital NHS Trust over the possible creation of an undergraduate medical school”.

TOSCAFUND BRITAIN’s PROPERTY CREDENTIALS
22 December 2015
1.4.3 Britain's Real Commercial Education Industry
Even though they are not motivated by profit we have characterised Britain's HEIs holding Royal Charter's as quasi-
commercial, and identified their real estate accordingly. Whilst some will contest this intermediate designation even for
the independently funded University of Buckingham (considered elsewhere), they cannot deny Britain's fully commercial
and growing further education industry.
Chart 2: UK HEIs income from tuition fees & education contracts Chart 3: Long term migration to the UK by reason given
Source: HESA, ONS, Toscafund
Britain is home to at least 670 private colleges, almost all run on commercial lines. Whilst mainly concentrated in and
around London, often specialising as English language schools, 50% of these colleges are peppered across the country,
almost invariably in proximity to HEIs carrying a Royal Charter. Indeed, outside of normal term-time there is a trend
amongst the latter to open their doors to foreign students, most notably by operating summer schools operating literally
and financially on commercial grounds.
The reality is that even if we were to exclude Royal Charter holding HEIs, educating fee-paying foreign students is proving
a growth market across Britain and one where its real estate is playing an essential role. True distance learning is a feature
of modern education. The number of overseas students enrolled on fee-paying tertiary courses per annum across Britain
has increased by about 70% since 2002, and trending upwards still. The reality is that face to face tutorials, delphic
learning and the travel experience to other countries all have considerable chargeable value. A few nations hold a more
sought after Positional Product Proposition in education than Britain.
Let us repeat a point we have made throughout this research, commercial and quasi-commercial education sectors are
providing ever more valuable capital streams into Britain's external and internal accounts; external because of the foreign
earnings brought in through direct student fees, and internal because of the consumption, notably on accommodation,
performed by students from overseas during their period of study in Britain.
Students in full time HEI are proving one of the fastest growing markets for Britain's Private Residential Sector (PRS) with
companies such as the two London listed; Empiric and UNITE. Empiric comprises of 29 properties with 11 assets under
development, an aggregate of 3,503 beds. Whilst UNITE has 45,000 beds and is studied in depth in section 1.4.5.
Liberty Living, with its 16,827 room student accommodation portfolio covering 42 residences, considered an IPO in 2014
and was later bought by the Canada Pension Plan Investment Board for £1.1bn. CPPIB Liberty Living acquired a further
2,153 beds for £330m in August 2015.
Developers of purpose built student accommodation (PBSA) have risen to the challenge. One such example is Watkin
Jones Group who have developed more than 25,000 student units since 1999, with a third of those student units (7,800
student units) built in just the last three years.
In short, with fee-paying education one of Britain's fasting growing sectors, it cannot fail to register as an ever-larger
owner and occupier of full and quasi commercial real estate, coincident with its customers (students) representing an
ever more sizeable share of Britain's rental sector.
20
25
30
35
40
45
50
0
5
10
15
20
25
30
35
2005 2006 2007 2008 2009 2010 2011 2012 2013 2014
%
£ b
illi
on
s
Tuition fees and education contracts Total Tuition fees and education contracts share (rhs)
0
50
100
150
200
250
2005 2006 2007 2008 2009 2010 2011 2012 2013 2014 2015*
Th
ou
san
ds
All Migrants less Formal Study Formal Study

TOSCAFUND BRITAIN’s PROPERTY CREDENTIALS
23 December 2015
1.4.4 Education, Education & Education
Britain's Higher Education Institutions (HEIs) are expanding, and as they do, they are creating CRE. They are adding
campus capacity for tuition, recreation and accommodation, forging something of a hybrid industry. For whilst in its core
a university sits within the education sector, it is part purpose built student accommodation, part leisure and recreation
and part broader CRE, where the campus extends to business and science parks.
After all, just as it could be argued that hotel rooms can be considered to fall within the private rental sector so too
student accommodation. As student numbers rise, so will the need to add to the PRS element of Britain's CRE, the
demands on which, do not however end there.
As Britain’s education sector continues on its impressive expansion path, a commensurate rise in its staffing levels -
academic and support - will be required.
1.4.5 Case Study: Students, UNITE-d
Back in 1991, research carried out by Bristol’s University of the West of England suggested disused inner-city office blocks
could be converted into low-cost student housing. Within a year, the first UNITE property had opened in Bristol. At a time
when the choice was between the draughty, often drab, halls of residence offered by the universities, or to rent a spare
room from an obliging but not always personable landlord, UNITE offered students comfort, convenience and
affordability.
Chart 4. UK student numbers, million Chart 5. UNITE revenues, £ million
Source: HESA, UNITE Group (Bloomberg), Toscafund (forecasts)
Since listing on the London Stock Exchange in 2000, UNITE has expanded considerably, adding to its core Bristol and
London portfolios and expanding into other regional cities, notably Leeds, Manchester, Liverpool and Sheffield. UNITE
has grown in tandem with the rising number of international students seeking easy-to-arrange and reputable
accommodation. The firm currently provides over 45,000 beds in 28 university towns and cities. It recently raised £115m
to fund further expansion, with the aim of funding its development pipeline in key university towns and cities.
Whilst the UNITE model has gone through changes, the emphasis remains redevelopment and conversion of former
commercial properties into student accommodation. UNITE’s story is not unique and highlights one of our core points in
assessing the growth future of Britain’s regional cities and the importance of commercial property in its dormitory form.
Britain's undergraduate accommodation is not simply serving students from abroad but investors too.
0.0
0.1
0.2
0.3
0.4
0.5
0.6
0.7
0.8
1996 2000 2004 2008 2012 2016 2020 2024 2028
Student numbers, mn
England Scotland Wales NI
Tuition fees
introduced:
maximum £1000
Top-up fees
introduced:
capped at £3000
Impact of Browne
Review: fees raised
to £7500-9000
0
50
100
150
200
250
300
1998 2000 2002 2004 2006 2008 2010 2012 2014
Re
ve
nu
e, £
mil
lio
n

TOSCAFUND BRITAIN’s PROPERTY CREDENTIALS
24 December 2015
1.5 Great retail developments Britain’s evolving retail sector is two-fold, with both large city-centre transformations (Birmingham’s Bull ring centre for
example) and much smaller retail pop-ups adapting to the modern day shopper.
1.5.1 The Amazon story: Reading between the real estate lines
Whilst Amazon can boast a considerable 'loyal' clientele, it also has its detractors; the two groups rather curiously not
necessarily mutually exclusive.
There are those who see Amazon as an unrelenting force pushing Britain's independent book shops into extinction. By
changing our reading habits - both in its physical form and through virtual delivery, via the Kindle - Amazon has become,
it seems, a killer in its particular category. As its presence has grown, so it has had a marked effect on Britain real estate.
Britain's once ubiquitous private book shops long provided local employment, generated business rate revenues and
established something of a cultural presence on high streets. As for its public libraries, they too have been loyal local
employers. In addition, they offered a welcoming indoor space for some to pass theirs days in thoughtful comfort. The
reality is that as Amazon has grown, so the number of book shops and libraries across Britain has shrunk. For their part,
authors too have come to see Amazon's competitive pricing model as favouring mass market writing. Criticism of
Amazon has been fuelled further by the revelation that it uses tax inversion to minimise what it pays to HMRC.
In terms of Britain's CRE, there can be no denying the rate at which its book shops have closed in the face of the
onslaught of online buying. There will be those, however, pointing not to the internet as undermining the independent
book shop model, but to the end of the 'price management' governed by Net Book Agreement, which had finally come
under the scrutiny of the OFT from 1994 and was revoked in 1997 (when Amazon was still in its infancy formed as it was
in 1994). Amazon's defenders will point to how many of those sipping cappuccinos in the swelling ranks of Britain's coffee
shops might on close inspection be seen to be reading material obtained via it. They will suggest that new coffee shops
often occupy space where once a book shop operated, and employ staff which a book shop would have drawn upon.
This will all come as little comfort to those who see Starbucks as using the same tax inversion technique as Amazon.
Chart 6: Landscape of UK’s book-selling revamping, publisher sales, £bn
Source: The Publishers Association
This said, Britain's book shops have increasing broadened their offer to become hybrids, adding cafes and in some ways
providing a welcome space for those deprived of a public library. It could be argued that just as Britain's cinemas have
enjoyed a renaissance by becoming protean in their offer, so too can its book shops. The reality is there is a symbiosis or
co-dependency between how Britain's CRE adapts and the changing needs of its occupiers.
0.0
0.1
0.2
0.3
0.4
0.5
0.6
0.7
2.5
2.6
2.7
2.8
2.9
3.0
3.1
3.2
2008 2009 2010 2011 2012 2013 2014
£ b
illi
on
s
£ b
illi
on
s
Printed Digital (rhs)
TOSCAFUND BRITAIN’s PROPERTY CREDENTIALS
25 December 2015
1.5.2 CREacting commercial space in a flash
When we once spoke of restaurants, bars and shops having just popped up, it was as an expression of surprise when we
saw a new retail unit on a road along we were walking or driving. Whilst these businesses might not have survived for
long, often their proprietors ventured into them with the hope they would prove durable and so signing long-term
leases. Now, there is an entirely new concept of pop-up business.
The modern pop-up unit involves sales space which by its very nature is intended to be – in the first instance at least -
short-term, possibly just a day, known widely as “guerrilla” retailers. Whilst modern pop-ups might be located in “real”
real-estate, they could equally well be mobile structures, from freight containers to buses. Britain has had a long tradition
of these temporary sales pitches, where, for example, fireworks and Christmas trees have been sold seasonally or longer
still with weekly markets. The modern form of pop-up retail – whose origins in California date back 15 years – is
distinguishable from that of Britain’s past in that the sheer range of what is being offered, with food and beverages is as
likely to be sold as clothing and accessories. Remarkably, the pop-up phenomenon has even involved cinemas. The
nature of the venue is often quite different too, as it is as likely to be a temporary structure as one that is permanent.
Whilst some pop-up units will stand alone, others will be part of transient communities, say farmers markets, and whilst
certain pop-up units will sell goods provided in a cottage industry volume, others may be used to test products by large
retailers with an established physical footprint.
Whilst mobile units do not face business rates, a pop-up retailer in “real” estate does, something which those who see the
potential for pop-ups to fill vacant space and generate economic good argue is an obstacle to the phenomenon’s
growth. Indeed, the Centre for Economics and Business Research (CEBR) in a report commissioned by the telecoms giant
EE estimates the pop-up sector to have produced £2.1bn of turnover, or 0.5% of all retail spending, in 2013, doing so
across 94,000 units and employing 23,000 workers. Moreover, CEBR forecast Britain’s consumers will spend over 8% more
with pop-up retailers in 2014 compared to 2013.
Transport for London (TfL) has woken up to the potential of pop-up retailing, owning as it does over 1,000 retail
properties and the same number again of arches under its railways. The economics are simple. Consider Old Street
Underground located in London’s Shoreditch. Each year, 23 million pass through a station which is open 20 hours each
day. It is no surprise then that Old Street has been in the vanguard of TfL’s launch into short-term or pop-up leasing, an
area transformed by the arrival of technology companies into its once unloved CRE to have it become known as the
“Magic” and “Silicon” Roundabout. On the theme of regeneration and under-utilised transport real estate, it was recently
revealed that TfL has started to sell “unused” tunnels and “Ghost” stations. TfL has awakened to the potential of its
property assets as tourist attractions, hotels, bars, shops and museums. Tunnels below Clapham North are home to a herb
farm, and a deal has been signed with Waitrose to run a service where customers pick up goods from lockers at Chalfont
& Latimer, on the Metropolitan line. Here again is an instance of economically-empowering property under our very feet.
The reality is that what might at first be planned to be a short-term venture could easily take root. Rather than considered
a rival or threat to Britain's long-lease CRE, pop-up commercial units should be viewed in most cases as a welcome
complement. After all, customers who travel to pop-up units as a destination, provide foot-fall for neighbouring
permanent retailers. Pop-up businesses are more than likely to occupy units which have suffered long spells of inactivity
and have blighted the surroundings for neighbouring retailers. The pop-up phenomenon has also been one of the most
positive developments for Britain’s high streets, helping in part to mitigate the challenges they have faced in other
dimensions, and helping not simply to contain vacancy rates but also helping to soften the recent fall. In order to make
leases more attractive, it is critical to ensure that a prospective pop-up can be connected with its essential utilities.
1.5.3 All change: The moving story of Aldwych Station
The story of Aldwych station straddles a number of the real estate themes that we have covered elsewhere; property in
the public sector finding a new lease of commercial life, a property having earned listed status (Grade II) and a story of
unfulfilled development plans and ambitions. It is also a story of a property whose name has changed as has its role from
transporting people across a relatively short distance back and forth from Holborn, to transporting cinema and TV
audiences back and forth over fictional time.
Descending from where the Royal Strand Theatre had once stood, Strand underground station opened in 1907 and
finally closed in 1994. Over that period, and in the years since its closure, plans have been presented to link Aldwych
station with Waterloo and so onwards to the City (as well as with the DLR), so as to connect the Strand with The
Docklands. Aldwych Station was also part of the original plans for the Fleet Line proposed in 1965, the template for what
would become the Jubilee Line, which has bypassed Aldwych (nee The Strand station). During both world wars, the
station was used as shelter for Londoner and treasures from the British museum including the Elgin or Parthenon
marbles, closing to trains in 1940 and reopening six years later.
Passing the building, it has the unmistakable red-glazed terracotta blocks of the Underground Electric Railway Company
of London (UERL), with a two-storey steel framed building following the familiar design of architect Leslie Green. As
already noted, the station has since its closure become a favoured location for film and TV shoots in addition as an event

TOSCAFUND BRITAIN’s PROPERTY CREDENTIALS
26 December 2015
venue, as well as hosting regular tours of the station and its environs, the curious able to see a platform not used since
1914 and architectural sites of a bygone age.
Aldwych station is far from being alone as a “ghost station” - there are 40 - neither too is it the only one to have taken on a
new tourist destination. Indeed, plans are being presented to enliven these sites or to economically move on these pieces
of transport related real estate. TfL is hoping to raise £3.4bn in non-fare revenue from their disused stations and tunnels,
whatever any realised value might be there can be no doubt the assets have considerable intrinsic worth located as they
are in key locations across the UK capital.
1.5.4 CREating new Markets from old
London's Covent Garden market has come to epitomise commercial urban redevelopment and regeneration, utilising
character rich listed property in the heart of a metropolis for modern purposes.
From housing Britain's largest dedicated wholesale fruit, vegetable and flower market, the Covent Garden area in central
London has, since 1979, increasingly become home to a mixture of residential and commercial tenants. Now, it spans a
range of retail, leisure, creative and business service sectors and is one of the most visited tourist areas, not only across
London but Europe too. Covent Garden is home to one of the largest Apple store in the world, whilst also being a
favoured location for the growing breed of pop-up food and retail stalls in its modern market incarnation.
Over the years, Covent Garden’s success has encouraged the redevelopment of its environs, commercial revival now
clearly evident across Seven Dials and most recently the area around St Giles. The end of horse drawn delivery and rise of
cold storage transit has allowed wholesale markets to move out of central urban areas and thus free them up for modern
economic purpose.
As much as Covent Garden provides clear evidence of the protean nature of Britain's CRE, it also illustrates the economic
potential that exists widely elsewhere. From the neighbouring wholesale meat market at Smithfield across to Nine Elms,
the metonym home since 1974 of New Covent Garden, the Covent Garden 'model' highlights the redevelopment
capacity and regeneration potential for CRE within a London that has far from exhausted its development potential. Just
as New Covent Garden Market came to life in Nine Elms, so the peripatetic onward journey of London's main wholesale
fruit, vegetable and flower market will create economic multipliers at its next stop, as indeed will the relocation when it
happens of Smithfield Meat Market.
Further afield from London, many cities across Britain have their own proven redeveloped equivalent of Covent Garden.
There can be little doubt that across Britain's cities there are central urban areas whose property was developed originally
for wholesale activity but which has long offered the potential for redevelopment and economic regeneration. Whilst
these will obviously not be of the size of Covent Garden, they conceivably could prove to actually be more important on
their revival in terms of economic benefit to the city or large town they nestle in.
In short, it would be no exaggeration to claim that the cumulative economic multipliers from redevelopment compare
extremely favourably with the financial concessions that local authorities may need to offer as an incentive to catalyse
change. It could be argued that domestic and overseas investors are keen enough to commit capital and so are not in
need of actual financial inducement, but rather only require more certainty around the planning process.
1.5.5 Gateshead's MetroCentre; A Real development turning point
In the next section we reflect on the transformation of Birmingham's Bull Ring Centre from a 1960s white elephant into a
successful and economically empowering city centre shopping and recreational complex. In considering its regeneration
we reflect on the site having been a market of some sort since the 12th century and how an originally poor design had
been followed by one which had unlocked the areas potential in a way the original clearly had not.
In this section we focus on an out of town shopping and leisure complex which opened almost thirty years ago in
England's North East, one developed on land unaccustomed to the use it would be put to, but which has performed its
new role with such success it can now boast being Europe's largest covered shopping and leisure centre. Indeed, the
opening in 1986 of the MetroCentre in Gateshead was a turning point in the fortunes of not only the immediate area but
a defining economic moment for Newcastle and indeed Tyneside.
The opening and extension of Gateshead's MetroCentre, with its 340 stores extending over two million square feet of
retail space, has come to symbolise a turning point in what had been an extremely troubled economic time across the
North East. The complex was developed on a brownfield former industrial site once alive with activity but which fallen
victim to Britain's changing fortunes. The area’s revival was to crucially prove the economic merit of dynamic evolution in
land use.
The creation of the MetroCentre also illustrated how collaboration by the most unlikely of groups could realise a major
real estate transformation and economic revival. Those aware of the importance of Sir John Hall's vision in delivering the
MetroCentre, might not be so clear as to how crucial the funding from the most unlikely of sources, the Church

TOSCAFUND BRITAIN’s PROPERTY CREDENTIALS
27 December 2015
Commissioners, happened to be. Indeed, rather unusually for a shopping centre it has its own chapel and resident full-
time chaplain. Funding was also made available at national (an urban development grant from the Department of the
Environment) and local (the Metropolitan Borough of Gateshead) levels.
Since opening in 1986 the Metrocentre has been developed further with the addition of more malls (there are now five)
and a new cinema complex boasting 12 screens, including 3D and IMAX. It boasts additionally an area dedicated to
dining and entertainment venues. It can claim to have its own railway station and car parks with close to 10,000 spaces.
From the two Westfield centres in east and west London, across to Essex's Lakeside and Kent's Bluewater and north to the
redeveloped Bull Ring in the heart of Birmingham, new or redeveloped shopping complexes have provided centres of
mixed-use real estate which have generated economic multipliers and employ in considerable numbers from local
communities. And few have done more to define an area of Britain more greatly than the Metrocentre in Gateshead.
Many other instances along the same regeneration lines can be found in other parts of the UK, examples including Merry
Hill in Dudley and Meadowhall over in Sheffield. Both of these modern mixed-use commercial developments were built
on sites formerly occupied by steelworks.
The Round Oak steelworks in Merry Hill closed in December 1982 by which time it employed 1,286 people. A shopping
centre would open three years later close to the site, actual development of which commenced from 1989 in the form of
an expansive business park.
As mentioned Meadowhall too was built on a larger steelworks site, becoming the UK’s second largest shopping centre
when it opened in 1990. With over 280 stores it attracted 19.8 million visitors in its first 12 months and currently brings in
30 million visitors a year. In October 2012, Norges Bank Investment Management announced that the Norwegian
Government Pension Fund Global had acquired a 50% stake at a cost of £348m, another illustration of Britain's CRE
attracting sovereign wealth investors
1.5.6 Ring in positive change: Birmingham's Bull Ring Centre story
London's Brent Cross (1976) and Wood Green (1981) developments, then Lakeside (1990) in Essex and most recently
Bluewater (1999) in Kent have, in their respective ages, come to characterise episodes of innovative shopping centre
design, each situated where there was little in the way of dense CRE before. In a world where design seems to be
becoming less about building durability as design anticipating obsolescence, each will no doubt adapt as shopping
patterns change. It is not, however, the story of four shopping centres on which we wish focus here, but one in the heart
of England's second city.
The redevelopment of Birmingham's Bull Ring centre has come to represent most aspects of sympathetic and inclusive
CRE design, just as its initial post-war development came to symbolise the worst aspects of 1960s 'brutalist' architecture
and failure to deliver a commercially successful property product.
In 1961, construction began on Britain's first indoor city-centre shopping precinct, the Bull Ring, Centre on a site which
historians could date as a market place as far back as the 12th century. The Bull Ring covered 23 acres and boasted
350,000 square feet of retail space, large enough for 140 shop units. Complementing the all new shopping centre was a
traditional open air market of approximately 150 stalls. Accessibility seemed assured by direct access to New Street and
Moor Street Stations along with a network of subways and a 500-space multi-storey car. The development even included
a nine-floor office block attached to the car park. Close by was the site of the Old Market Hall, which was turned into
Manzoni Gardens, an open space for where it was intended shoppers would relax between forays into the Bull Ring.
The Bull Ring Centre seemed a perfect template for integrated urban mixed use CRE, yet before long it became clear it
'wasn't working'. Relatively high rates of vacant space, frequent failures in its escalators and lifts and its isolation,
surrounded as it was by ring roads and its uninviting subways, contrived to make the Bull Ring Centre a symbol of
indisputable failure in urban development as footfall failed to arrive. Whilst plans to redevelop the Centre began to take
serious form in 1987, it would not be until 2000 that demolition would begin.
In 2003, the newly branded Bullring opened, and within a year became the most visited shopping centre attracting 36.5
million visitors. Where concrete once darkened areas, glass was used to shed light, indeed, a 75,000 square foot glass
roof, known as the Skyplane, covers the main mall. Once barren and uninviting underground passages are now lined with
shops, and where the old Bull Ring struggled to attract marquee stores the new Bullring can boast Selfridges. In place of a
once dark and isolated car park, there is retail space on the ground floor and a suspended footbridge, the Parametric
Bridge, connecting directly to the Selfridges store. In 2011 ongoing redevelopment saw the nearby Spiceal Street
become a restaurant hub, to provide a more integrated consumer environment for the entire development.
The story of The Bull Ring Centre has come to most represent the importance of design and configuration in capitalising
on city centre CRE, much like the development of One New Change along London’s Cheapside tells its own story. This has
also has introduced an entirely new element of mixed-use to transform an area and brought economic activity into what
had otherwise been largely barren weekends.

TOSCAFUND BRITAIN’s PROPERTY CREDENTIALS
28 December 2015
1.5.7 High street Real estate, the butcher, and baker and...
We will reflect later on the changing fortunes and real estate needs of the “picture” and public houses, betting and shoe
shops once ubiquitous along the high streets of Britain's towns and cities. There was a time when such high streets and
most in small towns and even large villages boasted butchers, bakers, green-grocers and even fish mongers.
Consider these statistics, as of 2011 across Britain there were fewer than 7,000 butchers, 4,000 greengrocers, 3,000
independent bakeries and 1,000 specialist fishmongers. In each of those food categories the total of specialists has come
down to 10% what they had been in the 1950's, and down 40% in the previous decade. As independent fresh food
specialists have left high streets, retail floor-space take up by supermarkets has itself risen sharply, at one point mostly
away from city centres and in large out-of-town ground-scrappers and more recently returning to urban hubs in smaller
but generalised convenience stores.
There has admittedly been a renaissance in specialist bakers, albeit not independents, with for instance Greggs now
boasting an estate of nearly 1,700 shops. This said and albeit a relatively recent development artisan food retailers have
begun to grow in numbers.
Concerns about the impossible-to-measure social, economic and health costs of the decline in “wholesome” and
community-centred independent fresh food retailers have led to calls for a negative externalities, or more commonly
“supermarket tax” (essentially a business rate surcharge we will discuss later) whose receipts would be used to help
mitigate for the perceived costs of dominant food generalists.
There is of course the counter argument that supermarkets have broadened availability of fresh food and done so whilst
making it cheaper to buy. The response to this has often been that this conceals both their oligopoly powers over their
customers and monopoly powers over their suppliers.
Let us return to the real estate demands of Greggs. True, it has gained an ever-more noticeable presence on high streets
through its expansion programme. True too this has been coincident with a very clear hub and spoke strategy, where
large regional bakeries supply its high street stores, bakeries only in name.
In summary, the CRE needs of Britain's food retailers have altered dramatically over time. At first supermarkets crowded
out specialist high street food retailers by their close proximity. Supermarkets then focused their growth ambitions on
large edge of town and out-of-town superstores through the 1990s. Increasingly over the past decade or so we have seen
evidence of the main supermarket groups returning to smaller town centre convenience formats. Remarkably, expansion
in store numbers has been evident at both the discount and premium ends of the price spectrum, Waitrose and M&S
Simply Food expanding and so too Lidl, Aldi, Morrison and Sainsbury’s, the latter doing so by returning the Netto brand
to Britain (initially by converting 15 stores across its estate to the brand). And crucial to store expansion has been the
development of large regional distribution centres essential for efficiency in logistics.
1.5.8 Betting on a continued real estate need
Britain's pubs have had to adapt to changing social-economic and demographic patterns, its high street shops and post
offices to e-commerce, and all to a challenging tax regime. Betting shops have had to cope with all three potential
problems.
Betting shops were legalised in 1961 and operated under strict controls. At their peak, numbers exceeded 15,000, and
many were often family run. Since then, numbers have fallen, with estimates suggesting around 9,000 shops following a
burst of consolidation across the market.
In April 2014, the UK's largest bookmaker William Hill announced it would close 109 shops. It cited the increased duty on
Fixed-Odds Betting Terminals (FOBTs). Soon after Ladbroke revealed they too would make significant closures; William
Hill and Ladbrokes operating over half of all UK betting shops. Coral followed suit by revealing their own closure plans.
The reality was that whilst Ladbrokes had already been closing its shops, this was being accompanied by new openings.
During the first quarter of 2014 Ladbrokes opened ten shops, and during the same period it closed eight. William Hill
stated in its Annual Reports the aim of a net expansion in its estate of 1% each year, in 2013 alone opening 59 new shops
equivalent to a 2% rise in its estate size. Although numbers have increased over a 10 year period - 800 net new shops
have been opened - their combined employment levels have been moving lower, down by one tenth. A significant factor
in these seemingly paradoxical movements has been the presence of labour un-intensive FOBT's, first introduced to
betting shops in 2001 with the 2005 Gambling Act limiting their numbers to four for each betting shop across England
and Wales, a decision which simply tempted operators to open betting shops in close proximity.
In 2012, the Commons Cross Party Culture Committee claimed the gambling Acts had left casinos (covered in the 2005
and a 1968 Gaming Act which liberalised the sector) and betting shops “ill-equipped” and “outdated” to deal with social
and technological changes.

TOSCAFUND BRITAIN’s PROPERTY CREDENTIALS
29 December 2015
To conclude, since the 1960s Britain's high streets have been home to betting shops in rising numbers, even as online
gaming has increased. This is a pattern not unlike the rise - or the renaissance - of fresh food retailers even as home
internet driven food delivery has increased.

TOSCAFUND BRITAIN’s PROPERTY CREDENTIALS
30 December 2015
1.6 Hospitality & Leisure In this section, we consider two property-hungry elements of Britain’s expanding service economy are the hospitality and
leisure industries.
1.6.1 Center Parcs building its fifth British resort, creating 2,700 jobs
As much as its decline symbolised the country's ills, the renaissance in Britain's domestic holiday sector will come to
reflect its resurgence. No business captures this turnaround more than Center Parcs.
Since arriving in 1987, Center Parcs has grown to five sites across Britain. Of course some will claim resurgence in
holidaying in Britain is a reflection of austerity, and therefore a sign of Britain's weakness not its strength. We disagree.
Even a casual glance at the pricing of a basic Center Parcs stay proves it is not a budget option. Center Parcs has
succeeded because it delivers the product demanded by Britons. In short, both overseas and domestic travel will
increase.
There are also a rising number of tourists coming to Britain. Like so much else of Britain's future, London will feature
strongly in the latter. As for the strength we envisage for sterling against the dollar and euro we anticipate the currencies
of emerging nations will also strengthen, providing their nationals with a positive wealth effect that is certain to translate
into higher consumption, and increased foreign travel will feature on their shopping list with Britain a trophy destination.
If Britain is to see the sharp rise in tourist numbers that that are predicted, there will be some changes required. Across
Britain hotel capacity is increasing. Just consider a few instances.
Travelodge last year announced target of 1,100 hotels and 100,000 rooms by 2025, more than doubling capacity. The
group has plans to build 41 new hotels through 2012 alone.
Premier Inn, currently Britain’s largest branded budget hotel chain, plans to increase its room capacity by 65,000 within
five years. New locations will be added across the country, the largest of which will be a 130-bedroom Premier Inn in
Leeds.
Marriott aims to increase its hotel room availability to 80,000 by 2015, last year adding 17,000 towards that target, with its
push within Britain including London’s newly reopened and iconic St. Pancras Renaissance Hotel.
InterContinental Hotels Group which owns seven major brands including Holiday Inn and Crowne Plaza is planning to
add 37 British sites to its portfolio.
The limited service hotel chain ‘Tune Hotels’ has increased capacity in the last few years. Currently the chain has 8 hotels
in Britain of which 5 are in London. We could continue with a great many more instances where capacity is being added
with jobs alongside.
1.6.2 Licensed to change
Having appeared to have past the worst, entering 2012 the pace at which pubs closed accelerated to 18 closures per
week. In the first six months of 2014, CamRA estimated the rate of pub closures has reached an average of 31 per week,
3% of all suburban pubs shutting over the period. It is also suggested by the Campaign for Real Ale (CamRA) and analysts
at CGA, that across Britain fewer than 55,000 pubs remain, with 10% of these expected to close by 2018.
According to CamRA, pubs have been closing and will continue to close because of gaps in planning legislation that
allow pubs to be demolished or converted to a range of alternative commercial uses - notably convenience stores,
betting shops and pay-day loan stores - without the need for planning permission. CamRA also identified the conversion
of pubs to solely residential use as both socially and economically unfavourable to local communities.
Whilst the conversion of pubs to homes provides another instance of a 'tax bias' favouring residential over commercial
use, it also captures how some pub property simply isn't fit for modern purpose, given social and regulatory changes.
Some pubs without the capacity to accommodate kitchens and dining areas have fallen victim to the trends towards
patrons who prefer food with their alcohol. Others without outside areas have suffered in the wake of the ban on
smoking in enclosed premises and others, it is widely argued, suffer from being tied to a brewery. Moreover, many of the
pubs which have closed never quite dealt competitively following the 2003 Licensing Act, or with the off-sale rivalry from
supermarkets, with the end of the beer-duty escalator in 2013 seen as little real mitigation.
Changing demographics have meant that once viable pubs no longer have 'natural' local markets, prompting a falling
demand in customers and hence helping the demise of the pub.
TOSCAFUND BRITAIN’s PROPERTY CREDENTIALS
31 December 2015
1.6.3 Hotels: A home from home
Britain's hospitality industry is undergoing much needed and long-overdue improvement and expansion widely across
the country. For its hotels, restaurants and related sectors to upgrade existing and add new capacity, the cornerstone
quite literally is new commercial real estate.
In part 2, we will analytically consider Britain's Private Rental Sector (PRS) and the specific and wider economic benefits of
its expansion. Given we can consider hotel rooms as a form of ultra short tenancy - their shortest tenure an overnight stay
- we can extend upon our earlier analysis. By drawing upon hotel occupancy rates and average room revenues, we can
establish an estimate of capital value. This is of course a fraction of the total since we need to add the direct employment
and supply chain related multipliers deriving from each room.
It is estimated that Britain's hotel sector added 5,000 new rooms in 20142, investment motivated by increasing tourist
arrivals. From visits driven purely by curiosity and keenness to see the sights, to visiting those studying in Britain's
education sector - private schools and HEIs - tourist numbers are on the rise. With large tracts of the emerging world
seeing an impressive enlargement in its middle class, the ability to satisfy travel ambitions is growing and Britain can only
benefit.
1.6.4 Who could have accurately pictured that?
The internet is having a profound effect on how we consume; from doing the travelling and hauling, we now click and
have our goods and groceries delivered. This change is having a profound and increasingly debated and documented
effect on Britain's CRE.
Many see the encroachment of the internet as unambiguously negative for city-centre retail CRE. As with any assessment
of what awaits in an uncertain world, it is instructive to identify credibly close historical precedents, and examine how
events unfolded relative to the expectations of 'the day'.
There was a time when cinemas, or as they were affectionately known, “picture houses” were a staple of any medium to
large town high street, the Odeons, ABCs and Coronets plus a raft of independent brands competing for a customer base
which had grown sharply through the war years. Indeed, in 1946, there were a staggering 1.6 billion cinema admissions,
equivalent to 33 visits per person per year. This was however to prove a high water mark.
Through the late 1940s, cinema attendances began to fall. Their decline was made worse with the arrival of ever more
affordable televisions and rising living standards. The process was accelerated still further by ever more TV content; the
BBC began broadcasting in 1936, with Independent Television launched in 1955, and BBC Two in 1964. With the arrival of
the VCR and a general decline in investment in the cinema industry, by 1984 only 54 million cinema tickets were sold,
equivalent to less than one trip per Briton per year. It is no surprise that cinema after cinema closed in the wake of falling
attendances. Some would convert to billiard or snooker halls to cater for a craze whose popular interest had been
galvanised by the very TV broadcasting which had darkened cinema screens. Many cinemas simply became derelict,
blighting high streets and testament (it seemed) to an industry which would never again require CRE. Indeed, few in 1984
could have imagined otherwise.
From 1984, matters began to change for the better for Britain’s cinema industry. The introduction and expansion of
multiplex cinema combined with improving economic fortunes and greater amounts of leisure time saw attendances
revive such that by 2011 total admissions had risen to 172 million. Whilst this hardly equalled the 1.6 billion ticket sales
recorded in 1946, the nature of visits had altered. Multiplex cinema, straddling towns and out of town sites had become a
destination event; the film part of a wider dining and recreational experience. Whilst the arrival of multiplex saw the
revival of old cinema sites, it also saw the development of entirely new premises, often as mentioned out of town within
retail parks which offered plentiful parking and relative ease of access.
As for legacy cinema sites which could not transition to multiplex, today many have been converted to other users, often
exploiting the grand architecture legacy which once characterised “cinema theatres” and “electric palaces”. Here again
one comes up against the protean nature of Britain’s CRE. After all, as music halls began to give way to cinema, the
process was most often not dereliction but conversion. Many cinema sites have in turn converted to other uses, bowling
alleys, snooker halls and licensed premises.
The intention in examining the rise, fall and then rise again in Britain’s cinema industry, has been to sound a note of
caution to those convinced the “evacuation” of its high streets can only continue unabated. For just as those in 1984 who
saw an Orwellian view of the future of cinema in the age of home entertainment proved wrong, so too might those who
see much the same thing for traditional retail in the age of the internet.
2 Colliers Hotel Snapshot, 2014

TOSCAFUND BRITAIN’s PROPERTY CREDENTIALS
32 December 2015
1.6.5 Britain's built ReCREational space
There was a time when Britain’s communal built space dedicated to 'leisure' time was largely limited to public baths.
Communal pools and bath were however provided not for recreational needs but essentially to make-up for the lack of
basic washing facilities in homes. A great deal has thankfully changed since then.
Today Britain's purpose-built leisure centres provide subsidised facilities across a wide range of sporting disciplines. It is
not however these large purpose-built leisure centres which we want to reflect on here, but rather the multitude of gyms
which are housed within a wide range of Britain's CRE.
Many of Britain's now considerable number of commercial gyms are not users of what might be considered conventional
built space. They tend to take up areas that might otherwise remain economically inactive, notably lower ground floors
and other space with restricted or indeed no natural light.
The growing presence of gyms within multi-use buildings provides landlords with greater tenant diversification, whilst
offering other occupiers proximity to facilities that are used in ever greater numbers during their leisure time.
The proliferation of its commercial gyms provides yet another instance of how utilisation of Britain's CRE has become as
much about improvisation as it has innovation.
1.6.6 A Real Olympian effort
On July 6th 2005, it was revealed that London had beaten off four fierce challengers to win the bid for hosting the 2012
Summer Olympics. Remarkably, at the time of the announcement, 60% of the facilities and venues necessary were
already in place, but not the Stratford City development. This included the Olympic Park, and was no more than a
computer simulation requiring considerable demolition, excavation and construction work ahead, in certain cases
involving fiercely-contested compulsory purchases.
With the euphoria of the success of the London 2012 bid still high, a shocking series of attacks across the Capital on 7/7
would force a reassessment of venue logistics in the light of entirely new security issues. This challenge would however
not greatly interrupt the 'building' momentum towards summer 2012.
Key to the IOC agreeing to give London the 2012 Olympiad was a commitment to match improved transport
infrastructure with the delivery of developed and redeveloped fit for purpose sporting real estate. Indeed, the IOC's
preliminary assessment was that London's public transport system was relatively poorly prepared for the demands which
they would face in 2012. In the years up to the event - London's third hosting, although its 1908 and 1948 experiences
were by default - improvements were made to the Docklands Light Railway (DLR), the North London Line and the East
London Line of the Overground network. An entirely new cable car was created across the River Thames to link Olympic
venues. In each instance, the legacy of this Olympian effort would show benefits well after the event.
Just as the transport initiatives introduced to meet the needs of the 2012 Olympics would have a valuable post event
legacy, so to would the accommodation delivered to house participants. Indeed, in the wake of the event much has
entered the private rental sector, helping accommodate London's growing population.
What London's 2012 Olympian effort proved was the ability within Britain to utilise its existing CRE and where necessary
to redevelop extensively on brownfield sites long in need of regeneration. Since hosting the 2012 Summer Olympics, it is
clear that a greater focus on sustainability has been beneficial, as real estate delivered for the event has been refocused
towards more durable and often commercial ends.
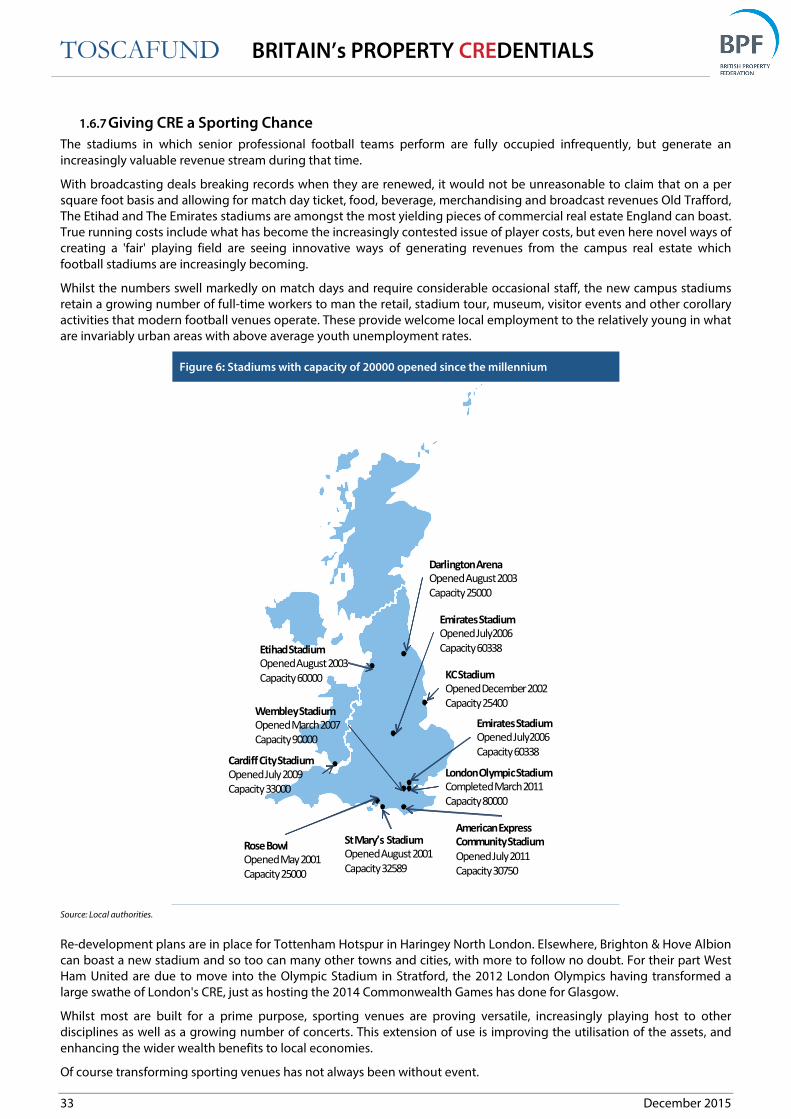
TOSCAFUND BRITAIN’s PROPERTY CREDENTIALS
33 December 2015
1.6.7 Giving CRE a Sporting Chance
The stadiums in which senior professional football teams perform are fully occupied infrequently, but generate an
increasingly valuable revenue stream during that time.
With broadcasting deals breaking records when they are renewed, it would not be unreasonable to claim that on a per
square foot basis and allowing for match day ticket, food, beverage, merchandising and broadcast revenues Old Trafford,
The Etihad and The Emirates stadiums are amongst the most yielding pieces of commercial real estate England can boast.
True running costs include what has become the increasingly contested issue of player costs, but even here novel ways of
creating a 'fair' playing field are seeing innovative ways of generating revenues from the campus real estate which
football stadiums are increasingly becoming.
Whilst the numbers swell markedly on match days and require considerable occasional staff, the new campus stadiums
retain a growing number of full-time workers to man the retail, stadium tour, museum, visitor events and other corollary
activities that modern football venues operate. These provide welcome local employment to the relatively young in what
are invariably urban areas with above average youth unemployment rates.
Figure 6: Stadiums with capacity of 20000 opened since the millennium
Source: Local authorities.
Re-development plans are in place for Tottenham Hotspur in Haringey North London. Elsewhere, Brighton & Hove Albion
can boast a new stadium and so too can many other towns and cities, with more to follow no doubt. For their part West
Ham United are due to move into the Olympic Stadium in Stratford, the 2012 London Olympics having transformed a
large swathe of London's CRE, just as hosting the 2014 Commonwealth Games has done for Glasgow.
Whilst most are built for a prime purpose, sporting venues are proving versatile, increasingly playing host to other
disciplines as well as a growing number of concerts. This extension of use is improving the utilisation of the assets, and
enhancing the wider wealth benefits to local economies.
Of course transforming sporting venues has not always been without event.
American Express
Community Stadium
Opened July 2011
Capacity 30750
London Olympic Stadium
Completed March 2011
Capacity 80000
Wembley Stadium
Opened March 2007
Capacity 90000
Emirates Stadium
Opened July2006
Capacity 60338
EtihadStadium
Opened August 2003
Capacity 60000
St Mary’s Stadium
Opened August 2001
Capacity 32589
Emirates Stadium
Opened July2006
Capacity 60338
Rose Bowl
Opened May 2001
Capacity 25000
Darlington Arena
Opened August 2003
Capacity 25000
KC Stadium
Opened December 2002
Capacity 25400
Cardiff City Stadium
Opened July 2009
Capacity 33000

TOSCAFUND BRITAIN’s PROPERTY CREDENTIALS
34 December 2015
It would take Wembley Stadium 59 years to be transformed from its 1948 British Empire design to the current model.
Over its reconstruction period (2002-07), its contractor suffered serious budgetary pain, not entirely uncommon given the
tender price and penalty clauses Britain's contractors tend to work within.
As "The National Stadium' was being developed, the Millennium Stadium in Cardiff played host to League and FA Cup
Finals, providing a welcome boost to the local economy. England's home internationals were distributed across club
stadiums across the midlands and north which had enjoyed a long tradition of hosting semi finals for club competitions.
In broad terms, Britain has always, and continues to enjoy improvements to its sporting CRE widely often in urban areas
where stadiums have become the most important and extremely welcome wealth generators.
1.6.8 Britain’s winning CREw
Hosting a major international sporting event, commercial show or arts gathering has become both an ambition for
Britain's cities - often in fierce competition with other overseas and indeed British rival cities - as well as the potential to
prove a poison chalice. In addition to requiring the use of existing real estate, sufficiently large events will invariably need
to draw upon additional capacity. They may need new strategically positioned venues for activities or they may need
accommodation for visitors and participants, and will often in fact require both. With the need for additional space comes
the risk that these short-term requirements are underused once the sporting, commercial or artistic event has passed (the
idiom “be careful what you wish for” is something of a caution to cities and towns desirous of hosting a major
international event).
Britain can rightfully boast an established reputation in successfully hosting major international events, the Rugby World
Cup this year, last held in Britain in 1999 when Wales were the hosts and London hosted the 2012 Summer Olympics. For
its part, Glasgow was the venue for the Commonwealth Games two years later, an event, the world’s third largest
sporting gathering, that Manchester had hosted in 2002. In all cases, as well as utilising existing capacity, we know that,
where necessary, entirely new real estate was developed, which in some cases did admittedly “force” existing property to
be redeveloped. Every instance there was and remains no sign of any meaningful real-estate 'hangover'.
We have reflected elsewhere how Wembley Stadium - nee the Empire Stadium - having been intended for a single event,
the British Empire Exhibition of 1924/5, survived a further 75 years, during which time it was the venue for part of the
1948 Summer Olympiad. Having famously and successfully hosted the World Cup in 1966, when the final was played at
Wembley, England has since unsuccessfully bid for the 2006 and 2018 FIFA events. It did, of course, host a number of
notable European Cup finals (including in 1968, when Manchester United became the first English club team to win the
trophy) and the European Championships in 1996, when England progressed to the semi-final.
As much as hosting international sporting events provides economic benefits, there are as already noted potential
pitfalls, in essence the events generate both positive and negative externalities. Around the world, a number of cities
have over time hosted international events for which they invested in considerable new real estate, only for it to find little
subsequent commercial purpose.
Rather originally, some cities have tried to avoid the challenges of excess capacity by satisfying the short-term needs of
burgeoned attendances through the duration of an event by some innovative idea. This has included mooring cruise
ships to provide temporary accommodation, as Lisbon did for Expo 1998 at which 11 million visitors arrived over 132
days. The use of temporary real estate for Expo 1998 showed that whilst any major international event may be welcome
to a city or region, a measured approached is essential in delivering a sustainable real estate solution. The idea of
mooring cruise ships was muted for London 2012, however, it was never adopted since it was assessed that adequate use
of existing space plus the delivery of additional new capacity would be sufficient. Crucially, the new capacity would find
economic purpose after the event.
Another potential pitfall of a city hosting a major international event is the risk ‘crowding-out’ other economic activity.
This was a particular concern voiced by the London theatre industry which foresaw a marked decline in audience
numbers and the threat from Andrew Lloyd Webber that this would turn “theatres dark” with the arrival of the Olympics,
.This fear seemed to be supported by a significant rise in hotel room rates – tariffs in August 2012 increased by nearly 40%
on average compared to the previous year. Concerns were heightened still further by an anticipation that London’s
‘normal’ summer tourist patterns might be disrupted if potential visitors perceived ‘Olympic distribution’ would interfere
with what their plans for their time in the UK’s capital.
In reality, room occupancy across London’s hotels was only slightly down on average through the duration of the
Olympics. Moreover, far from theatre audience numbers falling, attendances increased – boosted by Britons themselves -
forcing Lloyd Webber to subsequently apologise for predicting a “bloodbath”, going on to say “I have been proved
wrong and I couldn’t be more delighted about that”.

TOSCAFUND BRITAIN’s PROPERTY CREDENTIALS
35 December 2015
Chart 7: London hotels: average daily rate Chart 8: London hotels: occupancy
Source: ONS, Toscafund –vertical lines denote beginning and end of the Olympic and Paralympic London events.
This is not to claim that parts of London’s CRE did not suffer during the Olympic and Paralympic period, nor indeed that it
did not face disruption to business activity in preparation for the events as a result of the considerable development work
involved. What London’s most recent Olympic experiences - 1948 and 2012 – clearly seem to have shown, is that the
benefits well exceed the costs, providing economic multipliers and catalysing real estate development which might
otherwise have gone undone.
Britain's cities do not only vie for quadrennial international events, but provide annual rivals to events which move within
the course of a year around Europe and beyond London hosts Fashion Week twice each year, the first such week back in
1984. Not only is existing space used to accommodate the events but considerable pop-up structures are constructed in
public places for the purpose. With London Fashion Week, we have seen these take shape in Berkeley Square, in the
grounds of Somerset House and elsewhere across London.
The reality is that with its extensive property estate, ever improving transport network, convenient time-zone and widely
spoken language, Britain has considerable potential to regularly attract international showpiece events, across a wide
variety of sports and extending to entertainment shows, commercial conferences and trade exhibitions. It is worthy of
note in closing that Britain currently hosts NFL league international fixtures, each to a full New Wembley. The draw of
Britain is moreover not confined to its capital city but widely, with Manchester, Birmingham, Glasgow, Edinburgh, Cardiff,
Belfast and many other centres, not simply vying with one another to host artistic, sporting and commercial events, but
each in their own way rivalling other cities in Europe and beyond. Crucial to the list of attractions of Britain’s cities is the
existence across all of an established and varied base of property assets – from conference and exhibition centres to hotel
accommodation - as well as the ability to deliver temporary or pop-up structures, if and when needed, some performing a
useful economic role long after they were intended, as with the original Wembley Stadium. For when it comes to
international sports Britain can boast a winning CREw.
-15
-10
-5
0
5
10
15
20
2004 2006 2008 2010 2012 2014
% c
ha
ng
e, y
ea
r o
n y
ea
r -
3 m
on
th m
ov
ing
av
era
ge
-15
-10
-5
0
5
10
15
20
2004 2006 2008 2010 2012 2014
% c
ha
ng
e, y
ea
r o
n y
ea
r -
3 m
on
th m
ov
ing
av
era
ge

TOSCAFUND BRITAIN’s PROPERTY CREDENTIALS
36 December 2015
1.7 Private Rental Sector One aspect of Britain’s modern CRE base which warrants particular interest is its rapidly expanding Private Rental Sector
(PRS), an often overlooked but all the same increasingly important CRE market.
1.7.1 Britain's Modern Work Houses
We have already given attention to what part of Britain's residential property can be considered CRE, qualifying if it is
privately let and generates rental income, including PRS, there is a second, admittedly smaller, segment of British
property which can reasonably be considered to fulfil dual residential and commercial roles, namely where living space
doubles as work space. Whilst home working is hardly new to Britain, its nature is very different today from its largely
farming or 'piece rate' rag trade in the past. The ONS suggests that higher-paid occupations and managerial positions
account for three quarters of those working from home. This is a significant change to as in the past, home working was
largely characterised by men undertaking manual agriculture or construction, or women performing low paid piece work.
There are, of course, the great many who are at home caring for their children or other dependents, all of whom perform
a productive role even if not recognised fully or remunerated properly for their valuable attention. In addition to this
group, there are those using their home as a regular workplace, affording them flexibility over hours and releasing them
from commuting time and its attendant costs.
According to the ONS, 1.5 million workers across Britain or 5% of those in work who 'mainly' operate from home
compared to 678,000 in 2001. More broadly, 4.2 million people use their home as a base, a figure up 45% from the 2.9
million estimated in 1998. This is a leap in the last three years of more than 500,000, as the 'home working rate' is now
13.9% compared to 11.1% in 1998.
The majority (two-thirds) of Britain's home workers are part of its growing self-employed class and are mostly found in
rural areas. Previously, home working was concentrated in farming, construction and manual work, it is now more
common for highly skilled roles to be performed part-time from a home base by those commonly approaching or
beyond retirement age. This helps to explain why median hourly earnings for home workers were recorded to be 30%
higher than conventionally housed staff. Mixed residential/commercial real estate is the 'home' of part of the figurative
grey economy, now recognised in the measurement of GDP.
Across the shires, growth in professionals working from home has been particularly noticeable, with almost one in five
workers in the Derbyshire Dales performing their roles from home. The number across farming intensive West Somerset is
over one in four, whereas it was one in twenty in Kingston upon Hull, and one in ten professionals working from home in
Scotland.
Those now working from home range widely across the socio-economic spectrum and in some cases, involve start up
businesses for which the ambition is to move into commercial space at the earliest opportunity. For many, working from
home is a lifestyle choice. In fact, it is estimated that 100,000 Britons are “home agents” or provide contact centre call
services from their own homes, capitalising on their remote access to data hubs, the internet and broadband.
Chart 9: Working from home Figure 7: % of home workers (January-March 2014)
% point increase since 2008
South West
1.5
South East 1.9
East of England 0.7
Wales 0.1
London 2.1
East Midlands 1.3
West Midlands 0.9
North West 1.8
Yorkshire and The Humber
0.9
North East 1.1
Scotland 1.4
Source: ONS, Toscafund
There is, of course, the issue of those working from home not being subject to business rates. They do nonetheless pay
domestic rates, and will in addition be liable to income tax and national insurance. Many workers based at home will, of
course, need to travel to customers and use traditional CRE, arranging meetings for instance in coffee shops.
A Government commissioned study from 2012 suggested that there would be a £15bn saving were more state workers
to operate from home, £7bn in savings from office costs, and a £8bn gain in improve productivity. It also suggested that
reduced commuting needs would help towards improved sustainability by reducing carbon emissions.
0
2
4
6
8
10
12
14
1998 2000 2002 2004 2006 2008 2010 2012 2014
%
Unpaid family workers Self employed Employees
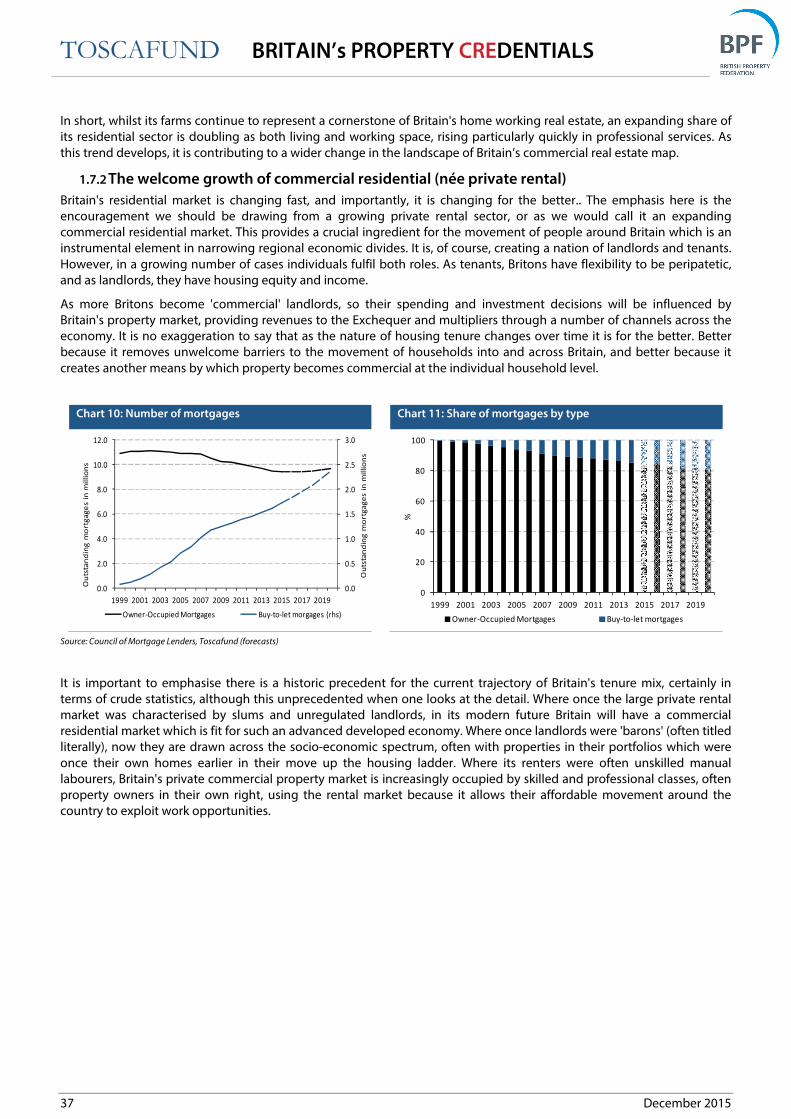
TOSCAFUND BRITAIN’s PROPERTY CREDENTIALS
37 December 2015
In short, whilst its farms continue to represent a cornerstone of Britain's home working real estate, an expanding share of
its residential sector is doubling as both living and working space, rising particularly quickly in professional services. As
this trend develops, it is contributing to a wider change in the landscape of Britain’s commercial real estate map.
1.7.2 The welcome growth of commercial residential (née private rental)
Britain's residential market is changing fast, and importantly, it is changing for the better.. The emphasis here is the
encouragement we should be drawing from a growing private rental sector, or as we would call it an expanding
commercial residential market. This provides a crucial ingredient for the movement of people around Britain which is an
instrumental element in narrowing regional economic divides. It is, of course, creating a nation of landlords and tenants.
However, in a growing number of cases individuals fulfil both roles. As tenants, Britons have flexibility to be peripatetic,
and as landlords, they have housing equity and income.
As more Britons become 'commercial' landlords, so their spending and investment decisions will be influenced by
Britain's property market, providing revenues to the Exchequer and multipliers through a number of channels across the
economy. It is no exaggeration to say that as the nature of housing tenure changes over time it is for the better. Better
because it removes unwelcome barriers to the movement of households into and across Britain, and better because it
creates another means by which property becomes commercial at the individual household level.
Chart 10: Number of mortgages Chart 11: Share of mortgages by type
Source: Council of Mortgage Lenders, Toscafund (forecasts)
It is important to emphasise there is a historic precedent for the current trajectory of Britain's tenure mix, certainly in
terms of crude statistics, although this unprecedented when one looks at the detail. Where once the large private rental
market was characterised by slums and unregulated landlords, in its modern future Britain will have a commercial
residential market which is fit for such an advanced developed economy. Where once landlords were 'barons' (often titled
literally), now they are drawn across the socio-economic spectrum, often with properties in their portfolios which were
once their own homes earlier in their move up the housing ladder. Where its renters were often unskilled manual
labourers, Britain's private commercial property market is increasingly occupied by skilled and professional classes, often
property owners in their own right, using the rental market because it allows their affordable movement around the
country to exploit work opportunities.
0.0
0.5
1.0
1.5
2.0
2.5
3.0
0.0
2.0
4.0
6.0
8.0
10.0
12.0
1999 2001 2003 2005 2007 2009 2011 2013 2015 2017 2019
Ou
tsta
nd
ing
mo
rtg
ag
es i
n m
illio
ns
Ou
tsta
nd
ing
mo
rtg
ag
es
in m
illi
on
s
Owner-Occupied Mortgages Buy-to-let morgages (rhs)
0
20
40
60
80
100
1999 2001 2003 2005 2007 2009 2011 2013 2015 2017 2019
%
Owner-Occupied Mortgages Buy-to-let mortgages

TOSCAFUND BRITAIN’s PROPERTY CREDENTIALS
38 December 2015
1.8 Manufacturing CREativity In this short section we reflect on how CRE has taken Britain from its pastoral roots to an industrial powerhouse and is
again manufacturing a whole new British economy.
1.8.1 Real estate’s Food for thought
A modern economy is not so much based in real estate as would not exist without it. In fact, without real estate an
economy will remain pastoral.
Real estate is essential in rural communities as it is in urban areas. For without real estate, a nation's agricultural sector
cannot support the needs of its urban economy. From barns equipped with industrial milking equipment to silos storing
cereals and green-houses to protect crops from the elements, real estate allows food production to increase with ever
less arable land and farm labour, whilst also reducing its exposure to the vicissitudes of an unpredictable climate. The
factories in which food is processed provides another crucial element in the creation of an industrial food-supply-chain,
literally feeding urbanisation by delivering affordable foods in ever greater volumes from, as already noted, lessening
needs for farmland and farm labour. In addition, there is the real estate formed of large out of town supermarkets and
high street volume grocery stores, both providing convenience to the urban population.
1.9 Flexibility
1.9.1 Property arriving from above
In this short section, we reflect on how buildings that were once consecrated have been transformed into commercial
real estate. Of course, as some declining ministries have resorted to disposing of their houses of worship there have been
those expanding theirs, acquiring existing property or building new. There is a continuous evolution in and out of CRE.
Chart 12: Churches opened and closed
Source: Whychurch.
Across Britain, it is estimated that 2,244 churches and chapels have ceased to be houses of worship since 2003, with many
closing earlier too. Some have become commercial or residential, in some cases, part of the expanding private rental
sector. Houses of worship are generally located within the centre of parochial communities and so their transformation
into commercial use can prove only positive for local economies.
0
500
1000
1500
2000
2500
3000
3500
1980-1989 1990-1994 1995-2002 2003-2010
Opened Closed
TOSCAFUND BRITAIN’s PROPERTY CREDENTIALS
39 December 2015
1.9.2 Protean property
We would argue Britain's stock of commercial property has never been more flexible, taking on a Protean or changeable
form.
A great deal of British real estate is capable of relatively swift and affordable realignment, adapting for occupiers in quite
different business sectors. From steel or textile mills to shipyards and coal mines, commercial property became practically
useless on the demise of the industry it had been built for. As a consequence, the calculation of a present discounted
value (PDV) for such single-use real estate demanded the inclusion of risk factors. These raised discount rates, which by
their inflated nature lowered the intrinsic long-term value of each building.
Now, real estate often involves multiple occupiers across varied sectors with space able to be realigned relatively easily
and not overly expensively. The result has been, if not to entirely remove the risk factors used in PDV calculations to
capture the possibility of a 'permanent void', as to bring the probability down sharply. This has provided property owners
with enhanced asset values and allowed them to capitalise on this for the benefit of the wider British economy.
1.9.3 Our future is in the clouds but still very real
As Britain progresses on its technological growth path, concerns will no doubt be expressed that its current commercial
real estate will not be fit for future purpose. Whilst it is easy to understand why such concerns may exist, it is important to
make clear why they must not be exaggerated.
The reality is that Britain's real estate has been challenged by change on many previous occasions over time, and in the
case of some notable 'shocks' it has failed to adjust, with leading to obsolescence and considerable cost. We have
considered elsewhere how in its past, Britain's industrial real estate was shocked and exposed as being fit for only one
purpose. Some are concerned by this sudden and dramatic obsolescence as rapid technological advance where
functionality moves from physical structures up into the clouds. To allay these fears, one needs to contrast the old
mercantilist Britain with the new. Where once Britain traded in steel, coal and ships, it now does so in insurance,
education and software. The real estate of these traditional industries were location and purpose specific and linked in
size to manpower, the new generation are less.
Consider Google and its new one million square feet in King’s Cross, whose output is far larger than one would see from a
traditional firm in a space of this size. Consider too how the new occupiers across London's financial districts will platform
their middle and back offices some distances from their front. Not overseas we will stress, but in Manchester, Birmingham
and Leeds. Online retailers also require premises, and as small inventory intensive shops on the high street close, huge
central distribution depots open. Whilst initially this seems to signal the demise of the British high street, they will, in fact,
shrink and become more focused, with some conversions to residential.
As for cloud technology, it must be emphasised that this demands a physical presence on terra firma. Rather than
imagining our physical data needs will lessen, we must be prepared to see them grow with our own population; Britain is
set to become Europe's largest economy by 2100, more populous not only than Germany, but Turkey.

TOSCAFUND BRITAIN’s PROPERTY CREDENTIALS
40 December 2015
1.9.4 The regeneration of Nine Elms & Battersea: a case study in regeneration and relocation
The US Embassy in London will eventually relocate to Nine Elms from Grosvenor Square, and so too the Embassy of the
Netherlands, moving from Hyde Park Gate. These moves will be an area of London along the Thames with an industrial
heritage, but not much pedigree beyond it. Indeed, one of its most recent inward relocations was the arrival in 1974 of
New Covent Garden Market. By 2020, Nine Elms in Wandsworth is likely to be amongst London's most celebrated
extensive mixed-use real estate regeneration and relocation success stories, set to boast hotels, offices, retail, art, leisure
and recreational real estate as well as residential and even, it has been suggested, a university campus and related
student accommodation . Once completed, Nine Elms will boast a skyline which will stand in the same way as The City
and Docklands at present.
Amongst its many other claims, a re-invigorated Nine Elms will be testament to transport investment as the Northern line
is extended. The area’s revival will also highlight the potency of overseas capital with funding for the re-development
originating from Malaysia's state-backed investment fund.
The regeneration of Nine Elms, and more widely the Vauxhall and Battersea area, will extend to the eponymous landmark
power station. Comprising two coal fired power stations opened in the mid 1930s and mid 1950s, Battersea was
decommissioned in 1983. Since then it has loomed large but economically useless along the Thames. Since the plant’s
closure, schemes ranging from a theme park and site of a new stadium for Chelsea FC to a return to power production
using bio fuels have all been muted. Each of these has floundered, not least because of the cost considerations in dealing
with a Grade II listed structure. In September 2012, the site was sold to a Malaysian consortium who have committed to
the redevelopment, involving the Power Station as the central focus of a regenerated 40-acre site, housing a blend of
shops, cafes, restaurants, art and leisure facilities, office space and residential accommodation.
In addition to the restoration of the historic Power Station itself, the plan for the area includes the creation of a new
riverside park to its north and the creation of a new High Street designed to link the future entrance to Battersea Power
Station tube station with the Power Station structure. It is hoped that the redevelopment will bring about the extension
of the existing riverside walk and facilitate access directly from the Power Station to Battersea Park and Chelsea Bridge.
Work commenced last year and plans include the restoration of the art deco structure internally and externally,
reconstruction of the chimneys, and refurbishment of the historic cranes and jetty as a new river taxi stop. The plan
includes over 800 homes of varying sizes and sales of residential apartments in Phase 1 of the redevelopment, of which
around three-quarters of the off-plan townhouses and apartments were sold within four days.
The full redevelopment consists of seven main phases, some of which are planned to run concurrently. Phase 1, named
Circus West involving work on the new residential property and the Power Station, began last year and is due to
complete in 2016/17. The Northern line extension and new Battersea Power Station terminal is anticipated to complete in
2020. Liew Kee Sin, chairman of the Battersea Project Holding Company, has said that Phase 1 and Phase 2 investment
combined has a 50-50% split between UK and foreign-based investment.
Returning to Nine Elms and its own regeneration, this will involve the need for “New Covent Garden Market” to relocate
again, albeit across the road (temporarily whilst the new site is redeveloped), proving when it does the peripatetic
qualities of Britain's modern economy. For as the Covent Garden metonym is moved once more it will illustrate the
importance of space over place, and how Britain's CRE requirements have altered from when the occupational needs of
its old industrial base were so often dictated to by place, with property often so specific it offered little if any potential to
be realigned for alternative use.
Like so many other case studies we have considered, Nine Elms and Battersea reflect how economically-dormant real
estate across London and more widely across Britain is being brought back to commercial life, relocation coinciding with
entirely new activity and all made possible by capital and occupiers from overseas.

TOSCAFUND BRITAIN’s PROPERTY CREDENTIALS
41 December 2015
1.9.5 Time to open up Britain's CRE
We are familiar with many across the industrial sector uses shift working around the clock to increase the productivity of
all related real estate, and this operational gearing improves its economic value. We would like to reflect on the
operational leverage of property beyond industry in the areas of retail, leisure and even business services.
Some readers will remember when high street banks closed at 3.30pm, and when many shops were shuttered early on
Thursdays and when little commercial activity occurred on a Sunday. Whilst this was relatively recent, it now seems
virtually impossible.
There will of course be those who remember the days before the introduction of Bank Holidays, when a need arose to
improve working conditions and govern working hours. Across a large part of Britain's CRE, in the past, its economic value
was restricted because of relatively limited hours of operation, creating opportunity costs. As business hours have
increased, so greater productivity has meant increased economic value.
Of course, some may claim longer business hours do not increase activity, but rather spread it, lowering hourly
productivity and actually increasing business costs. They may go on to argue that even were there to be economic gains
from extended opening hours, these would need to be considered against the personal costs faced by those working
them.
There is, however, the counter argument that longer business hours have delivered greater flexibility in how we use our
precious leisure hours, releasing us to spend more not less time with one another. There is also the evidence that average
hours worked have simply exhibited a cyclical pattern. One might also make the case that extended business hours have
encouraged greater labour activity, as those unable or unwilling to take-up full-time employment with 'conventional'
business hours, have been allowed into the labour market and into the world of work.
In section 1.3.6, we argued Britain’s economy would benefit as it provides a complementary time-zone home to those
businesses with operations in emerging economies or resource rich nations looking to operate around the clock. Just as
in making that case we argued certain business sectors do not lend their property or staff to shift-work, so we will make
the case again here. Businesses are perfectly conscious of how best to optimise their property and professionals through
the day, not to need the imposition of somewhat arbitrary restrictions.
In short, whilst working real estate involves depreciation and maintenance cost, these also apply to some degree when
property stands idle. And for this reason restrictions on business hours need to be considered in the context of the
opportunity cost of inactivity.
1.9.6 Mixed and change of use property: all for the better
There have been loudly-voiced concerns that abandoned shops could increasingly blight Britain's high streets and create
urban economic vacuums. Not only should any such alarm not be exaggerated, but the positive change for the good
must not be ignored.
Many stock intensive retailers have abandoned Britain's high streets, forced to close or relocate as 'their offer' is overtaken
by the convenience of and competition from the internet and large capacity retail parks. Rather than their departure
leading to long-term vacant possession, voids or the need to resort to 'charity shops', the relocation of low stock-turn and
inventory intensive retailers is opening up the chance for premises to realign; 'downstairs' to consumer services and
'upstairs' to residential.. Just consider a retailer of shoes or household textiles. In each case, the requirement to have stock
to hand involves taking up an entire building, upper floors and back rooms filled with inventory. The departure of durable
retail and consequent replacement with consumer services opens up the greater opportunity for combined business and
residential use.
Far from high streets being abandoned, we have the real possibility that urban centres will enjoy population growth and
renewal. Rather than centres emptying from 5pm and filling once more at 9am, urban centres will be enlivened by not
only change of use but greater mixed use.

TOSCAFUND BRITAIN’s PROPERTY CREDENTIALS
42 December 2015
1.9.7 Productive Property
The productivity of Britain's labour force and the real estate they occupy has been dramatically transformed over the
decades. Transformed because many of us can be productive in a host of real estate settings. And underlying this
transformation has been Britain's labour force becoming what we would argue is the prototype service economy. In its
most reduced form, the productivity of property can be measured by the cumulative output of those 'working' in it. Once
this would be confined to the single shift or what one could call the 'nine-to-five' rule. Until relatively recently many
Briton's were essentially only productive in their work situ. For those employed across 'hard' industrial sectors their
productive day could not begin until they had arrived at the real estate dedicated to their occupation. Similarly for those
across service sectors, albeit here one could arguably identify additional productivity as it were in the form of 'home
work'. Even this however was restricted by relatively limited remote office access. Matters are very different now, because
more Briton's than ever before are involved in 'soft' service sectors. And very different because of how technology has
allowed so many of us to be productive even when remote from our designated place of work. The result has been to
empower or make productive whichever property we occupy, whilst working off-site, but on-line. We are productive in
transit and we are productive even in recreation. And what this has done is transform how we measure the productivity
of Britain's real estate. Transport real estate such as airports and train stations has been empowered. Consider too other
real estate housing restaurants and retail. It is not only the cooking and waiting staff who can be said to be productive
but those diners enjoying a working meal. It is not only shop assistants who are being productive but their customers
using remote tools such as iPhones and androids, iPads and laptops between spending forays. The result of this
technology transformation should have included a transformation in how we measure the productivity of real estate. And
yet it hasn't, or certainly hasn't to the meaningful extent it should have.
1.9.8 Self-contained property
According to the Self Storage Association, Britain had barely 5 million square feet of capacity in 2002, and by 2013,
capacity had increased six fold, showing significant growth throughout the downturn, with over 1,000 facilities offering
self storage space. The forces underlying this expansion reflected many changing social-economic and demographic
patterns, as well as changing business habits. In both cases, self-storage provides greater flexibility than leasing
warehouse space and improved security over traditional lock-ups.
Amongst Britain's growing number of "Ebayers", “Gumtree-ers” and others, the flexibility, short-notice, low overheads
and cost of self-storage is often a preferred option to holding inventory. Particularly attractive is the absence of a business
rate. Whilst VAT was introduced to storage space in 2012, this can be reclaimed by business users. According to the
Valuation Office Agency (VOA), "we normally assess self-storage facilities as a warehouse and the operator will generally
be liable for the payment of rates" which of course is then included within the rent. As of 2014, 42% of self-storage use
was commercial, an increase of 39% over the previous two years. For operators such as Safestore and Big Yellow, Britain's
two largest operators, self-storage breaks into profitability above an occupancy rate of 40% as there are relatively low
overheads. For non-commercial users, self-storage provides an important option during home moves, with the rise in
private rental and migration certain to trigger growing usage of temporary and even longer term storage.
TOSCAFUND BRITAIN’s PROPERTY CREDENTIALS
43 December 2015
1.9.9 Moving buildings: It's elementary
Scotland Yard has become synonymous with London's policing. The name has in fact gone beyond being a mere
figurative metonym, attached officially to wherever the Metropolitan Police Service finds itself head-quartered; the name
literally moving building to building. Whilst the various "Scotland Yards" of their time have not been part of London's
CRE, their 'moving story' has been inextricably linked with it, involving issues such as shifts from and to commercial use,
land reclamation, new build and redevelopment, and more recently foreign ownership.
In 2016, the headquarters of London's Metropolitan police force will move again, to what will become the fourth in the
line of 'Scotland Yards'. In its next incarnation, Scotland Yard will return for a second time to the Victoria Embankment, on
this occasion taking up residence in the neo-classical "Extension" Building, more commonly known as "The Curtis Green
Building" after its architect (one of whose designs is the Dorchester Hotel on London's Park Lane and another the
Wolseley Building on Piccadilly).
Ahead of relocating in 2016, the Met's home remains where it has been since 1967, at 10 Broadway, by St James’s Park.
The current Scotland Yard building was sold to the Abu Dhabi Financial Group at the end of 2014, its new owner
intending to undertake a comprehensive redevelopment to mixed residential and commercial use.
This relocation highlights how space can be reclaimed and renewed from public to commercial use, done so in reverse,
and where new space is built purposefully or existing property redeveloped. It might be instructive to briefly plot how
over time Scotland Yard has moved around London.
The Metropolitan Police story begins in 1829 in a private house on 4 Whitehall Place backing onto a street named Great
Scotland Yard. By 1887, the Met headquarters had expanded from 4 Whitehall Place into several neighbouring addresses,
including 3, 5, 21 and 22 Whitehall Place; 8 and 9 Great Scotland Yard, and several stables. Indeed, some of the mounted
branch to this day use stables located at 7 Great Scotland Yard just across the street from the first headquarters.
Eventually, the needs of the Metropolitan Police had outgrown its original site, requiring new headquarters, and these
were to be built overlooking the River Thames.
The force moved into New Scotland Yard in 1890 to buildings sitting on land reclaimed from the Thames thanks to the
construction of the Victoria Embankment. By this time, the Met had grown from its initial 1,000 officers to about 13,000
and needed more administrative staff and a bigger headquarters. Further increases in the size and responsibilities of the
force required even more administrators, and in 1907 and 1940, New Scotland Yard was extended further. This complex is
now a Grade I listed structure known as the North Norman Shaw Buildings, mostly Government offices, but still partly
used as the base for the Metropolitan Police's Territorial Support Group. The South Building, now Grade II listed, built
during 1902-1906, was originally called Scotland House, and was linked to the original north building by a bridge over
what was then a public road.
By the 1960s, the requirements of modern technology and further increases in the size of the force meant that it had
outgrown its Victoria Embankment site. In 1967 New Scotland Yard moved to 10 Broadway, close to St James’s Park. The
building, which was an existing office block was acquired under a long-term lease, and now houses 2,000 staff. It is also
home to a national computer system developed for major crime enquiries by all British forces, called the Home Office
Large Major Enquiry System, more commonly referred to by its acronym HOLMES, which recognises the great fictional
detective Sherlock Holmes.
In addition to Scotland Yard and London’s many police stations the Met occupiers a number of large buildings across the
capital. Certain administrative functions are based at the Empress State Building, whilst communications are handled at
the three Metcall complexes, rather than at Scotland Yard.
The Empress State Building is a skyscraper originally designed as a hotel located on the border of West Brompton and
Earls Court, in the London Borough of Hammersmith and Fulham. It was built in 1961 extending to 28 floors and was
renovated in 2003.
Having been tenants since 1967, in 2008, at a time of considerable market unease amongst property owners, the
Metropolitan Police Authority bought the freehold to New Scotland Yard for c£120m. As already mentioned, the freehold
was sold in December 2014 for £370m, the Met confirmed in May 2013 that it would dispose of its Broadway site and the
force's headquarters moving to "The Curtis Green Building" located along the Victoria Embankment, a building which
incidentally had formerly been home to Whitehall police station.
The Curtis Green Building will be renamed Scotland Yard. This will be all the more appropriate, albeit confusing to some,
since its new site sits adjacent to the second "Scotland Yard", now the Norman Shaw North Building.
As for the often gruesome private invitation-only Crime or "Black" Museum housed in room 101 of the present "Scotland
Yard", this will be moved to a new site and opened to the public, with revenues contributing to the Met's budget. The
iconic rotating three-sided sign identifying "Scotland Yard" this will adorn its new 'home'.
TOSCAFUND BRITAIN’s PROPERTY
44
It is likely that the Met's will move again at some point in the future, at which point the Scotland Yard name and its
famous three-sided rotating sign would find themselves on the move again. As
too would turn itself to another useful occupation
1.9.10 Britain's sustainably eco
From the use of solar, wind and other renewable forms of power and renewed materials, across to more efficient use
heat and light Britain's CRE is arguably at the forefront in achieving ambitious targets on climate protection. Indeed it is
crucial in fulfilling not one but two eco-friendly roles, one protecting our ‘eco
And in its economic role CRE provides a favourable feedback in its ecological role. For much of the reduction in the
carbon footprint made by us all whilst at work and in our leisure has only been realised because of the eco
made to the real estate we occupy in these pursuits. This is not to claim more cannot be done, because the process is not
only ongoing but accelerating. Rather it is to make clear that as a factor input to Britain's economy CRE is not only making
its own contribution to reducing our impact on the environment but facilitating the improvement made by another
factor input; us. Indeed, as important as has been the increase in the number of electric motor vehicles across Britain we
should remember these are being assembled in increas
increasing numbers across Britain whilst also being exported in growing numbers too, friendly then on two eco
Chart 13: Net CO2 emissions, million tonnes
Source: ONS
In the pursuit of reducing our green house gas emissions we should remember that the glass or green house is an early
form of CRE which enhanced food production embracing the
tracing themselves back to the Roman Emperor Tiberious to grow his favoured cucumber
appear in numbers across Britain from the 17
formally started in 1759 and which consists of 300 acres of gardens, botanical green
include the Nash and Prince of Wales Conservatories, Palm, Temperate and Waterlily Houses, the Orangery and most
recently the Alpine House, which opened in 2006, the third version taking that name. Just as Kew Gardens is flourishing
as a non-departmental public body, so too are botanical and horticultural building’s run commercially across Britain’s real
estate world.
BRITAIN’s PROPERTY CREDENTIALS
It is likely that the Met's will move again at some point in the future, at which point the Scotland Yard name and its
sided rotating sign would find themselves on the move again. As for the vacated Curtis Green Building, it
too would turn itself to another useful occupation.
Britain's sustainably eco-friendly built-scape
From the use of solar, wind and other renewable forms of power and renewed materials, across to more efficient use
heat and light Britain's CRE is arguably at the forefront in achieving ambitious targets on climate protection. Indeed it is
friendly roles, one protecting our ‘eco-logy’ the other promoting our ‘eco
in its economic role CRE provides a favourable feedback in its ecological role. For much of the reduction in the
carbon footprint made by us all whilst at work and in our leisure has only been realised because of the eco
e we occupy in these pursuits. This is not to claim more cannot be done, because the process is not
only ongoing but accelerating. Rather it is to make clear that as a factor input to Britain's economy CRE is not only making
g our impact on the environment but facilitating the improvement made by another
factor input; us. Indeed, as important as has been the increase in the number of electric motor vehicles across Britain we
should remember these are being assembled in increasingly eco-friendly industrial real estate within Britain, driven in
increasing numbers across Britain whilst also being exported in growing numbers too, friendly then on two eco
emissions, million tonnes Chart 14: Fruit grown in Greenhouses
In the pursuit of reducing our green house gas emissions we should remember that the glass or green house is an early
form of CRE which enhanced food production embracing the environment rather than harming it. These structures,
tracing themselves back to the Roman Emperor Tiberious to grow his favoured cucumber
appear in numbers across Britain from the 17th century. They arguably found their defining f
formally started in 1759 and which consists of 300 acres of gardens, botanical green-houses and conservatories. These
include the Nash and Prince of Wales Conservatories, Palm, Temperate and Waterlily Houses, the Orangery and most
recently the Alpine House, which opened in 2006, the third version taking that name. Just as Kew Gardens is flourishing
departmental public body, so too are botanical and horticultural building’s run commercially across Britain’s real
DENTIALS
December 2015
It is likely that the Met's will move again at some point in the future, at which point the Scotland Yard name and its
for the vacated Curtis Green Building, it
From the use of solar, wind and other renewable forms of power and renewed materials, across to more efficient use of
heat and light Britain's CRE is arguably at the forefront in achieving ambitious targets on climate protection. Indeed it is
logy’ the other promoting our ‘eco-nomy’.
in its economic role CRE provides a favourable feedback in its ecological role. For much of the reduction in the
carbon footprint made by us all whilst at work and in our leisure has only been realised because of the eco-improvements
e we occupy in these pursuits. This is not to claim more cannot be done, because the process is not
only ongoing but accelerating. Rather it is to make clear that as a factor input to Britain's economy CRE is not only making
g our impact on the environment but facilitating the improvement made by another
factor input; us. Indeed, as important as has been the increase in the number of electric motor vehicles across Britain we
friendly industrial real estate within Britain, driven in
increasing numbers across Britain whilst also being exported in growing numbers too, friendly then on two eco-fronts.
: Fruit grown in Greenhouses
In the pursuit of reducing our green house gas emissions we should remember that the glass or green house is an early
environment rather than harming it. These structures,
tracing themselves back to the Roman Emperor Tiberious to grow his favoured cucumber-like vegetable, began to
century. They arguably found their defining form In Kew Gardens,which
houses and conservatories. These
include the Nash and Prince of Wales Conservatories, Palm, Temperate and Waterlily Houses, the Orangery and most
recently the Alpine House, which opened in 2006, the third version taking that name. Just as Kew Gardens is flourishing
departmental public body, so too are botanical and horticultural building’s run commercially across Britain’s real

TOSCAFUND BRITAIN’s PROPERTY CREDENTIALS
45 December 2015
Part 2. Analytics of Britain’s CRE sector: concepts and numbers
2.1 Definition and Value
2.1.1 Definition
We must first define what we mean by CRE. While an everyday definition is fairly straightforward, in terms of examples
like offices, factories and shops, a precise definition is more complex.
In economic terms CRE is capital, and constitutes a large part of the economy’s capital stock. Capital is a produced factor
of production and as such it contributes to the economy in three distinct ways: first, as a factor of production it
contributes directly to the output of goods and services (GDP), second, as an asset it is part, and we will argue a large part,
of the economy’s stock of wealth, and third the production of CRE, that is construction, is in economic terms investment
and thus a significant determinant of employment and economic growth. Thus, in the next two chapters (2.2 and 2.3) we
endeavour to estimate the value of CRE, first in terms of its contribution to GDP, then as a component of wealth and
thirdly as part of current economic activity.
‘Real Estate’ is ‘immoveable property’, that is buildings and other structures which are fixed at a particular location. We
exclude land because it is not produced but include location which is a component of the value of buildings. We will take
the value of real estate to mean the full value of a commercial building, and not attempt to separate out an element of
site value.
Originally the word ‘commercial’ referred to ‘trade’ as against ‘manufacturing’, so one might see reference to ‘industrial
and commercial property’. More recently the word commercial has been used more inclusively, to cover any activities
which produce marketable goods and services with the objective of generating a profit from so doing. It thus includes
manufacturing (factories and the like) but also both business services (such as offices) and services provided direct to the
consumer (such as shops, cinemas and hotels).
While these examples are not contentious there are many activities which are ‘commercial’ in the sense of having to
cover their costs through the sale of goods or services but which are owned or managed by public authorities, charities or
other not-for-profit organisations, and which do not seek to make a profit. The reality is that there can be no definitive
CRE universe because there are segments of the economy which do not categorise exactly. For example universities are
not run primarily for pecuniary gain yet are moving increasingly into ventures with a commercial angle. Think also of the
employer-owned retailer John Lewis Partnership – whose eponymous stores and Waitrose all operate within a trust. Or an
independent school that needs to raise sufficient money through fees (or gifts) to cover its costs, but may typically be set
up as a charity with trustees rather than shareholders, and any surplus is reinvested rather than distributed. We will refer
to these activities, and the real estate they occupy, as ‘quasi-commercial’ because in many respects the owners of quasi-
commercial real estate face very similar economic pressures to those of the commercial sector. Even where such activities
are run on a commercial basis, it is contrary to normal usage to describe them as commercial, and we will not do so.
Of course much real estate is not commercial or even quasi-commercial. Most public buildings and most of the nation’s
infrastructure of roads, tunnels, bridges and the like generate no pecuniary
income or only from marginal activities, such as hiring out the town hall for a
wedding reception. But even here the position is not always clear, for example
airports were mostly public but now, at least in the UK, are mostly privately
owned and run on commercial lines. Railways are more problematic having
been privatised by now in part re-nationalised.
None the less, our ‘economic’ definition of CRE is somewhat wider than that
often employed, which appears sometimes based more on property
characteristics than economic function. For example, a property company
renting out flats is in economic terms providing much the same service as a
hotel, and similarly private individuals letting out property to generate
income in the ‘buy-to-let’ sector are engaging in business activity so that such
housing is part of CRE. In the business sector, infrastructure installations like
oil refineries or (privately owned) airports are as commercial as other
manufacturing or retail operations. In what follows, we will make use of this
definition to determine which structures count as CRE.
So how much of Britain’s real estate is ‘commercial’? We have, of course, not attempted to create a new register of all the
property in the UK, but base our measures on the closest we have to a modern day Domesday Book; the register created
by the Valuation Office Agency. The VOA was set up in 1910 for the purpose of listing and valuing all property in England
and Wales thereby providing measures of the tax base for local authority property taxes (see Box 1 above).
Box 1. The VOA The Valuation Office Agency is a
government body whose function is to
value properties for the purpose of Council
Tax and for non-domestic rates in England
and Wales.
The Inland Revenue set up the VO after the
introduction of a new land value tax in
Finance Act of 1910.
The VOA employs almost 4,000 people and
is the largest single employer of chartered
surveyors in the UK.
Scottish Assessors perform the same work
for Scotland and Land & Property Services
operate on behalf of the Department of
Finance & Personnel in Northern Ireland.

TOSCAFUND BRITAIN’s PROPERTY CREDENTIALS
46 December 2015
However for various reasons, including taxation, it has been convenient to separate the valuation of dwellings
(‘domestic’) from other (‘non-domestic’) properties. With regard to non-domestic properties the VOA lists properties in
four main groups (offices, industrial, shops and hotels and others) which are sub-divided into no less than 369 categories.
We have reviewed this list, carefully in the case of the larger categories, more impressionistically in the case of the smaller
ones to determine which can properly be described as commercial and which better fit our ‘quasi-commercial’ or non-
commercial categories.
In Table 2 below we indicate some examples of the types of property in each category while a full list is given in Appendix
1 (which also gives the aggregate value assigned to each category).
Table 2. How ‘Commercial’ is Commercial Real Estate
Commercial Real Estate Quasi-Commercial Non-Commercial
Dwellings Private rental
Property companies
Buy-to-let
Owner occupied
Social rented
Non-Residential building Offices
Factories
Shops
Universities
Museums and art galleries
Local authority schools
Hospitals & clinics NHS
Police stations
Other Structures Airports
Oil installations
Sports grounds Roads
Source: Valuation Office Agency, Toscafund
2.1.2 Some taxing concerns over CRE taxonomy
In our analysis, we have endeavoured to challenge the conventional taxonomy of Britain's CRE market. We have argued
that elements hitherto excluded from the orthodox categorisation be fully included, or that at the very least these be
considered as quasi-CRE, in proportion to their respective contributions to Britain's 'commercial' economy.
In theory, we have a clear-cut and seemingly mutually exclusive and exhaustive breakdown between offices, industrial
and retail space, but there are two criticisms of this methodology. First, there is little or no room for a rapidly expanding
PRS component, and second, there is the failure to allow for the increase in British commercial property essential for the
(literal) delivery of goods serving the demands of a growing technology based economy.
Chart 15: IPD performance measures Chart 16: Capital Values of CRE and PRS
Source: IPD, Toscafund
We question the accuracy of the measurement of development, overall take-up and rental and capital growth of Britain's
CRE on the grounds that these exclude the property classes that we would choose to include as providing essential
commercial benefits to Britain, not least private rental .Our argument, in essence, is that the existing taxonomy has yet to
fully adjust to the evolution in Britain's economy, and is therefore both under and over-stating segmented performance.
We believe that PRS should be integrated as into Britain’s modern CRE. Indeed, in many cases, property now involved in
the PRS was formally in the retail, industrial and office segments. In its delivery of fiscal and broader wealth multipliers,
PRS has all the hallmarks of the three 'classical' CRE markets.
-30
-20
-10
0
10
20
30
2001 2002 2003 2004 2005 2006 2007 2008 2009 2010 2011 2012 2013 2014
%
Retail Office Industrial
0.0
0.2
0.4
0.6
0.8
1.0
1.2
1.4
1.6
1.8
2005 2009 2010 2011 2012 2013 2014
Tri
llio
ns
Commercial real estate Private Rented Sector

TOSCAFUND BRITAIN’s PROPERTY CREDENTIALS
47 December 2015
2.1.3 Valuation
The problem with valuing the contribution of property to economic activity is that it is essentially sedentary, whereas
economic activity generally entails movement, flows of goods and services, production, consumption, exports and
imports. Of course, property is needed to enable these activities to take place, but this does not help to quantify that
contribution. The challenge is measure what the UK’s property assets are worth to the economy, or its contribution to
Gross Domestic Product (GDP).
GDP is the total value of all marketed goods and services produced within an economy over some period of time, usually
a year. It is the value of final output, that is goods and services entering into consumption and investment (including
government consumption or investment) or exports, but not including intermediate goods. Within any organisation it
corresponds to the value of sales less the cost of materials etc., also known as ‘value added’. The surplus of sales revenue
over material costs constitutes income of a factor of production (labour or capital) or as profit. It therefore follows that
GDP can also be measured as the total of payments to factors of production in the economy, which is also the sum of
total household income and retained (undistributed) profits.
We have made clear in Part 1 of this report that the contribution of
commercial real estate goes far beyond the generation of cash
income for its owners. There are many benefits that are not included
in GDP, from the environment to aesthetics and from security to
sustainability. To focus solely on GDP would be grossly inadequate.
However, the production of marketable goods and services is the
immediate purpose of CRE, (its day job, as it were) and we need
therefore to measure this, and this also measures the contribution
CRE makes to GDP.
It is a standard proposition in economics that, in competitive
markets, the contribution of a factor to GDP can be measured by
how much it gets paid. This example is illustrated in Box 2.
So, if a firm were to rent its office buildings from a property
company, the rent it pays for the use of the buildings measures their
value to the firm and hence their ‘contribution’ to the firm (the
increase in the net profit the firm can make as against a situation in
which it did not have the use of those buildings).
Valuing the contribution of property by its market rent, though beset with practical complexities, has the major
advantage that it corresponds to the obligation on the VOA to provide ‘open market’ rental valuations of properties. The
VOA therefore provides us not only with a register of all properties, but also its best estimate of their market rents. There
are, of course, estimates only as we do not have direct open market rental evidence for many properties.
There are obvious complexities such as rent reviews, where rents are adjusted periodically rather than adjusting
continuously to reflect changes in market conditions, but, more importantly for many types of property there is no ‘open
market’. For example, there is no market in oil refineries, or at least no evidence of market transactions. In fact, for many
types of commercial property there is not much market evidence, but valuers have devised techniques for addressing
these problems and most rateable values are determined on the basis of accepted criteria with regard to factors such as
comparability rather than exclusively on the basis of direct observation of open market rents. The absence of observed
market rents has been a particular problem in relation to housing and we return to this below.
An immediate consequence of the paucity of open market rental evidence is that VOA valuations are conducted
periodically, in principle once every five years. For non-domestic properties the principle of five-yearly valuations has
been maintained until very recently, the most recent being in 2003 and 2008 (though for domestic properties the
principle was abandoned in the 1970s, see below). For non-domestic properties new valuation lists were issued in 2005
and 2010, based on 2003 and 2008 (‘antecedent date’) valuations respectively. Chart 17 shows the evolution of non-
domestic rateable value in England and Wales since 2000. The graph has big jumps in value following the revaluations,
with minimal changes in between (due to new buildings, renovations etc.) but, as the red line shows overall floor space
(‘footprint’) has been static, and the growth in non-domestic rateable value reflects increasing rentals per square foot
rather than an increase in the number of square feet.
Finally we consider housing. During much of the post-war period there was extensive rent control and in particular the
last attempted revaluation of dwellings (in 1973) was carried out at a time, following the Rent Act of 1968, when an open
market in rental housing was essentially non-existent. Clearly, in the absence of any evidence, basing taxation on
hypothetical open market rents could not be sustained. This led to the abolition of domestic rates and their replacement
initially by the community charge (poll tax) and then by council tax which is based on capital values. The VOA therefore
made a comprehensive valuation of all dwellings for council tax, based on evidence of market transactions adjusted to
Box 2.
Clearly firms employ both labour and capital: both are
essential. So why does labour get paid 70% and capital
30%? Consider say Starbucks. Obviously it needs its
CRE, its coffee shops, but it also needs its raw materials
and its labour (baristas). What determines how much
each of these gets paid? As far as Starbucks is
concerned there is a market and it pays the market
price. But the payoff to Starbucks from opening up
another coffee shop is the additional profit it can make
from doing so. And it will open up another coffee shop
as long as the additional profit at least covers the cost.
The additional profit is the addition to sales revenue
less operating costs, so it measures the contribution of
the CRE to GDP. So the contribution to GDP is
measured by how much each factor contributes at the
margin – one more coffee shop, one more barista, and
measured in this way such contributions add up to the
total GDP.

TOSCAFUND BRITAIN’s PROPERTY CREDENTIALS
48 December 2015
the valuation date, April 1991. There has been no revaluation since then, so all dwellings built since 1991 are valued at
what they would have been worth in 1991. Fortunately there are other sources of information on housing rents and
prices.
In valuing CRE in the chapters that follow, we will therefore use VOA data for property other than housing (‘non-
domestic’ property), but use independent data for the private rental sector.
Chart 17: VOA rateable value (England & Wales)
Source: Valuation Office Agency.(experimental statistics, release date May 2012 – data is Local Rating List sectors only)
Note: Figures include retail, offices and industrial business floor space – Other is excluded. The incremental increase in rateable value reflects the infrequent nature of valuation.
540
545
550
555
560
565
570
575
580
585
0
10
20
30
40
50
60
70
2000 2002 2004 2006 2008 2010 2012 2014
millio
n m
2
£b
n
Rateable value Footprint (rhs)
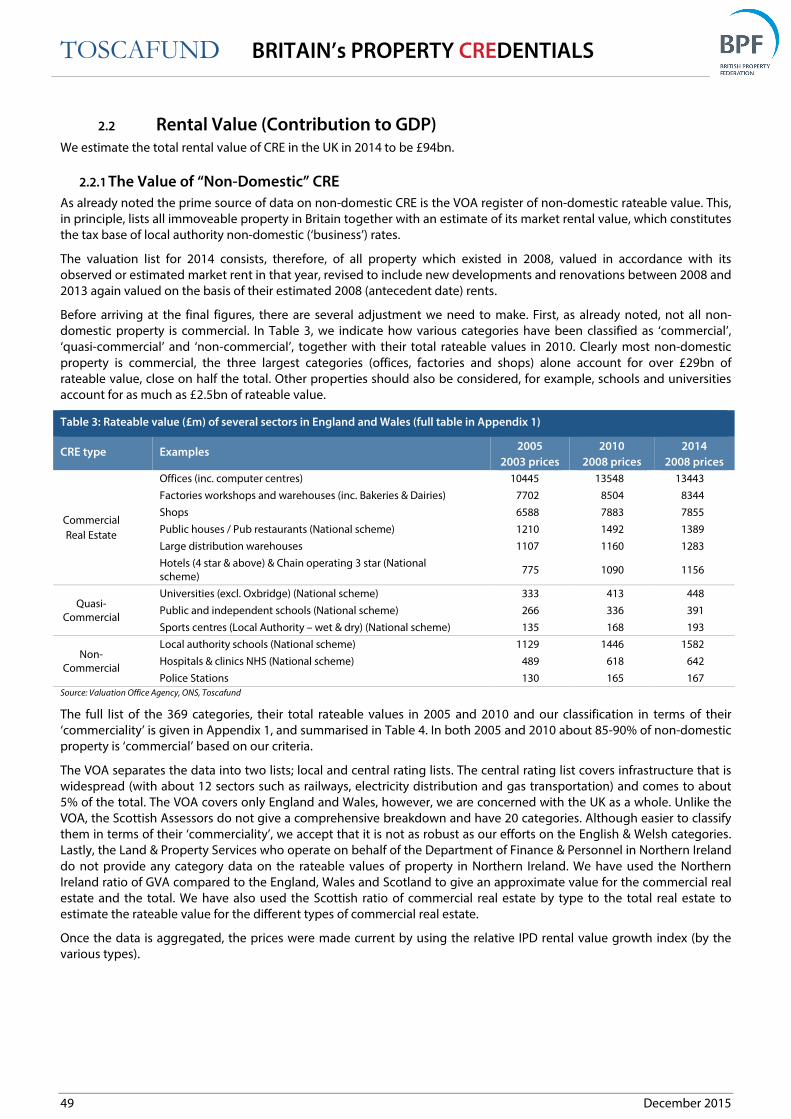
TOSCAFUND BRITAIN’s PROPERTY CREDENTIALS
49 December 2015
2.2 Rental Value (Contribution to GDP) We estimate the total rental value of CRE in the UK in 2014 to be £94bn.
2.2.1 The Value of “Non-Domestic” CRE
As already noted the prime source of data on non-domestic CRE is the VOA register of non-domestic rateable value. This,
in principle, lists all immoveable property in Britain together with an estimate of its market rental value, which constitutes
the tax base of local authority non-domestic (‘business’) rates.
The valuation list for 2014 consists, therefore, of all property which existed in 2008, valued in accordance with its
observed or estimated market rent in that year, revised to include new developments and renovations between 2008 and
2013 again valued on the basis of their estimated 2008 (antecedent date) rents.
Before arriving at the final figures, there are several adjustment we need to make. First, as already noted, not all non-
domestic property is commercial. In Table 3, we indicate how various categories have been classified as ‘commercial’,
‘quasi-commercial’ and ‘non-commercial’, together with their total rateable values in 2010. Clearly most non-domestic
property is commercial, the three largest categories (offices, factories and shops) alone account for over £29bn of
rateable value, close on half the total. Other properties should also be considered, for example, schools and universities
account for as much as £2.5bn of rateable value.
Table 3: Rateable value (£m) of several sectors in England and Wales (full table in Appendix 1)
CRE type Examples 2005
2003 prices
2010
2008 prices
2014
2008 prices
Commercial
Real Estate
Offices (inc. computer centres) 10445 13548 13443
Factories workshops and warehouses (inc. Bakeries & Dairies) 7702 8504 8344
Shops 6588 7883 7855
Public houses / Pub restaurants (National scheme) 1210 1492 1389
Large distribution warehouses 1107 1160 1283
Hotels (4 star & above) & Chain operating 3 star (National
scheme) 775 1090 1156
Quasi-
Commercial
Universities (excl. Oxbridge) (National scheme) 333 413 448
Public and independent schools (National scheme) 266 336 391
Sports centres (Local Authority – wet & dry) (National scheme) 135 168 193
Non-
Commercial
Local authority schools (National scheme) 1129 1446 1582
Hospitals & clinics NHS (National scheme) 489 618 642
Police Stations 130 165 167
Source: Valuation Office Agency, ONS, Toscafund
The full list of the 369 categories, their total rateable values in 2005 and 2010 and our classification in terms of their
‘commerciality’ is given in Appendix 1, and summarised in Table 4. In both 2005 and 2010 about 85-90% of non-domestic
property is ‘commercial’ based on our criteria.
The VOA separates the data into two lists; local and central rating lists. The central rating list covers infrastructure that is
widespread (with about 12 sectors such as railways, electricity distribution and gas transportation) and comes to about
5% of the total. The VOA covers only England and Wales, however, we are concerned with the UK as a whole. Unlike the
VOA, the Scottish Assessors do not give a comprehensive breakdown and have 20 categories. Although easier to classify
them in terms of their ‘commerciality’, we accept that it is not as robust as our efforts on the English & Welsh categories.
Lastly, the Land & Property Services who operate on behalf of the Department of Finance & Personnel in Northern Ireland
do not provide any category data on the rateable values of property in Northern Ireland. We have used the Northern
Ireland ratio of GVA compared to the England, Wales and Scotland to give an approximate value for the commercial real
estate and the total. We have also used the Scottish ratio of commercial real estate by type to the total real estate to
estimate the rateable value for the different types of commercial real estate.
Once the data is aggregated, the prices were made current by using the relative IPD rental value growth index (by the
various types).

TOSCAFUND BRITAIN’s PROPERTY CREDENTIALS
50 December 2015
Table 4 – Rateable values of CRE in UK
Region List Year of data 2005 2009 2010 2011 2012 2013 2014
England and Wales
Antecedent date (priced at) 2003 2008 2008 2008 2008 2008 2008
Local
Rating List Commercial Real Estate (£bn) 42.0 51.1 51.5 51.7 51.6 51.4 51.5
Quasi-CRE (£bn) 2.3 2.9 2.9 3.0 3.1 3.1 3.2
Non-remunerative (£bn) 3.8 4.8 4.8 4.9 5.0 5.0 5.0
Central
Rating List Commercial Real Estate (£bn) 2.7 2.6 2.6 2.6 2.6 2.5 2.5
Quasi-CRE (£bn) 0.08 0.07 0.07 0.07 0.07 0.07 0.06
Non-remunerative (£bn) 0.35 0.35 0.35 0.35 0.35 0.35 0.35
Total Commercial Real Estate (£bn) 44.7 53.7 54.1 54.3 54.1 53.9 54.0
Rateable value (£bn) 51.3 61.8 62.3 62.7 62.6 62.5 62.6
Current
Prices Commercial Real Estate (£bn) 47.2 49.3 49.5 49.8 49.6 49.6 51.0
Rateable value (£bn) 54.0 57.2 57.6 58.2 58.1 58.2 59.8
Scotland
Antecedent date (priced at) 2003 2003 2008 2008 2008 2008 2008
Totals
(Current
Prices)
Commercial Real Estate (£bn) 3.9 4.0 4.2 4.2 4.3 4.2 4.5
Quasi-CRE (£bn) 0.9 1.0 1.5 1.5 1.5 1.5 1.5
Non-remunerative (£bn) 0.4 0.5 0.6 0.6 0.6 0.6 0.4
Total Rateable value (£bn) 5.25 5.3 6.23 6.30 6.34 6.35 6.43
Northern
Ireland
Current
Prices
Commercial Real Estate (£bn)
(calculated using GVA ratio)) 1.22 1.27 1.26 1.25 1.23 1.21 1.30
Total Rateable value (£bn) 1.42 1.50 1.49 1.49 1.47 1.44 1.55
UK at Current
prices
Total Commercial Real Estate (£bn) 52.4 54.6 54.9 55.3 55.1 55.1 56.8
Total Rateable value (£bn) 60.7 64.3 65.3 66.0 65.9 66.0 67.8
Total
(Voids) Commercial Real Estate
(£bn) 48.6 49.4 50.2 50.5 50.0 50.4 52.3
Total Rateable value (£bn) 56.6 58.7 60.1 60.7 60.4 61.0 62.9
Source: Valuation Office Agency, Scottish Assessors, ONS, Toscafund. Note: Data shaded grey is estimated
Chart 18: UK rateable values by type, at current prices and accounting for voids
Source: Valuation Office Agency. Scottish Assessors, ONS, Toscafund
0
10
20
30
40
50
2005 2009 2010 2011 2012 2013 2014
£ b
illi
on
s
Retail Office Industrial Infrastructure Other

TOSCAFUND BRITAIN’s PROPERTY CREDENTIALS
51 December 2015
2.2.2 The Value of Private Rental Housing
The bulk of UK housing stock is owner-occupied and, for better or worse, this does not count as commercial. Similarly,
local authorities and housing associations provide much of the rented housing and this is also not commercial. Table 5
and Chart 19 show the growth of the various sectors since 1981, during which time the number of owner-occupied
properties has more than doubled while the private rental sector fell sharply up until 1991 but has experienced rapid
growth more recently, particularly since 2001. The table and chart also show forecasts of the increase in the housing stock
by sector up until 2014, which project a rapid further growth in private renting.
Table 5: Trends in tenure in the UK (million dwellings) Chart 19: UK tenure trend, dwellings
Year Owner
occupied
Private
renters
Social
renters
1961 7.15 5.65 3.82
1971 9.63 3.75 5.89
1981 12.21 2.32 7.05
1991 15.53 2.01 5.84
2001 17.60 2.44 5.32
2011 17.90 4.73 4.92
2012 17.79 4.96 4.94
2013 17.71 5.17 4.96
2014* 17.65 5.47 4.90
Source: Department for Communities and Local Government, ONS (Census), Toscafund (*forecast)
Chart 20: Tenure by region, 2013
Source: DCLG, Welsh Assembly Government, Scottish Government, ONS, Toscafund
Around 18.6% of the UK housing stock is in the private rented sector. It includes both major residential developments
such as blocks of flats, but also a substantial small scale activity where individual landlords ‘buy-to-let’ one or a small
number of, properties. Data on housing is collected separately for England, Wales, Scotland and Northern Ireland. The
distribution of the housing stock by tenure is shown by country in Chart 20.
We also have data on average rents paid in the private sector, so this data taken with the number of properties in the
sector allows us to obtain estimates of the total income received by private sector landlords.
0
2
4
6
8
10
12
14
16
18
20
1981 1986 1991 1996 2001 2006 2011
Mil
lio
n
Rented Privately Owner Occupied Social
0
10
20
30
40
50
60
70
80
90
100
UK England Wales Scotland Northern
Ireland
%
Rented Privately Owner Occupied Social

TOSCAFUND BRITAIN’s PROPERTY CREDENTIALS
52 December 2015
Table 6 – UK Private rental sector income
Region Year 2005 2008 2009 2010 2011 2012 2013 2014 Source
England
and Wales
Number of dwellings (£m) 2.83 3.58 3.86 4.08 4.29 4.48 4.66 4.80 DCLG
Average monthly Rent 599 666 656 674 702 723 742 754 LSL
Monthly Rental Income (£bn) 1.69 2.38 2.53 2.75 3.01 3.24 3.45 3.62
England
Number of dwellings (m) 2.72 3.44 3.71 3.91 4.11 4.29 4.47 4.59 DCLG
Average monthly Rent 592 659 648 667 696 705 742 745 VOA
Monthly Rental Income (£bn) 1.61 2.27 2.40 2.61 2.86 3.02 3.31 3.42
Wales
Number of dwellings (m) 0.11 0.14 0.16 0.17 0.18 0.19 0.19 0.21 DCLG
Average monthly Rent) 412 459 451 472 489 498 498 519 StatsWales
Monthly Rental Income (£bn) 0.04 0.06 0.07 0.08 0.09 0.10 0.09 0.11
Scotland
Number of dwellings (m) 0.23 0.26 0.29 0.30 0.32 0.37 0.39 0.39 DCLG
Average monthly Rent 424 472 464 478 508 509 519 534 LSL
Monthly Rental Income (£bn) 0.09 0.12 0.13 0.14 0.16 0.19 0.20 0.21
Northern
Ireland
Number of dwellings (m) 0.07 0.08 0.10 0.11 0.12 0.12 0.13 0.13 DCLG
Average monthly Rent 435 484 476 490 510 526 539 548 NI Housing Executive
Monthly Rental Income (£bn) 0.03 0.04 0.05 0.05 0.06 0.06 0.07 0.07
UK Annual Rental Income (£bn) 21.37 29.90 31.81 34.64 38.04 40.40 44.15 45.73
UK Annual Rental Income (£bn)
Accounting for voids 19.6 27.4 29.2 31.7 34.9 37.0 40.5 41.9
Notes: Dwelling stock forecasted for Wales and Scotland, 2014, using a linear regression analysis. Data shaded grey is estimated using the complete England & Wales LSL Property
Services rental dataset.
The Department for Communities and Local Government’s (DCLG) latest number of dwellings figures have been updated
to 2014 except for Wales and Scotland, where we used a linear regression analysis to forecast values the 2014 value. We
had a complete list of data for England & Wales rents from LSL Property Services, but wanted to use the larger rental
datasets from the VOA, Statistics Wales and NI Housing Executive. So we took the LSL rental dynamics and applied them
to the larger datasets.
Adding the estimates for each country gives a UK value of total rental income from private sector dwellings of £45.7bn
(2014). Lastly, this estimate has to be reduced to reflect voids – property left empty and providing no service. It is
customary to assume properties are on average empty for one month a year, so the actual rents generated fall short of
the full occupancy potential by around 8%. Reducing £45.7bn by 8.3% gives a figure of £41.9bn. This measures the
contribution of private rented housing to GDP.
Adding the total rental income from PRS (£41.9bn) to the rental value of non-domestic CRE (£52.3bn) gives a final figure
of £94.2bn for the contribution of CRE to GDP in 2014. This is 5.4% of GDP.

TOSCAFUND BRITAIN’s PROPERTY CREDENTIALS
53 December 2015
2.2.3 CRE and the generation of household income
The income attributable to commercial property accrues in the first instance to its owners. It may be thought that as most
people do not own commercial property, this is of no great interest to them, but such a conclusion would be wrong.
We need to distinguish legal from ‘beneficial’ ownership. The latter is the entity who ultimately receives the income
which is, often, far from obvious. For example, if a company issues equity shares to finance a new CRE investment, many
of those shares will be acquired by financial intermediaries such as pension or insurance companies. The pension fund
will use the dividends on these equities to fund its obligations to its contributors, so that ultimately a pensioner is
receiving income generated by the CRE.
Office buildings are often owned by property companies, but these too need finance, again sometimes through the issue
of equity capital, but often through debt (corporate debentures or loans). Such debt may be put up directly by
households or provided by other financial institutions such as banks, which in turn raise funds from households. Likewise
in the housing sector, much ‘buy-to-let’ housing is financed through mortgages from banks or building societies. The
rental income generated thus pays the interest households receive on their bank or building society deposits.
We look in more detail at the linkages between financial intermediaries in section “2.3.4 - Who owns Britain’s CRE?”, as the
data on this relates more directly to asset values than to income flows. Some insight on income receipts can be gleaned
from tax returns and we look at this next.
In Table 7, we set out aggregate HMRC tax data for 2012/13, broken down into four main categories, employment, self-
employment, pensions and a final category ‘property, interest, dividend and other’ income. The first three of these
categories were until recently termed ‘earned income’ (income from labour), and the final category ‘unearned or
investment income’ (income from capital). The total income known to the tax authorities amounted to £904bn of which
only £70.3bn (7.4%) was derived from property, interest and dividends.
Even so, remarkably no less than 26.6 million taxpayers (80%) derived some income from this source. However, the actual
amount households receive is very unequally distributed. The average income from this source is £2,650, but the median
is only £22, meaning that half of all recipient households benefit by less than £22 a year from these income sources.
The tax authorities split up the income received between the several sub-categories. This is shown in Table 10, which
shows that most households receive income from interest on bank deposits (though the average is relatively low) with
only a few households (1.63 million, or about 5% of taxpayers) receiving money directly from property.
Finally, we have HMRC data also on the split between state (unfunded) and private (funded) pensions. Private pensions
amount in aggregate to £80bn, about double the payments of state pensions. We will argue in Section 2.3.4 that private
pensions are to a significant extent funded from the income generated by CRE. There are over 7 million UK citizens with
private pensions whose retirement income is thus directly linked to the fortunes of the CRE sector.
Table 7: UK income and tax, 2012-13 (most recent data)
Category No. of individuals (‘000) Mean (£) Median* (£) Amount (£ million)
Self employment income 3,490 21,000 10,600 73,400
Employment income 23,400 27,200 26,600 638,000
Pensions 14,400
National Insurance 5,950 7,210 42,900
All other pensions 7,390 10,800 80,000
Property, interest, dividend and other income 26,600 2,650 22 70,300
Property 1,630 8,030 13,100
Interest 24,800 317 7,870
Dividends 4,560 9,940 45,300
Other 1,110 3,780 4,190
Total income 30,600 29,600 28,800 904,000
Total tax 30,600 5,140 5,060 157,000
Source: HMRC – Median values from 2011-2012 tax year

TOSCAFUND BRITAIN’s PROPERTY CREDENTIALS
54 December 2015
2.3 The Asset Value of CRE (CRE as an investment class) We estimate that the value of CRE in modern Britain is just over £1,662bn, which amounts to just under 20% of national
wealth.
2.3.1 The value of Britain's CRE: AcCREdited and AcCREtive
As an investment, Britain's CRE is by its very nature asset backed, and so provides a welcome degree of security. Capital
values have on occasion fallen broadly, most notably in 2008/9, however over time capital growth has been the norm and
impressive advances in total return all the more so. CRE is also income generating. Whilst its income varies with its rate of
occupancy, it also moves in line with the level of rent, whose flexibility is in stark contrast to the intractability of the
coupon paid on fixed income 'paper'.
Whilst CRE is often viewed in the collective, we must stress that as an asset class it covers an assortment of business
models and occupier types, from retail and leisure across to industrial and business and financial services. Each of these
sectors assets can be reduced still further and so too the real estate which is an essential element of their activity.
Some CRE is entirely reliant on economic events unfolding within the UK, whilst other real estate faces entirely outwards,
involving in making goods for export or selling services overseas, and whereas certain real estate assets may cater for
traditional needs, say food processing and other food services, other elements may serve entirely new markets, for
instance renewable energy. Tenancy agreements for their part provide as much for security of tenure for the occupier as
security of income for the landlord. Elements of Britain's CRE can also boast the added security of the public sector as a
cornerstone tenant.
There can be said to be an essential symbiosis between Britain's CRE and the economy. As one demands a particular form
of property, the other provides it and as innovative real estate is delivered, so Britain's economic base broadens, a
diversification which can only be for the good.
To conclude, Britain's CRE can boast an asset quality and provenance and security of ownership and in turn tenancy
contracts as best in class. Its CRE is in addition valued in the world's third most saved currency. It is, in short, a sterling
asset class.
2.3.2 The Asset Value of CRE
The value of CRE is largely determined by the income it can generate. The person buying an asset acquires the right to
the income stream (in terms of financial revenue or direct services) it produces. In the case of real estate, this income
stream can be expected to continue for many years into the future and so the asset value can be expected to be a
substantial multiple of the current rent.
But how big is this multiple? In financial theory, the value of an asset is the discounted present value of the net income
stream that the asset generates, and hence depends on the current and future income stream, the life of the asset, and
the risk adjusted interest rate. Since different classes of property differ in terms of their useful life and their riskiness, the
relationship between asset value and current rental income - the rental yield - will not be the same for all properties but
vary between them. Similarly the rental yield will not be the same as e.g. the interest on deposits (which have less risk but
have static rather than growing income potential).
We have looked at the data on rental yields for the various types of property that we have classified as CRE. With regard
to non-domestic properties, the most extensive data has been collected by the IPD. It may be noted that the rental yield
on offices and retail is lower than on industrial assets, reflecting both the greater potential for growth in values for offices
etc due to their being in prime sites, and the lower the risks of obsolescence due to their greater flexibility. On the basis of
the data in Table 8, we estimate the asset value of non-domestic CRE in the UK in 2014 to be £824bn.

TOSCAFUND BRITAIN’s PROPERTY CREDENTIALS
55 December 2015
Table 8: UK Capital Value of “Non-Domestic” Commercial Real Estate, by type (and accounting for voids)
(£bn) 2005 2009 2010 2011 2012 2013 2014
Retail 320 241 274 280 271 281 311
Office 163 132 152 158 153 166 202
Industrial 158 108 112 113 109 116 140
Infrastructure 105 83 88 89 87 88 97
Other 58 58 62 64 65 66 74
Capital Value of UK Commercial Real Estate (£bn) 805 623 687 705 685 717 824
Source: VOA, Scottish Assessors, IPD, IPF (Yield data kindly provided by IPF Research Programme in their latest Size and Structure of the UK Property Market, End-2014), Toscafund
Chart 21: Implied UK capital Value of CRE, by type
Source: Valuation Office Agency, Scottish Assessors, IPD, Toscafund
With regard to the private rental sector data on rental yields was drawn from LSL property yields and is given in Table 9.
Table 9 – Imputed capital value of UK private rented sector
2005 2008 2009 2010 2011 2012 2013 2014
England & Wales
Annual Rental Income (£bn) 18.2 25.6 27.2 29.6 32.4 34.3 37.5 38.8
England and Wales (yields %) 4.4 4.61 5.01 4.87 5.18 5.31 5.36 5.10
Capital value of
English & Welsh private rented sector (£bn) 413.9 556.1 543.0 608.0 626.1 645.8 699.5 761.0
Scotland
Annual Rental Income (£bn) 1.05 1.34 1.46 1.59 1.79 2.05 2.22 2.32
Scotland (yields %) 3.41 3.57 3.88 3.77 4.01 4.03 4.13 4.06
Capital value of
Scottish private rented sector (£bn) 30.8 37.7 37.5 42.2 44.6 50.8 53.8 57.1
Northern Irish capital value based on GVA 10.6 14.2 13.8 15.2 15.5 15.9 16.9 19.1
Imputed capital value of UK PRS (£bn) 455 608 594 665 686 712 770 837
Source: LSL Property Services, Toscafund
On the basis of this data, we estimate the asset value of domestic CRE in the UK in 2013 to be £770bn. Adding to the
above figure for business CRE yields an estimated total of £1,487bn in 2013.
0
100
200
300
400
500
600
700
800
900
2005 2009 2010 2011 2012 2013 2014
£ b
illi
on
s
Retail Office Industrial Infrastructure Other

TOSCAFUND BRITAIN’s PROPERTY CREDENTIALS
56 December 2015
2.3.3 CRE as a proportion of national wealth
The Office of National Statistics (ONS) publishes a measure of national wealth (or now ‘worth’) which is the value of all
assets at current market prices. This measure is published annually in the Blue Book. At the end of 2013, according to the
Blue Book, national wealth consisted of £8.52tn non-financial assets together with £29.54tn of financial assets. However,
with every financial asset comes a financial liability, so that net national wealth comprises only non-financial assets and is
£8.06tn.
Table 10: UK National Balance Sheet Total value at end-2014 (£bn)
Non-financial assets
Produced assets
Fixed assets 8231.4
Tangible fixed assets 80348
Dwellings 5061.8
Other buildings and structures 1897.4
Non-residential buildings 950.2
Other structures 947.2
Machinery and equipment 849.6
Transport equipment 186.8
ICT equipment 36.2
Other machinery, equip. & systems 626.6
Cultivated biological resources 226.0
Intellectual property products 196.6
Inventories 283.7
Total produced assets 8515.1
Total non-produced assets 2.5
Total financial assets/liabilities -454.1
Total net worth 8063.5
Source: ONS (Blue book), Toscafund
The Blue Book table (above) shows the breakdown of different types of non-financial assets. The largest single category is
dwellings valued at £6.06tn, or 62.8% of the total. Non-residential buildings, which might be thought to correspond fairly
closely to commercial real estate, are valued at £0.95tn or 11.8% of the total. The ONS classifications do not correspond at
all closely with our definition of CRE, in that ‘commercial buildings’ include some dwellings and other structures while
non-residential buildings include those in the public sector or in other non-commercial uses.
In section 2.3.2, we estimated the value of Britain’s CRE at £1.6tn. This constitutes 20% of net national wealth. The main
reason why our estimate of CRE is higher than some others is that it includes private rented housing. The significance of
this is illustrated in Figure 8, which is a Venn diagram showing the growth and overlap in current asset value between
commercial real estate and dwellings.
If we leave aside dwellings, we can derive a figure for the proportion of non-housing wealth accounted for by non-
domestic CRE. We have estimated non-domestic CRE at around £0.82tn, as against £2.97tn of total national wealth other
than housing. So, leaving aside housing, CRE constitutes 28% of national wealth.

TOSCAFUND BRITAIN’s PROPERTY CREDENTIALS
57 December 2015
Figure 8: Britain’s real estate universe (£ billions)
Source: Blue Book, Toscafund
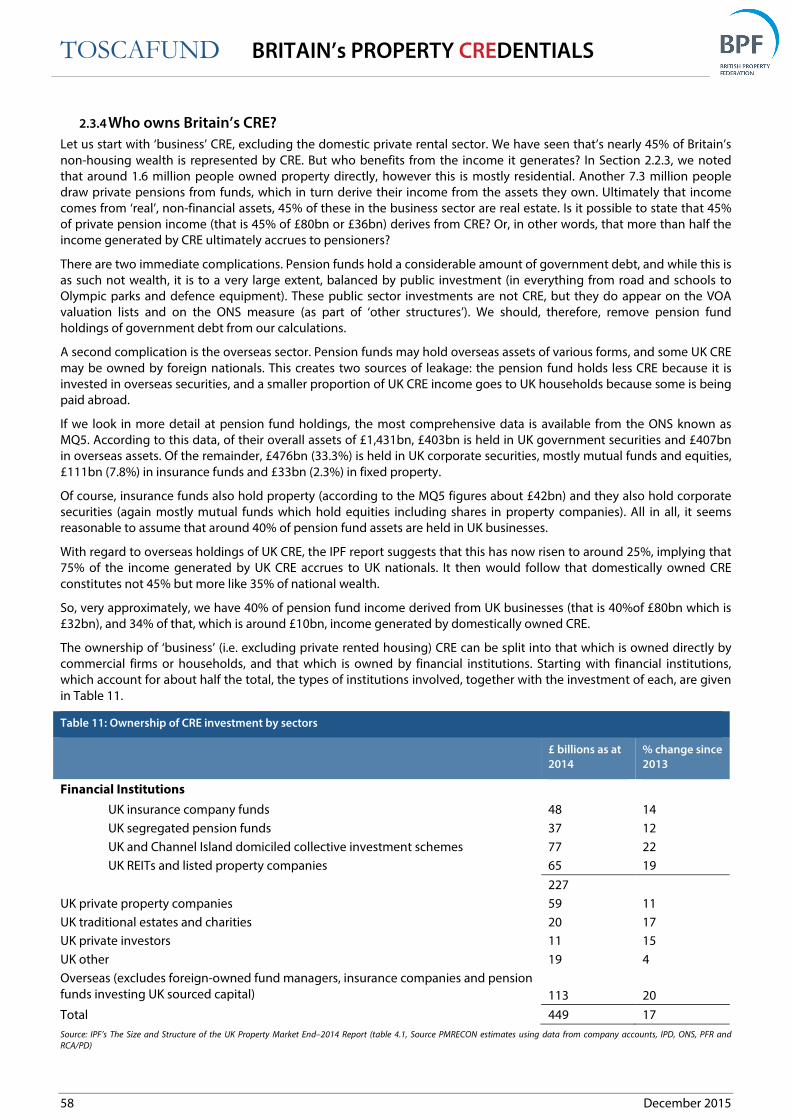
TOSCAFUND BRITAIN’s PROPERTY CREDENTIALS
58 December 2015
2.3.4 Who owns Britain’s CRE?
Let us start with ‘business’ CRE, excluding the domestic private rental sector. We have seen that’s nearly 45% of Britain’s
non-housing wealth is represented by CRE. But who benefits from the income it generates? In Section 2.2.3, we noted
that around 1.6 million people owned property directly, however this is mostly residential. Another 7.3 million people
draw private pensions from funds, which in turn derive their income from the assets they own. Ultimately that income
comes from ‘real’, non-financial assets, 45% of these in the business sector are real estate. Is it possible to state that 45%
of private pension income (that is 45% of £80bn or £36bn) derives from CRE? Or, in other words, that more than half the
income generated by CRE ultimately accrues to pensioners?
There are two immediate complications. Pension funds hold a considerable amount of government debt, and while this is
as such not wealth, it is to a very large extent, balanced by public investment (in everything from road and schools to
Olympic parks and defence equipment). These public sector investments are not CRE, but they do appear on the VOA
valuation lists and on the ONS measure (as part of ‘other structures’). We should, therefore, remove pension fund
holdings of government debt from our calculations.
A second complication is the overseas sector. Pension funds may hold overseas assets of various forms, and some UK CRE
may be owned by foreign nationals. This creates two sources of leakage: the pension fund holds less CRE because it is
invested in overseas securities, and a smaller proportion of UK CRE income goes to UK households because some is being
paid abroad.
If we look in more detail at pension fund holdings, the most comprehensive data is available from the ONS known as
MQ5. According to this data, of their overall assets of £1,431bn, £403bn is held in UK government securities and £407bn
in overseas assets. Of the remainder, £476bn (33.3%) is held in UK corporate securities, mostly mutual funds and equities,
£111bn (7.8%) in insurance funds and £33bn (2.3%) in fixed property.
Of course, insurance funds also hold property (according to the MQ5 figures about £42bn) and they also hold corporate
securities (again mostly mutual funds which hold equities including shares in property companies). All in all, it seems
reasonable to assume that around 40% of pension fund assets are held in UK businesses.
With regard to overseas holdings of UK CRE, the IPF report suggests that this has now risen to around 25%, implying that
75% of the income generated by UK CRE accrues to UK nationals. It then would follow that domestically owned CRE
constitutes not 45% but more like 35% of national wealth.
So, very approximately, we have 40% of pension fund income derived from UK businesses (that is 40%of £80bn which is
£32bn), and 34% of that, which is around £10bn, income generated by domestically owned CRE.
The ownership of ‘business’ (i.e. excluding private rented housing) CRE can be split into that which is owned directly by
commercial firms or households, and that which is owned by financial institutions. Starting with financial institutions,
which account for about half the total, the types of institutions involved, together with the investment of each, are given
in Table 11.
Table 11: Ownership of CRE investment by sectors
£ billions as at
2014
% change since
2013
Financial Institutions
UK insurance company funds 48 14
UK segregated pension funds 37 12
UK and Channel Island domiciled collective investment schemes 77 22
UK REITs and listed property companies 65 19
227
UK private property companies 59 11
UK traditional estates and charities 20 17
UK private investors 11 15
UK other 19 4
Overseas (excludes foreign-owned fund managers, insurance companies and pension
funds investing UK sourced capital) 113
20
Total 449 17
Source: IPF’s The Size and Structure of the UK Property Market End–2014 Report (table 4.1, Source PMRECON estimates using data from company accounts, IPD, ONS, PFR and
RCA/PD)
TOSCAFUND BRITAIN’s PROPERTY CREDENTIALS
59 December 2015
2.3.5 Ownership – the significance of foreign capital
Many high profile developments in recent years have been financed by foreign capital. The most notable developments
include the Shard by Qatar or the London Gateway by the UAE. We give many more examples in Part 1. Such foreign
investment could be viewed negatively by a community in which the properties have central importance as they may
believe that they should belong to the community or at least to its fellow citizens.
What are the facts? As noted in the table above, 25% of institutionally owned CRE was owned by foreign institutions in
2014, and more significantly this share has doubled in the last 10 years. Despite the number of foreign-owned, high-
profile developments, we should stress that overall British CRE remains predominantly owned from within.
There is little or nothing inherently unwelcome in Britain's CRE being owned by those overseas. Capital is mobile across
frontiers and it seeks the best return in terms of its owners’ objectives, their time horizon and attitudes to risk. Moreover,
for its part, British capital has made its way extensively into foreign assets. The fact that our property attracts interest can
be considered something of an international endorsement of Britain's economic present and future. However, while we
would not for one moment wish to argue for barriers to capital mobility, the phenomenon of foreign ownership does
raise concerns in some quarters, and we may first ask why it is growing.
Typically, capital is invested locally: the ‘home country bias’ has puzzled finance theorists who point to the benefits of
diversification, but it is generally explained in terms of local knowledge in terms both of production possibilities and of
the market. These factors might seem particularly important in relation to property, which is by its nature ‘local’. So why
have so many major CRE investments been financed externally?
One possible explanation the availability of external funds has increased enormously over the past 10 years, initially
under the influence of rapid economic growth led by China and an associated boom in raw material and most
importantly oil prices, leading in particular to the emergence of sovereign wealth funds, often with different investment
objectives from more traditional financial institutions. So part of the answer is that foreign investors have ‘crowded out’
domestic investors, by bidding more for available sites and investment opportunities, or providing more extensive
amenities. Major foreign investors often have two key characteristics; – they can bring a lot of money to support a project
and they have long-term investment horizons. Both of these are very important in relation to property development: one
way of accommodating the agglomeration and co-ordination externalities associated with property development is
through their internalisation in large-scale developments. In many cases, property assets are designed and built to stand
the test of time, so an investor must be prepared to have his money tied up over a long period of time. Clearly, sovereign
wealth funds are ideally placed to make such investments and are one major source of such funds.
It is only natural that the allocations or weightings across asset classes will vary over time reflecting cyclical factors. The
question is whether the amount of domestic capital flowing into developing British CRE assets is below the rate needed
to meet Britain’s growth ambitions. Should we be content that foreign capital is crowding-in, and less worried that it
might be crowding-out domestic funds? This said, recent signs have been promising, with evidence showing that British
investors are rotating capital back into its CRE assets. There is every chance that in absolute terms domestic and
international ownership of Britain's expanding CRE base will increase in tandem, and will increase via joint ventures in
developing commercial and indeed residential real estate.
Another possible (and related) explanation is that the elevation of short term ‘shareholder value’ as the guiding principle
of commercial governance in the UK (taking its lead from the US) has encouraged firms to stabilize their share price rather
than to take risks and to devote resources to financial engineering rather than to real investment. This may have created
barriers to raising domestic finance for major property developments and hence the availability of external funds has
allowed good investments to go ahead often linked to domestic investments. Thus there may have been crowding in
rather than crowding out as domestic investors feel less able to take long-term risks than their overseas peers.
Whilst UK residents enjoy the use of these investments, working in them or living nearby, often they will not enjoy the
income they generate. Those who provide external finance will obviously expect a return on their investment, which may
take the form of rents on properties and any residual surplus. However well managed, these foreign owned
developments will need to make a return for their owners, and cannot contribute to local incomes to the same extent as
those indigenously owned.
A further concern arises if foreign ownership is accompanied by foreign debt. Not only does this introduces a currency
mismatch between property assets across Britain and the liabilities secured against them, but cheap debt may be “carried
into” Britain to fund asset purchases. Even in our inter-connected global economy, this debt transfer is something that
must be viewed with a little concern. In fact, the experiences post 2008 suggest how destabilising to Britain's economy
this kind of funding mismatch could prove as exchange rates moved sharply "the wrong way" such that sterling
denominated assets such as UK CRE lost value from an overseas perspective. The result was that otherwise perfectly well-
functioning property assets, such as prime London hotels, found themselves characterised as distressed. Whilst the
pound's move downwards in 2008 may have been welcomed by exporters and others for whom it provided a
competitive boost, it was hardly viewed favourably so by those who’s funding of British property asset purchases were in
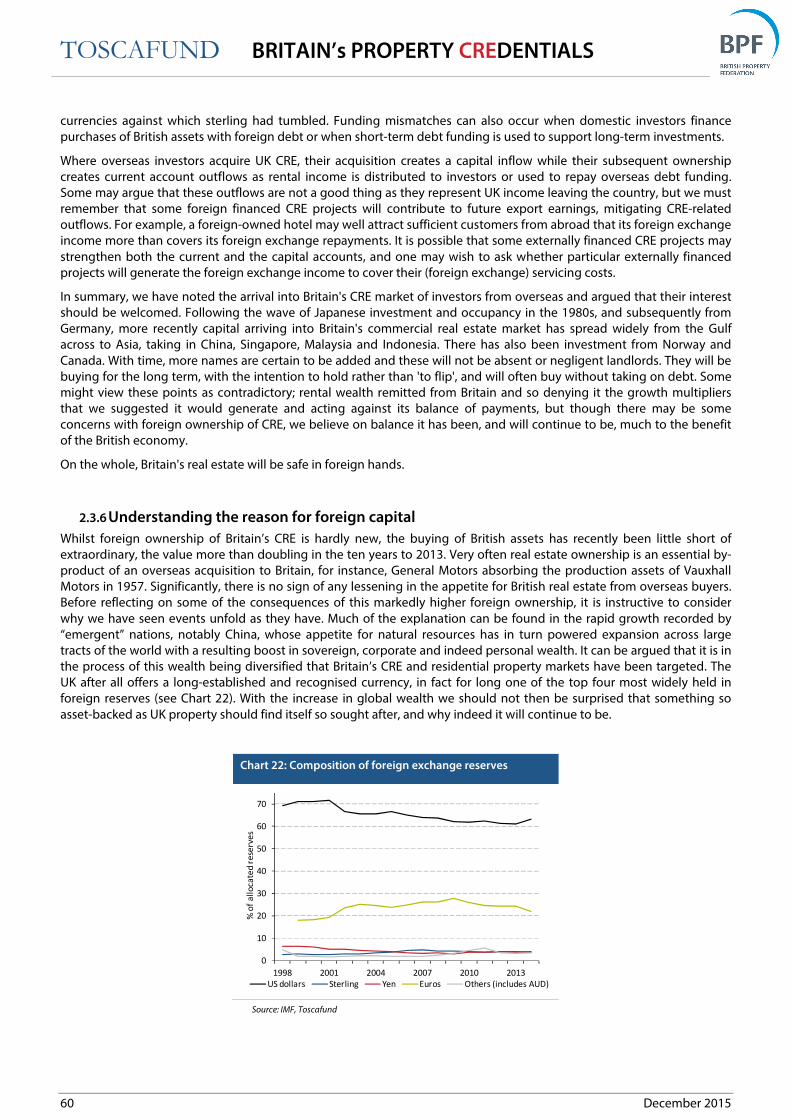
TOSCAFUND BRITAIN’s PROPERTY CREDENTIALS
60 December 2015
currencies against which sterling had tumbled. Funding mismatches can also occur when domestic investors finance
purchases of British assets with foreign debt or when short-term debt funding is used to support long-term investments.
Where overseas investors acquire UK CRE, their acquisition creates a capital inflow while their subsequent ownership
creates current account outflows as rental income is distributed to investors or used to repay overseas debt funding.
Some may argue that these outflows are not a good thing as they represent UK income leaving the country, but we must
remember that some foreign financed CRE projects will contribute to future export earnings, mitigating CRE-related
outflows. For example, a foreign-owned hotel may well attract sufficient customers from abroad that its foreign exchange
income more than covers its foreign exchange repayments. It is possible that some externally financed CRE projects may
strengthen both the current and the capital accounts, and one may wish to ask whether particular externally financed
projects will generate the foreign exchange income to cover their (foreign exchange) servicing costs.
In summary, we have noted the arrival into Britain's CRE market of investors from overseas and argued that their interest
should be welcomed. Following the wave of Japanese investment and occupancy in the 1980s, and subsequently from
Germany, more recently capital arriving into Britain's commercial real estate market has spread widely from the Gulf
across to Asia, taking in China, Singapore, Malaysia and Indonesia. There has also been investment from Norway and
Canada. With time, more names are certain to be added and these will not be absent or negligent landlords. They will be
buying for the long term, with the intention to hold rather than 'to flip', and will often buy without taking on debt. Some
might view these points as contradictory; rental wealth remitted from Britain and so denying it the growth multipliers
that we suggested it would generate and acting against its balance of payments, but though there may be some
concerns with foreign ownership of CRE, we believe on balance it has been, and will continue to be, much to the benefit
of the British economy.
On the whole, Britain's real estate will be safe in foreign hands.
2.3.6 Understanding the reason for foreign capital
Whilst foreign ownership of Britain’s CRE is hardly new, the buying of British assets has recently been little short of
extraordinary, the value more than doubling in the ten years to 2013. Very often real estate ownership is an essential by-
product of an overseas acquisition to Britain, for instance, General Motors absorbing the production assets of Vauxhall
Motors in 1957. Significantly, there is no sign of any lessening in the appetite for British real estate from overseas buyers.
Before reflecting on some of the consequences of this markedly higher foreign ownership, it is instructive to consider
why we have seen events unfold as they have. Much of the explanation can be found in the rapid growth recorded by
“emergent” nations, notably China, whose appetite for natural resources has in turn powered expansion across large
tracts of the world with a resulting boost in sovereign, corporate and indeed personal wealth. It can be argued that it is in
the process of this wealth being diversified that Britain’s CRE and residential property markets have been targeted. The
UK after all offers a long-established and recognised currency, in fact for long one of the top four most widely held in
foreign reserves (see Chart 22). With the increase in global wealth we should not then be surprised that something so
asset-backed as UK property should find itself so sought after, and why indeed it will continue to be.
Chart 22: Composition of foreign exchange reserves
Source: IMF, Toscafund
0
10
20
30
40
50
60
70
1998 2001 2004 2007 2010 2013
% o
f a
llo
ca
ted
re
serv
es
US dollars Sterling Yen Euros Others (includes AUD)

TOSCAFUND BRITAIN’s PROPERTY CREDENTIALS
61 December 2015
To repeat, the recent surge in foreign buying of British real estate has, it could be argued, been far less about acquiring
the corporate entities occupying the premises, as simply the premises themselves. The same applies to development
activity funded from overseas, as for instance, when Ford invested in the development of its sizeable plant in Dagenham
which opened in 1931 covering 475 acres. This is not to claim that buying as an owner and occupier is not occurring, just
that these instances are becoming rarer. Nor too is it to claim that overseas owners will not someday become owner-
occupiers; just that they have not taken up both roles in the first instance.
Aside from the obvious competition to existing - and indeed prospective - UK landlords, the arrival of overseas landlords
across Britain’s CRE market has had an unquestionable impact. As already noted, a great deal of overseas ownership can
be explained by a desire to diversify wealth. The result is that income generation is often relegated to a secondary desire.
The growing overseas ownership of British CRE can lead to situations where an asset is valued in one currency but the
debt secured against the asset is valued in a different currency. There are a number of consequences of such ‘currency
mismatch’ situations. Most notably, a sharp unanticipated movement in exchange rates could quite easily trigger
covenant breaches and the forced selling of property in no way distressed in the conventional sense. However, it is quite
typical for investors to engage in foreign exchange hedging strategies in order to mitigate these risks.
The reality is that the sharp increase in the overseas ownership of Britain’s CRE has not only internationalised ownership,
but opened entirely new, and widened existing, transmission channels. We have to accept that monetary shocks
elsewhere will increasingly have a very direct bearing within Britain, even on real estate occupied by business sectors
insulated from macro-economic events overseas. To address,, statutory restriction on foreign ownership is not required,
but instead a greater understanding of monetary mismatches – in relation to funding and accounting currencies - and an
insistence that these are hedged or mitigated against as much as possible.

TOSCAFUND BRITAIN’s PROPERTY CREDENTIALS
62 December 2015
2.4 Employment
2.4.1 A CREator of jobs
We have emphasised how CRE is a crucial production factor within the British economy, providing an irreplaceable input
across almost every business sector. However, the process of creating CRE is an industry in itself, as is its operation,
management and maintenance. Let us first focus on construction.
Over the course of the last decade, construction has on average directly employed 2.1m workers across Britain - currently
just over 2m (of which 1.1m are private contractors), some are active beyond CRE in building infrastructure. In addition,
there are a number of workers involved along mutually dependent supply chains, in secondary and tertiary sectors;
notably the extraction, production and distribution of materials and in plant hire. There will also be some who benefit
from being in proximity to the activity generated by a 'building site" and all other positive economic multiplier effects
(although there will no doubt be adverse aspects from the unavoidable disruption).
Whilst construction draws upon a range of non-manual professions - developers, architects, surveyors, etc - and a
multitude of highly skilled manual crafts, it also provides large scale employment for young people whose skills are
limited, and whose employment opportunities are as a consequence restricted; evidenced by the stubbornly above
average unemployment rate. Whilst labouring may be physically strenuous, average earnings are known to be above
manual work performed in the hotel and catering sectors (see Chart 23).
Chart 23: Average weekly earnings (Construction vs
Retail wholesale, Hotels and Catering) Chart 24: Average weekly earnings for industries compared
Source: ONS.
Much like construction, property provides work extensively across professional non-manual and skilled manual activities
in its operation, maintenance and management. We would wish to continue to focus here on the largely unskilled areas.
Properties need to be secure, clean well-maintained and a range of employees are needed to achieve these ends.
Chart 25: Jobs (Construction vs real estate activities) Chart 26: Vacancies (Construction vs real estate activities)
Source: ONS.
0
100
200
300
400
500
600
2000 2002 2004 2006 2008 2010 2012 2014 2016
AWE - Construction AWE - Distribution hotels and restaurants
0
100
200
300
400
500
600
2000 2002 2004 2006 2008 2010 2012 2014 2016Agriculture forestry & fishing Construction
Retail trade and repairs Hotels and CateringReal estate activities
0
0.5
1
1.5
2
2.5
2000 2002 2004 2006 2008 2010 2012 2014 2016
Construction jobs of which Private contractors Real estate activities jobs
0
5
10
15
20
25
30
2000 2002 2004 2006 2008 2010 2012 2014 2016
Vacancies in Construction Vacancies in Real Estate Activities

TOSCAFUND BRITAIN’s PROPERTY CREDENTIALS
63 December 2015
While some of the traditional labour needs in the construction and maintenance of property have been overtaken by
technology, from the introduction of security gates to automated window cleaning, CRE assets still require full and part-
time labour to facilitate their operation. Not only is CRE a consumer of technology, but it has, on occasion, been the
trigger for innovation, indirectly driving a range of sectors seemingly unrelated to it, the growth in cloud technology for
instance motivated in no small way by a commercial desire to 'free-up' valuable office space.
The reality is that the construction, operation and maintenance of Britain's property assets opens a range of employment
opportunities across a breadth of skill-sets a number of supply-chains, a spectrum of business sizes and across the entire
country.
Chart 27: Unemployment rates
Source: ONS.
2.4.2 ‘Multiplier’ externalities
It is often claimed that buildings are needed for employment, but there are two sides to this. First, the construction and
maintenance of buildings creates jobs, but labour is a resource and there is a need to deploy it in its most productive use.
As the dismal experience of the centrally planned economies has shown, it is easy enough to create jobs if the pay is
sufficiently low and no one cares about what is produced. Not only the labour, but also the capital equipment used in
construction have value and could contribute to economic output in other ways if they were not employed in
construction. Employing people in construction makes sense only if the value of what they produce is greater than the
cost of employing them.
But how well does this argument hold up if the economy is in recession? Then there is an overall deficiency in the
demand for labour, and the economy is not creating enough jobs for its labour force. In such circumstances, with
widespread unemployment, any form of spending is good as it provides work for the unemployed, whose higher
incomes are spent creating more employment, and there are usually substantial fiscal paybacks from higher tax receipts
and reduced welfare payments. One concern with such ‘counter-cyclical’ policies is that jobs are created and money is
spent on employing more people rather than on consultants’ fees or imported materials. There is also the issue of speed,
recessions are sometimes fairly short-lived, so any intervention must be quick acting if it is to be effective.
During the post-war period, the UK has not used construction as a tool of counter-cyclical policy, not least because, until
the current recession, all downturns in the post-war period had been deliberately created by government to hold down
inflation. The recession following the financial crash of 2008 was different; it was not created by deflationary government
policies induced by rising inflation, and more spending of a traditional Keynesian type might well have alleviated its
consequences (it could be argued that the United States emerged more quickly from recession than European countries
because it avoided fiscal cutbacks despite its enormous budget deficit). However, this recession has now drawn to a
close, in the UK as well as in the US, and should not be assumed to provide the backdrop to economic policy for the
foreseeable future.
As technology advances more people are working in professional, managerial, administrative and other skilled positions
while fewer are engaged in unskilled manual jobs. As the labour market increasingly rewards skills, prospects for the
unskilled can deteriorate. The construction sector – fuelled by demand for CRE – can provide jobs for less qualified
people. Some employment data is given in Chart 28.
0
5
10
15
20
25
2000 2002 2004 2006 2008 2010 2012 2014 2016
Aged 16 and over Aged 18-24 Aged 25-49
TOSCAFUND BRITAIN’s PROPERTY
64
Chart 28: Sectoral employment in the UK since 1982
Source: ONS.
Buildings contribute to employment not only when they are being built, but also in use. Workers need somewhere to
work, and not much can be done without buildings to work in. Capital
electricity are all necessary for commercial enterprises to be viable. Without any of these, production would collapse but
they cannot all claim credit for all that is produced as it is the marginal, rather than the
factor’s contribution.
Nonetheless, better premises enhance worker productivity and this constitutes a ‘pecuniary’ externality. Workers benefit
from better capital because they get paid more.
Finally, CRE contributes to the rest of the economy through taxation. Of course, (nearly) everyone and (nearly) every
business pays taxes, the question is whether CRE is more heavily burdened than other sectors. If the answer to that is yes,
then investment in CRE is liable to more taxat
represents a unique contribution to the rest of the economy.
Though business rates are a tax deductible expense in determining corporation tax (or income tax for unincorporated
enterprises) the overall tax burden on CRE none the less remains higher. For example, in 2009/10, receipts from business
rates amounted to £22.9bn as against corporation tax receipts of £35.8bn (there are more up
may be noted that businesses can reduce their corporation tax payments by various mechanisms such as locating their
head offices in low tax jurisdictions. For the service sector, business must be located near the customers, so whilst
Starbucks may not be paying much in corp
owned companies operating in the UK are liable for business rates
2.4.3 The employment value Britain's CRE construction
Were we to consider the numbers employed across Britain's constru
improvement across residential and the various non
and 2013 this amounted to 2.1 million, or 6.8% of the labour force.
BRITAIN’s PROPERTY CREDENTIALS
: Sectoral employment in the UK since 1982
Buildings contribute to employment not only when they are being built, but also in use. Workers need somewhere to
work, and not much can be done without buildings to work in. Capital equipment, roads and vehicles, water and
electricity are all necessary for commercial enterprises to be viable. Without any of these, production would collapse but
they cannot all claim credit for all that is produced as it is the marginal, rather than the total product, that measures a
Nonetheless, better premises enhance worker productivity and this constitutes a ‘pecuniary’ externality. Workers benefit
from better capital because they get paid more.
rest of the economy through taxation. Of course, (nearly) everyone and (nearly) every
business pays taxes, the question is whether CRE is more heavily burdened than other sectors. If the answer to that is yes,
then investment in CRE is liable to more taxation than equivalent investment in other forms of capital and that excess
represents a unique contribution to the rest of the economy.
Though business rates are a tax deductible expense in determining corporation tax (or income tax for unincorporated
rises) the overall tax burden on CRE none the less remains higher. For example, in 2009/10, receipts from business
rates amounted to £22.9bn as against corporation tax receipts of £35.8bn (there are more up
businesses can reduce their corporation tax payments by various mechanisms such as locating their
head offices in low tax jurisdictions. For the service sector, business must be located near the customers, so whilst
Starbucks may not be paying much in corporation tax, they cannot avoid payments of business rates. Likewise foreign
owned companies operating in the UK are liable for business rates.
he employment value Britain's CRE construction
Were we to consider the numbers employed across Britain's construction markets (new build, maintenance and
improvement across residential and the various non-residential sectors) we would record that, on average, between 2002
and 2013 this amounted to 2.1 million, or 6.8% of the labour force.
DENTIALS
December 2015
Buildings contribute to employment not only when they are being built, but also in use. Workers need somewhere to
equipment, roads and vehicles, water and
electricity are all necessary for commercial enterprises to be viable. Without any of these, production would collapse but
total product, that measures a
Nonetheless, better premises enhance worker productivity and this constitutes a ‘pecuniary’ externality. Workers benefit
rest of the economy through taxation. Of course, (nearly) everyone and (nearly) every
business pays taxes, the question is whether CRE is more heavily burdened than other sectors. If the answer to that is yes,
ion than equivalent investment in other forms of capital and that excess
Though business rates are a tax deductible expense in determining corporation tax (or income tax for unincorporated
rises) the overall tax burden on CRE none the less remains higher. For example, in 2009/10, receipts from business
rates amounted to £22.9bn as against corporation tax receipts of £35.8bn (there are more up-to-date figures available). It
businesses can reduce their corporation tax payments by various mechanisms such as locating their
head offices in low tax jurisdictions. For the service sector, business must be located near the customers, so whilst
oration tax, they cannot avoid payments of business rates. Likewise foreign
ction markets (new build, maintenance and
residential sectors) we would record that, on average, between 2002

TOSCAFUND BRITAIN’s PROPERTY
65
Chart 29: Number of people employed in construction
Source: ONS.
There is marked oscillation, reflecting Britain's unwelcome violent construction cycle. The reality is that such metrics beli
the value in providing work for a particular cohort of the
clearance, excavation and construction, there is a need for general labourers across to security staff for whom building
sites offer valuable albeit sometimes casual and itinerant work. Then th
needed, from plasterers, crane operators and site managers, to surveyors and architects.
If one clear macro policy objective emerges, it is to make every effort to create a backdrop for sustained activity, on
where monetary policy combines effectively with fiscal policy to shave the edges off of Britain's construction cycle. A
more accommodating approach to planning would help with this by allowing the supply
BRITAIN’s PROPERTY CREDENTIALS
: Number of people employed in construction
There is marked oscillation, reflecting Britain's unwelcome violent construction cycle. The reality is that such metrics beli
the value in providing work for a particular cohort of the labour force, specifically largely unskilled people. From land
clearance, excavation and construction, there is a need for general labourers across to security staff for whom building
sites offer valuable albeit sometimes casual and itinerant work. Then there is the skilled manual and non
needed, from plasterers, crane operators and site managers, to surveyors and architects.
If one clear macro policy objective emerges, it is to make every effort to create a backdrop for sustained activity, on
where monetary policy combines effectively with fiscal policy to shave the edges off of Britain's construction cycle. A
more accommodating approach to planning would help with this by allowing the supply-side to deliver
DENTIALS
December 2015
There is marked oscillation, reflecting Britain's unwelcome violent construction cycle. The reality is that such metrics belie
labour force, specifically largely unskilled people. From land
clearance, excavation and construction, there is a need for general labourers across to security staff for whom building
ere is the skilled manual and non-manual labour
If one clear macro policy objective emerges, it is to make every effort to create a backdrop for sustained activity, one
where monetary policy combines effectively with fiscal policy to shave the edges off of Britain's construction cycle. A
side to deliver.
TOSCAFUND BRITAIN’s PROPERTY CREDENTIALS
66 December 2015
2.5 CRE and Taxation
2.5.1 The burden of taxation on CRE relative to other factors of production
Taxation represents a shift in the claim on output away from those producing it to the government (or taxation
authority).). The total output of the economy is measured by its GDP, which is also the total value added by firms and the
total of factor incomes received, ultimately, by households. A fundamental principle of taxation is that it should be
‘neutral’, that the burden on different factors or sectors should be the same, as this avoids inefficient arrangements
whose purpose is more to minimise tax than to make the most efficient use of resources.
CRE is an important factor of production. Within the business sector, it is the major component of the capital employed
by firms. Differential rates of taxation on different factors can lead to inefficiencies both in the choice of techniques within
firms and in the pattern of output as consumers switch from more heavily to less heavily taxed products.
Two of the largest taxes by yield in the economy, income tax and VAT, are quite neutral in their impact within the
business sector. Income tax, which generates about 30% of all tax revenue, is levied on all forms of income, from interest
and rents tototo wages and salaries. VAT raises about 15% of total revenue, but the tax base of VAT is the same as the
payment of total factor incomes in firms. While these two taxes are neutral, the next big tax, which is national insurance
which raises about 20% of total revenue, is a tax on employment. There are also a number of taxes on capital, such as
corporation tax, stamp duties, business rates and council tax, which are all taxes on capital and together raise around 20%
of total revenue.
In the business sector, firms pay corporation tax on the total return on their capital (less any financed by borrowing,
interest payments being tax deductible), which amounts to around 8% of tax revenue. Additionally, they pay business
rates on the property they occupy, with a much smaller amount of stamp duty on transactions of (non-residential) land
and property (((around 5% of the total). Overall, the tax paid on property is close on twice as high as the tax paid on other
types of capital employed.
Outside the business sector, the imbalance is much greater. Households hold an enormous proportion of the capital
stock in the form of dwellings, which are taxed through council tax and stamp duty. These add up to about 7% of total
revenue, but there is no taxation on the implicit income produced by owner-occupied property, and owner-occupied
primary residences are also exempt from capital gains tax. So perhaps not surprisingly around 60% of the capital stock
consists of dwellings as against around 25% in the business sector (here excluding buy-to-let). The effective tax rate on
capital held in the form of dwellings is around 0.8%, whereas that employed in business pays around 3.0% on top of the
income and value-added taxes levied on business activity. This difference in effective tax rates is bound to affect
investment decisions and may be resulting in a misallocation of resources across the economy. So gross disparity is
bound to influence investment decisions: it is scarcely surprising that we see an apparently endless boom in housing
while business struggles.
Academics, economists and politicians often discuss the taxation of housing, and whilst it is clear that there are some
flaws in the current system, we are not going to solve those issues in this report. One obvious anomaly is council tax.
When this was introduced in early 1993 to replace the ‘community charge’ (poll tax), the Government clearly wished to
avoid the embarrassment of reintroducing domestic rates just a few years after having abolished them. Council tax is a
tax on dwellings, banded in accordance with capital value, but the bands have been left unchanged since the early 1990s
and there has not been a revaluation since that time (the capital value of a dwelling for council tax is still the assessed
capital value of the house as of 1 April 1991, and new houses are thus valued according to the amount valuers think they
would have been worth in April 1991). Clearly this tax is becoming as remote from market values as were domestic rates
in the years before their abolition: the bands need to be revised and the properties revalued to bring them into line with
market values. For as long as politicians remain averse to revaluations and housing remains tax privileged, it is likely that
households will continue to invest the bulk of their wealth in this form. An unfortunate consequence is that they do not
invest in other assets such as CRE, which in part may explain the lack of political support for the commercial property
sector.
While it might be thought that the efficiency loss caused by higher taxes on business property (as against other forms of
business capital) may be relatively small because there is not that much scope for substitution. After all, in. business CRE
is an essential input: for example a firm cannot substitute inventories for real estate. There are, nonetheless, ill effects of
the heavy taxation of commercial property.
One serious problem is that taxes reduce the incentive to use CRE efficiently. Property may be left empty, or stagnate in
some outdated use because using it more profitably will attract a larger tax bill. This is particularly the case as, in principle,
CRE has become more flexible – a property built for one purpose can, as the economy develops, be adjusted to another.
In summary, we would argue that CRE is taxed more heavily than other forms of wealth or other factors of production. We
suggest that this results in a gross misallocation of savings into residential property rather than productive capital, and
often inefficiencies in the use of CRE. Lastly, there is perhaps some diminution in the representation of CRE in the political
sphere as so few people have significant direct investments in it.
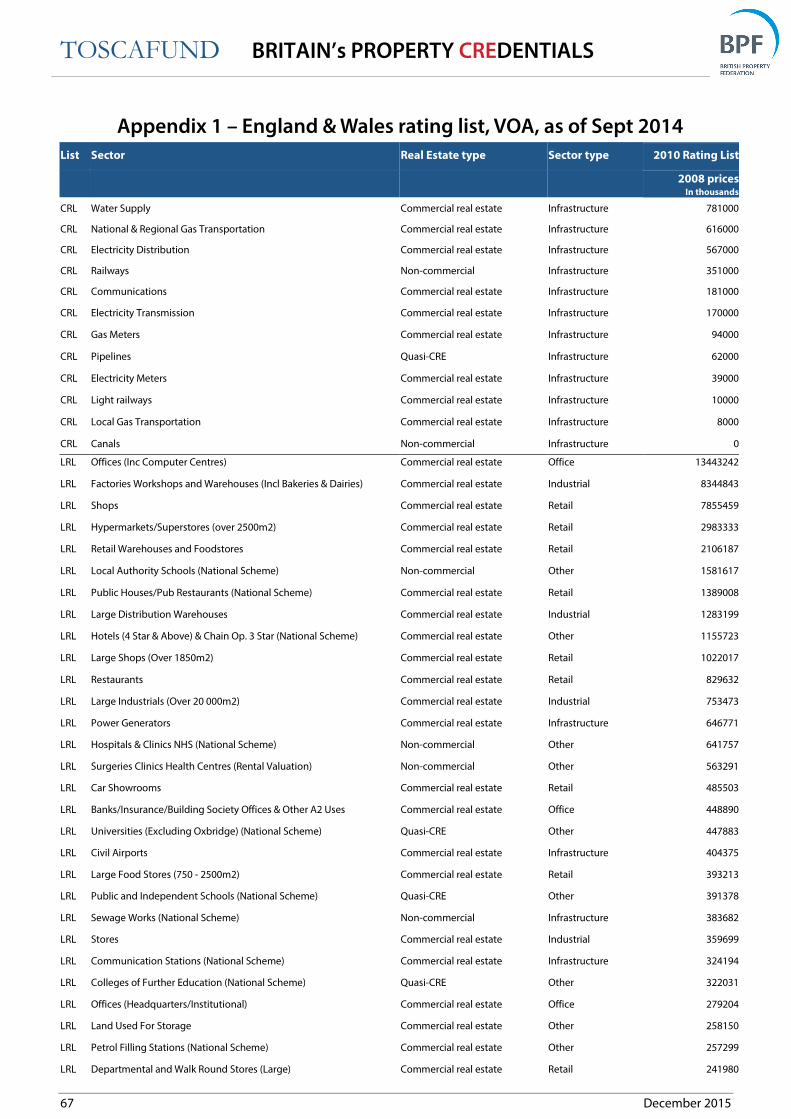
TOSCAFUND BRITAIN’s PROPERTY CREDENTIALS
67 December 2015
Appendix 1 – England & Wales rating list, VOA, as of Sept 2014
List Sector Real Estate type Sector type 2010 Rating List
2008 pricesIn thousands
CRL Water Supply Commercial real estate Infrastructure 781000
CRL National & Regional Gas Transportation Commercial real estate Infrastructure 616000
CRL Electricity Distribution Commercial real estate Infrastructure 567000
CRL Railways Non-commercial Infrastructure 351000
CRL Communications Commercial real estate Infrastructure 181000
CRL Electricity Transmission Commercial real estate Infrastructure 170000
CRL Gas Meters Commercial real estate Infrastructure 94000
CRL Pipelines Quasi-CRE Infrastructure 62000
CRL Electricity Meters Commercial real estate Infrastructure 39000
CRL Light railways Commercial real estate Infrastructure 10000
CRL Local Gas Transportation Commercial real estate Infrastructure 8000
CRL Canals Non-commercial Infrastructure 0
LRL Offices (Inc Computer Centres) Commercial real estate Office 13443242
LRL Factories Workshops and Warehouses (Incl Bakeries & Dairies) Commercial real estate Industrial 8344843
LRL Shops Commercial real estate Retail 7855459
LRL Hypermarkets/Superstores (over 2500m2) Commercial real estate Retail 2983333
LRL Retail Warehouses and Foodstores Commercial real estate Retail 2106187
LRL Local Authority Schools (National Scheme) Non-commercial Other 1581617
LRL Public Houses/Pub Restaurants (National Scheme) Commercial real estate Retail 1389008
LRL Large Distribution Warehouses Commercial real estate Industrial 1283199
LRL Hotels (4 Star & Above) & Chain Op. 3 Star (National Scheme) Commercial real estate Other 1155723
LRL Large Shops (Over 1850m2) Commercial real estate Retail 1022017
LRL Restaurants Commercial real estate Retail 829632
LRL Large Industrials (Over 20 000m2) Commercial real estate Industrial 753473
LRL Power Generators Commercial real estate Infrastructure 646771
LRL Hospitals & Clinics NHS (National Scheme) Non-commercial Other 641757
LRL Surgeries Clinics Health Centres (Rental Valuation) Non-commercial Other 563291
LRL Car Showrooms Commercial real estate Retail 485503
LRL Banks/Insurance/Building Society Offices & Other A2 Uses Commercial real estate Office 448890
LRL Universities (Excluding Oxbridge) (National Scheme) Quasi-CRE Other 447883
LRL Civil Airports Commercial real estate Infrastructure 404375
LRL Large Food Stores (750 - 2500m2) Commercial real estate Retail 393213
LRL Public and Independent Schools (National Scheme) Quasi-CRE Other 391378
LRL Sewage Works (National Scheme) Non-commercial Infrastructure 383682
LRL Stores Commercial real estate Industrial 359699
LRL Communication Stations (National Scheme) Commercial real estate Infrastructure 324194
LRL Colleges of Further Education (National Scheme) Quasi-CRE Other 322031
LRL Offices (Headquarters/Institutional) Commercial real estate Office 279204
LRL Land Used For Storage Commercial real estate Other 258150
LRL Petrol Filling Stations (National Scheme) Commercial real estate Other 257299
LRL Departmental and Walk Round Stores (Large) Commercial real estate Retail 241980

TOSCAFUND BRITAIN’s PROPERTY CREDENTIALS
68 December 2015
List Sector Real Estate type Sector type 2010 Rating List
2008 pricesIn thousands
LRL Car Parks (NCP & Multi-Storey) Commercial real estate Other 219936
LRL Showrooms Commercial real estate Retail 217183
LRL Airport Let Outs Commercial real estate Retail 215419
LRL Car Parks (Surfaced Open) Quasi-CRE Other 206072
LRL Vehicle Repair Workshops & Garages Commercial real estate Retail 201757
LRL Sports & Leisure Centres (LA) (Wet & Dry) (National Scheme) Quasi-CRE Other 193446
LRL Sports & Leisure Centres (Private)(Wet & Dry) Commercial real estate Other 189703
LRL Cafes Commercial real estate Retail 178527
LRL Day Nurseries/Play Schools Quasi-CRE Other 178406
LRL Hotels (3 Star And Under) Commercial real estate Other 176877
LRL Police Stations Non-commercial Other 166764
LRL Telecommunications Cable Networks (National Scheme) Quasi-CRE Infrastructure 159371
LRL Holiday Homes (Self Catering) Commercial real estate Other 146856
LRL Civic and Public Buildings (Local Authority Occupations) Non-commercial Office 144838
LRL Liquid Bulk Storage (Incl Petrol & Oil) (National Scheme) Commercial real estate Industrial 139994
LRL Courts (Contractors Valuation) Non-commercial Other 135968
LRL Caravan Parks (Leisure) (National Scheme) Commercial real estate Other 135211
LRL Museums and Art Galleries (Contractors) Non-commercial Other 128742
LRL Hairdressing/Beauty Salons Commercial real estate Retail 124282
LRL Iron and/or Steel Works Commercial real estate Industrial 122414
LRL Army Hereditaments Non-commercial Excluded 116788
LRL Clubs & Institutions Non-commercial Other 116677
LRL Chemical Works Commercial real estate Industrial 113663
LRL Golf Courses Commercial real estate Other 110120
LRL Libraries Non-commercial Other 109395
LRL Community Day Centres Non-commercial Other 106573
LRL Car Spaces Quasi-CRE Other 106342
LRL Garden Centres Commercial real estate Retail 101150
LRL Cinemas (National Scheme) Commercial real estate Other 100902
LRL MOD Hereditaments Non-commercial Excluded 100130
LRL Oil Refineries Commercial real estate Industrial 96450
LRL Drive-Thru Restaurants Commercial real estate Retail 91863
LRL Laboratories Non-commercial Other 91149
LRL Factory Shops Commercial real estate Retail 90467
LRL Storage Depots Commercial real estate Industrial 89379
LRL Motorway and Major Road Service Areas Commercial real estate Retail 85640
LRL Prison Service Hereditaments Non-commercial Excluded 85428
LRL Motor Vehicle Works Commercial real estate Industrial 84860
LRL Hospitals & Clinics (Private) (National Scheme) Commercial real estate Other 83986
LRL Wholesale Warehouses Commercial real estate Retail 81792
LRL Large Shops (750 - 1850m2) Commercial real estate Retail 80431
LRL Surgeries Clinics Health Centres (Contractors Valuation) Non-commercial Other 79264

TOSCAFUND BRITAIN’s PROPERTY CREDENTIALS
69 December 2015
List Sector Real Estate type Sector type 2010 Rating List
2008 pricesIn thousands
LRL Fire Stations Non-commercial Excluded 79185
LRL Business Units Commercial real estate Office 77448
LRL Cold Stores (Rental Valuation) Commercial real estate Industrial 77282
LRL Night Clubs & Discotheques Commercial real estate Other 74843
LRL Football Stadia Commercial real estate Other 73959
LRL Nuclear Establishments Non-commercial Industrial 73080
LRL Betting Offices Commercial real estate Retail 72382
LRL ATMs Commercial real estate Retail 71444
LRL Advertising Right Commercial real estate Other 67056
LRL Garages (Transport and Commercial) Commercial real estate Other 65623
LRL Sports & Leisure Centres (LA) (Dry Only) (National Scheme) Quasi-CRE Other 64928
LRL Computer Centres (Purpose Built) Commercial real estate Office 64284
LRL Village Halls Scout Huts Cadet Huts Etc Non-commercial Other 64134
LRL Pipelines Quasi-CRE Infrastructure 62000
LRL Drive-In Restaurants Commercial real estate Retail 59924
LRL Exhaust and Tyre Centres Commercial real estate Retail 58203
LRL Statutory Docks and Harbours (Non-Formula Prescribed) Quasi-CRE Infrastructure 57805
LRL Sports & Leisure Centres (Private)(Dry Only) Commercial real estate Other 56037
LRL Waste Transfer Stations Quasi-CRE Industrial 55972
LRL RAF Hereditaments Non-commercial Excluded 55540
LRL Film and TV Studios Commercial real estate Other 55331
LRL Casinos and Gambling Clubs Commercial real estate Other 55285
LRL Holiday Centres Commercial real estate Other 53978
LRL Public Houses/Pub Restaurants (Inc. Lodge) (National Scheme) Commercial real estate Retail 53952
LRL Post Office Sorting Centres Commercial real estate Industrial 49906
LRL Guest & Boarding Houses Commercial real estate Other 47957
LRL Conference & Exhibition Centres Commercial real estate Other 45139
LRL Theatres (National Scheme) Commercial real estate Other 44269
LRL Training Centre (Residential) Quasi-CRE Other 43623
LRL Sales Kiosks Commercial real estate Retail 43619
LRL Showhouses (National Scheme) Commercial real estate Retail 43382
LRL Waste Incinerator Plants Quasi-CRE Industrial 42619
LRL Mineral Producing Hereditament - Putrescible Commercial real estate Industrial 42415
LRL Bingo Halls (National Scheme) Commercial real estate Other 42399
LRL Post Offices Commercial real estate Retail 42315
LRL Gymnasia/Fitness Suites Commercial real estate Other 41497
LRL Navy Hereditaments Non-commercial Excluded 41492
LRL Bowling Alleys Commercial real estate Other 41080
LRL Swimming Pools (Local Authority) Non-commercial Other 40848
LRL Sports Grounds Quasi-CRE Other 40442
LRL Mineral Producing Hereditament - Hardrock Commercial real estate Industrial 38965
LRL Car/Caravan Sales/Display/Hiring Sites Commercial real estate Retail 37313

TOSCAFUND BRITAIN’s PROPERTY CREDENTIALS
70 December 2015
List Sector Real Estate type Sector type 2010 Rating List
2008 pricesIn thousands
LRL Crown Miscellaneous Quasi-CRE Other 37309
LRL Training Centre (Non Residential) Commercial real estate Other 35600
LRL Clubhouses Commercial real estate Other 33110
LRL Tourist Attractions Quasi-CRE Other 33109
LRL Docks and Harbours (Non-Statutory) Quasi-CRE Infrastructure 32876
LRL Industrial Miscellaneous Commercial real estate Industrial 32657
LRL Paper Mills Commercial real estate Industrial 32518
LRL Wine Bars Commercial real estate Retail 31837
LRL Sports Stadia Commercial real estate Other 31735
LRL Computer Centres (Non-Purpose Built) Commercial real estate Office 30361
LRL Markets (Other Than Livestock) Commercial real estate Other 30150
LRL Archives Quasi-CRE Other 30044
LRL Mineral Producing Hereditament - Sand and Gravel Commercial real estate Industrial 29837
LRL Railways & Tramways (Non Leisure) Non-commercial Infrastructure 29300
LRL Amusement Arcades Commercial real estate Other 28815
LRL Commercial Miscellaneous Commercial real estate Other 28770
LRL Waste Recycling Plants Quasi-CRE Infrastructure 28712
LRL Breweries (National Scheme) Commercial real estate Industrial 27144
LRL Courts (Rental Valuation) Quasi-CRE Other 26979
LRL Takeaway Food Outlet (Predominantly Off Premises) Commercial real estate Retail 26666
LRL Aircraft Works With Airfields Commercial real estate Industrial 26027
LRL Pitchs for Stalls Sales or Promotions Quasi-CRE Retail 25976
LRL Concrete Batching Plants Commercial real estate Industrial 25974
LRL Newspaper Printing Works (National Scheme) Commercial real estate Industrial 25398
LRL Ship Building Yards Quasi-CRE Industrial 25160
LRL Bus Garages (Contractors Valuation) Quasi-CRE Other 24789
LRL Crematoria (With & Without Cemeteries) (National Scheme) Quasi-CRE Other 24235
LRL Pharmacies Within/Adjacent to Surgery/Health Centre Quasi-CRE Retail 24015
LRL Concrete Product Works Commercial real estate Industrial 23951
LRL Bus Stations Commercial real estate Other 23898
LRL Lorry Parks Quasi-CRE Other 23717
LRL Riding Schools & Livery Stables (National Scheme) Quasi-CRE Other 23481
LRL Pharmacies Commercial real estate Retail 23357
LRL Veterinary Clinics / Animal Clinics Commercial real estate Other 22696
LRL Oxbridge Colleges Quasi-CRE Other 22203
LRL Leisure Miscellaneous Quasi-CRE Other 21324
LRL Cement Works Commercial real estate Industrial 21300
LRL Car Washes (Stand Alone) Commercial real estate Other 21109
LRL Hostels Commercial real estate Other 20985
LRL Bus Garages (Rental Valuation) Quasi-CRE Other 20656
LRL Theme Parks Commercial real estate Other 19741
LRL Country House Hotels Commercial real estate Other 19719
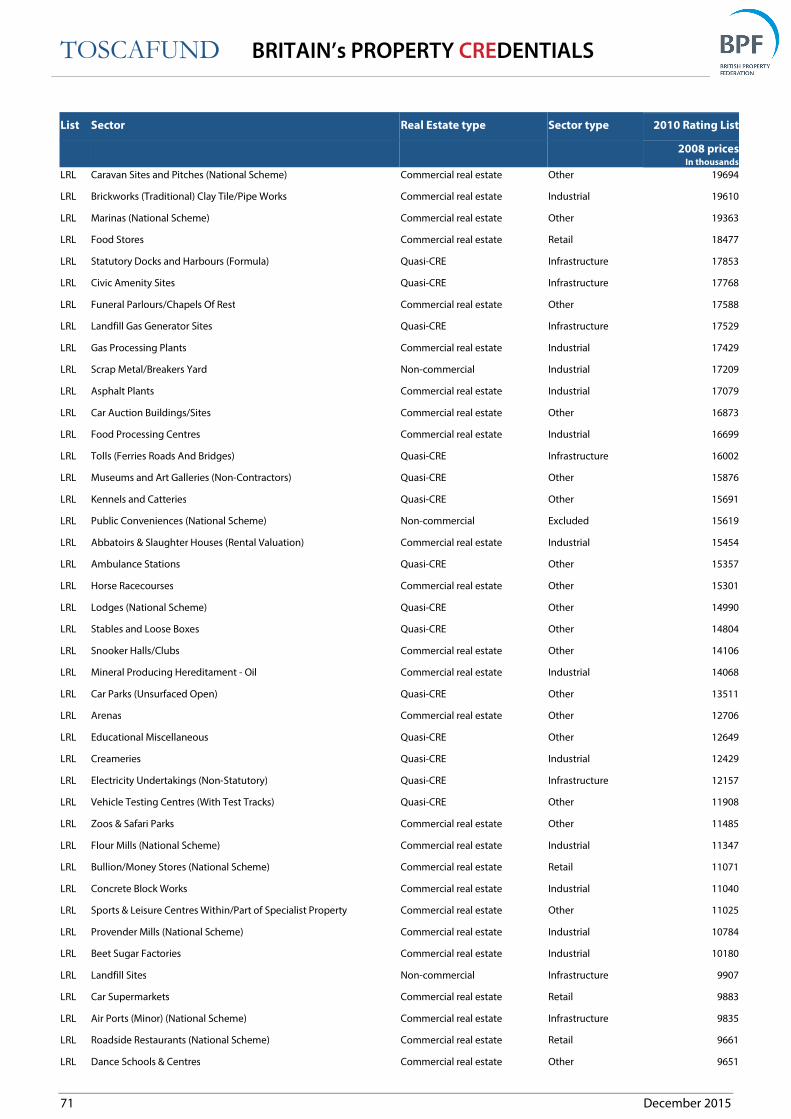
TOSCAFUND BRITAIN’s PROPERTY CREDENTIALS
71 December 2015
List Sector Real Estate type Sector type 2010 Rating List
2008 pricesIn thousands
LRL Caravan Sites and Pitches (National Scheme) Commercial real estate Other 19694
LRL Brickworks (Traditional) Clay Tile/Pipe Works Commercial real estate Industrial 19610
LRL Marinas (National Scheme) Commercial real estate Other 19363
LRL Food Stores Commercial real estate Retail 18477
LRL Statutory Docks and Harbours (Formula) Quasi-CRE Infrastructure 17853
LRL Civic Amenity Sites Quasi-CRE Infrastructure 17768
LRL Funeral Parlours/Chapels Of Rest Commercial real estate Other 17588
LRL Landfill Gas Generator Sites Quasi-CRE Infrastructure 17529
LRL Gas Processing Plants Commercial real estate Industrial 17429
LRL Scrap Metal/Breakers Yard Non-commercial Industrial 17209
LRL Asphalt Plants Commercial real estate Industrial 17079
LRL Car Auction Buildings/Sites Commercial real estate Other 16873
LRL Food Processing Centres Commercial real estate Industrial 16699
LRL Tolls (Ferries Roads And Bridges) Quasi-CRE Infrastructure 16002
LRL Museums and Art Galleries (Non-Contractors) Quasi-CRE Other 15876
LRL Kennels and Catteries Quasi-CRE Other 15691
LRL Public Conveniences (National Scheme) Non-commercial Excluded 15619
LRL Abbatoirs & Slaughter Houses (Rental Valuation) Commercial real estate Industrial 15454
LRL Ambulance Stations Quasi-CRE Other 15357
LRL Horse Racecourses Commercial real estate Other 15301
LRL Lodges (National Scheme) Quasi-CRE Other 14990
LRL Stables and Loose Boxes Quasi-CRE Other 14804
LRL Snooker Halls/Clubs Commercial real estate Other 14106
LRL Mineral Producing Hereditament - Oil Commercial real estate Industrial 14068
LRL Car Parks (Unsurfaced Open) Quasi-CRE Other 13511
LRL Arenas Commercial real estate Other 12706
LRL Educational Miscellaneous Quasi-CRE Other 12649
LRL Creameries Quasi-CRE Industrial 12429
LRL Electricity Undertakings (Non-Statutory) Quasi-CRE Infrastructure 12157
LRL Vehicle Testing Centres (With Test Tracks) Quasi-CRE Other 11908
LRL Zoos & Safari Parks Commercial real estate Other 11485
LRL Flour Mills (National Scheme) Commercial real estate Industrial 11347
LRL Bullion/Money Stores (National Scheme) Commercial real estate Retail 11071
LRL Concrete Block Works Commercial real estate Industrial 11040
LRL Sports & Leisure Centres Within/Part of Specialist Property Commercial real estate Other 11025
LRL Provender Mills (National Scheme) Commercial real estate Industrial 10784
LRL Beet Sugar Factories Commercial real estate Industrial 10180
LRL Landfill Sites Non-commercial Infrastructure 9907
LRL Car Supermarkets Commercial real estate Retail 9883
LRL Air Ports (Minor) (National Scheme) Commercial real estate Infrastructure 9835
LRL Roadside Restaurants (National Scheme) Commercial real estate Retail 9661
LRL Dance Schools & Centres Commercial real estate Other 9651

TOSCAFUND BRITAIN’s PROPERTY CREDENTIALS
72 December 2015
List Sector Real Estate type Sector type 2010 Rating List
2008 pricesIn thousands
LRL Racing Stables (National Scheme) Commercial real estate Other 9579
LRL Field Study Activity and Adventure Centres Quasi-CRE Other 9410
LRL Cemeteries (National Scheme) Quasi-CRE Other 9229
LRL Public Halls Quasi-CRE Other 9170
LRL Auction Rooms Commercial real estate Retail 9151
LRL Police Training Colleges Non-commercial Other 9110
LRL Studios Commercial real estate Other 8952
LRL Cricket Grounds/Pitches (Non-County) Commercial real estate Other 8727
LRL Beach Huts Quasi-CRE Other 8520
LRL Mineral Producing Hereditament - Coal Commercial real estate Industrial 8507
LRL Concert Halls (National Scheme) Commercial real estate Other 8501
LRL Miscellaneous Non-commercial Other 8323
LRL Chalet Parks (National Scheme) Commercial real estate Other 8253
LRL Football Grounds Quasi-CRE Other 7980
LRL Recording Studios Commercial real estate Other 7977
LRL University Occupation Within Hospitals Quasi-CRE Other 7924
LRL Timeshare Complexes (National Scheme) Commercial real estate Other 7883
LRL Motorway Service Area Let Outs Commercial real estate Retail 7881
LRL Air Strips (National Scheme) Commercial real estate Infrastructure 7830
LRL Properties Involving Extraction Of Materials For Profit Commercial real estate Industrial 7730
LRL Minerals Miscellaneous Quasi-CRE Industrial 7647
LRL Motor Racetracks Commercial real estate Other 7562
LRL Farm Shops Commercial real estate Retail 7547
LRL Foundries Commercial real estate Industrial 7528
LRL Maltings - Non Trad Commercial real estate Industrial 7489
LRL Shops Within/Part of Specialist Property Commercial real estate Retail 7141
LRL Livestock Markets (National Scheme) Commercial real estate Other 7103
LRL Rugby Union Grounds Quasi-CRE Other 6911
LRL Conference Centres in Country Houses Commercial real estate Other 6888
LRL Potteries Commercial real estate Industrial 6880
LRL Bowling Centres (Indoor) Commercial real estate Other 6845
LRL Heredits Used For Primary Treatment/Processing Of Minerals Commercial real estate Industrial 6744
LRL Cafes/Restaurants Within/Part of Specialist Property Commercial real estate Retail 6557
LRL Mineral Producing Hereditament - Shale Burnt Commercial real estate Industrial 6525
LRL Boat Yards Quasi-CRE Other 6504
LRL Sea Dredged Aggregate Processing Plants & Depots Non-commercial Industrial 6374
LRL Mechanised Handling Depots Commercial real estate Industrial 6292
LRL Warehouses Within/Part of Specialist Property Commercial real estate Industrial 6265
LRL Coaching Inns Commercial real estate Other 6265
LRL Bowling Greens (Outdoor) Commercial real estate Other 6261
LRL Tennis Courts/Clubs Quasi-CRE Other 6031
LRL Tennis Centres Quasi-CRE Other 5949

TOSCAFUND BRITAIN’s PROPERTY CREDENTIALS
73 December 2015
List Sector Real Estate type Sector type 2010 Rating List
2008 pricesIn thousands
LRL Moorings (Floating Hereditaments) Quasi-CRE Infrastructure 5935
LRL Amusement Parks Commercial real estate Other 5920
LRL Golf Driving Ranges Commercial real estate Other 5889
LRL Contractors Huts & Compounds Commercial real estate Industrial 5721
LRL Food Courts Commercial real estate Other 5657
LRL Royal Palaces Non-commercial Excluded 5654
LRL Health Farms Commercial real estate Other 5529
LRL Stately Homes & Historic Houses (National Scheme) Quasi-CRE Other 5131
LRL Cricket Grounds (County) Commercial real estate Other 5089
LRL Mineral Producing Hereditament - China Clay Commercial real estate Industrial 5071
LRL Statutory Docks and Harbours (Other) Quasi-CRE Infrastructure 4564
LRL Agricultural Showgrounds (National Scheme) Quasi-CRE Other 4445
LRL Lifeboat Stations Non-commercial Other 4388
LRL Wafer Fabrications (National Scheme) Commercial real estate Industrial 4299
LRL Go Kart Rinks Commercial real estate Other 4132
LRL Artificial Fibre Works Commercial real estate Industrial 4090
LRL Stud Farms Quasi-CRE Other 4052
LRL District Heating Undertakings & Networks Quasi-CRE Infrastructure 3943
LRL Religious Retreats/Study Centres (Residential) Quasi-CRE Other 3864
LRL Greyhound Racetracks Commercial real estate Other 3829
LRL Aquaria Commercial real estate Other 3758
LRL Nursing Homes (Inc. Old Peoples Homes) Quasi-CRE Other 3732
LRL Mineral Producing Hereditament - Chalk Commercial real estate Industrial 3721
LRL Station Let Outs Commercial real estate Retail 3541
LRL Vehicle Testing Centres (Without Test Tracks) Quasi-CRE Retail 3479
LRL Grain Silos Commercial real estate Industrial 3442
LRL Pleasure Piers Commercial real estate Other 3404
LRL Bulk Cement Storage Depots Commercial real estate Industrial 3246
LRL University - Ancillary Land or Buildings Quasi-CRE Other 3201
LRL Ski Centres Commercial real estate Other 3197
LRL Pack Houses Quasi-CRE Industrial 3145
LRL Cement Tile Works Commercial real estate Industrial 3116
LRL Mineral Producing Hereditament - Blockstone Commercial real estate Industrial 3021
LRL Information/Visitor Centres Quasi-CRE Other 2942
LRL Mineral Producing Hereditament - Inert Commercial real estate Industrial 2890
LRL Pavillions Non-commercial Other 2837
LRL Sales Offices Commercial real estate Retail 2796
LRL Ship Repair Yards Quasi-CRE Industrial 2796
LRL Aluminium Smelting Works Commercial real estate Industrial 2698
LRL Lakes With Water Sport Facilities Quasi-CRE Other 2689
LRL Heritage Railways Quasi-CRE Infrastructure 2658
LRL Mineral Producing Hereditament - Other Mineral Category Commercial real estate Industrial 2509

TOSCAFUND BRITAIN’s PROPERTY CREDENTIALS
74 December 2015
List Sector Real Estate type Sector type 2010 Rating List
2008 pricesIn thousands
LRL Hospital Let Outs Commercial real estate Other 2380
LRL Squash Courts Commercial real estate Other 2204
LRL Granaries and Intervention Stores Commercial real estate Industrial 2194
LRL Workshops Within/Part of Specialist Property Commercial real estate Industrial 2095
LRL Rifle and Weapons Ranges Quasi-CRE Other 2093
LRL Mineral Producing Hereditament - Clay Commercial real estate Industrial 2025
LRL Kiosks Within/Part of Specialist Property Commercial real estate Retail 1984
LRL Land Used for Display Quasi-CRE Other 1971
LRL Football Pitches Quasi-CRE Other 1876
LRL Boathouses Quasi-CRE Other 1822
LRL Ice Rinks Commercial real estate Other 1792
LRL Miscellaneous Within/Part of Specialist Property Quasi-CRE Other 1740
LRL Land Used For Car Boot Sales Quasi-CRE Other 1691
LRL Truck Stops Quasi-CRE Other 1662
LRL War Games Courses/Misc Ag. Use Commercial real estate Other 1496
LRL Animal Boarding Commercial real estate Other 1440
LRL Totalisators On Horse Racecourses Commercial real estate Other 1427
LRL Coking and Carbonising Plants Commercial real estate Industrial 1321
LRL Mineral Producing Hereditament - Brine Commercial real estate Industrial 1279
LRL Land Used For Advertising Quasi-CRE Other 1244
LRL High Tech Warehouses Commercial real estate Industrial 1238
LRL Offices Within/Part of Specialist Property Commercial real estate Office 1237
LRL Telecommunications Switching Centres Commercial real estate Infrastructure 1235
LRL Swimming Pools (Private) Commercial real estate Other 1226
LRL Peat Fields Non-commercial Other 1185
LRL Nurseries/Creches Within/Part of Specialist Property Quasi-CRE Other 1140
LRL Rugby League Grounds Commercial real estate Other 1111
LRL Mineral Producing Hereditament - Slate Commercial real estate Industrial 1084
LRL Photographic Booths Commercial real estate Retail 1014
LRL Car Parking Within/Part of Specialist Property Commercial real estate Other 916
LRL Roller Skating Rings Commercial real estate Other 857
LRL Mortuaries Non-commercial Other 838
LRL Bird Sanctuaries Non-commercial Other 836
LRL Agricultural Research Centres Quasi-CRE Other 797
LRL Heliports Commercial real estate Infrastructure 793
LRL Distilleries Commercial real estate Industrial 780
LRL Electric Generators At Landfill Sites With Connecting Pipelines Quasi-CRE Infrastructure 765
LRL Changing Rooms Commercial real estate Other 721
LRL Polo Grounds Quasi-CRE Other 662
LRL Game Farms Quasi-CRE Other 547
LRL Pitch and Putt/Putting Greens Quasi-CRE Other 538
LRL Mineral Producing Hereditament - Gas Commercial real estate Industrial 486
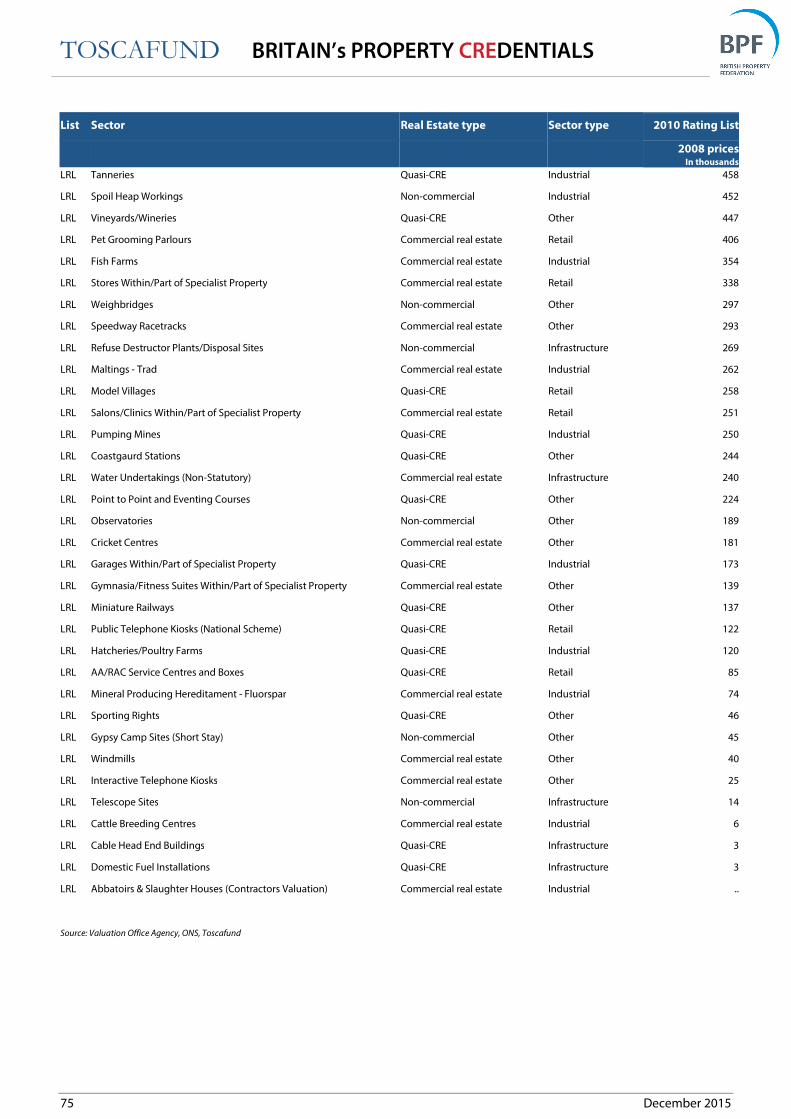
TOSCAFUND BRITAIN’s PROPERTY CREDENTIALS
75 December 2015
List Sector Real Estate type Sector type 2010 Rating List
2008 pricesIn thousands
LRL Tanneries Quasi-CRE Industrial 458
LRL Spoil Heap Workings Non-commercial Industrial 452
LRL Vineyards/Wineries Quasi-CRE Other 447
LRL Pet Grooming Parlours Commercial real estate Retail 406
LRL Fish Farms Commercial real estate Industrial 354
LRL Stores Within/Part of Specialist Property Commercial real estate Retail 338
LRL Weighbridges Non-commercial Other 297
LRL Speedway Racetracks Commercial real estate Other 293
LRL Refuse Destructor Plants/Disposal Sites Non-commercial Infrastructure 269
LRL Maltings - Trad Commercial real estate Industrial 262
LRL Model Villages Quasi-CRE Retail 258
LRL Salons/Clinics Within/Part of Specialist Property Commercial real estate Retail 251
LRL Pumping Mines Quasi-CRE Industrial 250
LRL Coastgaurd Stations Quasi-CRE Other 244
LRL Water Undertakings (Non-Statutory) Commercial real estate Infrastructure 240
LRL Point to Point and Eventing Courses Quasi-CRE Other 224
LRL Observatories Non-commercial Other 189
LRL Cricket Centres Commercial real estate Other 181
LRL Garages Within/Part of Specialist Property Quasi-CRE Industrial 173
LRL Gymnasia/Fitness Suites Within/Part of Specialist Property Commercial real estate Other 139
LRL Miniature Railways Quasi-CRE Other 137
LRL Public Telephone Kiosks (National Scheme) Quasi-CRE Retail 122
LRL Hatcheries/Poultry Farms Quasi-CRE Industrial 120
LRL AA/RAC Service Centres and Boxes Quasi-CRE Retail 85
LRL Mineral Producing Hereditament - Fluorspar Commercial real estate Industrial 74
LRL Sporting Rights Quasi-CRE Other 46
LRL Gypsy Camp Sites (Short Stay) Non-commercial Other 45
LRL Windmills Commercial real estate Other 40
LRL Interactive Telephone Kiosks Commercial real estate Other 25
LRL Telescope Sites Non-commercial Infrastructure 14
LRL Cattle Breeding Centres Commercial real estate Industrial 6
LRL Cable Head End Buildings Quasi-CRE Infrastructure 3
LRL Domestic Fuel Installations Quasi-CRE Infrastructure 3
LRL Abbatoirs & Slaughter Houses (Contractors Valuation) Commercial real estate Industrial ..
Source: Valuation Office Agency, ONS, Toscafund

Disclaimer
This document is for information purposes only. The information herein is believed to be correct, but cannot be guaranteed, and the opinions expressed in it constitute our
judgement as of this date but are subject to change. Reliance should not be placed on the information and opinions set out herein for the purposes of any particular
transaction or advice. The authors cannot accept any liability arising from any use of this document.
© 2014, All rights reserved