final dissertation - auburn university
TRANSCRIPT
Smart Materials for Advanced Applications: Self-Decontaminating Polymers,
Photofunctional Composites, and Electroconductive Fibers
by
Brian Kevin Little
A dissertation submitted to the Graduate Faculty of
Auburn University
in partial fulfillment of the
requirements for the Degree of
Doctor of Philosophy
Auburn, Alabama
May 9, 2011
Keywords: smart materials, photochemistry, high energy chemistry, electroconductive fibers
Copyright 2010 by Brian Kevin Little
Approved by
German Mills, Chair, Associate Professor of Chemistry
Rik Blumenthal, Associate Professor of Chemistry
Vincenzo Cammarata, Associate Professor of Chemistry
Curtis Shannon, Professor of Chemistry

ii
Abstract
Materials capable of providing multifunctional properties controllable by some external
stimulus (pH, light, temperature, etc) are highly desirable and obtainable given recent
advancements in material science. Development of these so called “Smart” materials spanned
across many disciplines of science with applications in industrial areas such as medical, military,
security, and environmental. Furthermore, next-generation materials require the ability to not
only sense/respond to changes in their external/internal environment, but process information in
regards to these changes and adapt accordingly in a dynamic fashion, autonomously, so called
“Intelligent” materials. Findings reported in this manuscript detail the synthesis, characterization,
and application of smart materials in the following three areas: 1) self-cleaning polymers 2)
photoresponsive composites and 3) electroconductive fibers.
Self-Cleaning Polymers: Self-decontaminating polymers are unique materials capable of
degrading toxic organic chemicals (TOCs). Barriers composed of or coated with our
photochemical reactive polymer matrix could be applied to multiple surfaces for defense against
TOCs; for example, military garments for protection against chemical warfare agents. This study
investigates conditions necessary for formation of peroxides via O2 reduction induced by long-
lived, strongly reducing benzophenyl ketyl (BPK) polymer radicals. Photolysis of aqueous
solutions composed of sulphonated poly(ether etherketone), SPEEK, and poly(vinyl alcohol),
PVA lead to the formation of the BPK radicals. Experiments investigate the formation and
decomposition of peroxides in aqueous solutions of SPEEK/PVA under photolysis.

iii
Photofunctional Composites: Photoresponsive nanoporous (PN) films and powders were
studied and evaluated as possible additives to sensitize the initiation of CH3NO2 via a mechanism
involving coalescence of reaction sites. Such materials consist of a 3-D mesoporous silica
framework possessing open interconnected pores. Attached to the pore walls are azobenzene
ligands that undergo trans to cis isomerization upon exposure to 350-360 nm photons; the
reverse reaction occurs with heat or under illumination with λ > 420 nm. PN films were studied
to ascertain the mass transport properties for the filling/releasing of CH3NO2 from within the
pores of the films in the absence/presence of UV-Vis light. PN powders were evaluated for pore
morphology, ligand mobility, and particle size and shape in order to determine their ability to be
utilized as an effective sensitizing agent.
Electroconductive Fibers: This study investigates electroless and electrochemical
techniques for purposes of producing highly conductive metal coatings on the surface of high
strength fibers. Metallized fibers were envisioned to be utilized as high strength low weight
tethers for space applications. Findings suggest that these materials could be valuable as
components within “Intelligent” textiles, but, at present, not suitable for conditions witnessed in
space (high energy UV irradiation, Atomic Oxygen, etc). Kevlar fibers were coated utilizing an
electroless and then electrochemical deposition processes. Metallized fibers were evaluated for
their resistivity, power output, tensile strength, uniform coverage, and mass gain. Presented in
this section are the results of such measurements.

iv
Acknowledgments
The author would like to graciously thank German Mills. Professor Mills has been and
will continue to have an influential impact on my knowledge of chemistry and my future
development as an independent scientist. Thanks are given to Professor Buster Slaten for his
never ending source of pursuance and insight throughout this project. Thanks are extended to
members of the author’s committee and others including Rik Blumenthal, Vince Cammarata,
Curtis Shannon, Mike Lindsay and German Mills for their guidance and time.
Gratitude is extended to the following funding agencies for support of this research:
NASA (contract # NASA-NCC8-237-MTM), NTC (contract # C06-AC01), and AFRL (contract
# BAA-RWK-08-0001).
The author would like to thank his parents, David and Pam Little and siblings, Bradd,
Erik, Brett, Zachary and Sara Little for their untiring feelings of love and encouragement.
Special thanks are given to my wife Alisa and two daughters, Carmen and Tristan for their
undying love and support.

v
Table of Contents
Abstract ................................................................................................................................... ii
Acknowledgments .................................................................................................................. iv
List of Tables ......................................................................................................................... vii
List of Figures ....................................................................................................................... viii
List of Abbreviations............................................................................................................. xiii
I. Development of SMART Materials
General History of SMART Materials ........................................................................ 1
Actuators and Sensors ................................................................................................. 4
Self-Cleaning Composites ........................................................................................... 8
Photofunctional Materials .......................................................................................... 12
Electroconductive Fibers ........................................................................................... 15
Conclusions ............................................................................................................... 18
References ................................................................................................................. 19
II. Investigation of Reactive Peroxides in Sulphonated Poly(ether etherketone)/Poly(vinyl
alcohol) Aqueous Polymer Solutions
Introduction .............................................................................................................. 22
Experimental ............................................................................................................ 25
Results and Discussion .............................................................................................. 27
Conclusions ............................................................................................................... 41
References ................................................................................................................. 42

vi
III. Probing Reaction Mechanisms Relevant to the High Energy Chemistry of Nitromethane
Introduction .............................................................................................................. 44
Background …………………………………………………………………………… 50
Experimental ............................................................................................................ 53
Results and Discussion .............................................................................................. 56
Conclusions ............................................................................................................... 80
References ................................................................................................................. 82
IV. Metallization of High Strength Fibers
Introduction .............................................................................................................. 84
Experimental ............................................................................................................ 85
Results and Discussion .............................................................................................. 88
Conclusions ..............................................................................................................113
References ................................................................................................................115
V. Conclusions .....................................................................................................................117
References ..........................................................................................................................119

vii
List of Tables
Table 1-1 Structural materials .................................................................................................. 3
Table 1-2 Functional materials ................................................................................................. 3
Table 1-3 Poly-functional materials .......................................................................................... 4
Table 1-4 Comparison of artificial muscle actuator technologies and natural muscle ................ 7
Table 3-1 Proton NMR spectrum data of TSUA in deuterated DMSO .................................... 60
Table 3-2 Physical properties for mesoporous materials ......................................................... 67
Table 4-1 Conductivity and mass change for metallized fibers of a length of 9 cm ................109
Table 4-2 Tensile strength measurements for metallized fibers ..............................................112

viii
List of Figures
Figure 1-1 Schematic for a DEA (rubbery capacitor). When a voltage potential
difference is applied between the two electrodes, the two oppositely charged
electrodes are attracted to one another thus creating a force unto the dielectric
elastomer compressing the film in the direction of the electric field, thus expanding
the film in perpendicular directions ............................................................................... 5
Figure 1-2 Diagram demonstrating the cleaning mechanism on smooth (a) and rough (b)
super-hydrophobic surfaces ........................................................................................ 10
Figure 1-3 Water drop profiles for photoresponsive nanostructured V2O5 switching between
super-hydrophobicity and super-hydrophilicty upon UV irradiation. b) SEM of the
rose-garden-like nanostructure of the V2O5 substrate .................................................. 11
Figure 1-4 a) CCTV images of water droplets on Activ taken in situ during UV irradiation.
CAi = 69°, final CA = ~0°. (b) CA versus irradiation time profiles recorded using
Activ sample irradiated from above in water-saturated oxygen atmosphere and either
UVC (○) or UVA (●) light, or in a water-saturated N2-only atmosphere with UVC
light (+) ..................................................................................................................... 13
Figure 1-5 Photoisomerization of azobenzene. Azobenzene normally exists in its
thermodynamically favored trans configuration. Upon absorption of a photon, within
the trans absorption band, the molecule isomerizes to the less stable cis configuration.
In the cis configuration, the molecule will relax back to the trans configuration with
time or can be induced by heat and/or absorption of a photon in the cis absorption
band ........................................................................................................................... 14
Figure 1-6 Photoresponsive nanocomposites prepared by Evaporation Induced
Self-Assembly (EISA). Atom labels: C: grey, O: red, N: dark blue, Si: blue, H atoms
omitted ....................................................................................................................... 16
Figure 1-7 SEM image of kevlar monofilaments coated with Au (electrochemically). Inset:
a) image of kevlar yarn before metallization steps; b) image of kevlar yarn after Ni
deposition (electroless); and c) image of kevlar yarn after Au deposition
(electrochemically). .................................................................................................... 17
Figure 2-1 Optical spectra obtained after analysis with the iodide-molybdate method on air-
saturated solutions at pH 7 containing 0.018 M SPEEK and 0.36 M PVA photolyzed

ix
in a closed vessel. Bottom to top: samples irradiated with 350 nm light,
I0 = 4.9 x 10⁻⁵
M(hν)/s, for 30 s, 60 s, 90 s and 120 s. Inset: plot of absorbance at
370 nm divided by as a function of irradiation time .................................................. 28
Figure 2-2 Plot of the concentrations of O2 () and H2O2 () as a function of irradiation
time. The aqueous air-saturated solutions containing 0.36 M PVA and 0.018 M
SPEEK at pH 7 were illuminated in an open vessel with 350 nm light, I0 = 1.6 x 10⁻⁵
M(hν)/s ....................................................................................................................... 29
Figure 2-3 Evolution of [O2] during an experiment in which the polarographic cell containing
1 mL of an air-saturated solution with 0.018 M SPEEK and 0.36 M PVA at pH 7 was
placed inside the Rayonet and irradiated continuously with 350 nm photons,
I0 = 3.01 x 10⁻⁵
M(hν)/s............................................................................................... 31
Figure 2-4 Initial decay of [O2] during the experiment in which the polarographic cell
containing 1 mL of an air-saturated solution with 0.018 M SPEEK and 0.36 M PVA
at pH 7 was placed inside the Rayonet and irradiated continuously with 350 nm
photons, I0 = 3.01 x 10⁻⁵
M(hν)/s ................................................................................ 32
Figure 2-5 Plots of [H2O2] versus irradiation time at different light intensities obtained from
photolysis with 350 nm light of air-saturated solutions containing 0.018 M SPEEK
and 0.36 M PVA at pH 7 in a closed system. .............................................................. 33
Figure 2-6 Evolution of [O21] with irradiation time measured for air-saturated solutions at
pH 6 containing 0.398 M KI and 5.8 x 10⁻⁴
M SPEEK with 0.012 M PVA,
λmax = 362 nm () and without PVA, λmax = 367 nm (). Photolysis were
performed on 1 cm optical cells using an intensity of 350 nm photons equal to
3.1 x 10⁻⁵
M(hν)/s. ...................................................................................................... 34
Figure 2-7 Plot of [H2O2] versus irradiation time determined using air-saturated aqueous
solutions in closed and opened vessels containing 0.018 M SPEEK and 0.36 M PVA
at pH 7. Illumination with 350 nm photons in closed system unstirred () and open
system unstirred (), I0 = 4.2 x 10⁻⁵
M(hν)/s. Photolysis of an open system at one
half the light unstirred () with I0 = 1.9 x 10⁻⁵
M(hν)/s. Lines between data points
are not fits, but are present as a guide. ......................................................................... 35
Figure 2-8 Dependence of Øi(H2O2) () and Øi(SPEEK•) () on the solution pH. Øi(H2O2)
determinations were carried using air-saturated solutions containing 0.018 M SPEEK
and 0.36 M PVA stirred in closed systems. Øi(SPEEK•) values were obtained from
similar solutions that were degassed but not stirred. Photolysis with 350 nm light,
I0 = 5.3 x 10⁻⁵
M(hν)/s................................................................................................. 37
Figure 3-1 Left side: representation of the azobenzene ligands in the trans configuration;
changes resulting from isomerization to the cis form are shown on the right side. ....... 48

x
Figure 3-2 General EISA process for the formation of mesoporous materials (films and
powders). From the top (left to right): micelles ( ) and inorganic precursors (○)
self-assemble during the initial evaporation phase followed by mesotructuration.
From the bottom (left to right): solidification of the liquid mesophase via
polymerization of the surrounding siloxane network followed by surfactant removal,
from the mesopores, leaving behind the final mesoporous structure ............................ 52
Figure 3-3 Asymmetric unit for 4-(-3-triethoxysilylpropyl-uriedo)azobenzene (TSUA) in
hexane. C (grey), O (red), H (green), N (blue) and Si (aqua). Unit cell constants a =
15.538(15.430), b = 9.245(9.247), and c = 18.482(18.504); for comparison, unit cell
constants in bold face are included from reference 17 ................................................. 57
Figure 3-4 UV/Vis absorption spectra of a) TSUA in EtOH (28 µg mL-1
); b, c) after UV
irradiation of (a) for 1 and 10 min; d, e, f, g) after room light exposure of (c) 3, 10,
40 min and 1 hr; h) after heating for 5 minutes at 100 ˚C; i) no light for 16 hr,
respectively ................................................................................................................ 61
Figure 3-5 (Top to bottom) XRD pattern of MCM-41 powder (1D-hexagonal). Inset: XRD
pattern of MCM-41 powder with indexed Powder Diffraction File (PDF). (Bottom)
TEM image of MCM-41 powder. Outline (far left) shows the 1D-hexagonal
structure for the pores. Inset: SEM image of MCM-41 powder .................................... 62
Figure 3-6 XRD pattern of MSU-H powder (2D-hexagonal). Inset: SEM image of MSU-H
powder. ...................................................................................................................... 64
Figure 3-7 XRD pattern of HMS powder (wormhole); Inset: SEM image of HMS powder. .... 64
Figure 3-8 XRD pattern of Sol1-2 Powder. Inset (left to right) TEM and SEM image of
Sol1-2 powder. ........................................................................................................... 65
Figure 3-9 XRD pattern of Sol1-3 Powder. Inset: SEM image of Sol1-3 powder. (Bottom)
TEM image of Sol1-3 powder showing wormhole like channels .................................. 66
Figure 3-10 (Top to bottom) XRD pattern of a PN film dip coated onto mica. Inset: PN film
dip coated unto a mica substrate. (Bottom) XRD pattern of a PN film spin coated
onto mica with reflections at 3.98 nm (d110) and 2.82 nm (d200). Inset: XRD pattern
of clean mica with diffraction peaks at 2θ = 4.410, 6.061, and 6.261 degrees ............... 68
Figure 3-11 UV-Vis spectra (diffuse reflectance mode) of PN powders: a) Sol1-2 and b)
Sol1-3. UV-Vis spectra of PN films synthesized via dip coated (c) or spin coated (d)
onto mica. ................................................................................................................... 70
Figure 3-12 a) UV-Vis spectrum of TSUA in EtOH (ptrans); b) TSUA in ethanol with
nitromethane; c) after 2 min of irradiation of (b) with 350 nm photons (predominately
cis - pcis); d) nitromethane in ethanol. Inset: UV-Vis spectrum of TSUA/EtOH,
ptrans (λmax = 360 nm); Later solution after 1 min of illumination with 350 nm

xi
photons, pcis (λmax = 443 nm and λmax = 338 nm). ....................................................... 71
Figure 3-13 a) UV-Vis spectrum of TSUA in EtOH (ptrans); b, c, & d) after addition of NM:
0.438 ml, 0.876 ml, and 1.376 ml, respectfully; e) photoylsis of (e) with 350 nm light
for 3 min (pcis). Inset: UV-Vis spectra of (a), (b), and (c) between the wavelength
ranges of 317 nm thru 467 nm. ................................................................................... 72
Figure 3-14 a) UV-Vis spectra of a spin coated film on mica after 14 h of irradiation with
350 nm light (pcis); b, c, d, e, f, & g) after immersion in CH3NO2 for 10, 30, 60, 120,
250, and 420 minutes. Inset: plot of optical density at λmax = 352 nm versus
immersion time (min) in CH3NO2. ............................................................................... 74
Figure 3-15 a) UV-Vis spectrum of a spin coated film on mica after 7 h immersion in NM;
b, c, d, e, & f) after photolysis with 350 nm light while immersed in CH3NO2 for 10,
30, 120, 420, and 1020 minutes. Inset: plot of optical density at λmax = 352 nm versus
irradiation time (min) at 350 nm light while immersed in CH3NO2, starting a (b). ....... 75
Figure 3-16 a) UV-Vis spectrum of a spin coated film on mica as prepared; b) after
photolysis with 350 nm light while immersed in CH3NO2 for 15 h; c, d, & e) after
irradiation of the film in air with 420 nm light. Inset: plot of optical density at
λmax = 352 nm versus irradiation time (min) with 420 nm light, starting with (b). ........ 77
Figure 3-17 ATR spectrum of a photoresponsive nanoporous film dip coated onto a mica
substrate immersed in CH3NO2, under illumination with 350 nm photons for 3 h.
Vibrations (cm-1
): Free alcohols or Si-O-H, vR-OH = 3618; TSUA, vN-H = 3440 &
3321; vCH2-Ph = 3082 & 3060; vC-H = 2981, 2937, & 2887; vC=O = 1653;
vC-C(AROMATIC) = 1500; vC=C(AROMATIC) = 1163 Nitromethane, vNO2 = 1560 & 1388 ....... 78
Figure 4-1 SEM image of “as received” Kevlar fibers ............................................................ 89
Figure 4-2 SEM image of clean Kevlar fibers ......................................................................... 89
Figure 4-3 Diffractometer trace of clean Kevlar fibers exposed to Cu K(α) radiation .............. 90
Figure 4-4 SEM image of sectioned Kevlar fibers coated with a single treatment of
electroless Ni deposition ............................................................................................. 92
Figure 4-5 XRD signals obtained using Cu K(α) radiation of Kevlar fibers coated with
nickel, K-Ni(F), and of powdered fibers coated with Ni, K-Ni(P) ............................... 93
Figure 4-6 TEM images of cross-sectioned slices of a Kevlar fiber plated using Ni
electroless deposition .................................................................................................. 95
Figure 4-7 TEM images of a powder from Kevlar fibers exposed to the Ni electroless bath .... 96

xii
Figure 4-8 SEM image of sectioned Kevlar fibers first coated using the electroless Ni bath
followed by treatment with the Au(I) thiosulfate electroless method. Inset: close-up
of the area that includes the fiber tip highlighted by an arrow in the main image ......... 98
Figure 4-9 XRD patterns of Kevlar fibers (black line) and of fibers pre-coated with the
electroless Ni bath, then coated with gold via electroless deposition (grey line). Data
collected using Mo K(α) radiation; the vertical lines identify reference positions for
the diffraction signals of metallic Ni (grey) and Au (red). ........................................... 99
Figure 4-10 SEM image showing an overview of a group of Kevlar fibers first coated in the
Ni electroless bath, then exposed to ultasound in H2O and electroplated with Au via
the thiosulfate procedure ............................................................................................102
Figure 4-11 SEM image of Kevlar fibers first coated in the Ni electroless bath, then exposed
to ultasound in H2O and electroplated with Au via the thiosulfate procedure. .............103
Figure 4-12 High magnification SEM image of a Kevlar fiber first coated in the Ni
electroless bath, then exposed to ultrasound in H2O and electroplated with Au via
the thiosulfate procedure. ...........................................................................................104
Figure 4-13 TEM images from 95 nm thick slices microtomed out of Kevlar fibers plated
with the electroless Ni bath, sonicated and metalized electrochemically with Au.
Each bottom picture corresponds to a magnified view of the area encircled on the
corresponding top image. ...........................................................................................105
Figure 4-14 XRD pattern obtained with Cu K(α) of Kevlar fibers coated three times via
electroless Ni deposition followed by three electrochemical Au platings. ...................106
Figure 4-15 SEM image of Kevlar fibers treated three times with the electroless Ni method,
then coated three times with Au via the thiosulfate electrodeposition procedure.. .......107
Figure 4-16 SEM image at higher magnification displaying coatings on Kevlar fibers treated
three times with the electroless Ni method, then coated three times with Au via
electrodeposition. ......................................................................................................108
Figure 4-17 Plots of current versus voltage obtained for a 9 cm Kevlar yarn treated three
times with the electroless Ni method, then coated three times with Au via
electrodeposition. Panel a) displays results from measurements over a yarn distance
of 3.2 cm; the data of panel b) is indicative of a point failure at 1.8 W for a distance
along the yarn of 6.5 cm ............................................................................................111

xiii
List of Abbreviations
Å angstrom
○C degrees Celsius
cm centimeter
ε extinction coefficient
e- electron
Eo potential energy, redox potential
EPR electron paramagnetic resonance
fcc face cubic center
FT Fourier transform
g gram
h hour
hν photon
Io light intensity
IR infrared
K Kelvin
keV kiloelectron volt
k1 rate constant for first step
k2 rate constant for second step
λ wavelength

xiv
L Liter
M molar concentration
Mx metal ion
µm micrometer
mol mol
MW molecular weight
min minute
mL milliter
mm millimeter
nm nanometer
NMR nuclear magnetic resonance
O.D. optical density
pH -log[H+]
PVA poly(vinyl alcohol)
s second
SEM scanning electron microscopy
t time
TEM transmission electron microscopy
UV ultraviolet light
Vis visible light
W watt
wt weight
XRD x-ray diffraction

1
I. DEVELOPMENT OF SMART MATERIALS
Evolution of Material Functionality
Since mankind‘s discovery of simple materials such as stone, bronze, and iron, human
civilization has prospered in many areas with advances in weapons, pottery, construction
materials, and multiple types of tools. These discoveries were so influential in our history that
periods in time were named after these materials (Stone Age, Bronze Age, and Iron Age).
However, as influential as these resources were to our way of living, progress was slow toward
applying these materials to new areas outside what was initially accomplished. Advances in the
design and application of materials require greater insight into macroscale properties (brittleness,
color, ductility) and their association with the underlying molecular structure of the material. For
instance, the discovery of synthetic materials e.g. plastics, through polymer chemistry, led to
materials designed and applied across multiple fields of science and technology in an exponential
manner that is continuing at this very moment.
Nevertheless, all materials described above are valued for possessing either a structural or
functional property (elasticity, conductivity, hardness), but not both, and are therefore limited in
their use towards more advanced applications. Tables 1-1, 1-2, and 1-3 are examples of structural
and functional materials and their inherent properties.1 Materials listed in Tables 1-1 through 1-3,
are classified as structural, functional, and poly-functional, respectfully. A structural material
would be considered a substance that possesses an ideal property, given the application, such as
steel versus wood for composing a tool, e.g. an axe. Materials containing functional properties
are chosen not based on their structure as much as their ability to perform a unique process, for
example germanium (germanium is a photoconductive material able to absorb light and

2
subsequently generate a current). Poly-functional materials are able to deliver more than one
function such as lead zirconate titanate, which can actually perform three functions
(piezoelectricity, pyroelectricity, and ferroelectricity).
Scientists have recognized through the study of biological systems, that the next big jump in
human civilization will come from the ability to synthesize ―intelligent‖ materials which possess
both structural and functional capabilities that operate autonomously based on specific
conditions within their environment (pH, temperature, light intensity …etc). Couple this insight
with the advancements in nanoengineering across so many broad disciplines of science in
combination with the ability to access information via the internet, and with the possible
discovery of practical renewable energy sources, intelligent materials will be unbound in their
impact towards the improvements of human civilization marking the next era in the material age.
It is important to note that there are many definitions for smart materials, but at a minimum, most
are confined to materials with the ability to change one or more functions significantly given
some outside stimulus. 2-4
Given this definition of smart materials, functional and poly-functional
materials are considered ―smart‖ materials. For the purpose of clarity and relevance to the
research results reported in the following chapters, smart materials will contain ideal structural
properties and sensing or actuating functionality that can be significantly altered in a controlled
fashion by some type of external stimulus (pH, light, temperature, pressure, etc). Furthermore,
the term ―intelligent‖ materials is commonly used to describe smart materials, however
inappropriately, given that the word intelligent suggests the ability to learn, gain knowledge, and
adapt, which would not be the case for smart materials. An intelligent material could be a
material composed of smart materials, but in addition has the ability to process information and
―learn‖ to adapt to its surrounding environmental conditions.

3
Table 1-1. Structural materials. Adapted from Gandhi et al.1
Material
Steel
Polycarbonate
Wood
Iron
Concrete
Graphite-epoxy laminates
Table 1-2. Functional materials. Adapted from Gandhi et al.1
Material Properties
Nickel-titanium
Cadmium sulphide
Terbium iron
Quartz
Electro-rheological fluids
Aluminum soap solution
Barium titanate
Copper oxide
Potassium dihydrogen phosphate
Selenium
Germanium
shape-memory
piezoelectric
magnetostrictive
pyroelectric
viscoplastic
viscoelastic
ferroelectric
photoelectric
electro-optic
photoelectric
photoconductive

4
Table 1-3. Poly-functional materials. Adapted from Gandhi et al.1
Material Properties
Lead zirconate titanates
Bone
Lead-magnesium niobate
Terbium-iron-dysprosium
Piezoelectric
Pyroelectric
Ferroelectric
Mineral Homeostasis
Structural Homeostasis
Piezoelectric
Pyroelectric
Thermo-electrostrictive
Thermo-magnetostrictive
Actuators and Sensors
The ability of some smart materials to detect and respond to their environment is a critical
process for next generation intelligent materials or systems. As stated earlier, intelligent
materials have the ability to adapt to their surrounding conditions dynamically from some form
of learning (knowledge), which requires the capability to sense changes (sensor) in their
environment and act accordingly i.e. actuation. Actuator is a material that simply converts some
form of energy into output, usually mechanical (motion). Figure 1-1 shows a schematic for a
dielectric elastomer actuator (DEA). DEA are basically rubber capacitors, composed of two
electrodes which have a dielectric polymer film sandwiched between their surfaces.

5
Figure 1 - 1. Schematic for a DEA (rubbery capacitor). When a potential difference is applied
between the two electrodes, the two oppositely charged electrodes are attracted to one another
causing compression of the film in the direction of the electric field, thus expanding the film in
perpendicular directions.5
Upon placing a voltage across the rubber capacitor, positive charges begin to accumulate on one
electrode as negative charges build-up on the other electrode (this induces an attraction between
the two electrodes), thus compressing the dielectric polymer film.
Dielectric elastomers are used in many applications given that they are constructed of low-
cost materials and provide reliable performance capabilities. Of particular interest is the
possibility of utilizing these materials as artificial muscle actuators in robotics given that they
can be electrically stimulated to induce motion similar to the behavior of natural muscle. Table 1

6
- 4 is a list of artificial muscle actuator technologies and natural muscle along with their relevant
properties.
Sensors on the other hand, are materials capable of associating the intensity of the stimulus to
some event such as stress, strain, temperature, radiation, or chemical change as a signal that can
be read by an observer or instrument. One of the most common types of sensors in the field of
smart materials is piezoelectric sensors. Piezoelectric sensors transform an imposed pressure into
a change in electrical charge on their surface i.e. piezoelectricity. Conversely, these same
materials show a proportional link with the generated geometric strain from an applied electric
field. In other words, these materials can convert mechanical energy into electrical energy or vice
versa, which makes them very useful as sensors and/or actuators. Piezoelectric materials are
utilized in diverse appliances which require the generation of a charge or high voltage such as
spark ignition of gas heaters, cooking stoves, and cigarette lighters as well as analytical devices
like microbalances. Piezoelectric actuators are commonly used as ultrasonic transducers by
converting electrical energy into sound from oscillations within the crystal. Piezoelectric
sensor/actuators can be engineered from different compositions (single-crystal materials,
piezopolymers, piezocomposites, and piezofilms), based on the desired function, making them
highly attractive across many different disciplines of science and industry. Furthermore, it is not
uncommon for some smart materials to contain both sensor and actuator capabilities as pointed
out with piezoelectric materials and which is also true for some dielectric elastomers.
Application of smart materials can be witnessed across multiple areas of technology in such
fields as surface coatings, medical, defense, solar energy, and aerospace to just name a few.
While there are many review articles on the different types of smart materials, their preferred

7
Table 1 – 4. Comparison of artificial muscle actuator technologies and natural muscle. Adapted from Shahinpoor and Kornbluh.5,6
Actuator type (specific example) Max. strain (%) Max. press. (MPa) Max. efficiency (%) Relative speed (full cycle)
Dielectric elastomers
Acrylic 380 8.2 60-80 Medium
Silicone 63 3.0 90 Fast
Electrostrictive polymer
Graft Elastomer 4 24 — Fast
Piezoelectric
Ceramic (PZT)a 0.2 110 >90 Fast
Single crystal (PZN-PT) 1.7 131 >90 Fast
Polymer (PVDF)b
0.1 4.8 n/a Fast
Shape-memory alloy (TiNi) >5 >200 <10 Slow
Thermal (expansion)c 1 78 <10 Slow
Electrochemomechanical 10 450 <1 Slow
conducting polymer (polyaniline)
Mechanochemical polymer/gels >40 0.3 30 Slow
(polyelectrolyte)
Natural muscle >40 0.35 >35 Medium
(human skeletal)
a PZT B, at a maximum electric field of 4 V/µm;
b PVDF, at a maximum electric field of 30 V/µm;
c Aluminum, with a temperature
change of 500 °C;

8
area of application, and their impact in particular markets, it is the intent of this author to focus
on certain kinds of smart materials and not to provide an exhausting review on the subject.7-
11Therefore, the following sections will be devoted to smart materials within the areas of self-
cleaning composites, photofunctional materials, and electroconductive fibers given that these
materials are more relevant to the research results contained in the following chapters of this
manuscript.
Self-Cleaning Composites
Smart materials with self-cleaning properties are highly sought after for multiple applications
like self-cleaning fibers e.g. to minimize odor and bacteria contamination, water treatment, water
proofing coatings for water sensitive electronics, self-cleaning windows for automobiles and
buildings, and stain resistant textiles.12-15
In general, ―self-cleaning‖ can be defined as the ability
to keep a material‘s surface or interior free of contamination such as dirt, bacteria, or water. The
two most common methods employed to achieve this function are super-hydrophobicity and
photocatalytic decomposition. Scientists discovered in 1977 via SEM that lotus leafs have a
unique ability to cleanse themselves of foreign particles by forming and rolling water droplets
across their surface.16
The ability of a surface to form a water droplet is dictated by the attraction
of water to the surface versus that of water to itself. Surfaces that promote a high degree of
water-water attraction are hydrophobic (repelling) thus forming near spherical water droplets and
surfaces that promote surface-water interaction are called hydrophilic (dispersant), which
consequently promotes the formation of flat puddles of water i.e. wetting the surface. The
hydrophobicity on the surface of a leaf is due to the roughness of the surface, which facilitates a
high contact angle (CA) with respect to the water droplet‘s side tangent to the plane of the

9
surface. In other words, contact angles greater than 90 degrees for the side of the liquid droplet
tangent to the plane of the surface will induce hydrophobicity; contact angles greater than 150
degrees are called super-hydrophobic. Presented in Figure 1-2 is an illustration of the mechanism
by which a rough super-hydrophobic surface promotes cleaning of contaminates by rolling
spherical water droplets. Also notice in Figure 1-2, that a smooth super-hydrophobic surface is
inefficient in creating spherical water droplets, hence flatter water droplets are not able to
provide adequate self-cleaning.
Smart materials able to control the surface-water interactions can be highly useful for on/off
self-cleaning processes such as the example in Figure 1-3. Lim et al. reported the ability to
control the surface roughness effect of an inorganic oxide semiconductor substrate (WO3, TiO2,
ZnO, SnO2, V2O5, Ga2O3) by UV irradiation which switches the valence states (oxygen
vacancies to hydroxyl groups) at the surface of the substrate in contact with a water droplet.19
This photosensitive material was able to revert to the original state upon storing in the dark
storage. Irradiation of the substrate in contact with the water droplet decreased the surface
roughness by increasing the interaction between the water and the surface thus allowing water to
adsorb and enter the microgrooves of the substrate facilitating wetting of the surface. Afterwards,
it was noticed that while leaving the substrate in the dark, hydroxyl groups convert back to oxide
groups, which lead to a water/air interface at the rough surface and promoted a super-
hydrophobic effect, demonstrating the self-cleaning ability of the material. Figure 1-3a illustrates
the switchable surface interaction properties of the substrate from super-hydrophobic to super-
hydrophilic (after irradiation). Ultimately the surface roughness effect is controlled by the
valence state of the inorganic oxide and not by a physical change in the surface morphology,
which is a fixed structural property (see Figure 1-3b).

10
Figure 1-2. Diagram demonstrating the cleaning mechanism on smooth (a) and rough (b) super-
hydrophobic surfaces. Reproduced with permission from ref 17. Copyright Wiley-VCH Verlag
GmbH & Co. KGaA.
Photocatalytic decomposition, as stated earlier, is another common method for creating self-
cleaning materials. TiO2 is a very popular choice for composing self-cleaning materials
especially for self-cleaning windows.20
Inorganic oxide semiconductors such as TiO2 can control
the surface interaction of a water droplet by UV irradiation, which ultimately converts the
droplet into a super-hydrophilic state. Another beneficial self-cleaning property of TiO2 is its
functionality as a strong oxidizer through activation by UV light.21
When TiO2 is irradiated with
photons greater than its band gap energy, 3.0 eV (rutile) or 3.2 eV (anatase), excited charge
carriers are formed in the conduction band, which in turn generates positively charged holes in
the valence band.

11
Figure 1-3. a) Water drop profiles for photoresponsive nanostructured V2O5 switching between
super-hydrophobicity and super-hydrophilicity upon UV irradiation. b) SEM of the rose-garden-
like nanostructure of the V2O5 substrate. Reproduced with permission from ref 18. Copyright
Wiley-VCH Verlag GmbH & Co. KGaA.
These positive holes can oxidize water into hydroxyl radicals which can proceed to
decomposed organic pollutants and/or the pollutants can be oxidized directly at the surface of the
TiO2 substrate by positive holes.20
An example of this is shown in Figure 1-4, where Mills and
Crow report the change in hydrophilicity of a water droplet as a function of UV irradiation
time.22
Of particular interest, with respect to how common these materials are, is the fact that the
authors use a commercially available self-cleaning photocatalytic glass (Activ) as a standard for
comparison against synthesized TiO2 films. Experimentally a water droplet (~5 µm) was placed

12
onto the Activ TiO2 coated glass substrate and irradiated with different wavelengths of UV light,
UVC light (280 nm – 100 nm) or UVA light (400 nm – 315 nm), while monitoring the shape of
the droplet (CA) as a function of UV irradiation. Initial tests conducted on Activ films showed an
increase hydrophilicity during irradiation, where the shape of the water droplet flattens or CA
becomes smaller, see Figure 1-4a. Furthermore, oxygen appears to facilitate this process as a
sacrificial electron acceptor delaying the electron-hole recombination mechanism, see Figure 1-
4b. Equally important was the fact that the authors showed the efficiency of TiO2, under UV
irradiation, to decompose an organic compound (stearic acid) within the water droplet in just a
few minutes. Altogether, the above examples of self-cleaning smart materials illustrate the
control of the self-cleaning mechanism strictly by surface roughness, e.g. lotus leaf, or through a
combination of a rough semiconductor surface with photolysis.
Photofunctional Materials
Materials capable of responding to light are one of the most promising classes of smart
materials. Obvious advantages with these materials are the fact that they are activated by light
which has the following characteristics: free (natural light), easily tunable, an unlimited energy
source, can be distributed remotely, and typically does not interfere with other components
within the exposed material. Key components of these photofunctional smart materials are
photoresponsive molecules. Of particular interest are photoresponsive molecules that exhibit
mobility upon absorption of light. These molecules perform unique and specific molecular
motions prearranged by their chemical structure and their surrounding matrix. Characterization
of photoinduced molecular mobility have been described basically by three common chemical
13
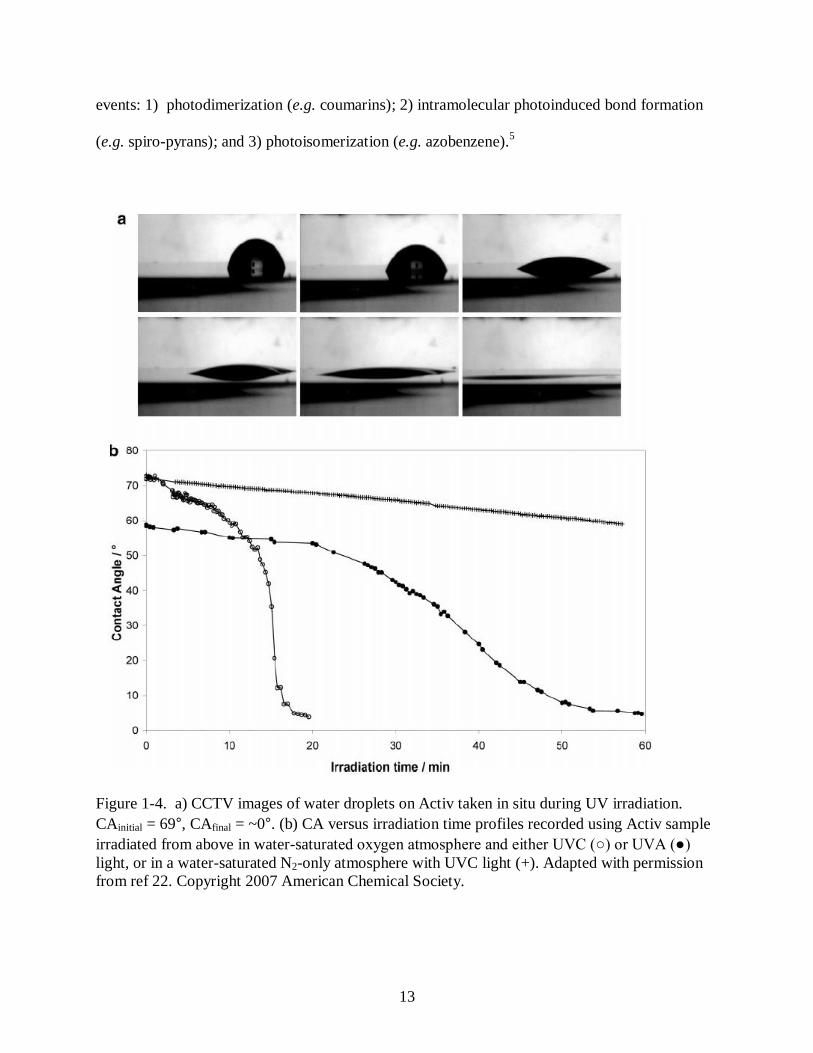
events: 1) photodimerization (e.g. coumarins); 2) intramolecular photoinduced bond formation
(e.g. spiro-pyrans); and 3) photoisomerization (e.g. azobenzene).5
Figure 1-4. a) CCTV images of water droplets on Activ taken in situ during UV irradiation.
CAinitial = 69°, CAfinal = ~0°. (b) CA versus irradiation time profiles recorded using Activ sample
irradiated from above in water-saturated oxygen atmosphere and either UVC (○) or UVA (●)
light, or in a water-saturated N2-only atmosphere with UVC light (+). Adapted with permission
from ref 22. Copyright 2007 American Chemical Society.

14
When these photoresponsive molecules are engineered to couple their light activated motion
coherently within a host matrix or on the surface of a substrate they can provide reliable
mechanical devices such as a nanoscale motors.23, 24
One very versatile photomechanical
molecule is azobenzene due to its clean and efficient photochemistry, strong absorption
properties, and reliability. Azo (— N=N—) containing compounds are well known for their
ability to isomerize from a thermodynamically favored trans configuration to a less stable cis
configuration upon absorption of a photon in the UV and/or visible portions of the spectrum.
Shown in Figure 1-5 is the photoisomerization motion of an azobenzene molecule. The reverse
photoisomerization of the azo containing compound (cis → trans) is dictated by ring-substitution
and/or the surrounding environment with lifetimes as short as a few seconds to as long as 6 years
when bulky substituent groups are added in conjunction with a surrounding solid matrix.5,25
A
unique example of a photoresponsive smart material containing azobenzene ligands was reported
NN
NN
hv
hv', kBT
trans (E)
cis (Z)
Figure 1-5. Photoisomerization of azobenzene. Azobenzene normally exists in the
thermodynamically favored trans configuration. Upon absorption of a photon, by the trans
absorption band, the molecule isomerizes to the less stable cis configuration. In the cis
configuration, the molecule will relax back to the trans configuration with time or by heat and/or
absorption of a photon in the cis absorption band.5

15
by Liu, et al. where they incorporated azobenzene ligands into the pore walls of a sol-gel
synthesized mesoporous silica host, Figure 1-6.26, 27
Upon irradiation with 365 nm light, the
azobenzene ligands (predominately in the trans state) bend into the cis state, thus creating more
space in the core of the pore with a estimated change in pore size of 6.8 Å.26
Furthermore, mass
transport studies were conducted with a membrane composed of this material where passage of
probing molecules, of different sizes (269 Å3 and 392 Å
3 ), were selectively controlled through
the pore channels by alternating the channel size through the isomerization of the azobenzene
ligands via UV irradiation.27
Photoresponsive molecules are ideal candidates for smart materials
given their robustness, energy efficiency, and versatility for incorporation into host matrices of
varying forms making their potential unlimited for many modern and future applications.
Electroconductive Fibers
Electrically conductive fibers are another class of smart materials that have attracted
significant awareness based on their ability to provide the following inherent properties: 1)
conduct electricity; 2) high flexibility and light weight (as compared to metal wire); 3)
electrostatic discharge; and 4) high frequency shielding.28
Electroconductive fibers have been
utilized in numerous applications including tethers for spacecraft and electrotextiles as wearable
electronics for purposes of supporting military, security, and solar cell devices.29, 30
In particular
conductive fibers have been integrated into ―Intelligent‖ systems such as wearable electronics for
the ability to perform as sensors, actuators, and distributors of electrical current for support of
higher end (i.e. intelligent materials) functions such as data processing and wireless
communication.28, 29
For example, in a review written by Coyle, el at. they described several

16
types of garments composed of conductive fibers utilized as piezoresistive sensors able to detect
pressure changes induced by the wearer during physical movements induced by sports related
Figure 1-6. Photoresponsive nanocomposites prepared by Evaporation Induced Self Assembly
(EISA). Atom labels: C: grey, O: red, N: dark blue, Si: blue, H atoms omitted. Adapted with
permission from ref 26. Copyright 2003 Wiley-VCH Verlag GmbH & Co. KGaA.
activities (running, jumping, etc).31
Also, some of these electroconductive garments are sensitive
enough to detect electrical currents associated with the functionality of vital organs (heart) within
the human body. The ability to provide continuous analysis of such vital processes within the
human body can offer invaluable data for the understanding and treatment of post-operative
patients. Conductive fibers come in many different forms such as metal wires, polymer fibers
with imbedded conductive particles (metals, carbon, etc), surface metalized polymer fibers via
chemical deposition (electroless and electrochemical), and inherently conductive polymers
(ICP), e.g. polyacetylene, polypyrrole, polyaniline, and polythiophene.29, 31-34
An example of a
conductive fiber synthesized in our lab is shown in Figure 1-6. This particular fiber (Kevlar) was

17
coated (electroless) with a Ni layer before electrochemically depositing the final Au layer. The
image shows well coated monofilaments with average conductivity values of 4.6 Scm-1
that
exhibit only a 27% decrease in tensile strength after plating.35
In addition, these high strength
conductive fibers reached power output values as high as 9 W.
Unfortunately, drawbacks are inherent to some of the aforementioned types of
electroconductive fibers, which eliminates their use for certain applications like wearable
electronics. For example, metal wires are uncomfortable to wear, brittle, and lack the necessary
flexibility for more active body movements.
Figure 1-7. SEM image of kevlar monofilaments coated with Au (electrochemically). Inset: a)
image of kevlar yarn before metallization steps; b) image of kevlar yarn after Ni deposition
(electroless); and c) image of kevlar yarn after Au deposition (electrochemically).35
a
b
c

18
Also, ICPs and conductive fibers -via inclusion of conductive particles, do not fare well once
laundered showing severe increases in resistivity.36
Nevertheless, these fibers are able to conduct
electricity and sense changes in their environment via piezoresistance and are ideal smart
materials for inclusion into future intelligent systems (especially textiles) capable of sensing,
actuating and processing information in response to an every changing external environment i.e.
autonomous adaptation.
Conclusions
Since the discovery of stone over 2 million years ago, mankind has passionately pursued the
development of such materials into tools in efforts to improve their every day lives. In the late
19th century, synthetic materials were discovered which possessed remarkable properties that
could be applied to multiple areas of industry and technology. However, understanding how to
combine the above mentioned materials into tools possessing multifunctional properties with
responsive characteristics had not been realized. At present, existing smart materials posses
unique structural properties (porosity, elasticity) and functions (actuator and/or sensor), but do
not have the capability to operate autonomously within their environment, requiring direction
(control) from an external source. Continued progress towards the evolution of smart materials
into intelligent materials will require a greater understanding of biological systems at the
molecular level with respect to their structural design and functional behavior. Knowledge gain
from the aforementioned activities in conjunction with improvements in nanoengineering,
renewable energy sources, and effective communication of scientific information will ultimately
position scientist to make discoveries towards next generation materials that will propel mankind
into the next era in the material age.

19
References
(1) Gandhi, M. V.; Thompson, B. S. Smart Materials and Structures; Chapman and Hall:
London, 1992.
(2) Schwartz, M. Encyclopedia of Smart Materials; John Wiley and Sons: New York, NY,
2002. Vol. 1.
(3) Shakeri, C.; Noori, M. N.; Hou, Z. Smart Materials and Structures a Review. Materials
for the New Millennium, Proceedings of the Material Engineering Conference, 4th,
Washington D. C., Nov. 10-14, 1996, 2, 863.
(4) Yoshida, M.; Lahann, J. ACS Nano 2008, 2, 1101-1107.
(5) Shahinpoor, M.; Schneider, H. Intelligent Materials; Royal Society of Chemistry:
Cambridge, 2008.
(6) Kornbluh, R. et al. Electroactive polymer (EAP) Actuators as Artificial Muscles: Reality,
Potential and Challenges; SPIE Press: Bellingham, 2004.
(7) Kumar, A.; Srivastava, A.; Galaev, T.; Mattiasson, B. Prog. Polym. Sci. 2007, 32, 1205-
1237.
(8) Zhang, H.; Han, J.; Yang, B. Adv. Funct. Mater. 2010, 20, 1533-1550.
(9) Corriu, R.; Mehdi, A.; Reyé, C. J. Organomet. Chem. 2004, 689, 4437-4450.
(10) Varadan, V. K. Proc. SPIE 2001, 4591, 28-38.
(11) Garg, D.; Zikry, M.; Anderson, G.; Smart Mater. Struct. 2001, 10, 610-623.
(12) Zielecka, M.; Bujnowska, E. Prog. Org. Coat. 2006, 55, 160-167.
(13) Saito, H.; Takai, K.; Takazawa, H.; Yamauchi, G. Mater. Sci. Res. Int. 1997, 3, 216-
219.
(14) Lazar, M. A.; Tadvani, J. K.; Tung, W. S.; Lopez, L.; Daoud, N. A. Innovations in thin
Film Processing and Characterization (ITFPC 2009). IOP Conference Series: Materials
Science and Engineering 2010, 12, 1.
(15) Wong, C. P.; Xu, J.; Zhu, L.; Li, Y.; Sun, Y.; Lu, J. ; Dong, H. Proceedings of the IEEE
CPMT Conference on High Density Microsystem Design, Packaging, and Failure
Analysis, 7th, Shanghai, China, June 27 – 30, 2005, 149.
(16) Barthlott, W.; Ehler, N.; Raster- Eletronenmikroskopie der Epidermis- Oberflachen von
Spermatophyten. Tropische und Subtropishe pflanzenwelt 1977, 19, 1-110.
20
(17) Crick, R. C.; Parkin, I. P. Chem. Eur. J. 2010, 16, 3568-3588.
(18) Xia, F.; Jiang, L. Adv. Mater. 2008, 20, 2842-2858.
(19) Lim, H. S.; Kwak, D.; Lee, D. Y.; Lee, S. G.; Choi, K. J. Am. Chem. Soc. 2007, 129,
4128-4129.
(20) Parkin, I. P.; Palgrave, R. G. J. Mater. Chem. 2005, 15, 1689-1695.
(21) Linsebigler, A. L.; Lu, G.; Yates, J. T. Chem. Rev. 1995, 95, 735-758.
(22) Mills, A.; Crow, M. J. Phys. Chem. C 2007, 111, 6009-6016.
(23) Kang, H.; Liu, H.; Phillips, J. A.; Cao, Z.; Kim, Y.; Chen, Y.; Yang, Z.; Li, J.; Tan, W.
Nano Lett. 2009, 9, 2690-2696.
(24) Amabilino, D. B. Chirality at the Nanoscale: Nanoparticles, Surfaces, Materials and
more; Wiley-VCH: Weinheim, 2009.
(25) Nagamani, S. A.; Nirikane, Y.; Tamaoki, N. J. Org. Chem. 2005, 70, 9304-9313.
(26) Liu, N. ; Chen, Z. ; Dunphy, D. ; Jiang, Y. ; Assink, R.; Brinker, C. Angew. Chem., Int.
Ed. 2003, 42, 1731-1734.
(27) Liu, N.; Dunphy, D. R.; Atanassov, P.; Bunge, S. D.; Chen, Z.; Lopez, G. P.; Boyle, T.
J.; Brinker, C. J. Nano Lett. 2004, 4, 551-554.
(28) Tao, X. Wearable Electronics and Photonics; Woodhead publishing Limited:
Cambridge, U. K., 2005.
(29) Westbrook, P.; Priniotakis, G. Intelligent/smart materials and textiles: an overview;
Woodhead publishing Limited: Cambridge, U. K., 2005.
(30) Lorenzini, E.; Sanmartin, J. Electrodynamic Tethers in Space; Scientific American
August 2004, 50-57.
(31) Coyle, S.; Wu, Y.; Lau, K.; Rossi, D. D. ; Wallace, G. ; Diamond, D. D. Smart
Nanotextiles : A Review of Materials and Applications ; MRS Bulletin, 2007, 32, 434.
(32) Mallory, G. O.; Hajdu, J. B., Eds.; Electroless Plating; AESF: Orlando, 1990.
(33) Vaia, R. A.; lee, J. W.; Wang, C.S.; Click, B.; Price, G. Chem. Mater. 1998, 10, 2030-
2032.
(34) Dong, H.; Fey, E.; Gandelman, A.; Jones, W. E. Chem. Mater. 2006, 18, 2008-2011.

21
(35) Little, B.; Li, Y.; Cammarata, G.; Mills, G. ACS Appl. Mater. Interfaces, preparing for
submission.
(36) Liu, X.: Chang, H.; Huck, W.; Zheng, Z. ACS Appl. Mater. Interfaces 2010, 2, 529-535.

22
II. INVESTIGATION OF REACTIVE PEROXIDES IN SULPHONATED POLY(ETHER
ETHERKETONE)/POLY(VINYL ALCOHOL) AQUEOUS POLYMER SOLUTIONS
Introduction
Photosensitive polymers are macromolecular materials that can utilize electromagnetic
radiation as a source of energy for a variety of transformations. These materials were initially
studied due to their ability to photoinitiate polymerizations,1 but they can also serve as key
components in holographic systems.2 Numerous investigations have focused on photochromic
polymers able to experience reversible property modifications when exposed to light including
switching behavior,3 structural alterations,
4 and conformational changes.
5 Polymers that exhibit
light-induced reversible color changes are also known.6,7
A different photosensitive
macromolecular system is based on blends of poly(vinyl alcohol), PVA, and sulfonated
poly(ether ether ketone), SPEEK.8 Photolysis of the blends with 350 nm photons yields -
hydroxy radicals from SPEEK; optical and EPR data have confirmed the identity of the
photoproducts. These observations can be rationalized on the basis of the known photochemistry
of benzophenone (BP) molecules.9 Illumination of BP produces a triplet (n, *) excited state able
to abstract an H-atom from alcohols, forming a -hydroxy radical of BP (known as a
benzophenyl ketyl (BPK) radical). The -hydroxy radical of the alcohol that is simultaneously
formed can reduce another BP molecule generating a second BPK radical. Thus, absorption of
one photon can yield up to two BPK radicals in solutions of BP.
A similar process explains the radical formation in the polymer system where BP groups of
SPEEK act as sensitizers whereas PVA functions as the H-atom donor. The overall
photochemical process in SPEEK/PVA blends is summarized by the reaction:
23
2{R'RC=O}z + hv + {CH2CHOH}y 2{R'RCOH}z + {CH2C=O}y (2-1)
where {R'RC=O}z represents SPEEK, {CH2CHOH}y corresponds to PVA, {R'RCOH}z
corresponds to the -hydroxy radical of SPEEK and {CH2C=O}y represents an oxidized PVA
molecule. Since both SPEEK and PVA are water soluble, casting methods together with
crosslinking procedures made possible the preparation of optically transparent films of the
blends. Thus, both aqueous solutions and thin films can serve as matrices to study reactions of
photogenerated SPEEK radicals. These radicals are strong reducing agents in solution with an
estimated oxidation potential of about -1.3 V.
8b Indeed, BPK radicals of SPEEK are able to
reduce a variety of metal ions forming nanometer-sized metallic particles in both liquid and solid
matrices.8 Polymeric BPK radicals decay in air-free solutions via second-order recombination
step with a rate constant of 290 M-1
s-1
, resulting in long lifetimes of about 30-40 min.8b
In
contrast, analogous -hydroxy radicals of PVA decay with rate constants of 1-7 x 10⁹ M
-1 s
-1 in
water.10
Electrostatic repulsions between the negatively charged SPEEK chains hinder reactive
collisions between the polymeric radicals, increasing their lifetime. Another contributing factor
is the slow radical diffusion in SPEEK/PVA solutions because their high PVA concentrations
results in a four fold viscosity increase as compared with that of water.
SPEEK radicals exhibit lifetimes of several hours when photogenerated inside films free of
O2 and persist for about 30 min when formed under air.8a
Reaction of typical -hydroxy radicals
(such as (CH3)2COH) with oxygen in water is essentially diffusion controlled with k = 4 x 10⁹
M-1
s-1
.11
In contrast, SPEEK radicals react with oxygen in films with an apparent first-order rate
constant of k2 = 1 x 10⁻³
s–1
probably due to the low O2 mobility in PVA,12
which is the solvent

24
in the solid matrices. Scavenging of SPEEK radicals by oxygen in the polymer films has been
represented by:8a
{R'RCOH}z + O2 {R'RC(OH)OO}z (2-2)
which results in an organic peroxyl radical. The proposed formation of peroxyl radicals seems
logical given that reaction of PVA radicals with O2 in solution yields analogous radical
intermediates that subsequently decay via elimination of HO2/O2-.13
Both of the latter radicals
form H2O2 through disproportionation reactions.14
Hence, photolysis of SPEEK/PVA films and solutions in the presence of O2 is expected to
yield H2O2. Support for such expectation is provided by earlier studies that reported generation
of the peroxide by illumination of air-saturated aqueous solutions containing BP or derivatives of
the ketone.15-17
Reduction of chemicals adsorbed on the surface of films by SPEEK radicals, in
competition with the H2O2 formation process, seemed possible given the long lifetime of the
radicals when photogenerated in the solid matrices under air. Strongly reducing radicals are
known to initiate transformations of halocarbons.18
Complete degradation of these materials
occurs in systems were the radicals are formed in the presence of H2O2, suggesting a synergistic
action of both reactive chemicals.19
This means that adsorption of chemicals on SPEEK/PVA
films would render them susceptible to degradation initiated via a combined attack of polymer
radicals and peroxide molecules.
Considerable interest exists presently in protective clothing that chemically inactivate toxic
compounds and pathogens.20
An example of such materials are ―self-cleaning fabrics‖
containing enzymes able to degrade organophosphorus compounds.21
A relevant fact is that

25
recent investigations demonstrated that methods based on H2O2 are highly effective for the
decontamination of several chemical warfare agents.22
Also, polymer films containing
chemically bonded BP molecules have been reported to exhibit antibacterial properties under
illumination.23
Qualitative tests indicated that BPK radicals and H2O2 were generated during
photolysis and the bactericidal activity was correlated to these reactive species. Thus, films of
SPEEK/PVA seem to exhibit properties relevant for the realization of ―self-cleaning surfaces‖, in
which the photogenerated reactive radicals and peroxide would act as agents for the degradation
of undesired materials present on the solid surface.
Reported here are kinetic data pertaining to the H2O2 formation in illuminated aqueous
solutions containing SPEEK and PVA. Such studies were preferred since methods for the
quantification of [H2O2] in solution are well established, and also because liquid phase reactions
are less constrained by diffusion restrictions that exist in the solid state. In fact, mechanistic
knowledge gained in solution investigations was considered crucial to understand the H2O2
photogeneration in polymer films that is currently being explored. The kinetics of H2O2
formation data is controlled by the photochemical excitation of the polymeric BP groups, not by
the chemistry of the radical intermediates.
Experimental
Poly(vinyl alcohol), 99+% hydrolyzed with an average molar mass of 8.9-9.8 x 10⁴ g/mol as
well as ammonium molybdate (VI) tetrahydrate were obtained from Aldrich. Poly(ether
etherketone) (PEEK) with an average molar mass of 4.5 x 10⁴ g/mol was a gift from Victrex, Inc
and served as a precursor of SPEEK. Hydrogen peroxide (30% v/v) was acquired from Fisher
Scientific and potassium hydrogen phthalate was from Matheson Coleman and Bell. All

26
solutions were prepared with purified water obtained through an ion-exchange resin deionizer
(US filter service). Preparation of SPEEK as well as of solutions containing this polymer and
PVA followed the procedures described in previous studies.8
Illuminations used modified Milton Roy # 33-17-80 optical test tubes able to withstand
the low temperatures (77 K) of the degassing processes.6,8
Unless otherwise stated, the optical
tubes containing air-saturated solutions were sealed with rubber septa for photolysis experiments.
Gas-tight syringes from Hamilton enabled extraction of samples from photolyzed solutions. A
freeze-pump-thaw method was utilized to eliminate oxygen from SPEEK/PVA solutions. The
vessels were back-filled with Ar to maintain a pressure of one atmosphere. Optical data was
collected on a Shimadzu UV-Vis 2501PC spectrophotometer. Photolysis experiments were
carried out inside a Rayonet 100 circular illuminator that generated photons with λ = 350 ± 15
nm by means of 16 RPR-3500A lamps; the light intensity (I0) was determined using the
Aberchrome 540 actinometer.24
Uniform illumination of the optical tubes was achieved by
positioning them at the center and mid-height of the cavity inside the Rayonet, where the
temperature was constant at 29 °C. All other measurements were conducted at room temperature
and each photochemical experiment was performed at least twice. Determinations of [H+]
employed a Radiometer PHM95 pH/ion meter in conjunction with an Accumet pH electrode.
Oxygen consumption was followed using a Hansatech Oxygraph instrument equipped
with a S1 Electrode Disc (Clark polarographic sensor). For these experiments the vessel
containing the polarographic sensor was filled with SPEEK/PVA solutions immediately after
their illumination inside the Rayonet. The top of this vessel was covered but not closed
completely because sealing this container with a septum increases the internal air pressure, which
augments the amount of O2 dissolved in solution. Since the vessel was not sealed, the lowest

27
oxygen reading was taken to be the O2 concentration present in the solution. Calibrations were
conducted using non-illuminated SPEEK/PVA samples. Detection of hydrogen peroxide was
conducted via the molybdenum-triiodide method using an extinction coefficient of = 2.64 x 10⁴
M-1
cm-1
.25
This procedure employs a solution containing 0.398 M KI, 1.7 x 10⁻⁴
M ammonium
molybdate, and 0.06 M NaOH together with another consisting of 0.098 M potassium
biphthalate. Equal amounts of the two solutions were mixed under stirring inside 1 cm quartz
optical cells, followed by addition of a small aliquot of photolyzed sample and deionized water
to yield a total volume of 3 mL. This method enabled to carry out kinetic runs using low
volumes of SPEEK/PVA solutions. Quantifications of [H2O2] via the I3- procedure exhibited a
typical error of 10% in water but deviations of 30% were observed in SPEEK/PVA solutions.
Results and Discussion
Exposure to 350 nm photons of air-saturated solutions containing 0.36 M PVA and 0.018 M
SPEEK (both molarities are expressed in terms of the monomer units) yielded no color change of
the liquids. This contrasts with the results obtained with degassed solutions, where an optical
signal centered at max = 565 nm corresponding to the SPEEK radical (or SPEEK) is promptly
detected.8 Analysis of the photolyzed solutions for H2O2 using the method described above
yielded yellow solutions due to the formation of I3- ions. Shown in Figure 2-1 are optical spectra
resulting from exposure of illuminated solutions to the iodide-molybdate reagent. An
absorbance centered at max = 370 nm is observed that increases in intensity as illumination
progresses. This signal is shifted to longer wavelengths as compared with the absorption of I3- in
water that exhibits a maximum at 350 nm.25
However, red-shifts of the triiodide spectrum and
decreases in the value occur when alcohols are added to aqueous solutions of I3-.26

28
Consequently, the shift in the max value depicted in Figure 2-1 can be understood considering
the very large [PVA] present in the polymer solutions. The data of Figure 1 clearly demonstrates
that peroxide is formed upon photolysis of SPEEK/PVA solutions containing air. Repeated
attempts to determine the extinction coefficient of I3- in the polymer solutions yielded results
equal to or lower by 20% than the well known value in water, = 2.64 x 10⁴ M
-1 cm
-1.25
Given
such erratic results all calculations of [H2O2] in polymer solutions used the value obtained in
H2O. This method underestimated the efficiency of the photoreaction, meaning that the reported
quantum yields of H2O2 generation represent lower limits.
0
0.1
0.2
0.3
0.4
0.5
0.6
0.7
350 400 450 500 550
Wavelength (nm)
Ab
s.
y = 2E-07x + 2E-07
R2 = 0.9974
0.0E+00
5.0E-06
1.0E-05
1.5E-05
2.0E-05
2.5E-05
0 50 100 150
Time (s)
Ab
s./ε
Figure 2-1. Optical spectra obtained after analysis with the iodide-molybdate method on air-
saturated solutions at pH 7 containing 0.018 M SPEEK and 0.36 M PVA photolyzed in a closed
vessel. Bottom to top: samples irradiated with 350 nm light, I0 = 4.9 x 10⁻⁵
M(hν)/s, for 30 s, 60
s, 90 s and 120 s. Inset: plot of absorbance at 370 nm divided by as a function of irradiation
time.

29
As shown in the inset of Figure 2-1 the absorbance at 370 nm varies in a linear fashion for short
illumination times. While H2O2 reacts fast with I-, organic peroxides oxidize iodide much slower
resulting in a delayed formation of I3-.25
No slow formation of the optical signal from I3- was
noticed, meaning that stable organic peroxide species are not produced upon illumination of
SPEEK/PVA solutions. This, in turn, implies that H2O2 is formed quickly after the decay of the
peroxyl radical resulting from reaction 2-2.
Experiments were performed in order to establish the relationship between the rates of H2O2
formation and of O2 consumed. For this purpose, an aliquot of the photolyzed sample was
immediately analyzed for [O2] and the peroxide concentration was determined simultaneously.
Results of these measurements are shown in Figure 2-2. According to the polarographic results
0.00E+00
5.00E-05
1.00E-04
1.50E-04
2.00E-04
2.50E-04
3.00E-04
0 200 400 600 800 1000 1200 1400
Irradiation Time (s)
[O2]
or
[H2O
2], M
Figure 2-2. Plot of the concentrations of O2 () and H2O2 () as a function of irradiation time.
The aqueous air-saturated solutions containing 0.36 M PVA and 0.018 M SPEEK at pH 7 were
illuminated in an open vessel with 350 nm light, I0 = 1.6 x 10⁻⁵
M(hν)/s.

30
the saturation concentration of O2 in neutral SPEEK/PVA solutions is 0.27 mM, close to the
value obtained in water. Formation of peroxide occurs with an initial rate of r i = 2.7 x 10⁻⁷
M/s
whereas the ri value for O2 consumption amounts to 2 x 10⁻⁷
M/s. In addition both [H2O2] and
[O2] reach a value close to one half of the initial oxygen concentration at about 190 s of
photolysis. The results indicate that O2 reduction and H2O2 formation take place in a
synchronous fashion and confirm that no stable organic peroxides are formed as intermediates.
After 200 s the rates of both processes decrease and a maximum in [H2O2] is reached at about
300 s, after which consumption of peroxide takes place. These findings clearly indicate that
reduction of the peroxide by SPEEK starts competing with reaction 2-2 once [H2O2] becomes
close to [O2].
The data shown in Figure 2-2 seems to indicate that a slight delay of about 70 s occurs during
the decay of [O2]. This phenomenon originates because of the low sensitivity of the
polarographic sensor to small [O2] changes and also because of oxygen diffusion into the vessel
where the measurements take place. Small air leaks into the photolyzed solutions are inevitable
given that the vessel was not sealed, which results in an artificial delay in the oxygen
consumption. To confirm this interpretation an experiment was performed in which the
polarographic vessel containing an SPEEK/PVA solution under air was placed inside the
Rayonet and irradiated, the results are presented in Figure 2-3. Reduction of oxygen starts as
soon as the light exposure is started and progresses initially in a linear fashion with time but the
rate of O2 decay decreases after about 2700 s. Also, an increase in [O2] occurs after photolysis is
stopped, supporting the interpretation that the delay in oxygen reduction noticed in Figure 2-2
results from small air leaks. Shown in Figure 2-4 is the initial data collected when the
polarographic cell containing an air-saturated SPEEK/PVA solution was place and irradiated

31
0
50
100
150
200
250
300
0 500 1000 1500 2000 2500 3000 3500 4000 4500
Irradiation Time (s)
[O2]
x 1
0-6
M
Figure 2-3. Evolution of [O2] during an experiment in which the polarographic cell containing 1
mL of an air-saturated solution with 0.018 M SPEEK and 0.36 M PVA at pH 7 was placed inside
the Rayonet and irradiated continuously with 350 nm photons, I0 = 3.01 x 10⁻⁵
M(hν)/s.
inside the illuminator. Under these conditions the initial rate of oxygen consumption amounts to
4 x 10⁻⁷
M/s and is twice the ri value derived from the data of Figure 2-2 because a two times
higher light intensity was used in the experiment of Figure 2-4. Depicted in Figure 2-5 are
kinetic data collected at short times when air-saturated SPEEK/PVA solutions were exposed to
different light intensities. In all cases [H2O2] increased linearly with time with initial quantum
yields of peroxide formation, i(H2O2), ranging between 0.021 and 0.017. The fact that i(H2O2)
was fairly constant at all light intensities means that the rate of peroxide formation is first-order
with respect to I0. Benzophenone molecules are known to generate singlet oxygen 1O2 via
quenching of their triplet (n, *) excited state by triplet oxygen.9 Therefore, experiments were
Photolysis
Dark

32
y = -4E-07x + 0.0011
R2 = 0.9995
2.20E-04
2.25E-04
2.30E-04
2.35E-04
2.40E-04
2.45E-04
2.50E-04
2.55E-04
2.60E-04
2.65E-04
2.70E-04
2360 2380 2400 2420 2440 2460 2480
Irradiation Time (s)
[O2],
M
Figure 2-4. Initial decay of [O2] during the experiment in which the polarographic cell containing
1 mL of an air-saturated solution with 0.018 M SPEEK and 0.36 M PVA at pH 7 was placed
inside the Rayonet and irradiated continuously with 350 nm photons, I0 = 3.01 x 10⁻⁵
M(hν)/s.
performed to ascertain if the formation of H2O2 originated from chemical reactions initiated by
1O2. A priori involvement of singlet oxygen in the photogeneration of H2O2 seemed unlikely
given that water deactivates 1O2 in a few s via physical quenching.
27 Quantification of [
1O2] in
aqueous solutions can be accomplished by a method based on the reaction of singlet oxygen with
I- to form triiodide ions.
28 The data of Figure 2-6 shows that [
1O2] increased linearly at short
irradiation times for solutions containing 5.8 x 10⁻⁴
M SPEEK with and without PVA, but
deviations from this behavior were noticed as the illumination progressed. Because of the low
concentration of SPEEK employed in these experiments only half of the photon flux entering the
optical cell was absorbed by the polyketone (350 = 900 M-1
cm-1
).8b
After correcting for the

33
0.0E+00
2.0E-05
4.0E-05
6.0E-05
8.0E-05
1.0E-04
1.2E-04
1.4E-04
0 20 40 60 80 100 120 140
Irradiation Time (s)
[H2O
2], M
16 Bulbs
12 Bulbs
8 Bulbs
4 Bulbs
Figure 2-5. Plots of [H2O2] versus irradiation time at different light intensities obtained from
photolysis with 350 nm light of air-saturated solutions containing 0.018 M SPEEK and 0.36 M
PVA at pH 7 in a closed system.
lower photon absorption by SPEEK, initial quantum yields for the 1O2 formation of 5 x 10
-4 and
1.1 x 10⁻³
result for the experiments with and without PVA, respectively. The presence of PVA
decreases the efficiency of 1O2 generation because the polyol competes with O2 for the
photogenerated triplet states of SPEEK, 3{SPEEK}*. At any rate, the initial quantum yields of
1O2 formation are 10 to 20 times lower than the i(H2O2) values derived from Figure 2-5,
indicating that singlet oxygen plays no significant role in the photoreduction of O2.
Shown in Figure 2-7 is the evolution of [H2O2] over longer periods of illumination. In all
cases the solutions were not stirred in order to gain insight about the mechanism of peroxide
formation under conditions that mimic somewhat the photochemical reactions taking place on

34
y = 2E-06x + 6E-07
R2 = 0.9903
y = 9E-07x + 3E-07
R2 = 0.9951
0.0E+00
1.0E-06
2.0E-06
3.0E-06
4.0E-06
5.0E-06
6.0E-06
7.0E-06
8.0E-06
9.0E-06
0 1 2 3 4 5 6
Irradiation Time (min)
[1O
2]
Figure 2-6. Evolution of [1O2] with irradiation time measured for air-saturated solutions at pH 6
containing 0.398 M KI and 5.8 x 10⁻⁴
M SPEEK with 0.012 M PVA, λmax = 362 nm () and
without PVA, λmax = 367 nm (). Photolysis were performed on 1 cm optical cells using an
intensity of 350 nm photons equal to 3.1 x 10⁻⁵
M(hν)/s.
film surfaces. A surprising observation is that the evolution of [H2O2] as a function of time at
constant I0 is very similar for both solutions that are open to air and those that are not.
The fact that the ri values of peroxide formation are identical is not unexpected given that the
initial oxygen concentrations are the same for both systems. In contrast to the observations,
solutions exposed to air throughout the illumination were anticipated to display a maximum
[H2O2] different from that of closed systems. The assumption was that replenishment of
consumed O2 would be faster in solutions open to air than in closed systems. Also, the rate of
peroxide consumption at longer exposure times measured in an open system (1.0 x 10⁻⁷
Ms-1
) is
only 40% lower than the value obtained for closed solutions (1.7 x 10⁻⁷
Ms-1
). Continuous

35
exposure to air was anticipated to delay the consumption of peroxide significantly and to
eventually yield a steady state concentration of oxygen where the rates of O2 consumption and of
0.0E+00
2.0E-05
4.0E-05
6.0E-05
8.0E-05
1.0E-04
1.2E-04
1.4E-04
0 10 20 30 40 50 60 70
Irradiation Time (min)
[H2O
2]
Closed Sys. Unst.
Open Sys. Unst.
Open Sys. (1/2 LightIntensity) Unst.
Figure 2-7. Plot of [H2O2] versus irradiation time determined using air-saturated aqueous
solutions in closed and opened vessels containing 0.018 M SPEEK and 0.36 M PVA at pH 7.
Illumination with 350 nm photons in closed system unstirred () and open system unstirred (),
I0 = 4.2 x 10⁻⁵
M(hν)/s. Photolysis of an open system at one half the light unstirred () with I0 =
1.9 x 10⁻⁵
M(hν)/s. Lines between data points are not fits, but are present as a guide.
gas diffusion into the solution would equal. Obviously, such situation was not possible in the
case of closed systems. However, the data of Figure 2-7 indicates that diffusion of O2 from the
gas phase is unable to compete with the speed of the oxygen reduction process at high light
intensities. This results in a complete consumption of H2O2 at long illumination times in both
systems. Hence, once [O2] decreases substantially and the instantaneous radical concentration
surpasses that of oxygen, any molecules of the gas diffusing into the solution are reduced fast to

36
H2O2 and the resulting H2O2 is also transformed promptly to water. Under those conditions light
acts in a way similar to degassing the solutions, where oxygen is quickly reduced to H2O before
the gas can diffuse into the bulk of the liquid phase.
Support for this interpretation is provided by the kinetic data gathered from a solution open to
air using half the light intensity. Under these conditions, not only is the initial rate of peroxide
formation 83 % smaller (1.7 x 10⁻⁷
Ms-1
), but the maximum [H2O2] occurs at longer times and
the decay of the peroxide is never complete within the illumination periods employed in these
experiments. Although the proposed explanation is able to rationalize the findings presented in
Figure 2-7, stirring the solutions during photolysis yields some surprising data. Namely, [H2O2]
continued to increase up to 0.17 mM and then leveled off when solutions in open systems
illumination were stirred using high light intensities. Photolysis under stirring of closed systems
containing air, or of a stirred closed system but saturated with O2 exhibited a continuous increase
in peroxide concentration up to a value of 0.3 mM. However, the value of ri was the same in all
cases including the high intensity experiments of Figure 2-7.
The fact that ri remains unchanged means that zero-order conditions prevail in all these
experiments because at the beginning of the photoreactions [O2] >> [SPEEK•] and the BPK
radicals are generated at a constant rate. Given that under such conditions enough oxygen is
available to scavenge all the photogenerated radicals, the rate of peroxide formation is controlled
by the rate of SPEEK• formation and is unaffected by stirring. A higher maximum in [H2O2]
occurs in open systems because agitating the solutions improves mass transfer. The larger
maxima noticed in stirred but closed systems either saturated with air of with O2 seems puzzling.
However, measurements on the air pressure in tubes sealed with rubber septa yielded interesting
results. One set of determinations consisted of equilibrating against atmospheric pressure the

37
plunger a gas-tight syringe pierced through the septa. In the other set the vessel containing the
polarographic sensor was sealed with septa. Gas pressures ranging between 2 and 2.6 atm were
0
0.005
0.01
0.015
0.02
0.025
4 5 6 7 8 9 10 11 12
pH
Øi
Figure 2-8. Dependence of Øi(H2O2) () and Øi(SPEEK•) () on the solution pH. Øi(H2O2)
determinations were carried using air-saturated solutions containing 0.018 M SPEEK and 0.36 M
PVA stirred in closed systems. Øi(SPEEK•) values were obtained from similar solutions that
were degassed but not stirred. Photolysis with 350 nm light, I0 = 5.3 x 10⁻⁵
M(hν)/s.
determined, meaning that [O2] similar to that of solutions saturated with oxygen were prevalent
in closed systems containing air. The higher concentrations of oxygen present in the closed, air-
saturated systems enabled O2 to outcompete H2O2 for SPEEK•.
Illustrated in Figure 2-8 is the dependence of i(H2O2) on solution pH showing that the O2
photoreduction was most efficient between pH values of 8 and 9. Included in this figure are
initial quantum yields for the formation of polymer radicals, i(SPEEK•) that were obtained in
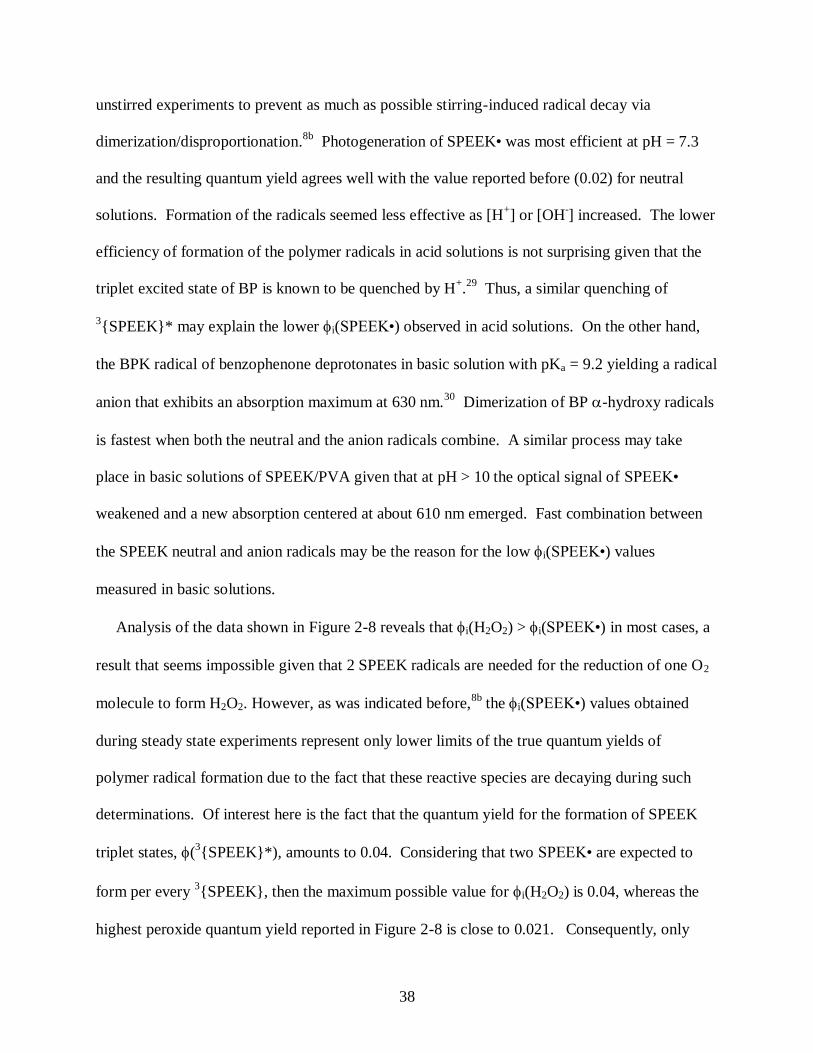
38
unstirred experiments to prevent as much as possible stirring-induced radical decay via
dimerization/disproportionation.8b
Photogeneration of SPEEK• was most efficient at pH = 7.3
and the resulting quantum yield agrees well with the value reported before (0.02) for neutral
solutions. Formation of the radicals seemed less effective as [H+] or [OH
-] increased. The lower
efficiency of formation of the polymer radicals in acid solutions is not surprising given that the
triplet excited state of BP is known to be quenched by H+.29
Thus, a similar quenching of
3{SPEEK}* may explain the lower i(SPEEK•) observed in acid solutions. On the other hand,
the BPK radical of benzophenone deprotonates in basic solution with pKa = 9.2 yielding a radical
anion that exhibits an absorption maximum at 630 nm.30
Dimerization of BP -hydroxy radicals
is fastest when both the neutral and the anion radicals combine. A similar process may take
place in basic solutions of SPEEK/PVA given that at pH > 10 the optical signal of SPEEK•
weakened and a new absorption centered at about 610 nm emerged. Fast combination between
the SPEEK neutral and anion radicals may be the reason for the low i(SPEEK•) values
measured in basic solutions.
Analysis of the data shown in Figure 2-8 reveals that i(H2O2) > i(SPEEK•) in most cases, a
result that seems impossible given that 2 SPEEK radicals are needed for the reduction of one O2
molecule to form H2O2. However, as was indicated before,8b
the i(SPEEK•) values obtained
during steady state experiments represent only lower limits of the true quantum yields of
polymer radical formation due to the fact that these reactive species are decaying during such
determinations. Of interest here is the fact that the quantum yield for the formation of SPEEK
triplet states, (3{SPEEK}*), amounts to 0.04. Considering that two SPEEK• are expected to
form per every 3{SPEEK}, then the maximum possible value for i(H2O2) is 0.04, whereas the
highest peroxide quantum yield reported in Figure 2-8 is close to 0.021. Consequently, only

39
about 50% of the photogenerated SPEEK radicals are reducing O2. Support for this conclusion is
provided by results from studies of SPEEK• reactions by Ag+ ions, which can scavenge about
80%
of the photogenerated polymer radicals.8b
Generation of H2O2 via free radicals usually involves HO2/O2- as intermediates and the
formation process is controlled by the disproportionation of the peroxyl species.14
The
disproportionation involving one HO2 and one O2 is fastest and reaches a maximum rate at pH
= 4.8, which is the pKa for HO2. Inspection of Figure 2-8 reveals that i(H2O2) reaches
maximum values at pH > 4.9, meaning that the photogeneration of peroxide in SPEEK/PVA
solutions is not governed by the reaction kinetics of the peroxyl radicals. This analysis supports
the notion that the photochemical process that generates the SPEEK• radicals controls the rate of
H2O2 formation. The following mechanism is consistent with the experimental results:
{R'RC=O}z + hv + {CH2CHOH}y {R'RCOH}z + {CH2COH}y (2-3)
{R'RC=O}z + {CH2COH}y {R'RCOH}z + {CH2C=O}y (2-4)
{R'RCOH}z + O2 {R'RC(OH)OO}z (2-5)
{R'RC(OH)OO}z {R'RC=O}z + HO2 (2-6)
HO2 H+ + O2
- (2-7)
HO2 + H+ + O2
- H2O2 + O2 (2-8)
Reaction 2-5 is identical to reaction 2-2.
Examination of the results presented in Figures 2-2 and 2-7 reveals that a maximum in the
peroxide concentration usually occurs when [H2O2] = [O2] = ½ [O2]0, where [O2]0 is the initial

40
oxygen concentration. Based on these results the logical conclusion is that at the time the
maximum takes place, rate(O2 consumption) = rate(H2O2 consumption)
The obvious conclusion is that k(O2 consumption) = k(H2O2 consumption), but this is incorrect.
For instance, in the case of (CH3)2COH, the -hydroxy radical derived from 2-propanol,11
k{(CH3)2COH + O2} = 4 x 10⁹ M
-1 s
-1
k{(CH3)2COH + H2O2} = 5 x 10⁵ M
-1 s
-1
Although the SPEEK radical is expected to react slower than (CH3)2COH, a logical
assumption is that the differences in reactivity would be similar for both radicals. In addition,
reduction of H2O2 by -hydroxy radicals can lead to chain reactions.6a
Considering the much lower rate constant for the reduction of H2O2 by (CH3)2COH than the
reaction with oxygen, an obvious path that would lead to equal rates of oxygen and peroxide
consumptions involves a radical chain process. The following mechanism can describe
qualitatively such chain reaction:
{R'RCOH}z + H2O2 {R'RC=O}z + OH + H2O (2-9)
OH + {CH2CHOH}y H2O + {CH2COH}y (2-10)
and
{R'RC=O}z + {CH2COH}y {R'RCOH}z + {CH2C=O}y (2-4)
Evidence in favor of such mechanism was obtained via photolysis, in a sealed vessel, of a
degassed SPEEK/PVA solution containing 0.1 mM H2O2. A short illumination generated a

41
small amount (several M) of SPEEK radicals that initiated the chain process via reaction 2-9.
The net result was complete consumption of the peroxide in about 15 min and optical
measurements showed that a constant [SPEEK•] persisted during this process.
Conclusions
The results gathered in the present investigation demonstrate that H2O2 is generated in
solutions of SPEEK/PVA that contained air. Formation of the peroxide occurs in a synchronous
fashion with the consumption of oxygen. The kinetic data is consistent with a mechanism in
which the rate-determining step is the photochemical process that generates the polymeric
SPEEK radicals. Maximum rates of peroxide formation are obtained in neutral solutions, which
suggest that efficient formation of H2O2 on the surface of SPEEK/PVA fibers is feasible. The
decay of H2O2 that takes place at low oxygen concentrations in solution is not expected to occur
in the case of the fibers due to the high and constant [O2] that prevail on the surface of these
polymeric materials.

42
References
(1) Carlini, C.; Angiolini, L.; Caretti, D.; Corelli, E. Polym. Advanced Technol. 1996, 7, 379-
384.
(2) Gu, C.; Xu, Y.; Liu, Y.; Pan, J. J.; Zhou, F.; He, H. Optical Mater. 2003, 23, 219-227.
(3) Tian, H.; Yang, S. Chem. Soc. Rev. 2004, 33, 85-97.
(4) Ercole, F.; Davies, T. P.; Evans, R. A. Polym. Chem. 2010, 37, 37-54.
(5) Irie, M.: Ikeda, T. In Functional Monomers and Polymers; Takemoto, K.; Ottenbrite, R. M.;
Kamachi, M. Eds.; Marcel Dekker: New York, 1997; p. 65-116.
(6) (a) Malone, K.; Weaver, S.; Taylor, D.; Cheng, H.; Sarathy, K. P.; Mills, G. J. Phys. Chem. B
2002, 106, 7422-7431. (b) Weaver, S.; Taylor, D.; Gale, W.; Mills, G. Langmuir 1996, 12, 4618-
4620.
(7) Organic Photochromic and Thermochromic Compounds; Crano, J; R. Guglielmetti, R., Eds.;
Kluwer Academic/Plenum Publishers: New York, 1999; Vol. 2.
(8) (a) Korchev, A. S. ; Konovalova, T.; Cammarata, V.; Kispert, L.; Slaten, B. L.; Mills, G.
Langmuir 2006, 22, 375-384. (b) Korchev, A. S.; Shulyak, T. S.; Slaten, B. L.; Gale, W. F.;
Mills, G. J. Phys. Chem. B 2005, 109, 7733-7745. (c) Korchev, A. S.; Sartin, M.; Mills, G.; B. L.
Slaten, B. L.; Gale, W. F. In Clusters and Nano-Assemblies: Physical and Biological Systems;
Jena, P.; Khanna, S. N.; Rao, B. K.; Eds, World Scientific Publishing Co.: Singapore, 2005; 371-
377. (d) Korchev, A. S.; Bozak, M. J.; Slaten, B. L.; Mills, G. J. Am. Chem. Soc. 2004, 126, 10-
11.
(9) Gilbert, A.; Baggott, J. Essentials of Molecular Photochemistry; CRC Press: Boca Raton,
1991; Chapter 7.
(10) Ulanski, P.; Bothe, K.; Rosiak, J. M.; von Sonntag, C. Macromol. Chem. Phys. 1994, 195,
1443-1461.
(11) Neta, P.; Grodkowski, J.; Ross, A. B. J. Phys. Chem. Ref. Data 1996, 25, 709-1050.
(12) Lien, L.; Fellows, C. M.; Copeland, L.; Hawkett, B. S.; Gilbert, R, G. Aust. J. Chem. 2002,
55, 507.
(13) von Sonntag, C.; Bothe, E.; Ulanski, P.; Adhikary, A. Radiat. Phys. Chem. 1999, 55, 599-
603.
(14) Bielski, B. H.; Cabelli, D. E.; Arudi, R. L.; Ross, A. B. J. Phys. Chem. Ref. Data 1985, 14,
1041-1100.

43
(15) Görner, H. Photochem. Photobiol. 2006, 82, 801-808.
(16) Radschuwelt, A.; Rüttinger, H.-H.; Nuhn, P.; Wohlrab, W.; Huschka, C. . Photochem.
Photobiol. 2001, 73, 119-127.
(17) Pitts, Jr., J. N.; Letsinger, R. L.; Taylor, R. P.; Patterson, J. M.; Recktenwald, G.; Martin, R.
B. J. Am. Chem. Soc. 1959, 81, 1068-1077.
(18) (a) Winkelmann, K.; Calhoun, R. L.; Mills, G. J. Phys. Chem. A 2006, 110, 13827-13835.
(b) Calhoun, R. L.; Winkelmann, K.; Mills, G. J. Phys. Chem. B 2001, 105, 9739-9746. (c)
Weaver, S.; Mills, G. J. Phys. Chem. 1997, 101, 3769-3775.
(19) Gonzalez, M. C.; Le Roux, G. C.; Rosso, J. A.; Braun, A. M. Chemosphere 2007, 69, 1238-
1244.
(20) Schreuder-Gibson, H.; Truong, Q.; Walker, J. E.; Owens, J. R.; Wander, J. D.; Jones, Jr., W.
E. MRS Bulletin 2003, 574-578.
(21) Singh, A.; Lee, Y.; Dressick, W. J. Adv. Mater. 2004, 16, 212-215.
(22) (a) Wagner, G. W.; Sorrick, D. C.; Procell, L. R.; Brickhouse, M. D.; Mcvey, I. F.;
Schwartz, L. I. Langmuir 2007, 23, 1178-1186. (b) Wagner, G. W.; Yang, Y.-C. Ind. Eng. Chem.
Res. 2002, 41, 1925-1928.
(23) (a) Hong, K. H.; Sun, G. J. Appl. Polym. Sci. 2009, 112, 2019-2026. (b) Hong, K. H.; Sun,
G. J. Appl. Polym. Sci. 2008, 109, 3173-3179. (c) Hong, K. H.; Sun, G. Polym. Eng. Sci. 2007,
47, 1750-1755.
(24) Heller, H. G.; Langan, J. R. J. Chem. Soc., Perkin Trans. 2 1981, 341-343.
(25) Kormann, C.; Bahnemann, D. W.; Hoffmann, M. R. Environ. Sci. Technol. 1988, 22, 798-
806.
(26) Stefanic, I.; Asmus, K.-D.; Bonifacic, M. Phys. Chem. Chem. Phys. 2003, 5, 2783-2789.
(27) Wilkinson, F.; Brummer, J. G. J. Phys. Chem. Ref. Data 1981, 10, 809-999.
(28) Mosinger, J.; Mosinger, B. Experientia 1995, 51, 106-109.
(29) Ramseier, M.; Senn, P.; Wirz, J. J. Phys. Chem. A 2003, 107, 3305-3315.
(30) Beckett, A.; Porter, G. Trans. Faraday Soc. 1963, 59, 2038-2050.
44
III. PROBING REACTION MECHANISMS RELEVANT TO THE HIGH ENERGY
CHEMISTRY OF NITROMETHANE
Introduction
Energetic materials (EM) able to modify their sensitization to initiation via some type of
external stimulus (light, temperature, electric field) are attractive as explosives containing
additional safety features. For example, this type of explosive could be remotely deactivated if
the munition was in enemy hands or if left behind in the battle field, thus eliminating the need to
transport or disarm the EM before departing an active military zone. In most military
applications, initiation of EM is induced by a high impact shock wave that compresses and heats
molecules within the EM, thus priming the molecular environment for fast thermal
decomposition. In general, the shock wave is the ―trigger‖, which begins the initiation of the EM
towards detonation. Detonation or detonation fronts are created due to the rapid release of
exothermic energy at supersonic speeds, which accelerate and overtake the initial propagating
shock front within the medium.1 Initiations of explosives, more specifically explosive molecules,
follow a chain decomposition reaction believed to begin with bond dissociation (induced by the
high pressure of the shock wave) and ultimately followed by hot gaseous byproducts (CO2, H2O,
N2, CO, etc.)2. Ultimately, control over the sensitivity of munitions is a real concern for the
handler as well as how the material has to be stored, thus the ability to modify the sensitivity of
an explosive is very important.
For detonation of heterogeneous liquids, the shock wave enters the EM and adiabatically
compresses voids (bubbles, hollow glass beads, polymer foams) filled with entrapped gases
causing areas of local heating, so called ―hot spots‖. For heterogeneous solids, hot spots are

45
thought to be formed through mechanical or electrical disruption (friction, shear, distortion, pile-
up, etc) of localized voids. These hot spots reach extreme temperatures capable of inducing
thermal decomposition of neighboring molecules that can expand/coalesce into a propagating
wave of hot gases and pressure. This propagating wave can become a deflagration (fast burning)
wave traveling at subsonic speeds or a detonation wave (shock wave that is chemically driven)
traveling at supersonic speeds. Ultimately this detonation wave overcomes the original shock
wave and amplifies the thermal decomposition reaction of energetic molecules to the point of
extreme temperatures and pressures resulting in an explosion. It is worthy to note that the
detonation mechanism for heterogeneous liquids has been reported to follow a somewhat
different path, albeit similar to the above description, where hot spot formation is generated at
pre-shocked cavities impacted by a jet stream, which then rapidly undergo adiabatic compression
forming a detonation wave propagating to an explosion.3
Nonetheless, hot spots play a critical
role in the initiation thresholds (i.e. sensitivity) of EM.
Of particular interest to this work are sensitized liquid EM such as nitromethane, CH3NO2.
Sensitization of such EM typically involves the addition of a powder or fine particulate material
that is used to create voids that aid in the initiation or propagation of the detonation wave. For
CH3NO2, sensitizers such as active EM (RDX, ammonium nitrate) or non-active materials
(aluminum, copper, fumed silica, boron carbide, air bubbles, hollow microballoons, etc.) can be
added to induce detonation at lower pressures and temperatures than what is required in neat
CH3NO2.4, 5, 6
Earlier studies reported that sensitization of liquid EM, in the presence of gas-
filled cavities, required hot spots within the diameter range of 0.1 µm to 10 µm in order to
achieve ignition.7 However, others report that hot spots can be much smaller as long as they are
able to initiate the thermal decomposition of just a few neighboring molecules under adiabatic
46
compression.8 Nonetheless, many mechanisms have been proposed for the formation of hot spots
and their sequential steps in initiating an EM. The reason that multiple mechanisms have been
reported for the same fundamental sensitization event is due in part to the difficulty in measuring
the reaction mechanism under high strain rates (within the shock wave) as well as the fact that
different techniques (experimental set-up, measurement conditions) employed to investigate this
phenomenon are not easily comparable e.g. thermal sensitization by temperature/laser
irradiation, compression by a shockwave, etc. Additionally, recent observations on the
detonation mechanisms governing EM by Ramaswamy suggests that coalescence of many
smaller ―reactions‖ sites is an alternative pathway for hot spot formation.9 In the previous work,
the author describes the formation of micron scale hot spots originating from reactions sites on
the nanometer scale (submicron). Their findings suggest that hot spots begin when adjacent
molecules are triggered (compressed by a shock wave, irradiated with a laser) into
decomposition at the atomic/molecular level. From this point, hot byproducts of the
decomposing molecules swiftly migrate into nanometer reaction sites along interfaces (solid-
liquid, solid-gas, and liquid-gas). Finally, coalescence of the reaction sites into micron size hot
spots are generated leading to sensitization. Given this mechanism for hot spot formation and
many others, a need for novel experimental designs are required to unravel evidence that might
support or dismiss these models and provide greater insight and understanding to this
phenomenon.
Conclusive evidence for the model proposed by Ramaswamy for hot spot formation is still
lacking given that none of the previously employed EM can clearly distinguish between
conventional hot spot formation and the coalescence mechanisms for hot spot formation. Liquid
homogenous EM, which do not contain voids, are well suited to test the occurrence of the

47
coalescence mechanism. The challenge is to produce a system where reaction sites are possible
only along liquid-gas interfaces originating from bubbles dispersed in the fluid phase, yet the
fusion of the bubbles must be suppressed to prevent their thermodynamically favored growth.
Therefore, stable dispersions of nanometer-sized gas bubbles in liquid explosives are required to
verify experimentally the coalescence mechanism. Meeting these requirements has proven to be
difficult mainly due to the inability to embed and sustain nanometer size gas bubbles in a liquid
EM.
In this work we proposed that photoresponsive nanoporous (PN) materials, shown below,
would be an ideal system to test the coalescence mechanism. As mentioned above, CH3NO2 is
considered a safe industrial solvent used in many applications, however it can be readily
detonated when µm size gas bubbles are added as sensitizing agents to facilitate hot spots
formation.3, 5
The central idea in this work is to use PN materials as the sensitizing agent for
CH3NO2 via the mechanism involving coalescence of reaction sites.
In accordance to hot spot theory, sensitization of CH3NO2 with the addition of this
photoresponsive material could be switch between a coalesced void state (pores filled with
CH3NO2) to a non-sensitizing state (voids empty) by exposure to light. Such materials have been
made as films consisting of a ~260 nm thick mesoporous silica framework possessing
interconnected pores with an diameter of 3.2 nm, separated by 2.4 nm thick SiO2 walls.10
Attached to the pore walls are azobenzene ligands that undergo trans-to-cis-isomerization upon
exposure to 350-360 nm photons; the reverse reaction occurs with heat or under illumination
with λ > 420 nm.
Shown in Figure 3-1 (from ref. 10a) is a cross-sectional representation of the pores before and
after the photoisomerization takes place. As depicted on the left of Fig. 3-1, interaction of
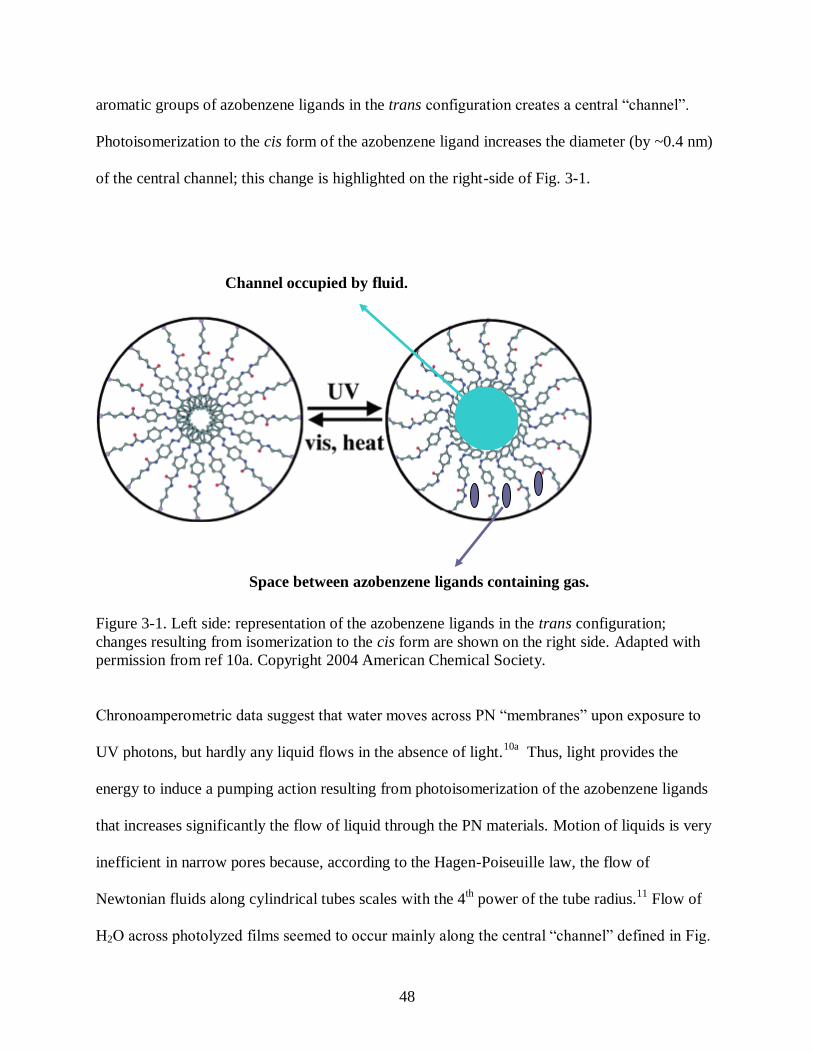
48
aromatic groups of azobenzene ligands in the trans configuration creates a central ―channel‖.
Photoisomerization to the cis form of the azobenzene ligand increases the diameter (by ~0.4 nm)
of the central channel; this change is highlighted on the right-side of Fig. 3-1.
Figure 3-1. Left side: representation of the azobenzene ligands in the trans configuration;
changes resulting from isomerization to the cis form are shown on the right side. Adapted with
permission from ref 10a. Copyright 2004 American Chemical Society.
Chronoamperometric data suggest that water moves across PN ―membranes‖ upon exposure to
UV photons, but hardly any liquid flows in the absence of light.10a
Thus, light provides the
energy to induce a pumping action resulting from photoisomerization of the azobenzene ligands
that increases significantly the flow of liquid through the PN materials. Motion of liquids is very
inefficient in narrow pores because, according to the Hagen-Poiseuille law, the flow of
Newtonian fluids along cylindrical tubes scales with the 4th power of the tube radius.
11 Flow of
H2O across photolyzed films seemed to occur mainly along the central ―channel‖ defined in Fig.
Channel occupied by fluid.
Space between azobenzene ligands containing gas.
49
3-1 ( highlighted aqua circle) by the end groups of the azobenzene ligands.10a
Also, since the
distance separating azobenzene ligands at the pore wall is very short (~1 nm),10b
small air
pockets may form between the chromophore molecules. Highlighted on the right side of Fig. 3-1
(purple ovals) is a region where formation of air pockets is probable. Because it is unlikely that
much liquid will flow in that region of the pores, the air pockets formed on the SiO2 walls are
anticipated to be fairly stable.
The close proximity of liquid CH3NO2 and gas pockets suggests that PN systems are unique
materials that will enable formation of hot spots exclusively via coalescence of reaction sites.9
Conventional hot spot formation (via cavity collapse/jet streaming or adiabatic gas compression)
is not feasible since the pore diameters are < 100 nm, and also because the liquid will occupy
part of the internal volume. Sensitization is expected to occur when dispersions of the
nanoporous materials in liquid CH3NO2 are subjected to conditions that trigger initiation.5
In order to test the coalesce theory with the above mentioned PN material and ultimately
engineer this material as a reversible sensitizing agent for a homogeneous liquid explosive, initial
efforts were allocated to expand on the work of Liu et al. for purposes of selecting the best
candidate for sensitization testing. Presented in this work are the results for the synthesis and
characterization of PN films and powders of varying pore morphology, ligand mobility, and
particle structure. PN films were studied initially given the inability to suspend PN powders in
liquid CH3NO2, thus making continuous/subsequent measurements on the same sample
impractical. Investigations into the pore structure and mass transport performance of PN films in
the presence/absence of CH3NO2 while subjected to UV-Vis irradiation will be presented and
discussed. PN powders will be evaluated and discussed with respect to their inherent properties
(pore morphology, ligand mobility, and particle size and shape) and their potential as an effective

50
sensitizer. Information obtained on the structure and/or dynamics of these PN materials in the
absence/presence of CH3NO2 are critical for future sensitivity measurements.
Background
Studies on EM entrapped in porous materials was conducted by Spitzer et al. by inclusion of
nanometer size RDX particles in a porous matrix composed of Cr2O3.12
Results from these
studies showed that the transition from deflagration to detonation was dependent on the
continuity of the explosive phase in the host matrix. Furthermore, the sensitivity and combustion
rate for these energetic nanocomposites was dictated by the ratio of loaded RDX nanoparticles to
the available surface area within the host matrix. More specifically, greater sensitivity was
witnessed (even higher than pure RDX microparticles) when the host matrix was loaded between
60 - 80% RDX. This observation was attributed to the close proximity of neighboring
decomposing EM particles able to propagate swiftly throughout the host matrix. Results from
this study could be evidence of the coalesce mechanism. However, the porosity of the host
matrix was defined as the space between neighboring Cr2O3 nanorods (mean diameter of 17.6
nm) contained within micron sized particles (~27 nm). This free space was enclosed between
neighboring nanorods, thus complete inter-pore-connectivity was most likely not obtainable in
this composite and would be necessary to validate the coalesce mechanism. Nonetheless, this
work is of interest to the findings of this study. If PN materials are successful in sensitizing NM
they could be applied to the aforementioned work to further the study of sensitization and
combustion rates of entrapped solid EM, except the host matrix (PN material) would possess
greater pore structure and inter-pore-connectivity.
51
Sensitization studies on CH3NO2 in the presence of micron sized solid silica particles (1-4 µm
& 40 µm) showed that hot spot formation is generated at the interface of the external surface
from impedance mismatches induced from the entering shockwave.13
Studies for this work also
demonstrated that hot spot formation via cavity collapse of hollow glass bubbles (38-45 µm
diameter) were more effective as a sensitizing agent than solid silica particles. In addition,
correlations between the inter-particle spacings of the different size particles showed that smaller
particles of equal loading weights induced detonation at lower pressures as compared to larger
particles of the same loading weight. This suggests that sensitization studies with PN particles
dispersed in CH3NO2 should be as small as possible in order to increase the ratio of pore surface
area to external particle surface. The reason is that hot spot formation via shock impedance
mismatch between the particle surface and the surrounding liquid could participate in the
sensitization event and prevent accurate measurements for the detonation of CH3NO2 dictated
solely by cavity collapse. Shock impedance mismatch arises at the interface at two materials with
different densities such as solids and liquids. Partial reflection of the shockwave from the solid
into the liquid increases the fluid pressure at the boundary, resulting in hot spots. While this
mechanism may be less significant than cavity collapse of pores, hot spots formation can result
in liquids containing dispersed solids through shock impedance mismatch. Also, shorter inter-
particle spacings can be achieved with smaller particles with lower concentrations as compared
to those needed for larger particles.
PN materials used here were synthesized following the sol-gel technique - evaporation-
induced surfactant directed self assembly (EISA).10
In the EISA approach, inorganic precursors
and a structure directing agent (SDA) are combined in a solution wherein favorable conditions
are achieved (i.e., composition, stoichiometry, inhibiting agent or polymerization catalyst, aging

52
Self-assembly via solvent evaporation Formation of mesostructures
Condensation Mesoporous Structure
after surfactant removal
(example of MCM-41)
Figure 3-2. General EISA process for the formation of mesoporous materials (films and
powders). From the top (left to right): micelles ( ) and inorganic precursors (○) self-assemble
during the initial evaporation phase followed by formation of mesostructures. From the bottom
(left to right): solidification of the liquid mesophase via polymerization of the surrounding
siloxane network followed by surfactant removal, from the mesopores, leaving behind the final
mesoporous structure.
time, evaporation rate, etc.) for designing mesoporous materials with specific properties (pore
size, pore morphology, ligands within the pore walls, etc).14
As presented in Figure 3-2, the
EISA process precedes in three steps; 1) solvent evaporation 2) mesostructuration and 3)
condensation. After components are homogenously dispersed in a solution, solvent evaporation
initiates the self-assembly of structure directing agents (i.e. surfactants) into spherical micelles.

53
When the concentration of the surfactant increases upon evaporation of the solvents, micelles
begin to form if the SDA concentration is below the critical micelle concentration (CMC). After
formation of micelles, inorganic precursors and other parts (mediator ions, modified siloxane
ligands, etc., if added) will begin to surround and/or embed themselves into the micelles to form
highly ordered structures; this step is known as mesostructuring. From this point, condensation is
induced via heat, evaporation, pH, etc., which solidifies the inorganic precursors into a silica
matrix around the micelles, thereby securing the mesostructural frame. Afterwards, the material
is exposed to high heat and/or acidic baths in order to remove the surfactants from the mesopores
leaving behind an open mesoporous material with high structural order. The overall
transformation can be summarized as polycondensation of inorganic precursors that are
surrounding ordered micelles in a crystal like mesostructure. The most prominent factors that
influence EISA processes are the ratio of surfactant to inorganic precursor, the chemical nature
of the inorganic precursor (sol-gel conditions), and the relative humidity influence during solvent
evaporation.15, 16
Experimental
Materials: Brij 56, tetraethyl orthosilicate (TEOS), and triethoxysilypropyl isocyanate (95%)
were purchased from Aldrich. Nitromethane (98.5%), MCM-41, MSU-H, and HMS were
purchased from Sigma Aldrich. Mica was from Axim Mica, ruby mica), HCl was from Fisher,
ethanol (99.98%) was from Pharmco-AAPER, and 4-phenylaniline (95%) was obtained from
TCI America. All materials were used as received without further purification.
Synthesis of TSUA: 4-(3-triethoxysilypropyl-uriedo)azobenzene (TSUA) was synthesized in
accordance with reference 17.

54
Sol-gel synthesis procedure: dip coated and spin coated films were made from a sol-gel
composition following procedures in reference 10b. For example, Brij 56 (0.27 g) and TSUA
(0.26 g) were dissolved in CH3CH2OH (6 mL) which contained TEOS (1.08 mL). After addition
of HCl (0.5 mL, 0.1 M) the solution was sonicated for 3 min and aged for 30 min before
depositing on substrates. Mica substrates were cleaned in a 1 M solution of HCl in CH3CH2OH
for 30 min before utilization as a substrate for deposition. Spin coated films were deposited on a
clean mica substrate at 1600 rpm for 30s. Dip coated films were deposited at a rate of ~1 cm/min
on a clean mica substrate. After deposition, films were treated to remove the surfactant in
accordance with reference 10b.
Mesoporous powders were made from the previous described sol-gel solution with slight
modifications: Sol1-2 was synthesized starting with the aforementioned sol-gel solution with the
addition of 25 mL of deionized water and 4 mL of ethanol (overall pH ~ 2.8). Sol1-3 was
synthesized with the sol-gel solution with the addition 10 mL of 0.1 M HCl in deionized water
(overall pH ~ 1.6). Both mixtures were placed in 250 mL polypropylene bottles with caps loosen
(to allow for evaporation) and stirred for 5 days in the dark in a semi-controlled surrounding.
After 5 days of stirring, solutions were left standing for 1 month then processed to remove the
surfactant in accordance with reference 10b.
FT-IR: Fourier transform infrared (FTIR) spectra of the samples were obtained in the
transmission mode from KBr samples pressed into pellets, on a Shimadzu IR-Prestige 21
spectrometer at a resolution of 4 cm-1
.
ATR: ATR spectra were recorded on the Mattson RS-1 with Harrick Twin Parallel Mirror
Reflection Variable Angle ATR accessory. Germanium ATR crystals were used as substrates
and were cleaned by plasma etching for 30 min under air. Spectra were recorded on a Mattson

55
RS-1 FTIR spectrometer with a Harrick variable angle ATR accessory using twin parallel mirror
reflection. Germanium ATR crystals (single pass parallel piped, 50 mm X 10 mm X 2 mm) were
used as internal reflection elements. The background spectra were recorded with the Ge crystal
contacting nitrogen gas in the absence of sample. All of the IR data were collected at a spectral
resolution of 4 cm-1
with 500 co-added sample scans using a high D* MCT-A detector with N2
purge of the sample compartment.
NMR: H1 nuclear magnetic resonance measurements (NMR) were made at 400.18 MHz with a
Bruker NMR spectrometer. TSUA was dissolved in deuterated dimethyl sulfoxide.
UV-Vis Spectroscopy: Optical densities were measured on a Shimadzu UV-Vis PC2501
spectrophotometer with a resolution of 1 nm. Illuminated films and powders were positioning at
mid-height inside a Rayonet that generated photons with λ = 350 nm ± 15 nm (16 RPR-3500A
lamps) or λ = 420 nm ± 10 nm (16 RPR-4190 lamps).
Diffuse Reflectance Measurements: Optical spectra were recorded in diffuse reflectance mode
using a Kubelka-Munk transform with a Shimadzu UV-Vis PC2501 spectrophotometer. Samples
were diluted with BaSO4 powder and pressed into the sample holder.
XRD: X-ray diffractograms (XRD patterns) were recorded between the scan range of 2θ = 1.5
and 7o using a Cu radiation source (Cu Kα, λ = 1.54178 Å) on a Rigaku Miniflex diffractometer.
Single Crystal XRD: Crystals suitable for single crystal XRD of TSUA were grown from hexane
at room temperature. A single crystal was mounted on a glass fiber with paratone-n oil. Unit cell
data was collected and was determined to be the previously reported structure. Data was
collected at 173 K on a Bruker Apex Single Crystal Diffractometer using the SMART software
package.

56
Nitrogen Absorption Measurements: Nitrogen adsorption measurements were performed using
an ASAP 2020 (Micrometrics, Inc.) volumetric analyzer at -196°C with ultra high purity
nitrogen gas. All samples were degassed under vacuum at 100°C for 3 h prior to measurement.
Adsorption parameters for the samples were determined from the collected nitrogen adsorption
data. The specific surface area (SBET) was calculated using the BET method in the relative
pressure range of 0.05 to 0.2.18
The single point pore volume (Vsp) was calculated from the
adsorption isotherm at a relative pressure of 0.98. Pore size distributions (PSDs) were calculated
from the adsorption branches of nitrogen adsorption-desorption isotherms using the improved
KJS method19
, calibrated for cylindrical pores in the range from 1-50 nm. The pore width (wKJS)
was obtained at the maximum of the PSD curve. Total pore volume (VT) and micropore volume
(Vmi) were evaluated by integration of the PSD curve (up to ~3 nm for micropore volume).
Transmission electron microscopy (TEM): images were acquired using a FEI Titan field-
emission microscope operating at 300 kV. Samples were prepared by suspending the powders in
hexanes via mild sonication and drop drying the suspension onto a 200 mesh Cu grid coated with
an ultrathin holey carbon film.
Scanning electron microscopy images (SEM): images were acquired using a FEI Quanta field-
emission microscope. Samples were prepared by drop drying a suspension of the powders in
acetone onto an aluminum stub. To minimize the effects of charging all samples were covered
with an atomic layer of carbon.
Results and Discussion
PN films and powders were composed from an EISA process outlined in reference 10b,
with some modifications for powders. This method utilizes an inorganic precursor tetraethyl

57
orthosilicate (TEOS) combined with a azobenzene modified silane ligand (4-(3-
triethoxysilypropyl-uriedo)azobenzene –TSUA) as a co-surfactant, in the presence of a structure
directing agent (Brij56, C20H42O5) mixed in an homogenous acidic CH3CH2OH / H2O solution
(pH = 2).
Figure 3-3. Asymmetric unit for 4-(-3-triethoxysilylpropyl-uriedo)azobenzene (TSUA) in
hexane. C (grey), O (red), H (green), N (blue) and Si (aqua). Unit cell constants a =
15.538(15.430), b = 9.245(9.247), and c = 18.482(18.504); for comparison, unit cell constants in
bold face are included from reference 17.
In this EISA process, micelles are formed containing TSUA molecules aligned in an ordered
position due to hydrophobic/hydrophilic forces. The silicic acid groups of TSUA settle next to
the hydrolyzed TEOS moieties (exterior micelle wall) and the hydrophobic
propylureidoazobenzene groups of TSUA are driven inward by the hydrophobic micelle core.
58
Developing PN materials for future sensitization testing requires many steps. They include: 1)
synthesis and confirmation of TSUA; 2) confirmation of TSUA photoisomerization; 3)
characterization of pore morphology; 4) confirmation of ligand mobility; 5) spectral
identification of TSUA in CH3NO2; 5) mass transport control of CH3NO2; 6) inclusion/retention
of CH3NO2; and 7) ligand mobility at longer wavelengths. Each of these steps will be discussed
in the following sections.
Confirmation of the Synthesis of TSUA
Structural conformation for the synthesis of TSUA was determined by single crystal XRD,
melting point, FT-IR and NMR. Shown in Figure 3-3, is the crystal structure for TSUA in
hexane validated by single crystal XRD with unit cell constants similar to that reported by Liu et
al., which was crystallized in acetone.17
Melting point was detected on a Mel-Temp instrument
(open air) which gave an average reading of 129.8 ˚C as compared to 127.5 ˚C from reference
17, which utilized thermogravimetric analysis (TGA), in argon, to determine the melting point.
Three characteristic vibrational bands were identified in TSUA via FT-IR spectroscopy
indicative to the –NH-CO-NH- urea group: v = 3346 cm-1
(NH stretch), 1651 cm-1
and 1560 cm-1
(amide I and II stretches). The previous vibrational bands were not witnessed in 4-phenylaniline
(starting product), which showed vibrational bands for a free NH2 group: v = 3464 cm-1
(Ar-NH2,
antisym.), 3381 cm-1
(sym.), and 1618 cm-1
(Ar-NH2 scissors).20
Confirmation of these
vibrational bands for the urea groups shows binding of triethoxysilypropyl isocyanate to 4-
phenyazoaniline, scheme 3-1. H1 NMR spectroscopy of TSUA in deuterated dimethyl sulfoxide
(d6-DMSO) show similar peaks to those reported by Lui et al., Table 3-1.
17 However, the exact
multiplicity of the three proton NMR peaks in the range of 7.58 ppm to 7.45 ppm was not
distinguishable due to a high degree of overlap and J-J coupling in these range.
59
N NSiO
O
O
N NNSi
H
O
O
O
N
H
H2N++NCO
CH3
H3C
CH3
CH3
H3C
CH3
C
O
Reflux in THF
Scheme 3-1. Synthesis of TSUA.
Photoisomerization of TSUA in ethanol (ligand mobility)
Photoisomerization of synthesized TSUA ligand was measured with UV-Vis spectroscopy.
Figure 3-4 shows a UV-Vis spectra of TSUA in ethanol under different exposure times to 350
nm light, visible light (room light), and heat. The trans configuration of the azobenzene ligand
absorbs at λmax = 364 nm (π-π*) and the cis configuration at λmax = 340 nm and λmax = 444 nm (n-
π*) respectively, see Figure 3-4. The initial spectrum of TSUA in ethanol shows a large
absorption band at 364 nm, signifying that the azobenzene ligand is predominantly present in the
thermally stable trans configuration. After 1 minute of irradiation with 350 nm light, the
azobenzene ligand has converted completely (100% starting from spectrum a) from the
predominately trans state to the cis state. Complete conversion into the cis configuration was

60
Table 3-1. Proton NMR spectrum data of TSUA in deuterated DMSO.
Group Proton Shift (ppm)* Proton Shift (ppm)
urea H close to aryl, 1H 8.86(s) 8.9 (s)
3J(H,H), the other urea H, 1H 6.32(t) 6.3(t)
3J(H,H), aryl H, 4H 7.79(d) 7.8(d)
3J(H,H), aryl H, 2H 7.58(d) M
3J(H,H), aryl H, 2H 7.51(t) M
3J(H,H), aryl H, 1H 7.45(t) M
-NCH2-, 2H 3.06(m) 3.1(q)
-CCH2C-, 2H 1.47(m) 1.5 (se.)
3J(H,H), -CH2Si-, 2H 0.53(t) 0.5(t)
3J(H,H), -OCH2, 6H 3.70(q) 3.7(q)
3J(H,H), -CH3, 9H 1.10(t) 1.2(t)
s = singlet; d = doublet; t = triplet; q = quartet; se = sextet; m = multiplex. *NMR data from
reference 17.
noticeable since an additional 10 minutes of irradiation (350 nm) left the spectrum unchanged,
Figure 3-4b & c. Reverse isomerization (cis – trans) was observed after exposure to room light at
different time intervals (spectra d, c, f, & g). Thermal reverse isomerization was obtainable as
well after 5 min of heating at 100 ○C in the absence of light (spectrum h). Furthermore, under
dark storage at room temperature for 16 hr, the TSUA ligand relaxed back to the more
thermodynamically favored trans configuration surpassing the maximum absorption (364 nm) of
the starting spectrum, (spectra i & a in Figure 3-4).

61
0
0.5
1
1.5
2
300 350 400 450 500 550
Abs
orba
nce
Wavelength (nm)
a
b & c
d
e
f & g
h
i
Figure 3-4. UV/Vis absorption spectra of a) TSUA in EtOH (28 µg mL-1
); b, c) after UV
irradiation of (a) for 1 and 10 min; d, e, f, g) after room light exposure of (c) 3, 10, 40 min and 1
hr; h) after heating for 5 minutes at 100 ˚C; i) no light for 16 hr, respectively.
Evaluation and Characterization of Pore Morphology
Mesoporous materials were synthesized following the sol-gel technique outlined in reference
10a & b. Pore morphology was verified using XRD, BET, SEM, and TEM. Figures 3-5 thru 3-
10 show the results of the aforementioned techniques for mesoporous standards (purchased from
Sigma-Aldrich) and that of the synthesized films and powders. Standard mesoporous materials
MCM-41, MSU-H, and HMS were analyzed for comparison against synthesized samples as well
as confirmation of the evaluation methods. Shown in Figure 3-5 (top) is the XRD pattern for 1D-
hexagonal pores. Conformation of the structure was verified by fitting a powder diffraction file
of MCM-41 onto the sample XRD pattern, Figure 3-5 (top), inset. TEM images of MCM-41
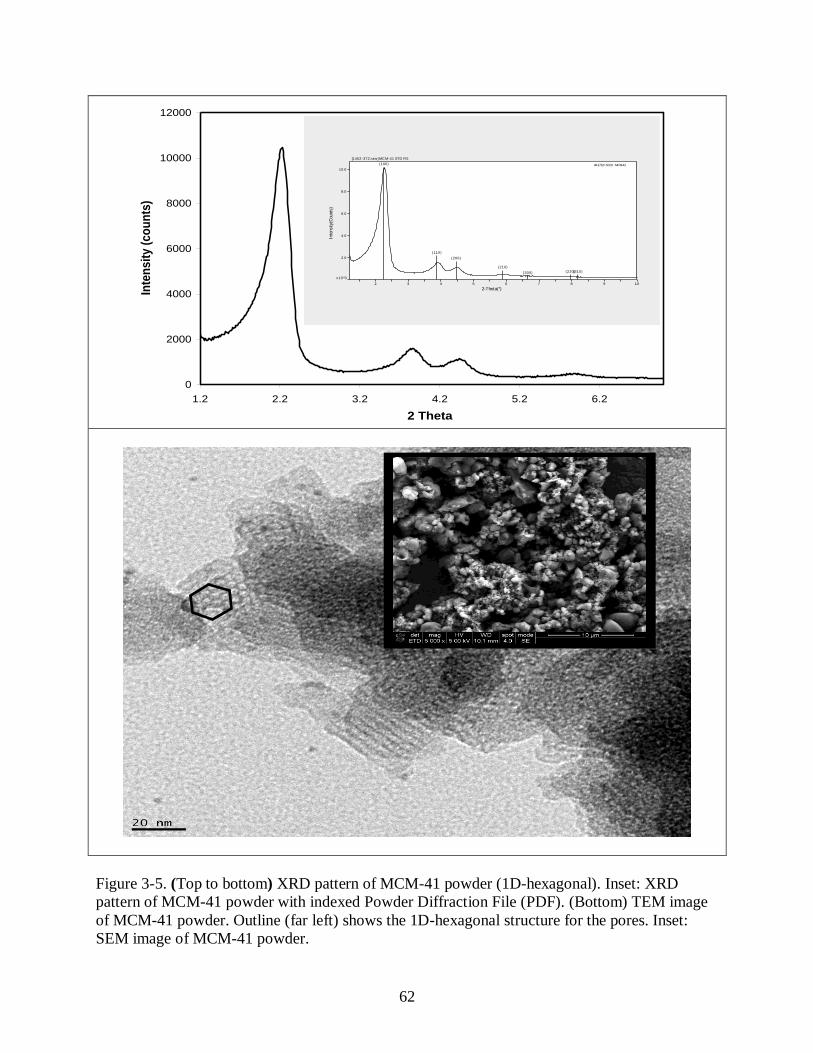
62
0
2000
4000
6000
8000
10000
12000
1.2 2.2 3.2 4.2 5.2 6.2
2 Theta
Inte
nsit
y (
co
un
ts)
(100)
(110)
(200)
(210)
(300) (220)(310)
2 3 4 5 6 7 8 9 10
2-Theta(°)
x10^3
2.0
4.0
6.0
8.0
10.0
Inte
nsity
(Cou
nts)
[1452-372.raw] MCM-41 STD R5
49-1712> SiO2 - MCM-41
Figure 3-5. (Top to bottom) XRD pattern of MCM-41 powder (1D-hexagonal). Inset: XRD
pattern of MCM-41 powder with indexed Powder Diffraction File (PDF). (Bottom) TEM image
of MCM-41 powder. Outline (far left) shows the 1D-hexagonal structure for the pores. Inset:
SEM image of MCM-41 powder.

63
show 1D-hexagonal pores with a pore diameter of ~2.86 nm, which is within the range provided
by the manufacturer (2.3 – 2.7 nm), Figure 3-5 (bottom). Surface morphology and particle size
was also visible via SEM showing small clustered particles within the range of 0.31 to 4.4 µm
with irregular surfaces. MSU-H (2D-hexagonal) shows an X-ray diffraction pattern with a peak
around 2θ = 1.77o, Figure 3-4. SEM images show 2D-hexagonal tubes (~diameter 238 nm)
protruding from all angles from the sample, Figure 3-6 inset. A broader XRD pattern was
observed for HMS with a peak at 2θ = 1.84o along with SEM images showing small spherical
particles (0.154 μm) clustered together into much larger aggregated masses on the order of a few
microns (12.5 μm), Figure 3-7 and inset. Figure 3-8 (top) shows a broad XRD pattern for Sol1-2
powder with a peak around 2θ = 1.47o. TEM images show channels/tubes shaped in a helical
fashion with diameters of 10 nm, Figure 3-8 left inset; channels with other shapes (straight and
irregular) were also observed, data not shown. SEM images show elongated particles within the
range of 30 – 100 µm long with a jagged surface structure, as shown in Figure 3-8 right inset.
BET measurements yielded a pore diameter of only 2.6 nm with a surface area of 107 m2/g, and
a pore volume of 0.07 cm3/g, Table 3-2. Pore diameters are slightly smaller than what was
expected (3.2 nm) as compared to PN films made by Liu et al.10a, b
However, given the estimated length of the TSUA ligand (~1.82 nm) in the trans position
surrounding the central pore channel and the assumption that most of the pore‘s surface is
covered by this ligand (see Figure 3-1), then the pore width could be as large as 6.2 nm, (5.6 nm
in the cis position). Yet the actual pore size is probably somewhat less than calculated given that
there is space between neighboring ligands that the absorbing molecule (N2) can occupy.10b
A
low surface area and pore volume is also expected given that a good portion of the pore surface
is covered by the azobenzene ligands as compared to empty pores, which show higher surface
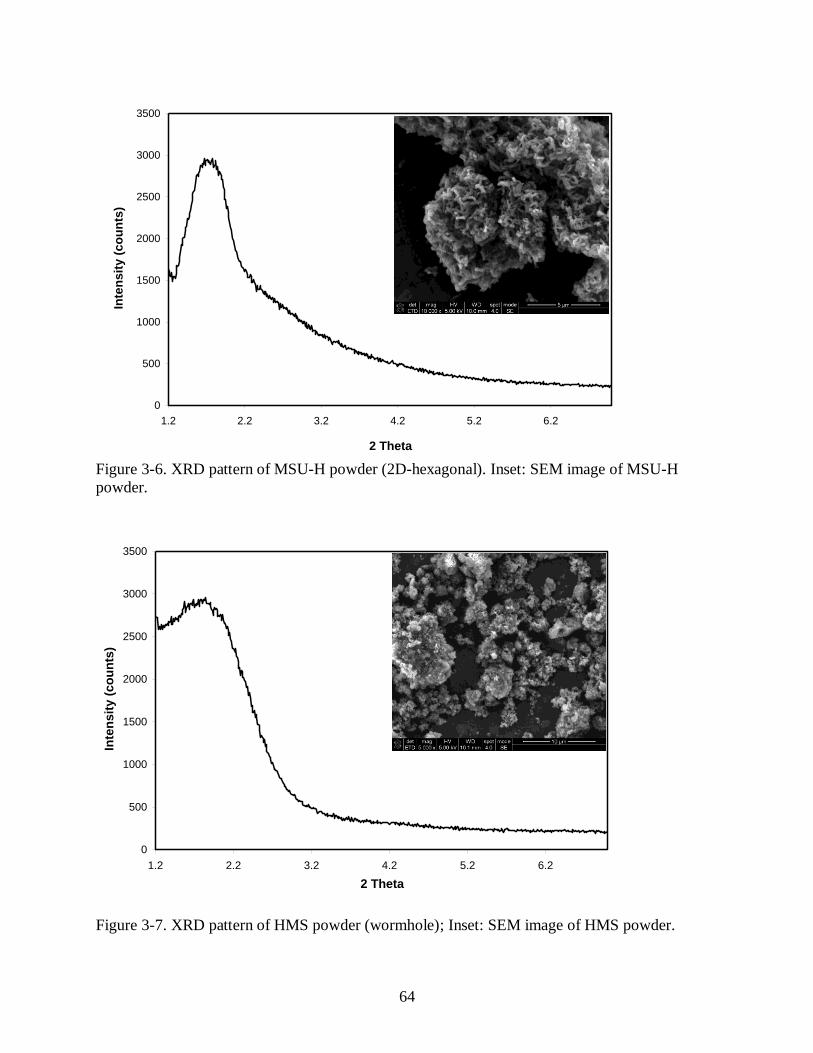
64
0
500
1000
1500
2000
2500
3000
3500
1.2 2.2 3.2 4.2 5.2 6.2
2 Theta
Inte
ns
ity
(c
ou
nts
)
Figure 3-6. XRD pattern of MSU-H powder (2D-hexagonal). Inset: SEM image of MSU-H
powder.
0
500
1000
1500
2000
2500
3000
3500
1.2 2.2 3.2 4.2 5.2 6.2
2 Theta
Inte
nsit
y (
co
un
ts)
Figure 3-7. XRD pattern of HMS powder (wormhole); Inset: SEM image of HMS powder.
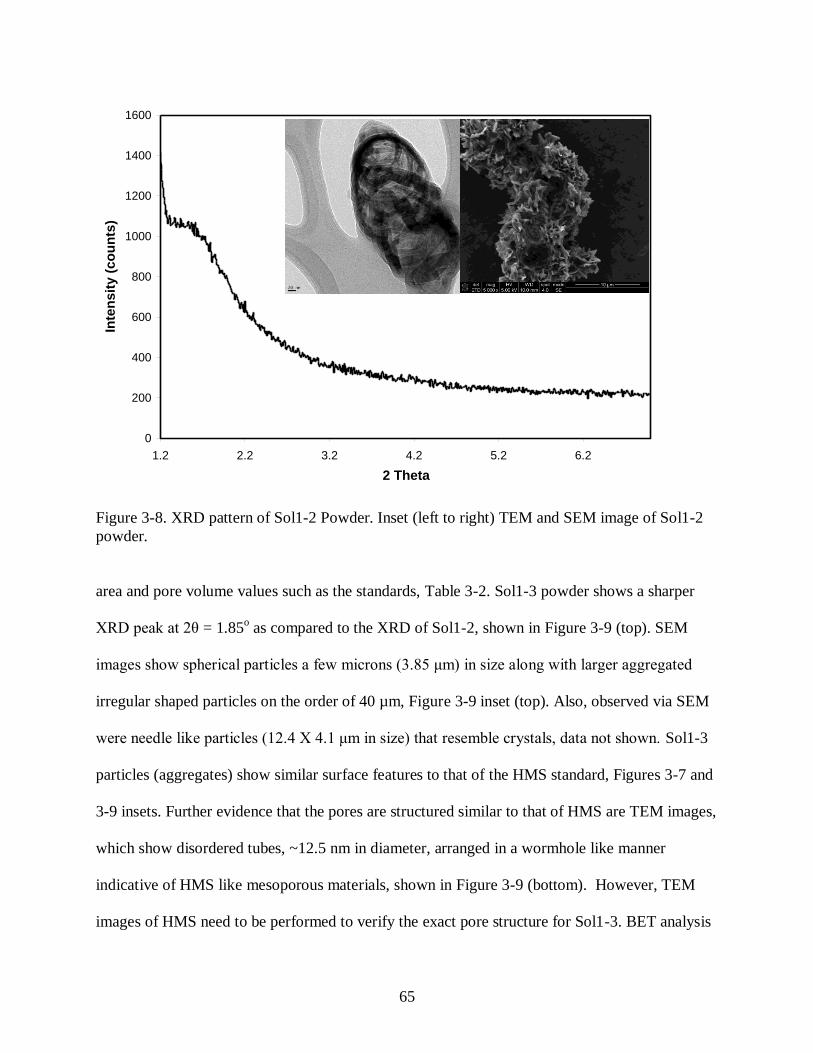
65
0
200
400
600
800
1000
1200
1400
1600
1.2 2.2 3.2 4.2 5.2 6.2
2 Theta
Inte
ns
ity
(c
ou
nts
)
Figure 3-8. XRD pattern of Sol1-2 Powder. Inset (left to right) TEM and SEM image of Sol1-2
powder.
area and pore volume values such as the standards, Table 3-2. Sol1-3 powder shows a sharper
XRD peak at 2θ = 1.85o as compared to the XRD of Sol1-2, shown in Figure 3-9 (top). SEM
images show spherical particles a few microns (3.85 μm) in size along with larger aggregated
irregular shaped particles on the order of 40 µm, Figure 3-9 inset (top). Also, observed via SEM
were needle like particles (12.4 X 4.1 μm in size) that resemble crystals, data not shown. Sol1-3
particles (aggregates) show similar surface features to that of the HMS standard, Figures 3-7 and
3-9 insets. Further evidence that the pores are structured similar to that of HMS are TEM images,
which show disordered tubes, ~12.5 nm in diameter, arranged in a wormhole like manner
indicative of HMS like mesoporous materials, shown in Figure 3-9 (bottom). However, TEM
images of HMS need to be performed to verify the exact pore structure for Sol1-3. BET analysis

66
0
100
200
300
400
500
600
700
800
1.2 2.2 3.2 4.2 5.2 6.2
2 Theta
Inte
nsit
y (
co
un
ts)
Figure 3-9. XRD pattern of Sol1-3 Powder. Inset: SEM image of Sol1-3 powder. (Bottom) TEM
image of Sol1-3 powder showing wormhole like channels.

67
Table 3-2. Physical properties for mesoporous materials.
Sample Pore Width
(nm)
Pore Volume
(cm3/g)
Surface
Area (m2/g)
Pore
Structure
MCM-41 2.3 – 2.7 0.98 1000 1D-hexagonal
MSU-H 7.1 0.91 750 large 2D-hexagonal
HMS 3.9 1.76 910 2D-hexagonal
(disordered/wormhole)
Sol1-2
Powder
2.6 0.07 107 unknown
Sol1-3
Powder 2.5 0.12 108
*2D hexagonal
(disordered)
* Based on TEM images.
estimates a pore width of 2.5 nm with a surface area of 108 m2/g and a pore volume of 0.12
cm3/g. Pore width, surface area, and pore volume are lower than expected and/or as compared to
standards for the same reasons as explained previously. It has been reported that sol-gel mixtures
with high water to silicate ratios take much longer to gel, thus allowing more time for micelles to
form into structured/order shapes as observed in the TEM images for Sol1-2, Figure 3-8 (left
inset).20
However, materials made with lower ratios of TEOS to water (Sol1-3) gel much faster,
thus impeding micelles from forming more ordered structures and alternatively yielding
aggregated spherical particles, see Figure 3-9 (SEM image).
Mica substrates dip coated in the sol gel solution show a homogenous coating of the PN film
onto the exposed mica surface, Figure 3-10 (top) inset. Sharp peaks at 2θ = 1.97 and 3.35
degrees in the XRD pattern demonstrate the high order of the enclosed pore structure, Figure 3-8
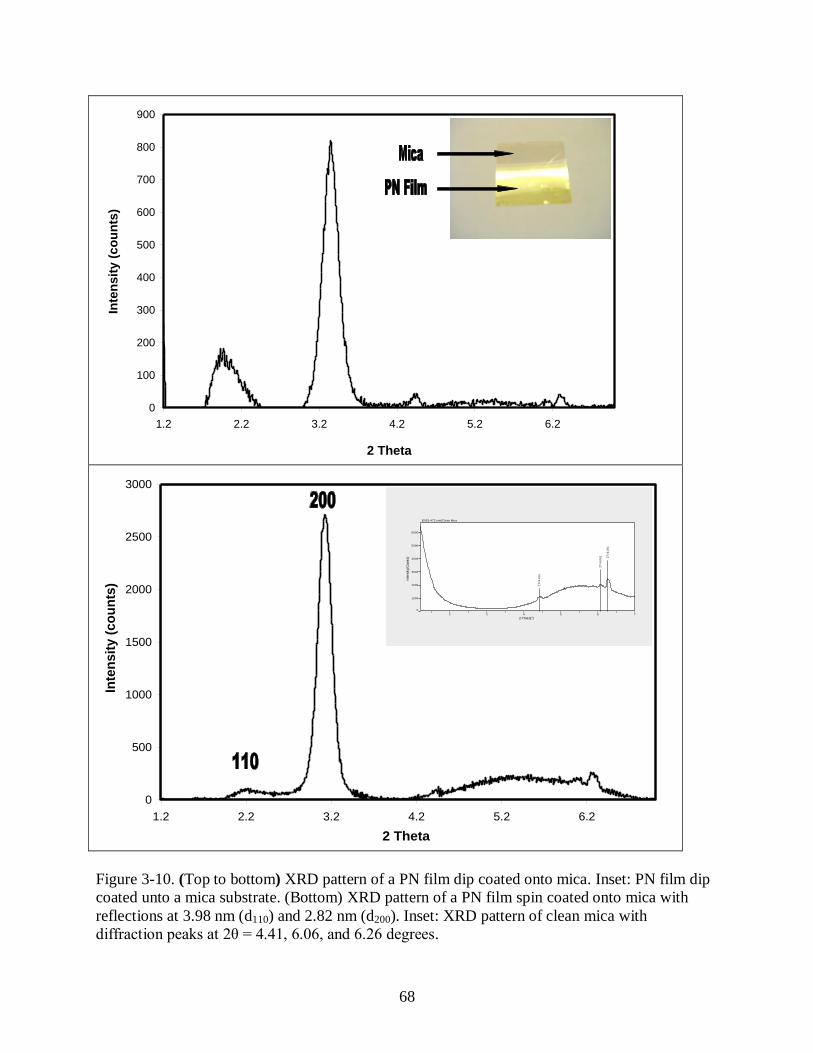
68
0
100
200
300
400
500
600
700
800
900
1.2 2.2 3.2 4.2 5.2 6.2
2 Theta
Inte
ns
ity
(c
ou
nts
)
0
500
1000
1500
2000
2500
3000
1.2 2.2 3.2 4.2 5.2 6.2
2 Theta
Inte
ns
ity
(c
ou
nts
) 2T
=4
.41
0
2T
=6
.06
1 2T
=6
.26
1
2 3 4 5 6 7
2-Theta(°)
0
1000
2000
3000
4000
5000
6000
Inte
nsity(C
ounts
)
[0953-472.raw] Clean Mica
Figure 3-10. (Top to bottom) XRD pattern of a PN film dip coated onto mica. Inset: PN film dip
coated unto a mica substrate. (Bottom) XRD pattern of a PN film spin coated onto mica with
reflections at 3.98 nm (d110) and 2.82 nm (d200). Inset: XRD pattern of clean mica with
diffraction peaks at 2θ = 4.41, 6.06, and 6.26 degrees.

69
(top). Peaks at 2θ = 4.41, 6.06, and 6.26 degrees in both XRD patterns for dip coated and spin
coated films on mica are associated with the mica substrate, see Figure 3-10 (bottom) inset.
Attempts to index the X-ray diffraction peaks for the dip coated films were unsuccessful. Spin
coated films show a more intense XRD pattern with sharp peaks at 2θ = 2.22o (d = 3.977 nm)
and 3.13o (d = 2.820 nm), Figure 3-10 (bottom). Indexing of these peaks with the Bravais lattice
fitting guide contained in the Rigaku software program, JADE, leads to a bcc structure with the
first reflection as 110 and the second as 200 with a unit cell dimension of a = 5.63 nm (d200 =
2.82 nm), Figure 3-10 (bottom). Films made by Liu et. al showed reflections at 2.85 nm (d200)
and 1.4 nm (d400), that were interpreted as corresponding to a bcc pore structure indexed as
belonging to the Im3m space group with a unit cell dimension of a = 5.7 nm (d200 = 2.85 nm).10a,
b Absence of the 400 reflection in the XRD pattern in Figure 3-10 (bottom) is understandable
given that this peak would be visible at around 2θ = 6.4o, which falls in the range of peaks
associated with the mica substrate. Also this peak was very weak in the reference XRD pattern
provided by reference 10b. The 110 reflection in Figure 3-8 (bottom) was not visible in the XRD
pattern provided by Liu et al., however it was detected with 2D grazing incidence small angle X-
ray scattering (GI-SAXS) and electron diffraction.10a, b
Ligand Mobility for PN Powders and Films
Photoisomerization of the TSUA ligand within solid samples in the form of powders and
films were monitored with UV-Vis spectroscopy (films) and in diffuse reflectance mode
(powders), Figure 3-11. Powders and films show similar photochemical behavior for trans – cis
isomerization under exposure to 350 nm light with that of TSUA in ethanol. In particular, spin
coated films show the largest change in absorption during photolysis with 350 nm light, as

70
compared to dip coated films and powders, Figure 3-11(d). Furthermore, all samples relaxed
back to the their predominately trans (ptrans) configuration after standing in the dark for 24 hrs;
spin coated films converted back to their initial state (ptrans) in only a few hours, Figure 3-11(d).
Sol1-3 (powder) showed a more resolved spectra at λmax = 360 nm as compared to Sol1-2, Figure
3-11b compared to 3-11a.
Figure 3-11. UV-Vis spectra (diffuse reflectance mode) of PN powders: a) Sol1-2 and b) Sol1-3.
UV-Vis spectra of PN films synthesized via dip coated (c) or spin coated (d) onto mica.
The distorted spectrum of Sol1-2 most likely implies a smaller amount of the TSUA ligand is
present in the pores as compared to Sol1-3. This is suggested given that 2~3 times more PN
material had to be mixed with the dispersant (BaSO4) to obtain a reflectance spectrum close to
that of Sol1-3. Also, this particular sol-gel solution showed poor miscibility during mixing of the
a b
c d

71
sol-gel solution, which could have limited the number of the TSUA ligands able to enter the
micelles.
UV-Vis Spectroscopy of TSUA in the Presence of CH3NO2
UV-Vis spectroscopy of TSUA/ethanol/NM solutions were conducted to identify key spectral
shifts for the TSUA ligand (trans and cis configurations) in the presence of NM. As shown in
Figure 3-12, curve a, TSUA in ethanol predominately in the trans
Figure 3-12. a) UV-Vis spectrum of TSUA in ethanol (ptrans); b) TSUA in ethanol with
nitromethane; c) after 2 min of irradiation of (b) with 350 nm photons (predominately cis - pcis);
d) nitromethane in ethanol. Inset: UV-Vis spectrum of TSUA/ethanol, ptrans (λmax = 360 nm);
Later solution after 1 min of illumination with 350 nm photons, pcis (λmax = 443 nm and λmax =
338 nm).
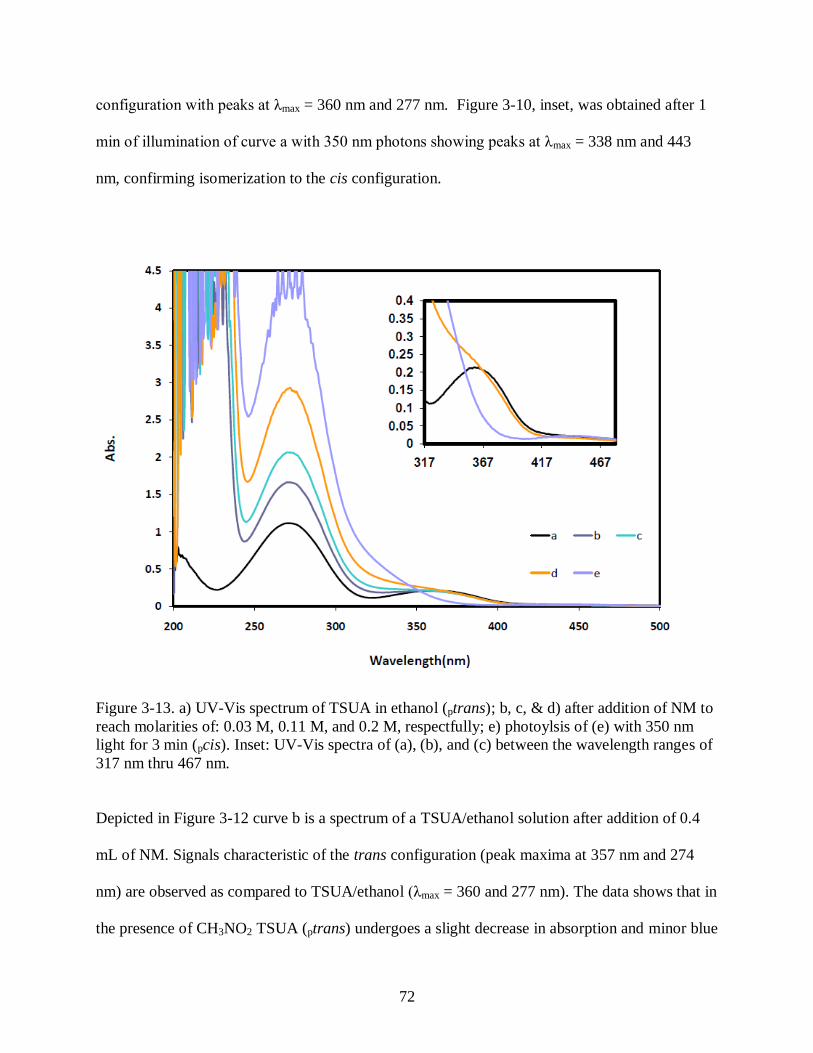
72
configuration with peaks at λmax = 360 nm and 277 nm. Figure 3-10, inset, was obtained after 1
min of illumination of curve a with 350 nm photons showing peaks at λmax = 338 nm and 443
nm, confirming isomerization to the cis configuration.
Figure 3-13. a) UV-Vis spectrum of TSUA in ethanol (ptrans); b, c, & d) after addition of NM to
reach molarities of: 0.03 M, 0.11 M, and 0.2 M, respectfully; e) photoylsis of (e) with 350 nm
light for 3 min (pcis). Inset: UV-Vis spectra of (a), (b), and (c) between the wavelength ranges of
317 nm thru 467 nm.
Depicted in Figure 3-12 curve b is a spectrum of a TSUA/ethanol solution after addition of 0.4
mL of NM. Signals characteristic of the trans configuration (peak maxima at 357 nm and 274
nm) are observed as compared to TSUA/ethanol (λmax = 360 and 277 nm). The data shows that in
the presence of CH3NO2 TSUA (ptrans) undergoes a slight decrease in absorption and minor blue

73
shifts from 360 nm to 357 nm together with an increase in absorption and blue shift from 277 nm
to 274 nm; compare curve a with curve b, Figure 3-12. On the other hand CH3NO2 shows a
signal with λmax = 272 nm, Figure 3-12 curve d. After 2 minutes of illumination with 350 nm
photons of the TSUA solution in ethanol containing CH3NO2 isomerization of (ptrans) to the cis
configuration takes place, Figure 3-12 curve c. Blue shifts at 338 nm to 335 nm and 274 to 271
nm were observed along with an increase in absorption intensity accompanying the latter shift;
no spectral shift was noticed at λmax = 443 nm.
Stronger solvent-like effects on the TSUA ligand in the trans position were observed at
higher ratios of CH3NO2 to ethanol, see Figure 3-13 curves a thru d. At high NM concentrations
the absorption by CH3NO2 with λmax = 272 nm extends significantly to longer wavelengths. This
NM absorption partially masks the optical signal of the ligand at 360 nm, which can now be
detected only as a shoulder depicted in the inset of Figure 3-13. Upon photolysis with 350 nm
light of solutions with the highest concentration of CH3NO2 in ethanol, the cis signal at λmax =
335 nm is no longer identifiable as a distinct absorbance due to the contribution from CH3NO2,
yet the cis signal at λmax = 443 nm is still visible, Figure 3-13 inset.
Photochemical Control for the Mass Transport of CH3NO2: PN films
UV-Vis spectroscopy of spin coated PN films on mica (TSUA - ptrans) show a main peak
maxima at 352 nm and, after irradiation with 350 nm light, two peaks at λmax = 345 nm and λmax
= 444 nm for the cis configuration, Figure 3-14d. Immersion of the film in CH3NO2 for 7 h
showed no changed in the optical spectrum (data not shown) suggesting that NM was not able to
enter the pores within the films when the TSUA ligands existed preferentially in the ptrans
configuration. Subsequently, the film was photolyzed with 350 nm photons for 14 h to produce

74
mainly (pcis) and immersed in CH3NO2. Figure 3-14 shows the optical spectra as measured with
immersion time in CH3NO2. Initially the TSUA ligand within the pores of the spin coated film
relax back to the trans configuration from its photoinduced cis state at a rate of 0.002 O.D. 352 nm
min-1
(2 h), Figure 3-14 curves a through e and inset. At longer immersion times in CH3NO2 the
optical signal at 352 nm starts to decrease, then stabilize around 17 h, Figure 3-14 inset. This
trend seems to suggest that small amounts of CH3NO2 are included within the pores of the films
causing a slight decrease in the absorption at 352 nm, similar to the effect witnessed in Figure 3-
12 curves a and b.
Figure 3-14. a) UV-Vis spectra of a spin coated film on mica after 14 h of irradiation with 350
nm light (pcis); b, c, d, e, f, & g) after immersion in CH3NO2 for 10, 30, 60, 120, 250, and 420
minutes. Inset: plot of optical density at λmax = 352 nm versus immersion time (min) in CH3NO2.

75
Subsequently the spin coated film in CH3NO2 was illuminated with 350 nm light and the optical
signal at 352 nm decreased as expected, Figure 3-15 curves a and b. However, continued
illumination at this wavelength shows a steady increase at 352 nm reaching a maximum
absorption at 7 h at an initial rate of 0.002 O.D. 352 nm min-1
, Figure 3-15 curves b through e and
inset. This unusual behavior of the ligand converting to the trans position instead of maintaining
the cis position under illumination with 350 nm photons can be explained by an solvent-induced
effect from CH3NO2 on the rates of isomerization from cis – trans or by formation of a charge-
transfer complex.
Figure 3-15. a) UV-Vis spectrum of a spin coated film on mica after 7 h immersion in NM; b, c,
d, e, & f) after photolysis with 350 nm light while immersed in CH3NO2 for 10, 30, 120, 420,
and 1020 minutes. Inset: plot of optical density at λmax = 352 nm versus irradiation time (min) at
350 nm light while immersed in CH3NO2, starting from (b).

76
Azobenzene derivatives have been reported to incur significant solvents effects on their rates of
isomerization from cis to trans in the presence of polar solvents by as much as a factor of 105.22 -
24 Furthermore, at longer illumination times (17 h) the optical signal at 352 nm stabilizes
suggesting that a photostationary point has been reached between the photoinduced trans - cis
isomerization and that of the solvent induced cis - trans conversion, Figure 3-15 curve f and
inset.
Inclusion/retention of CH3NO2 in PN Films
A ―as prepared‖ spin coated film immersed in CH3NO2 under photolysis with 350 nm light
for 15 h shows a noticeable shift in the optical signal at 352 nm, Figure 3-16 curves a and b,
similar to effects witness at high CH3NO2 to ethanol ratios seen in Figure 3-13 curve a and d.
This change in the optical spectrum strongly suggests that CH3NO2 has been loaded into the
pores of the film. A similar experiment was performed with a dip coated film that was submersed
in CH3NO2 and irradiated for 3 h with 350 nm photons then measured by ATR spectroscopy,
Figure 3-17. IR signals (vibrations) for TSUA and nitromethane were identified; no signal for
either compound was detectable before the inclusion of CH3NO2, again suggesting a solvent-like
effect on the TSUA ligand in the presence of CH3NO2. The aforementioned spin coated film,
loaded with CH3NO2, was removed from liquid NM and left to stand in the dark for 90 minutes,
then measured with UV-Vis spectroscopy (data not shown). No noticeable change was detected
in the optical spectrum for the spin coated film showing that the film had retained the CH3NO2 in
the pores (data not shown). Experiments on dip coated films showed similar behavior with no
change in the optical spectrum up to 5 days; only after placing the films in a vacuum oven under

77
heat (100 oC) does the optical spectrum appear similar to the ‗as prepared‖ dip coated films
before photolysis in CH3NO2 (data not shown).
Figure 3-16. a) UV-Vis spectrum of a spin coated film on mica as prepared; b) after photolysis
with 350 nm light while immersed in CH3NO2 for 15 h; c, d, & e) after irradiation of the film in
air with 420 nm light. Inset: plot of optical density at λmax = 352 nm versus irradiation time (min)
with 420 nm light, starting with (b).
Ligand Mobility at Longer Wavelengths (420 nm) in the Presence of CH3NO2
A spin coated film loaded with CH3NO2 was illuminated with 420 nm light to monitor any
ligand isomerization induced by irradiation at longer wavelengths, the results are presented in
Figure 3-16 curves c, d, & e. Initial photolysis of the loaded spin coated films show an expected
increase in absorption at 352 nm signifying that the remaining TSUA ligands in the cis

78
configuration isomerize to the trans state, Figure 3-16 curves a and b. However, at longer
illumination times with 420 nm light the optical signal at 352 nm decreases (0.0007 O.D. 352 nm
min-1
) indicating formation of the cis configuration, Figure 3-16, inset. This unexpected trans –
cis isomerization path could be another solvent effect induced by CH3NO2 on the TSUA ligands
existing within the pores of the films. The origin of the unexpected trans – cis isomerization
reaction taking place under these conditions remains unclear. Nonetheless, this shows that the
films can retain CH3NO2 for several hours if not days once removed from the liquid NM bath,
and also that the azobenzene ligands are photoresponsive to longer wavelengths in the presence
of CH3NO2.
Figure 3-17. ATR spectrum of a photoresponsive nanoporous film dip coated onto a mica
substrate that was immersed in CH3NO2 and then photolyzed with 350 nm photons for 3 h.
Vibrations (cm-1
): Free alcohols or Si-O-H, vR-OH = 3618; TSUA, vN-H = 3440 & 3321; vCH2-Ph =
3082 & 3060; vC-H = 2981, 2937, & 2887; vC=O = 1653; vC-C(AROMATIC) = 1500; vC=C(AROMATIC) =
1163 Nitromethane, vNO2 = 1560 & 1388.

79
Evaluation of Results for Sensitization Measurements
PN films (made via spin coating and dip coating) showed similar properties as those reported
in reference 9a and 9b; spin coated films showed near identical properties. Mass transport control
for the loading of CH3NO2 within the pore channels was observed under photolysis. In the
absence of 350 nm light and when the ligands are in their more favorable trans position,
inclusion of CH3NO2 within the pores of PN films was not witnessed. Furthermore, smaller
amounts of CH3NO2 appear to flow into the pore channels at a much slower rate, as compared to
illuminated PN films in CH3NO2, when the PN films are immersed in CH3NO2 and the ligands
are initially in the cis position. In addition, ligands within the PN film‘s pores are
photoresponsive to both wavelengths (λ = 350 and 420 nm) of light in the presence of CH3NO2.
Retention/storage of CH3NO2 within the pores of films, once removed from solution, was
observed for several hours. An unexpected observation was a solvent-like effect induced on the
photoisomerization of the ligand in the presence of CH3NO2.
Results show that PN powders contain pore sizes of a few nanometers with disordered
morphology, irregular particle size and shape; they appear to be less photoresponsive with
respect to ligand photoisomerization as compared to PN films. Sol1-2 powder has poor ligand
mobility as compared to Sol1-3 powder. At present, Sol1-3 appears more favorable for
sensitization measurements based off its greater mobility of the TSUA ligand and higher yield of
particles of similar size and shape containing pores with a similar morphology; albeit disordered
(wormhole). Greater mobility of the TSUA ligand should translate into more effective filling of
the central pore channels when immersed in CH3NO2. Particles of uniform size and shape are
preferred because their regular features facilitate evaluation and modeling sensitization results.
Similarly, uniform pore morphology should equate to reproducible mass transport properties

80
such as loading rates for the filling of CH3NO2 with in the pore channels. Sol1-3 powder, if
administered as a sensitizing agent for CH3NO2 under standard conditions, will required that the
additive particles are suspended in a CH3NO2 gel; increasing the viscosity of CH3NO2 is
necessary or the particles will fall out of solution.13
Ultimately, engineering of a truly dynamic
sensitizing system will require that PN materials are freely suspended in CH3NO2 without the
need of changing the viscosity of the solution (i.e. liquid → gel), which would hinder the pore
filling process within the particles. Nanometer size PN particles would be ideal sensitizing
additives for such a system, given that the ratio of unoccupied space (pore volume) to particle
weight would be highest. Due to their lower density the particles are most likely to remain
stabilized within liquid CH3NO2.
Conclusions
Results demonstrate a ―lock and key‖ mechanism for loading CH3NO2 into the pore cavities
via illumination with 350 nm photons for spin coated films on a mica substrate. In addition,
loading of CH3NO2 can be performed in two ways: 1) photolysis of PN films immersed in
CH3NO2; and 2) photolysis of PN films in air, followed by immersion in CH3NO2 for slower
loading rates. However, illuminated films in the presence of CH3NO2 with 350 nm or 420 nm
photons show reverse effects on the isomerization pathway which could present problems for
control and/or selectivity of the ligand within the PN material for specific applications. Further
investigations into this research should examine azobenzene derivatives that are less sensitive to
polar solvents to gain greater control on the isomerization of the ligands in the presence of highly
polar liquids. In addition, efforts to make free standing films (detached from the mica substrate)

81
should be pursued to verify mass transport results obtained in this study, which might be affected
to some degree by the mica substrate.
At present, Sol1-3 powder seems reasonable for sensitization testing for the coalescence
model. On the other hand, utilization of this material as an ―on/off‖ safety switch will require a
greater understanding of the solvent effects induced on the ligand in the presence of CH3NO2.
Future efforts should be directed towards synthesizing smaller PN particles of uniform size with
pore structure (bcc) similar to the one of spin coated films in efforts to correlate mass transport
results for the inclusion of CH3NO2.

82
References
1) Fickett, W. Am. J. Phys. 1979, 47, 1050-1059.
2) Tarver, C. M. Shock Compression of Solids VI; Springer-Verlag; New York City, NY:
2003, Chapter 10.
3) Milne, A. M.; Bourne, N. K. AIP Conference Proceedings 2001, 620 (Shock
Compression of Condensed Matter, Part 2) pp. 914-917.
4) Engelke, R. Phys. Fluids 1983, 26, 2420-2424.
5) Cartwright, M.; Lloyd-Roach, D.; Simpson, P. J. J. Energy. Mat. 2007, 25, 111-127.
6) Zeman, S. Struct. Bond 2007, 125, 195-271.
7) Field, J. E. Acc. Chem. Res. 1992, 25, 489-496.
8) Borisenok, V. A.; Bel‘skii, V. M. Russ. J. Phys. Chem. B 2008, 2, 187-193.
9) Ramaswamy, A. L. J. Energ. Mat. 2006, 24, 35-65.
10) a) Liu, N. G.; Dunphy, D. R.; Atanassov, P.; Bunge, S. D.; Chen, Z.; Lopez, G. P,; Boyle,
T. J.; Brinker, C. J. Nano Lett. 2004, 4, 551-554. b) Liu, N. G.; Chen, Z.; Dunphy, D. R.;
Jiang, B.; Assink, R. A.; Brinker, C. J. Angew. Chem. Int. Ed. 2003, 42, 1731-1734.
11) Reduner, E. Nanoscopic Materials: Size-dependent Phenomena; RSC Publishing,
Cambridge, UK: 2006, chapters 6 and 7.
12) Spizer, D; Comet, M.; Baras, C.; Pichot, V. J. Phys. & Chem. of Solids 2010, 71, 100-
108.
13) Dattlebaum, D.; Sheffield, S.; Stahl, D.; Dattlebaum, A.; Trott, W.; Engelke, R. Influence
of Hot Spot Features on the Initiation Characteristics of Heterogeneous Nitromethane (in
press)
14) Sanchez, C.; Boissière, C.; Grosso, D.; Laberty, C. ; Nicole, L. Chem. Mater. 2008, 20,
682-737.
15) Hoffmann, F.; Cornelius, M.; Morell, J.; Fröba, M. Angew. Chem. Int. Ed. 2006, 45,
3216-3251.
16) Grosso, D. et al. Adv. Funct. Mater. 2004, 14, 309-322.
17) Liu, N.; Dunphy, D. R.; Rodriguez, M. A.; Singer, S. Brinker, J. Chem. Commun. 2003,
1144-1145.
83
18) Kruk, M.; Jaroniec, M. Chem. Mater. 2001, 13, 3169-3183.
19) Jaroniec, M.; Solovyov, L. Langmuir 2006, 22, 6757-6760.
20) Lin-Vien, D et al. The handbook of Infrared and Raman Characteristic Frequencies of
Organic Molecules; Academic Press Inc, San Diego, CA: 1991, chapters 9 and 10.
21) Brinker, C. J. and Scherer, G. W. Sol-Gel Science: The Physics and Chemistry of Sol-Gel
Processing; Academic Press, Inc., San Diego, CA: 1990, chapter 3.
22) Reichardt, C. Solvent and Solvent Effects in Organic Chemistry; VCH Publishers, New
York, NY: 1988, chapter 5.
23) Wildes, P. D.; Pacifici, J. G.; Irick, G. I.: Whitten, D. G. J. Amer. Chem. Soc. 1971,
2004-2008.
24) Schanze, K. S.; Mattox, T. F.; Whitten, D. G. J. Org. Chem. 1983, 2808-2813.

84
IV. METALLIZATION OF HIGH STRENGTH FIBERS
Introduction
Polymer metallization is an area of intense activity due to the practical importance of the
resulting materials. For instance, metallized polymer films play very significant roles in
microelectronics, space and automotive technologies.1 Metallization imparts useful properties
to polymeric components of space vehicles and structures, including protection against
degradation processes that can be severe in the harsh environment of low earth orbit.2 In fact,
material erosion together with electrostatic charging are problems that have hindered the
realization of space tethers consisting of two masses connected via a flexible cable.3 Tethers
have long been considered promising propulsion systems and for specific applications the
demands imposed on the physical properties of the flexible joining cables seem to be met by
currently-available high strength fibers.4 Interestingly, an earlier study showed that deposition
of m thick Cu/Ni coatings onto Kevlar fibers, poly(p-phenylene terephthalamide), yielded
conductive materials exhibiting good erosion resistance without affecting the mechanical
strength of the polymer.5 While these results suggested a route for achieving satisfactory tether
materials based on the aramid fibers, the methodologies used for metal deposition remain
unknown.
Metallized fibers have been of interest to the textile industry because of their practical use in
heating and antibacterial garments,5,6
and the appeal for such materials is increasing due to
their relevance to ―smart‖ textiles.7 Intelligent textiles are those involving wearable electronic
devices including processors and energy responsive fabrics,8 but other possible technologies
have been envisioned.9,10
Conducting fibers for electromagnetic shielding were traditionally
85
obtained by means of metal vaporization and doping;11
the former method has also yielded
sensors based on metalized Kevlar monofilaments.12
Electroless metal deposition has been
frequently used to treat fibers due to the effectiveness of this procedure in the metallization of
plastics.13
This method has enabled preparation of conductive cotton fibers plated with Cu/Ni
and also metallization of PBZT, poly(p-phenylenebenzobisthiazole), fibers with Ag.14,15
Gold
plating on polyacrylonitrile (PAN) fibers has been accomplished at room temperature with an
electroless Au(I) thiosulfate bath.16
Analogous procedures operating at higher temperatures
enabled plating of polycarbonate fibers with Au, Cu and Ni.17
Metallization of aramid fibers
has been reported to occur after activating them with a combination of bases and Ag.18
Reported here are results from an investigation that employed electrochemical methods for
metallization of Kevlar fibers with Au. The aim was to achieve reproducible metallization of
Kevlar yarns because this material exhibits physical properties (such as tensile strength to
weight ratio) suitable for some tether applications.4 Selection of gold seemed logical given that
this metal is not affected by the corrosive space environment.2b
Several electrochemical and
electroless plating procedures were tested, among them, recently proposed methods that are
cyanide-free.19
Metal plating utilized Ni coated fibers as electrodes that were prepared via
conventional metallization procedures for plastics.13
Electrochemical Au deposition by means
of a thiosulfate bath yielded the best results, producing conductive yarns exhibiting significant
mass increases, negligible loss of flexibility and modest decreases in fiber tensile strength.
Experimental
All chemicals were used as received from the manufacturers; deionized water obtained from
a Barnstead D7401 purification system was employed to prepare all solutions. KCl, CHCl3,

86
SnCl2 2H2O, NH4Cl, KOH and NH4OH were supplied by Fischer whereas NiCl2 6H2O,
Na3Au(S2O3)2 xH2O and anhydrous citric acid were from Alfa. Aldrich supplied hexane,
K2PdCl4 and NaH2PO2 H2O; L-ascorbic acid was from J.T. Baker, CH3OH was obtained
from Aater, and Kevlar 49 yarn was provided by DuPont.
Experiments were conducted on samples of Kevlar yarn cut to lengths of 9 and 25 cm, then
tied at one end with a knot to prevent the separation of the individual fibers. All Kevlar
materials were rigorously cleaned via immersion in an ultrasonic bath containing first CH3OH,
then hexane and finally CHCl3. In each of these steps the polymeric materials were exposed to
ultrasound for 10 minutes and then air-dried. Metallization experiments for electroless coated
yarn were performed in water-jacketed glass containers (25 cm in diameter, 15 cm depth),
which allowed control of the reaction temperature. Electrochemically coated yarn was
metallized in clean open containers (beakers, petri dish) at room temperature. After every
chemical step described below, the resulting fibers were rinsed with deionized water and air-
dried. Adhesion of coatings was tested via a 10 min exposure to ultrasound of treated yarn
immersed in water to dislodge any metal not firmly bound to the fiber surface. Occasionally,
the results were confirmed using the adhesive tape test.20
Pretreatment of the fiber surfaces involved first a 1 min immersion of clean fibers in an
aqueous solution containing 1 g/L of SnCl22H2O, followed by exposure to a solution
containing 2 g/L of PdCl2 and 0.84 g/L of KCl for the same amount of time. This two-step
process lasted about 5 min The third pretreatment step consisted of electroless Ni plating,
which was conducted by immersing the sensitized Kevlar fibers for 5 minutes in a nickel bath
that contained 30 g/L NiCl2 6H2O, 60 g/L citric acid, 10 g/L NaH2PO2 H2O and 50 g/L
NH4Cl. This solution exhibited a natural pH of 9 – 9.4 and plating took place at 60 ºC.

87
Electrochemical Au metallization occurred via polarization of Ni-coated fibers submersed in an
Au bath containing 6.3 g/L Na3Au(S2O3)2 xH2O, 19.8 g/L sodium L-ascorbate, 15.2 g/L citric
acid and 11.2 g/L KOH. Alternatively, a commercial gold cyanide bath from SMC Inc. (of
proprietary composition) was also employed, diluted by a factor of ten with water yielding best
results. The fibers functioned as cathodes whereas the anode consisted of a Pt mesh wire and a
saturated Ag/AgCl electrode served as the reference. Electrochemical depositions were
controlled by means of a BAS CV-27 potentiostat. For comparison, a few experiments were
conducted in which Ni-plated fibers were subsequently metallized with an electroless Au
deposition procedure described in the literature.16
In this method the Au bath consisted of a
solution with 25.5 g/L Na3Au(S2O3)2 xH2O, 19.8 g/L sodium L-ascorbate, 15.2 g/L citric acid
and 11.2 g/L KOH. The reaction was carried out at room temperature and immersion times
ranged from 3 – 30 minutes.
Coated fibers were characterized in terms of mass gain and conductivity. Mass changes
were monitored throughout the coating steps with an analytical balance. The resistance of
treated fibers was measured by means of the two-point method using a digital ohm-meter from
IET Labs model LOM 4000; stretched samples were used to ensure consistency in the analysis.
Power output for coated fibers was quantified on an electrochemistry workstation with a
modified AFRDE4 Bi-Potentiostat (Pine Instrument Co.) set to galvanostatic mode with the
output I-V curves plotted with a BAS X-Y recorder. The current was stepped ~ 5-10 mA/s
while measuring both current passed and voltage dropped across the fiber. An Instron 1122-
4400R test machine served to determine the tensile strength of coated and uncoated fibers.
Surface morphology was examined with optical microscopy, scanning electron microscopy
(SEM) and transmission electron microscopy (TEM). For fibers plated with electroless

88
methods, SEM measurements were performed on a Zeiss DSM 940 microscope equipped with
an EDS detection system. Specimens were prepared by immobilizing yarn in plastic pipettes,
followed by sectioning the fibers at the pipette tip with a knife and sputter-coating with Au to
avoid charging effects. Yarn plated electrochemically was analyzed with a Zeiss EVO 50
VPSEM; these conducting materials needed no additional coating and specimens were
prepared by pressing metallized fibers onto C-coated tape. TEM analysis was carried out on a
Zeiss EM 10CR instrument using 95 nm thick slices of fibers prepared via microtoming. X-ray
diffraction (XRD) measurements employed a Bruker Smart APEX CCD diffractometer using a
Mo K() radiation, = 0.071 nm, or a Rigaku Miniflex instrument using Cu K() radiation,
= 0.154 nm.
Results and Discussion
Metal deposition on yarns involves chemical transformations taking place on the fiber
surface. Thus, the presence of impurities on the fiber surface was anticipated to affect the
efficiency of the plating processes. Shown in Figure 4-1 is an SEM image of ―as received‖
Kevlar fibers that were not subjected to cleaning. An average fiber diameter of 12 µm was
estimated from this image. Figure 4-2 depicts an SEM image of fibers subjected to the
cleaning procedure described above. The flattened and deformed fiber top ends resulted from
the sectioning procedure used to prepare the samples. Comparison of the two images reveals
that the cleaning procedure yields smooth fiber surfaces free of the contaminants (seen as
irregular objects) that are observed in the case of ―as received‖ yarns. A slight decrease in the
average fiber diameter to 11.2 µm is noticeable after the cleaning step. Presented in Figure 4-3

89
Figure 4-1. SEM image of sectioned ―as received‖ Kevlar fibers.
Figure 4-2. SEM image of clean Kevlar fibers after sectioning.

90
is the data obtained after exposing cleaned Kevlar fibers to Cu K(α) radiation. The intense
peaks at 2θ values of 20.3 and 22.6 degrees agree well with the signals (20.6 and 22.8) reported
previously,21
which have been assigned to equatorial scattering of X-rays by the fiber material.
Considering that the fibers were positioned perpendicular to the radiation beam, the
predominance of signals originating from radial scattering of X-rays in our experiments is not
surprising.
All metal depositions were performed with clean fibers in order to avoid the erratic and
inefficient plating that resulted when impurities were not rigorously eliminated from the yarn
surfaces.
0
20
40
60
80
100
120
140
160
180
0 20 40 60 80 100 120 140 160
2 Theta
Inte
nsit
y (
co
un
ts)
Figure 4-3. Diffractometer trace of clean Kevlar fibers exposed to Cu K(α) radiation.

91
Coated samples were selected for characterization and further treatment by examination of
color changes since fibers coated with the Ni electroless method display a dark-gray coloration
whereas Au coatings are bright red. Failed experiments were those producing non-uniform
plating, or brittleness resulting in flaking of the metal coating. Polymeric materials such as
Kevlar are devoid of surface groups able to bind metal ions and require pretreatment (surface
activation) to create nucleation sites that enable metal attachment.13
Surface activation is
believed to involve binding of Sn(II) ions to the surface of the polymeric material, followed by
deposition of Pd particles,
Sn2+
+ Pd2+
Sn4+
+ Pd (1)
Attempts to quantify gravimetrically the amounts of Sn and Pd present on the fiber surfaces
were unsuccessful. Small Pd particles derived from this process are thought to catalyze the
electroless Ni deposition since plating was successful only when the fibers were subjected to
surface activation. Immersion of surface-pretreated Kevlar yarn into the Ni electroless bath for
5 min induced uniform darkening of the fibers together with evolution of numerous bubbles
believed to be H2 gas.13
Removal of the bubbles from the fiber surface using glass rods
promoted the plating process. Depicted in Figure 4-4 is an image of the resulting material; the
coating is clearly noticeable particularly at the fiber tips. Significant damage to the coatings,
including fracturing, was induced by the sectioning procedures employed during preparation of
the SEM samples. On average, a single Ni plating step increases the fiber diameter to about 12
µm and the yarn mass by about 14% but larger changes occurred sporadically. EDS
measurements conducted on plated fibers detected Ni together with low amounts of Sn and Pd.

92
While the coatings appear uniform in Figure 4-4, examination of longer fiber segments
revealed the presence of uneven deposits and of places on the surface of the polymeric
materials that remained uncoated.
Earlier metallization studies using electroless Ni baths containing hypophosphite ions have
reported the formation of mixtures of materials including metallic nickel.13
For this reason, the
nature of the coatings was investigated by means of XRD.
Figure 4-4. SEM image of sectioned Kevlar fibers coated with a single treatment of electroless
Ni deposition.

93
Data represented with a continuous line in Figure 4-5 were obtained from fibers coated with
the electroless Ni bath. Reflections at 2θ = 40, a ―doublet‖ with maxima at 44.5 and
46.6 º, as well as signals at 68.2 and 82.1 degrees were detected together with the strong fiber
signals at lower angles shown in Figure 4-3. Weaker peaks were also observed at 2θ = 86.4,
105.2, 119.7, and 125.2 degrees in Figure 4-5. The broken line in Figure 4-5 shows a pattern
obtained after grinding coated fibers to a fine powder. Essentially the same reflections resulted
in both cases, except that the low angle signals due to scattering from the fibers are absent in
the powder case.
0
10
20
30
40
50
60
70
80
90
100
0 20 40 60 80 100 120 140 160
2 Theta
Inte
nsit
y (
co
un
ts)
K-Ni(F)
K-Ni(P)
Figure 4-5. XRD signals obtained using Cu K(α) radiation of Kevlar fibers coated with nickel,
K-Ni(F), and of powdered fibers coated with Ni, K-Ni(P).

94
Also, the intensities of the reflections are higher for the powder because this material exhibits a
larger surface area than that of fibers. While the signal with a maximum of 44.5 degrees that is
part of the doublet may be interpreted as corresponding to diffractions from the {111} planes
of metallic Ni, none of the other anticipated diffractions from the {200}, {220} and {311}
crystallographic planes (2θ = 51.8, 76.3 and 92.9 º, JCPDF card 4-0850) were detected.
Electroless Ni plating is known to yield some metallic Ni and also amorphous phosphides
(NixPy) that crystallize upon annealing at high temperatures to form Ni2P, Ni3P and Ni12P5.22-25
Attempts to match the diffraction data of the phosphides with the signals at 2θ > 35 degrees
shown in Figure 4-5 were unsuccessful. However, the data match well the diffractions from
metallic (fcc) Pd located at 2θ = 40.1, 46.7, 68.1 and 82.1 degrees arising from the {111},
{200}, {220} and {311} planes, (JCPDF card 46-1043). Even the weaker signals shown in
Figure 4-5 can be indexed as Pd reflections from the {222}, {400}, {331} and {420}
crystallographic planes (2θ = 86.6, 104.8, 119.3 and 124.6 º). Furthermore, the ―doublet‖ can
be identified as composed of reflections from Ni {111} planes at 44.5 degrees and a stronger
peak at 46.6 degrees due to diffractions from Pd {200} planes. Detection of metallic Pd
confirms the occurrence of reaction 1 and the low intensity of the XRD data is consistent with
EDS results indicating that only small amounts of palladium are present on the fiber surfaces.
Metallic Ni is clearly a minor product of the electroless process, which yields mainly
amorphous materials, presumably NixPy phases.22-25
Electroless Ni deposition using a
hypophosphite bath has been rationalized in terms of:13
Ni2+
+ 2H2PO2- + 2H2O Ni + 2H
+ + 2H2 + 2HPO3
2- (2)

95
The results of the present study indicate that reaction 2 fails to accurately represent the overall
deposition process since metallic Ni and H2 are just side products.
TEM images of a microtomed Kevlar fiber coated via the Ni electroless deposition method
are presented in Figure 4-6. Dark areas corresponding to deposited materials denser than the
polymeric matrix, which are not penetrated by the electron beam, and were detected only on
the fiber surface. Powder TEM samples derived from the plated fibers were suitable for
imaging the surface coatings.
Figure 4-6. TEM images of cross-sectioned slices of a Kevlar fiber plated using Ni electroless
deposition.
Presented in Figure 4-7 are images obtained at different magnifications from a surface
fragment of a plated fiber measuring several µm. Large irregular objects with dimensions
between 100 nm to 1 µm are present together with numerous nearly spherical particles
characterized by an average diameter of about 50 nm. Given the XRD results presented above,
Cross-section slice of
a Kevlar fiber
Fragments of the
coating

96
the particles are, most probably, composed of amorphous NixPy phases.
Yarn treated with the electroless Ni bath were the starting point of attempts to plate Au on
Kevlar fibers. This strategy was adopted because efforts to coat fibers pretreated just with the
Sn2+
/Pd2+
surface activation step were unsuccessful.
Figure 4-7. TEM images of a powder from Kevlar fibers exposed to the Ni electroless bath.

97
Only fibers with mass increase of at least 14% from the electroless Ni process served as
suitable substrates for plating using the room-temperature Au electroless bath based on
Na3Au(S2O3)2 and L-ascorbate ions as the reducing agents. Gold coating of PAN fibers
pretreated with a similar electroless Ni process was reported to require only 3 min of
immersion in the Au thiosulfate bath.16
In contrast; Au deposition onto Kevlar fibers was not
easily reproducible, requiring immersion times that varied between 5 to 30 min in order to
achieve a constant golden coloration of the coatings. Reduction of the Au(I) ions by ascorbate
ions on surface deposits generated by the electroless Ni bath can be represented by the reaction,
2Au+ + C6H7O6
- 2Au + C6H5O6
- + 2H
+ (3)
Presented in Figure 4-8 is a SEM image obtained after sectioning fibers that were plated with
the Au electroless method following the electroless Ni step. After such treatment, the fibers
exhibited an average diameter of 13.5 µm, which is a substantial change as compared with the
non-coated but cleaned material (diameter = 11.2 µm). As illustrated in the image sectioning
of the samples induced significant damage including fracturing of segments of the coating.
Separation of the metal coating from the substrate is observed in some cases, resulting in
hollow metallic tubes highlighted by the circles. Analogous observations were made in an
investigation that employed similar electroless plating baths to grow metal tubes using fibers as
sacrificial templates.17
The inset in Figure 4-8 displays a magnified view of the fiber
highlighted by an arrow in the main image. Apart from the fiber substrate, two different layers
are clearly visible; EDS measurements confirmed that Ni was present on the bottom layer
whereas the top layer consisted of Au. In contrast, coatings consisting of a single layer were

98
obtained previously upon metallizing PAN fibers with consecutive electroless Ni and Au
plating methods very similar to those employed in the present study.16
Compared in Figure 4-9
is a diffraction pattern of clean Kevlar fibers (black line) with that of fibers exposed
sequentially to Ni and Au electroless platings. Both patterns exhibit the signals at low angles
corresponding to X-ray scattering from the Kevlar materials.
Figure 4-8. SEM image of sectioned Kevlar fibers first coated using the electroless Ni bath
followed by treatment with the Au(I) thiosulfate electroless method. Inset: close-up of the area
that includes the fiber tip highlighted by an arrow in the main image.
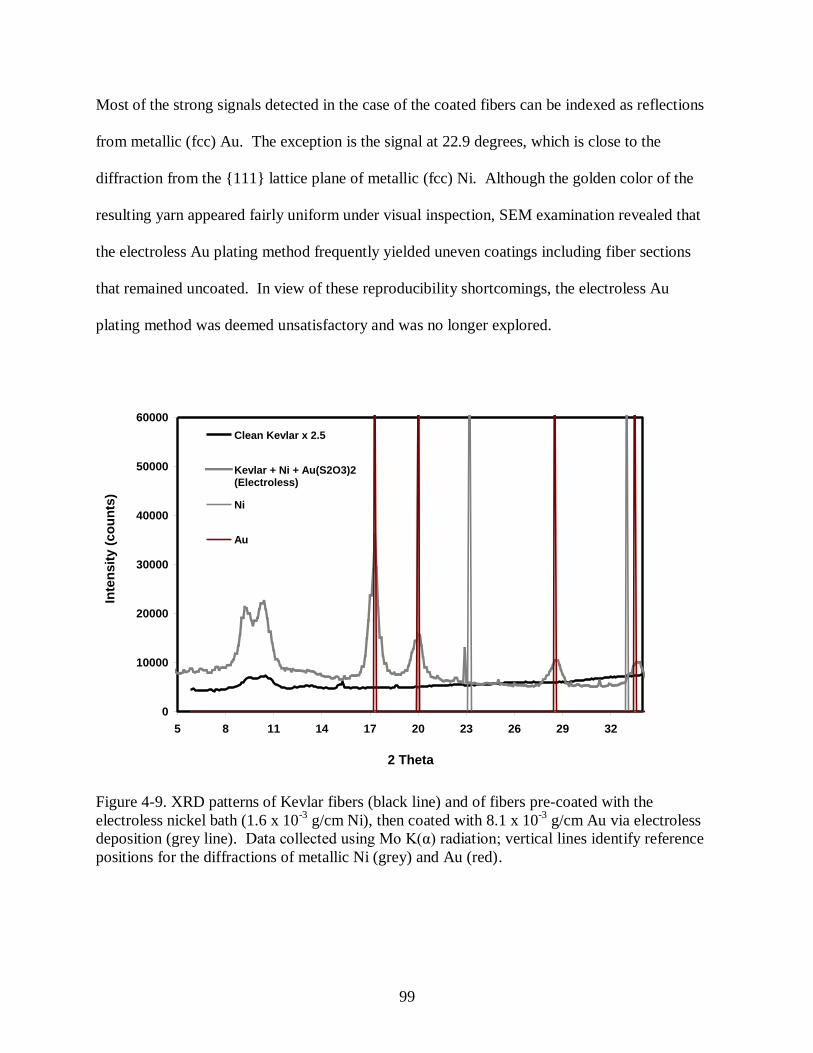
99
Most of the strong signals detected in the case of the coated fibers can be indexed as reflections
from metallic (fcc) Au. The exception is the signal at 22.9 degrees, which is close to the
diffraction from the {111} lattice plane of metallic (fcc) Ni. Although the golden color of the
resulting yarn appeared fairly uniform under visual inspection, SEM examination revealed that
the electroless Au plating method frequently yielded uneven coatings including fiber sections
that remained uncoated. In view of these reproducibility shortcomings, the electroless Au
plating method was deemed unsatisfactory and was no longer explored.
0
10000
20000
30000
40000
50000
60000
5 8 11 14 17 20 23 26 29 32
2 Theta
Inte
nsit
y (
co
un
ts)
Clean Kevlar x 2.5
Kevlar + Ni + Au(S2O3)2(Electroless)
Ni
Au
Figure 4-9. XRD patterns of Kevlar fibers (black line) and of fibers pre-coated with the
electroless nickel bath (1.6 x 10⁻³
g/cm Ni), then coated with 8.1 x 10⁻³
g/cm Au via electroless
deposition (grey line). Data collected using Mo K(α) radiation; vertical lines identify reference
positions for the diffractions of metallic Ni (grey) and Au (red).

100
Electrochemical experiments were performed on Kevlar yarn plated with the Ni electroless
method given that attempts to electroplate Au onto fibers treated only with the Sn2+
/Pd2+
surface activation step were unsuccessful. This result is not surprising since the very high
resistivity of fibers after the Sn2+
/Pd2+
procedure made them unsuitable as electrodes. In
contrast, fibers coated with a single electroless Ni deposition exhibited a typical resistivity of
about 20 ohm/cm, which enabled them to serve as cathodes. Initial experiments with such
fibers served to characterize the reaction parameters for Au electrodeposition with both the
thiosulfate and cyanide procedures described previously. The optimum deposition parameters
were identified empirically and correspond to a potential of -0.6 V vs. Ag/AgCl and a current
of -2.5 mA for the Au(S2O3)23-
system, and values of -1.09 V vs. Ag/AgCl and -2.5 mA were
determined for the Au(CN)2- system. In the NHE scale these values amount to -0.401 and -
0.891 V and are lower than the standard potentials, 0.153 and -0.595 V, respectively.19
Such
potential differences probably result from the high fiber resistance together with the reactant
concentrations employed in the present study that are lower than those of the standard states.
In both systems the electrochemical reduction of gold ions to gold atoms on a conductive
surface acting as the cathode can be represented in a simplistic fashion by reaction 4:
Au+ + e
- Au (4)
As anticipated, the net current output increased during Au coating in both systems because the
deposited gold lowers the resistance of the fibrous material and facilitates further metal plating.
Plating times between the range of 3-5 min produced uniform substrate coloration in the case
of the thiosulfate electrochemical system. The cyanide electrodeposition method required 1 h
to yield strongly adhering and dense coatings (average diameter = 12.9 µm) but the number of

101
fiber surface places left uncoated was markedly higher. Although both electrochemical
procedures produced coatings more uniform than those resulting from the electroless Au
deposition, the thiosulfate electroplating procedure was selected for further optimization since
this method involved shorter reaction times and avoided handling of fairly toxic solutions.
An important property of metallized fibers is robustness of the coatings, which was probed
via exposure of the coated yarn to ultrasound in H2O. Figures 4-10 to 4-12 are a series of SEM
images obtained at increasing magnifications of fibers first treated with the Ni electroless bath,
followed by exposure to ultrasound and then coated with Au using the thiosulfate
electrochemical procedure. Figure 4-10 shows a low magnification overview of a group of
fibers containing seemingly smooth coatings. Electroplating induced a large increase in
average fiber diameter to 15.9 µm as compared with that (12 µm) obtained after coating with
the electroless Ni bath. An interesting observation is that Au metallization started at the yarn
end connected to the external electrical circuit and propagated along the fiber axes. In contrast,
Au electrodeposition on yarn not exposed to ultrasound started simultaneously on numerous
places and extended via overlap of the growing coating. Tested yarns exhibited coating defects
including uncoated areas and fractures that were less numerous on fibers not subjected to the
ultrasound test. As shown in Figure 4-11, exposed sections of the polymer surface were
frequently found, indicating that segments of the Ni electroless coating were stripped from the
fibers by the ultrasound. Dislodgment of weakly adhering Ni/NixPy deposits left bare fiber
surface area where electrodeposition of Au was not possible. While coating fractures were less
frequent, they probably originate from to ultrasound-induced rupturing of defect regions in the
Ni/NixPy coatings. Obviously, the subsequent Au electrodeposition step was unable to close
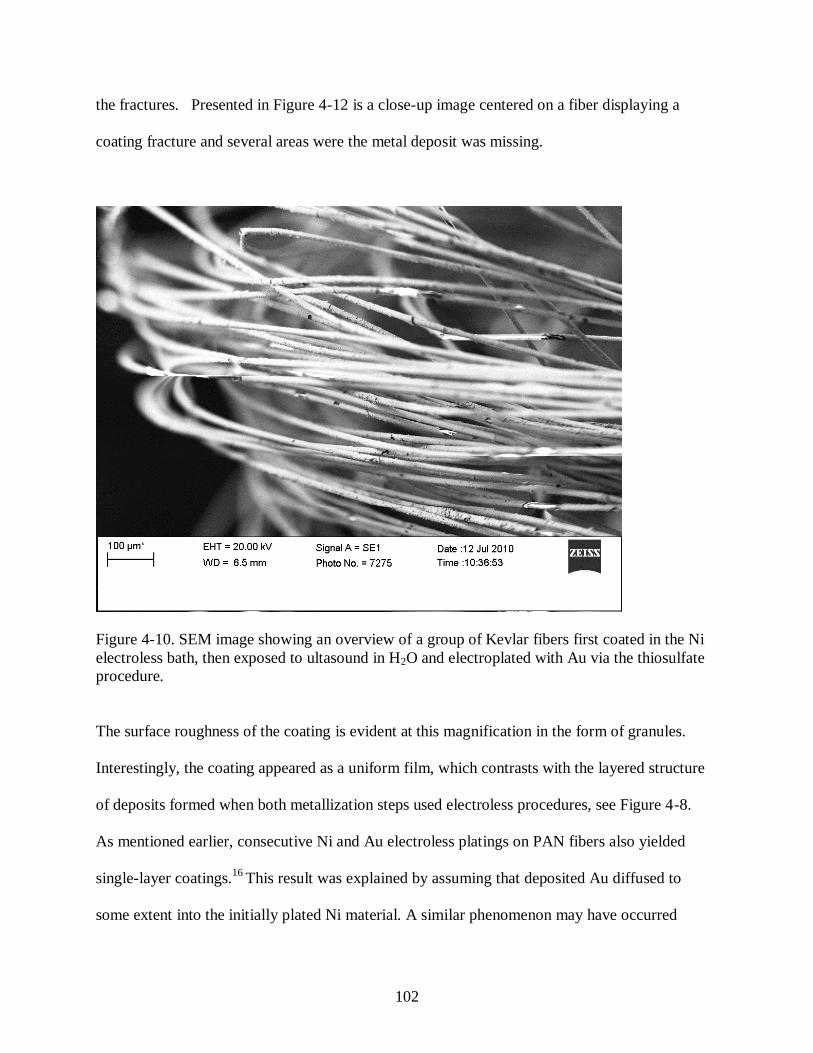
102
the fractures. Presented in Figure 4-12 is a close-up image centered on a fiber displaying a
coating fracture and several areas were the metal deposit was missing.
Figure 4-10. SEM image showing an overview of a group of Kevlar fibers first coated in the Ni
electroless bath, then exposed to ultasound in H2O and electroplated with Au via the thiosulfate
procedure.
The surface roughness of the coating is evident at this magnification in the form of granules.
Interestingly, the coating appeared as a uniform film, which contrasts with the layered structure
of deposits formed when both metallization steps used electroless procedures, see Figure 4-8.
As mentioned earlier, consecutive Ni and Au electroless platings on PAN fibers also yielded
single-layer coatings.16
This result was explained by assuming that deposited Au diffused to
some extent into the initially plated Ni material. A similar phenomenon may have occurred

103
Figure 4-11. SEM image of Kevlar fibers first coated in the Ni electroless bath, then exposed to
ultrasound in H2O and electroplated with Au via the thiosulfate procedure.
during Au electrodeposition onto Kevlar fibers, where the resulting coatings were at least 10
times thicker than those plated on PAN fibers.
Presented in Figure 4-13 are TEM images of a slice microtome from fibers that were
subjected to the ultrasound test. Shown on the top two images are different areas of the
sample, the darker regions correspond to surface regions of the fiber that contain coating.
Displayed on the bottom are high magnification images of regions highlighted by circles on the
top frames. These images provide evidence that numerous small particles (highlighted by
circles) exist inside the fibers. Since the particles were found within the polymer backbone
only after gold was plated, an obvious interpretation is that they consist of Au. Since the
presence of particles inside the fibers was observed exclusively after the ultrasound exposed
the initial Ni coating, the particle formation mechanism remains unclear.

104
Figure 4-12. High magnification SEM image of a Kevlar fiber first coated in the Ni electroless
bath, then exposed to ultrasound in H2O and electroplated with Au via the thiosulfate
procedure.
Further experiments showed that the adhesion problems could be solved through application
of multiple electroless Ni plating steps, each containing a sensitization step. Adhesion of the
coatings improved considerably when three consecutive electroless Ni depositions were carried
out prior to three successive Au electrochemical platings (e.g. Ni, Ni, Ni, Au, Au, Au). Defects
were rarely detected in coatings derived from this procedure, and the deposits were no longer
affected by ultrasound waves or by the adhesive tape test.
Mass changes determined during Au plating varied somewhat linearly with the number of
deposition steps and increases between 150-180 % were produced after three coatings.
Surprisingly, treatment of the fibers with the Sn2+
/Pd2+
surface activation method between
successive Au plating steps improved the efficiency of the subsequent coating step. On the

105
Figure 4-13. TEM images from 95 nm thick slices microtomed out of Kevlar fibers plated with
the electroless Ni bath, sonicated and metallized electrochemically with Au. Each bottom
picture corresponds to a magnified view of the area encircled on the corresponding top image.
other hand, nearly constant total mass increases of about 100 % resulted when surface
activated Kevlar fibers were subjected to three electroless Ni coating steps, yet the contribution
of each individual plating step was not equivalent. Figure 4-14 depicts a diffraction pattern
obtained from fibers plated three times in the electroless Ni bath followed by three gold
electrodepositions. Signals at 2θ angles of 38.3, 44.6, 64.8, 77.8, 82, 98.8, 111, 115.5 and
135.7 degrees were detected, which can be indexed as diffractions from the {111}, {200},
{220}, {311}, {222}, {400}, {331}, {420} and {422} lattice planes of metallic Au (JCPDF

106
card 4-0784). Despite the fact that the multistep plating method yielded large amounts of
coated Ni, and that EDS measurements confirmed the presence of this element on the fiber
surfaces, diffractions corresponding to metallic (fcc) nickel were not detected. These results
0
50
100
150
200
250
300
350
400
450
0 20 40 60 80 100 120 140 160
2 Theta
Inte
nsit
y (
co
un
ts)
Figure 4-14. XRD pattern obtained with Cu K(α) of Kevlar fibers coated three times via
electroless Ni deposition followed by three electrochemical Au platings.
are consistent with the data shown in Figure 4-5 and support the conclusion that most of the Ni
deposited via the electroless process is present as amorphous NixPy phases. Given the large
amounts of gold plated on the fiber surfaces via the multiple deposition method, and the small
Pd concentrations present in the coatings, any XRD signals corresponding to palladium are
obscured by the much more intense Au diffractions. Hence, in addition to the reflections
originating from metallic Au, only the signals at low angles due to scattering of X-rays by the

107
fibers are observed in Figure 4-14. Figure 4-15 shows an SEM image of fibers coated by
means of the multiple deposition procedure. As is evident from this Figure the coatings were,
in general, uniform but exhibited numerous ―grains‖.
Figure 4-15. SEM image of Kevlar fibers treated three times with the electroless Ni method,
then coated three times with Au via the thiosulfate electrodeposition procedure.
Presented in Figure 4-16 is an image at higher magnification of the fibers plated with the
multiple deposition method. The resulting fibers exhibit an average diameter of 17.5 µm and
numerous grains with sizes between 1 and 10 µm protruded from the coatings. The larger Au
crystallites found in the case of the Kevlar fibers seem to be a consequence of the specific
plating procedure used since multiple depositions were also employed in one of the previous

108
Figure 4-16. SEM image at higher magnification displaying coatings on Kevlar fibers treated
three times with the electroless Ni method, then coated three times with Au via
electrodeposition.
studies that generated smaller Au grains.26
The multiple step deposition procedure employed in
the present study suppressed significantly coating defects, particularly the occurrence of places
on the fiber surface that remained free of coating. However, fractures in the coating were not
entirely eliminated.
Compiled in Table 4-1 are results of mass increases and resulting conductivities from fibers
prepared in coating experiments involving three consecutive electroless Ni
platings combined with three successive electrochemical steps using the thiosulfate procedure.
Included are results obtained from fibers coated via a single electrodeposition using the
cyanide method. Fibers exhibiting weight increases between 60-120% after the electroless Ni

109
treatment exhibited resistance values (≤ 30 ohm/cm) low enough to enable Au plating with the
thiosulfate electrodeposition method. An exception occurred in the case of the cyanide method,
which enabled Au electrodeposition on fibers exhibiting mass increases of only 14% after the
Ni electrodeposition on fibers exhibiting mass increases of only 14% after the Ni electroless
treatment. The fact that the measured Au mass increases correlated with the number of
electrodeposition steps suggests that depletion of Au(S2O3)23-
ions within the bulk of the
solution may play a role during plating, which is consistent with the lower mass gain detected
when the yarn length doubled, compare entries 1 and 2 in Table 4-1. An interesting issue is that
the increase in percent mass from the electrodeposition steps refers to the masses measured
after and before Au plating. On the other hand, the mass percent increases from the electroless
process resulted from the difference between plated and non-plated fibers.
Table 4-1. Conductivity and mass change for metallized fibers of a length of 9 cm.
Treatment Mass
Change Ni
Mass Change
Au
Conductivity (S cm-1
)
K-Ni- Au(S2O3)23-
102.5 % 181.5 % aNT: 3.07; TW: 6.02
bK-Ni- Au(S2O3)2
3- 103 % 149 % NT: 1.19; TW: 3.17
cK-Ni- Au(S2O3)2
3- 110 % 49.5 % NT: 0.75; TW: 2.4
K-Ni- Au(CN)2- 14 % 100 % NT: 0.86; TW: 1.17
a: NT = fibers not twisted; TW = twisted fibers. b: Metallized fibers of a length of 25 cm. c:
Fibers sonicated for 10 min after electroless Ni coating, then electroplated with Au.
This means that the mass increases resulting from the Au deposition process are much larger
than those derived from the electroless treatment. An exception occurred for fibers subjected

110
to the ultrasound test, which experienced very similar increases of mass in both electroless and
electrochemical platings.
Resistivity measurements were performed on twisted and non-twisted metalized yarn; as
shown in Table 4-1, fiber twisting yielded a 3.6 increase in conductivity. Twisting of coated
fibers is known to increase their conductivity,14
which is rationalized on the basis that a higher
number of contact points between fibers exist in twisted yarn. This leads to additional
conductive pathways for electrons to migrate that are not available in non-twisted fibers.
Another general correlation is that, in general, raising the mass of deposited Au increased the
fiber conductivity. Comparison of entries 3 and 4 in Table 4-1 indicate that Au coating of
Kevlar fibers via a cyanide bath yielded conductivity similar to that obtained by means of the
thiosulfate method. Considering that the latter treatment is faster and safer, utilization of the
cyanide method offers no significant advantage.
Illustrated in Figure 4-17 are results from experiments that probed the ability of metallized
Kevlar fibers to sustain electrical currents utilizing freestanding, non-twisted yarn. To improve
electrical contact, yarn sections were wrapped in narrow strips of Al foil and clamped to
connectors linked to the potentiostat. This arrangement allowed determinations of power output
at variable distances along the yarn. The data presented in Figure 4-17a demonstrates that over
a yarn distance of 3.2 cm no limitation in the passage of current exists up to a power output of
9 W (the maximum value that can be determined by the potentiostat). Measurements
performed over a yarn distance of 6.5 cm showed that a point failure occurred at 1.8 W.
Systematic measurements showed that, on average, the Au metallized Kevlar fibers can sustain
a power output of 1 W.
Compared in Table 4-2 are tensile strength results determined from individual Kevlar

111
Figure 4-17. Plots of current versus voltage obtained for a 9 cm Kevlar yarn treated three times
with the electroless Ni method, then coated three times with Au via electrodeposition. Panel a)
displays results from measurements over a yarn distance of 3.2 cm; the data of panel b) is
indicative of a point failure at 1.8 W for a distance along the yarn of 6.5 cm.
monofilaments that are the components of the metallized materials. A single electroless Ni
plating step induces of modest decrease of 10% in the strength of the filaments, but an
additional electrochemical Au plating step with the cyanide method induces a larger decrease
of about 28 %. Metallization of the yarn with three consecutive electroless Ni platings and
three successive Au electrochemical depositions resulted in practically the same (27 %)
decrease in the strength of the monofilaments. Obviously, Au coatings affect the fiber strength
in a fashion more pronounced than Ni and also influence negatively the reproducibility of the
experiments.
Metallization of Kevlar fibers involving surface activation initiated by strong bases in
dimethy sulfoxide has been reported to yield coatings that have no negative effect on the fiber
tensile strength.18
Furthermore, the resulting coated materials were claimed to exhibit the same
conductivities as those of the pure metals employed in the coatings.
a b
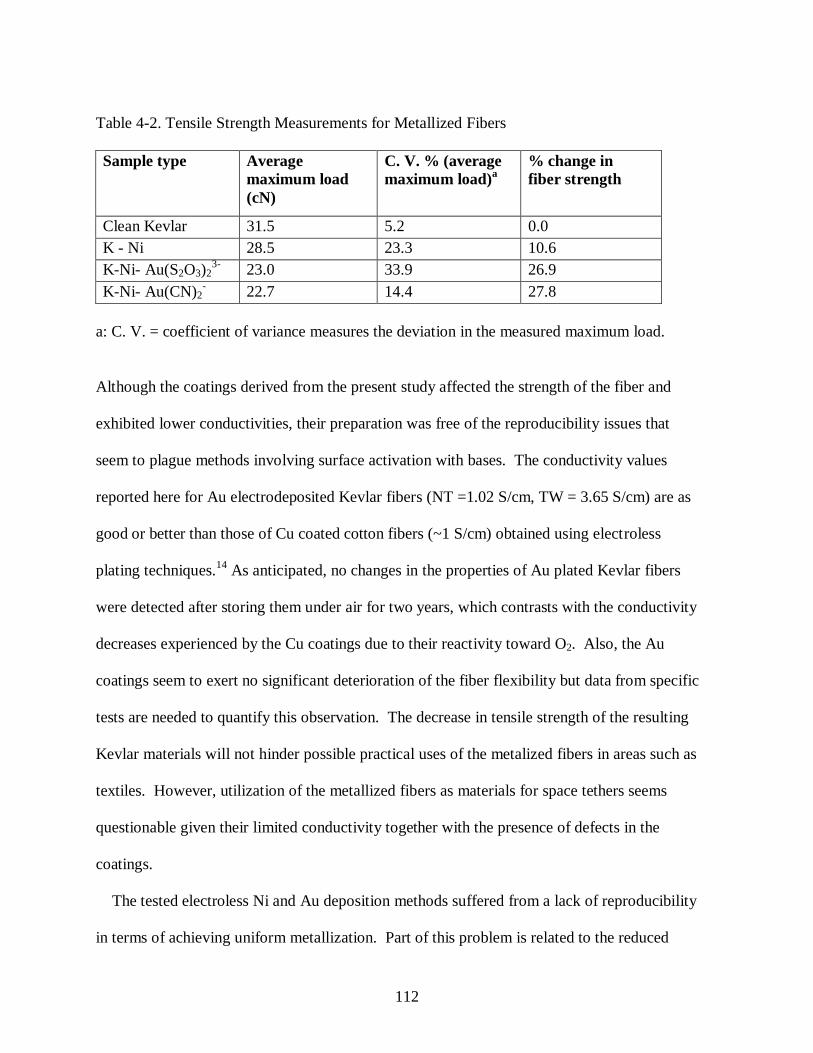
112
Table 4-2. Tensile Strength Measurements for Metallized Fibers
Sample type Average
maximum load
(cN)
C. V. % (average
maximum load)a
% change in
fiber strength
Clean Kevlar 31.5 5.2 0.0
K - Ni 28.5 23.3 10.6
K-Ni- Au(S2O3)23-
23.0 33.9 26.9
K-Ni- Au(CN)2- 22.7 14.4 27.8
a: C. V. = coefficient of variance measures the deviation in the measured maximum load.
Although the coatings derived from the present study affected the strength of the fiber and
exhibited lower conductivities, their preparation was free of the reproducibility issues that
seem to plague methods involving surface activation with bases. The conductivity values
reported here for Au electrodeposited Kevlar fibers (NT =1.02 S/cm, TW = 3.65 S/cm) are as
good or better than those of Cu coated cotton fibers (~1 S/cm) obtained using electroless
plating techniques.14
As anticipated, no changes in the properties of Au plated Kevlar fibers
were detected after storing them under air for two years, which contrasts with the conductivity
decreases experienced by the Cu coatings due to their reactivity toward O2. Also, the Au
coatings seem to exert no significant deterioration of the fiber flexibility but data from specific
tests are needed to quantify this observation. The decrease in tensile strength of the resulting
Kevlar materials will not hinder possible practical uses of the metalized fibers in areas such as
textiles. However, utilization of the metallized fibers as materials for space tethers seems
questionable given their limited conductivity together with the presence of defects in the
coatings.
The tested electroless Ni and Au deposition methods suffered from a lack of reproducibility
in terms of achieving uniform metallization. Part of this problem is related to the reduced

113
(laboratory) scale of the experiments since the reactions were carried out in relatively small
containers with respect to the length of the fibers to be coated. Sporadic contacts between the
fiber surfaces are unavoidable under such conditions, and are the most probably origin for the
reproducibility problems, which has been reported before.16
Despite the fact that the
electroless Ni deposition failed to produce metallic nickel on the fiber surfaces, the resulting
coatings (probably amorphous NixPy) aided the subsequent electrochemical Au deposition.
However, plating of such Ni compounds on the fiber surfaces may inherently yield non-
uniform coatings, negatively affecting the uniformity of the subsequent Au deposition.
Another concern related to the electroless Ni-phosphite baths is the evolution of H2 gas as a
byproduct of the deposition process. Since H2 is believed to form within the coatings as well,
evolution of this gas inevitably leaves behind voids in the plated material and also between
substrate and coated layer.25
Further efforts should be devoted to achieving uniform metallic
Ni coatings by means of deposition processes that are free of these problems.
Conclusions
Gold electrodeposition procedures were superior as compared to electroless methods in
terms of reproducibility, and yielded higher mass gains, better adhesion and lower resistance.
Inconsistencies encountered during Au deposition onto the surface of Kevlar fibers are likely
results of problems associated with the initial Ni coating treatment and not with the
electrodeposition method. Utilization of alternative electroless Ni deposition methods that
produce coatings of metallic Ni is expected to yield substantial improvements in the
metallization procedure. Although the metallization procedure presented here is somewhat
laborious, the coated Kevlar fibers seem capable of sustaining power outputs of about 1 W and

114
may be useful in applications involving ―smart‖ textiles.

115
References
(1) Mittal, K. L., Ed.; Metallized Plastics 7; V.S.P. Intl. Sci.: AH Zeist, 2001, and earlier
volumes.
(2) (a) Grossman, E.; Gouzman, I. Nucl. Instr. Meth. Phys. Res. B 2003, 208, 48-57. (b)
Packirisamy, S.; Schwam, S.; Litt, M. L. J. Mater. Sci. 1995, 30, 308-320.
(3) Lorenzini, E.; Sanmartín, J. Sci. Am. 2004, 291, 50-57.
(4) Frisbee, R. H. J. Propulsion Power 2003, 19, 1129-1154.
(5) Orban, R. J. Coated Fabrics 1989, 18, 246-254.
(6) Grace, M.; Chand, N.; Bajpai, S. K. J. Engineered Fibers Fabrics 2009, 4, 24-35.
(7) Park, S.; Jayaraman, S. MRS Bull. 2003, 28, 585-591.
(8) Kim, Y. K.; Lewis, A. F. MRS Bull. 2003, 28, 592-596.
(9) Intelligent Textiles for Personal Protection and Safety; Jayaraman, S.; Kiekens, P.;
Grancaric, A. M., Eds.; IOS Press: Amsterdam, Netherlands, 2005.
(10) Wearable Electronics and Photonics; Tao, X., ed.; Woodhead Publishing: Cambridge,
U.K., 2005.
(11) Bigg, D. M. Short Fibre-Polym. Compos. 1996, 144-167.
(12) McNaughton, T. G.; Horch, K. W. J. Neurosci. Methods 1996, 70, 103-110.
(13) Electroless Plating; Mallory, G. O.; Hajdu, J. B., Eds.; AESF: Orlando, 1990, Chapters 1
and 14.
(14) Liu, X.: Chang, H.; Huck, W.; Zheng, Z. ACS Appl. Mater. Interfaces 2010, 2, 529-535.
(15) (a) Vaia, R. A., Lee, J.-W.; Click, W.; Price, G.; Wang, C.-S. Mat. Res. Soc. Symp. Proc.
1998, 519(Organic/Inorganic Hybrid Materials), 201-209. (b) Vaia, R. A., Lee, J.-W., Wang,
C.-S., Click, W., Price, G. Chem. Mater. 1998, 10, 2030-2032.
(16) Pinto, N. J.; da Silva, A. N. R.; Fachini, E.; Carrion, P.; Furlan, R.; Ramos, I. Polym.
Preprints 2003, 44, 138-139.
(17) Ochanda, F.; Jones, Jr., W. E. Langmuir 2005, 21, 10791-10796.
(18) Burch, R. R. In Metallized Plastics 3; Mittal, K. L. Ed.; Marcel Dekker: New York, 1998;
pp. 45-54.

116
(19) Green, T. Gold Bull. 2007, 40, 105-114.
(20) Chong, E. K.; Stevens, M. G. In Metallized Plastics 5 & 6; Mittal, K. L. Ed.; V.S.P. Intl.
Sci.: Utrecht, 1998; pp. 409-422.
(21) Zavadskii, A. E.; Zakharova, I. M.; Zhukova, Z. N. Fibre Chem. 1998, 30, 6-10.
(22) Goldenstein, A. W.; Rostoker, W.; Schossberger, F. J. Electrochem. Soc. 1957, 104, 104-
110.
(23) Abrantes, L. M.; Fundo, A.; Jin, G. J. Mater. Chem. 2001, 11, 200-203.
(24) Kim, D.; Kim, J.; Yoon, J.; Lee, W.; Jung, S. Surf. Interface Anal. 2006, 38, 440-443.
(25) Chen, C.; Chen, B.; Hong, L. Chem. Mater. 2006, 18, 2959-2968.
(26) Winters, E. D.; Coronati, J. M.; Braski, D. M.; Watkins, D. R. Plating Surface
Finishing 2000, 87, 68-75.
(27) San March, C.; Moody, N. R.; Cordill, M. J.; Lucadamo, G.; Kelly, J. J.; Headley, D.;
Yang, N. Mat Res. Soc. Symp. Proc. 2004, 821, 281-286.

117
V. CONCLUSIONS
The results gathered in the present investigation demonstrate that H2O2 is generated in
solutions of SPEEK/PVA that contained air. Formation of the peroxide occurs in a synchronous
fashion with the consumption of oxygen. The kinetic data is consistent with a mechanism in
which the rate-determining step is the photochemical process that generates the polymeric
SPEEK radicals. Maximum rates of peroxide formation are obtained in neutral solutions, which
suggest that efficient formation of H2O2 on the surface of SPEEK/PVA fibers is feasible. The
decay of H2O2 that takes place at low oxygen concentrations in solution is not expected to occur
in the case of the fibers due to the high and constant [O2] that prevail on the surface of these
polymeric materials.
Results demonstrate a ―lock and key‖ mechanism for loading CH3NO2 into the pore cavities
via illumination with 350 nm photons for spin coated films on a mica substrate. In addition,
loading of CH3NO2 can be performed in two ways: 1) photolysis of PN films immersed in
CH3NO2; and 2) photolysis of PN films in air, followed by immersion in CH3NO2 for slower
loading rates. However, illuminated films in the presence of CH3NO2 with 350 nm or 420 nm
photons show reverse effects on the isomerization pathway which could present problems for
control and/or selectivity of the ligand within the PN material for specific applications. Further
investigations into this research should examine azobenzene derivatives that are less sensitive to
polar solvents to gain greater control on the isomerization of the ligands in the presence of highly
polar liquids. In addition, efforts to make free standing films (detached from the mica substrate)
should be pursued to verify mass transport results obtained in this study, which might be affected
to some degree by the mica substrate.

118
At present, Sol1-3 powder seems reasonable for sensitization testing for the coalescence
model. On the other hand, utilization of this material as an ―on/off‖ safety switch will require a
greater understanding of the solvent effects induced on the ligand in the presence of CH3NO2.
Future efforts should be directed towards synthesizing smaller PN particles of uniform size with
pore structure (bcc) similar to the one of spin coated films in efforts to correlate mass transport
results for the inclusion of CH3NO2.
Gold electrodeposition procedures were superior as compared to electroless methods in terms
of reproducibility, and yielded higher mass gains, better adhesion and lower resistance.
Inconsistencies encountered during Au deposition onto the surface of Kevlar fibers are likely
results of problems associated with the initial Ni coating treatment and not with the
electrodeposition method. Utilization of alternative electroless Ni deposition methods that
produce coatings of metallic Ni is expected to yield substantial improvements in the
metallization procedure. Although the metallization procedure presented here is somewhat
laborious, the coated Kevlar fibers seem capable of sustaining power outputs of about 1 W and
may be useful in applications involving ―smart‖ textiles.

119
References
(1) Gandhi, M. V.; Thompson, B. S. Smart Materials and Structures; Chapman and Hall:
London, 1992.
(2) Schwartz, M. Encyclopedia of Smart Materials; John Wiley and Sons: New York, NY, 2002.
Vol. 1.
(3) Shakeri, C.; Noori, M. N.; Hou, Z. Smart Materials and Structures a Review. Materials for
the New Millennium, Proceedings of the Material Engineering Conference, 4th
, Washington
D. C., Nov. 10-14, 1996, 2, 863.
(4) Yoshida, M.; Lahann, J. ACS Nano 2008, 2, 1101-1107.
(5) Shahinpoor, M.; Schneider, H. Intelligent Materials; Royal Society of Chemistry:
Cambridge, 2008.
(6) Kornbluh, R. et al. Electroactive polymer (EAP) Actuators as Artificial Muscles: Reality,
Potential and Challenges; SPIE Press: Bellingham, 2004.
(7) Kumar, A.; Srivastava, A.; Galaev, T.; Mattiasson, B. Prog. Polym. Sci. 2007, 32, 1205-
1237.
(8) Zhang, H.; Han, J.; Yang, B. Adv. Funct. Mater. 2010, 20, 1533-1550.
(9) Corriu, R.; Mehdi, A.; Reyé, C. J. Organomet. Chem. 2004, 689, 4437-4450.
(10) Varadan, V. K. Proc. SPIE 2001, 4591, 28-38.
(11) Garg, D.; Zikry, M.; Anderson, G.; Smart Mater. Struct. 2001, 10, 610-623.
(12) Zielecka, M.; Bujnowska, E. Prog. Org. Coat. 2006, 55, 160-167.
(13) Saito, H.; Takai, K.; Takazawa, H.; Yamauchi, G. Mater. Sci. Res. Int. 1997, 3, 216-219.
(14) Lazar, M. A.; Tadvani, J. K.; Tung, W. S.; Lopez, L.; Daoud, N. A. Innovations in thin Film
Processing and Characterization (ITFPC 2009). IOP Conference Series: Materials Science
and Engineering 2010, 12, 1.
(15) Wong, C. P.; Xu, J.; Zhu, L.; Li, Y.; Sun, Y.; Lu, J. ; Dong, H. Proceedings of the IEEE
CPMT Conference on High Density Microsystem Design, Packaging, and Failure Analysis,
7th
, Shanghai, China, June 27 – 30, 2005, 149.
(16) Barthlott, W.; Ehler, N.; Raster- Eletronenmikroskopie der Epidermis- Oberflachen von
Spermatophyten. Tropische und Subtropishe pflanzenwelt 1977, 19, 1-110.
120
(17) Crick, R. C.; Parkin, I. P. Chem. Eur. J. 2010, 16, 3568-3588.
(18) Xia, F.; Jiang, L. Adv. Mater. 2008, 20, 2842-2858.
(19) Lim, H. S.; Kwak, D.; Lee, D. Y.; Lee, S. G.; Choi, K. J. Am. Chem. Soc. 2007, 129, 4128-
4129.
(20) Parkin, I. P.; Palgrave, R. G. J. Mater. Chem. 2005, 15, 1689-1695.
(21) Linsebigler, A. L.; Lu, G.; Yates, J. T. Chem. Rev. 1995, 95, 735-758.
(22) Mills, A.; Crow, M. J. Phys. Chem. C 2007, 111, 6009-6016.
(23) Kang, H.; Liu, H.; Phillips, J. A.; Cao, Z.; Kim, Y.; Chen, Y.; Yang, Z.; Li, J.; Tan, W.
Nano Lett. 2009, 9, 2690-2696.
(24) Amabilino, D. B. Chirality at the Nanoscale: Nanoparticles, Surfaces, Materials and more;
Wiley-VCH: Weinheim, 2009.
(25) Nagamani, S. A.; Nirikane, Y.; Tamaoki, N. J. Org. Chem. 2005, 70, 9304-9313.
(26) Liu, N. ; Chen, Z. ; Dunphy, D. ; Jiang, Y. ; Assink, R.; Brinker, C. Angew. Chem., Int. Ed.
2003, 42, 1731-1734.
(27) Liu, N.; Dunphy, D. R.; Atanassov, P.; Bunge, S. D.; Chen, Z.; Lopez, G. P.; Boyle, T. J.;
Brinker, C. J. Nano Lett. 2004, 4, 551-554.
(28) Tao, X. Wearable Electronics and Photonics; Woodhead publishing Limited: Cambridge,
U. K., 2005.
(29) Westbrook, P.; Priniotakis, G. Intelligent/smart materials and textiles: an overview;
Woodhead publishing Limited: Cambridge, U. K., 2005.
(30) Lorenzini, E.; Sanmartin, J. Electrodynamic Tethers in Space; Scientific American August
2004, 50-57.
(31) Coyle, S.; Wu, Y.; Lau, K.; Rossi, D. D. ; Wallace, G. ; Diamond, D. D. Smart
Nanotextiles : A Review of Materials and Applications ; MRS Bulletin, 2007, 32, 434.
(32) Mallory, G. O.; Hajdu, J. B., Eds.; Electroless Plating; AESF: Orlando, 1990.
(33) Vaia, R. A.; lee, J. W.; Wang, C.S.; Click, B.; Price, G. Chem. Mater. 1998, 10, 2030-2032.
(34) Dong, H.; Fey, E.; Gandelman, A.; Jones, W. E. Chem. Mater. 2006, 18, 2008-2011.

121
(35) Little, B.; Li, Y.; Cammarata, G.; Mills, G. ACS Appl. Mater. Interfaces, preparing for
submission.
(36) Liu, X.: Chang, H.; Huck, W.; Zheng, Z. ACS Appl. Mater. Interfaces 2010, 2, 529-535.
(37) Carlini, C.; Angiolini, L.; Caretti, D.; Corelli, E. Polym. Advanced Technol. 1996, 7, 379-
384.
(38) Gu, C.; Xu, Y.; Liu, Y.; Pan, J. J.; Zhou, F.; He, H. Optical Mater. 2003, 23, 219-227.
(39) Tian, H.; Yang, S. Chem. Soc. Rev. 2004, 33, 85-97.
(40) Ercole, F.; Davies, T. P.; Evans, R. A. Polym. Chem. 2010, 37, 37-54.
(41) Irie, M.: Ikeda, T. In Functional Monomers and Polymers; Takemoto, K.; Ottenbrite, R. M.;
Kamachi, M. Eds.; Marcel Dekker: New York, 1997; p. 65-116.
(42) (a) Malone, K.; Weaver, S.; Taylor, D.; Cheng, H.; Sarathy, K. P.; Mills, G. J. Phys. Chem.
B 2002, 106, 7422-7431. (b) Weaver, S.; Taylor, D.; Gale, W.; Mills, G. Langmuir 1996, 12,
4618-4620.
(43) Organic Photochromic and Thermochromic Compounds; Crano, J; R. Guglielmetti, R.,
Eds.; Kluwer Academic/Plenum Publishers: New York, 1999; Vol. 2.
(44) (a) Korchev, A. S. ; Konovalova, T.; Cammarata, V.; Kispert, L.; Slaten, B. L.; Mills, G.
Langmuir 2006, 22, 375-384. (b) Korchev, A. S.; Shulyak, T. S.; Slaten, B. L.; Gale, W. F.;
Mills, G. J. Phys. Chem. B 2005, 109, 7733-7745. (c) Korchev, A. S.; Sartin, M.; Mills, G.; B.
L. Slaten, B. L.; Gale, W. F. In Clusters and Nano-Assemblies: Physical and Biological
Systems; Jena, P.; Khanna, S. N.; Rao, B. K.; Eds, World Scientific Publishing Co.: Singapore,
2005; 371-377. (d) Korchev, A. S.; Bozak, M. J.; Slaten, B. L.; Mills, G. J. Am. Chem. Soc.
2004, 126, 10-11.
(45) Gilbert, A.; Baggott, J. Essentials of Molecular Photochemistry; CRC Press: Boca Raton,
1991; Chapter 7.
(46) Ulanski, P.; Bothe, K.; Rosiak, J. M.; von Sonntag, C. Macromol. Chem. Phys. 1994, 195,
1443-1461.
(47) Neta, P.; Grodkowski, J.; Ross, A. B. J. Phys. Chem. Ref. Data 1996, 25, 709-1050.
(48) Lien, L.; Fellows, C. M.; Copeland, L.; Hawkett, B. S.; Gilbert, R, G. Aust. J. Chem. 2002,
55, 507.
(49) von Sonntag, C.; Bothe, E.; Ulanski, P.; Adhikary, A. Radiat. Phys. Chem. 1999, 55, 599-
603.

122
(50) Bielski, B. H.; Cabelli, D. E.; Arudi, R. L.; Ross, A. B. J. Phys. Chem. Ref. Data 1985, 14,
1041-1100.
(51) Görner, H. Photochem. Photobiol. 2006, 82, 801-808.
(52) Radschuwelt, A.; Rüttinger, H.-H.; Nuhn, P.; Wohlrab, W.; Huschka, C. . Photochem.
Photobiol. 2001, 73, 119-127.
(53) Pitts, Jr., J. N.; Letsinger, R. L.; Taylor, R. P.; Patterson, J. M.; Recktenwald, G.; Martin, R.
B. J. Am. Chem. Soc. 1959, 81, 1068-1077.
(54) (a) Winkelmann, K.; Calhoun, R. L.; Mills, G. J. Phys. Chem. A 2006, 110, 13827-13835.
(b) Calhoun, R. L.; Winkelmann, K.; Mills, G. J. Phys. Chem. B 2001, 105, 9739-9746. (c)
Weaver, S.; Mills, G. J. Phys. Chem. 1997, 101, 3769-3775.
(55) Gonzalez, M. C.; Le Roux, G. C.; Rosso, J. A.; Braun, A. M. Chemosphere 2007, 69, 1238-
1244.
(56) Schreuder-Gibson, H.; Truong, Q.; Walker, J. E.; Owens, J. R.; Wander, J. D.; Jones, Jr., W.
E. MRS Bulletin 2003, 574-578.
(57) Singh, A.; Lee, Y.; Dressick, W. J. Adv. Mater. 2004, 16, 212-215.
(58) (a) Wagner, G. W.; Sorrick, D. C.; Procell, L. R.; Brickhouse, M. D.; Mcvey, I. F.;
Schwartz, L. I. Langmuir 2007, 23, 1178-1186. (b) Wagner, G. W.; Yang, Y.-C. Ind. Eng.
Chem. Res. 2002, 41, 1925-1928.
(59) (a) Hong, K. H.; Sun, G. J. Appl. Polym. Sci. 2009, 112, 2019-2026. (b) Hong, K. H.; Sun,
G. J. Appl. Polym. Sci. 2008, 109, 3173-3179. (c) Hong, K. H.; Sun, G. Polym. Eng. Sci. 2007,
47, 1750-1755.
(60) Heller, H. G.; Langan, J. R. J. Chem. Soc., Perkin Trans. 2 1981, 341-343.
(61) Kormann, C.; Bahnemann, D. W.; Hoffmann, M. R. Environ. Sci. Technol. 1988, 22, 798-
806.
(62) Stefanic, I.; Asmus, K.-D.; Bonifacic, M. Phys. Chem. Chem. Phys. 2003, 5, 2783-2789.
(63) Wilkinson, F.; Brummer, J. G. J. Phys. Chem. Ref. Data 1981, 10, 809-999.
(64) Mosinger, J.; Mosinger, B. Experientia 1995, 51, 106-109.
(65) Ramseier, M.; Senn, P.; Wirz, J. J. Phys. Chem. A 2003, 107, 3305-3315.
(66) Beckett, A.; Porter, G. Trans. Faraday Soc. 1963, 59, 2038-2050.

123
(67) Fickett, W. Am. J. Phys. 1979, 47, 1050-1059.
(68) Tarver, C. M. Shock Compression of Solids VI; Springer-Verlag; New York City, NY: 2003,
Chapter 10.
(69) Milne, A. M.; Bourne, N. K. AIP Conference Proceedings 2001, 620 (Shock Compression of
Condensed Matter, Part 2) pp. 914-917.
(70) Engelke, R. Phys. Fluids 1983, 26, 2420-2424.
(71) Cartwright, M.; Lloyd-Roach, D.; Simpson, P. J. J. Energy. Mat. 2007, 25, 111-127.
(72) Zeman, S. Struct. Bond 2007, 125, 195-271.
(73) Field, J. E. Acc. Chem. Res. 1992, 25, 489-496.
(74) Borisenok, V. A.; Bel‘skii, V. M. Russ. J. Phys. Chem. B 2008, 2, 187-193.
(75) Ramaswamy, A. L. J. Energ. Mat. 2006, 24, 35-65.
(76) a) Liu, N. G.; Dunphy, D. R.; Atanassov, P.; Bunge, S. D.; Chen, Z.; Lopez, G. P,; Boyle, T.
J.; Brinker, C. J. Nano Lett. 2004, 4, 551-554. b) Liu, N. G.; Chen, Z.; Dunphy, D. R.; Jiang,
B.; Assink, R. A.; Brinker, C. J. Angew. Chem. Int. Ed. 2003, 42, 1731-1734.
(77) Reduner, E. Nanoscopic Materials: Size-dependent Phenomena; RSC Publishing,
Cambridge, UK: 2006, chapters 6 and 7.
(78) Spizer, D; Comet, M.; Baras, C.; Pichot, V. J. Phys. & Chem. of Solids 2010, 71, 100-108.
(79) Dattlebaum, D.; Sheffield, S.; Stahl, D.; Dattlebaum, A.; Trott, W.; Engelke, R. Influence of
Hot Spot Features on the Initiation Characteristics of Heterogeneous Nitromethane (in
press)
(80) Sanchez, C.; Boissière, C.; Grosso, D.; Laberty, C. ; Nicole, L. Chem. Mater. 2008, 20, 682-
737.
(81) Hoffmann, F.; Cornelius, M.; Morell, J.; Fröba, M. Angew. Chem. Int. Ed. 2006, 45, 3216-
3251.
(82) Grosso, D. et al. Adv. Funct. Mater. 2004, 14, 309-322.
(83) Liu, N.; Dunphy, D. R.; Rodriguez, M. A.; Singer, S. Brinker, J. Chem. Commun. 2003,
1144-1145.
(84) Kruk, M.; Jaroniec, M. Chem. Mater. 2001, 13, 3169-3183.

124
(85) Jaroniec, M.; Solovyov, L. Langmuir 2006, 22, 6757-6760.
(86) Lin-Vien, D et al. The handbook of Infrared and Raman Characteristic Frequencies of
Organic Molecules; Academic Press Inc, San Diego, CA: 1991, chapters 9 and 10.
(87) Brinker, C. J. and Scherer, G. W. Sol-Gel Science: The Physics and Chemistry of Sol-Gel
Processing; Academic Press, Inc., San Diego, CA: 1990, chapter 3.
(88) Reichardt, C. Solvent and Solvent Effects in Organic Chemistry; VCH Publishers, New
York, NY: 1988, chapter 5.
(89) Wildes, P. D.; Pacifici, J. G.; Irick, G. I.: Whitten, D. G. J. Amer. Chem. Soc. 1971, 2004-
2008.
(90) Schanze, K. S.; Mattox, T. F.; Whitten, D. G. J. Org. Chem. 1983, 2808-2813.
(91) Mittal, K. L., Ed.; Metallized Plastics 7; V.S.P. Intl. Sci.: AH Zeist, 2001, and earlier
volumes.
(92) (a) Grossman, E.; Gouzman, I. Nucl. Instr. Meth. Phys. Res. B 2003, 208, 48-57. (b)
Packirisamy, S.; Schwam, S.; Litt, M. L. J. Mater. Sci. 1995, 30, 308-320.
(93) Lorenzini, E.; Sanmartín, J. Sci. Am. 2004, 291, 50-57.
(94) Frisbee, R. H. J. Propulsion Power 2003, 19, 1129-1154.
(95) Orban, R. J. Coated Fabrics 1989, 18, 246-254.
(96) Grace, M.; Chand, N.; Bajpai, S. K. J. Engineered Fibers Fabrics 2009, 4, 24-35.
(97) Park, S.; Jayaraman, S. MRS Bull. 2003, 28, 585-591.
(98) Kim, Y. K.; Lewis, A. F. MRS Bull. 2003, 28, 592-596.
(99) Intelligent Textiles for Personal Protection and Safety; Jayaraman, S.; Kiekens, P.;
Grancaric, A. M., Eds.; IOS Press: Amsterdam, Netherlands, 2005.
(100) Wearable Electronics and Photonics; Tao, X., ed.; Woodhead Publishing: Cambridge,
U.K., 2005.
(101) Bigg, D. M. Short Fibre-Polym. Compos. 1996, 144-167.
(102) McNaughton, T. G.; Horch, K. W. J. Neurosci. Methods 1996, 70, 103-110.
(103) Electroless Plating; Mallory, G. O.; Hajdu, J. B., Eds.; AESF: Orlando, 1990, Chapters 1
and 14.

125
(104) Liu, X.: Chang, H.; Huck, W.; Zheng, Z. ACS Appl. Mater. Interfaces 2010, 2, 529-535.
(105) (a) Vaia, R. A., Lee, J.-W.; Click, W.; Price, G.; Wang, C.-S. Mat. Res. Soc. Symp. Proc.
1998, 519(Organic/Inorganic Hybrid Materials), 201-209. (b) Vaia, R. A., Lee, J.-W.,
Wang, C.-S., Click, W., Price, G. Chem. Mater. 1998, 10, 2030-2032.
(106) Pinto, N. J.; da Silva, A. N. R.; Fachini, E.; Carrion, P.; Furlan, R.; Ramos, I. Polym.
Preprints 2003, 44, 138-139.
(107) Ochanda, F.; Jones, Jr., W. E. Langmuir 2005, 21, 10791-10796.
(108) Burch, R. R. In Metallized Plastics 3; Mittal, K. L. Ed.; Marcel Dekker: New York, 1998;
pp. 45-54.
(109) Green, T. Gold Bull. 2007, 40, 105-114.
(110) Chong, E. K.; Stevens, M. G. In Metallized Plastics 5 & 6; Mittal, K. L. Ed.; V.S.P. Intl.
Sci.: Utrecht, 1998; pp. 409-422.
(111) Zavadskii, A. E.; Zakharova, I. M.; Zhukova, Z. N. Fibre Chem. 1998, 30, 6-10.
(112) Goldenstein, A. W.; Rostoker, W.; Schossberger, F. J. Electrochem. Soc. 1957, 104, 104-
110.
(113) Abrantes, L. M.; Fundo, A.; Jin, G. J. Mater. Chem. 2001, 11, 200-203.
(114) Kim, D.; Kim, J.; Yoon, J.; Lee, W.; Jung, S. Surf. Interface Anal. 2006, 38, 440-443.
(115) Chen, C.; Chen, B.; Hong, L. Chem. Mater. 2006, 18, 2959-2968.
(116) Winters, E. D.; Coronati, J. M.; Braski, D. M.; Watkins, D. R. Plating Surface
Finishing 2000, 87, 68-75.
(117) San March, C.; Moody, N. R.; Cordill, M. J.; Lucadamo, G.; Kelly, J. J.; Headley, D.;
Yang, N. Mat Res. Soc. Symp. Proc. 2004, 821, 281-286.