finaccess business – supply - central bank of kenya of kenya finaccess business – supply: bank...
TRANSCRIPT

FinAccess Business – supply Bank Financing oF SMES in kEnya
sepTeMBeR 2015
Central Bank of Kenya

FsD kenyaFinancial Sector Deepening
The Kenya Financial Sector Deepening (FSD) programme was established in early 2005 to support the development of financial markets in Kenya as a means to stimulate wealth creation and reduce poverty. Working in partnership with the financial services industry, the programme’s goal is to expand access to financial services among lower income households and smaller enterprises. It operates as an independent trust under the supervision of professional trustees, KPMG Kenya, with policy guidance from a Programme Investment Committee (PIC). Current funders include the UK’s Department for International Development (DFID), the Swedish International Development Agency (SIDA), and the Bill and Melinda Gates Foundation.
Government of Kenya
FinAccess Business – Supply: Bank Financing of SMEs in Kenya
This report was commissioned by Central Bank of Kenya (CBK), The World Bank and FSD Kenya. The findings, interpretations and conclusions are those of the authors and do not necessarily represent
those of CBK, WB and FSD Kenya, its Trustees and partner development agencies.
Central Bank of Kenya

FinACCeSS BuSineSS – SupplyBAnK FinAnCinG oF SMeS in KenyA • i
Table of contents
TABle oF ConTenTS iliST oF TABleS AnD FiGureS iiliST oF ABBreviATionS ivACKnoWleDGeMenTS viexeCuTive SuMMAry vii
Chapter 1inTroDuCTion 1
Chapter2overvieW oF The FinAnCiAl SeCTor in KenyA 32.1 Asset quality in the banking Sector 42.2 Segmentation within the banking sector: a matrix by size and ownership 4
Chapter 3DATA AnD MeThoDoloGy 8
Chapter 4eMpiriCAl FinDinGS 94.1 Bank financing of SMEs 9
4.2 Characteristics of business lending in Kenya in 2013 124.3 Segmentation of the banks by business model 184.4 Key drivers and obstacles to bank involvement with SMEs 20
Chapter 5FinAnCiAl ServiCeS AnD lenDinG proDuCTS 235.1 Leasing and hire purchase 235.2 Invoice discounting and factoring 235.3 Equity finance 24
Chapter 6enABlinG environMenT 266.1 Legal and regulatory framework 256.2 Government and donor involvement 27
Chapter 7ConCluSionS AnD reCoMMenDATionS 29
reFerenCeS 32

ii • FinAccess Business – supplyBAnk FinAncing oF sMes in kenyA
Figures, tables and boxes
BoxeSBox 1: Reverse factoring: experience from Mexico: 23
Box 2: Factoring scheme in Peru: 24
FiGureSFigure 1: Non-performing loans as a share of total loans 4
between 2001 and 2013
Figure 2: Inflation rates (Fig. A) and Interest rates (Fig. B) between 5 2010–11 and 2014
Figure 3: Size of the total SME finance portfolio by bank 10 size (left) and proportion of SME finance to total lending in the whole banking industry (right)
Figure 4: Share of SME loans in overall loan portfolio by 11 bank size and ownership
Figure 5: International comparison of the share of SME 11 lending to total lending
Figure 6: Average percentage of SME finance revenues by 12 product type in different countries
Figure 7: Purpose of SME loans in different countries 12
Figure 8: Non-performing loans in SME finance by bank size 16 and ownership
Figure 9: Value of loan write-offs in 2013 as a % of total 16 loan portfolio by bank size and ownership
Figure 10: Main lending technologies used by the banks with SMEs, 17 categorised by bank size and ownership
Figure 11: Reliance on credit scoring in SME finance by 18 bank size and ownership
Figure 12: Drivers for bank involvement with SMEs 21
Figure 13: Obstacles to bank involvement with SMEs 21
Figure 14: Issues affecting SME lending 25
Figure 15: Effect of prudential regulations on involvement 25 with SMEs (number of banks)
Figure 16: Could Government increase appeal of SME 26 lending through
Figure 17: Credit bureau use and effectiveness 27
TABleSTable 1: Prudentially regulated financial institutions in Kenya 3
Table 2: A 3x3 matrix of the Kenyan commercial banking 5 sector as of December 2013
Table 3: Characteristics of Kenya financial sector by size 6 and ownership of the banks as of December 2013
Table 4: Maximum thresholds of loan size (KSh), business 9 turnover (KSh) and number of employees in the definition of business size as of December 2013
Table 5: Ratio of loan accounts to deposit accounts and 12 average loan size by segment as of December 2013
Table 6: Average maturity (months) of loans for business 13 clients by bank size and ownership in 2013*
FinACCeSS BuSineSS – SupplyBAnK FinAnCinG oF SMeS in KenyA • iii
Figures, tables and boxes
Table 7: Average interest rates for business clients by bank 13 size and ownership in 2013
Table 8: Composition of SME portfolio by lending product 14 and bank size (value and volume)
Table 9: Composition of SME portfolio by lending product 15 and bank ownership (value and volume)
Table 10: Sectoral distribution of lending by size of the firms 15
Table 11: Overview of business models 18
Table 12: Specific obstacles to SME financing mentioned 22 by the banks
Table 13: Summary of policy recommendations 30

iv • FinAccess Business – supplyBAnk FinAncing oF sMes in kenyA
AfD Agence Française de Développement
AfDB African Development Bank
AGF Africa Guarantee Fund
AMl Anti-money laundering
AMSMe Africa Micro Small Medium Enterprise Finance Program
ASCA Accumulating Savings and Credit Association
ATM Automated Teller Machine
BoA Bank of Africa
CAr Capital Adequacy Ratios
CBA Commercial Bank of Africa
CBK Central Bank of Kenya
CBr Central Bank Rate
CrB Credit Reference Bureau
CBM Corporate-oriented Business Model
CiS Credit Information System
CFrSD Comprehensive Financial Sector Reform and Development Strategy
Coop Cooperative Bank of Kenya
DTB Diamond Trust Bank
DeG Deutsche Investitions- und Entwicklungsgesellschaft
DTS Deposit-taking Savings and Credit Cooperative
eiB European Investment Bank
FMo Financierings-Maatschappij voor Ontwikkelingslanden
GDp Gross Domestic Product
GoK Government of Kenya
KBA Kenya Bankers Association
KCB Kenya Commercial Bank
KfW Kreditanstalt für Wiederaufbau
KyC Know Your Customer
iCr roSC Insolvency and Creditor/Debtor Regimes Report on the Observance of Standards & Codes
iCT Information and Communication Technology
iFC International Finance Corporation
irA Insurance Regulatory Authority
lpo Local Purchasing Order
MBM Microfinance-oriented Business Model
MFB Microfinance Banks
MFi Microfinance Institution (refers to both MFBs and credit-only MFIs)
MSMe Micro, Small and Medium Enterprise
abbreviations

FinACCeSS BuSineSS – SupplyBAnK FinAnCinG oF SMeS in KenyA • v
abbreviations
MTp-ii Second Medium Term Plan
nCiS National Credit Information Sharing
npl Non-performing loan
nSSF National Social Security Fund
rBA Retirement Benefits Authority
roSCA Rotating Savings and Credit Association
SACCo Savings and Credit Cooperative
SASrA SACCO Societies Regulatory Authority
SBM Supply-Chain oriented Business Model
SiDA Swedish International Development Cooperation Agency
SMe Small and medium enterprise

vi • FinAccess Business – supplyBAnk FinAncing oF sMes in kenyA
The project team for this study consisted of Gunhild Berg (World Bank), Michael Fuchs (World Bank and FSD Kenya), the late Ravindra Ramrattan (FSD Kenya), Edoardo Totolo (FSD Kenya) and Smita Wagh (World Bank), with support from the Bank Supervision Department of the Central Bank of Kenya led by Matu Mugo, and coordinated by Evelyne Kilonzo and Edwin Kipsitet. The project team would like to thank the commercial and microfinance banks that participated in the survey, the Central Bank of Kenya, the Ministry of Finance, the Kenya Bankers Association and all the individuals from other institutions who contributed to this research by providing valuable inputs. In particular, we would like to thank representatives from those banks and other players in the Kenyan SME market who participated in our in-depth interviews.
The project team is grateful also to James Kashangaki, Amrik Heyer, Mehnaz Safavian and David Ferrand for giving us feedback and providing valuable comments while drafting this report. All remaining errors are our own.
The project team wishes to dedicate this study to Ravi Ramrattan, who fell victim to the terrorist attack on Westgate Mall on 23 September 2013. The study benefitted from Ravi’s invaluable insights, dedication, and professionalism, as well as the engaging warmth of his personality.
acknowlEDgEMEnTS
FinACCeSS BuSineSS – SupplyBAnK FinAnCinG oF SMeS in KenyA • vii
The involvement of Kenyan banks in the SME segment has grown remarkably over the last few years and most banks intend to continue expanding their SME portfolio in the near future. The segment has also received growing interest from policymakers and donors, recognising the pivotal role that SMEs play in economic development, investment and employment creation. Many SMEs, however, continue to lack appropriate financial services and have to rely on lending technologies that are expensive and often unsuited to their needs. Banks often lack crucial information to inform their product development and expansion strategies due to a lack of systematic data collection and a common definition of the SME finance market. This also affects the work of the Government, regulatory authorities, and credit bureaus, as it makes it difficult to identify the key developments, challenges, and opportunities in the market.
FinAccess Business is a research project conducted jointly by FSD-Kenya, the World Bank, and the Central Bank of Kenya (CBK) to improve understanding of the SME market on both the supply and demand sides. Demand-side data continues to be limited due to the lack of a representative list of active business establishments in Kenya, which makes it difficult to track the size of the market as well as the evolving characteristics of the business population and their need for financial services. This is a major gap in the analysis of the Kenyan SME finance market, which will be analysed in a forthcoming, in-depth report. The present report provides instead a comprehensive view of the supply-side of SME finance and its evolution between 2009 and 2013. In addition to quantifying the size of the supply-side market and its growth rate, it shows the exposure of different types of banks in the segment, the portfolio of services most used by SMEs, and the quality of assets. The report also discusses the regulatory framework for SME finance, the drivers and obstacles of banks’ involvement with SMEs, and their specific business models.
The study shows that the total SME lending portfolio in December 2013 was estimated to be KSh332 billion, representing 23.4 per cent of the banks’ total loan portfolio. The SME portfolio grew fast in absolute values but also as a percentage of total lending: in 2009 and 2011 the total SME portfolio was estimated to be KSh133 and KSh225 billion, respectively, representing 19.5 and 20.9 per cent of total lending. These figures show that in the context of the general growth of the financial sector, SME financing is growing at a relatively fast rate, and is thereby representing a growing share of the commercial banks’ portfolios.
Based on the findings of the study, the banks’ business models in the SME finance market can be divided into three main types: the corporate-oriented business model (CBM), the supply-chain oriented business model (SBM) and the micro-enterprise oriented business model (MBM). Although banks may diversify between these categories, resulting in some overlap between the three categories, banks tend to differ in terms of lending technologies, customer acquisition strategies, and risk management mechanisms. Risk
management strategies vary widely across banks and may be based on ‘hard information’, ‘soft information’, or a combination of the two. Hard information may consist of financial ratios calculated from certified audited statements and data assembled by credit bureaus. Soft information consists of non-financial information about the firm or entrepreneur, such as the sources of revenue or the borrower’s historical relationship with the bank.
While there have been positive developments over the last few years, there is still considerable room for product innovation in the SME finance space. A large number of SMEs continues to use overdrafts to finance their working capital needs, although banks have introduced several trade finance and asset finance products designed for the SME market. The development of other important SME finance products, such as factoring and financial leasing, has made some progress over the last few years but is still very limited. Developing such products is expected to lower transaction as well as borrowing costs for SMEs and reduce reliance on collateral by drawing on a more diverse set of information. The main constraint to financial leasing appears to be the ambiguous treatment of leasing in the Hire Purchase Act as well as the application of VAT. Potential constraints to the development of factoring, such as the recourse mechanism and the impact of stamp duties, need to be explored as well. In addition, it would be useful to study in more detail the potential and feasibility of an electronic reverse factoring platform similar to the one operated by Nafin in Mexico or factoring schemes as used in Paraguay or Peru. This could lower transaction and borrowing costs further and introduce more competition into that market segment while also increasing transparency.
The cost of credit for SMEs remains high due to a number of factors, including the limited use and sharing of positive information about borrowers, inefficiencies in the collateral registration process, the cost of the judicial process, and high overhead costs. The move towards positive information sharing by banks should go some way towards addressing these problems, but positive information sharing from all credit providers including payment service providers and utilities companies among others, would add great value to the information already present in the credit bureaus and should be prioritised going forward, provided that data quality can be ensured.
The collateral registry could be made more efficient in terms of the speed and the range of items accepted as collateral. Resolving the legal and regulatory challenges, especially regarding the contractual environment, will require significant reforms over a period of several years. Supporting the alternative dispute resolution system established by the Kenya Bankers Association (KBA) and the Association of Kenya Credit Providers (AKCP) would be a promising approach. Such a system would ensure that the majority of disputes are mediated and resolved prior to entering the judicial system, therefore avoiding lengthy judicial procedures.
EXEcUTiVE SUMMaRy
viii • FinAccess Business – supplyBAnk FinAncing oF sMes in kenyA
While the Government sees its role in supporting SMEs primarily as market enabling and has largely avoided direct interventions in the SME finance space, several donors are active in supporting banks through credit lines or partial credit guarantees, often coupled with technical assistance. Given that the market for SME finance is relatively vibrant, the question is what gap donors are filling. Inevitably there is bound to be overlap in the donors’
involvement. Closer donor coordination could therefore be quite important in ensuring that resources are allocated effectively and are market enabling, and that they do not create an uneven playing field for market players. The government could play a stronger role in keeping track of the various donor initiatives to encourage transparency and a sharing of best practices across initiatives

FinACCeSS BuSineSS – SupplyBAnK FinAnCinG oF SMeS in KenyA • 1
As the Kenyan economy is poised to embark on a period of relatively high growth, the financial sector’s role to channel credit affordably and efficiently to small and medium enterprises (SMEs) will become ever more central for inclusive and sustained economic development. After rebasing the GDP calculations and reaching middle-income status in 2014 1, the Kenyan economy is expected to grow by 6–7 per cent in 2015–17 (World Bank, 2015). Given the pivotal role SMEs play in fuelling innovation and employment-creation, understanding the opportunities, gaps and challenges in the SME finance market is crucial to maintaining the current growth momentum.
The importance for SMEs to have access to financing is widely recognised among academics and policymakers. Ayyagari, Beck, and Demigurc-Kunt (2007) show that SMEs play a key role in economic development, diversification, and employment creation, and that they contribute 49 per cent of GDP on average in high-income countries and 29 per cent in low-income countries. However, SMEs are more credit constrained than large firms, severely affecting their possibilities to grow and innovate (Beck and Demigurc-Kunt, 2006; Beck et al., 2006). In the Kenyan context, there is widespread agreement among financial sector stakeholders that the small business sector is at the heart of a vibrant private sector. Increasing access to financial services for SMEs is a key pillar of the Comprehensive Financial Sector Reform and Development Strategy (Kenya Treasury, 2011).
Despite growing interest in the segment, Kenya still lacks rigorous analysis on the size and evolution of the SME finance market. There is no systematic market-wide analysis of the trends and recent developments in SME finance, the drivers and obstacles to further engagement in the segment and its future prospects. The problem exists on both the demand-side and supply-side: on the demand-side, there is no systematic analysis on the numbers, characteristics, and challenges to access to finance for SMEs. Kenya lacks a comprehensive list of active business establishments and therefore it is not possible to measure the number of new entrants in different segments of the economy and the survival rate of young firms, or their capacity to create employment, to grow, and to use credit for productive investments. Financial sector players, on the other hand, lack key information on this target market and cannot respond dynamically to changes in the market. On the supply-side, the data routinely collected on bank financing of SMEs is limited. Banks do not report data specifically on their SME finance portfolios, and therefore industry players and the Government lack data on market size, the exposure of banks to the segment, and the product portfolio available to SMEs2.
The objective of FinAccess Business is to improve the knowledge of the business finance market and fill the current knowledge gaps. It seeks to provide the rigorous analysis required to enhance the overall understanding of
1 See Kenya National Bureau of Statistics (2015).2 As discussed below this is complicated by the fact that banks use different definitions of SMEs, and
data collected by the banks is therefore not directly comparable.
business financing in Kenya from both the supply and demand perspectives. On the demand-side, FinAccess Business has collected data on and the number and characteristics of SMEs using a survey of over 1,000 businesses in Nairobi, which will be analysed in a forthcoming report. On the supply-side – which is the core focus of this report – the data was collected through a survey questionnaire and interviews with banks involved in the SME segment.
The empirical analysis in FinAccess Business ¬– Supply is based on data collected in two survey rounds in a joint project by Financial Sector Deepening Kenya (FSD-K), the World Bank (WB) and the Central Bank of Kenya (CBK). The first survey round was conducted in 2012 and collected data on SME financing as of December 2011 and December 2009. It also analysed the legal and regulatory framework affecting SME finance and the role of donors. In order to discuss in greater depth the perceptions, potentials, and key challenges in the market, a series of qualitative interviews was conducted with key market players. In 2014, a second survey round was conducted to collect data for 2013, and which followed up on various questions such as the composition of SME finance portfolios, the lending technologies used by the banks and the characteristics of the loans, including interest rates, maturity and sectoral distribution of lending. This research project is the first comprehensive effort to estimate the size of bank financing to SMEs in Kenya and to analyse its characteristics over time. While the different survey rounds had different response rates from the banks, the data captures a minimum of 80 per cent to a maximum of 94 per cent of the credit market in the different survey rounds, therefore being representative of the Kenyan market 3.
The market for SME finance is growing rapidly in Kenya and all banks seem interested in developing their engagement with SMEs regardless of size (small, medium or large) or ownership (domestic or foreign). SME finance increased both in absolute terms and relative to the banks’ total lending portfolio: it represented 19.5 per cent of the total portfolio in 2009, 20.9 per cent in 2011 and 23.4 per cent in 2013. In terms of absolute lending to SMEs, the major players in the market in 2009, 2011 and 2013 were mid-sized banks, while small banks tended to have the highest level of exposure to SMEs relative to their total asset size4. Between 2009 and 2013, SME lending by foreign banks increased in absolute terms but decreased relative to domestic banks, confirming a growing role played by local players in the SME market. While the overall SME finance portfolio increased during the period, the report shows that there are limitations to the sophistication of the SME portfolio and in particular regarding the over-reliance of mid-sized banks on overdrafts as their main lending technology. While overdrafts can be useful to finance working capital when businesses need fast access to liquidity, they can be expensive
3 The response rate was 33 commercial banks for the first survey round and 25 banks for the second.4 It is important to note that banks reported on their SME portfolio based on their own definition
of SMEs. While a standardised definition would have improved the quality of the data and the comparability across institutions, initial research showed that most banks were unable to provide such data. This will be discussed in more detail in Section 4.1.1 of this report.
Chapter 1
inTRoDUcTion

2 • FinAccess Business – supplyBAnk FinAncing oF sMes in kenyA
and they expose SMEs to interest rate and liquidity risks. They are therefore ill-suited as an instrument for funding SMEs’ longer term investment needs.
The next sections are organised as follows: Section 2 provides background on the financial sector in Kenya and the current market structure; Section 3 describes the data collection process and methodology used in the research; Section 4 discusses the findings of the survey, showing how banks define
SMEs and the growth of the SME finance portfolio for different types of banks in 2009, 2011 and 2013 and includes a comparison with other African markets; Section 5 describes in greater depth SMEs’ use of financial services, such as asset financing, invoice discounting, leasing and factoring, and presents examples from other countries; Section 6 discusses the regulatory environment and donor involvement in the segment; and finally, Section 7 provides a conclusion and policy recommendations.
FinACCeSS BuSineSS – SupplyBAnK FinAnCinG oF SMeS in KenyA • 3
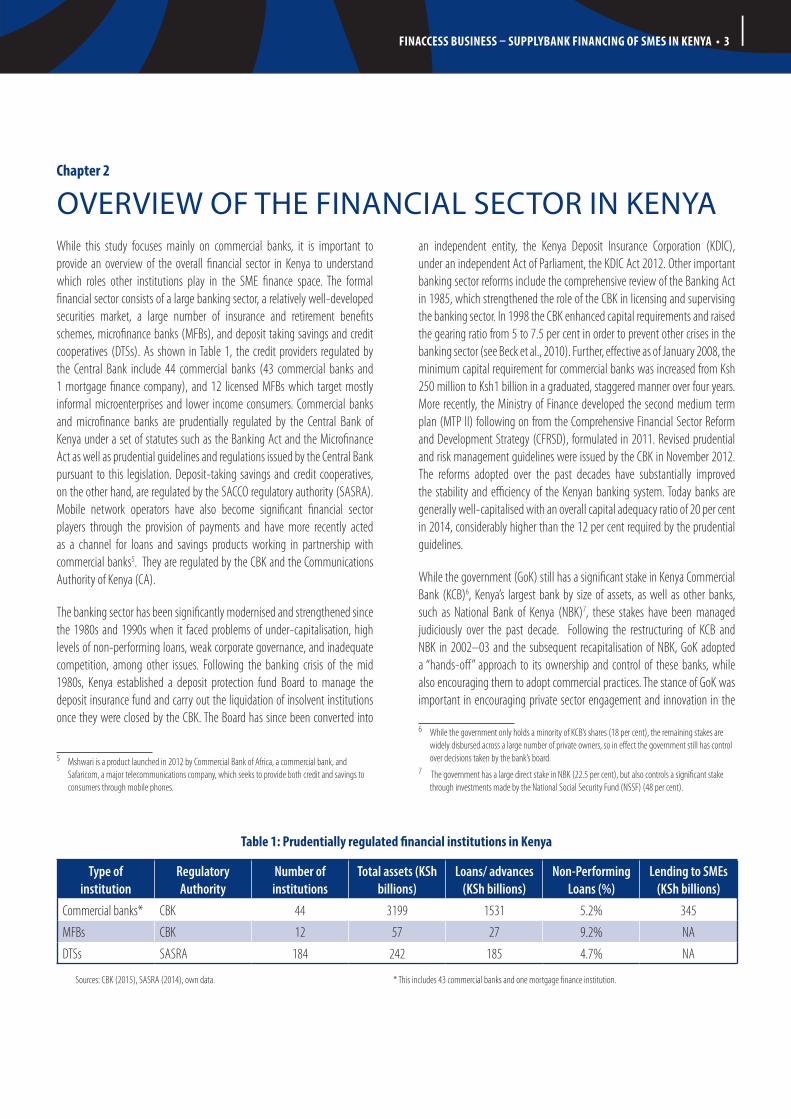
While this study focuses mainly on commercial banks, it is important to provide an overview of the overall financial sector in Kenya to understand which roles other institutions play in the SME finance space. The formal financial sector consists of a large banking sector, a relatively well-developed securities market, a large number of insurance and retirement benefits schemes, microfinance banks (MFBs), and deposit taking savings and credit cooperatives (DTSs). As shown in Table 1, the credit providers regulated by the Central Bank include 44 commercial banks (43 commercial banks and 1 mortgage finance company), and 12 licensed MFBs which target mostly informal microenterprises and lower income consumers. Commercial banks and microfinance banks are prudentially regulated by the Central Bank of Kenya under a set of statutes such as the Banking Act and the Microfinance Act as well as prudential guidelines and regulations issued by the Central Bank pursuant to this legislation. Deposit-taking savings and credit cooperatives, on the other hand, are regulated by the SACCO regulatory authority (SASRA). Mobile network operators have also become significant financial sector players through the provision of payments and have more recently acted as a channel for loans and savings products working in partnership with commercial banks5. They are regulated by the CBK and the Communications Authority of Kenya (CA).
The banking sector has been significantly modernised and strengthened since the 1980s and 1990s when it faced problems of under-capitalisation, high levels of non-performing loans, weak corporate governance, and inadequate competition, among other issues. Following the banking crisis of the mid 1980s, Kenya established a deposit protection fund Board to manage the deposit insurance fund and carry out the liquidation of insolvent institutions once they were closed by the CBK. The Board has since been converted into
5 Mshwari is a product launched in 2012 by Commercial Bank of Africa, a commercial bank, and Safaricom, a major telecommunications company, which seeks to provide both credit and savings to consumers through mobile phones.
an independent entity, the Kenya Deposit Insurance Corporation (KDIC), under an independent Act of Parliament, the KDIC Act 2012. Other important banking sector reforms include the comprehensive review of the Banking Act in 1985, which strengthened the role of the CBK in licensing and supervising the banking sector. In 1998 the CBK enhanced capital requirements and raised the gearing ratio from 5 to 7.5 per cent in order to prevent other crises in the banking sector (see Beck et al., 2010). Further, effective as of January 2008, the minimum capital requirement for commercial banks was increased from Ksh 250 million to Ksh1 billion in a graduated, staggered manner over four years. More recently, the Ministry of Finance developed the second medium term plan (MTP II) following on from the Comprehensive Financial Sector Reform and Development Strategy (CFRSD), formulated in 2011. Revised prudential and risk management guidelines were issued by the CBK in November 2012. The reforms adopted over the past decades have substantially improved the stability and efficiency of the Kenyan banking system. Today banks are generally well-capitalised with an overall capital adequacy ratio of 20 per cent in 2014, considerably higher than the 12 per cent required by the prudential guidelines.
While the government (GoK) still has a significant stake in Kenya Commercial Bank (KCB)6, Kenya’s largest bank by size of assets, as well as other banks, such as National Bank of Kenya (NBK)7, these stakes have been managed judiciously over the past decade. Following the restructuring of KCB and NBK in 2002–03 and the subsequent recapitalisation of NBK, GoK adopted a “hands-off” approach to its ownership and control of these banks, while also encouraging them to adopt commercial practices. The stance of GoK was important in encouraging private sector engagement and innovation in the
6 While the government only holds a minority of KCB’s shares (18 per cent), the remaining stakes are widely disbursed across a large number of private owners, so in effect the government still has control over decisions taken by the bank’s board.
7 The government has a large direct stake in NBK (22.5 per cent), but also controls a significant stake through investments made by the National Social Security Fund (NSSF) (48 per cent).
Chapter 2
oVERViEw oF THE Financial SEcToR in kEnya
Table 1: prudentially regulated financial institutions in Kenya
Type of institution
Regulatory Authority
Number of institutions
Total assets (KSh billions)
Loans/ advances (KSh billions)
Non-Performing Loans (%)
Lending to SMEs (KSh billions)
Commercial banks* CBK 44 3199 1531 5.2% 345
MFBs CBK 12 57 27 9.2% NA
DTSs SASRA 184 242 185 4.7% NA
Sources: CBK (2015), SASRA (2014), own data. * This includes 43 commercial banks and one mortgage finance institution.
4 • FinAccess Business – supplyBAnk FinAncing oF sMes in kenyA
growth of SME lending in Kenya. Given Cooperative Bank’s strong relationship with the SACCO sector, and thereby its potentially significant role in reaching out to smaller enterprises, played a significant role in stimulating competition and innovation in the market for SME finance. The listing of the Cooperative Bank on the Nairobi stock exchange in 2008 allowed the bank to strengthen its capital base and it now operates on a level playing field with other banks.
2.1 ASSeT QuAliTy in The BAnKinG SeCTor
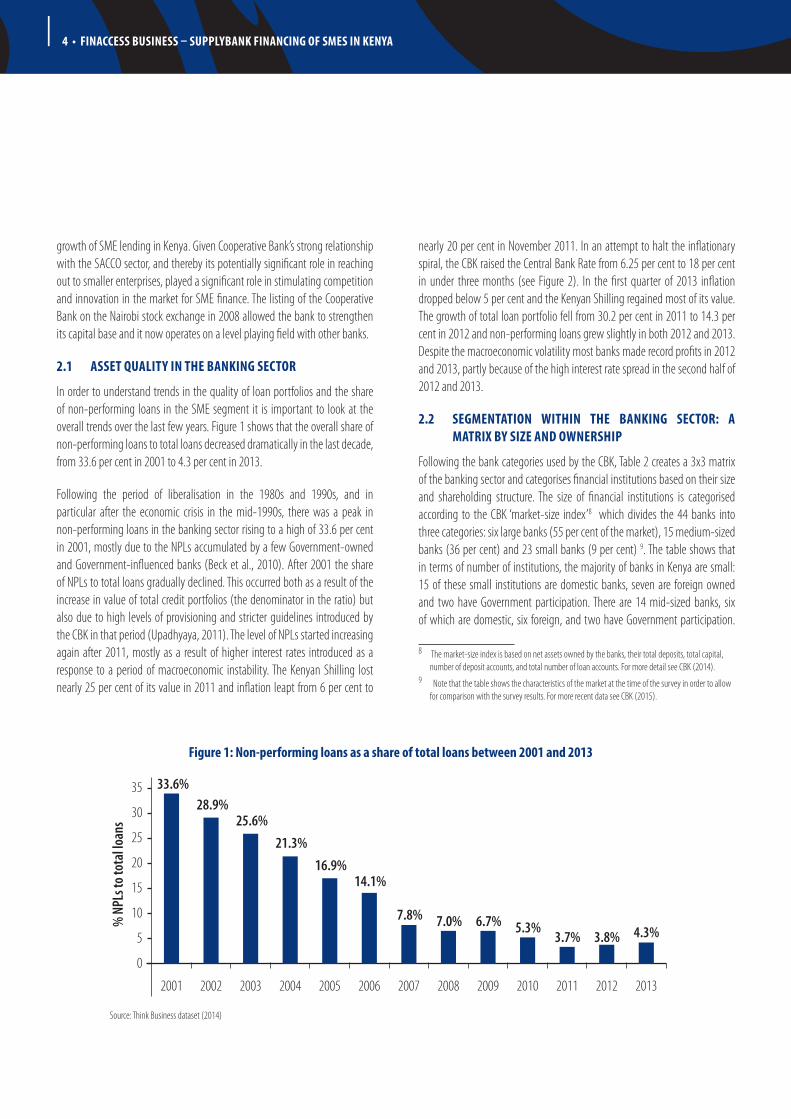
In order to understand trends in the quality of loan portfolios and the share of non-performing loans in the SME segment it is important to look at the overall trends over the last few years. Figure 1 shows that the overall share of non-performing loans to total loans decreased dramatically in the last decade, from 33.6 per cent in 2001 to 4.3 per cent in 2013.
Following the period of liberalisation in the 1980s and 1990s, and in particular after the economic crisis in the mid-1990s, there was a peak in non-performing loans in the banking sector rising to a high of 33.6 per cent in 2001, mostly due to the NPLs accumulated by a few Government-owned and Government-influenced banks (Beck et al., 2010). After 2001 the share of NPLs to total loans gradually declined. This occurred both as a result of the increase in value of total credit portfolios (the denominator in the ratio) but also due to high levels of provisioning and stricter guidelines introduced by the CBK in that period (Upadhyaya, 2011). The level of NPLs started increasing again after 2011, mostly as a result of higher interest rates introduced as a response to a period of macroeconomic instability. The Kenyan Shilling lost nearly 25 per cent of its value in 2011 and inflation leapt from 6 per cent to
nearly 20 per cent in November 2011. In an attempt to halt the inflationary spiral, the CBK raised the Central Bank Rate from 6.25 per cent to 18 per cent in under three months (see Figure 2). In the first quarter of 2013 inflation dropped below 5 per cent and the Kenyan Shilling regained most of its value. The growth of total loan portfolio fell from 30.2 per cent in 2011 to 14.3 per cent in 2012 and non-performing loans grew slightly in both 2012 and 2013. Despite the macroeconomic volatility most banks made record profits in 2012 and 2013, partly because of the high interest rate spread in the second half of 2012 and 2013.
2.2 SeGMenTATion WiThin The BAnKinG SeCTor: A MATrix By SiZe AnD oWnerShip
Following the bank categories used by the CBK, Table 2 creates a 3x3 matrix of the banking sector and categorises financial institutions based on their size and shareholding structure. The size of financial institutions is categorised according to the CBK ‘market-size index’8 which divides the 44 banks into three categories: six large banks (55 per cent of the market), 15 medium-sized banks (36 per cent) and 23 small banks (9 per cent) 9. The table shows that in terms of number of institutions, the majority of banks in Kenya are small: 15 of these small institutions are domestic banks, seven are foreign owned and two have Government participation. There are 14 mid-sized banks, six of which are domestic, six foreign, and two have Government participation.
8 The market-size index is based on net assets owned by the banks, their total deposits, total capital, number of deposit accounts, and total number of loan accounts. For more detail see CBK (2014).
9 Note that the table shows the characteristics of the market at the time of the survey in order to allow for comparison with the survey results. For more recent data see CBK (2015).
Figure 1: non-performing loans as a share of total loans between 2001 and 2013
2001
33.6%28.9%
25.6%
21.3%
16.9%14.1%
7.8% 7.0% 6.7% 5.3%3.7% 3.8% 4.3%
2002 2003 2004 2005 2006 2007 2008 2009 2010 2011 2012 2013
0
5
15
10
25
20
35
30
% N
PLs t
o to
tal l
oans
Source: Think Business dataset (2014)

FinACCeSS BuSineSS – SupplyBAnK FinAnCinG oF SMeS in KenyA • 5
Finally, there are six large-scale banks, two of which are local, two foreign and two have Government participation. Within each category the banks’ interest in engaging in the SME sector is quite varied, and indeed within each size category there are both leaders devoted to innovation within the SME
financing space and other banks for whom SMEs are not a target client group. This illustrates the dynamism of the Kenyan market, in that a ‘one-size-fits-all’ approach cannot be applied to the banks’ involvement in this fast -evolving segment of the market.
Figure 2: inflation rates (Fig. A) and interest rates (Fig. B) between 2010–11 and 2014
Table 2: A 3x3 matrix of the Kenyan commercial banking sector as of December 201310
local banks Foreign banks Banks with government participation
Small
� African Banking Corporation Ltd. � Jamii Bora Bank Ltd. � Credit Bank Ltd. � Charterhouse Bank Ltd. � Dubai Bank Kenya Ltd � Equatorial Commercial Bank Ltd. � Fidelity Commercial Bank Ltd. � Giro Commercial Bank Ltd. � Guardian Bank Ltd. � Middle East Bank (K) Ltd. � Oriental Commercial Bank Ltd. � Paramount Universal Bank Ltd. � Prime Bank Ltd. � Trans-National Bank Ltd. � Victoria Commercial Bank Ltd.
� Habib Bank A.G. Zurich � Habib Bank Ltd. � UBA Kenya Bank Limited � K-Rep Bank Ltd. � Gulf Africa Bank (K) Ltd � First Community Bank � GT Bank Ltd
� Consolidated Bank of Kenya Ltd. � Development Bank of Kenya Ltd.
Medium
� Commercial Bank of Africa Ltd. � Chase Bank (K) Ltd. � Family Bank Ltd. � Imperial Bank Ltd.
� Bank of India � Citibank N.A. Kenya � Bank of Baroda (K) Ltd. � Diamond Trust Bank Kenya Ltd
� Housing Finance Ltd. � National Bank of Kenya Ltd.
Large � Equity Bank � Cooperative Bank of Kenya
� Barclays Bank of Kenya � Standard Chartered Bank (K) Ltd.
� Kenya Commercial Bank Ltd. � CFC Stanbic Bank Ltd.
10 Note that the ownership of some banks has changed since December 2013. This matrix reflects the ownership and size of banks at the time of the survey. For more recent data see CBK (2015).
0
5
10
15
20
25
30
35
Food inflation Inflation Rate
2010
Mar Jun Sep Dec Mar Jun Sep DecMar Jun Sep Dec Mar Jun Sep Dec Mar Jun Sep Dec
20122011 2013 2014
0
5
10
15
20
25
CBR Lending Deposit
2010
Jan Apr Jul Oct Jan Apr Jul OctJan Apr Jul Oct Jan Apr Jul Oct Jan Apr Jul Oct
20122011 2013 2014

6 • FinAccess Business – supplyBAnk FinAncing oF sMes in kenyA
Of the banks with Government participation, three are majority Government owned (Consolidated, National Bank, and Development Bank of Kenya), while the other three have a mix of Government and private stakeholders. The most significant presence of the Government in the latter group is in Kenya Commercial Bank (KCB), the largest bank in Kenya by asset size. The Government moved from full ownership in 1970 to 35 per cent in 2004. Two more rounds of divestiture in 2008 and 2010 reduced the Government’s shareholding to 17.7 per cent. CFC Stanbic has only minimal Government participation (approximately 1 per cent) and Housing Finance Ltd has a specific focus on mortgages and is therefore not analysed in the SME finance section of this paper11. Table 3 looks at key indicators and the overall market structure in a 3x2 matrix 12, focusing on aspects such as the share of assets, the share of the total number and value of deposits, the percentage of total loan accounts the institutions hold, and the average loan size. While the data in Table 3 does not focus specifically on small business finance, the table provides information about the overall market structure of the Kenyan banking sector and a more in-depth picture of market concentration and segmentation.
In terms of assets, Table 3 shows that the six large banks own almost 53 per cent of the total assets in the financial system, whereas mid-sized banks own almost 36 per cent and small banks less than 11 per cent. If we segment the market by bank ownership, we see that domestic banks have the largest share
11 In order to simplify the analysis of the survey data, Government ownership of banks is not analysed in the rest of the report.
12 The 3x3 matrix has transformed into a 3x2 matrix because Government banks are analysed as domestic banks not as an independent category.
with approximately 59 per cent of total assets, while foreign banks own about 41 per cent. The table shows that the aggregate value of assets owned by domestic mid-sized banks (21.6 per cent) is only slightly smaller than those owned by large foreign institutions (23.2 per cent), confirming once again the dominant role of domestic banks in the Kenyan financial system.
Table 3 also segments the financial sector based on the deposit market. There are three main components: the share of total deposit value, the share of total deposit accounts, and the average value in each deposit account. While the percentage of total deposit value (row b in Table 3) reflects quite closely the share of total assets (row a), we notice a striking heterogeneity when it comes to the number of deposit accounts and average value of deposits per account. While the difference in deposit value between domestic and foreign large banks is relatively small (31 and 22 per cent, respectively), large domestic banks hold almost 67 per cent of the total deposit accounts in Kenya while large foreign banks hold only around 9 per cent. This arguably confirms that large domestic banks – targeting low-income customers despite their limited savings availability – have a much stronger focus on attracting deposits from the ‘bottom of the pyramid’ compared to large foreign banks. In fact while large domestic banks have average account balances of over KSh94,000 (roughly €920), large foreign banks have average account balances of KSh708,000 (about €7,000)13. Small and mid-sized have less variability in their average account balances, which oscillates between KSh700,000 and KSh950,000.
13 It is important to note that the average value of deposit is only indicative as it can be skewed by outliers as well as dormant accounts. What is more important for this analysis is the comparison between different segments of the market rather than the value itself.
Table 3: Characteristics of Kenya financial sector by size and ownership of the banks as of December 2013Small banks Mid-sized banks Large banks
a. % of total assetsDomestic 6.8% 21.6% 30.7%
Foreign 3.8% 13.9% 23.2%
b. % of total deposits (value)Domestic 7.6% 21.6% 31.0%
Foreign 4.0% 13.9% 21.9%
c. % of total deposit accountsDomestic 1.8% 8.6% 66.9%
Foreign 2.5% 11.4% 8.8%
d. Average value of deposits per account (KSh)Domestic 706,331 948,864 94,199
Foreign 834,880 828,256 708,550
e. % of total loan accountsDomestic 1.5% 12.7% 62.6%
Foreign 3.0% 3.3% 17.0%
f. Average loan size (KSh)Domestic 4,768,925 4,076,940 557,858
Foreign 2,512,433 9,299,921 2,061,834
Source: Central Bank of Kenya (2014)
FinACCeSS BuSineSS – SupplyBAnK FinAnCinG oF SMeS in KenyA • 7
The data can be further segmented by looking at the number of loan accounts and the average loan size across different types of institutions. Hermes, Lensink, and Meesters (2011) use, for example, average loan size as a proxy for the outreach of microfinance institutions in an analysis of several low-income markets, arguing that lower average loan sizes are likely to be related to a higher degree of penetration of the lower income segments of the population. While this approach could be affected by many factors, such as the composition of the loan portfolio and the focus on specific industry segments of the economy, it still provides an important summary of the characteristics of the banks and their lending to consumers and the private sector. The last two rows of Table 3 confirm what was observed in the analysis of deposit accounts:
large domestic banks have the lion’s share of the credit market with over 60 per cent of the total loan accounts in the country. The average loan size (row f) is around KSh560,000 (about €5,000) across the portfolio, far lower than the average loan size of large foreign banks as well as that of small and mid-sized banks.
Altogether these data provide evidence of the highly competitive market for smaller savers and borrowers in Kenya. They also provide evidence of the innovative approaches adopted by larger banks and the penetration they have achieved over the past decade.

8 • FinAccess Business – supplyBAnk FinAncing oF sMes in kenyA
This study is based on two surveys conducted in 2012 and 2014 in a joint project between Financial Sector Deepening Kenya (FSD-K), the Central Bank of Kenya (CBK) and the World Bank. The first survey instrument was composed of 65 questions in four main areas of analysis: (i) the extent of the banks’ involvement with SMEs; (ii) the profile of SME clients; (iii) drivers and obstacles to SME and micro-enterprise financing, including the role of government policies and donor programmes; and (iv) the banks’ SME business models, including marketing strategies, the array of financial products offered to SMEs, and the main risk management models. The project team subsequently conducted in-depth interviews with staff of the commercial banks directly responsible for their SME business. Overall 34 banks completed the questionnaire and 17 banks were selected for interview on the basis of market share and their involvement with SME lending. The team also met with one of the two licensed Credit Reference Bureaus. For insights into alternative sources of finance, interviews were held with Acumen Fund, Grassroots Business Fund, CIC Insurance and Faulu Kenya MFB Limited (a microfinance bank). For information on the involvement and support provided by the Government and donors in the SME finance space, representatives from the Ministry of Finance, the International Finance Corporation (IFC), USAID and
Proparco were interviewed. Other information was collated through a desk review of publicly available information.
The second survey round was conducted between June and August 2014. The objective of this survey was to update the credit data provided in 2012 and to better understand the composition of SME finance portfolios with more detailed and recent figures. In order to increase the willingness to share information, it was stressed in both survey rounds that all data will remain anonymous and will be presented only in an aggregated fashion. A total of 26 institutions completed the questionnaire in the second survey round, representing approximately 81 per cent of the banks’ total credit portfolios.
The methodology used for the report is comparable to a study conducted in South Africa (Fuchs et al., 2011) and similar work has also been undertaken by the World Bank in analysing SME finance in Nigeria, Rwanda and Tanzania. Part of the 2012 survey data was used for a cross-country comparison of SME finance in five Sub Saharan African countries (Berg and Fuchs, 2013). Additional data analysed in this paper comes from the Central Bank of Kenya and from the audited financial accounts published by the banks.
Chapter 3
DaTa anD METHoDology

FinACCeSS BuSineSS – SupplyBAnK FinAnCinG oF SMeS in KenyA • 9
4.1 BAnK FinAnCinG oF SMeS
The next sections discuss how banks define micro, small and medium enterprises, and the evolution in size and characteristics of the SME finance market between 2009 and 2013. The Kenyan market will also be compared to other African markets such as South Africa, Nigeria, Tanzania and Rwanda. From section 4.2 onwards, the analysis focuses on the key characteristics of business lending such as interest rates, lending technologies, and the composition of the SME portfolio in Kenya. It also shows the risk management practices used by the banks and the drivers of and obstacles to banks’ involvement with SMEs.
4.1.1 Bank definitions of micro, small and medium enterprises
One of the main challenges in the analysis of SME finance is that the definition of what is considered a micro, small, medium or large enterprise differs widely across banks. While the Government of Kenya (GoK) has proposed to adopt a unified definition of the micro and small enterprise segment in terms of turnover and number of employees, banks’ definitions differ significantly both in terms of the information that is being collected and the categorisation of enterprises. According to the GoK, firms are defined as ‘micro’ when they have between 1 and 10 employees and a turnover not exceeding KSh500,000. They are considered ‘small’ when they have between 11 and 50 employees and a turnover not exceeding KSh5 million14.
Table 4: Maximum thresholds of loan size (KSh), business turnover (KSh) and number of employees in the definition of
business size as of December 2013
Loan size Median 1st quartile 3rd quartile
Micro 1,000,000 1,000,000 2,000,000
Small 6,500,000 5,000,000 10,000,000
Medium 50,000,000 20,000,000 100,000,000
Turnover Median 1st quartile 3rd quartile
Micro 10,000,000 3,250,000 11,500,000
Small 50,000,000 16,250,000 250,000,000
Medium 150,000,000 100,000,000 1,000,000,000
Employees Median 1st quartile 3rd quartile
Micro 10 8 10
Small 22 11 44
Medium 50 43 100
Source: Analysis of survey responses
14 The Micro and Small Enterprise Act (2013) defines micro and small activities but does not provide a definition of medium and large enterprises.
The banks’ variables of SME classification were, in order of importance, loan size, turnover, and number of employees. In fact, very few banks were able to provide a classification based on the number of employees. While the banks are aware that loan size is not the best proxy for the size of their business clients, it is used because loan-size information is easy to collect and serves as a second-order proxy for the overall size of the business. The challenge is that a large business, if requesting a small working capital loan, could be categorised as a small enterprise if no other information is available. Many banks, however, manage their clients in different departments (microenterprise department, SME department, corporate department, etc.), and therefore they are unlikely to miscategorise the data.
The quantitative differences in the definitional boundaries are considerable. Table 4 shows that the median turnover threshold for microenterprises is twice the size of the definition for microenterprises used by the GoK, and the difference in the small enterprise segment is noteworthy as well. Definitions also differ widely across banks depending on the market segment they focus on and their business-model: what is defined as a small enterprise by one bank might fall into the medium category of another. The heterogeneity of responses is apparent when looking at the difference between the first and third quartiles in Table 4. The third quartile of the turnover threshold, for example, is far larger compared to the first quartile for all types of enterprises. The difference in the loan size definition is considerable as well.
In order to improve the classification of businesses among banks, a series of qualitative interviews was conducted with key commercial banks prior to the 2014 survey round. The objective was to understand how banks organise their data and whether the definition of SMEs could be standardised before the survey was undertaken. These interviews revealed that using a standardised definition was currently not possible. Although banks often collect data on their business clients (turnover, employees, asset size), they are usually unable to link this data to the core data systems on lending facilities. If, for example, our questionnaire had asked about the total amount of loans going to businesses with an annual turnover between KSh10 and KSh20 million, most banks would not have been able to provide such data, making it impossible to analyse trends over time. Making such data collection possible is clearly one of the key changes that the CBK, working with the Kenya Bankers Association (KBA), should encourage in the near future15.
4.1.2 Quantifying the SMe finance market development in 2009, 2011 and 2013
The next sections analyse the development of the SME finance market comparing data for December 2009, December 2011 and December 2013. Since the December 2013 survey round obtained data at a disaggregate level
15 In the Conclusion of this paper, we offer a simple recommendation for the definition of SMEs that could be used for this purpose.
Chapter 4
EMPiRical FinDingS
10 • FinAccess Business – supplyBAnk FinAncing oF sMes in kenyA
for micro, small, medium as well as large enterprises, this data will be used to analyse all business lending, not only SMEs, for a number of indicators, such as maturity, interest rates, and the composition of business lending.
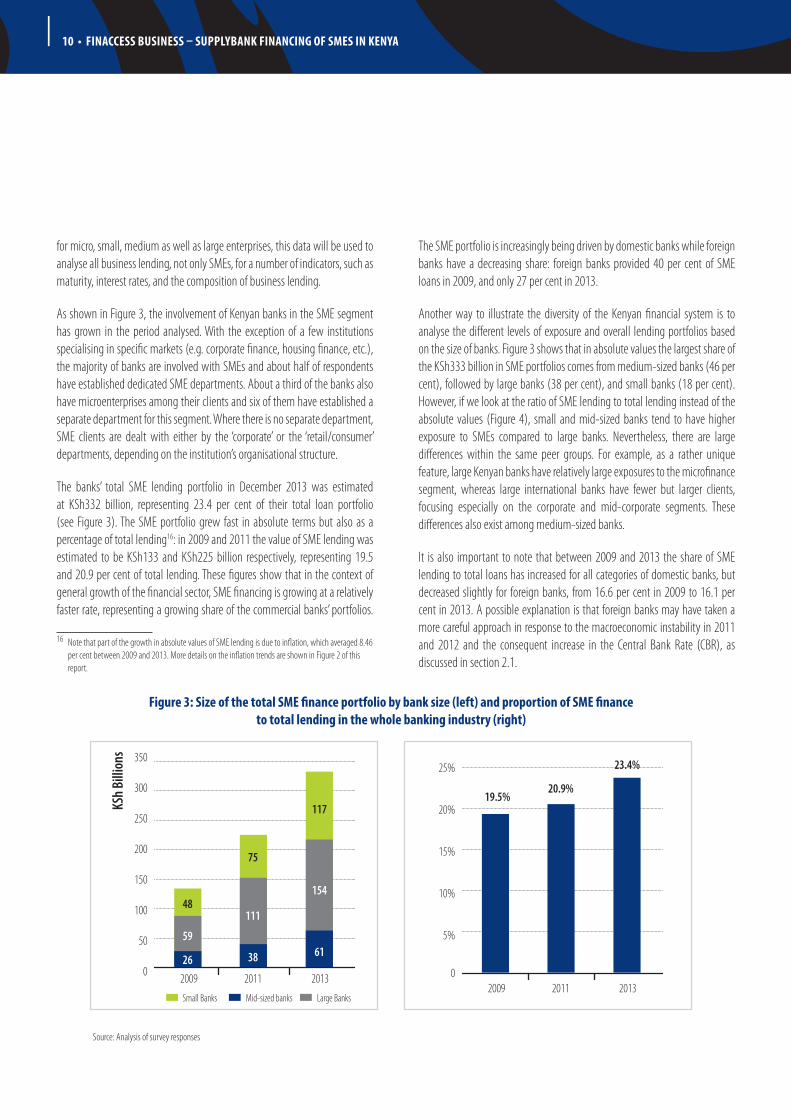
As shown in Figure 3, the involvement of Kenyan banks in the SME segment has grown in the period analysed. With the exception of a few institutions specialising in specific markets (e.g. corporate finance, housing finance, etc.), the majority of banks are involved with SMEs and about half of respondents have established dedicated SME departments. About a third of the banks also have microenterprises among their clients and six of them have established a separate department for this segment. Where there is no separate department, SME clients are dealt with either by the ‘corporate’ or the ‘retail/consumer’ departments, depending on the institution’s organisational structure.
The banks’ total SME lending portfolio in December 2013 was estimated at KSh332 billion, representing 23.4 per cent of their total loan portfolio (see Figure 3). The SME portfolio grew fast in absolute terms but also as a percentage of total lending16: in 2009 and 2011 the value of SME lending was estimated to be KSh133 and KSh225 billion respectively, representing 19.5 and 20.9 per cent of total lending. These figures show that in the context of general growth of the financial sector, SME financing is growing at a relatively faster rate, representing a growing share of the commercial banks’ portfolios.
16 Note that part of the growth in absolute values of SME lending is due to inflation, which averaged 8.46 per cent between 2009 and 2013. More details on the inflation trends are shown in Figure 2 of this report.
The SME portfolio is increasingly being driven by domestic banks while foreign banks have a decreasing share: foreign banks provided 40 per cent of SME loans in 2009, and only 27 per cent in 2013.
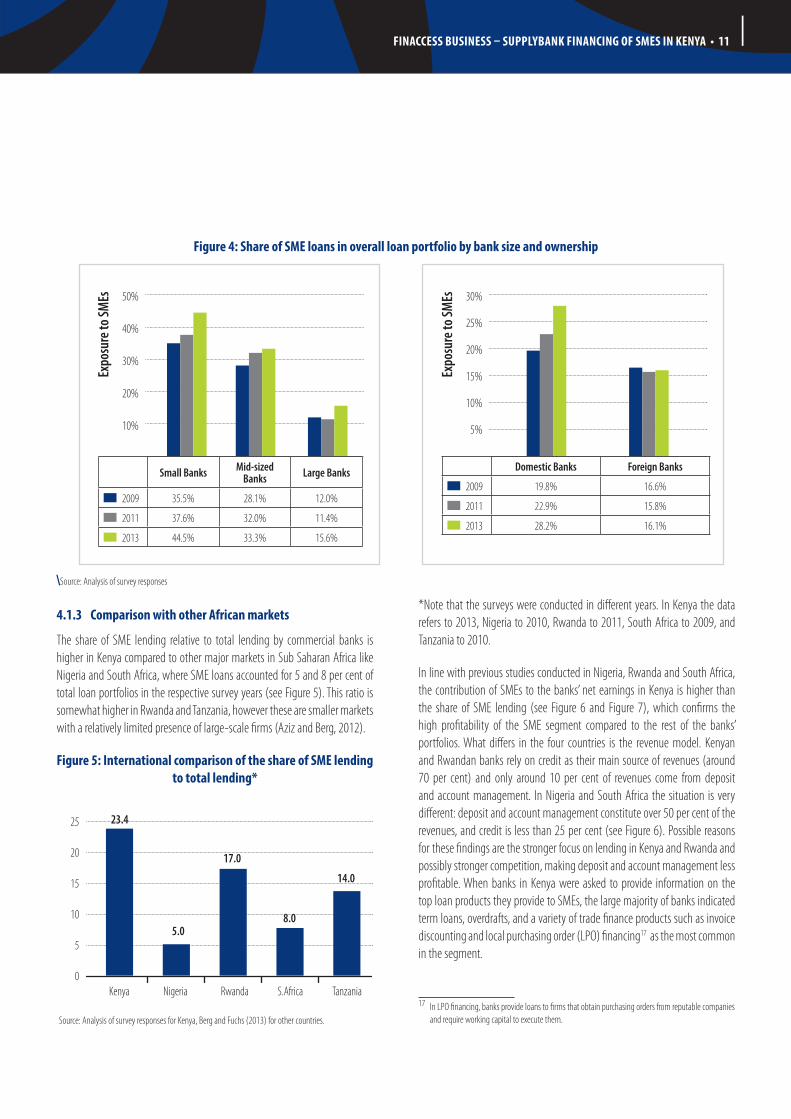
Another way to illustrate the diversity of the Kenyan financial system is to analyse the different levels of exposure and overall lending portfolios based on the size of banks. Figure 3 shows that in absolute values the largest share of the KSh333 billion in SME portfolios comes from medium-sized banks (46 per cent), followed by large banks (38 per cent), and small banks (18 per cent). However, if we look at the ratio of SME lending to total lending instead of the absolute values (Figure 4), small and mid-sized banks tend to have higher exposure to SMEs compared to large banks. Nevertheless, there are large differences within the same peer groups. For example, as a rather unique feature, large Kenyan banks have relatively large exposures to the microfinance segment, whereas large international banks have fewer but larger clients, focusing especially on the corporate and mid-corporate segments. These differences also exist among medium-sized banks.
It is also important to note that between 2009 and 2013 the share of SME lending to total loans has increased for all categories of domestic banks, but decreased slightly for foreign banks, from 16.6 per cent in 2009 to 16.1 per cent in 2013. A possible explanation is that foreign banks may have taken a more careful approach in response to the macroeconomic instability in 2011 and 2012 and the consequent increase in the Central Bank Rate (CBR), as discussed in section 2.1.
Figure 3: Size of the total SMe finance portfolio by bank size (left) and proportion of SMe finance to total lending in the whole banking industry (right)
Source: Analysis of survey responses
0
50
100
150
200
250
300
350
2009 2011 2013
26
59
48
38
111
75
61
154
117KSh
Billi
ons
0
5%
10%
15%
20%
25%
2009 2011 2013
19.5%20.9%
23.4%
Small Banks Mid-sized banks Large Banks
FinACCeSS BuSineSS – SupplyBAnK FinAnCinG oF SMeS in KenyA • 11
4.1.3 Comparison with other African markets
The share of SME lending relative to total lending by commercial banks is higher in Kenya compared to other major markets in Sub Saharan Africa like Nigeria and South Africa, where SME loans accounted for 5 and 8 per cent of total loan portfolios in the respective survey years (see Figure 5). This ratio is somewhat higher in Rwanda and Tanzania, however these are smaller markets with a relatively limited presence of large-scale firms (Aziz and Berg, 2012).
Figure 5: international comparison of the share of SMe lending to total lending*
0
5
10
15
20
25
Kenya Nigeria Rwanda S.Africa Tanzania
23.4
5.0
17.0
14.0
8.0
Source: Analysis of survey responses for Kenya, Berg and Fuchs (2013) for other countries.
*Note that the surveys were conducted in different years. In Kenya the data refers to 2013, Nigeria to 2010, Rwanda to 2011, South Africa to 2009, and Tanzania to 2010.
In line with previous studies conducted in Nigeria, Rwanda and South Africa, the contribution of SMEs to the banks’ net earnings in Kenya is higher than the share of SME lending (see Figure 6 and Figure 7), which confirms the high profitability of the SME segment compared to the rest of the banks’ portfolios. What differs in the four countries is the revenue model. Kenyan and Rwandan banks rely on credit as their main source of revenues (around 70 per cent) and only around 10 per cent of revenues come from deposit and account management. In Nigeria and South Africa the situation is very different: deposit and account management constitute over 50 per cent of the revenues, and credit is less than 25 per cent (see Figure 6). Possible reasons for these findings are the stronger focus on lending in Kenya and Rwanda and possibly stronger competition, making deposit and account management less profitable. When banks in Kenya were asked to provide information on the top loan products they provide to SMEs, the large majority of banks indicated term loans, overdrafts, and a variety of trade finance products such as invoice discounting and local purchasing order (LPO) financing17 as the most common in the segment.
17 In LPO financing, banks provide loans to firms that obtain purchasing orders from reputable companies and require working capital to execute them.
Figure 4: Share of SMe loans in overall loan portfolio by bank size and ownership
\Source: Analysis of survey responses
Small Banks Mid-sized Banks Large Banks
2009 35.5% 28.1% 12.0%
2011 37.6% 32.0% 11.4%
2013 44.5% 33.3% 15.6%
10%
20%
40%
30%
50%
Expo
sure
to SM
Es
Domestic Banks Foreign Banks
2009 19.8% 16.6%
2011 22.9% 15.8%
2013 28.2% 16.1%
5%
10%
20%
15%
30%
25%
Expo
sure
to SM
Es

12 • FinAccess Business – supplyBAnk FinAncing oF sMes in kenyA
Figure 6: Average percentage of SMe finance revenues by product type in different countries
0
20%
40%
60%
80%
Kenya Rwanda Nigeria S.Africa
Credit Other transactions and fee-based servicesDeposit and Account management
Source: Berg and Fuchs (2013)
Figure 7: purpose of SMe loans in different countries
0
20%
40%
60%
80%
Kenya Rwanda Nigeria S.Africa
Investment Working capital Other
Source: Analysis of survey responses, Fuchs et al. (2011), Aziz and Berg (2012), Berg et al. (2012)
Similarly, there are significant differences in the purpose and features of SME lending across countries. Whereas banks in Rwanda and South Africa provide the majority of their loans for investment purposes, Kenyan and Nigerian banks tend to provide a larger proportion for working capital (see Figure 7). There are arguably many possible explanations for this. Partly this could be demand-driven, meaning that SMEs tend to apply for working-capital loans more often than for investment loans because of the structure of the SME segment. The finding might also reflect the risk assessment made by banks on short-term versus long-term loans as well as the perceived difficulty of recovering loans and seizing collateral. According to the banks interviewed, it takes on average 190 days to recover bad loans in Kenya with the share of recovery around 80 per cent; the cost is approximately 40 per cent of the loans disbursed. In Rwanda the situation seems somewhat better: it takes on average 135 days to recover loans, the share of recovery is around 85 per cent and the cost is around 10 per cent of the loans disbursed. Nigerian banks operate in the most difficult environment: they take 246 days on average to recover a loan and are only able to recover 30 per cent of the loan amount, explaining the overall reluctance of the Nigerian banks to engage in term-lending to SMEs.
4.2 ChArACTeriSTiCS oF BuSineSS lenDinG in KenyA in 2013
The survey provided a detailed analysis of the composition of SME lending portfolios and the type of products that are mostly used by small firms. The idea is that while the growth of the overall portfolio certainly signals a growing relevance of small business financing in the banking sector, it tells us very little about the characteristics and sophistication of lending in the segment. This section will focus on key characteristics such as average loan size for different types of enterprises, loan maturity, interest rates, and the sectoral distribution of business lending. It will also analyse the role of different lending technologies in the composition of the SME finance portfolio. The objective is to analyse whether in addition to growth in the size of the SME lending, the banking sector is growing in its level of sophistication and is able to provide adequate and diverse services to address the heterogeneous needs of the SME sector.
4.2.1 A supply-side estimation of access to credit and average loan sizes
A first level of analysis can be conducted by looking at the simple ratio between the number of loan accounts and deposit accounts for business customers, which can shed light on the percentage of firms with access to a credit facility. This kind of question is normally addressed via demand-side surveys with the question “Have you received a loan from a bank in the last ‘x’ years?” directly posed to the firms interviewed. However looking at the same question from a supply-side point of view can shed light on the validity of results: out of all businesses with a deposit account at a bank, how many are granted access to a loan?
Table 5: ratio of loan accounts to deposit accounts and average loan size by segment as of December 2013
Micro Small Medium Large
Ratio of deposit accounts to loan accounts
6.0% 20.2% 23.4% 38.7%
Average loan size (KSh)
588,489 1,876,585 5,432,245 40,942,492
Source: Analysis of survey responses
Table 5 shows that the percentage is only 6 per cent for microenterprises, 20.2 per cent for small enterprises, 23.4 per cent for medium enterprises, and 38.7 per cent for large firms. It is important to note that this estimation is affected by many factors: first, many microenterprises may be borrowing from a personal account rather than a business account. Second, a business could have multiple deposit accounts at different institutions but receives a loan from only one or from none of them. Third, businesses could have only

FinACCeSS BuSineSS – SupplyBAnK FinAnCinG oF SMeS in KenyA • 13
one deposit account with a bank which is providing multiple loans at the same time (e.g. an overdraft and a term-loan simultaneously). The first and second situations are likely to be more common in the Kenyan market, which is characterised by customer mobility and therefore businesses often have more than one deposit account.
Another interesting estimation from the supply-side survey concerns the average loan size provided to different categories of businesses. While the median value is more representative because it is less affected by outliers, the segmentation of the data by firm size should minimise this problem. Table 5 shows that in 2013 the average loan size was approximately KSh590,000 for micro-enterprises, KSh1.9 million for small firms, KSh5.4 million for medium enterprises, and about Ksh41 million for large firms.
4.2.2 Average loan maturity
Table 6 shows the average maturity of loans provided to different types of business customers depending on bank size and ownership. Compared to small and mid-sized banks, large financial institutions provide loans with considerably shorter maturity to microenterprises (11 months on average) than what is offered to small, medium and large enterprises. While domestic banks provide longer repayment periods to micro and small enterprises, foreign banks tend to provide longer maturity to medium and large firms. However, it is important not to over-interpret data on the average maturity of loans, as such data can be affected by many factors including how banks define microenterprises or SMEs and the composition of the business finance portfolio. Different lending products (e.g. short/long-term loans, overdrafts, asset finance, etc.) are by definition characterised by different levels of maturity. This will be analysed in more detail in Section 4.2.4.
Table 6: Average maturity (months) of loans for business clients by bank size and ownership in 2013*
Bank size Bank ownership
TotalSmall Mid-sized Large Domestic Foreign
Micro enterprises
19.8 22.9 11.0 19.7 15.0 18.8
Small enterprises
33.6 37.9 44.6 37.8 36.0 37.1
Medium enterprises
37.3 46.8 50.3 40.1 47.8 42.5
Large enterprises
41.2 57.7 60.0 47.9 50.4 48.7
* Note that this table provides the average maturity across all types of loans to micro, small, medium and large enterprises.
Source: Analysis of survey responses
4.2.3 interest rates
One of the sections of the questionnaire asked banks to provide data on the average interest rates they charge to their different types of business customers18. As expected, smaller businesses tend to be charged higher interest rates on loans compared to larger firms. Across all types of financial institutions, our survey finds that the average annual interest rate is 20.6 per cent for microenterprises, 18.5 per cent for small enterprises, 17.4 per cent for medium enterprises and 15.3 per cent for large enterprises. There are differences, however, depending on bank size and ownership. Mid-sized banks appear to offer the lowest interest rates to micro, small and medium enterprises, whereas small banks appear to offer lower interest rates to what they define as large firms (see Table 7), though their core focus is often small and medium enterprises. Foreign banks appear to offer lower interest rates to medium and large firms, while they offer higher rates to smaller firms, in particular microenterprises. The interest rate levels in this table may also be a function of outreach: as shown in Table 2, mid-sized banks tend to offer the largest loan sizes on average, especially the foreign mid-sized banks, showing that they are probably focusing on upper tier customers for each of the segments, including microenterprises. As mentioned above, the data should be interpreted with the caveat that interest rates are affected by the types of loans that the various categories of businesses are able to access.
Table 7: Average interest rates for business clients by bank size and ownership in 2013
Bank size Bank ownership
TotalSmall Mid-sized Large Domestic Foreign
Micro enterprises
23.5 18.5 20.5 20.2 22.1 20.6
Small enterprises
18.5 17.1 20.1 18.6 18.4 18.5
Medium enterprises
17.1 16.4 19.5 17.8 16.6 17.4
Large enterprises
14.8 16.2 15.6 16.1 13.4 15.3
Source: Analysis of survey responses
4.2.4 Composition of SMe finance portfolios
One of the key objectives of this study is to shed light on the type of financial products provided to SMEs in the Kenyan market, the differences between types of institutions, and the overall level of sophistication of service provision to SMEs. Are banks providing diversified financial products to
18 This measure does not include additional fees and charges on loans.

14 • FinAccess Business – supplyBAnk FinAncing oF sMes in kenyA
businesses? Are they using different lending technologies or relying on more conventional lending products? The 2014 survey round was the first attempt to comprehensively address the composition of the banks’ loan portfolio in the Kenyan market: while the time-series component is not available and we are unable to analyse market trends, we can nevertheless analyse which market segments different banks are trying to target and set a baseline for future surveys. Lending products were grouped into five main types: term-loans with maturity below 24 months (short-term loans), term loans with maturity above 24 months (long-term loans), trade finance products (e.g. invoice discounting, letter of purchasing order financing, factoring, etc.), asset financing, and overdrafts. Banks could also specify a category ‘other’ for products that they were offering to SMEs but which were not included on the list. Banks were asked to provide data on both the number of outstanding loans for each lending product and the percentage of the total SME finance portfolio that these products represent: while the number of loans shows the level and frequency of demand for each type of credit product, the share of the total portfolio shows the weight that these products have in bank lending exposure.
Table 8 presents the findings on the composition of SME portfolios by bank size. The differences between types of banks are noteworthy: mid-sized banks, which have the largest commitment in terms of value to the SME financing space, rely heavily on overdrafts as their main financial product, representing 35 per cent of total value and over 62 per cent of total number of loans. So
while the financial commitment of mid-sized banks to the SME sector may be large, this commitment is focused on very short-term commitments that are largely only suitable for funding SMEs’ working capital needs. Large banks, on the other hand, rely much less on overdrafts (about 15 per cent of the SME portfolio) and are considerably more active in the provision of small-scale, long-term loans, which represent half of the value of their SME lending.
The most interesting finding from this analysis is arguably the central role played by overdrafts in SME lending in Kenya. While overdrafts can be useful to meet immediate liquidity needs and to avoid firms having to turn to informal lenders or shadow banking, a problem arises when firms use overdrafts to fund specific working capital or investment financing needs. Overdrafts tend to be very expensive and inefficient in addressing specific business funding needs. Banks, on the other hand, may have limited incentives to reduce firms’ reliance on overdrafts, as the overdrafts usually provide high profit margins. Nonetheless, during the interviews some bank managers confirmed that over-reliance on overdrafts can be a major hindrance to the development of SME finance in Kenya: overdrafts are a financial ‘black box’ because they do not reveal why firms are borrowing nor how the loans are used. On the whole, banks are highly risk-averse, particularly as regards their exposure to smaller and microenterprises, and they find that callable, short-term overdrafts suit their risk appetite well.
Table 8: Composition of SMe portfolio by lending product and bank size (value and volume)
Value of portfolio by lending product (% of total) Number of loan facilities by lending product (% of total)
Small banksMid-sized
banksLarge banks
Weighted average
Small banksMid-sized
banksLarge banks
Weighted average
Term loans (maturity below 24 months)
15.5 11.2 9.6 12.9 13.4 6.6 13.7 10.2
Term loans (maturity above 24 months)
42.9 33.7 50.6 42.1 33.1 9.0 40.5 24.7
Trade finance 2.6 3.7 7.9 4.2 2.1 1.9 2.8 2.3
Overdraft 30.0 34.9 15.3 27.8 42.9 62.4 23.1 43.4
Asset financing 8.8 16.6 11.8 11.7 8.4 20.1 19.6 19.3
Other 0.2 0.00 5.2 1.4 0.2 0.0 0.2 0.1Source: Analysis of survey responses

FinACCeSS BuSineSS – SupplyBAnK FinAnCinG oF SMeS in KenyA • 15
4.2.5 Sectoral distribution of business lending
Table 10 shows the disaggregation of micro, small, medium and large lending portfolios by sector of operation of the borrowing firms. Some sectors tend to have an approximately constant share of total lending regardless of the size of the firms. Lending to the construction sector, for instance, fluctuates between just 6.5 per cent and 7.8 per cent across all segments, whereas real estate represents only 0.8 per cent of lending to microenterprises yet almost 20 per cent of the finance portfolio for large enterprises. Similarly, manufacturing jumps from 6.8 per cent for microenterprises to 15.2 per cent for large enterprises.
Financing of agricultural firms seems to follow a ‘U’ pattern, with 4.8 per
cent at micro-enterprise level, down to 2.7 per cent at small enterprise level, and then back up to 4.7 per cent for medium enterprises and 7.4 per cent for large enterprises. This supports the view that banks finance agricultural firms that are either micro-scale or large scale and that there is a ‘missing middle’ in SME financing to the agricultural sector. More generally, however, it seems that agricultural firms tend to be poorly served by the financial sector, considering that agriculture represents over 20 per cent of GDP. It became clear during the interviews that most financial institutions lack the know-how to lend to agricultural enterprises and are therefore not inclined to increase their exposure to this segment, in particular due to the seasonality of revenues and vulnerability to unpredictable weather conditions. The small number of bank branches operating in rural areas also plays a role.
Table 9: Composition of SMe portfolio by lending product and bank ownership (value and volume)
Value of portfolio by lending product (% of total)
Number of loans per lending product (% of total)
Domestic banks Foreign banks Domestic banks Foreign banks
Term loans (maturity below 24 months) 15.4 7.6 11.5 6.1
Term loans (maturity above 24 months) 43.2 40 20.3 38.2
Trade finance 3.7 5.2 2.5 1.8
Overdraft 25.0 33.7 45.9 35.6
Asset financing 12.6 9.8 19.8 17.9
Other 0.2 3.9 0.0 0.4
Source: Analysis of survey responses
Table 10: Sectoral distribution of lending by size of the firms
Microenterprise lending
Small enterprise lending
Medium enterprise lending
Large enterprise lending
Agriculture 4.8% 2.7% 4.7% 7.4%
Manufacturing 6.8% 6.6% 12.3% 15.2%
Real estate 0.8% 15.9% 15.9% 19.9%
Construction 6.5% 7.8% 5.7% 6.6%
Trade 61.7% 39.5% 36.3% 21.9%
Transport and communication 12.8% 21.3% 15.6% 7.7%
Restaurant, hotel and tourism 0.9% 2.3% 3.6% 4.1%
Finance and business services 4.9% 2.2% 2.6% 6.3%
Energy and water 0.5% 0.7% 1.5% 10.5%
Mining and quarrying 0.3% 1.0% 1.8% 0.4%
Total 100.0% 100.0% 100.0% 100.0%Source: Analysis of survey responses
16 • FinAccess Business – supplyBAnk FinAncing oF sMes in kenyA
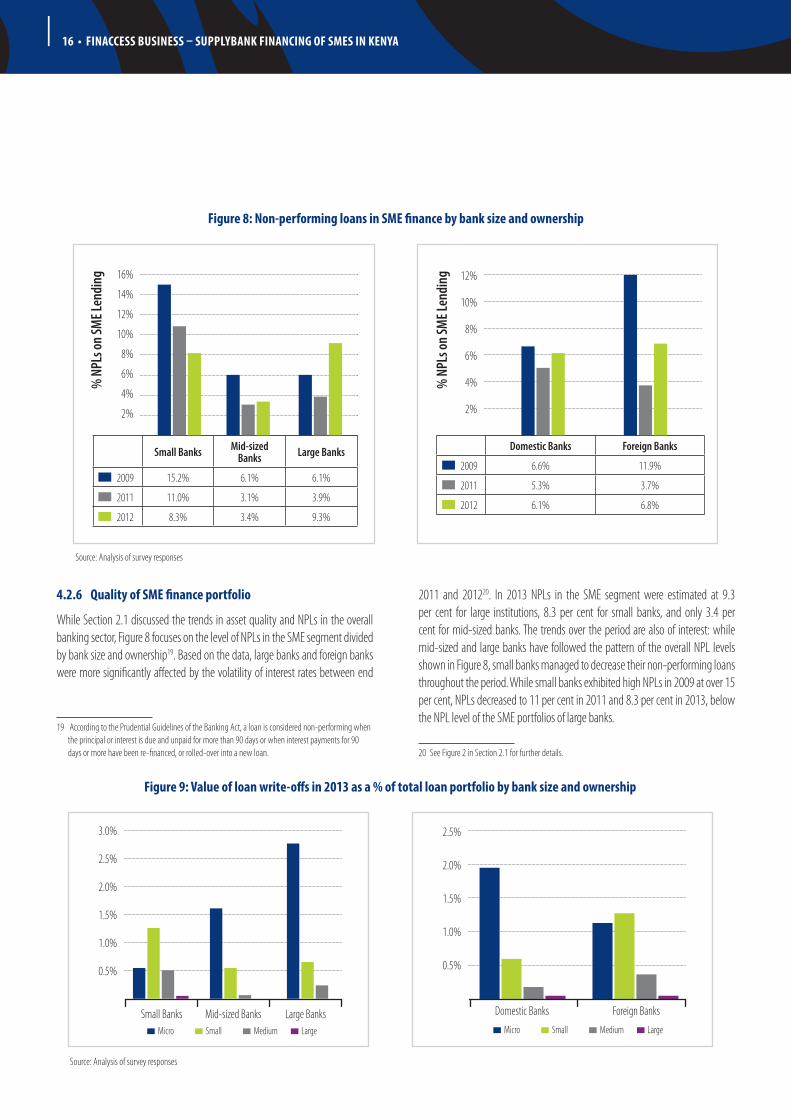
4.2.6 Quality of SMe finance portfolio
While Section 2.1 discussed the trends in asset quality and NPLs in the overall banking sector, Figure 8 focuses on the level of NPLs in the SME segment divided by bank size and ownership19. Based on the data, large banks and foreign banks were more significantly affected by the volatility of interest rates between end
19 According to the Prudential Guidelines of the Banking Act, a loan is considered non-performing when the principal or interest is due and unpaid for more than 90 days or when interest payments for 90 days or more have been re-financed, or rolled-over into a new loan.
2011 and 201220. In 2013 NPLs in the SME segment were estimated at 9.3 per cent for large institutions, 8.3 per cent for small banks, and only 3.4 per cent for mid-sized banks. The trends over the period are also of interest: while mid-sized and large banks have followed the pattern of the overall NPL levels shown in Figure 8, small banks managed to decrease their non-performing loans throughout the period. While small banks exhibited high NPLs in 2009 at over 15 per cent, NPLs decreased to 11 per cent in 2011 and 8.3 per cent in 2013, below the NPL level of the SME portfolios of large banks.
20 See Figure 2 in Section 2.1 for further details.
Figure 8: non-performing loans in SMe finance by bank size and ownership
Small Banks Mid-sized Banks Large Banks
2009 15.2% 6.1% 6.1%
2011 11.0% 3.1% 3.9%
2012 8.3% 3.4% 9.3%
2%
4%
12%
10%
14%
8%
6%
16%
% N
PLs o
n SM
E Len
ding
Domestic Banks Foreign Banks
2009 6.6% 11.9%
2011 5.3% 3.7%
2012 6.1% 6.8%
2%
4%
8%
6%
12%
10%
% N
PLs o
n SM
E Len
ding
Source: Analysis of survey responses
Figure 9: value of loan write-offs in 2013 as a % of total loan portfolio by bank size and ownership
0.5%
1.0%
3.0%
2.5%
2.0%
1.5%
Small Banks Mid-sized Banks Large Banks Micro Small Medium Large
0.5%
1.0%
2.0%
1.5%
2.5%
Domestic Banks Foreign Banks
Micro Small Medium Large
Source: Analysis of survey responses

FinACCeSS BuSineSS – SupplyBAnK FinAnCinG oF SMeS in KenyA • 17
Another important measure to assess the quality of the business loan portfolio concerns the value of write-offs during the year. This question was added in the 2014 survey, as it became clear from the previous survey that the NPL level data was affected by the value of loan write-offs during the year. Figure 9 shows that the value of write-offs was relatively high in the microenterprise loan portfolio and, in particular, as undertaken by large, domestic banks. Small and foreign banks undertook relatively high write-offs of their loans to small enterprises.
4.2.7 risk management and lending technologies
One of the key determinants of efficiency in SME finance concerns the role of lending technologies and how banks tackle the information opacity that characterises most SMEs. Banks were asked to choose from four main lending technologies (see Figure 10): ‘relationship lending’, which was described as the situation where the bank mainly approves loans through relationships with the client. This could involve soft information gathered by the loan officer through continuous, personalised direct contacts with the firms, their owners, managers, and the local community in which they operate. The second option ‘arms’ length lending’ refers to the context where banks mainly approve loans through transactional technologies such as credit scoring, standardised risk-rating tools and processes, factoring, leasing, etc. The third option ‘close monitoring’ is an extension of relationship lending, which involves frequent visits to firms’ premises, continuous interaction with clients, frequent reporting
requirements, etc. Finally, the fourth option, ‘automated monitoring’, refers to the context where banks rely on information based on firms’ cash-flow and transactions with the bank.
Figure 10 shows that relationship lending and close monitoring still play a central role in the SME finance space in Kenya. Banks often monitor their borrowers with visits to premises and careful observation of their clients’ activities. Transaction-based, arms-length technologies do, however, play a role across all types of institutions. In particular many banks make use of credit scoring in the loan appraisal process (see Figure 11). While none of the banks completely rely on credit scoring in their SME finance portfolio, the large majority of banks use this technology as an input in the assessment of loan applications, or for some specific lending products. This is particularly the case for foreign banks. On the other hand, a relatively high number of banks, especially domestic banks, do not use credit scoring at all and seem to rely entirely on relationship-based technologies. Large banks systematically use credit scoring as an input for assessing SME loans, one reason being that they have to deal with high numbers of applications and loan officers across the country. Nonetheless, scoring represents only an input in the decision-making, while close monitoring of the firms and relationships with the owners still play a central role. Some small banks use credit scoring as well, but not as systematically as large banks. In fact many small institutions rely entirely on relationship lending.
Figure 10: Main lending technologies used by the banks with SMes, categorised by bank size and ownership
0
5
10
15
20
25
35
30
40
Relationship lending (soft information)
Close monitoring (relationship )
Arms length lending
Automated monitoring
Other
Num
ber o
f Ban
ks
Small Banks Mid-sized banks Large Banks
0
5
10
15
20
25
35
30
40
Relationship lending (soft information)
Close monitoring (relationship )
Arms length lending
Automated monitoring
Other
Num
ber o
f Ban
ks
Domestic banks Foreign Banks
Note: the chart indicates the total number of responses. Respondents could choose more than one option
Source: Analysis of survey responses

18 • FinAccess Business – supplyBAnk FinAncing oF sMes in kenyA
4.3 SeGMenTATion oF BAnKS By BuSineSS MoDel
The vibrancy of the SME finance market in Kenya is evidenced in the distinct ways in which banks approach SMEs. In our analysis of the questionnaire responses and in-depth interviews, we identified three main types of business model: the corporate-oriented business model (CBM), the supply chain-oriented business model (SBM) and the microenterprise-oriented business model (MBM). These business models reflect the lending technology utilised and the approach to customer acquisition. To analyse the lending technology we draw upon the rich conceptual framework developed by Berger and Udell (2004).
Banks target the market segments they are most effectively able to service, reflecting their strategic orientation and limitations imposed by their approach to risk management. As evidenced above, risk management strategies vary widely across banks and may be based on ‘hard’ information, ‘soft’ information,
or a combination of the two. ‘Hard information’ consists, for example, of financial ratios calculated from certified audited statements and credit scores assembled from data on payment and cash-flow histories of SMEs and their owners, as well as data assembled by credit bureaus. ‘Soft information’ consists of non-financial information about the ability and willingness of firms and entrepreneurs to live up to their obligations to their creditors, such as the sources of their revenues and their historical relationship and track record with the bank. In addition banks rely to varying degrees on collateral or security as provided, for instance, by invoices of their clients. How these various forms of information are utilised determines the split between transactions-based lending, which relies on credit scoring technology and/or on security, and relationship-based lending, which is more qualitative. In the table below the products and services offered to SMEs are classified in terms of this overarching typology. The approach to customer acquisition illustrates the main approach banks use to draw in new SME customers. Based on this segmentation some key characteristics are highlighted for each of the segments.
Figure 11: reliance on credit scoring in SMe finance by bank size and ownership
0 0
2 2
4 4
6 6
8 8
10 10
14 14
16 16
12 12
18 18
Yes completely Yes completelyYes but only as input
Yes but only as input
Yes but only certain products
Yes but only certain products
Not at all Not at all
Num
ber o
f Ban
ks
Num
ber o
f Ban
ks
Small Banks Mid-sized banks Large Banks Domestic banks Foreign Banks
Source: Analysis of survey responses
Table 11: overview of business models
1. Corporate oriented 2. Supply-chain oriented 3. Micro-oriented
Banks Barclays, CfC Stanbic, Standard Chartered BoA, Chase, DTB, Ecobank, FINA, I&M, NIC Co-op, Equity, Family, KCB, KREP, Jamii Bora
Target market and risk management
Depth of target market
Medium enterprises Small and medium enterprises Micro, small and medium enterprises
Information used in credit appraisal
Hard information on business
Combination of hard and soft information on the business and entrepreneur, and information on government and corporate clients in supply chain of SME
Soft information on the entrepreneur and the business

FinACCeSS BuSineSS – SupplyBAnK FinAnCinG oF SMeS in KenyA • 19
4.3.1 Corporate-oriented business model
The market for corporate lending in Kenya is relatively mature. Most banks target the corporate segment when they start operating in Kenya and then expand into the retail/consumer market before lastly moving into the SME market. The proliferation of corporate lending has influenced the way in which the CBM banks approach SMEs.
The credit risk management tools used by CBMs utilise predominantly hard information when assessing the creditworthiness of SMEs, relying to a large extent on evaluations of the firms’ creditworthiness through the analysis of financial reports, borrowing histories, and financial ratios. The level of sophistication of the credit scoring models requires the use of robust financial statements. The downside of this model is that soft information is not utilised effectively and that collateral remains an important component of the loan decision with relatively limited flexibility. This affects how far down-market these banks can go since the majority of SMEs lack the track record required as well as the data needed for more sophisticated credit scoring techniques. Consequently, these banks tend to focus on medium-sized enterprises and mid corporates.
Product offerings of CBM banks tend to be scaled down versions of products they deliver to larger corporates, such as short-term working capital loans, asset-finance, wealth management, and foreign exchange risk management. Since only a limited number of SMEs are able to provide sufficient financial
documentation, the customer acquisition model tends to be fairly conservative with most of the business dependent on pre-existing relationships and referrals. The outreach network for SME financing is equally limited, not only in terms of actual branches, but also as regards the channels for delivery of SME finance (loan officers trained to do loan assessments, marketing campaigns, etc.). The average number of loan officers among the surveyed CBM banks serving SMEs was 27 which represented the smallest number in the three banking models.
CBM banks tend to situate the SME portfolio within the corporate division and typically do not have a dedicated department for smaller or microenterprises, nor do they harbour intentions of moving more strongly into this space. This segment is dominated by foreign-owned multinational banks with an institutional structure that allows them to draw upon sophisticated credit-scoring tools, but limits their ability to innovate due to long chains of command, often headquartered abroad.
4.3.2 Supply-chain oriented business model
The banks in this category often have their origins in community-based business models – targeting a specific clientele or network of firms within the Kenyan business community – and are now reaching a much broader customer base. They may also have a regional footprint and be catering to the local subsidiaries of their corporate clients located in other countries. These banks typically use a combination of specialised supply-chain finance
1. Corporate oriented 2. Supply-chain oriented 3. Micro-oriented
Lending technology
Credit scoring technology used for transactions based lending
Secured credit using invoices and hire-purchase as collateral
Relationship-based lending
Products and services offered
TypologyScaled down version of products offered to corporates
Specialised SME financing productsScaled up versions of retail or microfinance products
ExamplesAsset finance, working capital finance, FX, wealth management
Invoice discounting, hire purchase, leasing, overdrafts
Working capital loans, overdrafts, asset finance, FX
Approach to customer acquisition
Approach to customer Acquisition
Brand recognition Networks of corporate customersLarge outreach networks encourage graduation from micro to the SME space
Key characteristics
Type of bank Large multinationalsSmall and mid-sized banks of local and sometimes regional origin
Large and medium-sized local banks
Outreach networks
Minimal Minimal Extensive
20 • FinAccess Business – supplyBAnk FinAncing oF sMes in kenyA
products such as invoice discounting and local purchase order financing, and specialised asset finance products such as hire purchase. Supply-chain financing has developed quite strongly in Kenya, except for some financial products such as leasing and factoring which are still underdeveloped in the Kenyan market21.
Financial products such as invoice discounting and hire purchase allow banks to move beyond the basic lending technologies that rely on financial statements and credit scoring. Instead, the security provided is based on information about those firms to which SMEs supply goods and services or on the assets acquired on hire purchase. Banks that have adopted SBM as their approach therefore tend to use a considerably broader information spectrum compared to CBM banks. They often engage with SMEs that operate in the supply chain of pre-existing corporate clients.
The supply-chain and collateral-based enhancement techniques allow the SBM banks to focus on the SMEs in the medium end of the market and give them the opportunity to venture further down-market based on (a) the relationship between the smaller SMEs and their corporate clients or government entities, and (b) enhanced asset-based security. Similar to the CBM banks, the SBM banks originally started off focusing on corporate customers and then moved into the SME finance space. This means that the infrastructure in place for reaching out to new SMEs is fairly limited as well. With just 23 branches per bank, this bank model has the smallest outreach network in terms of geographical presence, but has, on average, a higher number of loan officers assessing SMEs than the CBM banks.
The SBM category of banks is made up of a set of medium-sized banks with a combination of local niche players and regional banks. These banks often compete with the CBM banks for the corporate segment and have innovated down-market so as to ring-fence the cash flows of the corporates with whom they already have a relationship. Thus competition in the market for smaller enterprise lending has led to exploitation of comparative advantages in the utilisation of lending technologies in the SME space.
4.3.3 Microenterprise-oriented business model
The most distinctive innovation in the Kenyan market is the transference of lending technology developed in the microenterprise segment to the SME lending space. Banks using the microenterprise-oriented business model (MBM) are characterised by a stronger reliance on ‘soft information’ or relationship-based lending. This lending technology is based on information gathered by loan officers over time through repeated interaction with SME managers as well as other parties, such as suppliers and customers. Several MBM banks are large Kenyan-owned banks. They tend to have an enhanced capacity to innovate relative to the CBM banks because their management
21 Factoring will be described in greater detail in Section 5.2.
structures allow them to devolve decision-making to the local level. This implies that they are more responsive to changes in the dynamics of the Kenyan market.
Another crucial aspect of the MBM lending approach is that it facilitates the graduation of bank borrowers allowing entrepreneurs to graduate as they grow from participation in basic group lending into small and medium sized enterprises serviced as individual enterprises according to more traditional lending technologies. Not only do these graduation opportunities help entrepreneurs establish their credit history with banks, they also provide banks with a pipeline of new ‘investable’ SMEs that have a track record with the formal financial sector. This rather uniquely Kenyan financial graduation model has been effective at delivering financial services to the underserved at scale and has led to market learning and the development of specialised skills.22
The credit risk management used by MBM banks is a combination of small business credit scoring and relationship-based lending. The lending products offered by MBM banks tend to rely heavily on plain vanilla products such as working capital loans, transactions accounts, and asset financing (for the larger customers). However, a flexible approach to collateral and the incorporation of ‘soft information’ is more developed here than in the other bank categories due to historical involvement with the MFI sector. There are typically two levels of risk management – at the branch level and then at headquarters for larger loan requests. This structure offers a greater degree of flexibility and autonomy at the branch level which the other bank categories typically do not encourage. The MBM banks also impose lower formality constraints.
The market being catered for by the MBM banks is at the lowest end of the SME market. The MBM banks tend to have extensive outreach networks due to their move from the mass retail/microfinance market into the SME space, and they have a large number of bank branches equipped with loan officers who are in a position to make SME loan assessments. Additionally, these institutions have embraced alternative outreach models such as agency banking and mobile banking to create points of contact with hard-to-reach communities and as service delivery channels. The banks in this category tend to be home-grown Kenyan institutions with a historical involvement in the microfinance space.
4.4 Key DriverS AnD oBSTACleS For BAnK involveMenT WiTh SMeS
Financial institutions were asked to identify the major drivers for their decision to get involved in SME finance as well as the main obstacles that they face in
22 The synergies between microfinance (collective lending model) and more traditional banking have been recognised and encouraged in Kenya for many years. An example is K-Rep which was founded as an intermediary organisation in 1984 providing funds to NGOs for on-lending to microenterprises and expanded to work on USAID's Private Enterprise Development Project in 1987. In 1997 K-Rep Bank Limited was formed as a subsidiary of K-Rep Group and in 2000 it became the first commercial bank in Kenya to directly target low-income clients.
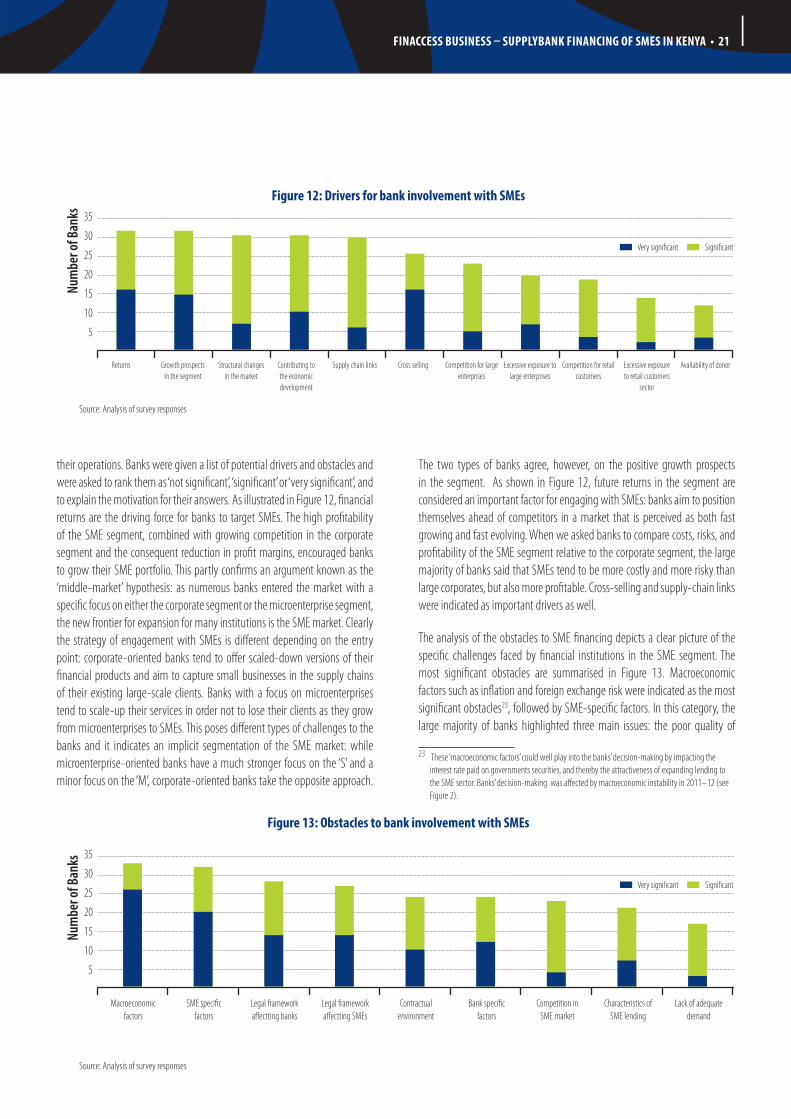
FinACCeSS BuSineSS – SupplyBAnK FinAnCinG oF SMeS in KenyA • 21
their operations. Banks were given a list of potential drivers and obstacles and were asked to rank them as ‘not significant’, ‘significant’ or ‘very significant’, and to explain the motivation for their answers. As illustrated in Figure 12, financial returns are the driving force for banks to target SMEs. The high profitability of the SME segment, combined with growing competition in the corporate segment and the consequent reduction in profit margins, encouraged banks to grow their SME portfolio. This partly confirms an argument known as the ‘middle-market’ hypothesis: as numerous banks entered the market with a specific focus on either the corporate segment or the microenterprise segment, the new frontier for expansion for many institutions is the SME market. Clearly the strategy of engagement with SMEs is different depending on the entry point: corporate-oriented banks tend to offer scaled-down versions of their financial products and aim to capture small businesses in the supply chains of their existing large-scale clients. Banks with a focus on microenterprises tend to scale-up their services in order not to lose their clients as they grow from microenterprises to SMEs. This poses different types of challenges to the banks and it indicates an implicit segmentation of the SME market: while microenterprise-oriented banks have a much stronger focus on the ‘S’ and a minor focus on the ‘M’, corporate-oriented banks take the opposite approach.
The two types of banks agree, however, on the positive growth prospects in the segment. As shown in Figure 12, future returns in the segment are considered an important factor for engaging with SMEs: banks aim to position themselves ahead of competitors in a market that is perceived as both fast growing and fast evolving. When we asked banks to compare costs, risks, and profitability of the SME segment relative to the corporate segment, the large majority of banks said that SMEs tend to be more costly and more risky than large corporates, but also more profitable. Cross-selling and supply-chain links were indicated as important drivers as well.
The analysis of the obstacles to SME financing depicts a clear picture of the specific challenges faced by financial institutions in the SME segment. The most significant obstacles are summarised in Figure 13. Macroeconomic factors such as inflation and foreign exchange risk were indicated as the most significant obstacles23, followed by SME-specific factors. In this category, the large majority of banks highlighted three main issues: the poor quality of
23 These ‘macroeconomic factors’ could well play into the banks’ decision-making by impacting the interest rate paid on governments securities, and thereby the attractiveness of expanding lending to the SME sector. Banks’ decision-making was affected by macroeconomic instability in 2011–12 (see Figure 2).
Figure 12: Drivers for bank involvement with SMes
Source: Analysis of survey responses
Figure 13: obstacles to bank involvement with SMes
Source: Analysis of survey responses
Returns Growth prospects in the segment
Structural changes in the market
Contributing to the economic development
Supply chain links Cross selling Competition for large enterprises
Excessive exposure to large enterprises
Competition for retail customers
Excessive exposure to retail customers
sector
Availability of donor
Very significant Significant
35
30
25
20
15
10
5
Num
ber o
f Ban
ks
Macroeconomic factors
Bank specific factors
Legal framework affectting banks
Characteristics of SME lending
SME specific factors
Competition in SME market
Contractual environment
Legal framework affectting SMEs
Lack of adequate demand
Very significant Significant
35
30
25
20
15
10
5
Num
ber o
f Ban
ks
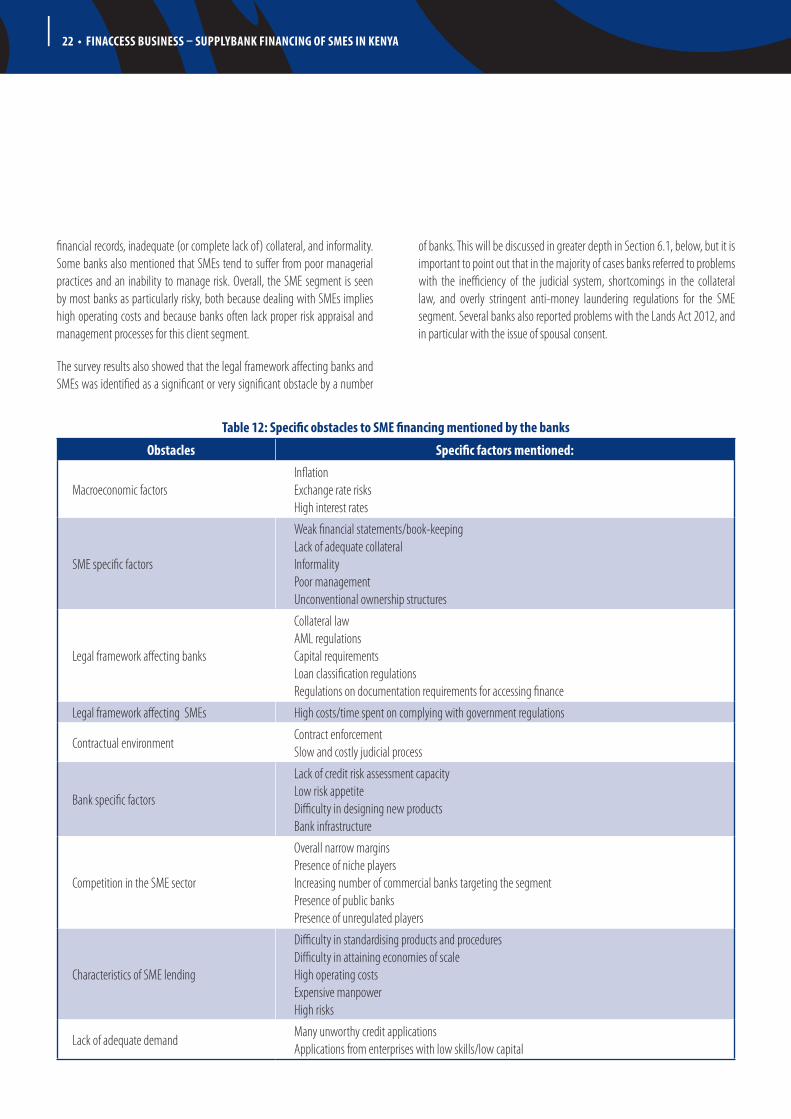
22 • FinAccess Business – supplyBAnk FinAncing oF sMes in kenyA
financial records, inadequate (or complete lack of) collateral, and informality. Some banks also mentioned that SMEs tend to suffer from poor managerial practices and an inability to manage risk. Overall, the SME segment is seen by most banks as particularly risky, both because dealing with SMEs implies high operating costs and because banks often lack proper risk appraisal and management processes for this client segment.
The survey results also showed that the legal framework affecting banks and SMEs was identified as a significant or very significant obstacle by a number
of banks. This will be discussed in greater depth in Section 6.1, below, but it is important to point out that in the majority of cases banks referred to problems with the inefficiency of the judicial system, shortcomings in the collateral law, and overly stringent anti-money laundering regulations for the SME segment. Several banks also reported problems with the Lands Act 2012, and in particular with the issue of spousal consent.
Table 12: Specific obstacles to SMe financing mentioned by the banks
obstacles Specific factors mentioned:
Macroeconomic factorsInflationExchange rate risksHigh interest rates
SME specific factors
Weak financial statements/book-keepingLack of adequate collateralInformalityPoor managementUnconventional ownership structures
Legal framework affecting banks
Collateral lawAML regulationsCapital requirementsLoan classification regulationsRegulations on documentation requirements for accessing finance
Legal framework affecting SMEs High costs/time spent on complying with government regulations
Contractual environmentContract enforcementSlow and costly judicial process
Bank specific factors
Lack of credit risk assessment capacityLow risk appetiteDifficulty in designing new productsBank infrastructure
Competition in the SME sector
Overall narrow marginsPresence of niche players Increasing number of commercial banks targeting the segmentPresence of public banksPresence of unregulated players
Characteristics of SME lending
Difficulty in standardising products and proceduresDifficulty in attaining economies of scaleHigh operating costsExpensive manpowerHigh risks
Lack of adequate demandMany unworthy credit applicationsApplications from enterprises with low skills/low capital

FinACCeSS BuSineSS – SupplyBAnK FinAnCinG oF SMeS in KenyA • 23
5.1 leASinG AnD hire purChASe
Leasing and hire purchase are two important types of asset-based financing for SMEs lacking collateral and/or robust financial statements. Leasing can be divided into operational leasing and financial leasing. The key difference between these forms of asset-based financing relates to ownership. For operational leasing, payments are made on an agreed periodic basis but ownership of the asset never passes to the lessee; for financial leasing, there is an option for ownership to pass to the lessee, usually upon payment of a final sum. In a hire purchase agreement the ‘hire purchaser’ takes on the goods against an agreed rental payment that includes instalment payment of principal and interest. An option is offered to the hirer to buy the goods at the end of the agreed period. During the interviews it appeared that mainly SBM banks were engaged in hire purchase and, to a lesser extent, financial leasing. The banks didn’t engage in operational leasing. These lending methodologies reflect security provided in the asset being financed, thereby allowing the financier to focus less on the balance sheet and more on the firm’s ability to generate sufficient cash flows.
While the market for hire purchase is growing, the market for financial leasing is not, mainly due to limitations in the Hire Purchase Act which allows the Kenyan tax authority to ‘claw back’ the tax deductions of the instalments if the asset goes on the books of the lessee. The VAT treatment of leasing is also unnecessarily burdensome: VAT is applied to the instalments paid to the lessor when in reality the act of leasing or hire purchase should be regarded as a financial service. These taxes create, in effect, a tax disadvantage for this product relative to operational leasing or bank loans for asset purchase (FSD Kenya, 2009). There is also ambiguity in the definition of leasing in the Kenyan legal and regulatory framework which fails to acknowledge the tripartite nature of the agreement (lessor, lessee, and supplier) in contradiction with international best practice. The Hire Purchase Act has the additional drawback that after two-thirds of instalments have been paid, the owner loses the right to recover the asset except by law suit.
5.2 invoiCe DiSCounTinG AnD FACTorinG
While many SMEs continue to use overdrafts for their short-term financing needs, a growing number of businesses are diversifying their use of bank products and are more frequently using invoice discounting to finance their working capital. By using invoice discounting, SMEs are able to borrow up to a certain percentage (usually about 80 per cent) of the value of receivables associated with high-quality buyers, effectively using the invoice as collateral for the loan. Out of the 18 banks interviewed in this study, 10 indicated that they offer invoice discounting products, and several banks mentioned that they were in the process of developing such products. Although invoice discounting is a flexible means of accessing working capital financing, it has its drawbacks, as banks need to appraise the risk of each buyer individually, increasing the cost of borrowing.
Factoring differs from invoice discounting in that SMEs sell their creditworthy accounts receivable at a discount (equal to interest plus service fees) to a factor, thereby receiving working capital financing without taking out a loan. In addition, most factoring is done ‘without recourse’, meaning that the firm purchasing the receivables assumes responsibility for collecting on the invoice. Factoring can be particularly useful in countries with weak secured lending laws, non-existent collateral registries, inefficient bankruptcy systems, and imperfect records of upholding seniority claims. This is the case because receivables factored without recourse are not part of the estate of a bankrupt SME. In Paraguay, a factoring scheme was implemented that allows for factoring over the mobile phone, an application that would potentially be interesting in Kenya. In environments with poor credit information on SMEs, ‘reverse factoring’ 24 is potentially an even more suitable source of working capital financing. Reverse factoring involves the factoring of accounts receivable only from high quality buyers. Reverse factoring allows small firms to borrow based on the better risk of its larger customers; see Box 125 and Box 2 for factoring examples from Mexico and Peru.
Box 1. reverse factoring: experience from Mexico
Reverse factoring has been successfully introduced in Latin America, with the most notable example being the Nafin program in Mexico (Klapper, 2005). The National Financiera (Nafin) development bank offers on-line factoring products (called ‘Cadenas Productivas’, or ‘Productive Chains’ programme) to SME suppliers. The programme works by creating ‘chains’ between ‘big buyers’ and small suppliers. The big buyers are large, creditworthy firms with low credit risk. All factoring is done on a non-recourse basis. The electronic platform operated by Nafin reduces costs and improves security (over 98 per cent of all services are provided electronically). The electronic platform also allows all commercial banks to participate in the programme, which gives regional banks national reach. The Nafin product also allows lenders to compete to factor suppliers’ receivables. In addition, Nafin pays for the costs associated with their electronic factoring platform and all legal work, so that banks charge only interest and not service fees. Nafin covers its own costs with the interest that lenders pay for their own financing or service fees. Nafin has established productive chains with about 200 big buyers and more than 70,000 small and medium firms.
24 Supplier financing initiated by the (high-quality) buyer, in which the firm sells its creditworthy accounts receivable for this specific buyer at a discount to a factor, providing immediate cash to the seller ‘without recourse’ and outsourcing the payables management of the buyer.
25 Leora Klapper, “Export Financing for SMEs: The Role of Factoring,” The World Bank Group, International Trade Department, Trade Note 29, September 15, 2006.
Chapter 5
Financial SERVicES anD lEnDing PRoDUcTS

24 • FinAccess Business – supplyBAnk FinAncing oF sMes in kenyA
Box 2: Factoring scheme in peruIn Peru, the World Bank has implemented a pilot transaction of a factoring scheme with COFIDE and Capital Tool Corporation, working directly with structuring, legal, and tax advisors. In the transaction, COFIDE and Axur (a local MSE supplier) – through a fiduciary agent – created a special purpose vehicle (SPV). The SPV issued a term note that COFIDE purchased, providing a US$3 million capacity for financing SMEs. The SPV used the proceeds to purchase pre-selected accounts receivable from Axur on a revolving basis. The transaction would extend financing to approximately 600 SMEs, discounting invoices of, on average, US$500 and 21 days maturity. In subsequent transactions, the rating agencies will determine the risk of the financial instrument to be issued by the SPV. This rating would allow the SPV to sell participations in the financing to local institutional investors. At that time, it could cover 45,000 client SMEs for a total funding amount of $30–40 million.
This factoring scheme was one of 14 winners of the G20 SME Challenge Award to find new ways of financing SMEs, and received a $1.5 million grant to expand the scheme. The solution also attracted the interest of the Inter-American Development Bank which approved a $1 million grant to expand the scheme incorporating the portfolio of local microfinance institutions and is about to approve a US$10 million mezzanine guaranty line for the expansion of the programme through the capital market.
Despite a high degree of activity in the invoice discounting market, attempts by banks and non-bank financial institutions to develop factoring products have not taken off. The limitations in the legal framework are seen to be the main constraint with the rights of the factor remaining fairly ambiguous with regards to recourse and stamp duties to be paid (FSD Kenya, 2009). The ambiguous legal status of factoring translates into an unwillingness of banks and non-bank financial institutions to offer factoring to their clients.
5.3 eQuiTy FinAnCe
The Nairobi Securities Exchange, founded in 1954, is the second-oldest in Sub-Saharan Africa. The current value of listed securities (debt and equity) stands
at KSh2,452 billion (nearly half of Kenya’s GDP) (Capital Markets Authority, 2015). However, only larger companies are able to source funds through this channel. In an attempt to open up these funding sources to SMEs, the Capital Markets Authority (CMA) launched the Growth Enterprise Market Segment (GEMS) in February 2013, which focuses on SMEs. It has lower capitalisation and documentation requirements, but requires a nominated management advisor (NOMAD) to bring the SME to market in order to ensure that basic requirements are met. This alternative market is still restricted to the higher end SMEs, and is therefore not available to the majority of Kenyan SMEs.
The private equity space in Kenya is the most active in East Africa and has been growing. In terms of investor perception as regards best prospects on investment returns, Nigeria and Kenya are the most attractive investment destinations for private equity funds.26 In 2013, 12 new deals worth a total of US$112 million were signed in Kenya (Deloitte & Africa Assets, 2014). The sectors of focus are diverse, ranging from financial services to health and agriculture. Regulators have also encouraged private equity investments. Kenya’s Retirement Benefit Authority (RBA) and the Capital Markets Authority (CMA) allow pension funds to invest in private equity as an asset class.
While the first SME-focused private equity firm only began investing in East Africa in 2007, by 2012 the majority of around 15–20 active private equity funds focused primarily on SMEs with a perceived financing gap of typically between US$50,000 and $5 million. The funds target deal sizes of around $1–3 million, which is still at the high end of the SME segment and is therefore out of reach for most SMEs in Kenya. The recent establishment of the funds and investment cycle implies that most funds have not yet reached the exit stage, which will likely remain a challenge due to the weakly developed capital market.
The venture capital industry is still nascent with about 10 venture capital type funds, but interest from international firms, as well as local ones, especially in the emerging ICT industry, has recently been on the increase. There are several incubators which have been set up to help build the pipeline for such deals, but the sector is still at an early stage of development.
26 Invest AD Report – Economist Intelligence Unit. Into Africa: Institutional Investor Intentions to 2016. 2012 http://www.investad.com/Portal/africa_addons/InvestAD_EIU_Africa_Report_2012_EN.pdf

FinACCeSS BuSineSS – SupplyBAnK FinAnCinG oF SMeS in KenyA • 25
6.1 leGAl AnD reGulATory FrAMeWorK
While the legal and regulatory framework in Kenya has been updated through several legislative efforts such as the new Insolvency Bill and the Lands Act, many laws and processes in place are inadequate. In addition, and more importantly for SME finance, the judicial system still has many inefficiencies and the enforcement of secured credit is slow and costly. According to the ‘Insolvency and Creditor/Debtor Regimes Report on the Observance of Standards & Codes’ (ICR ROSC) undertaken by the World Bank in July 2012, the “commercial courts are relatively unskilled, greatly understaffed, beset with an ad hoc attitude and excessive exercises of judicial discretion, and not given the material support they need and deserve”. The Company Charges and Land Registries are equally regarded as inefficient and unreliable; only the Chattels Registry appears to have undergone improvements.
In line with the results of the ICR ROSC, the legal and regulatory framework was mentioned by 14 of 32 banks as a very significant obstacle and by an additional 14 banks as a significant obstacle to their exposure to SMEs. The legal and regulatory framework ranked third after the macroeconomic environment and SME-specific factors (see Section 3.3). When asked whether they face issues with registering and enforcing collateral, the majority of banks indicated that this was the case, unlike tax issues which appear to be much less of a concern (see Figure 14)27. Within the contractual environment, the issues most frequently mentioned by banks were difficulties with enforcing contracts, the high cost and lengthy process of perfecting security, and judicial inefficiency. Additional concerns were the lengthy process of registering security and uncertainty about the new Lands Act.
Figure 14: issues affecting SMe lending
Registering collateral
Enforcing collateral
Tax
0 105 30252015
825
22
24
11
9
No Yes
Source: Analysis of survey responses
In contrast to contract enforcement, prudential regulations and regulatory documentation requirements were generally perceived as adequate (Figure
27 While tax issues may not be of any major concern to the banks, they will inevitably be of concern to small enterprise borrowers who are hesitant to be formalised, to prepare audited financial statements, and to be registered with the tax authorities.
15). A few banks mentioned that they face challenges with documentation requirements for SMEs (KYC framework and AML regulations), yet these banks are often those with headquarters abroad, and which have to comply with the stricter requirements of their parent banks. Capital requirements were also mentioned, particularly by those banks that were not yet compliant with the revised minimum capital requirements and capital adequacy ratios (CAR) which came into effect in January 2013.28 Some banks were initially concerned that the higher CARs will render lending to SMEs less interesting, particularly as those loans are often unsecured and therefore have a higher risk weighting. Notwithstanding those concerns, the majority of banks appreciate the CBK’s need to safeguard stability and confidence in the financial system and did not expect any negative effects on their exposure to SMEs.29
Figure 15: effect of prudential regulations on involvement with SMes (number of banks)
Burden posed by regulatory document
Burden posed by regulatory document
0 105 30252015
Negative Inconsequential e Positive Source: Analysis of survey responses
Overall, banks are positive about the potential for Government to increase the appeal of SME lending through reform of the legal, regulatory, and judicial system (Figure 16). Among the reforms that would be beneficial for SME finance are inter alia clarifications regarding the Lands Act 2012, strengthening the real property and chattels registries, and creating a simplified movable assets security system.30
28 In 2008, CBK announced a phased increase in banks’ minimum capital requirements from KSh250 million to KSh1 billion at end 2012. In addition to this requirement, a capitalisation conservation buffer of an additional 2.5 per cent was introduced in January 2013. The capital conservation buffer needs to consist of high quality capital which should comprise mainly of common equity, premium reserves and retained earnings.
29 It remains to be seen how banks will react to the recently announced further hike in minimum capital from Ksh1 billion to Ksh5 billion by 2018. This may well lead to rationalisation among the smaller banks and impact the diversity of banking institutions that has hitherto characterised the Kenyan banking system.
30 See ICR ROSC, 2012 for details.
Chapter 6
EnaBling EnViRonMEnT
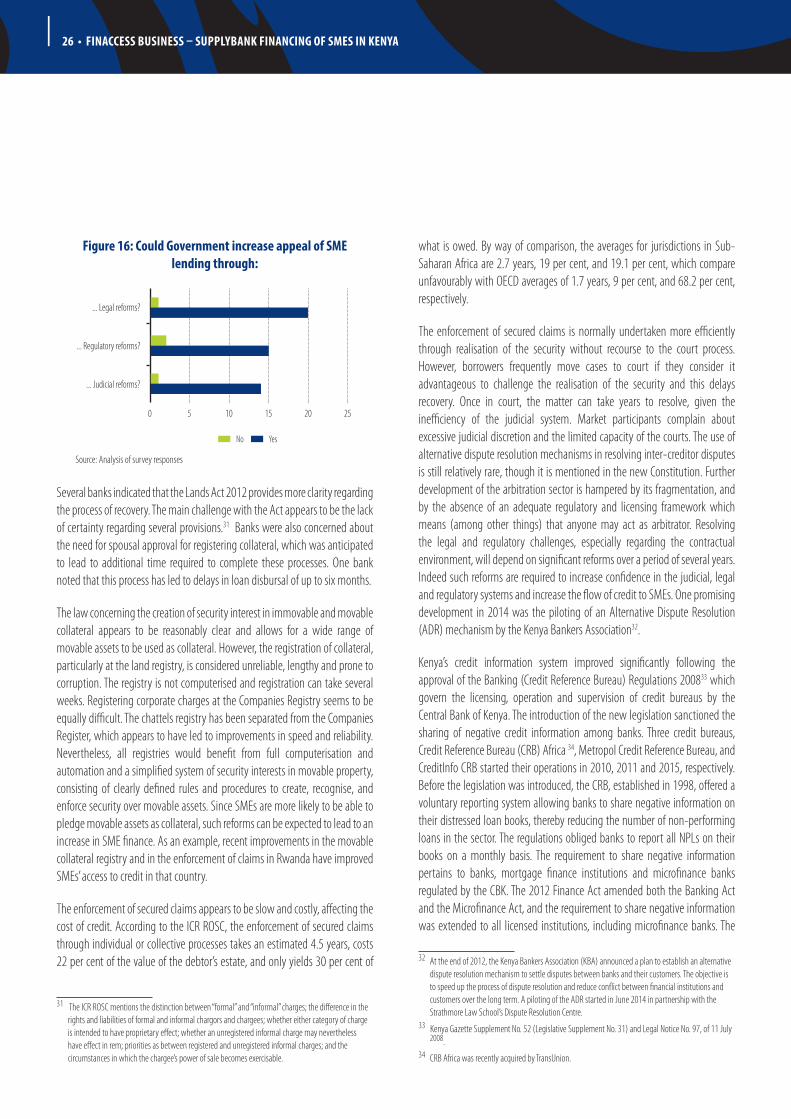
26 • FinAccess Business – supplyBAnk FinAncing oF sMes in kenyA
Figure 16: Could Government increase appeal of SMe lending through:
... Legal reforms?
... Regulatory reforms?
... Judicial reforms?
0 105 252015
No Yes
Source: Analysis of survey responses
Several banks indicated that the Lands Act 2012 provides more clarity regarding the process of recovery. The main challenge with the Act appears to be the lack of certainty regarding several provisions.31 Banks were also concerned about the need for spousal approval for registering collateral, which was anticipated to lead to additional time required to complete these processes. One bank noted that this process has led to delays in loan disbursal of up to six months.
The law concerning the creation of security interest in immovable and movable collateral appears to be reasonably clear and allows for a wide range of movable assets to be used as collateral. However, the registration of collateral, particularly at the land registry, is considered unreliable, lengthy and prone to corruption. The registry is not computerised and registration can take several weeks. Registering corporate charges at the Companies Registry seems to be equally difficult. The chattels registry has been separated from the Companies Register, which appears to have led to improvements in speed and reliability. Nevertheless, all registries would benefit from full computerisation and automation and a simplified system of security interests in movable property, consisting of clearly defined rules and procedures to create, recognise, and enforce security over movable assets. Since SMEs are more likely to be able to pledge movable assets as collateral, such reforms can be expected to lead to an increase in SME finance. As an example, recent improvements in the movable collateral registry and in the enforcement of claims in Rwanda have improved SMEs’ access to credit in that country.
The enforcement of secured claims appears to be slow and costly, affecting the cost of credit. According to the ICR ROSC, the enforcement of secured claims through individual or collective processes takes an estimated 4.5 years, costs 22 per cent of the value of the debtor’s estate, and only yields 30 per cent of
31 The ICR ROSC mentions the distinction between “formal” and “informal” charges; the difference in the rights and liabilities of formal and informal chargors and chargees; whether either category of charge is intended to have proprietary effect; whether an unregistered informal charge may nevertheless have effect in rem; priorities as between registered and unregistered informal charges; and the circumstances in which the chargee’s power of sale becomes exercisable.
what is owed. By way of comparison, the averages for jurisdictions in Sub-Saharan Africa are 2.7 years, 19 per cent, and 19.1 per cent, which compare unfavourably with OECD averages of 1.7 years, 9 per cent, and 68.2 per cent, respectively.
The enforcement of secured claims is normally undertaken more efficiently through realisation of the security without recourse to the court process. However, borrowers frequently move cases to court if they consider it advantageous to challenge the realisation of the security and this delays recovery. Once in court, the matter can take years to resolve, given the inefficiency of the judicial system. Market participants complain about excessive judicial discretion and the limited capacity of the courts. The use of alternative dispute resolution mechanisms in resolving inter-creditor disputes is still relatively rare, though it is mentioned in the new Constitution. Further development of the arbitration sector is hampered by its fragmentation, and by the absence of an adequate regulatory and licensing framework which means (among other things) that anyone may act as arbitrator. Resolving the legal and regulatory challenges, especially regarding the contractual environment, will depend on significant reforms over a period of several years. Indeed such reforms are required to increase confidence in the judicial, legal and regulatory systems and increase the flow of credit to SMEs. One promising development in 2014 was the piloting of an Alternative Dispute Resolution (ADR) mechanism by the Kenya Bankers Association32.
Kenya’s credit information system improved significantly following the approval of the Banking (Credit Reference Bureau) Regulations 200833 which govern the licensing, operation and supervision of credit bureaus by the Central Bank of Kenya. The introduction of the new legislation sanctioned the sharing of negative credit information among banks. Three credit bureaus, Credit Reference Bureau (CRB) Africa 34, Metropol Credit Reference Bureau, and CreditInfo CRB started their operations in 2010, 2011 and 2015, respectively. Before the legislation was introduced, the CRB, established in 1998, offered a voluntary reporting system allowing banks to share negative information on their distressed loan books, thereby reducing the number of non-performing loans in the sector. The regulations obliged banks to report all NPLs on their books on a monthly basis. The requirement to share negative information pertains to banks, mortgage finance institutions and microfinance banks regulated by the CBK. The 2012 Finance Act amended both the Banking Act and the Microfinance Act, and the requirement to share negative information was extended to all licensed institutions, including microfinance banks. The
32 At the end of 2012, the Kenya Bankers Association (KBA) announced a plan to establish an alternative dispute resolution mechanism to settle disputes between banks and their customers. The objective is to speed up the process of dispute resolution and reduce conflict between financial institutions and customers over the long term. A piloting of the ADR started in June 2014 in partnership with the Strathmore Law School’s Dispute Resolution Centre.
33 Kenya Gazette Supplement No. 52 (Legislative Supplement No. 31) and Legal Notice No. 97, of 11 July 2008.
34 CRB Africa was recently acquired by TransUnion.

FinACCeSS BuSineSS – SupplyBAnK FinAnCinG oF SMeS in KenyA • 27
Central Bank of Kenya Act has also been amended requiring commercial banks to share positive information on their customers through CRBs starting from March 2015. In order to improve the resolution of disputes in the context of Credit Information System (CIS), an Alternative Dispute Resolution mechanism was established by the Association of Kenya Credit Providers (AKCP).35
The majority of banks report that they use credit bureaus and find them effective (Figure 17). There has been a substantial increase in the number of providers who submit data to the credit bureaus and use it in their credit appraisal processes. As of 31 December 2014, a total of 5.2 million credit reports were requested by banks, compared with 2.3 million as of December 2012. Nevertheless, most banks also indicated that the Government could increase the appeal of lending to SMEs through increasing the scope of information assembled by the credit bureaus. The most prominent issue highlighted by the banks was to incorporate full information sharing from a variety of credit providers, including telcos and utility companies.
Figure 17: Credit bureau use and effectiveness
Use credit bureau?
Is crdit bureau effective (if used)?
Could government increase appeal of SMEs through bureau?
0 105 3525 302015
No Yes
Source: analysis of survey responses
The recent initiative by CBK and Treasury to revise the regulations to allow sharing of positive data is therefore a welcome development. This will allow the credit bureaus to develop credit scoring systems and allow good borrowers to establish a track record and access loans at more favourable interest rates. The regulations are also expected to mandate deposit-taking microfinance participation in the bank CIS database. A draft National Credit Information Sharing policy paper has been finalised and submitted to Government for approval and adoption.
These developments will mitigate the perception that the information collected by credit bureaus only takes the form of ‘blacklists’. Hitherto the availability of negative information alone has prevented the banks from using the information more extensively for risk management and scoring purposes that would enable the process of moving away from collateral-based lending. Initially, banks seemed concerned about losing a potential competitive
35 For more details, see AKCP (2015).
advantage when sharing positive information, but this obstacle appears to have been overcome as banks have come to realise that the perceived collective benefits far outweigh the risks.
Incorporating the information collected by MFIs and SACCOs as well as other providers is important to allow customers who do not, as yet, have access to banking products to establish a credit history and thereby facilitate their ‘graduation’ to provision of credit from banks. In particular, adding the information from the over 20 million registered mobile money/mobile financial services users would lead to a significant expansion of the underlying information base. In Rwanda, for instance, the CRB collects positive as well as negative data from all financial institutions as well as from some telecom and utility companies. One of the results of this far-reaching Rwandan initiative is that the coverage of the credit bureau is wider than in Kenya, even though the credit bureau only became operational in 2010. One problem with the inclusion of other providers is the quality and reliability of data which needs to be carefully assessed. A step-by-step inclusion of other providers therefore appears advisable.
6.2 GovernMenT AnD Donor involveMenT
While the Government sees its role in supporting SMEs primarily as a market-enabling role and has largely avoided direct intervention in the SMEs finance space, several donors are active in supporting banks in their involvement with SME financing through credit lines or partial credit guarantees, oftentimes coupled with technical assistance.
Through the CFRSD, the GoK has articulated SME finance as a clear priority for achieving Vision 2030. In 2010 Treasury established a special SME scheme, called the MSE Fund, but since 2012 no new loans have been approved by the fund. The fund was a credit line targeted at commercial banks interested in lending to SMEs with a total volume of KSh3.8 billion. The maximum loan amount was KSh5 million and lending was at commercial interest rates for predefined sectors. Banks were charged an interest rate of 6 per cent per year. The tenure of loans financed under the fund was for a maximum of five years, thereby allowing banks to lengthen loan contracts for SMEs. The credit line included a capacity building component (KSh50 million) for participating banks. Initially three banks participated in the scheme and loans were extended to the tune of KSh750 million. According to Treasury, the scheme was discontinued because “the intention was not for the Government to lend, but to create an incentive for banks to engage with SMEs”. After only a year of the fund’s operation, banks started to lend more to SMEs from their own books, especially Equity Bank, and therefore Treasury did not see any reason for the continued operation of the fund. In addition to the MSE fund, the Government set up a Youth Fund and a Women Entrepreneur Fund, in which a number of banks are participating. The Government is also contemplating a partial credit guarantee for agricultural loans.
While the Government has largely phased out the provision of direct support
28 • FinAccess Business – supplyBAnk FinAncing oF sMes in kenyA
to banks for lending to SMEs, several donors are active in this space. Of the donors, IFC has played an important role in providing credit lines to commercial banks for on-lending to SMEs. IFC set up the regional AMSME program to work with IFC clients in 2006 and this has been the main source of support to the banks for SME finance.36 Eight banks based in Kenya have benefited from IFC support either through the AMSME program or external investment vehicles such as private equity funds. The support provided by the IFC ranges from senior and subordinated loans, to equity, guarantees and advisory services. The objectives are to increase credit availability to MSMEs, enhance competition in the banking sector and expand credit availability across market segments. USAID is operating the largest credit guarantee scheme in Kenya, covering US$70 million, and ARIZ is a risk-sharing programme funded by AfD which guarantees 50 per cent of each loan in the portfolio. Other donors that are active in the SME finance space are EIB, Proparco, FMO, DEG, SIDA, AfDB, KfW, Norfund and the China Development Bank.
Nearly all of the banks interviewed received some form of donor support or were in discussions with donors for support directly related to financing of SMEs. In several cases there were banks with support from as many as four donors at a time. Interestingly, only 3 out of the 34 banks who responded to the questionnaire cited donor availability as a ‘very significant’ factor in their decision to lend to SMEs, and 9 out of 34 responded that it was ‘significant’. The CBM banks have the least involvement with donor financing, while the
36 As of June 2012, IFC provided financial support to the tune of US$125 million for 21 institutions across Africa.
SBM and MBM banks were quite heavily supported. The striking aspect about donor involvement in the SME finance space in Kenya is the sheer number of commitments in place. On the technical assistance side, donor interventions are mainly in the form of strategy work and training of bank staff on SME focused product development. IFC, FSD Kenya, FMO and AGF are just some of the donors that are involved in providing technical assistance for banks.
Overall, it is interesting to note that, while the Government is not heavily involved in directly supporting banks in developing SME financing, there are a large number of donor-led initiatives. Given that the market for SME finance is relatively vibrant and that this was the very reason for Treasury to discontinue its credit line, the question is what gap donors are filling. Availability of long-term funding is still relatively limited in Kenya and credit lines with a tenure of five years or even longer are therefore an important component of preventing maturity mismatches on banks’ balance sheets. Inevitably there is bound to be overlap in donor involvements. Donor coordination therefore becomes quite important for ensuring that the resources are allocated effectively, that allocated resources are market enabling, and that they do not create an uneven playing field among market players. The government could play a stronger role in keeping track of the various donor initiatives to encourage transparency and a sharing of best practices across initiatives. In addition, it would be worthwhile assessing whether banks are facing significant challenges in accessing longer term funding. Credit lines may not be the right vehicle to address this funding gap in the longer term while other efforts would potentially be more fruitful.
FinACCeSS BuSineSS – SupplyBAnK FinAnCinG oF SMeS in KenyA • 29
The financial sector in Kenya has expanded rapidly over the last decade and business financing has played an important role in the growth strategies of financial institutions. This study has explored the extent of banks’ involvement with SMEs, their main drivers and obstacles, and the role of government programmes and donors. It also provides recommendations based on the findings which are aimed towards the industry, policymakers and donors.
The involvement of Kenyan banks in the SME segment has grown between 2009 and 2013. The total SME lending portfolio in December 2013 was estimated at KSh332 billion, representing 23.4 per cent of the banks’ total loan portfolio. The SME portfolio grew fast in absolute values but also as percentages of total lending: in 2009 and 2011 the total SME portfolio was estimated to be KSh133 billion and KSh225 billion, respectively, and SME lending represented 19.5 per cent and 20.9 per cent of total lending, respectively. These figures show that in the context of general growth of the financial sector, SME financing represents a growing share of the commercial banks’ lending portfolios. Growth in the SME portfolio is increasingly being driven by domestic banks while the share of foreign banks decreased from 40 per cent of SME loans in 2009 to 27 per cent in 2013.
There is substantial diversity in the way banks approach the SME segment, both in the way they define SMEs and in terms of the banks’ business models. Although the GoK has proposed adoption of a unified definition of the SME segment in terms of turnover and number of employees, the banks’ still use definitions that differ significantly both in terms of the information that is being collected and the categorisation of SMEs. Within each category the banks’ interest in engaging in the SME sector is quite varied: there are both leaders devoted to innovation in SME financing and other banks for which SMEs are not a target client group. This illustrates the dynamism of the Kenyan market in that a ‘one-size-fits-all’ approach cannot be applied to the banks’ involvement in this fast-evolving segment of the market.
Banks’ strategies in the SME segment vary depending on their business model. The report identified three main types of business model: the corporate oriented business model (CBM), the supply-chain oriented business model (SBM), and the microenterprise-oriented business model (MBM). Although there is overlap between these categories, banks tend to differ in terms of lending technologies, customer acquisition strategies, and risk management mechanisms. MBMs are large, home-grown institutions with a historical involvement in the microfinance space. They tend to have extensive outreach networks due to their move from the mass retail/microfinance market into the SME space, and they have a large network of bank branches equipped with loan officers who are in a position to assess SME loans. Additionally, these institutions have embraced alternative outreach models such as agency banking and mobile banking as means of creating points of contact with hard-to-reach communities and as service delivery channels. SBMs instead tend to be mid-sized institutions that originally targeted specific clienteles or business
communities in the Kenyan economy and have now expanded to reach a wider customer base. These banks typically use a combination of specialised supply-chain finance products, such as invoice discounting and LPO financing, and specialised asset finance products, such as hire purchase. Finally, CBMs tend to be foreign-owned multinational banks focusing on the higher end of the SME market. Their institutional structures allow them to draw upon sophisticated credit-scoring tools, but limit their ability to innovate due to long chains of command, often headquartered abroad.
Despite the positive developments over the last few years, the cost of credit for SMEs remains high and there is still considerable room for product innovation in the SME finance space. The large majority of SME loans are overdrafts. While overdrafts can be useful in financing working capital when businesses need fast access to liquidity, they expose SMEs to interest rate and liquidity risks, particularly if overdrafts are used to finance longer term investments. Agricultural SME lending remains very limited as well, representing a small percentage of the total portfolio, even though the sector is the backbone of the Kenyan economy.
The high cost of credit is attributable to a number of factors including the limited use of positive information sharing about borrowers in the market37, inefficiencies in the collateral registration process, the cost of the judicial process, and high overhead costs. The recent move towards positive information sharing by banks should go some way towards addressing these problems, but positive information sharing from all credit providers, including payment service providers and utilities companies, among others, would add important value to the information already present in the credit bureaus and should be prioritised going forward, provided that data quality can be ensured.
Innovation in the SME financing space could also be driven by the development of factoring and financial leasing. It is to be anticipated that the introduction of such products would lower transaction as well as borrowing costs for SMEs and reduce reliance on collateral by drawing on more diverse sources of security. The main constraint to financial leasing appears to be the ambiguous treatment of leasing in the Hire Purchase Act and Income Tax Act as well as the application of VAT. Potential constraints to the development of factoring, such as the recourse mechanism and the impact of stamp duties, need to be explored with a view to enabling a local market for factoring. In addition, it would be useful to study in more detail the potential and feasibility of implementing an electronic reverse factoring scheme similar to the one operated by Nafin in Mexico or a factoring scheme as used in Paraguay or Peru. Such shared platforms could lower transaction and borrowing costs further still and introduce more competition into this market segment while also increasing transparency.
Donors are heavily involved in supporting banks in expanding their SME
37 Full file information sharing came into effect in 2015.
Chapter 7
conclUSionS anD REcoMMEnDaTionS

30 • FinAccess Business – supplyBAnk FinAncing oF sMes in kenyA
lending business. Inevitably there is overlap among the support mechanisms and incentives provided by donors. Donor coordination therefore becomes important in ensuring that resources are allocated effectively – that they are market enabling and do not displace resources made available by the private sector – and that they do not create an uneven playing field. The government could play a stronger role in keeping track of the various donor initiatives to encourage transparency and a sharing of best practices across initiatives.
Improving the knowledge of the SME sector can encourage banks to innovate more actively and take decisions more effectively. It is therefore important to reach consensus on the definition of SMEs and thereby facilitate periodic reporting of data on the size of the SME market. One way of streamlining definitions across public institutions and industry players would be for banks to collect information on the Single Business Permit (SBP). The SBP is a license administered by county governments and renewed on an annual basis. It allocates a code to businesses depending on their sector, turnover and number
of employees. A large proportion of businesses in Kenya have SBPs, including SMEs and microenterprises. Although SBPs do not indicate the exact size of businesses or the businesses’ ISIC codes, they hold relevant information about the size range and specific subsectors in which the firms operate. Furthermore, banks should be able to collect this information at negligible cost, as the validity of the data is checked by county authorities and updated on a yearly basis. If banks collect this information consistently, comparable information about their customer base would be made available, and policymakers would more easily be able to identify segments of the economy that are served, or underserved, by the Kenyan financial sector. Other recommendations include expanding the scope of the coverage of the credit information system to allow more non-bank, utility or telco providers to participate in the mechanism. The digitisation of the movable collateral registry would improve the efficiency of the financial sector by lowering the cost of credit and facilitating formal financial inclusion of small and medium enterprises.
Table 13: Summary of policy recommendations
policy recommendations Description
1. Harmonise definition of SMEs
� A harmonised definition of what constitutes an SME would facilitate the analysis of the development of SME finance over time. One possibility is to use the classification used in the Single Business Permit (SBP) administered by the county governments and renewed on an annual basis. Banks could collect this data at almost no cost.
2. Increase the frequency of data collection and dissemination
� It is recommended that a survey of the supply of SME finance – focused on essential data points – is conducted on an annual basis to generate reliable information on the SME market that can be tracked over time and inform policy. Triangulation with data from the credit reference bureaus could prove powerful as well.
3. Generate and maintain a list of active business establishments
� Kenya does not have a centralised database of active business establishments and therefore it lacks basic information on the size and characteristics of the local business population. This makes it very difficult to conduct representative enterprise-level surveys even in the formal sector and to understand the key financial constraints to access to finance. A national level list could be generated by aggregating information collected on licensed enterprises at county level.
4. Increase the scope of credit information sharing
� To facilitate the graduation of SME clients from smaller to larger providers of credit (as their businesses grow) positive information sharing should be expanded to all credit providers, including payment service providers, utilities companies, microfinance institutions, and savings and credit cooperatives, among others, provided that data quality can be ensured.
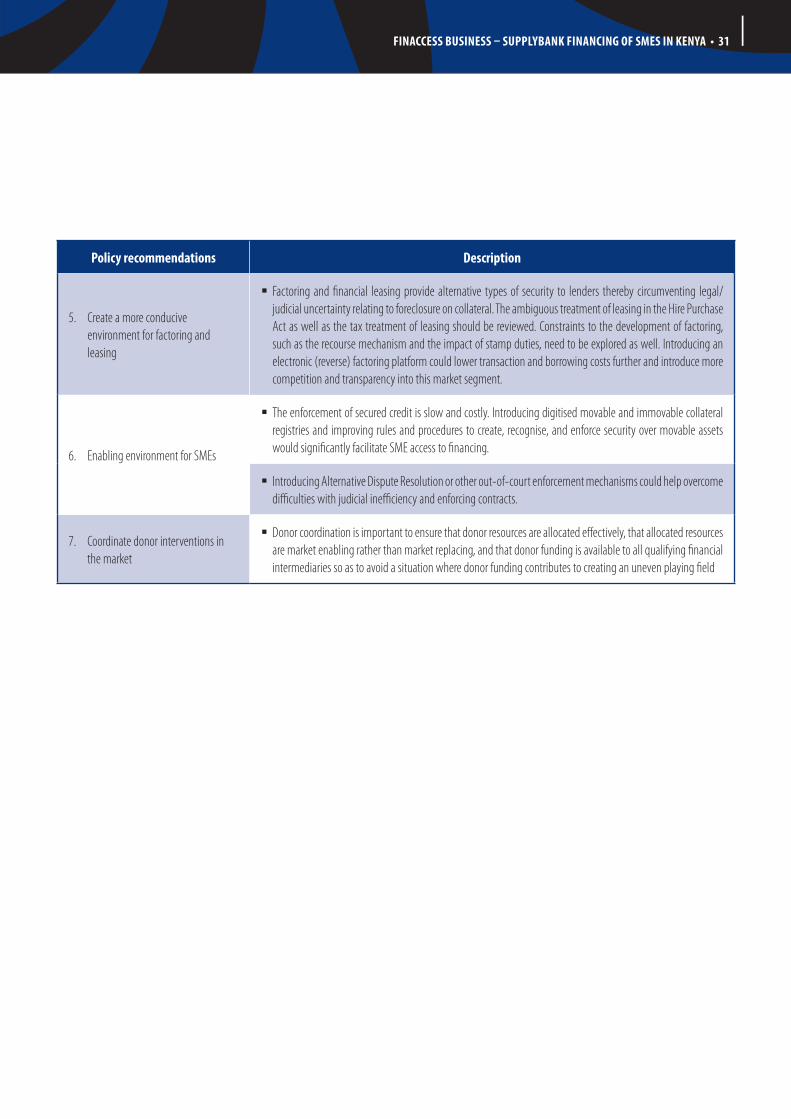
FinACCeSS BuSineSS – SupplyBAnK FinAnCinG oF SMeS in KenyA • 31
policy recommendations Description
5. Create a more conducive environment for factoring and leasing
� Factoring and financial leasing provide alternative types of security to lenders thereby circumventing legal/judicial uncertainty relating to foreclosure on collateral. The ambiguous treatment of leasing in the Hire Purchase Act as well as the tax treatment of leasing should be reviewed. Constraints to the development of factoring, such as the recourse mechanism and the impact of stamp duties, need to be explored as well. Introducing an electronic (reverse) factoring platform could lower transaction and borrowing costs further and introduce more competition and transparency into this market segment.
6. Enabling environment for SMEs
� The enforcement of secured credit is slow and costly. Introducing digitised movable and immovable collateral registries and improving rules and procedures to create, recognise, and enforce security over movable assets would significantly facilitate SME access to financing.
� Introducing Alternative Dispute Resolution or other out-of-court enforcement mechanisms could help overcome difficulties with judicial inefficiency and enforcing contracts.
7. Coordinate donor interventions in the market
� Donor coordination is important to ensure that donor resources are allocated effectively, that allocated resources are market enabling rather than market replacing, and that donor funding is available to all qualifying financial intermediaries so as to avoid a situation where donor funding contributes to creating an uneven playing field

32 • FinAccess Business – supplyBAnk FinAncing oF sMes in kenyA
Association of Kenya Credit Providers (2015) Credit Information Sharing. ADR Handbook
Aziz, T.A. and Berg, G. (2012) Financing of Small and Medium-Sized Enterprises in Rwanda. World Bank, Washington DC.
Ayyagari, M., Beck, T. & Demigurc-Kunt, A. (2007) Small and Medium Enterprises across the Globe. Small Business Economics, 29(4): 415–34.
Beck, T. & Demigurc-Kunt, A. (2006) Small and Medium Enterprises: Access to Finance as a Growth Constraint. Journal of Banking and Finance, 30: 2931–43.
Beck, T., Cull, R., Fuchs, M., Getenga, J., Gatere, P., Randa, J., et al. (2010) Banking Sector Stability, Efficiency and Outreach in Kenya. The World Bank.
Beck, T., Demigurc-Kunt, A., Laeven, L. & Maksimovic, V. (2006) The Determinants of Financing Obstacles. Journal of International Money and Finance, 25: 932–52.
Berg, G. and Fuchs, M.J. (2013) Bank Financing of SMEs in Five Sub-Saharan African Countries: The Role of Competition, Innovation, and the Government (August 1, 2013). World Bank Policy Research Working Paper No. 6563. Available at: <http://ssrn.com/abstract=2307809>
Berg, G., Fuchs, M., Iacovone, L., Jaeggi, T., Lovegrove A. & Villegas Sanchez, C. (2012) Financing Small- and Medium- Enterprises in Nigeria, World Bank, Washington DC.
Berger, A.N. & Udell, G.F. (2004, October 14-15). Presentation Prepared for World Bank Conference on "Small and Medium Enterprises: Overcoming Growth Constraints". Available at: <http://siteresources.worldbank.org/INTFR/Resources/475459-1107891190953/661910-1108584820141/Financing_Framework_berger_udell.pdf>
Capital Markets Authority. (2015) Quarterly Statistical Bulletin. Quarter ended in March 2015.
Castillo-Triana, R. (2010) Reveiw of Environment for Lease Financing in Kenya. The Project Implementation Unit, Ministry of Finance, Republic of Kenya.
Central Bank of Kenya (CBK). (2014) Bank Supervision Annual Report 2013, Nairobi.
Central Bank of Kenya (CBK). (2015) Bank Supervision Annual Report 2014, Nairobi.
Central Bureau of Statistics, K-Rep Development Agency, & International Centre for Economic Growth. (1999) A National Survey of Small and Micro Enterprises in Kenya. Nairobi.
De la Torre, A., Martinez Peria, M.S. and Schmukler, S. (2010) “Bank Involvement with SMEs: Beyond Relationship Lending.” Journal of Banking and Finance 34: 2280–93.
Deloitte, & Africa Assets. (2014) 2013 East Africa Private Equity Confidence Survey. Clarity and Distinction.
FSD Kenya. (2009) Costs of Collateral in Kenya: Opportunities for Reform.
FSD Kenya. (2009) FinAccess National Survey 2009: Dynamics of Kenya's Changing Financial Landscape.
FSD Kenya. (2012) Kenya Credit Information Sharing Initiative. A Progress Report 2008–11: Challenges and Opportunities. February 2012, Nairobi.
Fuchs, M., Iacovone, L., Jaeggi, T., Napier, M., Pearson, R., Pellegrini, G. et al. (2011) Financing Small and Medium Enterprises in the Republic of South Africa. Washington, DC: World Bank.
Hermes, N., Lensink, R. and Meesters, A. (2011) “Outreach and Efficiency of Microfinance Institutions.” World Development 39 (6): 938–48.
ICR ROSC. (2012) Report on the Observance of Standards & Codes – Kenya. Insolvency and Creditor/Debtor Regimes . The World Bank, Washington DC.
Insurance Regulatory Authority (IRA). (2012) Annual Report of the Insurance Regulatory Authority For the year ended 31 December 2011, Nairobi, Kenya.
Kenya National Bureau of Statistics. (2012) Economic Survey.
Kenya National Bureau of Statistics. (2015) Information on the Revised National Accounts.
Kenya Treasury. (2011) Kenya: A comprehensive financial sector reform and development strategy.
Klapper L. (2005) The Role of Factoring for Financing Small and Medium Enterprises. World Bank Policy Research Working Paper 3593, May 2005. Washington DC.
SASRA. (2012) Sacco Supervision Annual Report 2012, Nairobi, Kenya.
Upadhyaya, R. (2011) “Analyzing the Sources and Impact of Segmentation in the Banking Sector: A Case Study of Kenya.” SOAS, University of London. Available at: <http://core.kmi.open.ac.uk/download/pdf/9427178.pdf>.
World Bank. (2015) Kenya Economic Update : Anchoring High Growth – Can Manufacturing Contribute More? 94697. The World Bank. Available at: <http://documents.worldbank.org/curated/en/2014/12/24193201/kenya-economic-update-anchoring-high-growth-can-manufacturing-contribute-more>.
REFEREncES

FinACCeSS BuSineSS – SupplyBAnK FinAnCinG oF SMeS in KenyA • 33

[email protected] • www.fsdkenya.org FSD Kenya is an independent Trust established to support the development of inclusive financial markets in Kenya 5th floor, KMA Centre • Junction of Chyulu Road and Mara Road, Upper Hill • PO Box 11353, 00100 Nairobi, Kenya T +254 (20) 2923000 • C +254 (724) 319706, (735) 319706
FsD kenyaFinancial Sector Deepening