filling in the gaps in administrative data: lessons from the ticket to work evaluation
DESCRIPTION
Filling in the Gaps in Administrative Data: Lessons from the Ticket to Work Evaluation. Paul O’Leary U.S. Social Security Administration October 2006. Evaluation objectives. Address evaluation questions specified in the legislation Determine the basic impacts of the ticket program: - PowerPoint PPT PresentationTRANSCRIPT

Filling in the Gaps in Filling in the Gaps in Administrative Data: Administrative Data:
Lessons from the Lessons from the
Ticket to Work EvaluationTicket to Work Evaluation
Paul O’LearyPaul O’LearyU.S. Social Security AdministrationU.S. Social Security Administration
October 2006October 2006

Evaluation objectivesEvaluation objectives
Address evaluation questions specified in the legislationAddress evaluation questions specified in the legislation
Determine the basic impacts of the ticket program:Determine the basic impacts of the ticket program:– Return-to-work service participationReturn-to-work service participation– Work and earningsWork and earnings– SSA program benefitsSSA program benefits– Broader social impactsBroader social impacts
Determine how aspects of the ticket program affect Determine how aspects of the ticket program affect program successprogram success

The Evaluation Data ProcessThe Evaluation Data Process
Identify specific evaluation questionsIdentify specific evaluation questions
– Model the Ticket to Work processModel the Ticket to Work process
Assess existing data resources Assess existing data resources
Prioritize data needs Prioritize data needs
Develop resources to fill data gapsDevelop resources to fill data gaps

Data gapsData gaps
Service providers:Service providers:– Descriptive informationDescriptive information– General Awareness/perceptionsGeneral Awareness/perceptions– Program mechanics Program mechanics – SatisfactionSatisfaction
Beneficiaries:Beneficiaries:– Descriptive information (esp. disability)Descriptive information (esp. disability)– General Awareness/perceptionsGeneral Awareness/perceptions– Attitudes toward workAttitudes toward work– Work outcomes Work outcomes – SatisfactionSatisfaction
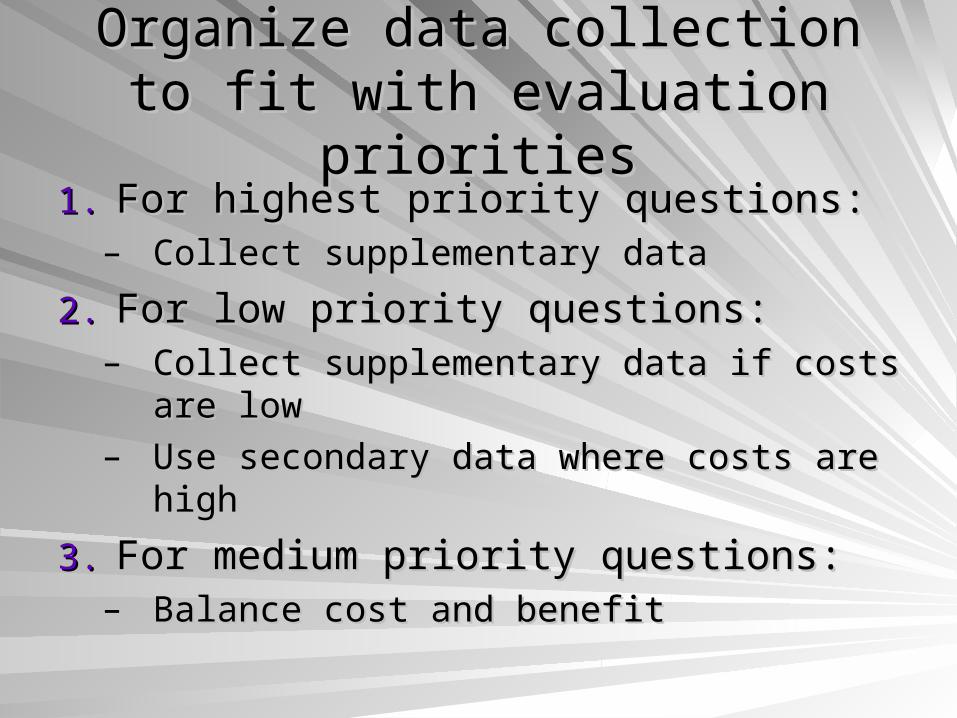
Organize data collection to fit with Organize data collection to fit with evaluation prioritiesevaluation priorities
1.1. For highest priority questions:For highest priority questions:– Collect supplementary dataCollect supplementary data
2.2. For low priority questions: For low priority questions: – Collect supplementary data if costs are lowCollect supplementary data if costs are low
– Use secondary data where costs are highUse secondary data where costs are high
3.3. For medium priority questions:For medium priority questions:– Balance cost and benefitBalance cost and benefit

Data resourcesData resources
The four components of the data:The four components of the data:
– Administrative data Administrative data
The Ticket Research File—TRFThe Ticket Research File—TRF
– Process dataProcess data
Qualitative interviews with employment service providers, Qualitative interviews with employment service providers,
SSA, MAXIMUS/CESSI, and othersSSA, MAXIMUS/CESSI, and others
– Survey dataSurvey data
The National Beneficiary Survey—NBSThe National Beneficiary Survey—NBS
– Secondary dataSecondary data

Current evaluation resultsCurrent evaluation results
Characteristics affecting Characteristics affecting participationparticipation
(from the multivariate analysis of SSA data)(from the multivariate analysis of SSA data)

Ticket participation declines Ticket participation declines steadily with agesteadily with age
-0.79
-1.11
-1.33
-1.57
-1.89
-2.28
-2.56-2.73
Reference
-3
-2.5
-2
-1.5
-1
-0.5
0
18-24 25-29 30-34 35-39 40-44 45-49 50-54 55-59 60-64
Age Group
Per
cen
t
Source: January 2005 extract of SSA Disability Control File

Ticket assignments rise steadily Ticket assignments rise steadily with months since ticket mailingwith months since ticket mailing
0.17
0.35
0.54
0.77
0.94
1.12
1.36
Reference0
0.2
0.4
0.6
0.8
1
1.2
1.4
1.6
0-3 4-6 7-9 10-12 13-15 16-18 19-24 24+
Months Since Ticket Mailed
Pe
rce
nt
Source: January 2005 extract of SSA Disability Control File

Beneficiaries with higher levels of Beneficiaries with higher levels of education participate at higher rates.education participate at higher rates.
0.03
0.42
0.85 0.87
Reference0
0.1
0.2
0.3
0.4
0.5
0.6
0.7
0.8
0.9
1
0-8 9-11 12 13-15 16+
Per
cen
t
Source: January 2005 extract of SSA Disability Control File
Years of School

While some small groups are much more While some small groups are much more likely to participate, variation among large likely to participate, variation among large
groups is only modestgroups is only modest
1.55
4.74
0.95 0.8
0.27 0.27 0.36 0.510.68
Reference0
1
2
3
4
5
6
Speechimpairment
Hearingimpairment
Visualimpairment
Injuries Mentalretardation
Circulatorysystem
Musculo-skeletalsystem
Other mentaldisorders
Nervoussystem
Psychoses, neuroses, affective disorders
Per
cen
t
Groups with high participation rates
Larger Disability Diagnosis Groups
Primary Impairment
Source: January 2005 extract of SSA Disability Control File

Early results from the Early results from the National Beneficiary Survey National Beneficiary Survey
(NBS) (NBS)

Age at Onset of Limiting Health Age at Onset of Limiting Health ConditionsConditions
21.7
9.9
24.1
31.6
9.6
36.8
16.3
26.5
16
1.4
44.2
11.1
20.6
14.1
5.6
0
5
10
15
20
25
30
35
40
45
50
<18 18 - 24 25 - 39 40 - 54 55 +
Source: 2004 National Beneficiary Survey (NBS)
Per
cent
All TTW Participants Employed at Interview

Health StatusHealth Status
9.9%
47.0%42.9%
23.4%
58.9%
17.5%
27.8%
55.1%
16.9%
0.0%
10.0%
20.0%
30.0%
40.0%
50.0%
60.0%
70.0%
Excellent or Very Good Good/Fair Poor or Very Poor
Source: 2004 National Beneficiary Survey (NBS)
Per
cent
All TTW Participants Employed at Interview

Current Health Compared with Current Health Compared with Last YearLast Year
16.0%
42.8%40.6%
31.9%
44.7%
22.7%25.4%
53.1%
21.0%
0.0%
10.0%
20.0%
30.0%
40.0%
50.0%
60.0%
Much or Somewhat better About the same Much or Somewhat worse
Source: 2004 National Beneficiary Survey (NBS)
Per
cent
All TTW Participants Employed at Interview

Number of ADL/IADL DifficultiesNumber of ADL/IADL Difficulties
27.5%
17.1%
51.2%
15.9%
11.2%
7.8%
6.8%
44.6%
17.1%
15.2%
11.6%
17.4%
12.9%
11.4%
5.4%
0.0% 10.0% 20.0% 30.0% 40.0% 50.0% 60.0%
0
1
2
3
4+
Source: National Beneficiary Survey
All TTW Participants Employed at Interview

Income and Program ParticipationIncome and Program Participation
23%
4%9%
0%3% 0%
5%8%2%3%
1%2%2%
31%
6%
31%
1%1%1%2%3%
95%
9% 5%
0%
10%
20%
30%
40%
50%
60%
70%
80%
90%
100%
FoodStamps
Public assistance
Earnings Pensions Private disability
insurance
Veteran's benefits
Workers' comp.
Unempl.insurance
Source: 2004 National Beneficiary Survey (NBS)
Pe
rce
nt
All TTW Participants Employed at Interview

Reason(s) for 2003 Service Use Reason(s) for 2003 Service Use Among UsersAmong Users
26%
10%6%
2% 1%
10%
1%
36%
21%27%
6%
42%
10%4%
75%
40%
6%3%
8%
54%
24%
47%
0%5%
4%
25%
58%
0%
10%
20%
30%
40%
50%
60%
70%
80%
Improve health
Improve daily
function
Find a (better)
job
Get a specific service
Outside pressure
to participate
Increaseincome
Avoid a continuing disability review
Other Services/supports needed in 2003 but
not received
Source: 2004 National Beneficiary Survey (NBS)
Per
cent
All Beneficiaries (18-64) TTW Participants Employed at Interview

28%
18%
6% 4%
28% 30% 27%
18%
35%
19%
50%
42%
11%
96%
13%
76%
54%
30%
8%
37%
23%27%
0%
10%
20%
30%
40%
50%
60%
70%
80%
90%
100%
Condition prevents
w ork
Not qualif ied for jobs found
No reliable
transpor-tation
Caring for others
No desirable
jobs found
Finishing school/ training
Workplaces not
accessible
Wants to keep
benefits
Discouragedby
previous attempts
Others do not think
I can w ork
Employers w ill not give me a chance
Source: 2004 National Beneficiary Survey (NBS) All Beneficiaries (18-64) TTW Participants
Reasons for Not WorkingReasons for Not Working

Work HistoryWork History
87%
13%9%
93%
48%
32%
100%
88%
100%
0%
20%
40%
60%
80%
100%
120%
Ever Work for Pay Worked in 2003 Employed at Interview
Source: 2004 National Beneficiary Survey (NBS)
Per
cent
All Beneficiaries (18-64) TTW Participants Employed at Interview

Employment ExpectationsEmployment Expectations
30%
20%26%
7%15%
81%
70%
80%
28%
53%57%
86%
71%
19%25%
0%
10%
20%
30%
40%
50%60%
70%
80%
90%
100%
Goals includework/career
advancement
Expects to work for pay in the Next Year
Expects to work for pay in 5 Years
Expects to earnenough
to stop disabilitybenefits
in the Next Year
Expects to earnenough
to stop disabilitybenefits
in 5 Years
Source: 2004 National Beneficiary Survey (NBS)
Per
cent
All Beneficiaries (18-64) TTW Participants Beneficiaries Employed at Interview
