€¦ · xls file · web view · 2016-11-15all cpm estimates are internal omd estimates, ......
TRANSCRIPT
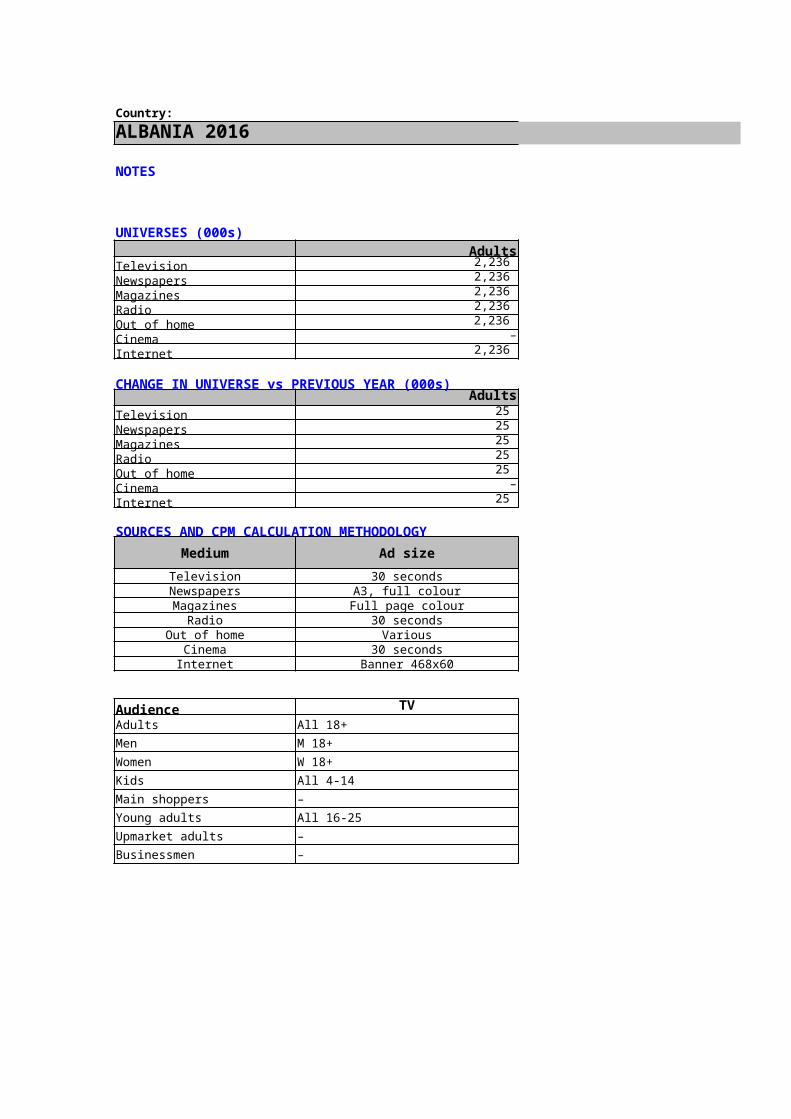
Country:ALBANIA 2016
NOTES
UNIVERSES (000s)Adults Men
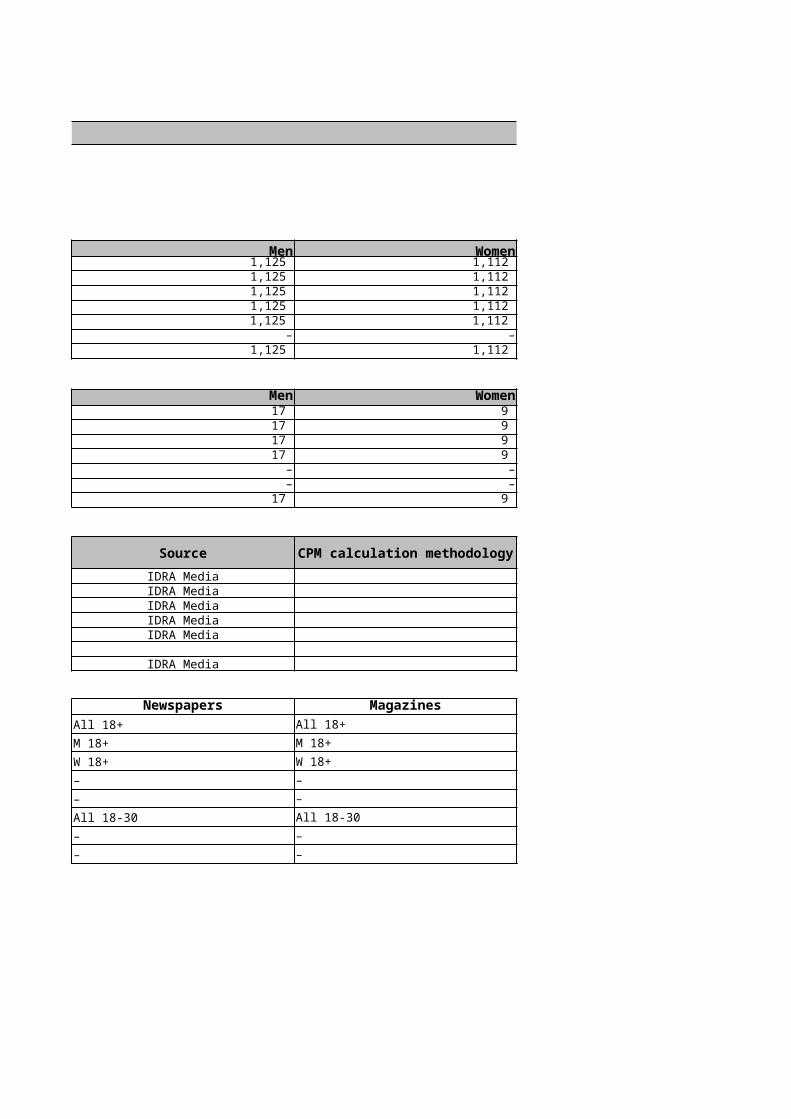
Television 2,236 1,125 Newspapers 2,236 1,125 Magazines 2,236 1,125 Radio 2,236 1,125 Out of home 2,236 1,125 Cinema – –Internet 2,236 1,125
CHANGE IN UNIVERSE vs PREVIOUS YEAR (000s)Adults Men
Television 25 17 Newspapers 25 17 Magazines 25 17 Radio 25 17 Out of home 25 –Cinema – –Internet 25 17
SOURCES AND CPM CALCULATION METHODOLOGYMedium Ad size SourceTelevision 30 seconds IDRA Media
Newspapers A3, full colour IDRA MediaMagazines Full page colour IDRA Media
Radio 30 seconds IDRA MediaOut of home Various IDRA Media
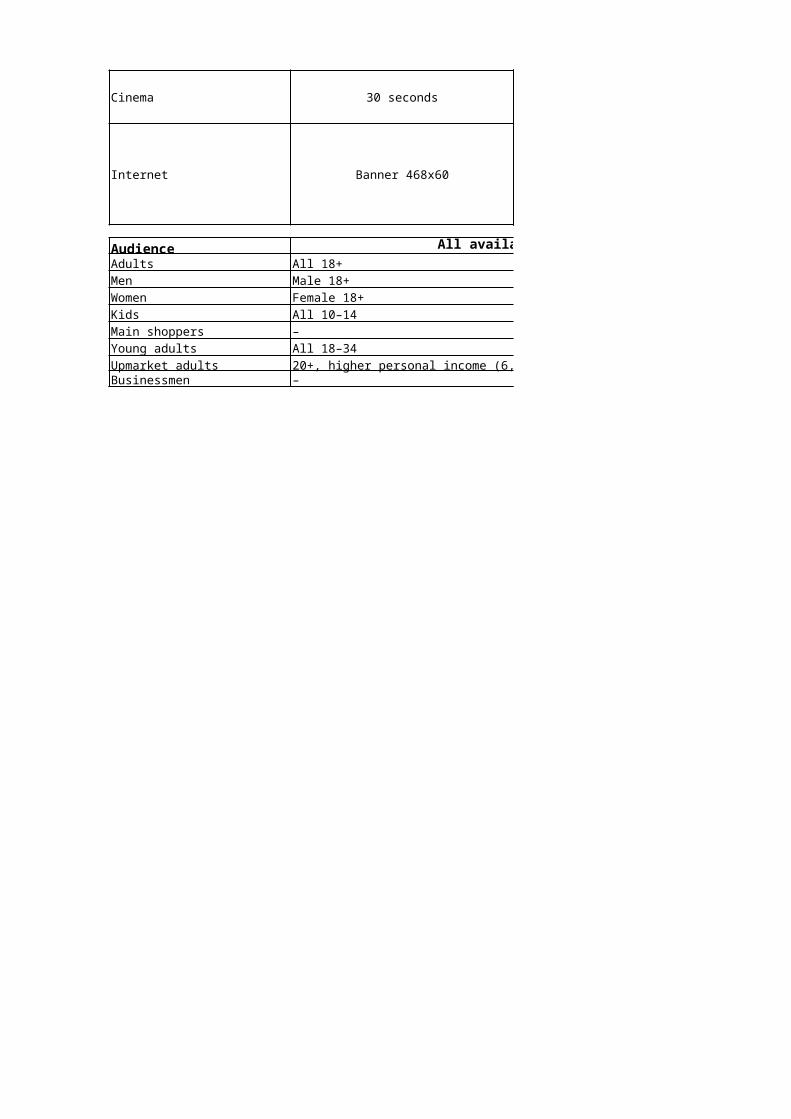
Cinema 30 secondsInternet Banner 468x60 IDRA Media
Audience TV NewspapersAdults All 18+ All 18+Men M 18+ M 18+Women W 18+ W 18+Kids All 4-14 –Main shoppers – –Young adults All 16-25 All 18-30Upmarket adults – –Businessmen – –
ALBANIA 2016
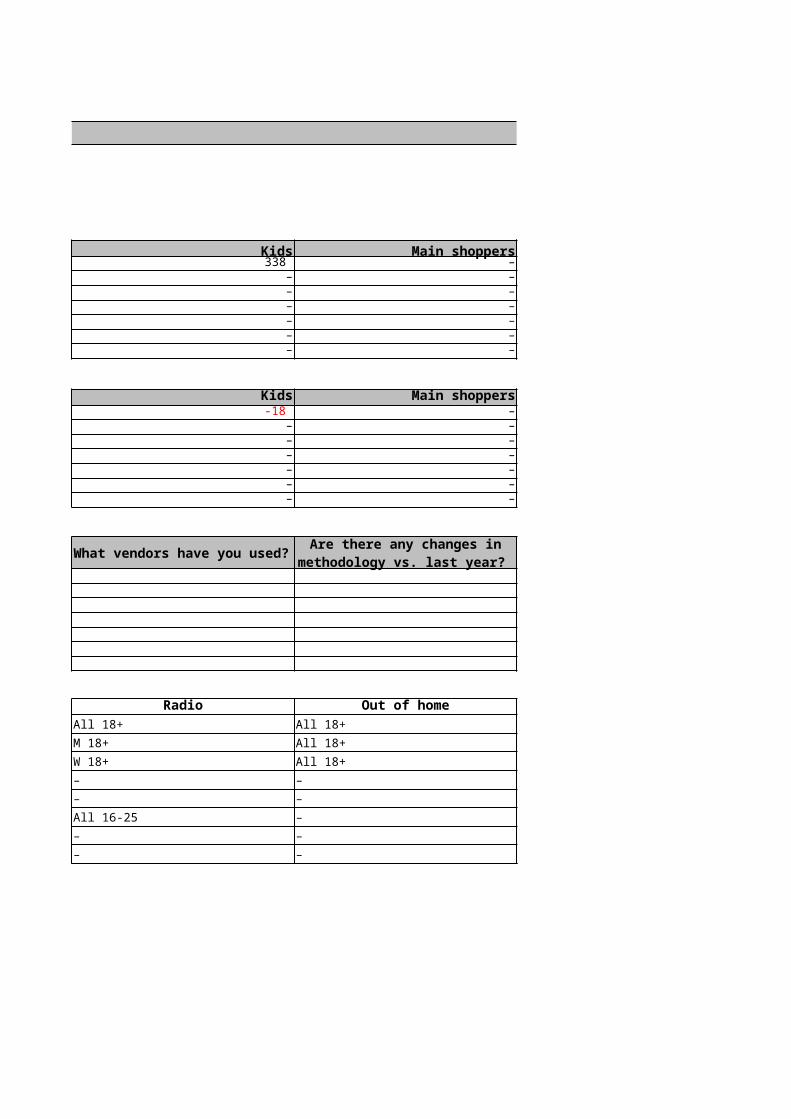
Women Kids Main shoppers 1,112 338 – 1,112 – – 1,112 – – 1,112 – –
1,112 – –– – –
1,112 – –
Women Kids Main shoppers9 -18 –9 – –9 – –9 – –– – –– – –9 – –
Magazines Radio Out of homeAll 18+ All 18+ All 18+M 18+ M 18+ All 18+W 18+ W 18+ All 18+– – –– – –All 18-30 All 16-25 –– – –– – –
CPM calculation methodology
What vendors have you used?
Are there any changes in methodology vs. last year?
ALBANIA 2016
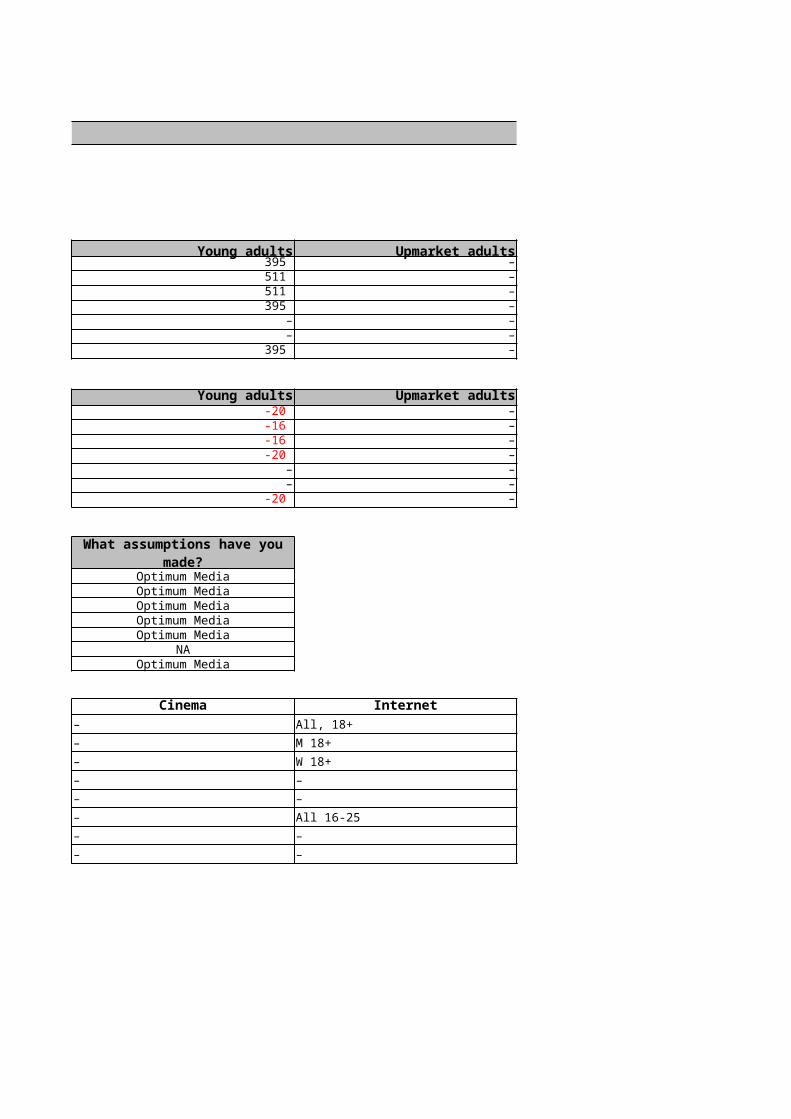
Young adults Upmarket adults Businessmen 395 – – 511 – – 511 – – 395 – –
– – –– – –
395 – –
Young adults Upmarket adults Businessmen-20 – –-16 – –-16 – –-20 – –
– – –– – –
-20 – –
Optimum MediaOptimum MediaOptimum MediaOptimum MediaOptimum Media
NAOptimum Media
Cinema Internet– All, 18+– M 18+– W 18+– –– –– All 16-25– –– –
What assumptions have you made?
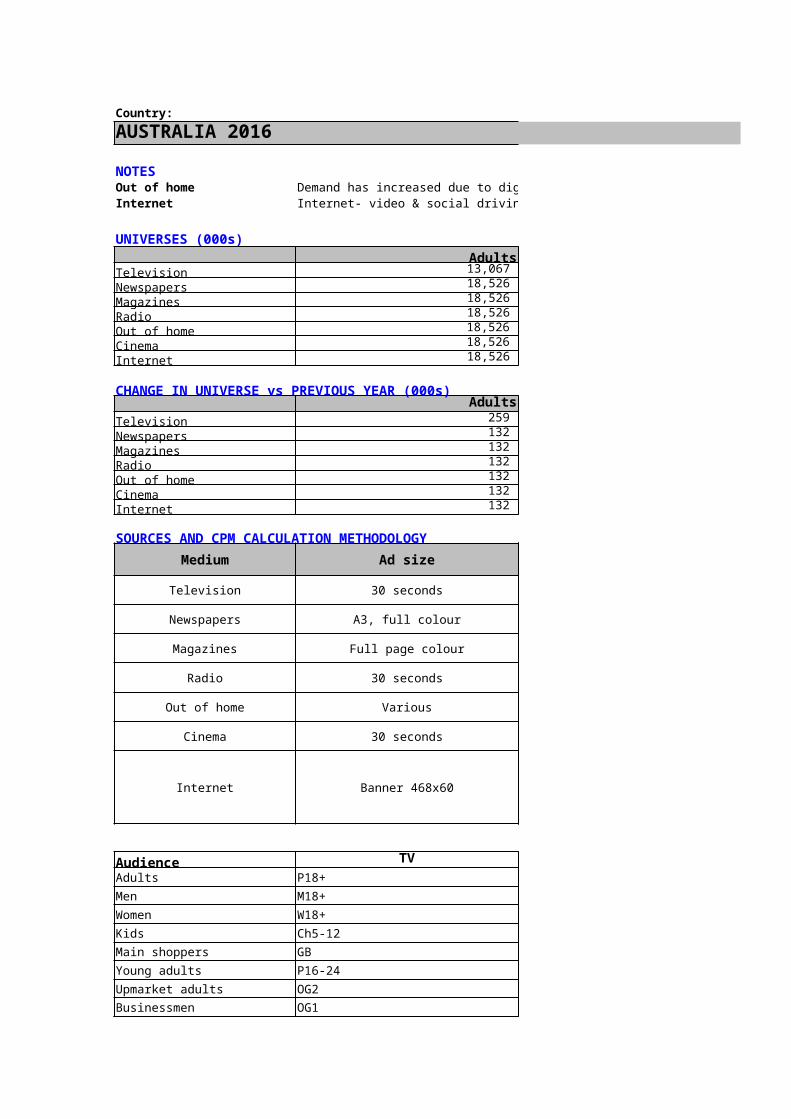
Country:AUSTRALIA 2016
NOTESOut of home Demand has increased due to digitisation of the medium, more premium inventory available.Internet Internet- video & social driving demand. Limited inventory in Australia.
UNIVERSES (000s)Adults Men
Television 13,067 6,409 Newspapers 18,526 9,105 Magazines 18,526 9,105 Radio 18,526 9,105 Out of home 18,526 9,105 Cinema 18,526 9,105 Internet 18,526 9,105
CHANGE IN UNIVERSE vs PREVIOUS YEAR (000s)Adults Men
Television 259 123 Newspapers 132 55 Magazines 132 55 Radio 132 55 Out of home 132 55 Cinema 132 55 Internet 132 55
SOURCES AND CPM CALCULATION METHODOLOGYMedium Ad size Source
Television 30 seconds Oztam
Newspapers A3, full colour Roy Morgan
Magazines Full page colour Roy Morgan
Radio 30 seconds Nielsen
Out of home Various MOVE
Cinema 30 seconds Cinema attendance Audience data
Internet Banner 468x60 Nielsen
Audience TV NewspapersAdults P18+ P18+Men M18+ M18+Women W18+ W18+Kids Ch5-12 Not SurveyedMain shoppers GB GBYoung adults P16-24 P16-24Upmarket adults OG2 P18+HH Income 100k +Businessmen OG1 P18+Professional

AUSTRALIA 2016
Demand has increased due to digitisation of the medium, more premium inventory available.Internet- video & social driving demand. Limited inventory in Australia.
Women Kids Main shoppers 6,658 1,632 6,360 9,420 865 12,911 9,420 865 12,911 9,420 865 12,911
9,420 865 12,911 9,420 865 12,911
9,420 865 12,911
Women Kids Main shoppers137 36 121
77 -43 -142 77 -43 -142 77 -43 -142 77 -43 -142 77 -43 -142 77 -43 -142
No based on 2015 plus inflation
No based on 2015 plus inflation
No based on 2015 plus inflation
No based on 2015 plus inflation
No based on 2015 plus inflation
No based on 2015 plus inflation
No based on 2015 plus inflation
Magazines Radio Out of homeP18+ P18+ P18+M18+ M18+ M18+W18+ W18+ W18+Not Surveyed Not Surveyed Not SurveyedGB GB GBP16-24 P16-24 P16-24P18+HH Income 100k + P18+HH Income 100k + P18+HH Income 100k +P18+Professional P18+Professional P18+Professional
CPM calculation methodology
What vendors have you used?
Are there any changes in methodology vs. last year?
Ave Peak Rate /Ave Peak Audience (1/1/13 - 8/9/13
consolidated data)
Total Metro 5 cap City- 7/9/10 Network (incl digital channels)
Ave Metro Full Page rates/Readership figures
Ave Full Page rates/Readership figures
Ave Metro Rates/Nielsen Radio Audience data
Ave Metro Rates/Move Audience data
Ave Cinema Rate/Cinema attendance Audience data
Nielsen Market Intelligence/Online Consumer report/SMI market
spend figures/Ceasa/IAB PWC expenditure estimates/market
knowledge
AUSTRALIA 2016
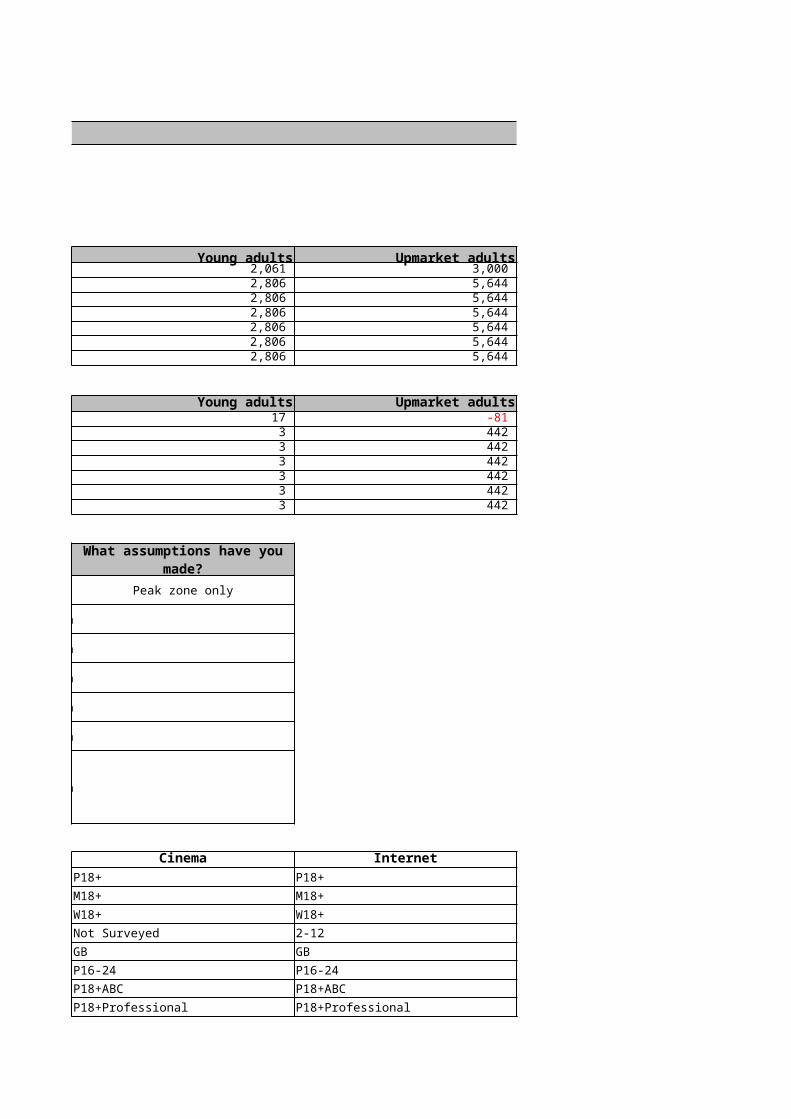
Young adults Upmarket adults Businessmen 2,061 3,000 3,081 2,806 5,644 3,490 2,806 5,644 3,490 2,806 5,644 3,490
2,806 5,644 3,490 2,806 5,644 3,490
2,806 5,644 3,490
Young adults Upmarket adults Businessmen17 -81 -20 3 442 300 3 442 300 3 442 300 3 442 300 3 442 300 3 442 300
Peak zone only
Cinema InternetP18+ P18+M18+ M18+W18+ W18+Not Surveyed 2-12GB GBP16-24 P16-24P18+ABC P18+ABCP18+Professional P18+Professional
What assumptions have you made?

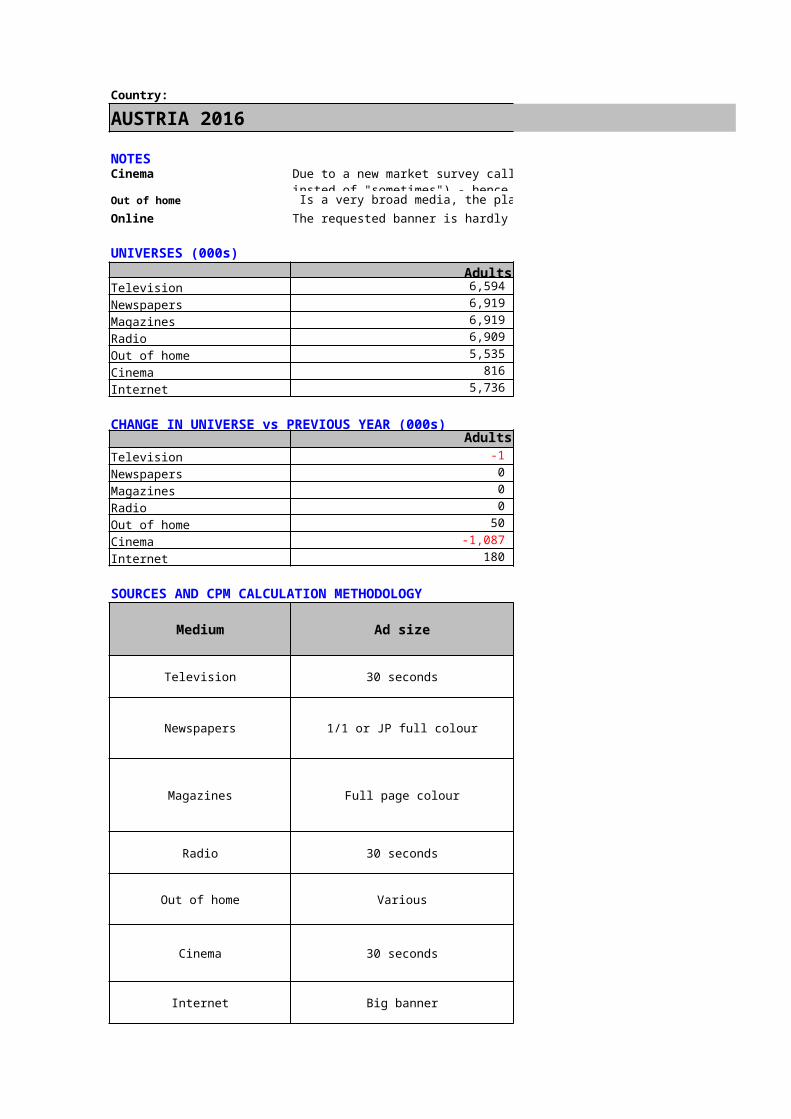
Country:
AUSTRIA 2016
NOTESCinema
Out of home Is a very broad media, the planning tools are not made for special target groups, so the gap for specific target groups are bigger than in total population. Online The requested banner is hardly booked so the CPT for this size is not relevant. Client switch to other formats e.g. HalfpageAd - the CPM for Halfpage. Deflation of Online due to start of programmatic era.
UNIVERSES (000s)Adults Men
Television 6,594 3,198 Newspapers 6,919 3,350 Magazines 6,919 3,350 Radio 6,909 3,347 Out of home 5,535 2,680 Cinema 816 416 Internet 5,736 2,890
CHANGE IN UNIVERSE vs PREVIOUS YEAR (000s)Adults Men
Television -1 -1 Newspapers 0 0 Magazines 0 0 Radio 0 0 Out of home 50 20 Cinema -1,087 -452 Internet 180 59
SOURCES AND CPM CALCULATION METHODOLOGY
Medium Ad size Source
Television 30 seconds
Newspapers 1/1 or JP full colour MA 2015Price 2016
Magazines Full page colour MA 2015Price 2016
Radio 30 seconds Radiotest 2015/ _Price 2016
Out of home Various OSA Q1/2016
Cinema 30 seconds CineMA
Internet Big banner OMD estimation
Due to a new market survey called Media-Server the universe changed from a "scale based universe" to an "frequency universe" (at least once a month insted of "sometimes") - hence the huge drop in audience size
Teletest 2016 / Forecast MW Prgn. 2.2

Audience Out of home RadioAdults All 14+ All 18+Men Male 14+ Male 18+Women Female 14+ Female 18+Kids All 3–11 All 3–11Main shoppers 14–49 14-49 y, E/B1-3aYoung adults All 18–39 18-29 yearsUpmarket adults Upper education group 18+ E/B1-2
Businessmen Working malesM E/B1-3a, working
AUSTRIA 2016
Is a very broad media, the planning tools are not made for special target groups, so the gap for specific target groups are bigger than in total population. The requested banner is hardly booked so the CPT for this size is not relevant. Client switch to other formats e.g. HalfpageAd - the CPM for Halfpage. Deflation of Online due to start of programmatic era.
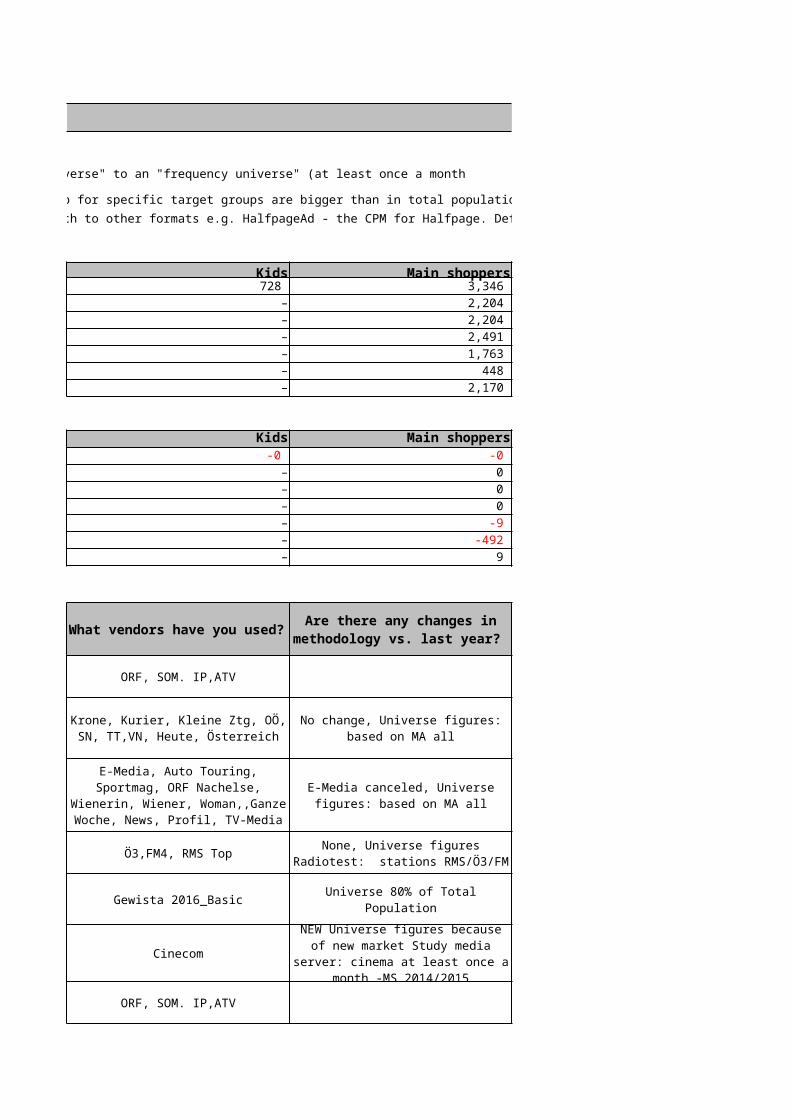
Women Kids Main shoppers 3,395 728 3,346 3,569 – 2,204 3,569 – 2,204 3,562 – 2,491 2,855 – 1,763 400 – 448 2,846 – 2,170
Women Kids Main shoppers-1 -0 -0 0 – 0 0 – 0 0 – 0
30 – -9 -635 – -492 121 – 9
30'' CPT ORF, SOM. IP,ATV
1/1 4c
1/1 4c
30'' CPT Ö3,FM4, RMS Top
Gewista 2016_Basic Universe 80% of Total Population
Cinecom
Banner 468x60 ORF, SOM. IP,ATV
Due to a new market survey called Media-Server the universe changed from a "scale based universe" to an "frequency universe" (at least once a month insted of "sometimes")
CPM calculation methodology
What vendors have you used?
Are there any changes in methodology vs. last year?
Krone, Kurier, Kleine Ztg, OÖ, SN, TT,VN, Heute, Österreich
No change, Universe figures: based on MA all
E-Media, Auto Touring, Sportmag, ORF Nachelse, Wienerin, Wiener,
Woman,,Ganze Woche, News, Profil, TV-Media
E-Media canceled, Universe figures: based on MA all
None, Universe figures Radiotest: stations RMS/Ö3/FM
24 Bogen/80.000 conatcts in total/März/14 days/Bevölkerung
30''/Indx 100/National Channel /Price 2016
NEW Universe figures because of new market Study media server:
cinema at least once a month -MS 2014/2015

All other mediaAll 18+Male 18+Female 18+All 3–1114–49, ABC1All 18–2918+, ABMale ABC1 – working at executive level or above
AUSTRIA 2016
The requested banner is hardly booked so the CPT for this size is not relevant. Client switch to other formats e.g. HalfpageAd - the CPM for Halfpage. Deflation of Online due to start of programmatic era.
Young adults Upmarket adults Businessmen 1,224 3,334 1,715 1,272 2,033 1,244 1,272 2,033 1,244 1,261 2,982 1,481 1,018 1,626 995 348 311 195 1,251 1,912 1,206
Young adults Upmarket adults Businessmen-0 -1 -0 0 0 0 0 0 0 0 0 0
10 8 -22 -311 -346 -219
14 22 -20
What assumptions have you made?
GFK had a scandal but we do not know how this affects Radiotest
data

Country:
BOSNIA & HERZEGOVINA 2016
NOTES
UNIVERSES (000s)Adults Men
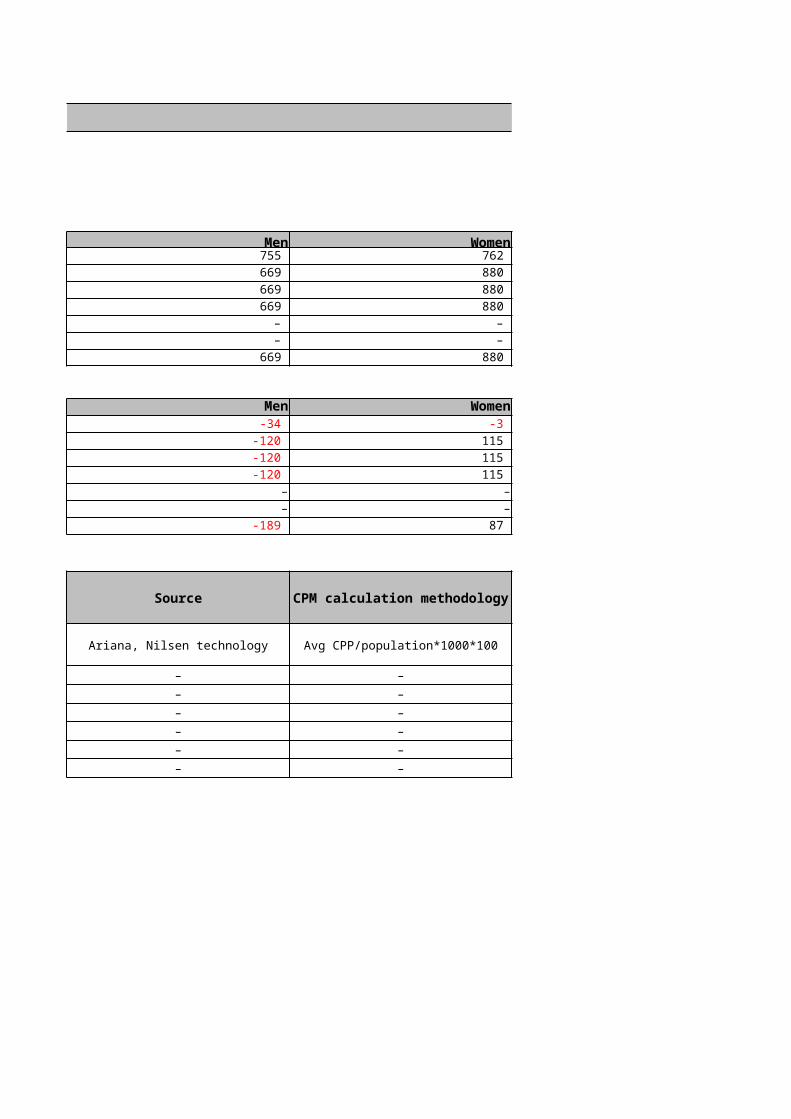
Television 2,638 755 Newspapers 2,405 669 Magazines 2,405 669 Radio 2,405 669 Out of home – – Cinema – – Internet 2,405 669
CHANGE IN UNIVERSE vs PREVIOUS YEAR (000s)Adults Men
Television -20 -34 Newspapers -253 -120 Magazines -253 -120 Radio -253 -120 Out of home – –Cinema – –Internet 868 -189
SOURCES AND CPM CALCULATION METHODOLOGY
Medium Ad size Source
Television 30 seconds Ariana, Nilsen technology
Newspapers A3, full colour –Magazines Full page colour –
Radio 30 seconds –Out of home Various –
Cinema 30 seconds –Internet Banner 468x60 –
Audience All mediaAdults All 20+Men M 18-49Women W 18-49Kids All 4-14Main shoppers All 25-55Young adults All 16-22Upmarket adults All 25-45
Businessmen M 30-49

BOSNIA & HERZEGOVINA 2016
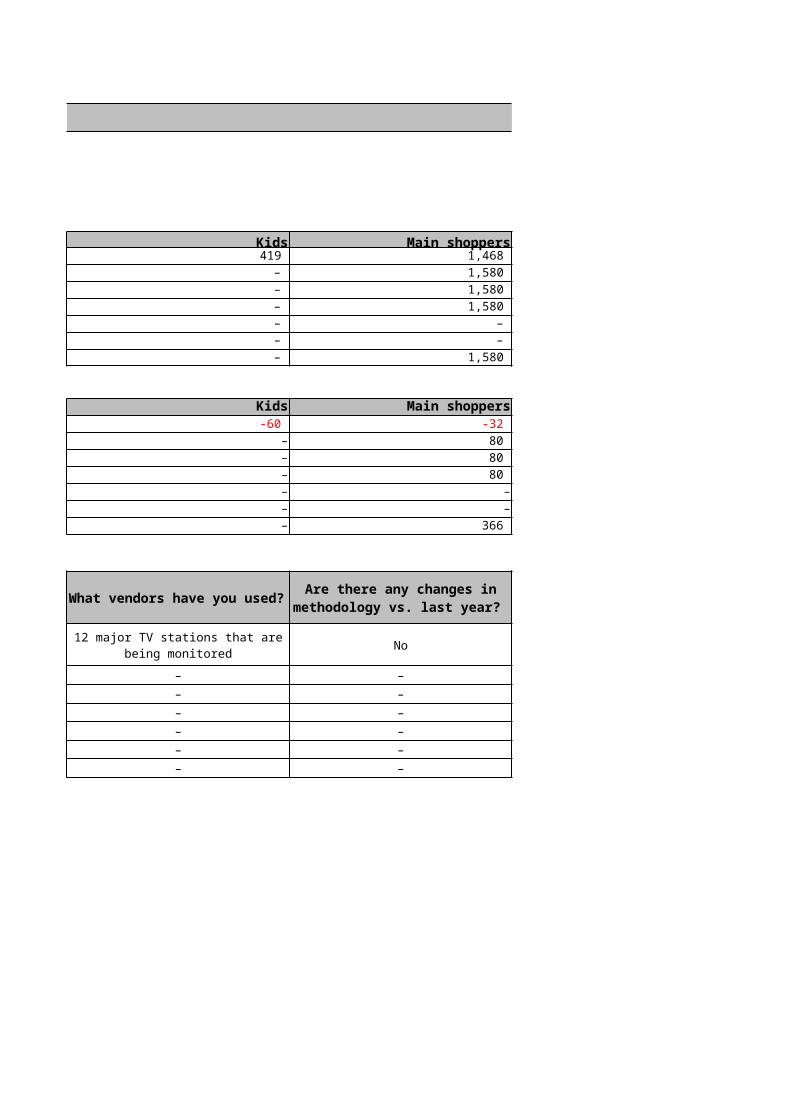
Women Kids Main shoppers 762 419 1,468 880 – 1,580 880 – 1,580 880 – 1,580
– – – – – –
880 – 1,580
Women Kids Main shoppers-3 -60 -32
115 – 80 115 – 80 115 – 80
– – –– – –
87 – 366
Avg CPP/population*1000*100 No
– – –– – –– – –– – –– – –– – –
CPM calculation methodology
What vendors have you used?
Are there any changes in methodology vs. last year?
12 major TV stations that are being monitored

BOSNIA & HERZEGOVINA 2016
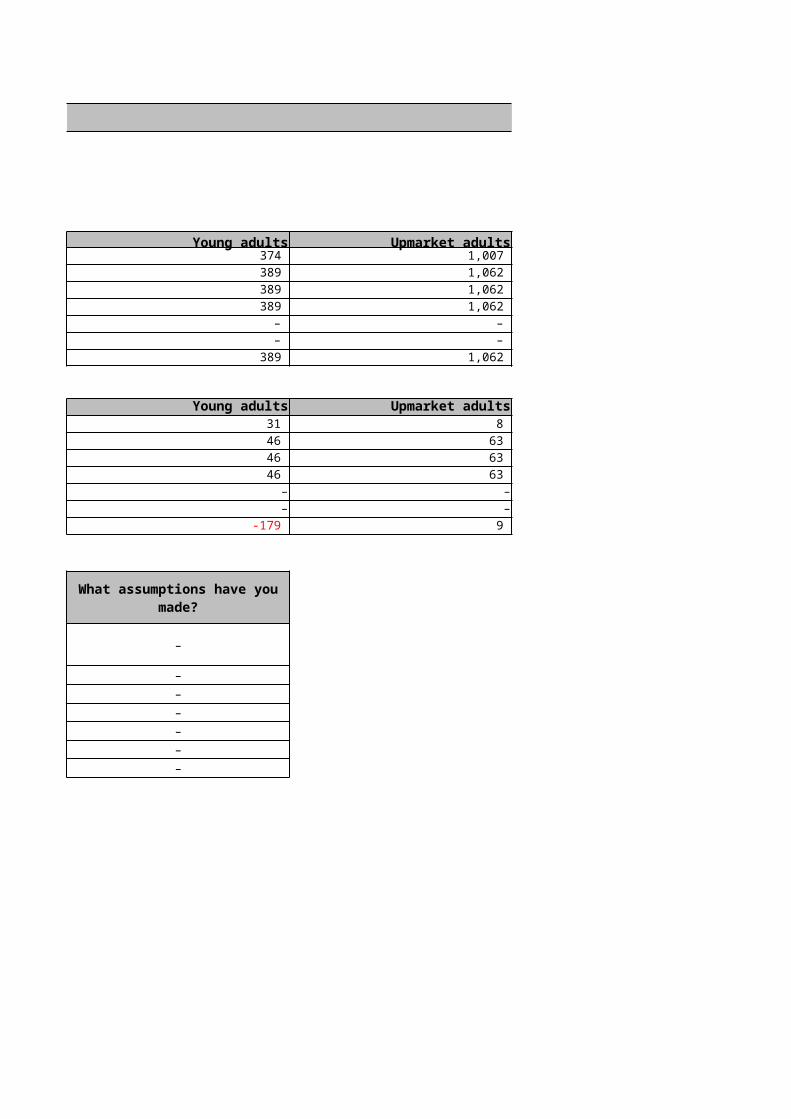
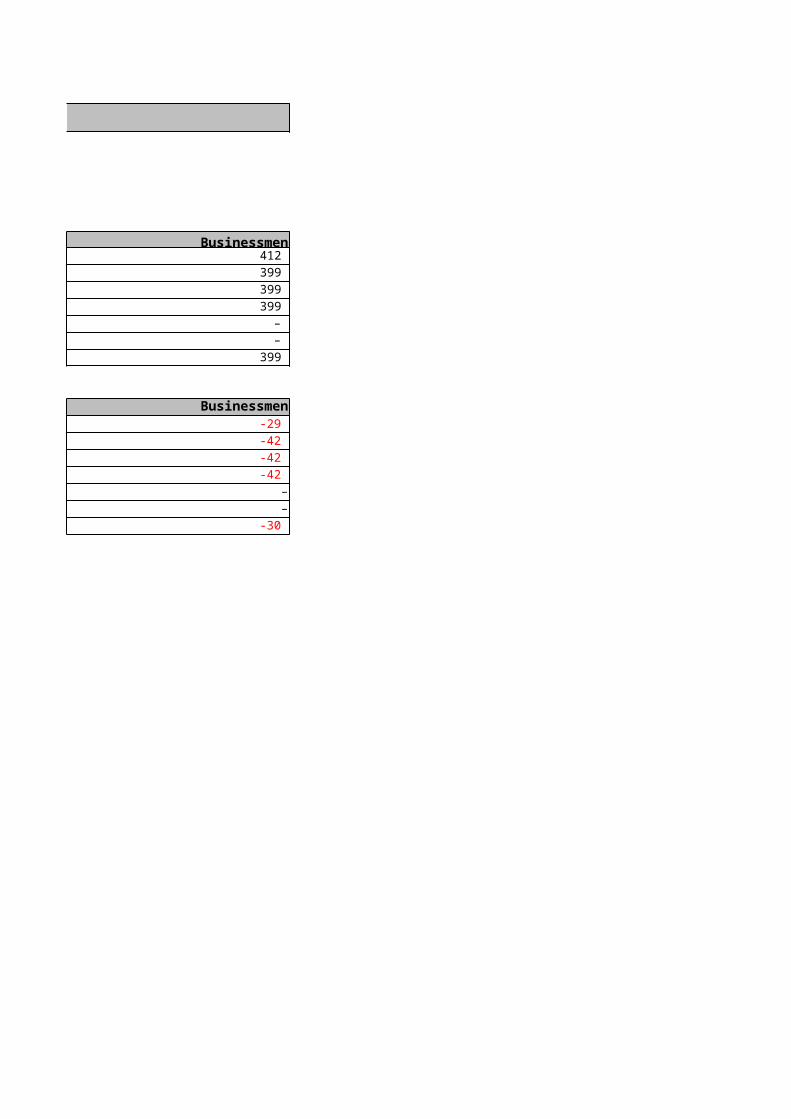
Young adults Upmarket adults Businessmen 374 1,007 412 389 1,062 399 389 1,062 399 389 1,062 399
– – – – – –
389 1,062 399
Young adults Upmarket adults Businessmen31 8 -29 46 63 -42 46 63 -42 46 63 -42
– – –– – –
-179 9 -30
–
––––––
What assumptions have you made?
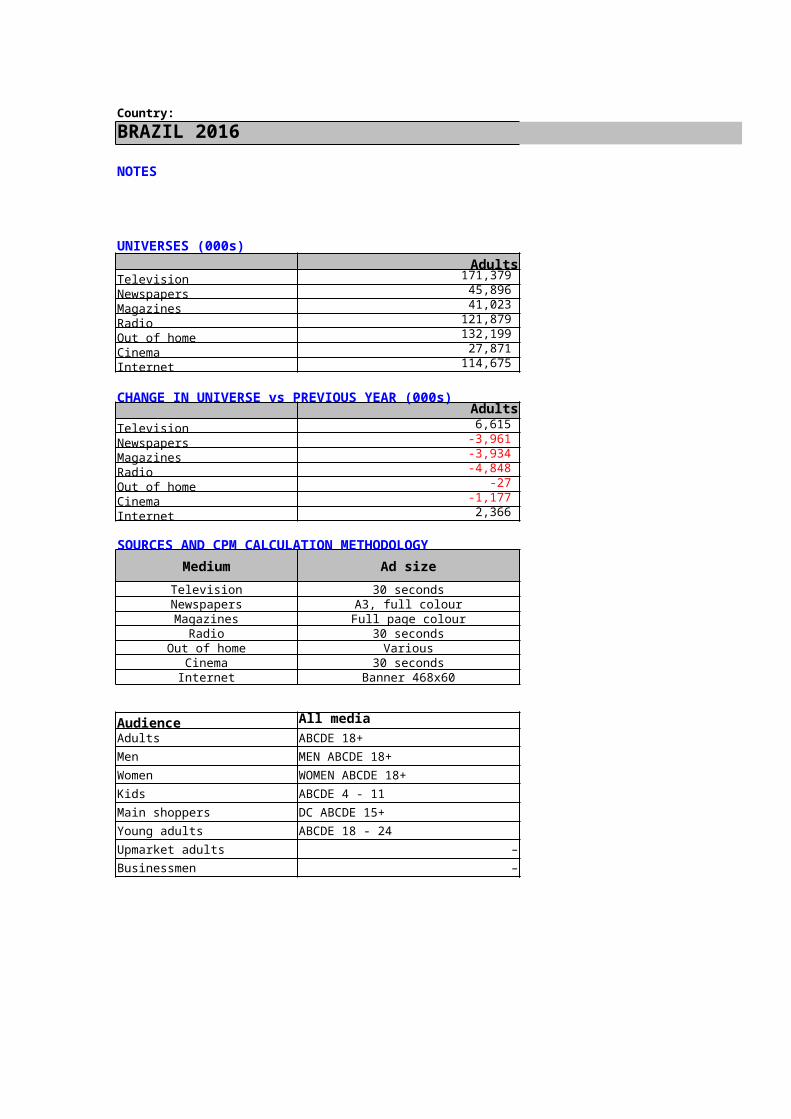
Country:BRAZIL 2016
NOTES
UNIVERSES (000s)Adults Men
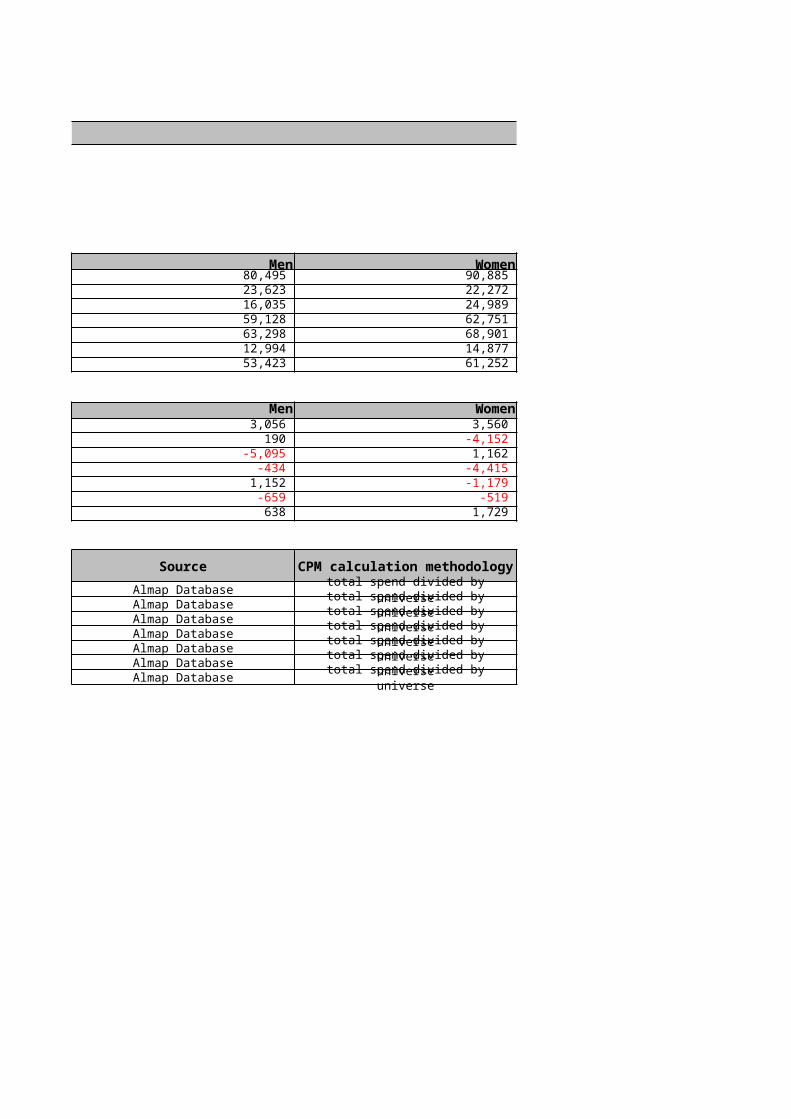
Television 171,379 80,495 Newspapers 45,896 23,623 Magazines 41,023 16,035 Radio 121,879 59,128 Out of home 132,199 63,298 Cinema 27,871 12,994 Internet 114,675 53,423
CHANGE IN UNIVERSE vs PREVIOUS YEAR (000s)Adults Men
Television 6,615 3,056 Newspapers -3,961 190 Magazines -3,934 -5,095 Radio -4,848 -434 Out of home -27 1,152 Cinema -1,177 -659 Internet 2,366 638
SOURCES AND CPM CALCULATION METHODOLOGYMedium Ad size SourceTelevision 30 seconds Almap Database
Newspapers A3, full colour Almap DatabaseMagazines Full page colour Almap Database
Radio 30 seconds Almap DatabaseOut of home Various Almap Database
Cinema 30 seconds Almap DatabaseInternet Banner 468x60 Almap Database
Audience All mediaAdults ABCDE 18+Men MEN ABCDE 18+Women WOMEN ABCDE 18+Kids ABCDE 4 - 11Main shoppers DC ABCDE 15+Young adults ABCDE 18 - 24Upmarket adults –Businessmen –

BRAZIL 2016
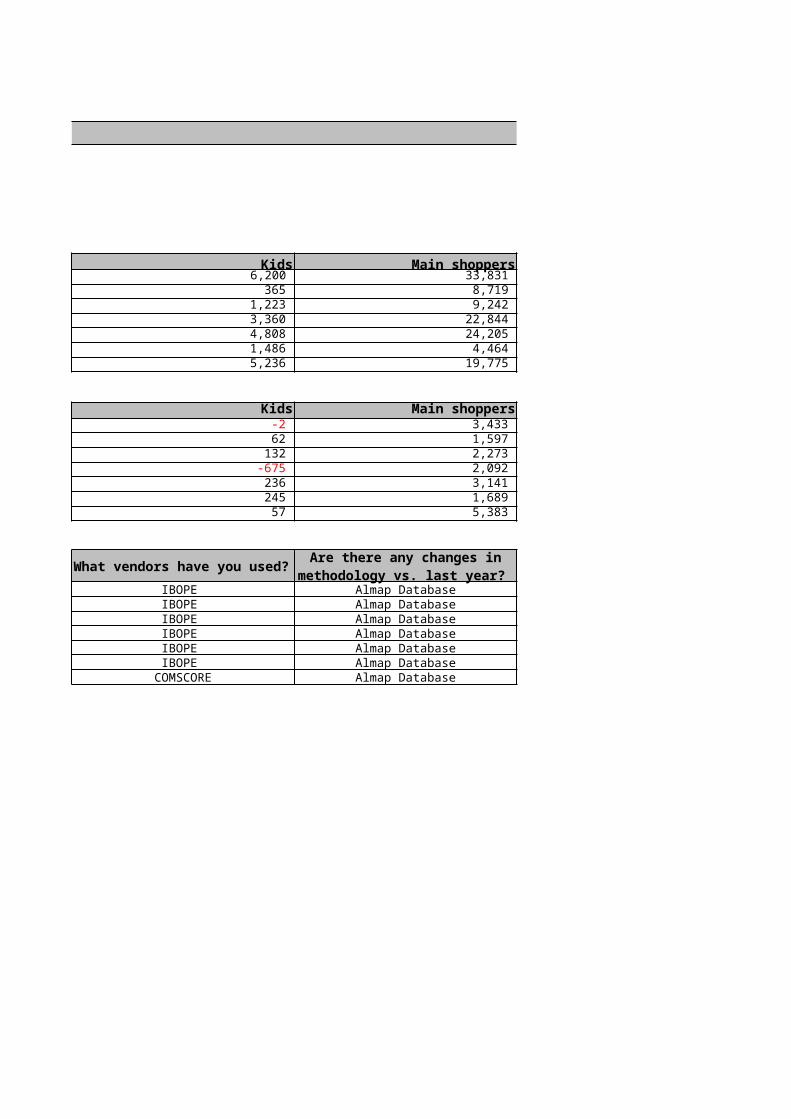
Women Kids Main shoppers 90,885 6,200 33,831 22,272 365 8,719 24,989 1,223 9,242 62,751 3,360 22,844 68,901 4,808 24,205 14,877 1,486 4,464 61,252 5,236 19,775
Women Kids Main shoppers3,560 -2 3,433
-4,152 62 1,597 1,162 132 2,273
-4,415 -675 2,092 -1,179 236 3,141
-519 245 1,689 1,729 57 5,383
total spend divided by universe IBOPE Almap Databasetotal spend divided by universe IBOPE Almap Databasetotal spend divided by universe IBOPE Almap Databasetotal spend divided by universe IBOPE Almap Databasetotal spend divided by universe IBOPE Almap Databasetotal spend divided by universe IBOPE Almap Databasetotal spend divided by universe COMSCORE Almap Database
CPM calculation methodology
What vendors have you used?
Are there any changes in methodology vs. last year?

BRAZIL 2016
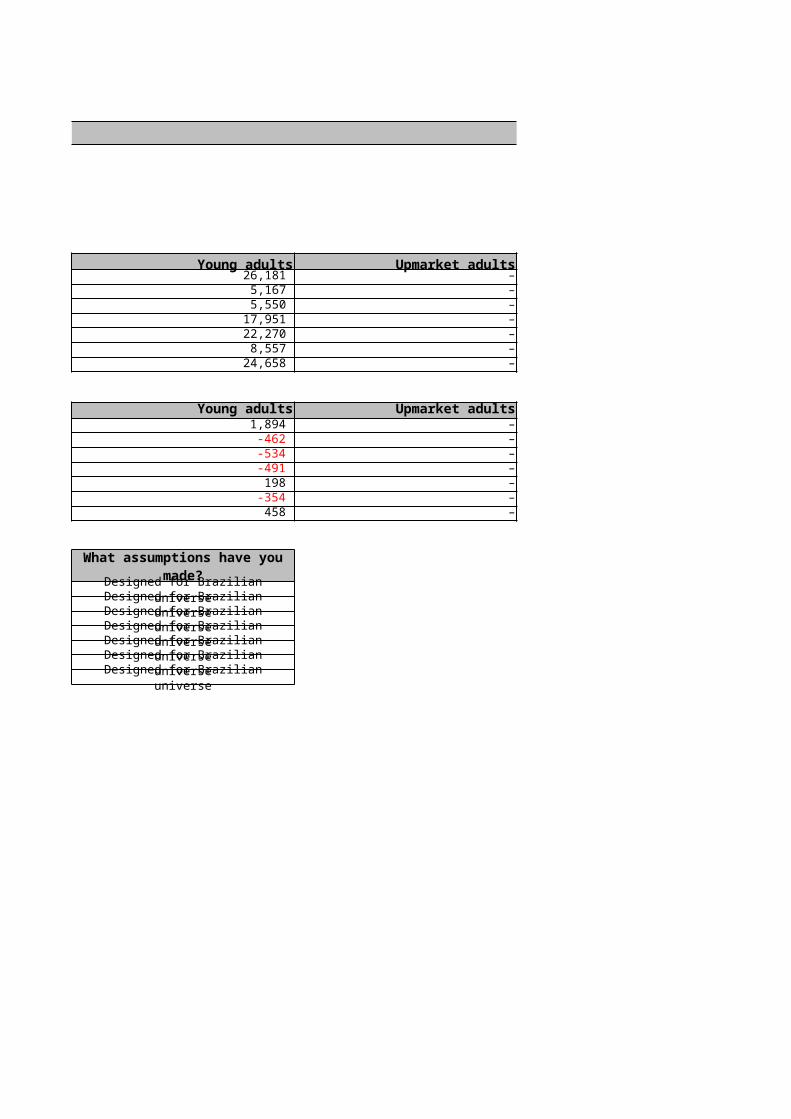
Young adults Upmarket adults Businessmen 26,181 – – 5,167 – – 5,550 – – 17,951 – – 22,270 – – 8,557 – – 24,658 – –
Young adults Upmarket adults Businessmen1,894 – –-462 – –-534 – –-491 – –198 – –
-354 – –458 – –
Designed for Brazilian universeDesigned for Brazilian universeDesigned for Brazilian universeDesigned for Brazilian universeDesigned for Brazilian universeDesigned for Brazilian universeDesigned for Brazilian universe
What assumptions have you made?

Country:
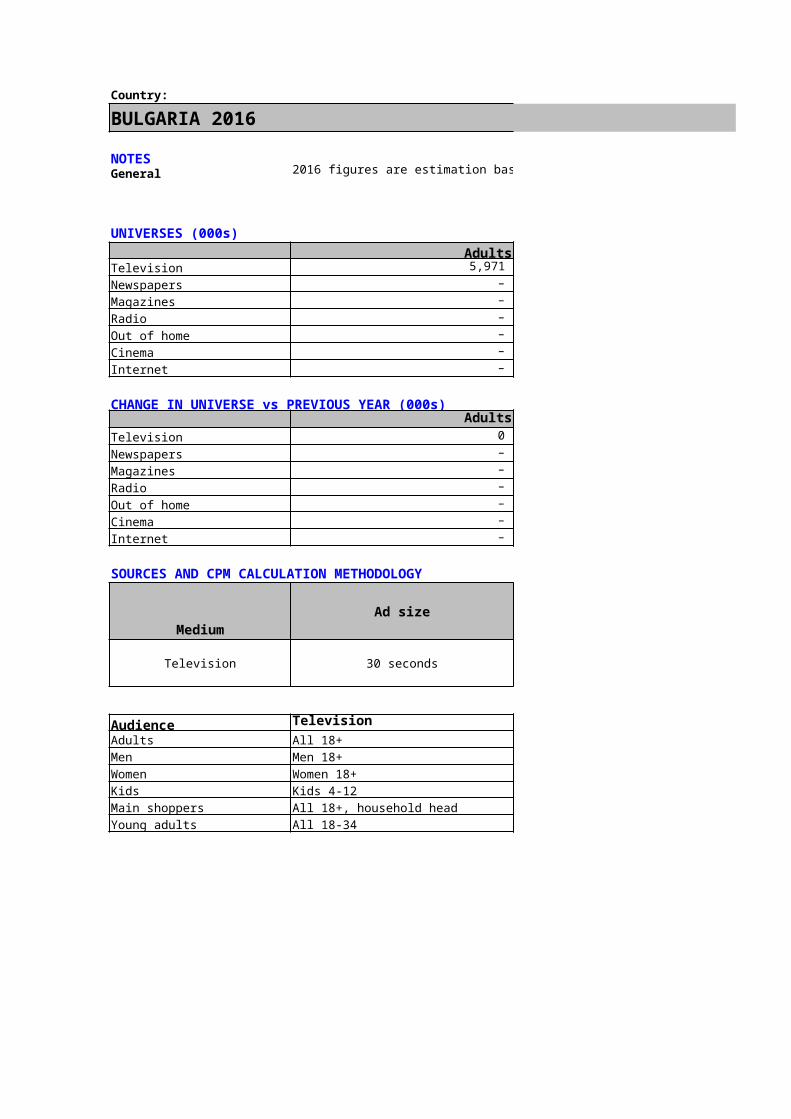
BULGARIA 2016
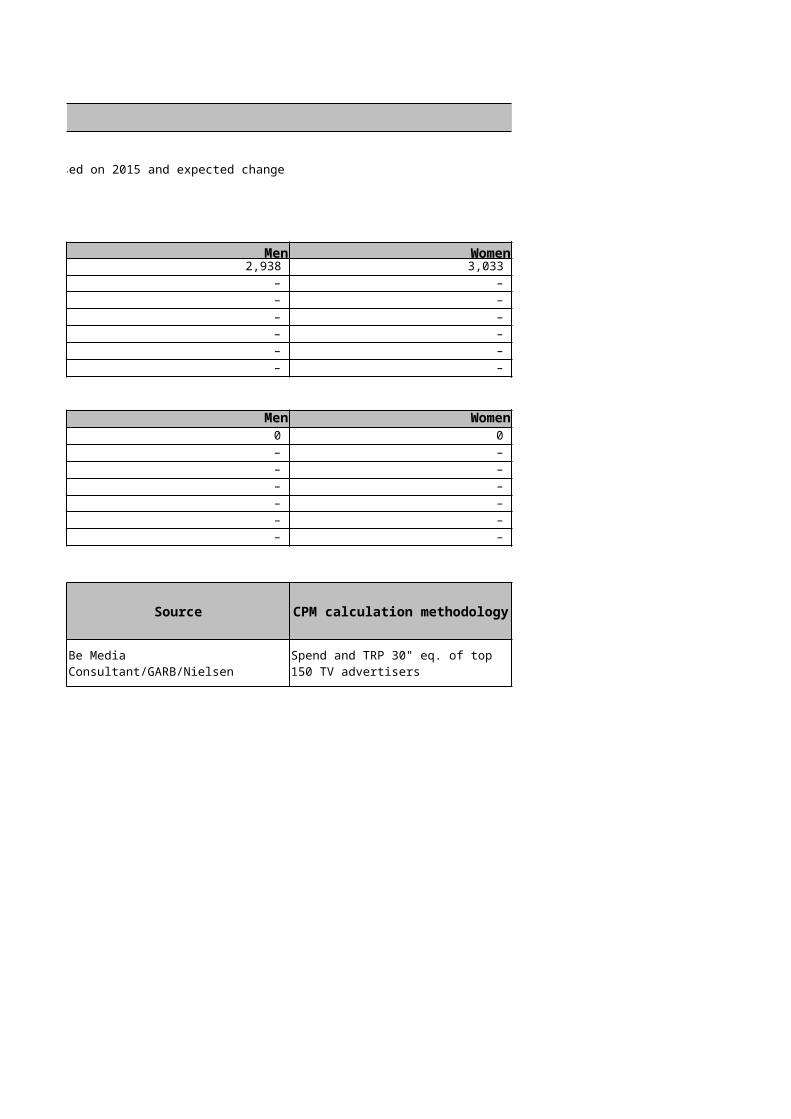
NOTESGeneral 2016 figures are estimation based on 2015 and expected change
UNIVERSES (000s)Adults Men
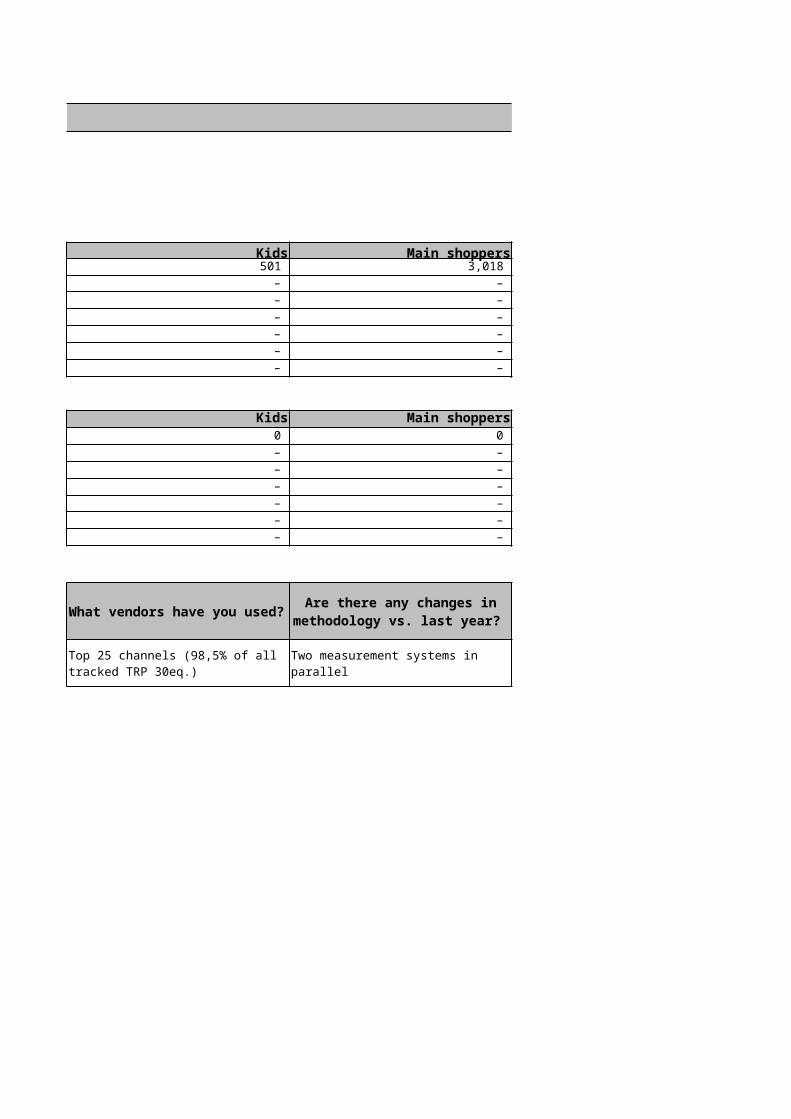
Television 5,971 2,938 Newspapers – – Magazines – – Radio – – Out of home – – Cinema – – Internet – –
CHANGE IN UNIVERSE vs PREVIOUS YEAR (000s)Adults Men
Television 0 0 Newspapers – – Magazines – – Radio – – Out of home – – Cinema – – Internet – –
SOURCES AND CPM CALCULATION METHODOLOGY
MediumAd size Source
Television 30 seconds
Audience TelevisionAdults All 18+Men Men 18+Women Women 18+Kids Kids 4-12Main shoppers All 18+, household headYoung adults All 18-34
Be Media Consultant/GARB/Nielsen
BULGARIA 2016
Women Kids Main shoppers 3,033 501 3,018
– – – – – – – – – – – – – – – – – –
Women Kids Main shoppers0 0 0 – – – – – – – – – – – – – – – – – –
CPM calculation methodology
What vendors have you used?
Are there any changes in methodology vs. last year?
Spend and TRP 30" eq. of top 150 TV advertisers
Top 25 channels (98,5% of all tracked TRP 30eq.)
Two measurement systems in parallel
BULGARIA 2016
Young adults Upmarket adults Businessmen 1,504 – –
– – – – – – – – – – – – – – – – – –
Young adults Upmarket adults Businessmen0 – – – – – – – – – – – – – – – – – – – –
What assumptions have you made?
Close estimation of spends according to our expertise
Country:
CANADA 2016
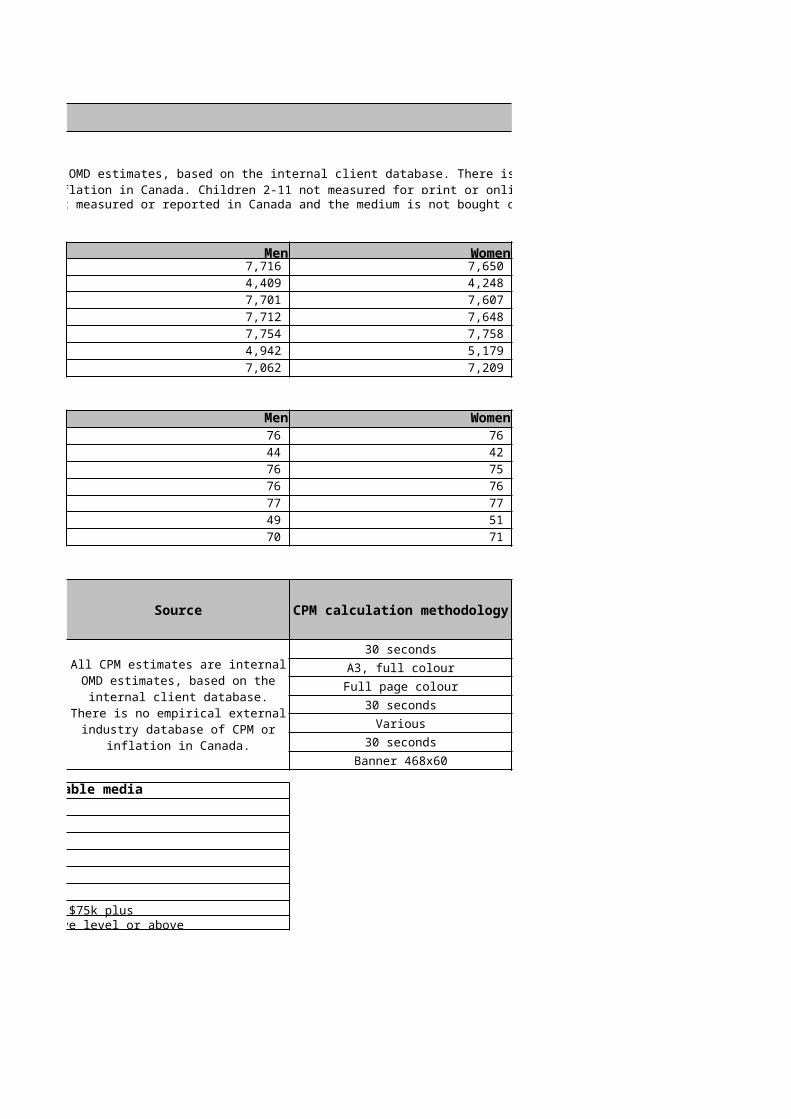
NOTESGeneral
Cinema Cinema advertising spend is not measured or reported in Canada and the medium is not bought on a CPM basis.
UNIVERSES (000s)Adults Men
Television 15,367 7,716 Newspapers 8,657 4,409 Magazines 15,309 7,701 Radio 15,360 7,712 Out of home 15,512 7,754 Cinema 10,122 4,942 Internet 14,271 7,062
CHANGE IN UNIVERSE vs PREVIOUS YEAR (000s)Adults Men
Television 152 76 Newspapers 86 44 Magazines 152 76 Radio 152 76 Out of home 154 77 Cinema 100 49 Internet 141 70
SOURCES AND CPM CALCULATION METHODOLOGY
Medium Ad size Source
Television 30 secondsNewspapers A3, full colourMagazines Full page colour
Radio 30 secondsOut of home Various
Cinema 30 secondsInternet Banner 468x60
Audience All available mediaAdults All 25–54Men Male 25–54Women Female 25–54Kids All 2–11Main shoppers Female, 25–54Young adults All 18–34Upmarket adults Adults 25–54, Household income $75k plusBusinessmen Male ABC1 – working at executive level or above
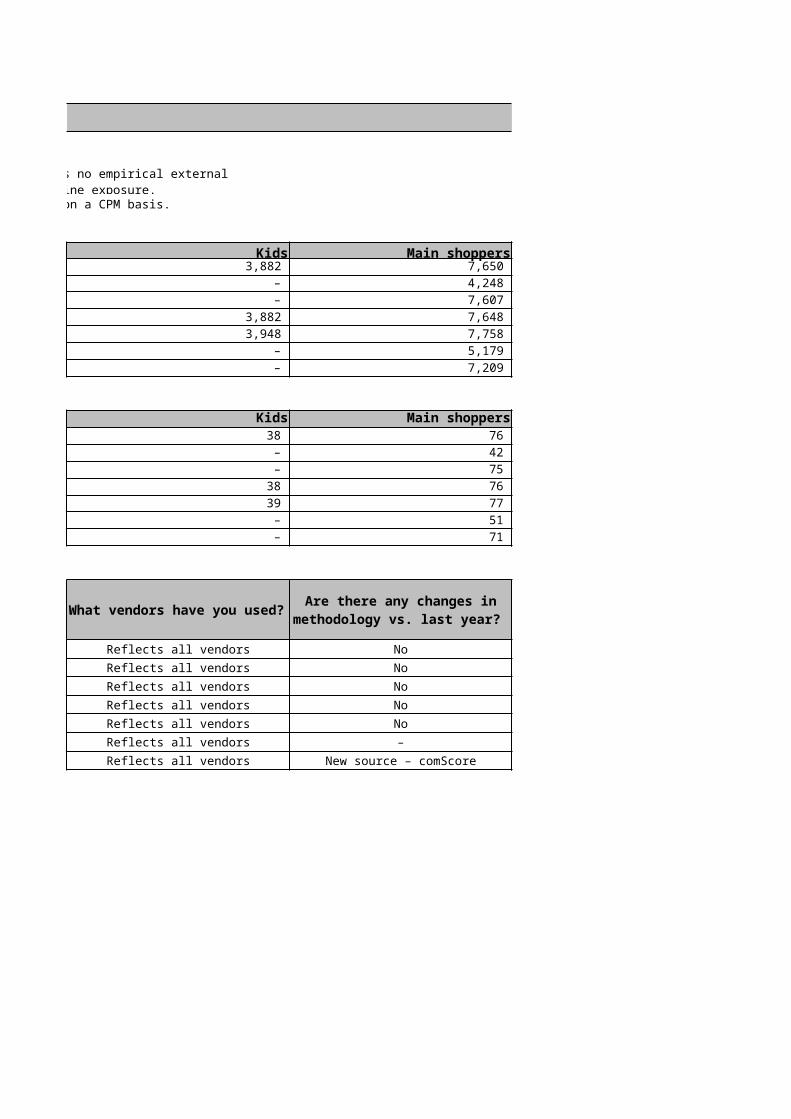
All CPM estimates are internal OMD estimates, based on the internal client database. There is no empirical external industry database of CPM or inflation in Canada. Children 2-11 not measured for print or online exposure.
All CPM estimates are internal OMD estimates, based on the
internal client database. There is no empirical external industry
database of CPM or inflation in Canada.
CANADA 2016
Cinema advertising spend is not measured or reported in Canada and the medium is not bought on a CPM basis.
Women Kids Main shoppers 7,650 3,882 7,650 4,248 – 4,248 7,607 – 7,607 7,648 3,882 7,648 7,758 3,948 7,758 5,179 – 5,179 7,209 – 7,209
Women Kids Main shoppers76 38 76 42 – 42 75 – 75 76 38 76 77 39 77 51 – 51 71 – 71
30 seconds Reflects all vendors NoA3, full colour Reflects all vendors No
Full page colour Reflects all vendors No30 seconds Reflects all vendors No
Various Reflects all vendors No30 seconds Reflects all vendors –
Banner 468x60 Reflects all vendors New source – comScore
All CPM estimates are internal OMD estimates, based on the internal client database. There is no empirical external industry database of CPM or inflation in Canada. Children 2-11 not measured for print or online exposure.
CPM calculation methodology
What vendors have you used?
Are there any changes in methodology vs. last year?
CANADA 2016
Young adults Upmarket adults Businessmen 8,461 7,086 – 4,566 4,846 – 8,475 8,609 – 8,463 7,017 – 8,528 7,366 – 6,289 6,010 – 7,196 6,422 –
Young adults Upmarket adults Businessmen84 70 – 45 48 – 84 85 – 84 69 – 84 73 – 62 60 – 71 64 –
–––––––
What assumptions have you made?
Country:
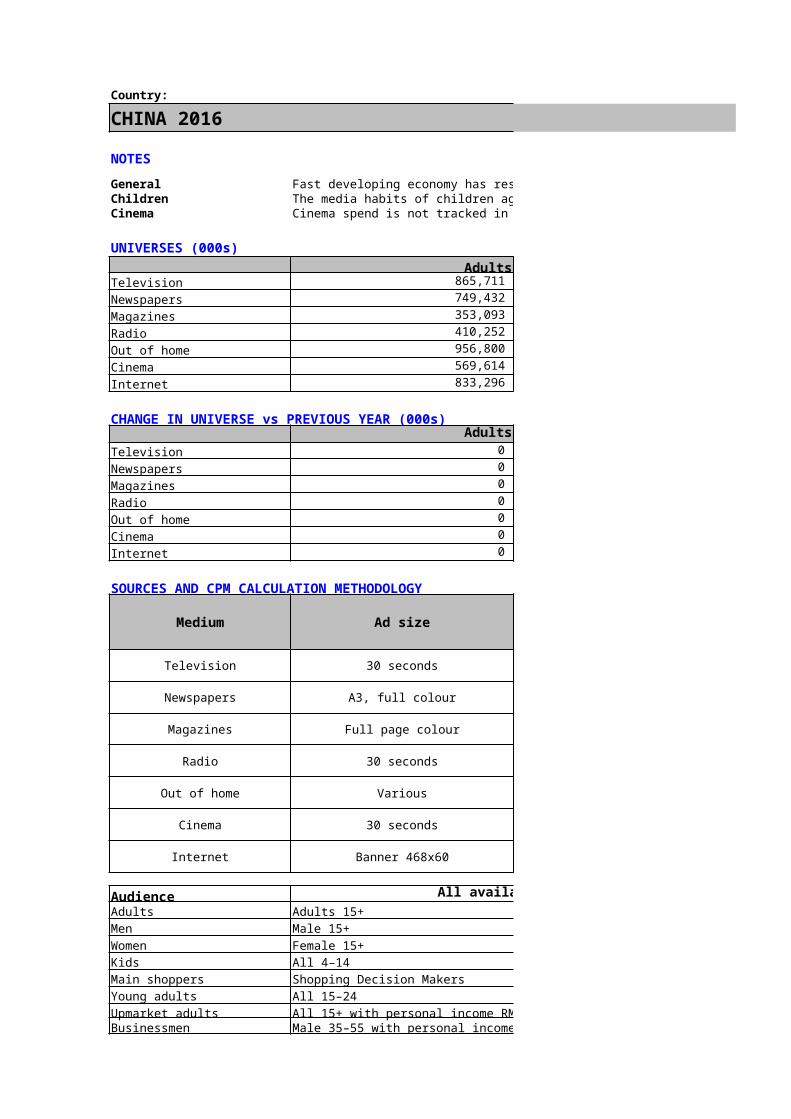
CHINA 2016
NOTES
General Fast developing economy has resulted in high inflationChildren The media habits of children aged 4–14 are not availableCinema Cinema spend is not tracked in China, so universe is an estimate
UNIVERSES (000s)Adults Men
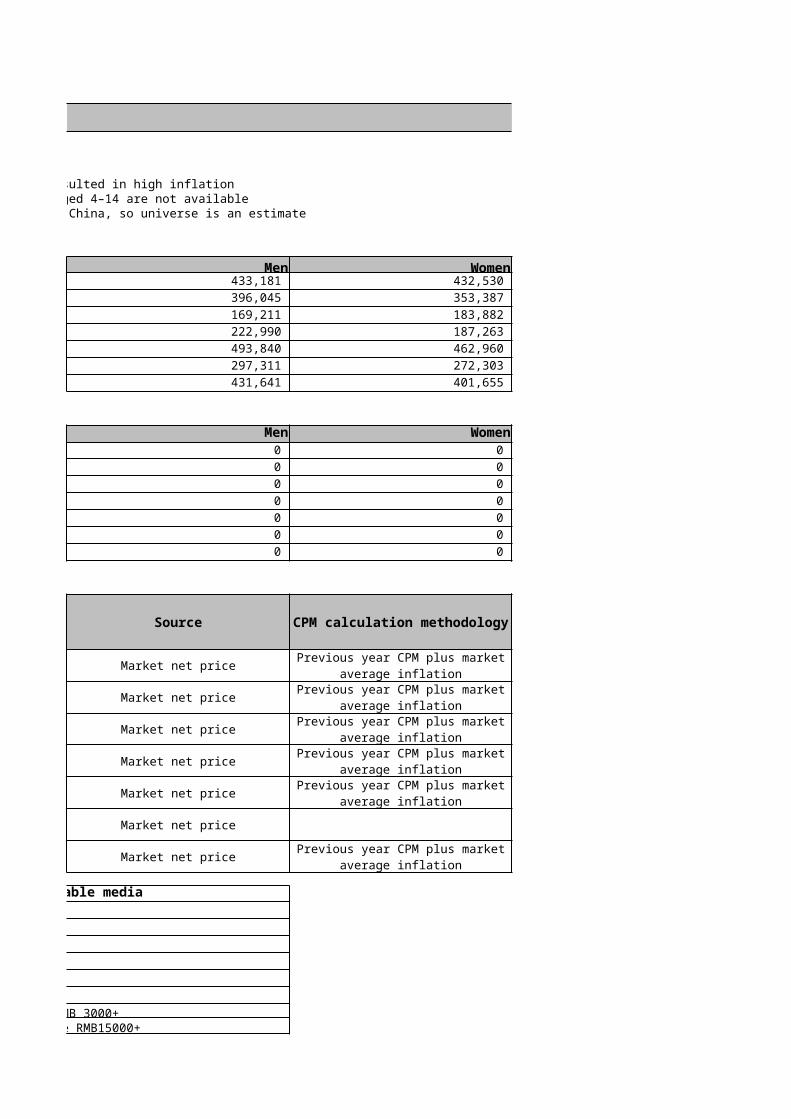
Television 865,711 433,181 Newspapers 749,432 396,045 Magazines 353,093 169,211 Radio 410,252 222,990 Out of home 956,800 493,840 Cinema 569,614 297,311 Internet 833,296 431,641
CHANGE IN UNIVERSE vs PREVIOUS YEAR (000s)Adults Men
Television 0 0 Newspapers 0 0 Magazines 0 0 Radio 0 0 Out of home 0 0 Cinema 0 0 Internet 0 0
SOURCES AND CPM CALCULATION METHODOLOGY
Medium Ad size Source
Television 30 seconds Market net price
Newspapers A3, full colour Market net price
Magazines Full page colour Market net price
Radio 30 seconds Market net price
Out of home Various Market net price
Cinema 30 seconds Market net price
Internet Banner 468x60 Market net price
Audience All available mediaAdults Adults 15+Men Male 15+Women Female 15+Kids All 4–14Main shoppers Shopping Decision MakersYoung adults All 15–24Upmarket adults All 15+ with personal income RMB 3000+Businessmen Male 35–55 with personal income RMB15000+
CHINA 2016
The media habits of children aged 4–14 are not availableCinema spend is not tracked in China, so universe is an estimate
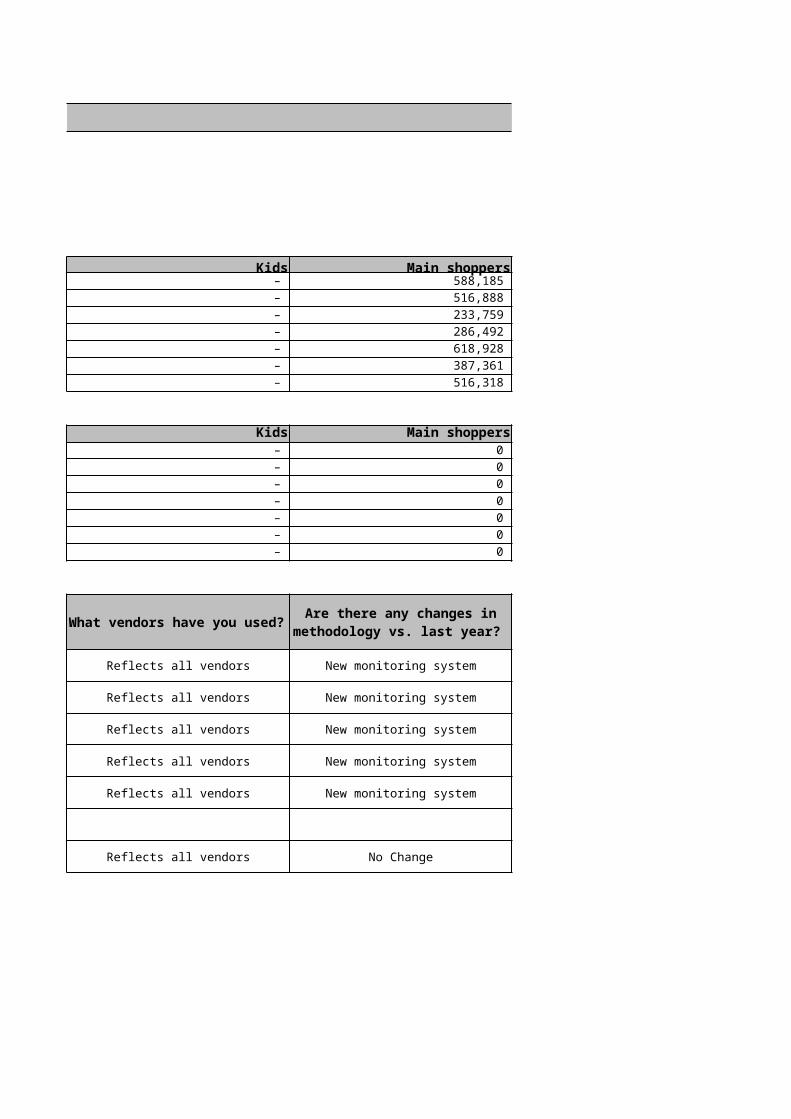
Women Kids Main shoppers 432,530 – 588,185 353,387 – 516,888 183,882 – 233,759 187,263 – 286,492 462,960 – 618,928 272,303 – 387,361 401,655 – 516,318
Women Kids Main shoppers0 – 0 0 – 0 0 – 0 0 – 0 0 – 0 0 – 0 0 – 0
Reflects all vendors New monitoring system
Reflects all vendors New monitoring system
Reflects all vendors New monitoring system
Reflects all vendors New monitoring system
Reflects all vendors New monitoring system
Reflects all vendors No Change
CPM calculation methodology
What vendors have you used?
Are there any changes in methodology vs. last year?
Previous year CPM plus market average inflation
Previous year CPM plus market average inflation
Previous year CPM plus market average inflation
Previous year CPM plus market average inflation
Previous year CPM plus market average inflation
Previous year CPM plus market average inflation
CHINA 2016
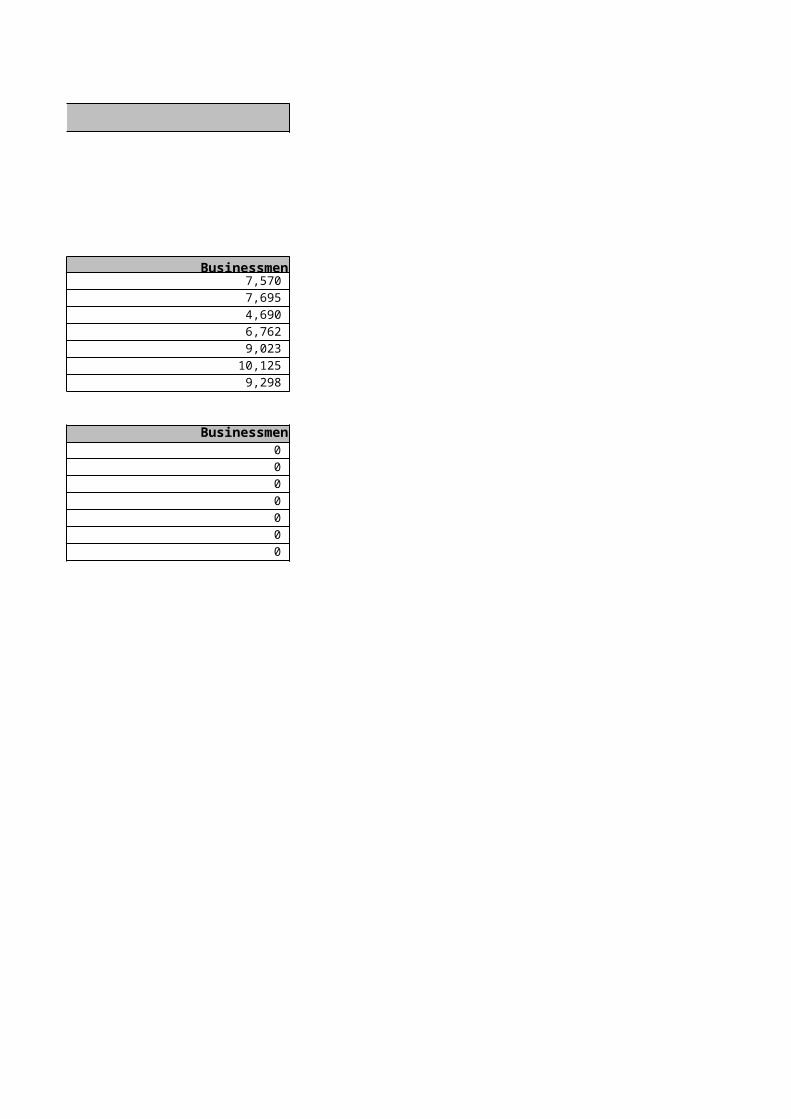
Young adults Upmarket adults Businessmen 181,114 577,623 7,570 154,992 521,966 7,695 103,487 256,237 4,690 71,692 314,505 6,762 235,124 654,198 9,023 182,805 453,900 10,125 246,413 594,240 9,298
Young adults Upmarket adults Businessmen0 0 0 0 0 0 0 0 0 0 0 0 0 0 0 0 0 0 0 0 0
What assumptions have you made?

Country:
CROATIA 2016
NOTESGeneral
Target groups
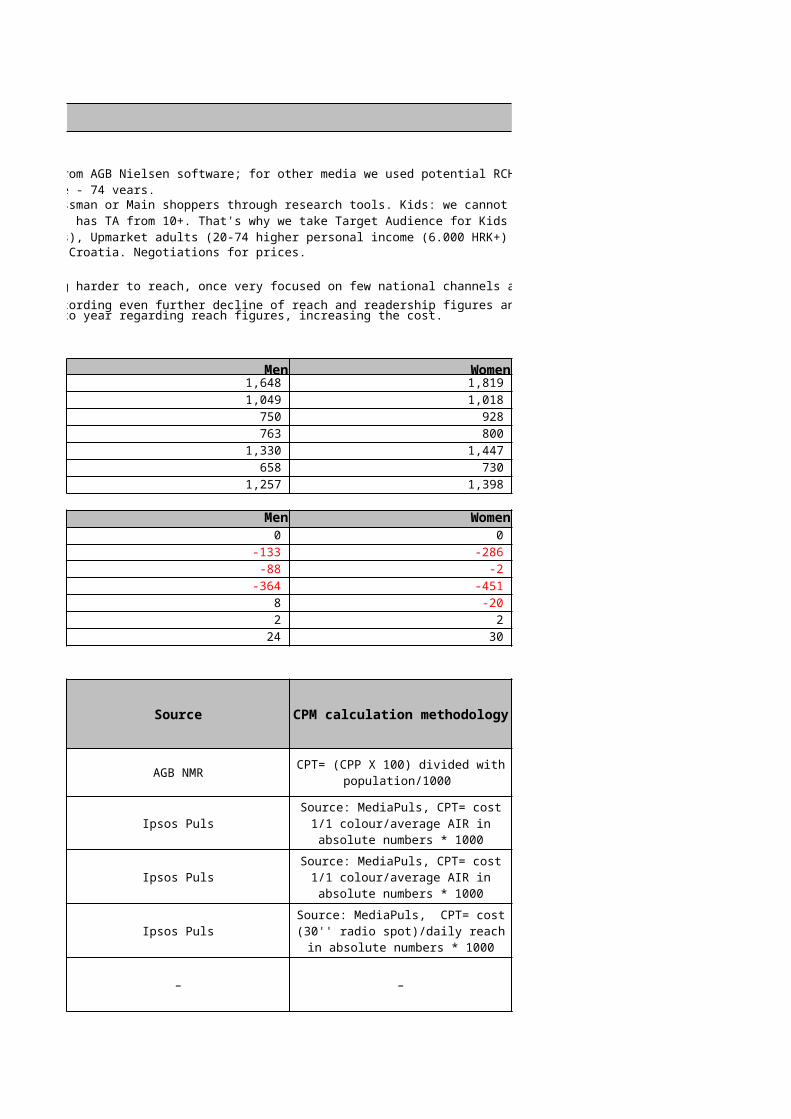
Cinema There is no 30" cinema spot in Croatia. Negotiations for prices.
TV Women on Television are getting harder to reach, once very focused on few national channels and easier to reach are watching more and more payTV channels.Newspapers Newspaper and magazines are recording even further decline of reach and readership figures and are trying to keep stable prices. Radio Radio in a small decline year to year regarding reach figures, increasing the cost.
UNIVERSES (000s)Adults Men
Television 3,468 1,648 Newspapers 2,068 1,049 Magazines 1,678 750 Radio 1,564 763 Out of home 2,795 1,330 Cinema 1,387 658 Internet 2,635 1,257 CHANGE IN UNIVERSE vs PREVIOUS YEAR (000s)
Adults MenTelevision 0 0 Newspapers -419 -133 Magazines -89 -88 Radio -814 -364 Out of home 5 8 Cinema 2 2 Internet 34 24
SOURCES AND CPM CALCULATION METHODOLOGY
Medium Ad size Source
Television 30 seconds AGB NMR
Newspapers A3, full colour Ipsos Puls
Magazines Full page colour Ipsos Puls
Radio 30 seconds Ipsos Puls
Out of home Various –
For TV we have exact figures from AGB Nielsen software; for other media we used potential RCH (BRANDpuls) on Census figures because in other research tools we have limited upper age - 74 years. We cannot define the TG Businessman or Main shoppers through research tools. Kids: we cannot take 4-14 because it is not comparable. TV panel has TA from 4 years+. Other media (non TV ) has TA from 10+. That's why we take Target Audience for Kids 10-14. CPT targets for non TV media: Adults (18-74), Men (18-74 Males), Women (18-74 Females), Upmarket adults (20-74 higher personal income (6.000 HRK+)
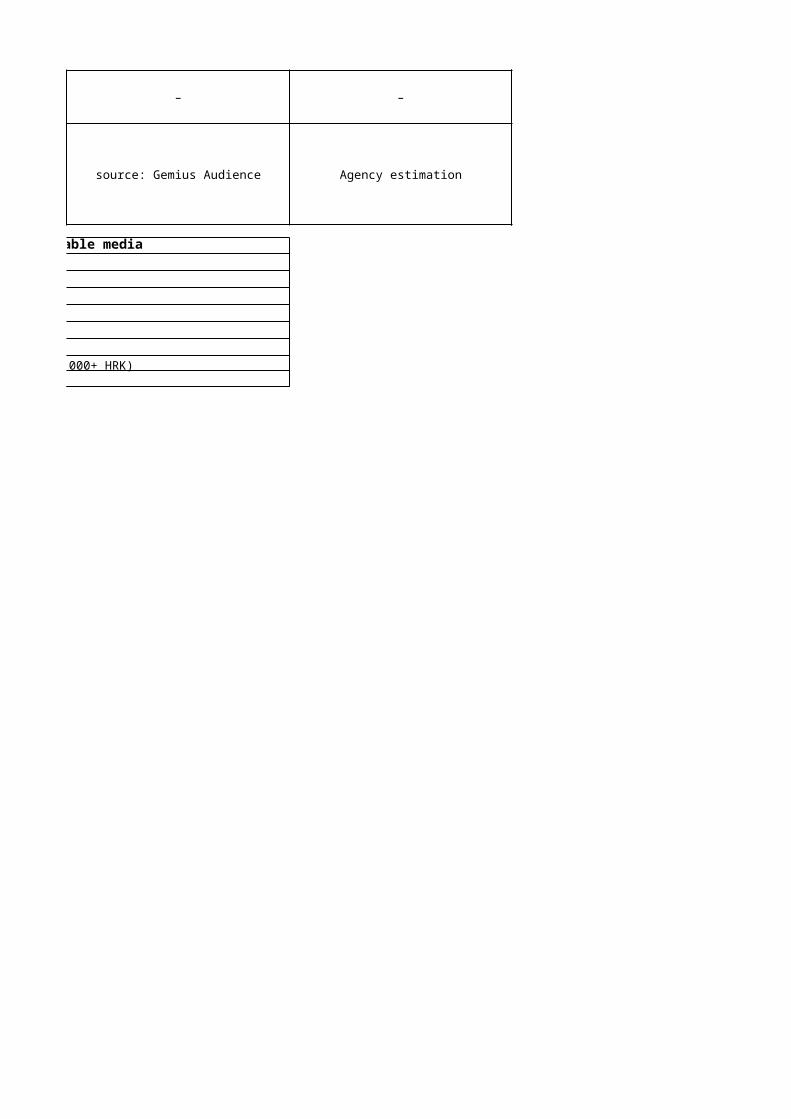
Cinema 30 seconds –
Internet Banner 468x60 source: Gemius Audience
Audience All available mediaAdults All 18+Men Male 18+Women Female 18+Kids All 10–14Main shoppers –Young adults All 18–34Upmarket adults 20+, higher personal income (6,000+ HRK)Businessmen –
CROATIA 2016
There is no 30" cinema spot in Croatia. Negotiations for prices.
Women on Television are getting harder to reach, once very focused on few national channels and easier to reach are watching more and more payTV channels.Newspaper and magazines are recording even further decline of reach and readership figures and are trying to keep stable prices. Radio in a small decline year to year regarding reach figures, increasing the cost.
Women Kids Main shoppers 1,819 234 – 1,018 44 – 928 64 – 800 33 – 1,447 209 – 730 115 – 1,398 212 –
Women Kids Main shoppers0 0 –
-286 -124 – -2 -72 –
-451 -150 – -20 -6 –
2 8 – 30 12 –
No change
5 National newspapers No change
Top 5 Magazines No change
Top 5 Radio stations No change
– – No change
For TV we have exact figures from AGB Nielsen software; for other media we used potential RCH (BRANDpuls) on Census figures because in other research tools we have limited upper age - 74 years. We cannot define the TG Businessman or Main shoppers through research tools. Kids: we cannot take 4-14 because it is not comparable. TV panel has TA from 4 years+. Other media (non TV ) has TA from 10+. That's why we take Target Audience for Kids 10-14. CPT targets for non TV media: Adults (18-74), Men (18-74 Males), Women (18-74 Females), Upmarket adults (20-74 higher personal income (6.000 HRK+)
CPM calculation methodology
What vendors have you used?
Are there any changes in methodology vs. last year?
CPT= (CPP X 100) divided with population/1000
Main national channels (6 channels)..based on channel mix
Source: MediaPuls, CPT= cost 1/1 colour/average AIR in absolute
numbers * 1000
Source: MediaPuls, CPT= cost 1/1 colour/average AIR in absolute
numbers * 1000
Source: MediaPuls, CPT= cost (30'' radio spot)/daily reach in
absolute numbers * 1000
– – No change
Agency estimation – No change

CROATIA 2016
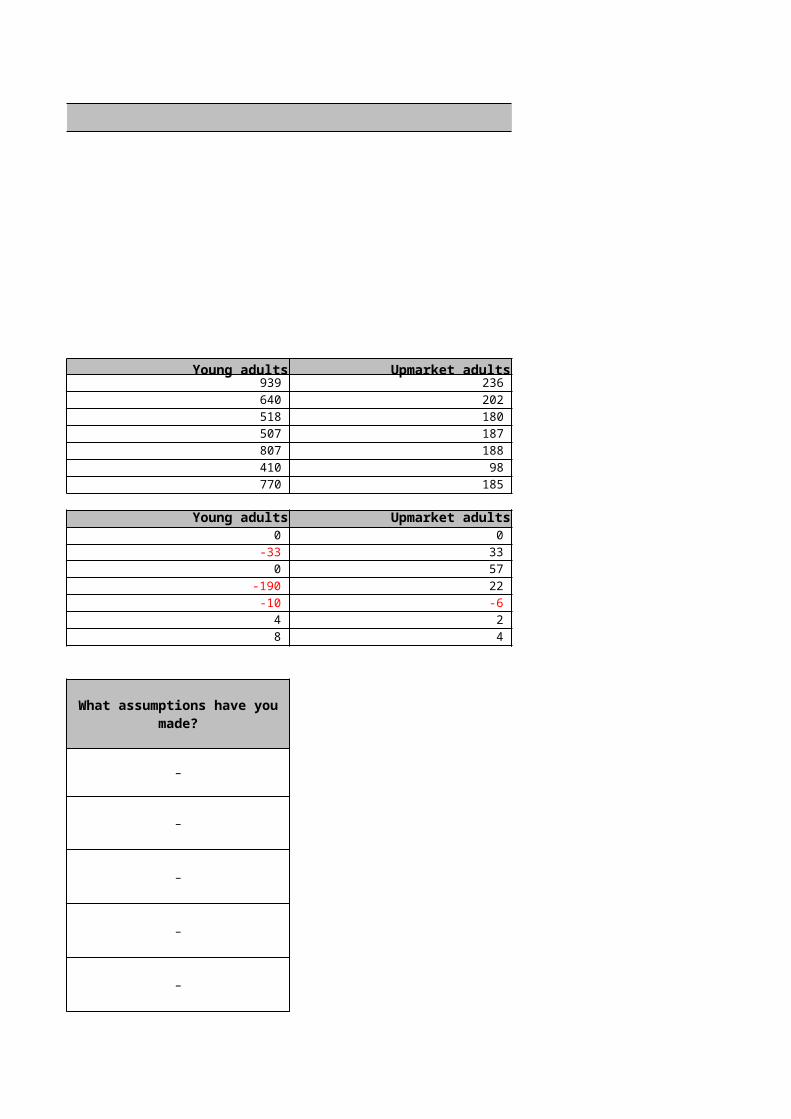
Young adults Upmarket adults Businessmen 939 236 – 640 202 – 518 180 – 507 187 – 807 188 – 410 98 – 770 185 –
Young adults Upmarket adults Businessmen0 0 –
-33 33 – 0 57 –
-190 22 – -10 -6 –
4 2 – 8 4 –
–
–
–
–
–
What assumptions have you made?

–
Since AdEx is not considered valid, we used our estimation,

Country:
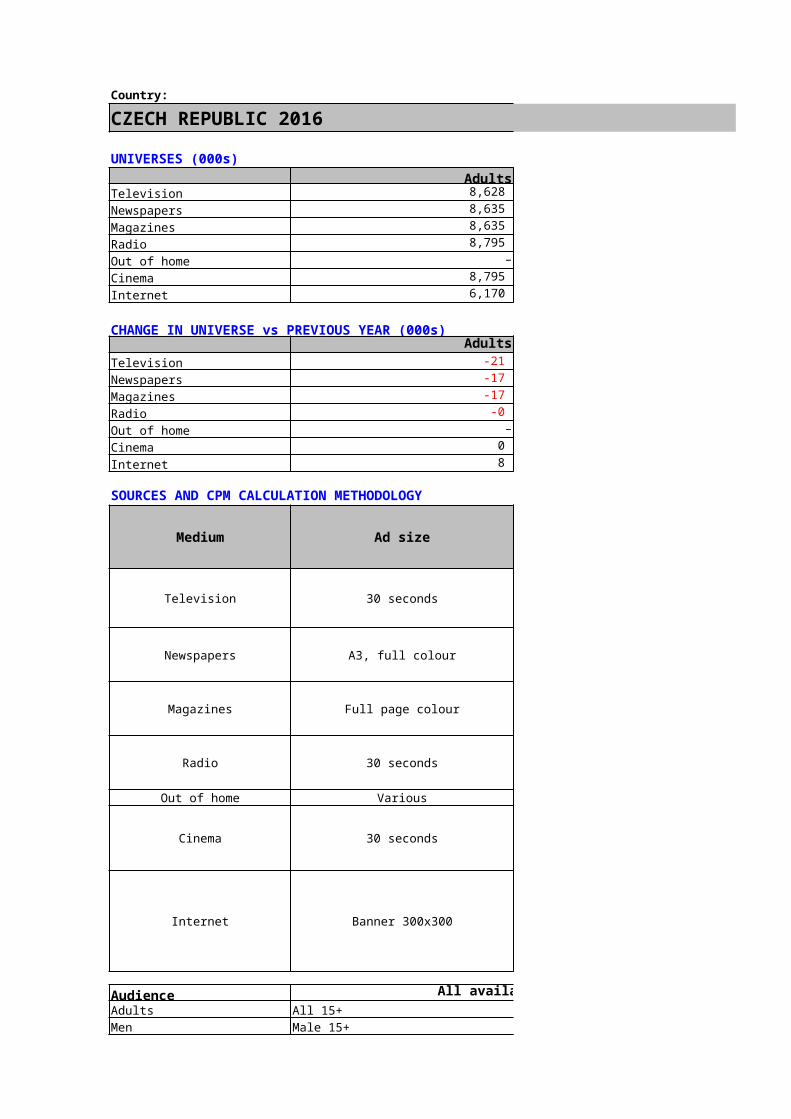
CZECH REPUBLIC 2016
UNIVERSES (000s)Adults Men
Television 8,628 4,191 Newspapers 8,635 4,260 Magazines 8,635 4,260 Radio 8,795 4,340 Out of home – –Cinema 8,795 –Internet 6,170 3,136
CHANGE IN UNIVERSE vs PREVIOUS YEAR (000s)Adults Men
Television -21 -4 Newspapers -17 1 Magazines -17 1 Radio -0 -0 Out of home – –Cinema 0 –Internet 8 -4
SOURCES AND CPM CALCULATION METHODOLOGY
Medium Ad size Source
Television 30 seconds
Newspapers A3, full colour
Magazines Full page colour
Radio 30 seconds
Out of home Various –
Cinema 30 seconds
Internet Banner 300x300
Audience All available mediaAdults All 15+Men Male 15+
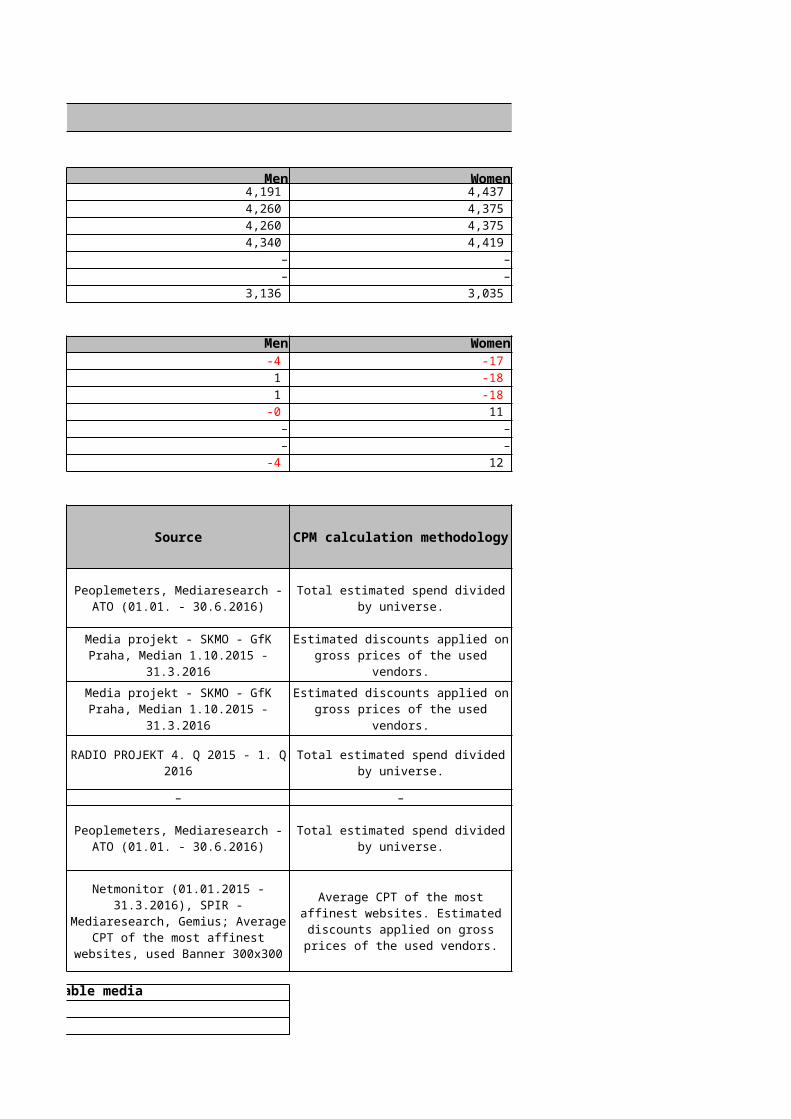
Peoplemeters, Mediaresearch - ATO (01.01. - 30.6.2016)
Media projekt - SKMO - GfK Praha, Median 1.10.2015 -
31.3.2016
Media projekt - SKMO - GfK Praha, Median 1.10.2015 -
31.3.2016
RADIO PROJEKT 4. Q 2015 - 1. Q 2016
Peoplemeters, Mediaresearch - ATO (01.01. - 30.6.2016)
Netmonitor (01.01.2015 - 31.3.2016), SPIR -
Mediaresearch, Gemius; Average CPT of the most affinest websites,
used Banner 300x300
Women Female 15+Kids All 0–15Main shoppers Housewives, 18+Young adults All 15–25Upmarket adults 15+, social class A (the highest level)Businessmen Entrepreneur, higher level manager supervising several departments,
top manager, director
CZECH REPUBLIC 2016
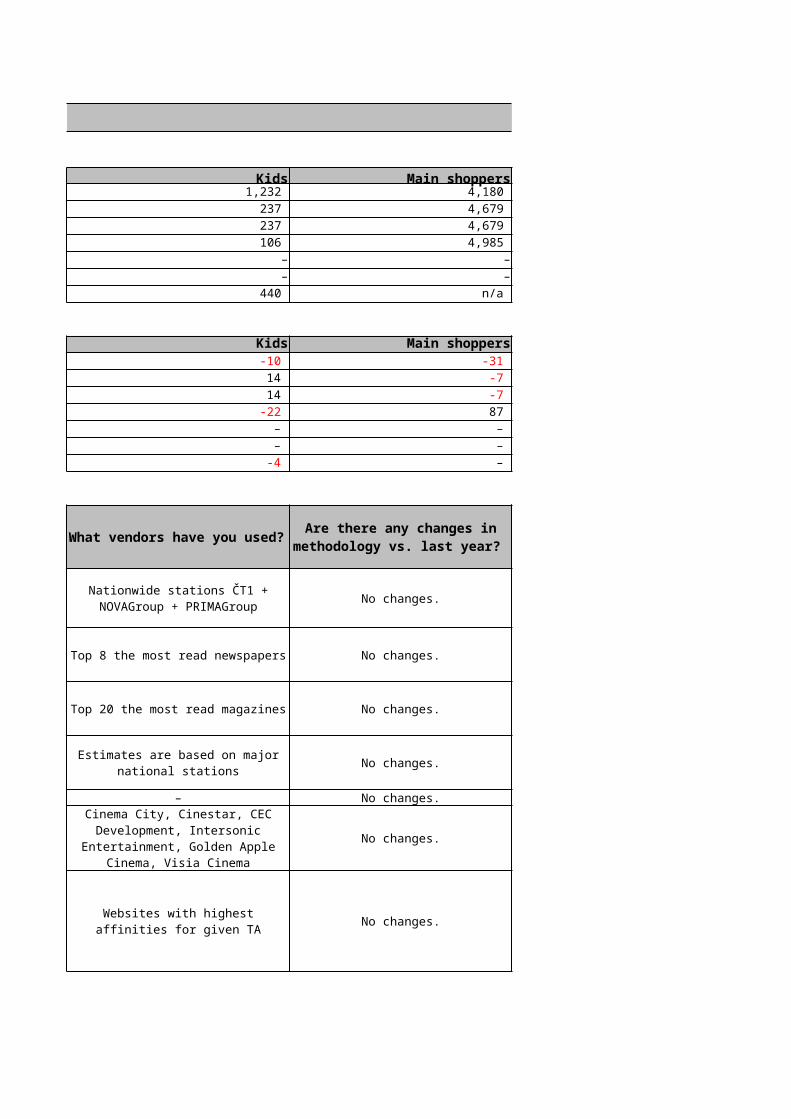
Women Kids Main shoppers 4,437 1,232 4,180 4,375 237 4,679 4,375 237 4,679 4,419 106 4,985
– – –– – –
3,035 440 n/a
Women Kids Main shoppers-17 -10 -31 -18 14 -7 -18 14 -7 11 -22 87
– – – – – –
12 -4 –
No changes.
Top 8 the most read newspapers No changes.
Top 20 the most read magazines No changes.
No changes.
– – No changes.
No changes.
No changes.
CPM calculation methodology
What vendors have you used?
Are there any changes in methodology vs. last year?
Total estimated spend divided by universe.
Nationwide stations ČT1 + NOVAGroup + PRIMAGroup
Estimated discounts applied on gross prices of the used vendors.
Estimated discounts applied on gross prices of the used vendors.
Total estimated spend divided by universe.
Estimates are based on major national stations
Total estimated spend divided by universe.
Cinema City, Cinestar, CEC Development, Intersonic
Entertainment, Golden Apple Cinema, Visia Cinema
Average CPT of the most affinest websites. Estimated discounts applied on gross prices of the
used vendors.
Websites with highest affinities for given TA

CZECH REPUBLIC 2016
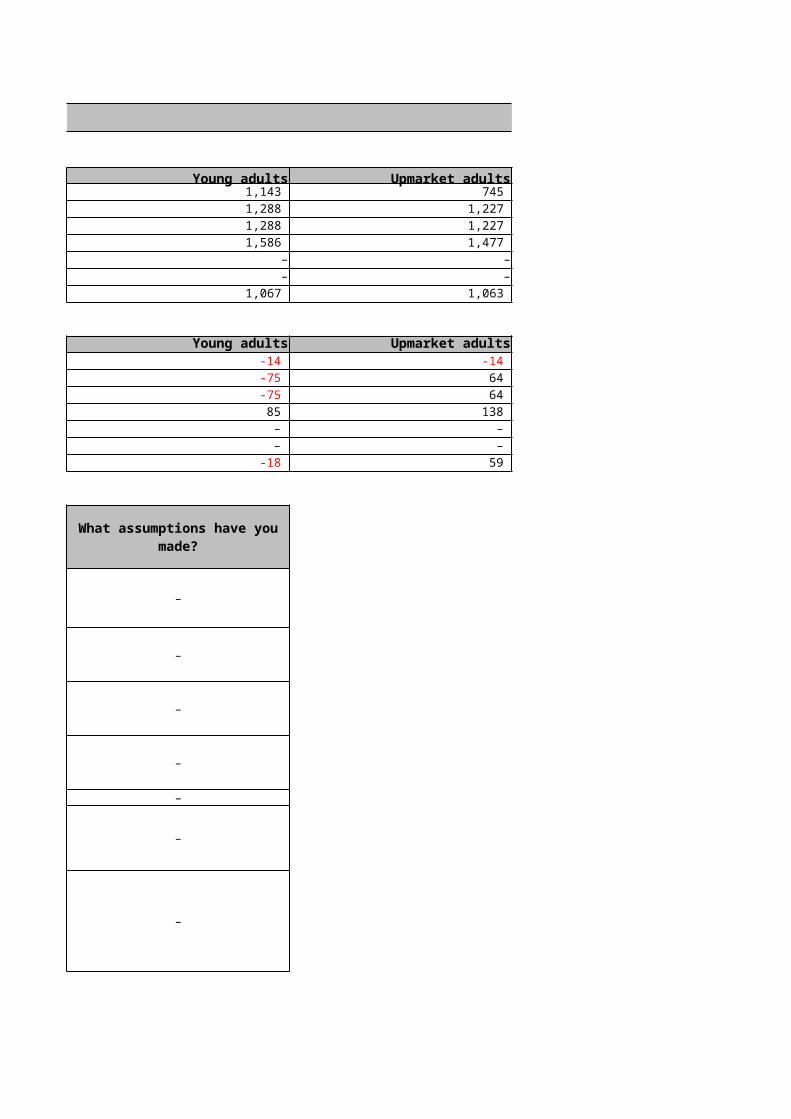
Young adults Upmarket adults Businessmen 1,143 745 626 1,288 1,227 561 1,288 1,227 561 1,586 1,477 832
– – –– – –
1,067 1,063 1,364
Young adults Upmarket adults Businessmen-14 -14 50 -75 64 -15 -75 64 -15 85 138 8 – – – – – –
-18 59 -9
–
–
–
–
–
–
–
What assumptions have you made?

Country:
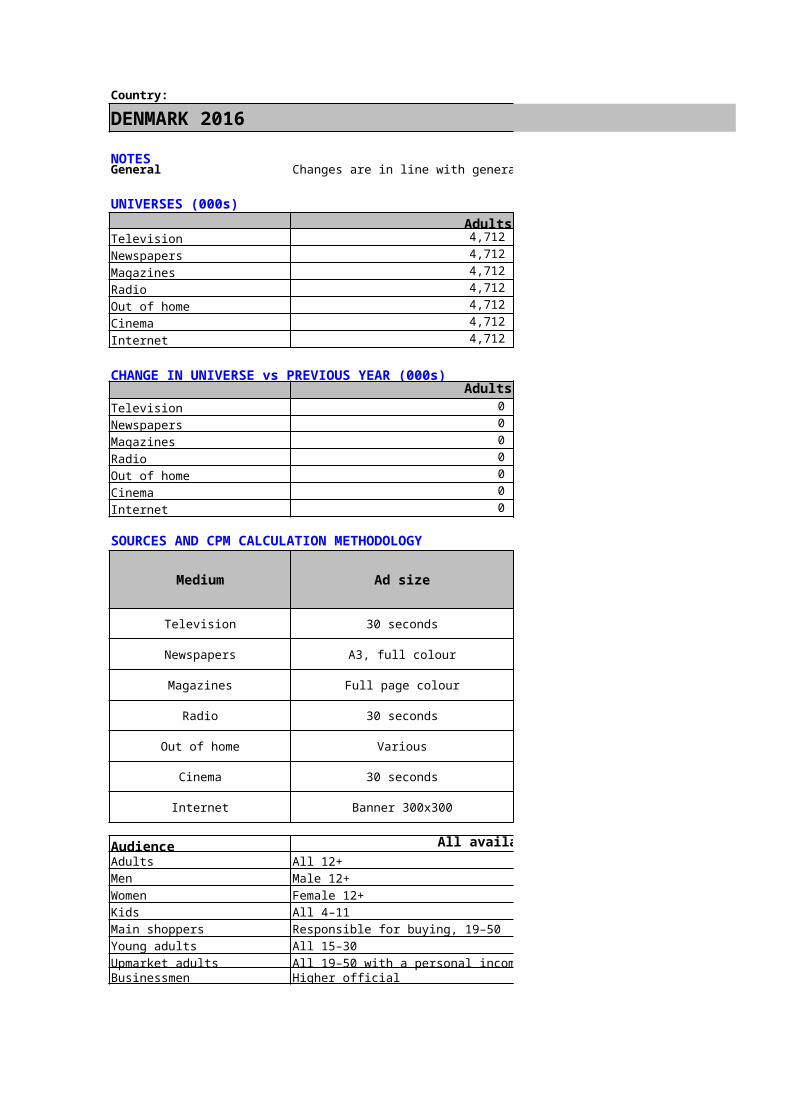
DENMARK 2016
NOTESGeneral Changes are in line with general market inflation
UNIVERSES (000s)Adults Men
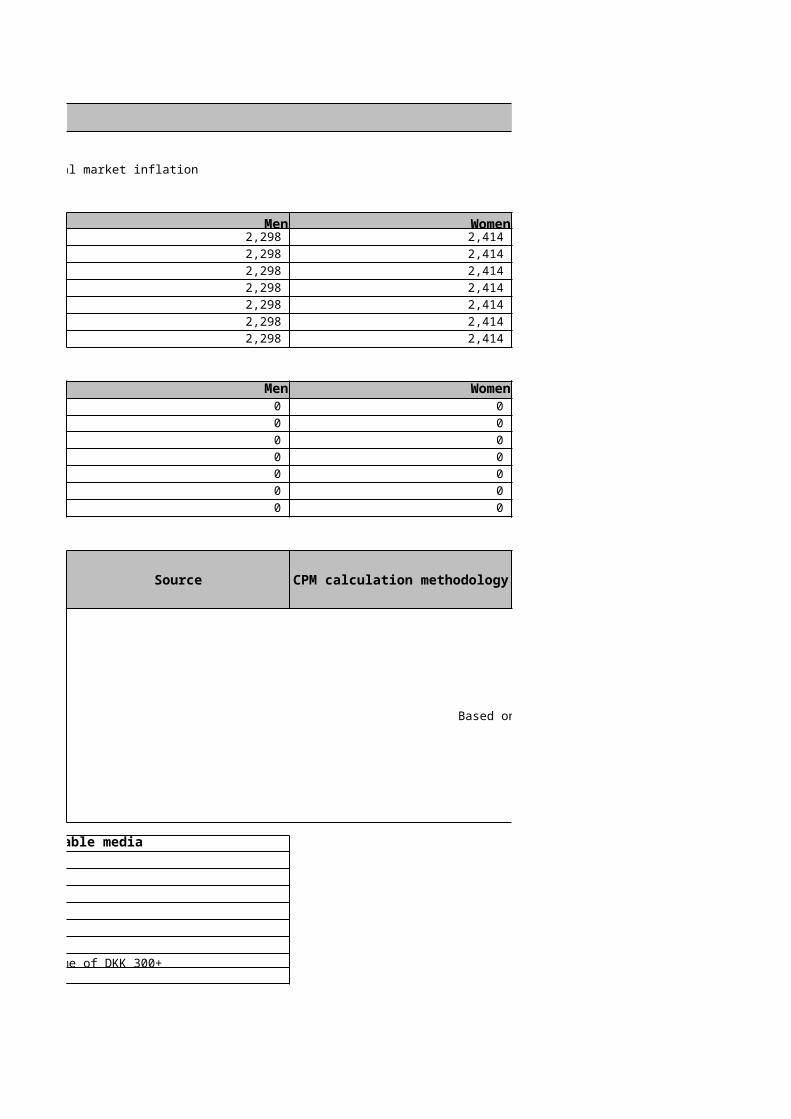
Television 4,712 2,298 Newspapers 4,712 2,298 Magazines 4,712 2,298 Radio 4,712 2,298 Out of home 4,712 2,298 Cinema 4,712 2,298 Internet 4,712 2,298
CHANGE IN UNIVERSE vs PREVIOUS YEAR (000s)Adults Men
Television 0 0 Newspapers 0 0 Magazines 0 0 Radio 0 0 Out of home 0 0 Cinema 0 0 Internet 0 0
SOURCES AND CPM CALCULATION METHODOLOGY
Medium Ad size Source
Television 30 seconds
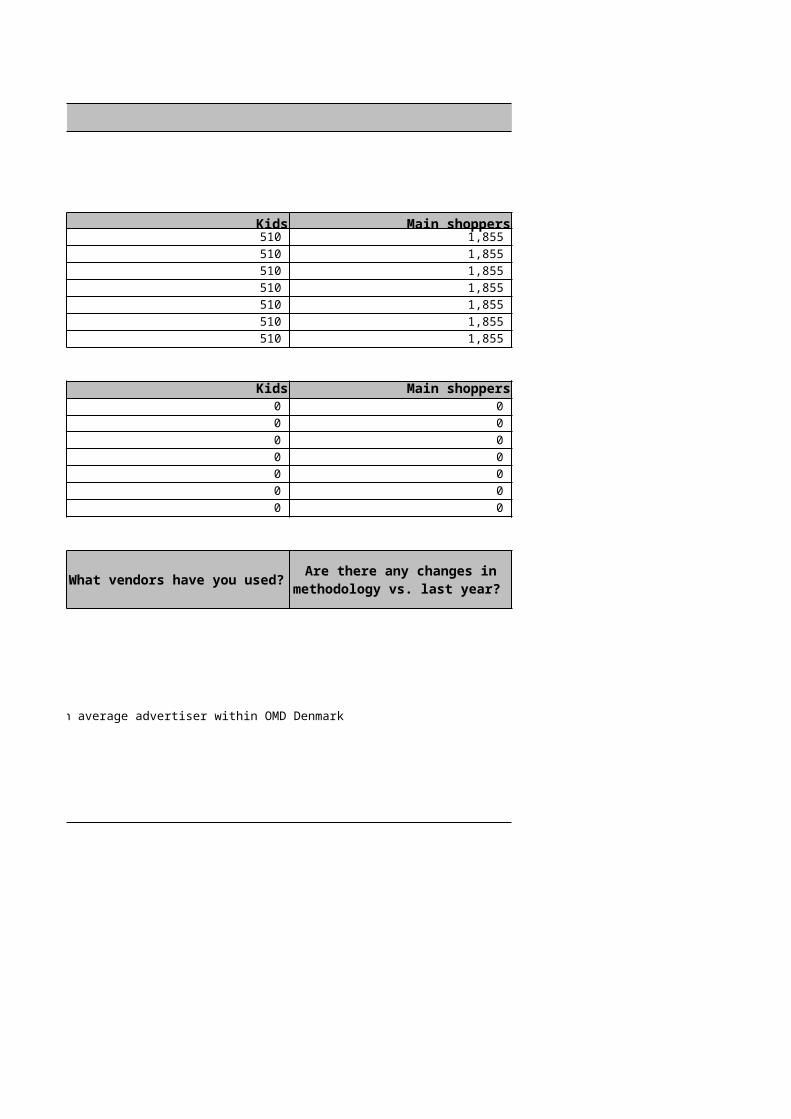
Based on average advertiser within OMD Denmark
Newspapers A3, full colour
Magazines Full page colour
Radio 30 seconds
Out of home Various
Cinema 30 seconds
Internet Banner 300x300
Audience All available mediaAdults All 12+Men Male 12+Women Female 12+Kids All 4–11Main shoppers Responsible for buying, 19–50Young adults All 15–30Upmarket adults All 19–50 with a personal income of DKK 300+Businessmen Higher official
DENMARK 2016
Women Kids Main shoppers 2,414 510 1,855 2,414 510 1,855 2,414 510 1,855 2,414 510 1,855 2,414 510 1,855 2,414 510 1,855 2,414 510 1,855
Women Kids Main shoppers0 0 0 0 0 0 0 0 0 0 0 0 0 0 0 0 0 0 0 0 0
Based on average advertiser within OMD Denmark
CPM calculation methodology
What vendors have you used?
Are there any changes in methodology vs. last year?
DENMARK 2016
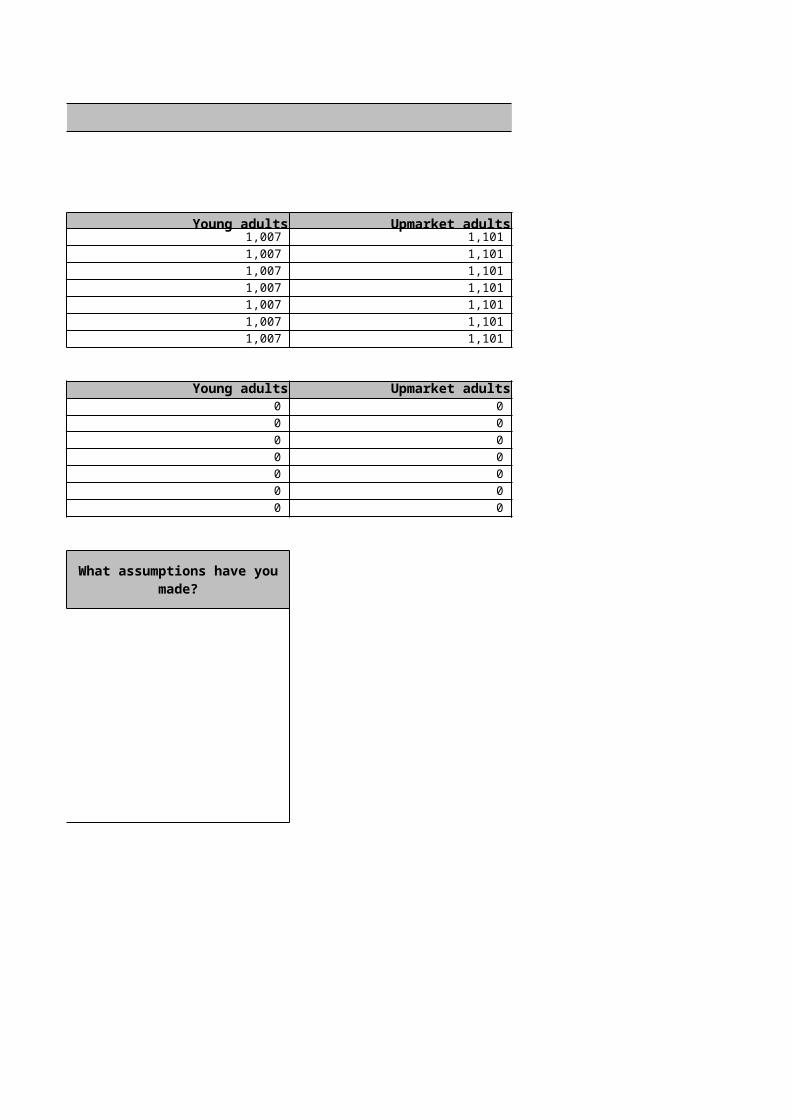
Young adults Upmarket adults Businessmen 1,007 1,101 584 1,007 1,101 584 1,007 1,101 584 1,007 1,101 584 1,007 1,101 584 1,007 1,101 584 1,007 1,101 584
Young adults Upmarket adults Businessmen0 0 0 0 0 0 0 0 0 0 0 0 0 0 0 0 0 0 0 0 0
Based on average advertiser within OMD Denmark
What assumptions have you made?
Country:ECUADOR 2016
NOTES
UNIVERSES (000s)Adults Men
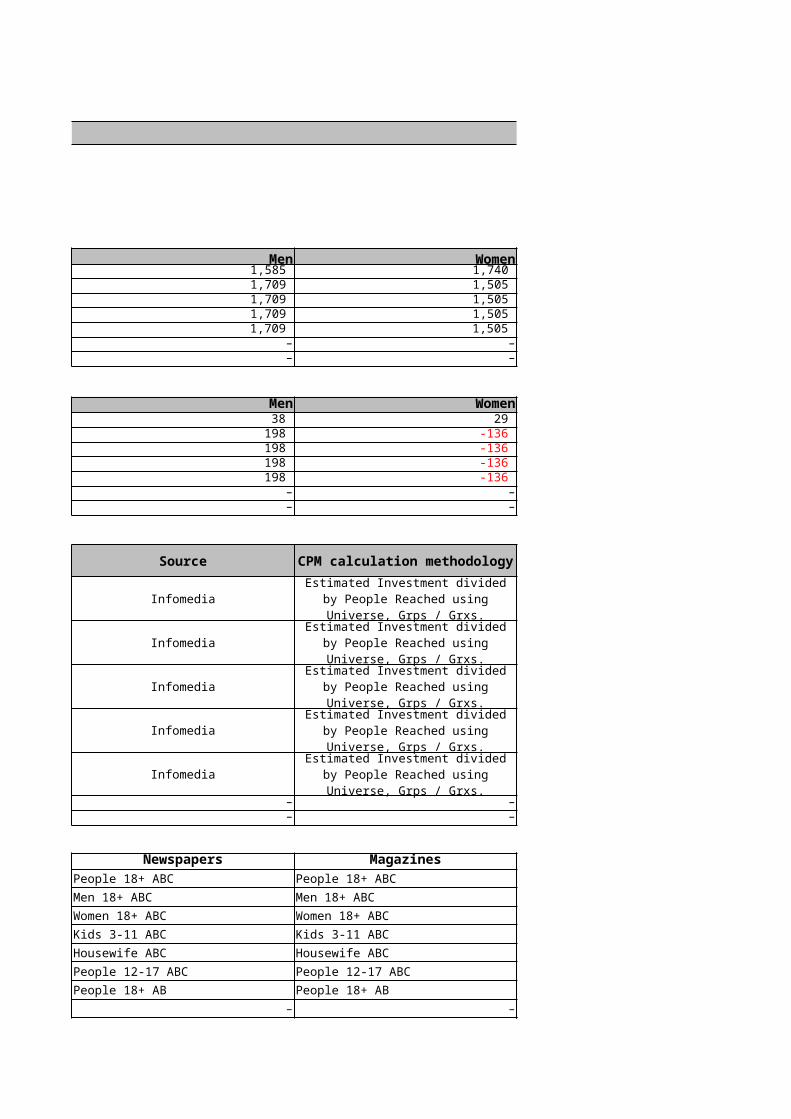
Television 3,325 1,585 Newspapers 3,214 1,709 Magazines 3,214 1,709 Radio 3,214 1,709 Out of home 3,214 1,709 Cinema – –Internet – –
CHANGE IN UNIVERSE vs PREVIOUS YEAR (000s)Adults Men
Television 67 38 Newspapers 62 198 Magazines 62 198 Radio 62 198 Out of home 62 198 Cinema – –Internet – –
SOURCES AND CPM CALCULATION METHODOLOGYMedium Ad size Source
Television 30 seconds Infomedia
Newspapers A3, full colour Infomedia
Magazines Full page colour Infomedia
Radio 30 seconds Infomedia
Out of home Various Infomedia
Cinema 30 seconds –Internet Banner 468x60 –
Audience TV NewspapersAdults People 18+ ABC People 18+ ABCMen Men 18+ ABC Men 18+ ABCWomen Women 18+ ABC Women 18+ ABCKids Kids 3-11 ABC Kids 3-11 ABCMain shoppers Housewife ABC Housewife ABCYoung adults People 12-17 ABC People 12-17 ABCUpmarket adults People 18+ AB People 18+ ABBusinessmen – –

ECUADOR 2016
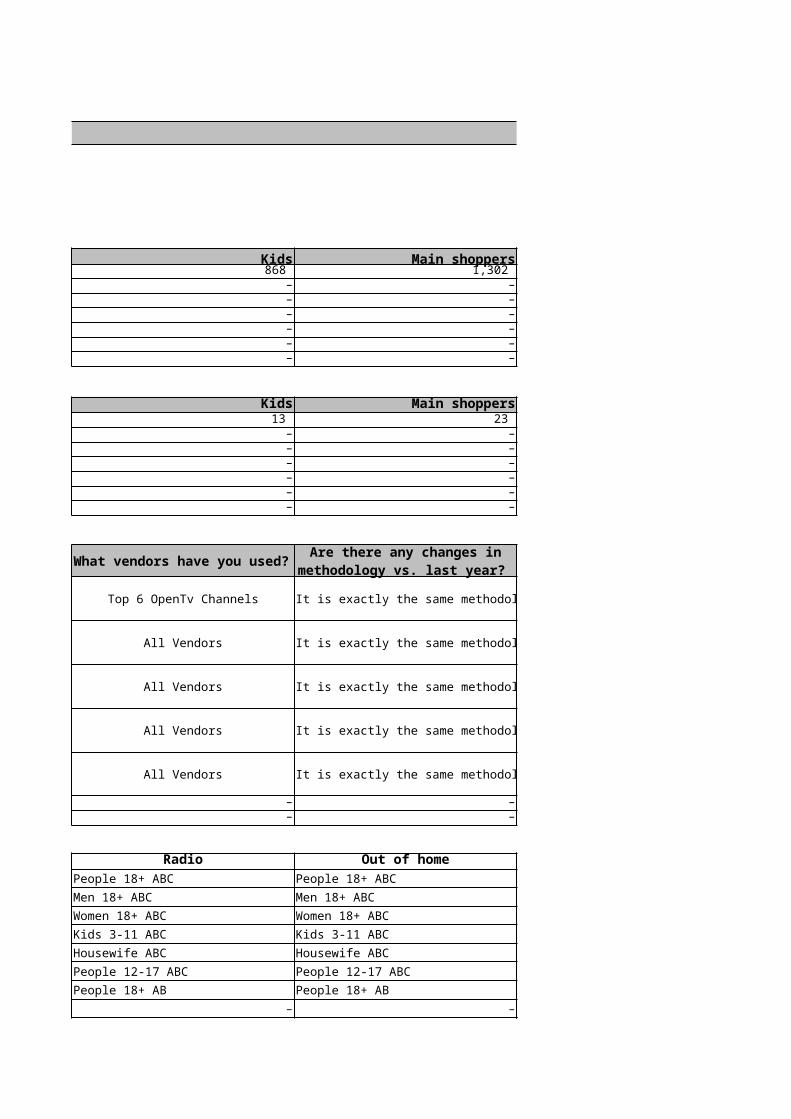
Women Kids Main shoppers 1,740 868 1,302 1,505 – – 1,505 – – 1,505 – –
1,505 – –– – –– – –
Women Kids Main shoppers29 13 23
-136 – –-136 – –-136 – –-136 – –
– – –– – –
Top 6 OpenTv Channels It is exactly the same methodology.
All Vendors It is exactly the same methodology.
All Vendors It is exactly the same methodology.
All Vendors It is exactly the same methodology.
All Vendors It is exactly the same methodology.
– – –– – –
Magazines Radio Out of homePeople 18+ ABC People 18+ ABC People 18+ ABCMen 18+ ABC Men 18+ ABC Men 18+ ABCWomen 18+ ABC Women 18+ ABC Women 18+ ABCKids 3-11 ABC Kids 3-11 ABC Kids 3-11 ABCHousewife ABC Housewife ABC Housewife ABCPeople 12-17 ABC People 12-17 ABC People 12-17 ABCPeople 18+ AB People 18+ AB People 18+ AB
– – –
CPM calculation methodology
What vendors have you used?
Are there any changes in methodology vs. last year?
Estimated Investment divided by People Reached using Universe,
Grps / Grxs.Estimated Investment divided by People Reached using Universe,
Grps / Grxs.Estimated Investment divided by People Reached using Universe,
Grps / Grxs.Estimated Investment divided by People Reached using Universe,
Grps / Grxs.Estimated Investment divided by People Reached using Universe,
Grps / Grxs.
ECUADOR 2016
Young adults Upmarket adults Businessmen 595 1,901 – 524 1,826 – 524 1,826 – 524 1,826 –
524 1,826 –– – –– – –
Young adults Upmarket adults Businessmen7 50 –
10 35 –10 35 –10 35 –10 35 –
– – –– – –
–
–
–
–
–––
Cinema Internet– –– –– –– –– –– –– –– –
What assumptions have you made?

Country:
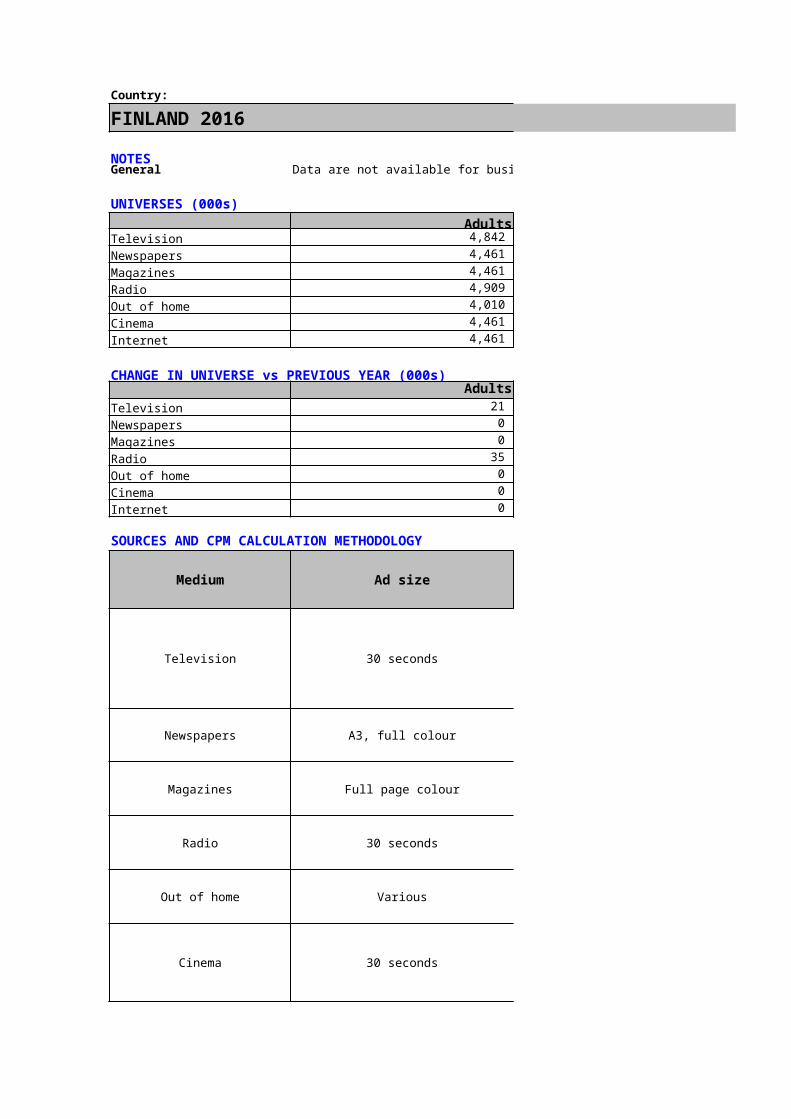
FINLAND 2016
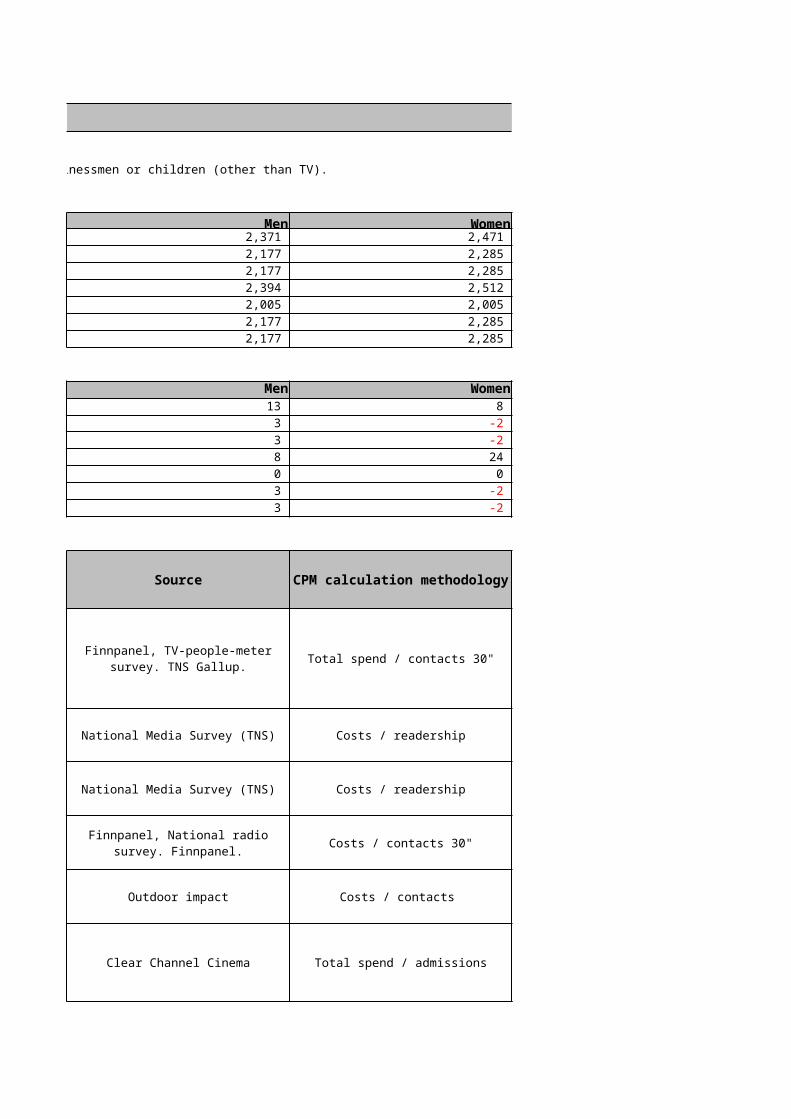
NOTESGeneral Data are not available for businessmen or children (other than TV).
UNIVERSES (000s)Adults Men
Television 4,842 2,371 Newspapers 4,461 2,177 Magazines 4,461 2,177 Radio 4,909 2,394 Out of home 4,010 2,005 Cinema 4,461 2,177 Internet 4,461 2,177
CHANGE IN UNIVERSE vs PREVIOUS YEAR (000s)Adults Men
Television 21 13 Newspapers 0 3 Magazines 0 3 Radio 35 8 Out of home 0 0 Cinema 0 3 Internet 0 3
SOURCES AND CPM CALCULATION METHODOLOGY
Medium Ad size Source
Television 30 seconds
Newspapers A3, full colour National Media Survey (TNS)
Magazines Full page colour National Media Survey (TNS)
Radio 30 seconds
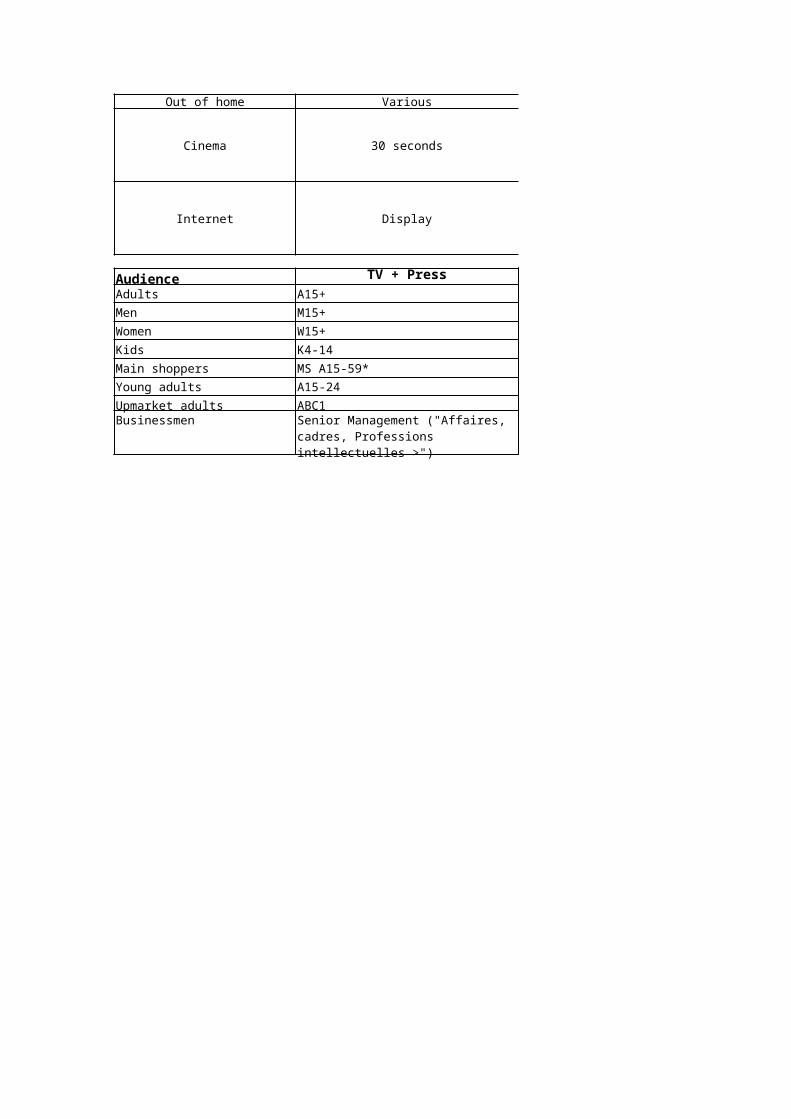
Out of home Various Outdoor impact
Cinema 30 seconds Clear Channel Cinema
Finnpanel, TV-people-meter survey. TNS Gallup.
Finnpanel, National radio survey. Finnpanel.
Internet Banner 468x60 TNS Metrix
Audience Television NewspapersAdults All 10+ All 12+Men Men 10+ Men 12+Women Women 10+ Women 12+Kids All 4-14Main shoppers HH Main shopper < 50 HH Main shopper < 50Young adults All 15-34 All 15-34Upmarket adults White collar (upper) White collar (upper)Businessmen
FINLAND 2016
Data are not available for businessmen or children (other than TV).
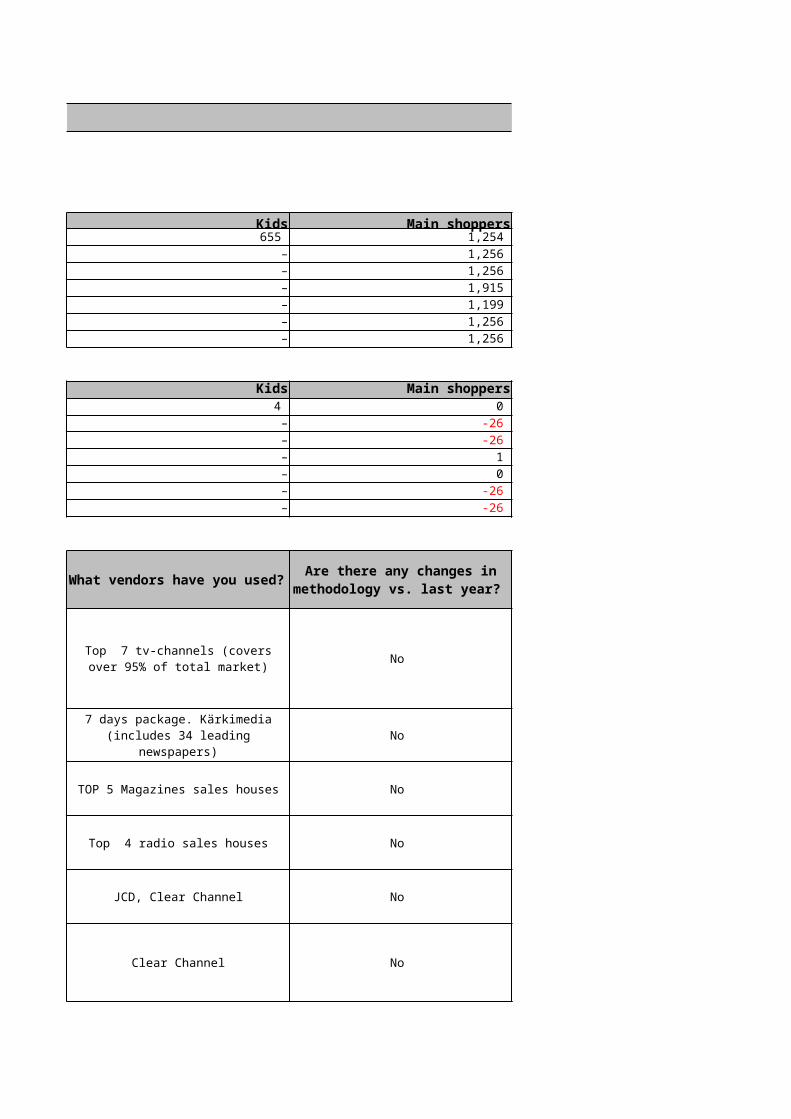
Women Kids Main shoppers 2,471 655 1,254 2,285 – 1,256 2,285 – 1,256 2,512 – 1,915 2,005 – 1,199 2,285 – 1,256 2,285 – 1,256
Women Kids Main shoppers8 4 0
-2 – -26 -2 – -26 24 – 1 0 – 0
-2 – -26 -2 – -26
Total spend / contacts 30" No
Costs / readership No
Costs / readership TOP 5 Magazines sales houses No
Costs / contacts 30" Top 4 radio sales houses No
Costs / contacts JCD, Clear Channel No
Total spend / admissions Clear Channel No
CPM calculation methodology
What vendors have you used?
Are there any changes in methodology vs. last year?
Top 7 tv-channels (covers over 95% of total market)
7 days package. Kärkimedia (includes 34 leading newspapers)
Costs / contacts Top 5 online sales houses No
Magazines Radio OOHAll 12+ All 9+ All 12-74Men 12+ Men 9+ Men 12-74Women 12+ Women 9+ Women 12-74
HH Main shopper < 50 HH Main shopper < 50 Main FMCG < 50All 15-34 All 15-34 All 15-34White collar (upper) White collar (upper) White collar

FINLAND 2016
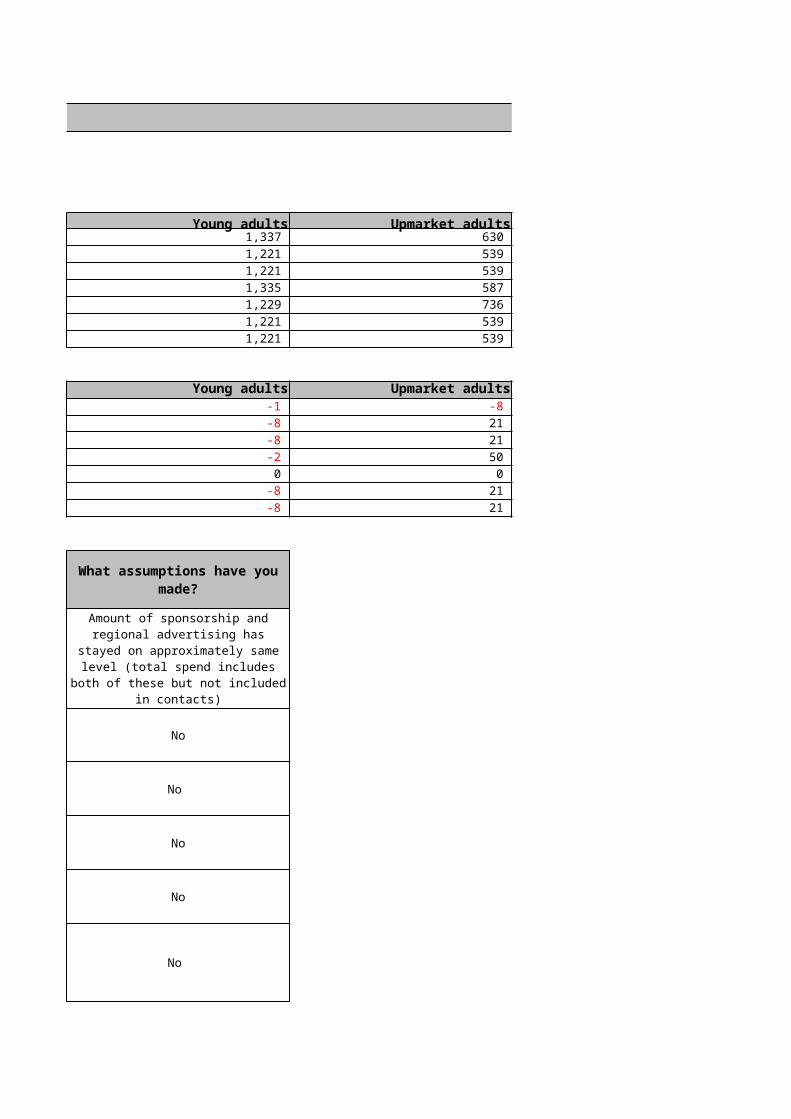
Young adults Upmarket adults Businessmen 1,337 630 – 1,221 539 – 1,221 539 – 1,335 587 – 1,229 736 – 1,221 539 – 1,221 539 –
Young adults Upmarket adults Businessmen-1 -8 –-8 21 –-8 21 –-2 50 –0 0 –
-8 21 –-8 21 –
No
No
No
No
No
What assumptions have you made?
Amount of sponsorship and regional advertising has stayed on
approximately same level (total spend includes both of these but
not included in contacts)

No
Cinema InternetAll 12+ All 12+Men 12+ Men 12+Women 12+ Women 12+
HH Main shopper < 50 HH Main shopper < 50All 15-34 All 15-34White collar (upper) White collar (upper)
Country:FRANCE 2016
NOTES
UNIVERSES (000s)Adults Men
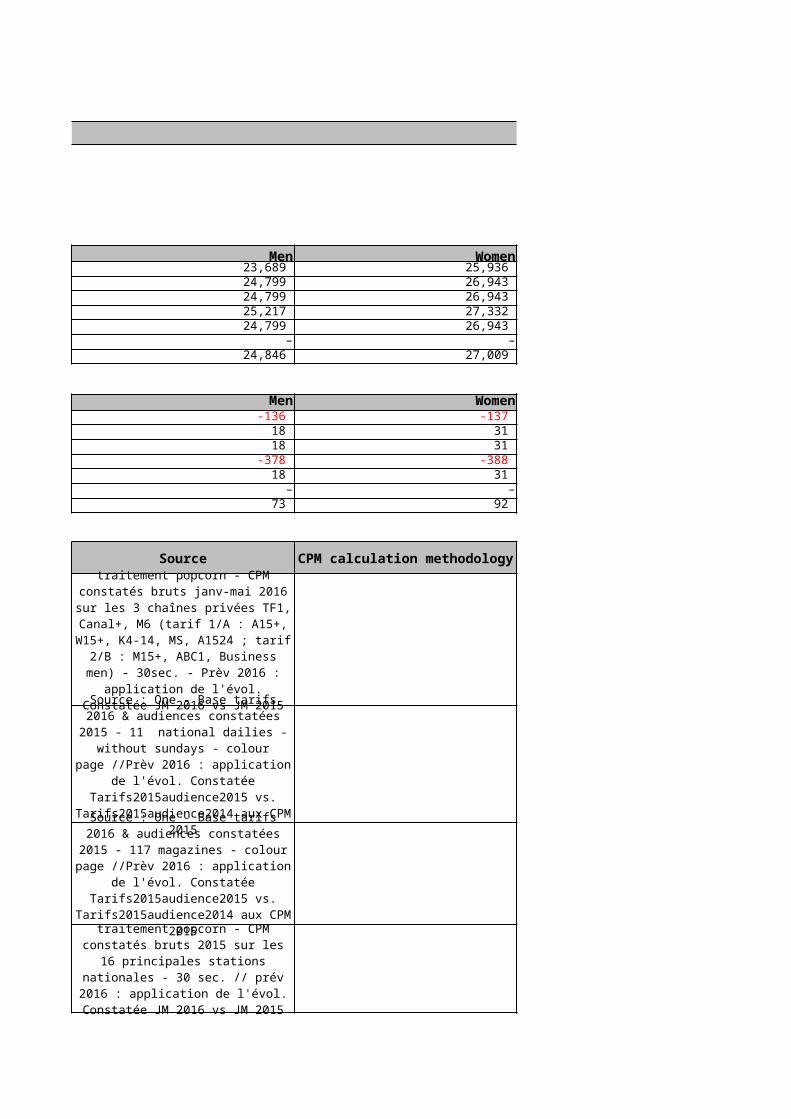
Television 49,625 23,689 Newspapers 51,742 24,799 Magazines 51,742 24,799 Radio 52,549 25,217 Out of home 51,742 24,799 Cinema 59,300 –Internet 51,855 24,846
CHANGE IN UNIVERSE vs PREVIOUS YEAR (000s)Adults Men
Television -273 -136 Newspapers 49 18 Magazines 49 18 Radio 276 -378 Out of home 49 18 Cinema 1,514 –Internet 165 73
SOURCES AND CPM CALCULATION METHODOLOGY
Medium Ad size Source
Television 30 seconds
Newspapers A3, full colour
Magazines Full page colour
Radio 30 seconds
Out of home Various
Source : Médiamétrie - traitement popcorn - CPM constatés bruts janv-mai 2016 sur les 3 chaînes privées TF1, Canal+, M6 (tarif 1/A : A15+, W15+, K4-14, MS, A1524 ; tarif 2/B : M15+, ABC1, Business men) - 30sec. - Prèv
2016 : application de l'évol. Constatée JM 2016 vs JM 2015
aux CPM 2015Source : One - Base tarifs 2016 & audiences constatées 2015 - 11
national dailies - without sundays - colour page //Prèv 2016 :
application de l'évol. Constatée Tarifs2015audience2015 vs.
Tarifs2015audience2014 aux CPM 2015
Source : One - Base tarifs 2016 & audiences constatées 2015 - 117 magazines - colour page //Prèv
2016 : application de l'évol. Constatée
Tarifs2015audience2015 vs. Tarifs2015audience2014 aux CPM
2015Source : Médiamétrie - traitement popcorn - CPM constatés bruts
2015 sur les 16 principales stations nationales - 30 sec. //
prév 2016 : application de l'évol. Constatée JM 2016 vs JM 2015
aux CPM2015

Cinema 30 seconds
Internet Display
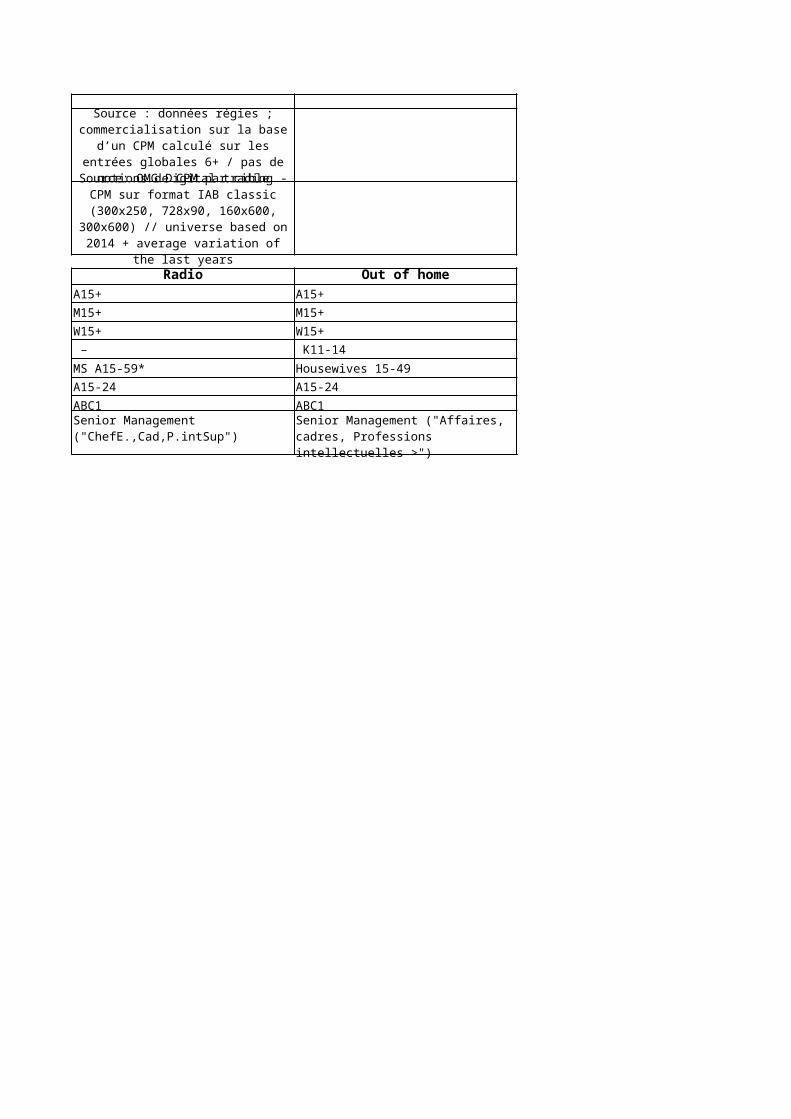
Audience TV + Press RadioAdults A15+ A15+Men M15+ M15+Women W15+ W15+Kids K4-14 – Main shoppers MS A15-59* MS A15-59*Young adults A15-24 A15-24Upmarket adults ABC1 ABC1Businessmen
Source : données régies ; commercialisation sur la base d’un
CPM calculé sur les entrées globales 6+ / pas de notions de
CPM par cibleSource: OMG Digital trading - CPM sur format IAB classic (300x250, 728x90, 160x600,
300x600) // universe based on 2014 + average variation of the
last years
Senior Management ("Affaires, cadres, Professions intellectuelles >")
Senior Management ("ChefE.,Cad,P.intSup")

FRANCE 2016
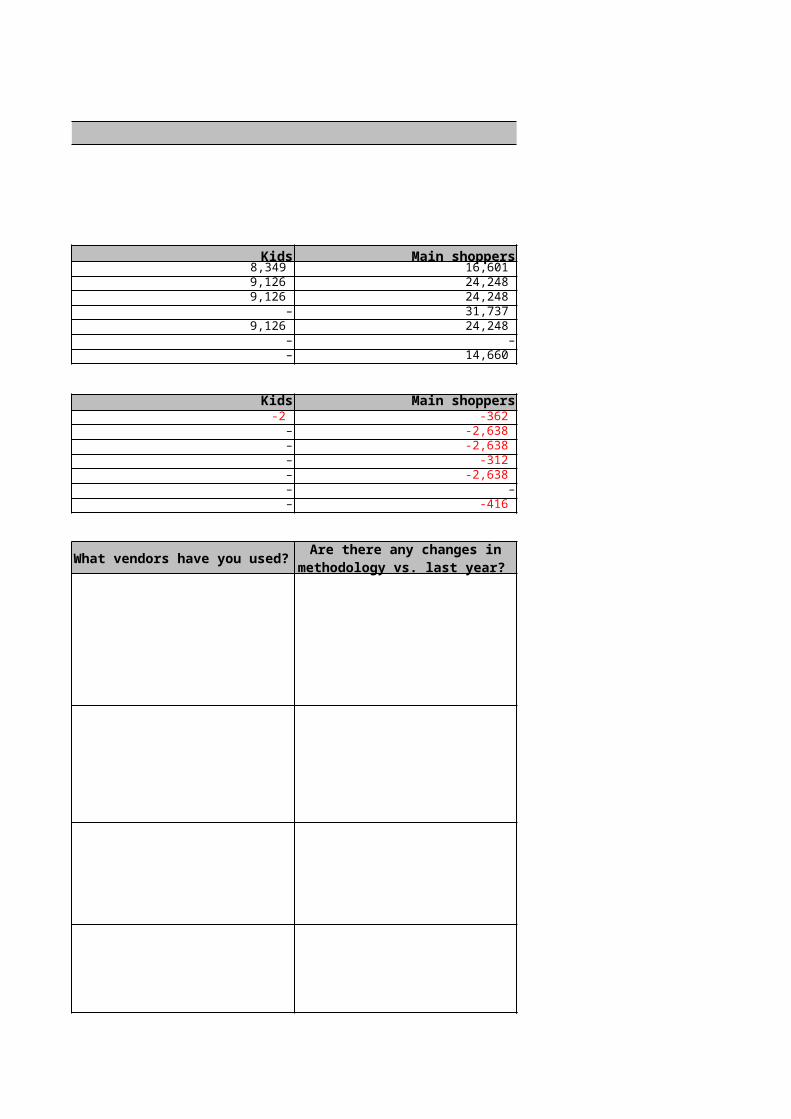
Women Kids Main shoppers 25,936 8,349 16,601 26,943 9,126 24,248 26,943 9,126 24,248 27,332 – 31,737 26,943 9,126 24,248
– – – 27,009 – 14,660
Women Kids Main shoppers-137 -2 -362
31 – -2,638 31 – -2,638
-388 – -312 31 – -2,638
– – –92 – -416
CPM calculation methodology
What vendors have you used?
Are there any changes in methodology vs. last year?
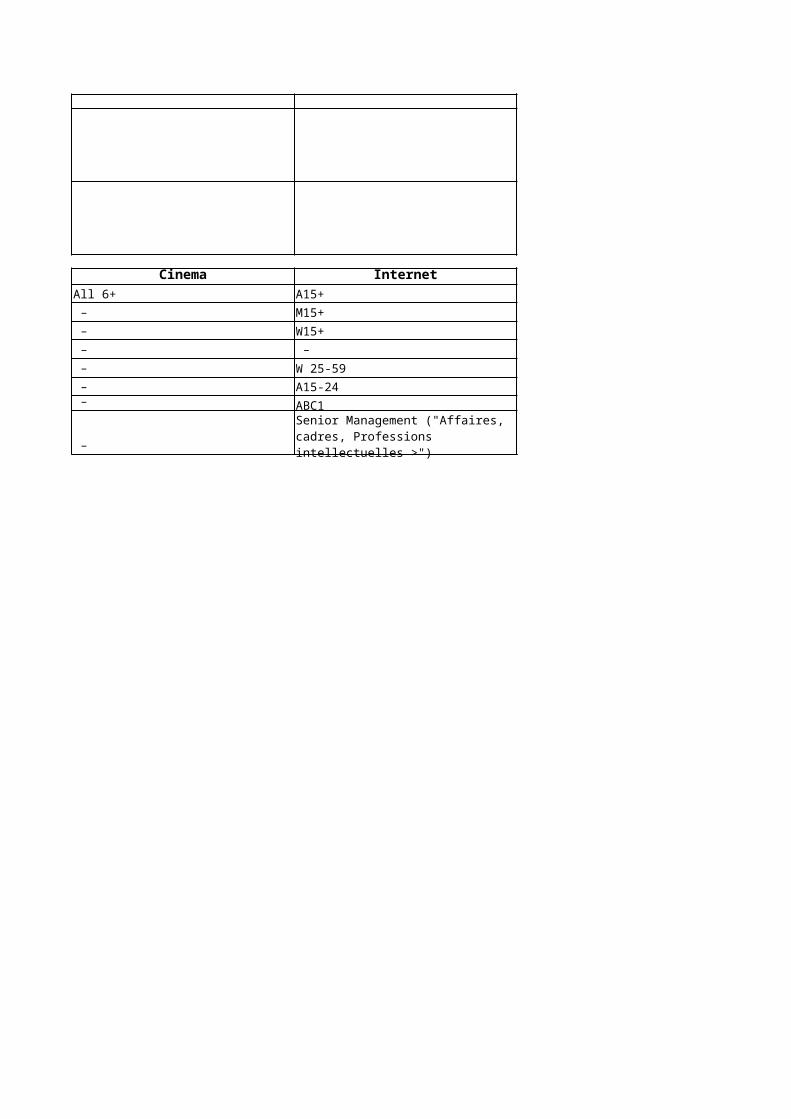
Out of home Cinema InternetA15+ All 6+ A15+M15+ – M15+W15+ – W15+
K11-14 – – Housewives 15-49 – W 25-59A15-24 – A15-24ABC1 – ABC1
–
Senior Management ("Affaires, cadres, Professions intellectuelles >")
Senior Management ("Affaires, cadres, Professions intellectuelles >")

FRANCE 2016
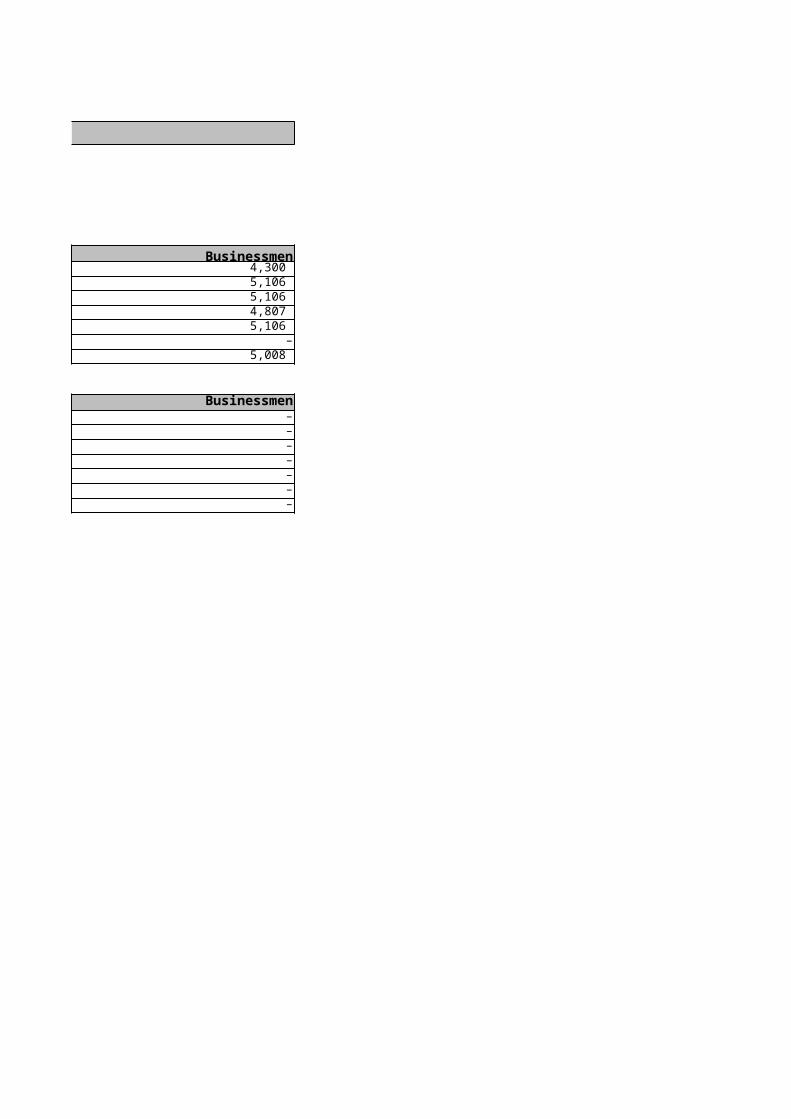
Young adults Upmarket adults Businessmen 6,909 12,437 4,300 7,272 13,630 5,106 7,272 13,630 5,106 7,782 13,429 4,807 7,272 13,630 5,106
– – – 7,302 13,556 5,008
Young adults Upmarket adults Businessmen13 -402 –
-24 -160 –-24 -160 –-44 -184 –-24 -160 –
– – –-15 -90 –
-0.56
-0.6
-0.56
-0.79
What assumptions have you made?
-0.65

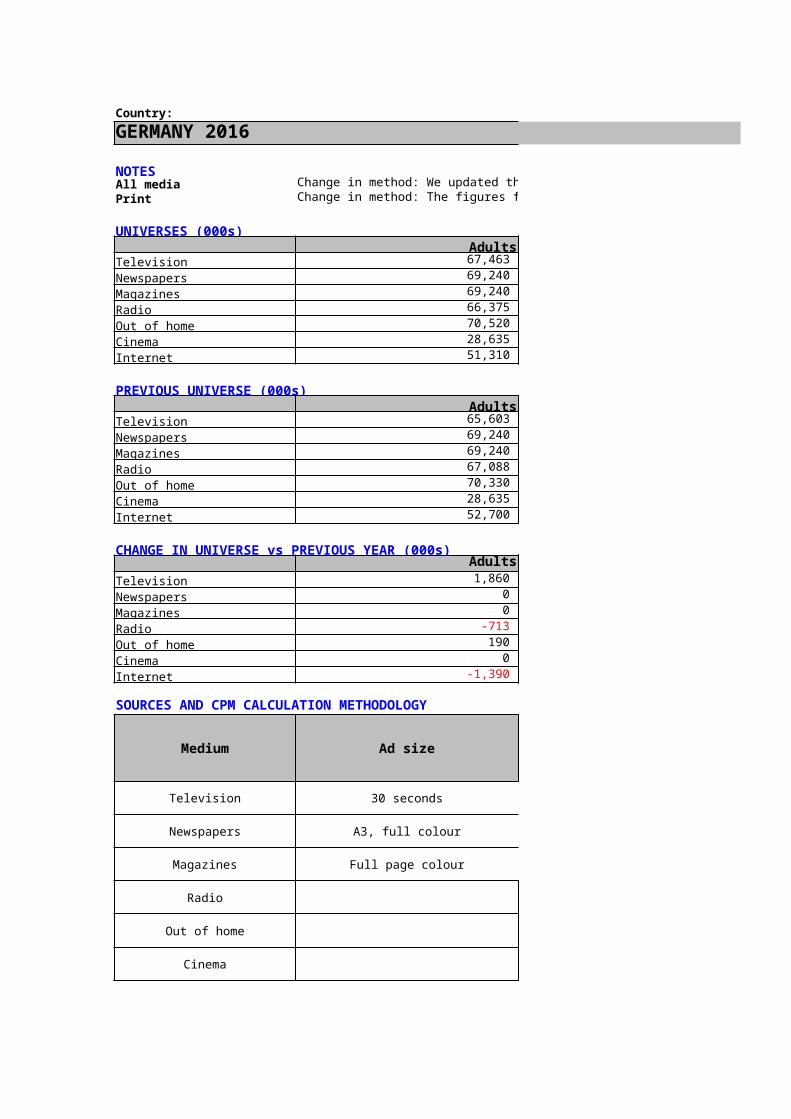
Country:GERMANY 2016
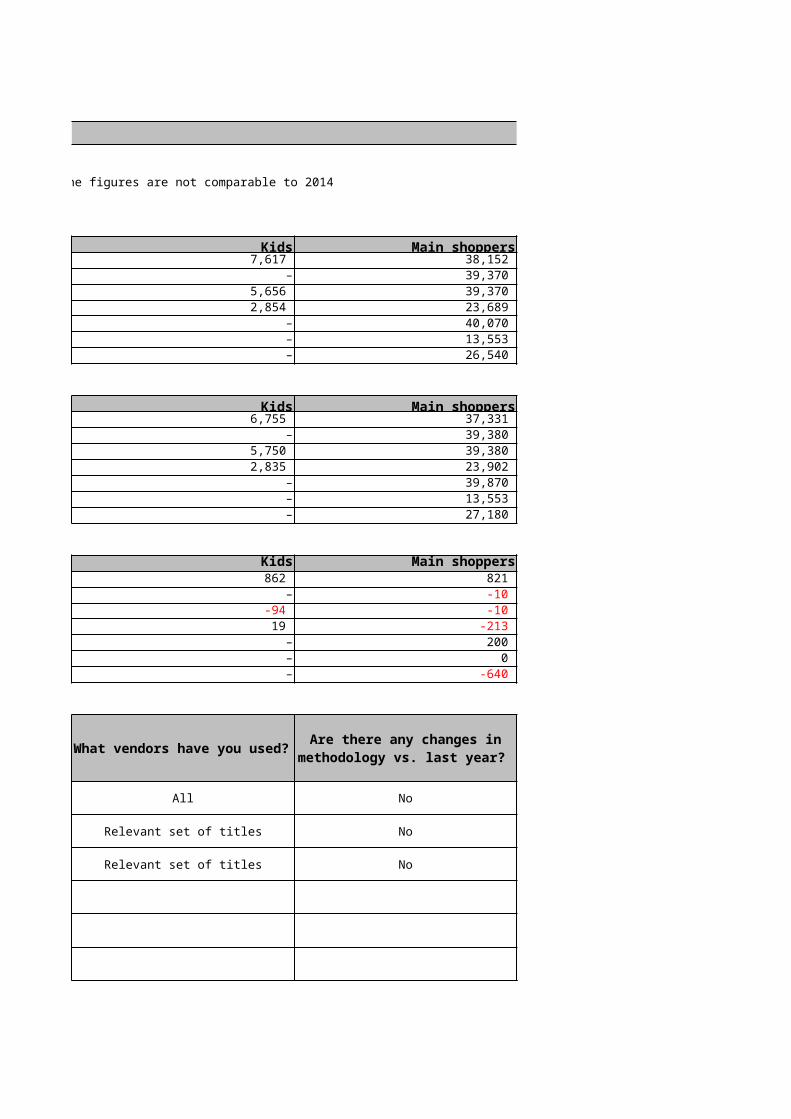
NOTESAll media Change in method: We updated the discounts corresponding to our inflation spending ticker. The figures are not comparable to 2014Print Change in method: The figures for Newspapers are on 1.000er page corner and full colour.
UNIVERSES (000s)Adults Men
Television 67,463 32,748 Newspapers 69,240 33,810 Magazines 69,240 33,810 Radio 66,375 32,349 Out of home 70,520 34,590 Cinema 28,635 14,727 Internet 51,310 26,590
PREVIOUS UNIVERSE (000s)Adults Men
Television 65,603 32,030 Newspapers 69,240 33,810 Magazines 69,240 33,810 Radio 67,088 32,809 Out of home 70,330 34,460 Cinema 28,635 14,727 Internet 52,700 27,500
CHANGE IN UNIVERSE vs PREVIOUS YEAR (000s)Adults Men
Television 1,860 718 Newspapers 0 0 Magazines 0 0 Radio -713 -460 Out of home 190 130 Cinema 0 0 Internet -1,390 -910
SOURCES AND CPM CALCULATION METHODOLOGY
Medium Ad size Source
Television 30 seconds AGF GFK TV Scope
Newspapers A3, full colour MA Presse I 2016
Magazines Full page colour MA Presse I 2016
Radio
Out of home
Cinema
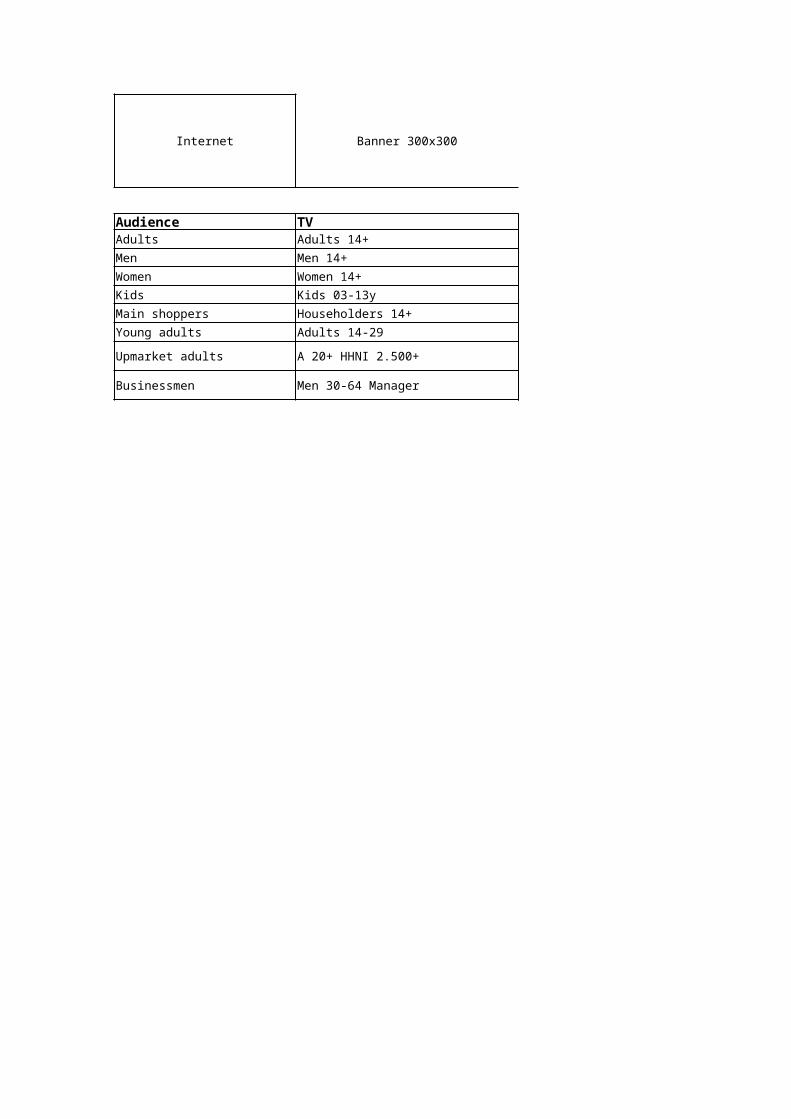
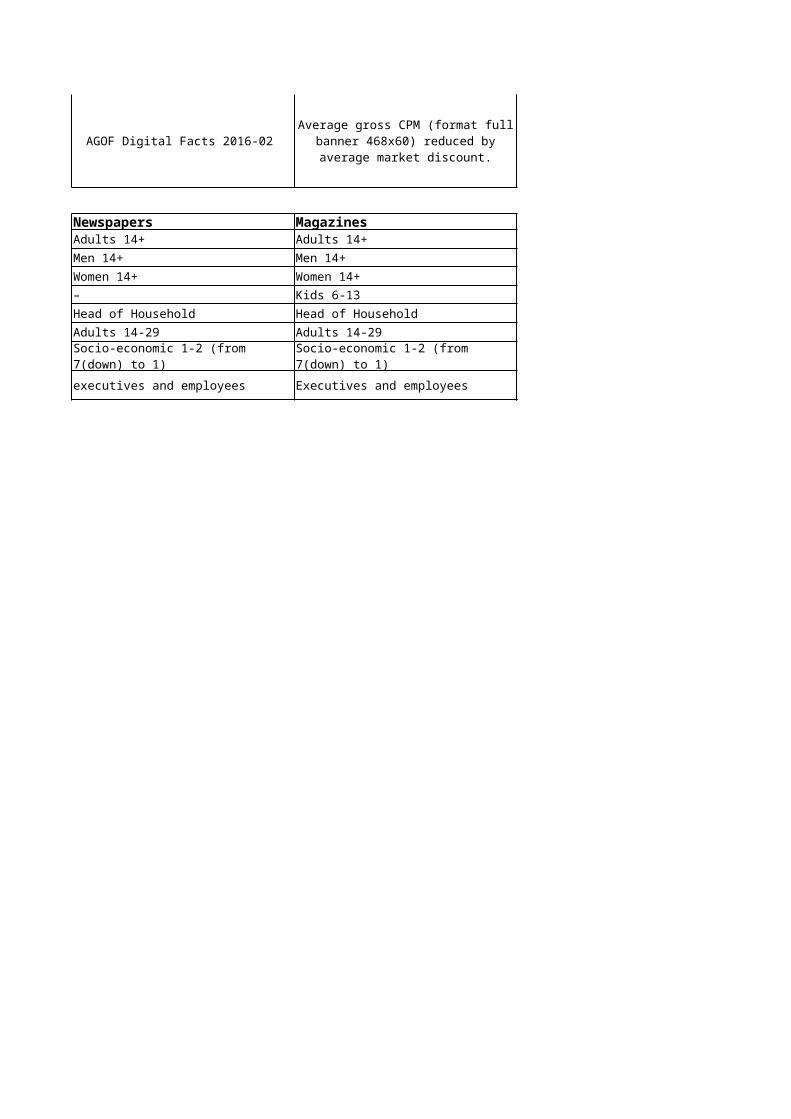
Internet Banner 300x300 AGOF Digital Facts 2016-02
Audience TV NewspapersAdults Adults 14+ Adults 14+Men Men 14+ Men 14+Women Women 14+ Women 14+Kids Kids 03-13y –Main shoppers Householders 14+ Head of HouseholdYoung adults Adults 14-29 Adults 14-29
Upmarket adults A 20+ HHNI 2.500+
Businessmen Men 30-64 Manager executives and employees
Socio-economic 1-2 (from 7(down) to 1)
GERMANY 2016
Change in method: We updated the discounts corresponding to our inflation spending ticker. The figures are not comparable to 2014Change in method: The figures for Newspapers are on 1.000er page corner and full colour.
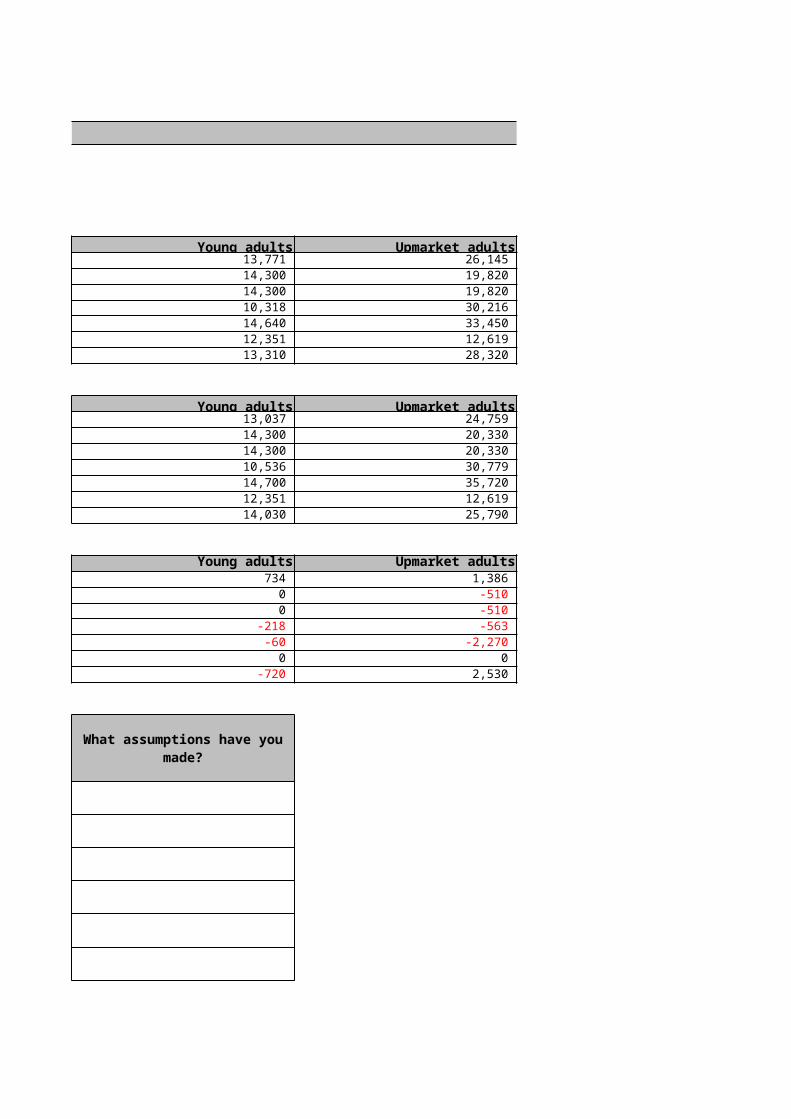
Women Kids Main shoppers 34,714 7,617 38,152 35,430 – 39,370 35,430 5,656 39,370 34,027 2,854 23,689 35,930 – 40,070 13,908 – 13,553 24,720 – 26,540
Women Kids Main shoppers 33,573 6,755 37,331 35,430 – 39,380 35,430 5,750 39,380 34,280 2,835 23,902 35,860 – 39,870 13,908 – 13,553 25,210 – 27,180
Women Kids Main shoppers1,141 862 821
0 – -10 0 -94 -10
-253 19 -213 70 – 200 0 – 0
-490 – -640
All No
1.0000er page corner Relevant set of titles No
full page Relevant set of titles No
CPM calculation methodology
What vendors have you used?
Are there any changes in methodology vs. last year?
9 main stations 06 - 01 oclock 30"

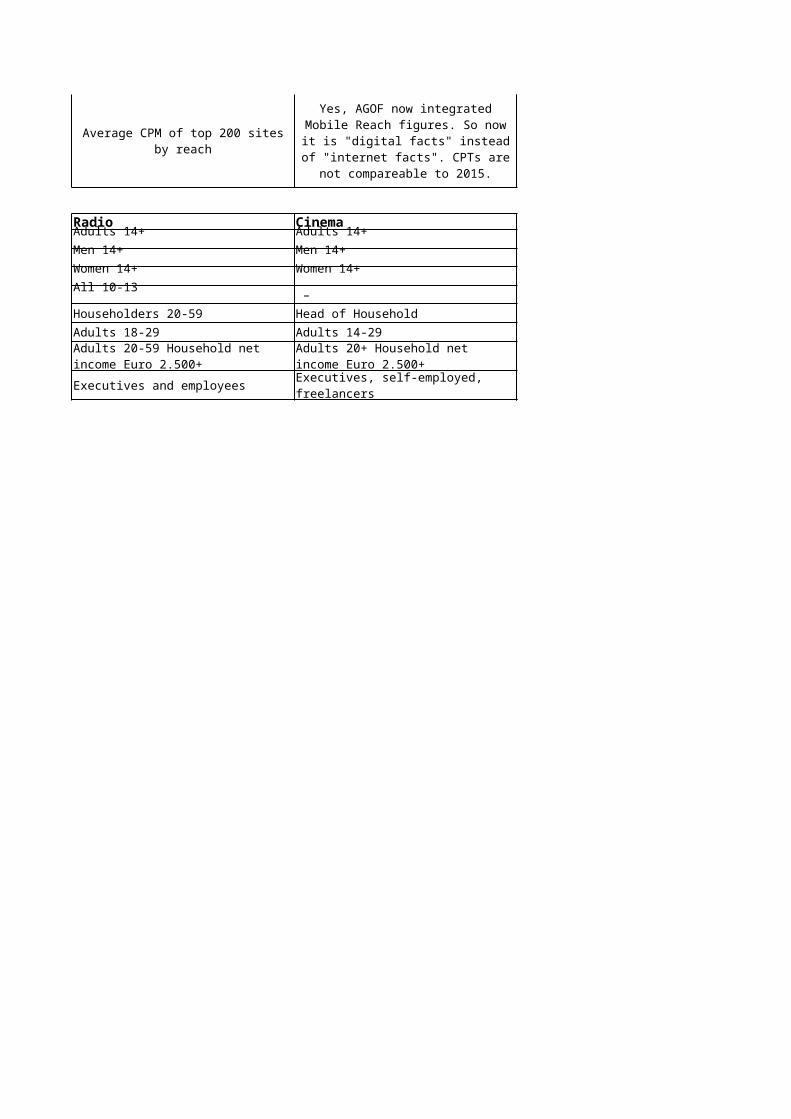
Magazines Radio CinemaAdults 14+Men 14+Women 14+Kids 6-13 – Head of Household Householders 20-59 Head of HouseholdAdults 14-29 Adults 18-29 Adults 14-29
Executives and employees Executives and employees
Average gross CPM (format full banner 468x60) reduced by average market discount.
Average CPM of top 200 sites by reach
Yes, AGOF now integrated Mobile Reach figures. So now it is "digital facts" instead of "internet facts". CPTs are not compareable to
2015.
Adults 14+ Adults 14+Men 14+ Men 14+Women 14+ Women 14+All 10-13
Socio-economic 1-2 (from 7(down) to 1)
Adults 20-59 Household net income Euro 2.500+
Adults 20+ Household net income Euro 2.500+Executives, self-employed, freelancers
GERMANY 2016
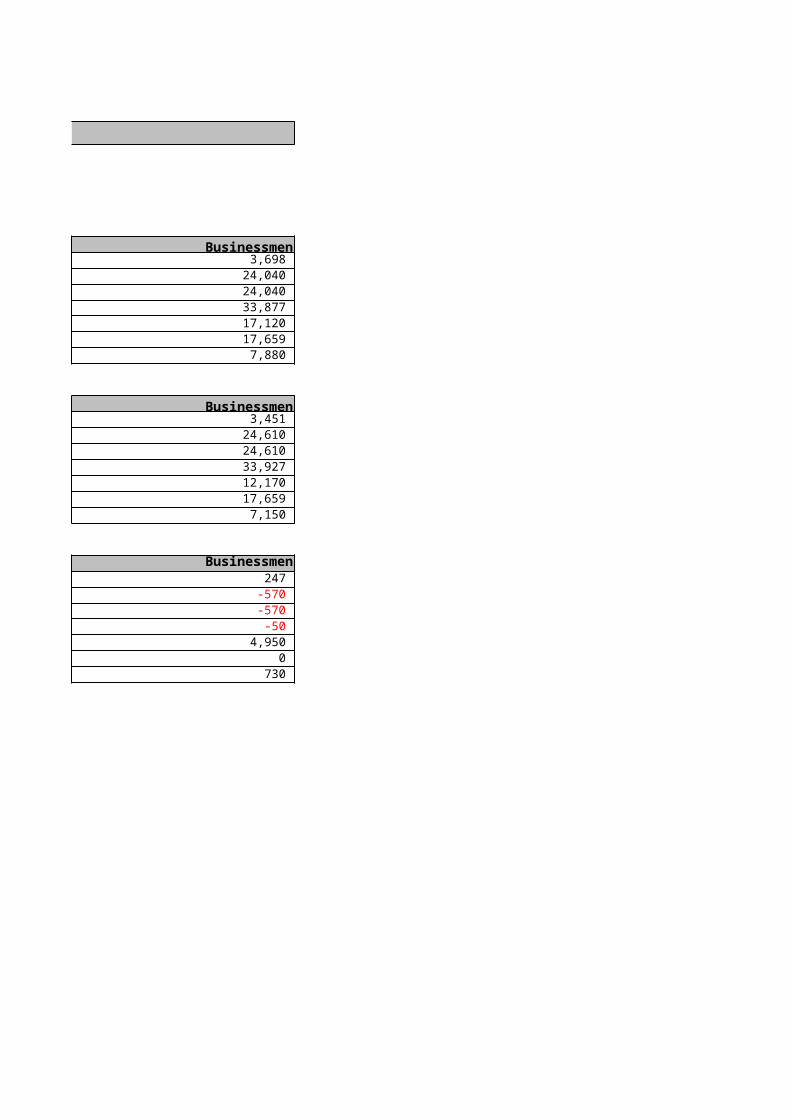
Young adults Upmarket adults Businessmen 13,771 26,145 3,698 14,300 19,820 24,040 14,300 19,820 24,040 10,318 30,216 33,877 14,640 33,450 17,120 12,351 12,619 17,659 13,310 28,320 7,880
Young adults Upmarket adults Businessmen 13,037 24,759 3,451 14,300 20,330 24,610 14,300 20,330 24,610 10,536 30,779 33,927 14,700 35,720 12,170 12,351 12,619 17,659 14,030 25,790 7,150
Young adults Upmarket adults Businessmen734 1,386 247
0 -510 -570 0 -510 -570
-218 -563 -50 -60 -2,270 4,950
0 0 0 -720 2,530 730
What assumptions have you made?
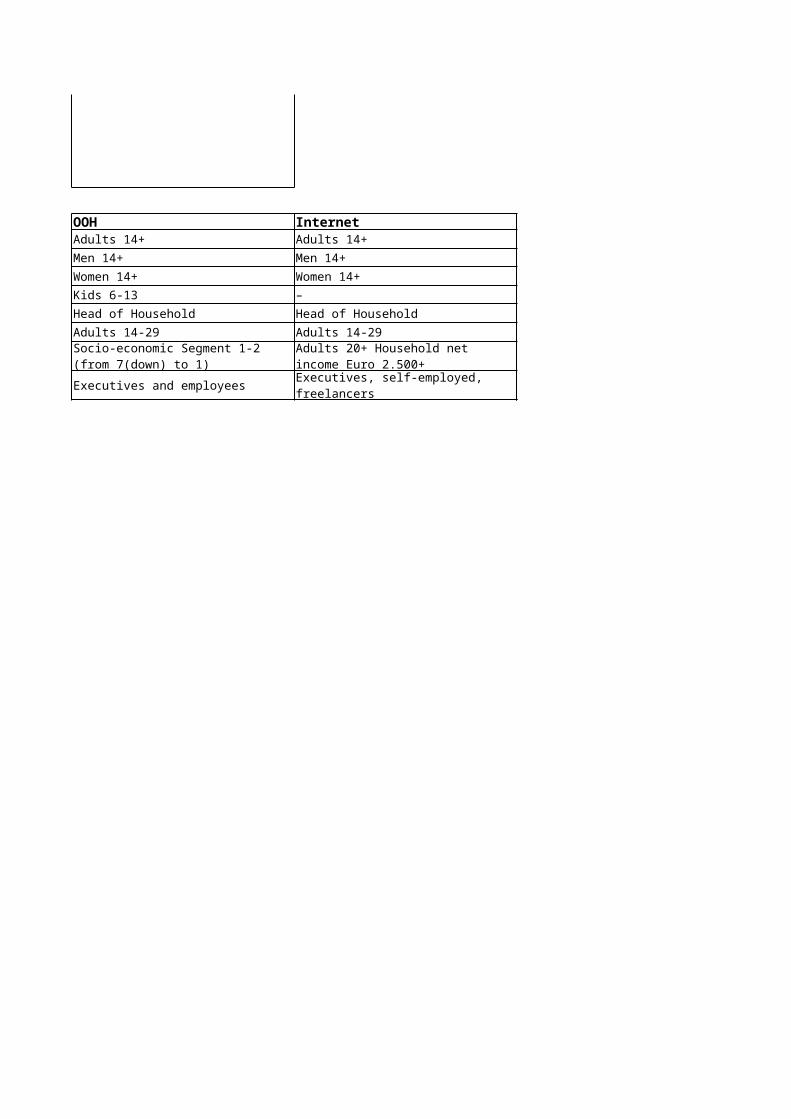
OOH InternetAdults 14+ Adults 14+Men 14+ Men 14+Women 14+ Women 14+Kids 6-13 –Head of Household Head of HouseholdAdults 14-29 Adults 14-29
Executives and employees
Socio-economic Segment 1-2 (from 7(down) to 1)
Adults 20+ Household net income Euro 2.500+Executives, self-employed, freelancers
Country:
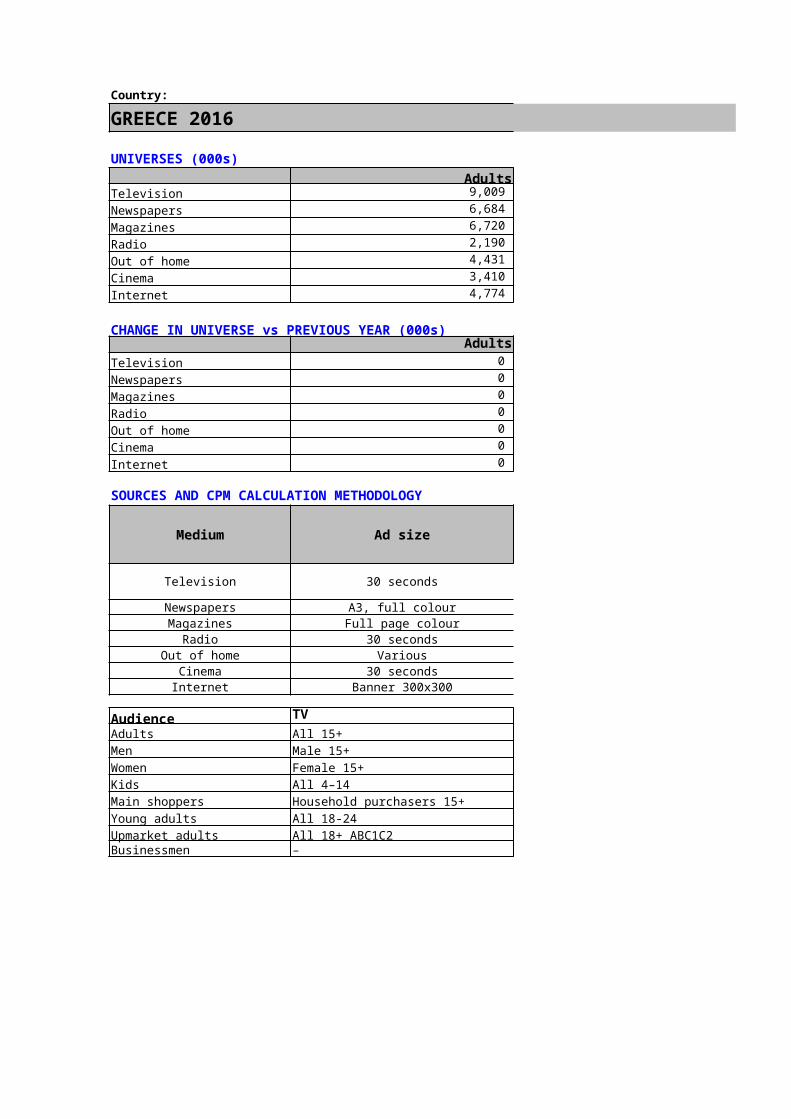
GREECE 2016
UNIVERSES (000s)Adults Men
Television 9,009 4,354 Newspapers 6,684 3,289 Magazines 6,720 3,304 Radio 2,190 1,137 Out of home 4,431 2,227 Cinema 3,410 1,653 Internet 4,774 2,516
CHANGE IN UNIVERSE vs PREVIOUS YEAR (000s)Adults Men
Television 0 0 Newspapers 0 0 Magazines 0 0 Radio 0 0 Out of home 0 0 Cinema 0 0 Internet 0 0
SOURCES AND CPM CALCULATION METHODOLOGY
Medium Ad size Source
Television 30 seconds Nielsen Audience Measurement
Newspapers A3, full colour –Magazines Full page colour –
Radio 30 seconds –Out of home Various –
Cinema 30 seconds –Internet Banner 300x300 –
Audience TV OOHAdults All 15+ All 18-64Men Male 15+ Male 18-64Women Female 15+ Female 18-64Kids All 4–14 –Main shoppers Household purchasers 15+ Household purchasers 18-64Young adults All 18-24 All 18-24Upmarket adults All 18+ ABC1C2 All 18+ ABC1C2Businessmen – –
GREECE 2016
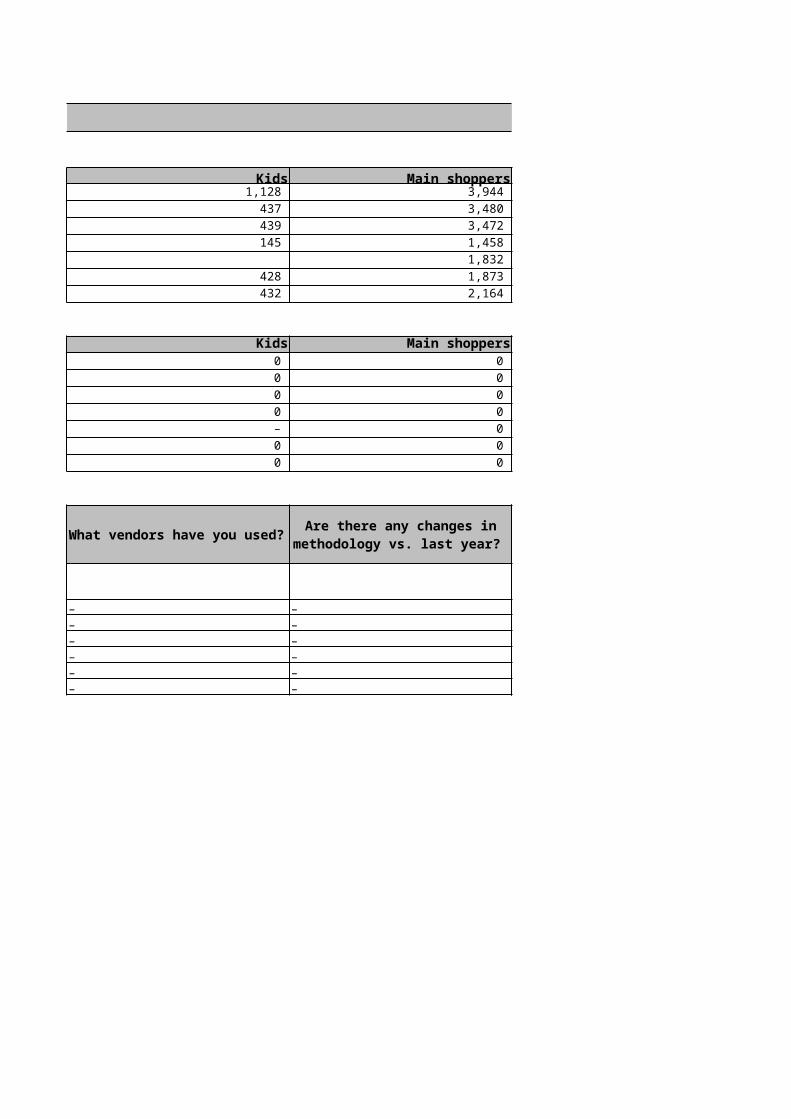
Women Kids Main shoppers 4,654 1,128 3,944 3,395 437 3,480 3,417 439 3,472 1,053 145 1,458 2,205 1,832 1,757 428 1,873 2,259 432 2,164
Women Kids Main shoppers0 0 0 0 0 0 0 0 0 0 0 0 0 – 0 0 0 0 0 0 0
– – –– – –– – –– – –– – –– – –
All other mediaAll 18-70Male 18-70Female 18-70All 13-17Household purchasers 18-70All 18-24All 18+ ABC1C2–
CPM calculation methodology
What vendors have you used?
Are there any changes in methodology vs. last year?
CPR per sec *100*30 /target universe population

GREECE 2016
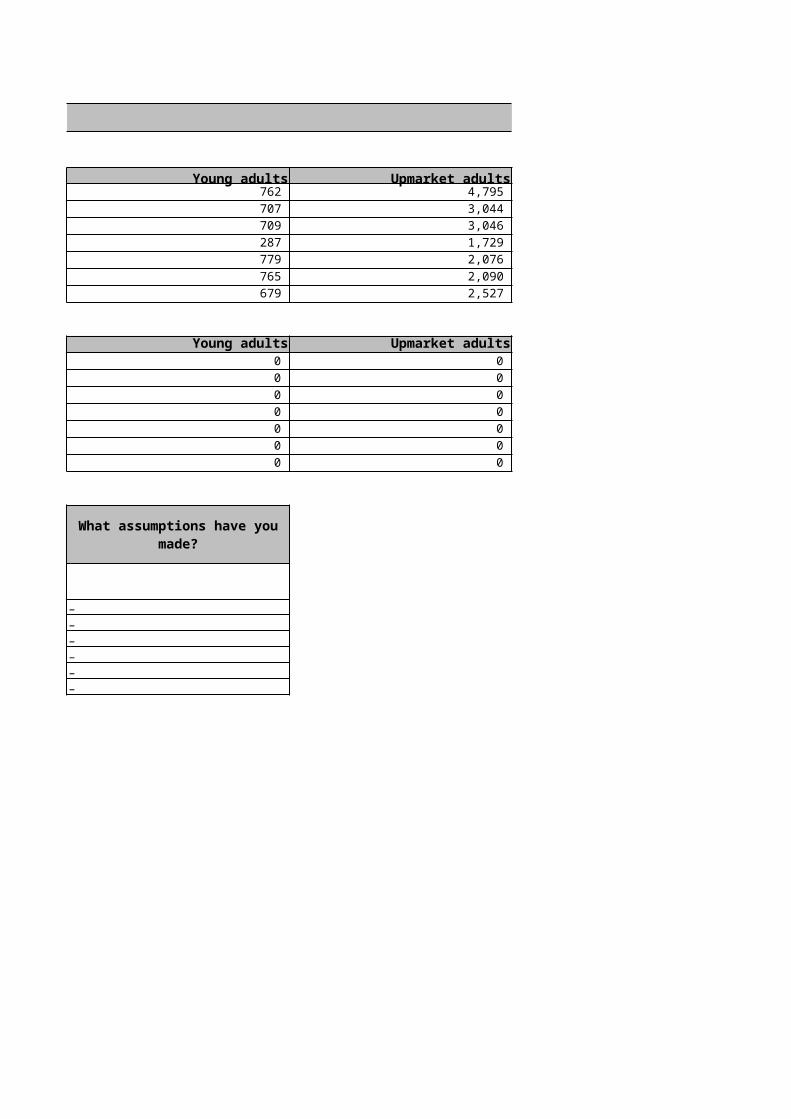
Young adults Upmarket adults Businessmen 762 4,795 – 707 3,044 – 709 3,046 – 287 1,729 – 779 2,076 – 765 2,090 – 679 2,527 –
Young adults Upmarket adults Businessmen0 0 – 0 0 – 0 0 – 0 0 – 0 0 – 0 0 – 0 0 –
––––––
What assumptions have you made?

`
Country:HONG KONG 2016
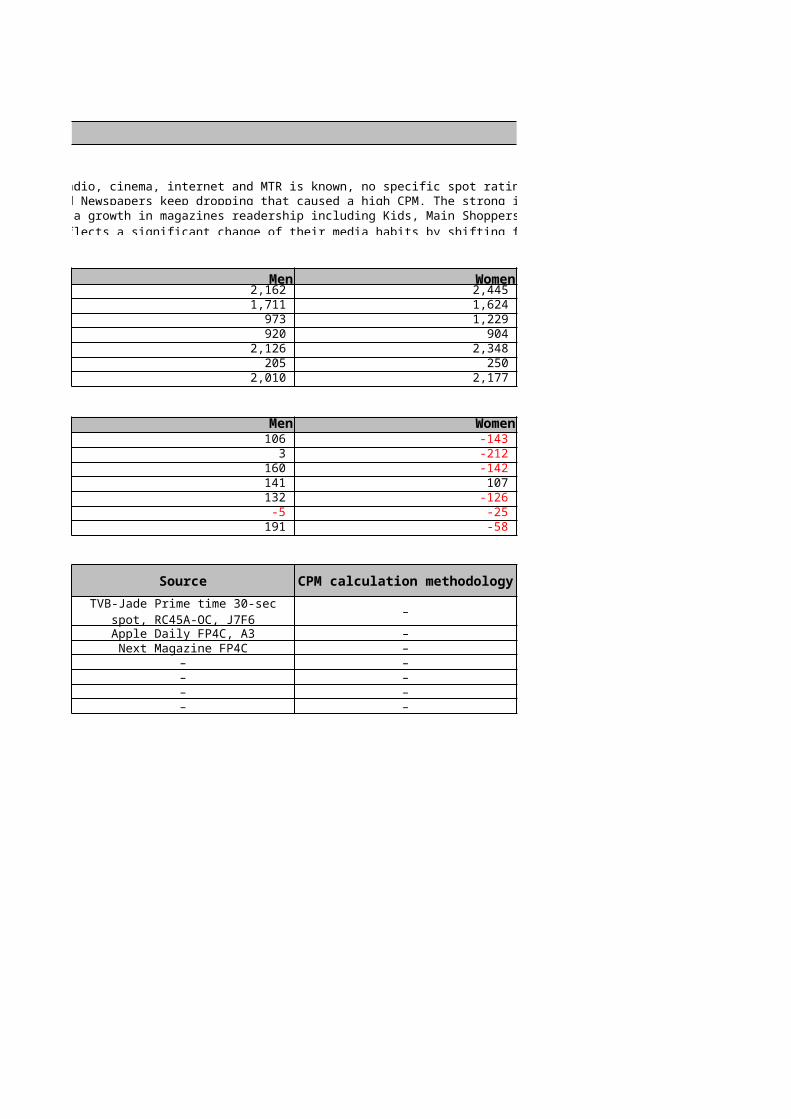
NOTESGeneral While overall penetration of radio, cinema, internet and MTR is known, no specific spot rating is available. Therefore, CPM cannot be provided for these media.TV/Newspapers The media consumption of TV and Newspapers keep dropping that caused a high CPM. The strong inflation is due to this drop in target consumption on TV and NewspaperMagazines
UNIVERSES (000s)Err:509 Men
Television 4,607 2,162 Newspapers 3,336 1,711 Magazines 2,201 973 Radio 1,825 920 Out of home 4,474 2,126 Cinema 456 205 Internet 4,186 2,010
CHANGE IN UNIVERSE vs PREVIOUS YEAR (000s)Adults Men
Television -37 106 Newspapers -208 3 Magazines 17 160 Radio 250 141 Out of home 7 132 Cinema -29 -5 Internet 132 191
SOURCES AND CPM CALCULATION METHODOLOGY
Medium Ad size Source
Television 30 seconds
Newspapers A3, full colour Apple Daily FP4C, A3Magazines Full page colour Next Magazine FP4C
Radio 30 seconds –Out of home Various –
Cinema 30 seconds –Internet Banner 300x300 –
Audience All available mediaAdults People 18-64Men Male 18-64Women Female 18-64Kids Parents with Kids 4-15Main shoppers Shopping Decision MakersYoung adults People 18-34Upmarket adults People 18-64, MHI$40K+Businessmen PMEPT
Several target groups recorded a growth in magazines readership including Kids, Main Shoppers and Businessmen while the magazine readership of Young Adults keep dropping. That reflects a significant change of their media habits by shifting from Offline to Online media.
TVB-Jade Prime time 30-sec spot, RC45A-OC, J7F6
HONG KONG 2016
While overall penetration of radio, cinema, internet and MTR is known, no specific spot rating is available. Therefore, CPM cannot be provided for these media.The media consumption of TV and Newspapers keep dropping that caused a high CPM. The strong inflation is due to this drop in target consumption on TV and Newspaper
Women Kids Main shoppers 2,445 1,167 2,742 1,624 804 1,948 1,229 614 1,493 904 437 1,157 2,348 1,116 2,642 250 123 271 2,177 1,161 2,435
Women Kids Main shoppers-143 150 339 -212 100 116 -142 75 209 107 75 221
-126 175 386 -25 30 45 -58 183 439
– – –
– – –– – –– – –– – –– – –– – –
Several target groups recorded a growth in magazines readership including Kids, Main Shoppers and Businessmen while the magazine readership of Young Adults keep dropping. That reflects a significant change of their media habits by shifting from Offline to Online media.
CPM calculation methodology
What vendors have you used?
Are there any changes in methodology vs. last year?

HONG KONG 2016
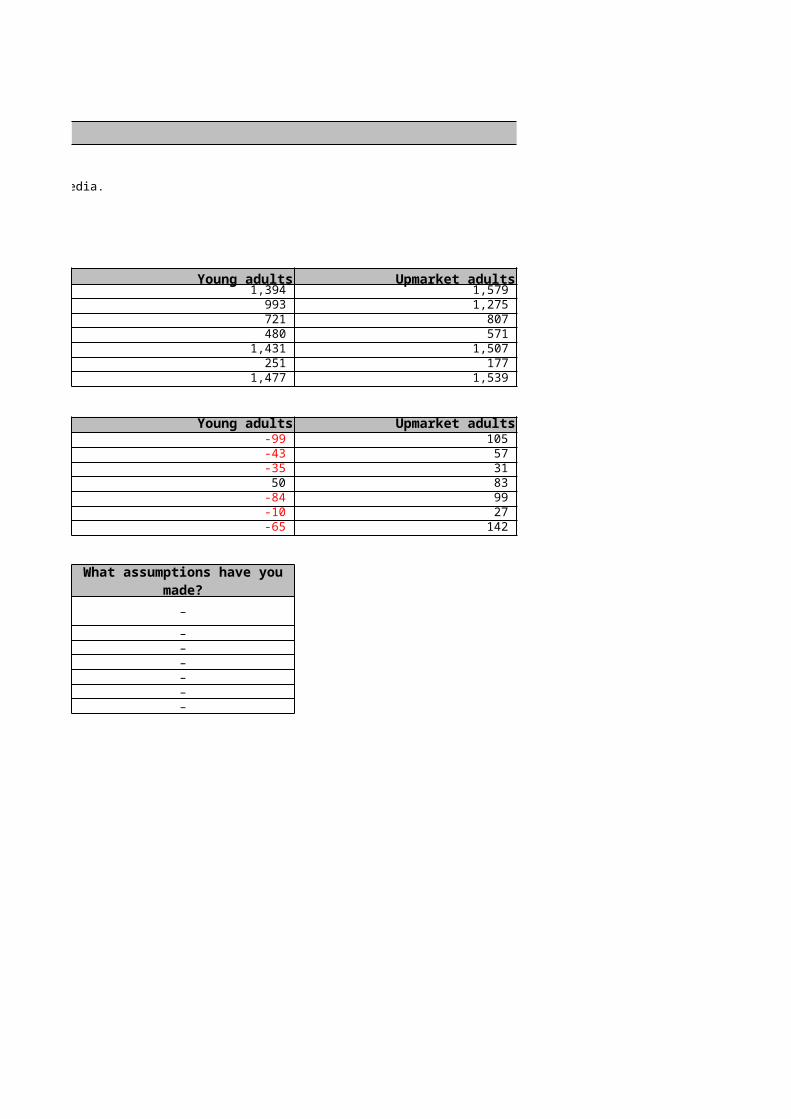
Young adults Upmarket adults Businessmen 1,394 1,579 1,095 993 1,275 861 721 807 591 480 571 449 1,431 1,507 1,059 251 177 135 1,477 1,539 1,102
Young adults Upmarket adults Businessmen-99 105 -22 -43 57 -64 -35 31 23 50 83 53
-84 99 -11 -10 27 2 -65 142 9
–
––––––
What assumptions have you made?

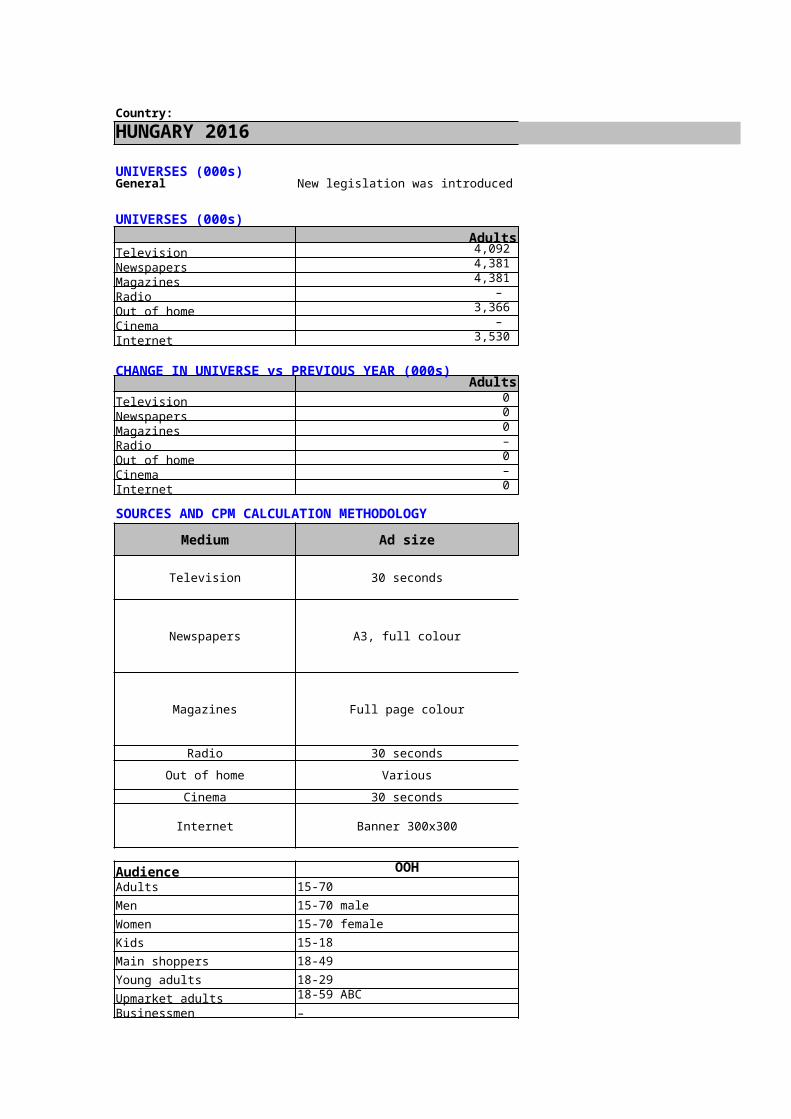
Country:HUNGARY 2016
UNIVERSES (000s)General New legislation was introduced in Hungary in 2015, which has affected our media buying process - in terms of prices, bonuses, etc. This has made it difficult to compare inflation figures in 2016 vs. 2015.
UNIVERSES (000s)Adults Men
Television 4,092 2,040 Newspapers 4,381 2,215 Magazines 4,381 2,215 Radio – – Out of home 3,366 1,598 Cinema – – Internet 3,530 1,701
CHANGE IN UNIVERSE vs PREVIOUS YEAR (000s)Adults Men
Television 0 0 Newspapers 0 0 Magazines 0 0 Radio – – Out of home 0 0 Cinema – – Internet 0 0
SOURCES AND CPM CALCULATION METHODOLOGY
Medium Ad size Source
Television 30 seconds AGB Hungary
Newspapers A3, full colour TGI/NOK
Magazines Full page colour TGI/NOK
Radio 30 seconds No source
Out of home Various SzondaIpsos
Cinema 30 seconds No source
Internet Banner 300x300 Gemius and OMG estimations
Audience OOH All other mediaAdults 15-70 A 18-49Men 15-70 male 18-49 maleWomen 15-70 female 18-49 femaleKids 15-18 CHD4-14Main shoppers 18-49 MS18-49Young adults 18-29 A18-29Upmarket adults 18-59 ABC A18-59 AB (p)Businessmen – A25-59 Manager, self-employed
HUNGARY 2016
New legislation was introduced in Hungary in 2015, which has affected our media buying process - in terms of prices, bonuses, etc. This has made it difficult to compare inflation figures in 2016 vs. 2015.
Women Kids Main shoppers 2,051 1,053 1,676 2,166 – 2,825 2,166 – 2,825
– – – 1,768 205 2,057
– – – 1,830 no data 1,788
Women Kids Main shoppers0 0 0 0 – 0 0 – 0 – – – 0 0 0 – – – 0 – 0
-
-
-
- - -
All measured -
- - -
All measured -
CPM calculation methodology
What vendors have you used?
Are there any changes in methodology vs. last year?
Total yearly net investment divided by the total number of EQ GRP delivered in that certain year.
All channels and sales houses measured by AGB
Calculation is based on an average campaign's (based on the top titles by target audiance) net
budget (OMG estimation) and this campaign's reach%
Top titles with the highest readership in the target group
Calculation is based on an average campaign's (based on the top titles by target audiance) net
budget (OMG estimation) and this campaign's reach%
Top titles with the highest readership in the target group
Calculation is made by our outdoor specilist, Odex (as every
year)
Average campain's budget divided by the universe of the given
audience

HUNGARY 2016
New legislation was introduced in Hungary in 2015, which has affected our media buying process - in terms of prices, bonuses, etc. This has made it difficult to compare inflation figures in 2016 vs. 2015.
Young adults Upmarket adults Businessmen 1,322 2,513 354 1,472 1,211 516 1,472 1,211 516
– – – 720 1,985 –
– – – 1,518 1,195 916
Young adults Upmarket adults Businessmen0 0 0 0 0 0 0 0 0 – – – 0 0 - – – – 0 0 0
-
-
-
-
-
What assumptions have you made?
Country:INDONESIA 2016
NOTESGeneral
UNIVERSES (000s)Adults Men
Television 30,817 21,453 Newspapers 35,609 24,117 Magazines 35,609 24,117 Radio – – Out of home – – Cinema – – Internet – –
CHANGE IN UNIVERSE vs PREVIOUS YEAR (000s)Adults Men
Television 1,284 1,118 Newspapers 554 386 Magazines 554 386 Radio – –Out of home – –Cinema – –Internet – –
SOURCES AND CPM CALCULATION METHODOLOGY
Medium Ad size Source
Television 30 seconds Arianna Nielsen
Newspapers 1/1 or JP full colour
Magazines Full page colour
Radio 30 seconds –Out of home Various –
Cinema 30 seconds –Internet Big banner –
Audience All available mediaAdults All 25+Men Male 15+Women Female 15+Kids All 5-9Main shoppers –Young adults All 20-24Upmarket adults –Businessmen –
To ensure consistency, we're following the 2014 methodology, then adding on the Effect of AVERAGE NET COST increase and REACH Fragmentation ( decrease) . We're basing the COST and REACH Effect on FY projection, therefore tend to have some UP ( additional ) margin of cost incease and reach fragmentationThe higher inflation is caused by audience fragmentation, where audience shift from traditional to digital. Also with the new audience panel definition which changed from solely expenditure in the past but in 2016 also include "source of drinking water, electricity and source of fuel/cooking gas in the house" has impacted to higher inflation for overall target audience.
Nielsen Fusion, Readership or R&F
Nielsen Fusion, Readership or R&F

INDONESIA 2016
Women Kids Main shoppers 21,118 4,940 – 23,804 – – 23,804 – –
– – – – – – – – – – – –
Women Kids Main shoppers977 203 –375 – –375 – –
– – –– – –– – –– – –
10 channel national terrestrial TV No
No
No
– – –– – –– – –– – –
To ensure consistency, we're following the 2014 methodology, then adding on the Effect of AVERAGE NET COST increase and REACH Fragmentation ( decrease) . We're basing the COST and REACH Effect on FY projection, therefore tend to have some UP ( additional ) margin of cost incease and reach fragmentationThe higher inflation is caused by audience fragmentation, where audience shift from traditional to digital. Also with the new audience panel definition which changed from solely expenditure in the past but in 2016 also include "source of drinking water, electricity and source of fuel/cooking gas in the house" has impacted to higher inflation for overall target audience.
CPM calculation methodology
What vendors have you used?
Are there any changes in methodology vs. last year?
t sec cost (net after appliying the disc) divided by viewership (gross)
Net cost divided by gross impressions
We choose only vendor that exist for 2015 - 2016
Net cost divided by gross impressions
We choose only vendor that exist for 2015 - 2016
INDONESIA 2016
Young adults Upmarket adults Businessmen 5,937 – – 6,321 – – 6,321 – –
– – – – – – – – – – – –
Young adults Upmarket adults Businessmen680 – –
95 – –95 – –
– – –– – –– – –– – –
––––
To ensure consistency, we're following the 2014 methodology, then adding on the Effect of AVERAGE NET COST increase and REACH Fragmentation ( decrease) . We're basing the COST and REACH Effect
The higher inflation is caused by audience fragmentation, where audience shift from traditional to digital. Also with the new audience panel definition which changed from solely expenditure in the past but in
What assumptions have you made?
Only for the disc (by applying our regular disc in each channel)
We choose only the category that has highest spend within Jan Mar period (due to limitations of data, the software can not drilldown the
data for full year)

Country:
ITALY 2016
NOTESTV TV Business man inflaion is due to the growth of the Business Man universe in 2016. Print Smaller/cheaper print titles disappear from the market, hence average market price goes up.
UNIVERSES (000s)Adults Men
Television 52,335 25,136 Newspapers 52,993 25,488 Magazines 52,993 25,488 Radio 52,612 25,283 Out of home – – Cinema 52,993 – Internet 45,134 22,036
CHANGE IN UNIVERSE vs PREVIOUS YEAR (000s)Adults Men
Television 0 0 Newspapers 0 0 Magazines 0 0 Radio 0 0 Out of home – – Cinema – – Internet 1,738 433
SOURCES AND CPM CALCULATION METHODOLOGY
Medium Ad size Source
Television 30 seconds Auditel/Nielsen
Newspapers A3, full colour Audipress/Nielsen
Magazines Full page colour Audipress/Nielsen
Radio 30 seconds Radiomonitor/Nielsen
Out of home Various Nielsen
Cinema 30 seconds Audimovie/Nielsen
Internet Standard box (300x250)
Audience TV Other mediaAdults All 15+ All 14+Men Male 15+ Male 14+Women Female 15+ Female 14+Kids All 4-14 –Main shoppers Household purchasers Household purchasersYoung adults All 15–34 All 15–34Upmarket adults Income: high
Businessmen Profession: high level
Income: high economic level and high social dimension
Profession: Entrepreneur / manager / professional man

ITALY 2016
TV Business man inflaion is due to the growth of the Business Man universe in 2016. Smaller/cheaper print titles disappear from the market, hence average market price goes up.
Women Kids Main shoppers 27,198 6,295 24,889 27,505 – 25,816 27,505 – 25,816 27,329 – 32,161
– – – – – –
23,098 – –
Women Kids Main shoppers0 0 0 0 – 0 0 – 0 0 – 0 – – – – – –
1,305 – –
CPM calculation methodology
What vendors have you used?
Are there any changes in methodology vs. last year?
Total spend divided by impression on target
All vendors monitored by Nielsen (Rai, Mediaset etc)
Total spend divided by impression on target
All vendors monitored by Nielsen (Rcs, Manzoni etc)
Total spend divided by impression on target
All vendors monitored by Nielsen (Mediamond Condenast etc)
Total spend divided by impression on target
All vendors monitored by Nielsen (Mediamond, Rai etc)

Total spend divided by impression on target
All vendors monitored by Nielsen (Moviemedia, Rai etc)
Total spend divided by impression on target All vendors monitored by Nielsen

ITALY 2016
Young adults Upmarket adults Businessmen 12,963 9,668 2,570 13,369 – – 13,369 – – 13,240 – 3,223
– – – – – – – – –
Young adults Upmarket adults Businessmen0 107 332
-83 – – -83 – –
0 – – – – – – – – – – –
What assumptions have you made?
While TV is struggling to increase investments after a 4-year crisis audience is suffering. For this
reason, there is an increase of cpt
Very tough time for press in Italy caused by a continuous reduction
of investments. Although readership is losing less than
previous years with a little increase for digital copies
Very tough time for press in Italy caused by a continuous reduction
of investments. Although readership is losing less than
previous years simple because today it is a smaller and faithful
target
Radio is stable, like in previous years. It is still a very important media for automotive and retail, and audience is mostly in by car
driving. Stable
2016 started with a great increase of audience do to Italian movies.
Therefore, cpm is decreasing
Increase of special and qualitative positions and programmatic planning is influencing media
inflation that is growing
Country:
JAPAN 2016NOTESAll The media inflation is estimated to be almost flat in 2016, so put the same cost as 2015. Not change for the media reach, so the universe is not changed from 2015 figure.
UNIVERSES (000s)Adults Men
Television 79,067 38,748 Newspapers 52,023 25,915 Magazines 53,133 25,207 Radio 35,407 19,874 Out of home – – Cinema – – Internet 53,119 28,540
CHANGE IN UNIVERSE vs PREVIOUS YEAR (000s)Adults Men
Television 0 0 Newspapers 0 0 Magazines 0 0 Radio 0 0 Out of home – – Cinema – – Internet 0 0
SOURCES AND CPM CALCULATION METHODOLOGY
Medium Ad size Source
Television 30 seconds
Dentsu Ad StatisticsNewspapers A3, full colour
Magazines Full page colour
Radio 30 seconds
Out of home Various –
Cinema 30 seconds –
Internet Standard box (300x250) Dentsu Ad Statistics
Audience Television NewspapersAdults Age 20-69 Age 20-69Men Male 20-69 Male 20-69Women Female 20-69 Female 20-69Kids Male/Female 4-12 – Main shoppers – – Young adults Age 20-34 Age 20-34Upmarket adults – Age 20-69, HH income 10MMyen+Businessmen – Office worker
JAPAN 2016
The media inflation is estimated to be almost flat in 2016, so put the same cost as 2015. Not change for the media reach, so the universe is not changed from 2015 figure.
Women Kids Main shoppers 40,319 – – 26,108 – – 27,926 – – 15,533 – –
– – – – – –
24,579 – –
Women Kids Main shoppers0 – – 0 – – 0 – – 0 – – – – – – – – 0 – –
Total ad spend vs previous year
– –
– –
– –
– –
– – –
– – –
CPM calculation methodology
What vendors have you used?
Are there any changes in methodology vs. last year?
Market trend observation – –
Magazines Radio InternetAge 20-69 Age 20-69 Age 20+Male 20-69 Male 20-69 Male 20-69Female 20-69 Female 20-69 Female 20-69 – Male/Female 4-12 Male/Female 4-12 – – – Age 20-34 Age 20-34 Age 20-34Age 20-69, HH income 10MMyen+ – – Office worker – Office worker

JAPAN 2016
Young adults Upmarket adults Businessmen 19,644 10,047 29,383 6,851 7,299 18,530 15,365 7,373 20,658 5,381 4,097 12,980
– – – – – –
17,138 7,257 22,384
Young adults Upmarket adults Businessmen0 0 0 0 0 0 0 0 0 0 0 0 – – – – – – 0 0 0
Ad spend is flat
–
–
What assumptions have you made?

Inflation: flat as both the demand and supply are increasing
Country:
KAZAKHSTAN 2016NOTESGeneral
UNIVERSES (000s)Adults Men
Television 5,763 2,117 Newspapers 5,763 961 Magazines 5,763 1,197 Radio 5,763 1,197 Out of home 1,154 467 Cinema – – Internet 4,824 2,266
CHANGE IN UNIVERSE vs PREVIOUS YEAR (000s)Adults Men
Television 304 113 Newspapers 199 50 Magazines 199 -19 Radio 304 -807 Out of home -12 44 Cinema – – Internet – –
SOURCES AND CPM CALCULATION METHODOLOGY
Medium Ad size Source
Television 30 seconds TNS
Newspapers A3, full colour TNS
Magazines Full page colour TNS
Radio 30 seconds TNS
Out of home Various TNS
Cinema 30 seconds
Huge change in Print price changes due to devaluation of currency and increasing audience.Radio price changed due to significant drops in Men/Women audiences.
Internet Banner 468x60 TNS
Audience TV NewspapersAdults 18+ 18+Men 18-54 35-54Women 18-54 35-54Kids 6-15 6-15Main shoppers 20-64 25-64Young adults 20-25 20-25Upmarket adults 25-64 25-64Businessmen 25-54 20-44
KAZAKHSTAN 2016
Women Kids Main shoppers 2,396 1,043 5,086 1,136 – 4,384 2,396 – 3,322 1,320 1,043 4,384 531 – 1,054
– – – 2,558 111 4,494
Women Kids Main shoppers131 41 195
60 – 303 80 – 232
-945 41 -507 35 – 95 – – – – – –
Av CPP _ Universal All TV Channels –
Av cost _ Universal ТОР 5 of newspapers –
Av cost _Universal Top 5 of magazines –
Av CPP_Universal All Radio Channels –
Av Cost _ Av OTS –
–
Huge change in Print price changes due to devaluation of currency and increasing audience.Radio price changed due to significant drops in Men/Women audiences.
CPM calculation methodology
What vendors have you used?
Are there any changes in methodology vs. last year?
OOH constructions 3х6 (Almaty city)

Av CPP_Universal TOP 5 of web pages –
Magazines Radio OOH18+ 18+ 18+18-35 18-35 18-5418-54 18-35 18-54 6-15 6-15 6-1520-44 25-64 20-6420-25 20-25 20-2525-44 20-54 20-4420-44 25-54 20-44
KAZAKHSTAN 2016
Young adults Upmarket adults Businessmen 810 4,384 3,606 810 4,384 3,322 810 2,621 3,322 810 4,307 3,606 199 725 725
– – – 962 3,675 3,675
Young adults Upmarket adults Businessmen26 138 191
-25 303 232 -25 141 232 26 61 191 27 66 66 – – – – – –
–
–
–
–
–
–
What assumptions have you made?
–
Internet18+18-5418-54 12-1520-5420-2525-5425-54
Country:
LITHUANIA 2016NOTES
All Changes in cost for niche audiences are largely due to target affinities changes. Such specific targets like Upmarket Adults or Business Men are very unstable in terms of sample sizes.
TV For TV it is inline with the average level of inlation in the country
UNIVERSES (000s)Adults Men
Television 2,346 1,053 Newspapers 2,139 996 Magazines 2,139 996 Radio 2,196 1,027 Out of home – – Cinema – – Internet – –
CHANGE IN UNIVERSE vs PREVIOUS YEAR (000s)Adults Men
Television -18 -9 Newspapers 0 0 Magazines 0 0 Radio 0 0 Out of home – – Cinema – – Internet – –
SOURCES AND CPM CALCULATION METHODOLOGY
Medium Ad size Source
Television 30 seconds
TNS LTNewspapers A3, full colourMagazines Full page colour
Radio 30 secondsOut of home Various –
Cinema 30 seconds –Internet Banner 468x60 –
Audience Television All other mediaAdults 18+ 18 - 74 y.o.Men Men 18+ Men 18 - 74 y.o.Women Women 18+ Women 18 - 74 y.oKids Age 4-14 Age 12-14Main shoppers Women 20 - 60 y.o. MHI Women 20 - 60 y.o. MHIYoung adults 15 - 30 y.o. 15 - 30 y.o.Upmarket adults 25 - 55 A, B, C1 25 - 55 A, B, C1Businessmen Men 25 - 55, A, C1, C2 Men 25 - 55, A, C1, C2
LITHUANIA 2016
Changes in cost for niche audiences are largely due to target affinities changes. Such specific targets like Upmarket Adults or Business Men are very unstable in terms of sample sizes.
For TV it is inline with the average level of inlation in the country
Women Kids Main shoppers 1,293 305 806 1,143 n/a 515 1,143 n/a 515 1,169 73 513
– – – – – – – – –
Women Kids Main shoppers-9 -4 -13 0 – 0 0 – 0 0 0 0 – – – – – – – – –
All monitored vendors No
– – –– – –– – –
CPM calculation methodology
What vendors have you used?
Are there any changes in methodology vs. last year?
TNS LT Gross expenditures of average advertisers with agency
estimated discount
LITHUANIA 2016
Changes in cost for niche audiences are largely due to target affinities changes. Such specific targets like Upmarket Adults or Business Men are very unstable in terms of sample sizes.
Young adults Upmarket adults Businessmen 583 732 562 626 512 235 626 512 235 657 596 379
– – – – – – – – –
Young adults Upmarket adults Businessmen-21 50 -8
0 0 0 0 0 0 0 0 0 – – – – – – – – –
–––
What assumptions have you made?
Average advertiser size and discounts estimated
Country:
MALAYSIA 2016NOTESTV The increase in TV YOY cost change is due to the increase in cost while the TV audiences penetration remain relatively stable Newspapers Readership increased across all targets, costs too have increased for all titles.
Magazines
Radio Despite having increase in listenership, costs went up, hence the reason for the changes
Internet
UNIVERSES (000s)Adults Men
Television 16,689 8,372 Newspapers 9,855 5,325 Magazines 1,902 672 Radio 15,760 7,920 Out of home 15,910 8,069 Cinema 2,395 1,350 Internet 10,877 5,814
CHANGE IN UNIVERSE vs PREVIOUS YEAR (000s)Adults Men
Television 339 163 Newspapers 235 121 Magazines -388 -12 Radio 3 34 Out of home 431 138 Cinema 645 393 Internet 2,374 1,278
SOURCES AND CPM CALCULATION METHODOLOGY
Medium Ad size Source
Television 30 seconds Nielsen Arianna
Newspapers A3, full colour Nielsen Consumer & Media View
Magazines Full page colour Nielsen Consumer & Media View
Radio 30 seconds Nielsen Consumer & Media View
Out of home Various NA
Readership dropped while costs stayed the same in the periods compared, hence the large changes. Readership in Malaysia is getting smaller so, by target, readership numbers are small causing large fluctuations
Internet: there is an significant increase of the internet users, indicating that internet penetration in Malaysia has increased, and also accessing it more frequently, which can be reflected in the past day and past week usage (past week usage is the standard unit we have used in this case). The proliferation and decrease in cost for mobile broadband services and the wide offers by wireless broadband operators have mainly contributed to the huge increase in the internet universe across all."
Cinema 30 seconds Nielsen Consumer & Media View
Internet Banner 468x60 NA
Audience All available mediaAdults All 15+Men Male 15+Women Female 15+Kids All 6-14Main shoppers HousewivesYoung adults All 15-29Upmarket adults All 15+ Income MHI2000+Businessmen Professionals / Executives/
Magangers

MALAYSIA 2016
The increase in TV YOY cost change is due to the increase in cost while the TV audiences penetration remain relatively stable Readership increased across all targets, costs too have increased for all titles.
Despite having increase in listenership, costs went up, hence the reason for the changes
Women Kids Main shoppers 8,316 3,628 4,762 4,530 NA 3,389 1,229 NA 835 7,839 NA 5,436 7,841 NA 5,455 1,045 NA 429 5,063 NA 3,154
Women Kids Main shoppers174 -68 108 114 – 721
-377 – 33 -32 – 944 293 – 1,064 253 – 196
1,097 – 1,412
NO
NO
NO
NO
NA NA NO
Readership dropped while costs stayed the same in the periods compared, hence the large changes. Readership in Malaysia is getting smaller so, by target, readership
Internet: there is an significant increase of the internet users, indicating that internet penetration in Malaysia has increased, and also accessing it more frequently, which can be reflected in the past day and past week usage (past week usage is the
The proliferation and decrease in cost for mobile broadband services and the wide offers by wireless broadband operators have mainly contributed to the huge increase in the internet universe across all."
CPM calculation methodology
What vendors have you used?
Are there any changes in methodology vs. last year?
Top 100 Program CPRP/TV Universe (-15%)
All FTA Channel (TV1, TV2, TV3, NTV7, 8TV & TV9)
Average CPT/Npp Universe (-15%)
Based on titles covered in Nielsen Media Index
Average CPT/Magazine Universe (-15%)
Based on titles covered in Nielsen Media Index
Average CPT/Radio Universe (-15%)
Based on staion covered in Nielsen Media Index
NO
NA NA NO
Average CPT/Cinema Universe (-15%)
Based on 30sec cost, average of all cinema & halls
MALAYSIA 2016
Young adults Upmarket adults Businessmen 6,155 10,406 2,491 3,426 8,127 1,654 779 1,443 222 5,862 11,751 2,239 6,001 12,001 2,247 1,782 2,155 411 5,380 9,187 1,842
Young adults Upmarket adults Businessmen52 192 -161 -6 800 76
-319 -211 -71 -73 737 177 117 1,037 146 511 564 96 781 2,088 331
Base on Rate Card
Internet: there is an significant increase of the internet users, indicating that internet penetration in Malaysia has increased, and also accessing it more frequently, which can be reflected in the past day and past week usage (past week usage is the
The proliferation and decrease in cost for mobile broadband services and the wide offers by wireless broadband operators have mainly contributed to the huge increase in the internet universe across all."
What assumptions have you made?

Base on Rate Card

Country:MEXICO 2016Newspapers On Newspapers during 2014 & 2015 used gross rates, so we updated CPM in 2014 and 2015 for CPM applying an Average discount. Radio CPM on Radio decrease, because in some stations increase the audience (Business Men). On the rest targets the increment is driven by increase the rates and maintain similar levels of audience, but it isn't the same levels and the percent varies. Out of home CPM on OOH increment, because in some sites decrease the audience and maintain same rates.Internet CPM on Internet decrease, because in 2015 we used gross rates plus an applying average discount, so for this year we use OMG rates
UNIVERSES (000s)Adults Men
Television 39,411 18,860 Newspapers 9,928 5,778 Magazines 7,147 3,012 Radio 20,173 10,041 Out of home 35,379 16,684 Cinema 9,894 5,019 Internet 18,507 9,471
CHANGE IN UNIVERSE vs. PREVIOUS YEAR (000s)Adults Men
Television -1,475 -469 Newspapers 389 168 Magazines 183 -90 Radio 46 291 Out of home -889 -611 Cinema -2,045 -854 Internet -3,719 -1,663
SOURCES AND CPM CALCULATION METHODOLOGY
Medium Ad size Source
Television 30 seconds NIELSEN IBOPE
Newspapers A3, full colour EGM
Magazines Full page colour EGM
Radio 30 seconds EGM
Out of home Various NIELSEN IBOPE
Cinema 30 seconds Main Supplier
Internet Banner 468x60 Main Supplier
Audience All available mediaAdults All 18+Men Male 18+Women Female 18+Kids All 4-12Main shoppers All 25+ ABC+ CYoung adults All 18-30Upmarket adults 30+ ABC+Businessmen Male 30-54 ABC+
MEXICO 2016On Newspapers during 2014 & 2015 used gross rates, so we updated CPM in 2014 and 2015 for CPM applying an Average discount. CPM on Radio decrease, because in some stations increase the audience (Business Men). On the rest targets the increment is driven by increase the rates and maintain similar levels of audience, but it isn't the same levels and the percent varies. CPM on OOH increment, because in some sites decrease the audience and maintain same rates.CPM on Internet decrease, because in 2015 we used gross rates plus an applying average discount, so for this year we use OMG rates
Women Kids Main shoppers 20,551 9,335 12,895 4,150 – 3,734 4,135 – 2,845 10,132 – 6,674 18,695 – 11,628 4,876 – 4,211 9,035 – 7,507
Women Kids Main shoppers-1,006 265 -1,848
221 – -53 273 – -229
-245 – -413 -279 – -1,276
-1,191 – -1,324 -2,057 – -1,864
IBOPE AGB (COST/RTG # *1000)
TOP 10
TOP 7
TOP 9
Main Supplier
Main Supplier
CPM Supplier Main Supplier We consider OMG rates
CPM calculation methodology
What vendors have you used?
Are there any changes in methodology vs. last year?
MAIN CHANNELS OPEN TV / PAY TV
Main Newspaper per target (cost 1 page/Impacts*1000) VYASA (MEXICO CITY, GDL, MTY)
We consider a gross rates an apply average discount
Main magazines per target ( cost per 1 ColorP./ total impacts*1000)
VYASAMain stations per target ( cost per 1 ins in 30"/ total impacts*1000) IPSOS-EGM (MEXICO CITY,
GDL, MTY)Average Plan weekly Cost/impacts*1000
Main supplier Average Weekly Plan (Cost Weekly / Audience
*1000)

MEXICO 2016
CPM on Radio decrease, because in some stations increase the audience (Business Men). On the rest targets the increment is driven by increase the rates and maintain similar levels of audience, but it isn't the same levels and the percent varies.
Young adults Upmarket adults Businessmen 12,530 6,849 3,235 3,316 2,108 607 2,778 1,625 440 7,331 3,483 953 12,899 5,983 1,496 5,164 2,467 837 9,360 4,086 1,270
Young adults Upmarket adults Businessmen-164 -1,312 -650 145 30 -98
27 -172 -104 274 -23 60
-355 -479 -255 -898 -471 -131
-1,243 -844 -308
What assumptions have you made?
Country:NETHERLANDS 2016NOTESNewspapers
MagazinesRadio Budget have been decreased with 6%. Discounts have been increased with 5%, channel mix as in 2015.
UNIVERSES (000s)Adults Men
Television 6,624 3,319 Newspapers 7,924 3,691 Magazines 7,924 3,691 Radio 6,623 3,057 Out of home 6,758 3,397 Cinema – – Internet – –
CHANGE IN UNIVERSE vs PREVIOUS YEAR (000s)Adults Men
Television -29 -15 Newspapers 0 0 Magazines 0 0 Radio -44 -94 Out of home 0 0 Cinema – – Internet – –
SOURCES AND CPM CALCULATION METHODOLOGY
Medium Ad size Source
Television 30 seconds SKO
Newspapers A3, full colour NOM
Magazines Full page colour NOM
Radio 30 seconds NLO
Out of home Various
Cinema 30 seconds –Internet Banner 468x60 –
Audience All available mediaAdults 20-49 yoMen Men 20-49Women Women 20-49Kids 6-12 yoMain shoppers Shoppers 20-49Young adults 20-34 yoUpmarket adults 20-49 AB1Businessmen BtoB
For TA Adults/Men/Women/Main Shoppers/Upmarket Adults --> Sales house Telegraaf / Regional newspapers have implemented a new ratecard methodology based on CPM and actual number of contacts, just like Persgroep did in 2015. This has led to a decrease of the rates. NRC Handelsblad has also decreased it's rates. Number of contacts for now equal to 2015, as we have used the same survey.
TA Adults/Men/Women/Young Adults: Media vendors Sanoma and Vrouw has decreased its rates. Number of contacts for now equal to 2015, as we have used the same
OOH survey (Buitenreclame Onderzoek)

NETHERLANDS 2016
Budget have been decreased with 6%. Discounts have been increased with 5%, channel mix as in 2015.
Women Kids Main shoppers 3,305 1,338 3,671 4,233 – 5,187 4,233 – 5,187 3,566 – 4,057 3,361 – 4,364
– – – – – –
Women Kids Main shoppers-14 -15 -35
0 – 0 0 – 0
50 – -101 0 – 0 – – – – – –
No changes
No changes
Ster, OMS, SRG, Q-Music No changes
No changes
– – –– – –
For TA Adults/Men/Women/Main Shoppers/Upmarket Adults --> Sales house Telegraaf / Regional newspapers have implemented a new ratecard methodology based on CPM and actual number of contacts, just like Persgroep did in 2015. This has led to a decrease of the rates. NRC Handelsblad has also decreased it's rates. Number of contacts for
TA Adults/Men/Women/Young Adults: Media vendors Sanoma and Vrouw has decreased its rates. Number of contacts for now equal to 2015, as we have used the same
CPM calculation methodology
What vendors have you used?
Are there any changes in methodology vs. last year?
((total average spend / grps) / 1% of the TA universe) * 1,000
Top 4 Sales houses (Ster, RTL, SBS, BrandDeli)
total average spend divided by number of contacts/1,000
TMG; Persgroep; RDC; NDC; NRC Media
total average spend divided by number of contacts/1,000
Sanoma, Mood for Magazines, G+J, Veronica Magazines, VI,
Hachette((total average spend / grps) / 1%
of the TA universe) * 1,000total average spend divided by
number of contacts/1,000JC Decaux, Clear Channel,
Exterion, Centercom
NETHERLANDS 2016
Young adults Upmarket adults Businessmen 3,098 3,663 1,215 3,567 4,179 1,276 3,567 4,179 1,276 3,097 3,673 1,062 2,978 3,583 2,723
– – – – – –
Young adults Upmarket adults Businessmen25 45 -39 0 0 0 0 0 0
17 -110 21 0 0 0 – – – – – –
Average discount of 40%
Average discount of 25%
Average discount of 25%
Average discount of 35%
––
What assumptions have you made?

Country:NEW ZEALAND 2016NOTESGeneral Cost per thousand figures not released in NZ, and so are not fixed. Figures are based on market estimates.Internet Rising cost in internet ad space due to inceasing demand. Out of home 2016: Methodology for calculating OOH universe size flawed, updated retroactively to encompass population of main mets only (in line with Cost per Thousand calculations)
UNIVERSES (000s)Adults Men
Television 3,473 937 Newspapers 1,834 426 Magazines 2,730 630 Radio 2,616 – Out of home 1,872 – Cinema 1,814 – Internet 3,151 814
CHANGE IN UNIVERSE vs PREVIOUS YEAR (000s)Adults Men
Television 210 99 Newspapers -118 -59 Magazines -58 -55 Radio 18 – Out of home 0 – Cinema -337 – Internet 68 -24
SOURCES AND CPM CALCULATION METHODOLOGY
Medium Ad size Source
Television 30 seconds Nielsen/PARC
Newspapers A3, full colour
Magazines Full page colour
Radio 30 seconds ASA, Adquest, Clear Descisions
Out of home Various ASA, Adquest, 2013 Census Data
Cinema 30 seconds ASA, Adquest, Val Morgan
Internet Banner 468x60
Audience All Other Media InternetAdults AP18+ AP15+Men Males 25-54 M15+Women Females 25-54 F15+Kids – –Main shoppers HHS 25-54 –
ASA, Adquest, SMI, Clear Descisions
ASA, Adquest, SMI, Clear Descisions
Yahoo/Stuff/NZHerald/Ad2One/Adhub/Mediaworks/MSN/TVNZ/
Metservice
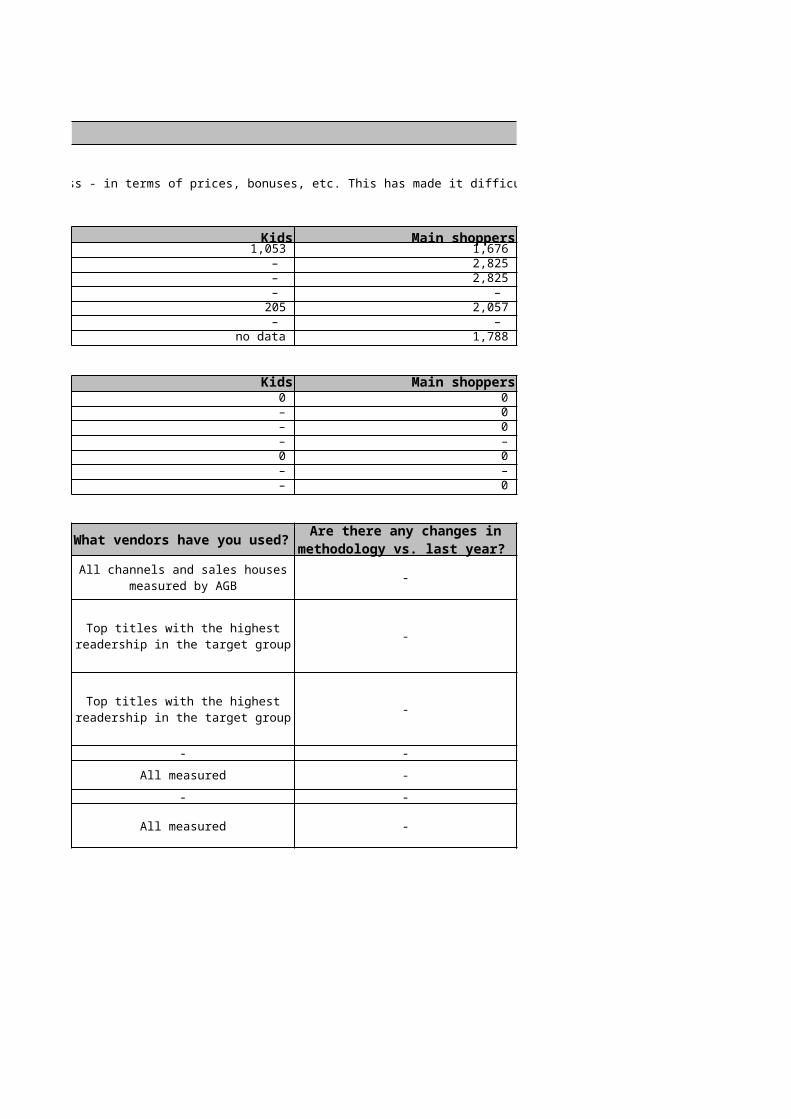
Young adults AP 18-39 15-24Upmarket adults AP 25-54 HHI $60k+ –Businessmen – –

NEW ZEALAND 2016
Cost per thousand figures not released in NZ, and so are not fixed. Figures are based on market estimates.Rising cost in internet ad space due to inceasing demand. 2016: Methodology for calculating OOH universe size flawed, updated retroactively to encompass population of main mets only (in line with Cost per Thousand calculations)
Women Kids Main shoppers 1,003 – 998 437 – 442 778 – 748
– – – – – – – – –
914 – –
Women Kids Main shoppers77 – 168
-63 – -72 -48 – -61
– – – – – – – – –
-19 – –
Total Revenue/Total Audience No
No
No
TRN/RadioWorks No
iSite/APNO No
Val Morgan No
No
CPM calculation methodology
What vendors have you used?
Are there any changes in methodology vs. last year?
TVNZ/MediaWorks/SKY Network,cost-efficient mix based on demo
Total Revenue/(Total Readership x14)
NZ Herald/Waikato Times/Dominion Post
Total Revenue/(Total Readership x8)
Womans Weekly (NZ and AUS)/Woman's Day/NEXT/ North
& South/YH&G
Total Revenue/(Total Listenership*8)
Total Revenue/(Population Main Mets*70%*20)
Total Revenue/(Total Admissions x3)
Based on market knowledge, client database, and historical
dealings
Yahoo/Stuff/NZHerald/Ad2One/Adhub/Mediaworks/MSN/TVNZ/
Metservice
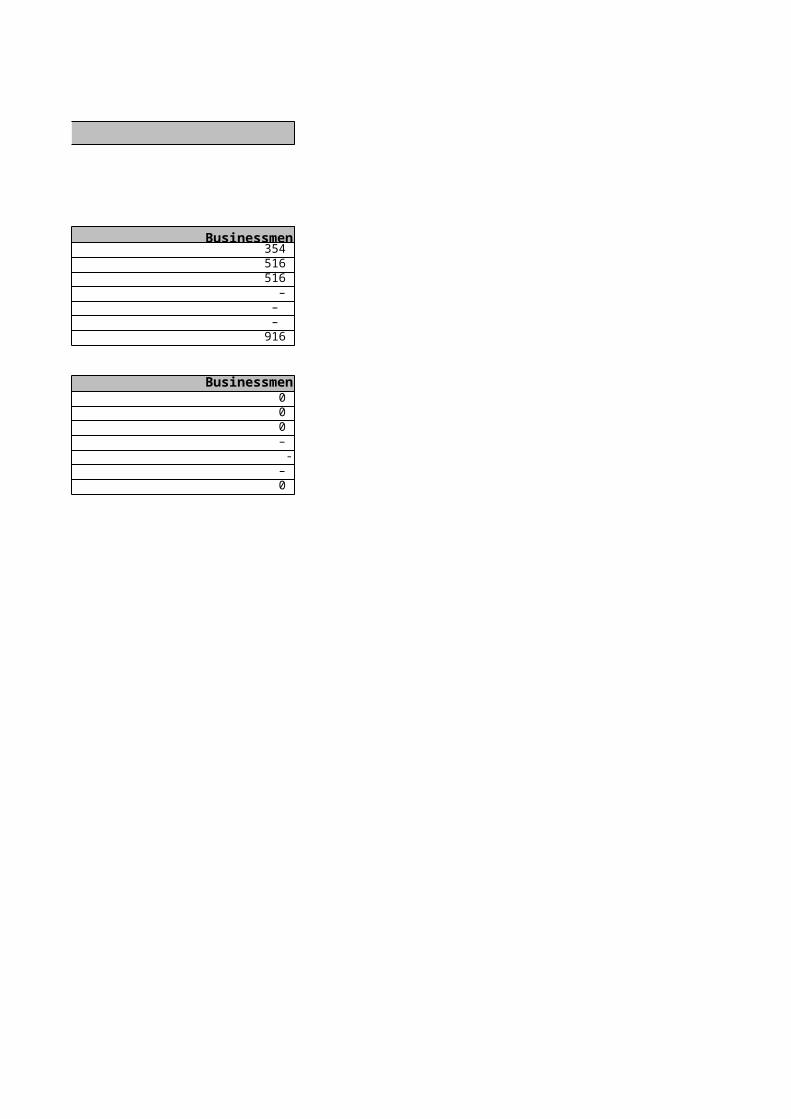
NEW ZEALAND 2016
Young adults Upmarket adults Businessmen 1,319 1,405 – 497 573 – 956 891 –
– – – – – – – – –
1,260 – –
Young adults Upmarket adults Businessmen85 277 –
-93 -106 – -87 -103 –
– – – – – – – – –
-29 – –
What assumptions have you made?
Assume network split for converting ASA figures to net-net
Assume network split for converting ASA figures to net-net, assuming an average OTS of 14 full pages of advertising per issue
Assume network split for converting ASA figures to net-net,
assuming an average of 8 full pages of advertising per issue
Assume an average of 8 impacts per listen
Assumes 70% of population of 5 main mets see an average of 20
OOH ads per dayEstimated impacts come from Val
Morgan are not independently audited and are based on
admission levels
Estimation based on Premium Display advertising only

Country:NORWAY 2016NOTES
UNIVERSES (000s)Adults Men
Television 4,078 1,985 Newspapers 4,313 2,157 Magazines 4,012 2,032 Radio 4,078 1,985 Out of home 4,067 2,026 Cinema 4,078 1,985 Internet 4,078 1,985
CHANGE IN UNIVERSE vs PREVIOUS YEAR (000s)Adults Men
Television 15 9 Newspapers 0 0 Magazines 0 0 Radio 15 9 Out of home 0 0 Cinema 15 9 Internet 15 9
SOURCES AND CPM CALCULATION METHODOLOGY
Medium Ad size Source
Television 30 seconds
Newspapers A3, full colour EstimatesMagazines Full page colour Estimates
Radio 30 seconds
Out of home Various EstimateCinema 30 seconds EstimateInternet Banner 980X150 Adserver/INMA
Audience All available media Out of homeAdults All 12+ All 12+Men Male 12+ Male 12+Women Female 12+ Female 12+Kids All 4-12Main shoppers Female 25-50 Female 25-50Young adults All 15-34 All 15-34Upmarket adults All 25-55 All 20-55Businessmen Male 30-60 Male 35-44
TNS Gallup and Mediebyråforeningen
TNS Gallup and Mediebyråforeningen

NORWAY 2016
Women Kids Main shoppers 2,093 518 899 2,156 – 865 1,981 – 880 2,093 518 899 2,040 – 1,180 2,093 518 899 2,093 518 899
Women Kids Main shoppers6 – 7 0 – 0 0 – 0 6 – 7 0 – 0 6 – 7 6 – 7
All commercial channels No
Estimates EstimatesEstimates Estimates
All commercial channels No
Estimate EstimateEstimate Estimate
Estiamte/Avg from adserver Estimate
CPM calculation methodology
What vendors have you used?
Are there any changes in methodology vs. last year?
Net spending via agencies / spot rating
Net spending via agencies / spot rating
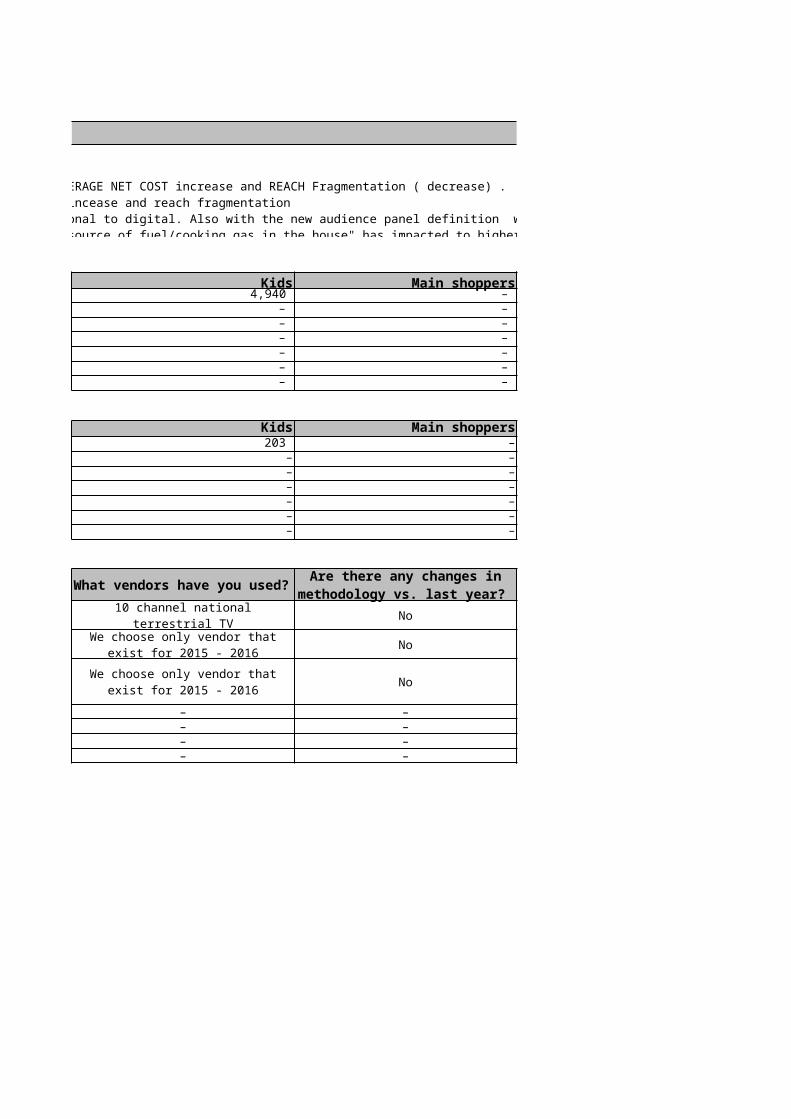
NORWAY 2016
Young adults Upmarket adults Businessmen 1,156 1,977 916 1,132 2,171 1,063 1,053 2,088 975 1,156 1,977 916 1,343 2,312 372 1,156 1,977 916 1,156 1,977 916
Young adults Upmarket adults Businessmen0 0 0 0 0 0 0 0 0 0 0 0 0 0 0 0 0 0 0 0 0
Same SOR as last year
Same SOR as last year
What assumptions have you made?

Country:PAKISTAN 2016
NOTES
UNIVERSES (000s)Adults Men
Television 128,617 67,072 Newspapers – – Magazines – – Radio – – Out of home – – Cinema – – Internet – –
CHANGE IN UNIVERSE vs PREVIOUS YEAR (000s)Adults Men
Television 0 0 Newspapers – – Magazines – – Radio – – Out of home – – Cinema – – Internet – –
SOURCES AND CPM CALCULATION METHODOLOGYMedium Ad size Source
Television 30 seconds
Newspapers A3, full colour Adviewer Pakistan
Magazines Full page colour Adviewer Pakistan
Radio 30 seconds Adviewer Pakistan
Out of home Various
Cinema 30 seconds
Internet Banner 468x60 Based on Market Intel
Audience TV NewspapersAdults All 18+ All 18+Men M 18+ M 18+Women W 18+ W 18+Kids All 4-14 – Main shoppers All 18-55 All 18-55Young adults All 16-25 All 18-30Upmarket adults All 18 +, high income 18+ AB
Businessmen
Kantar Pakistan and MediaMonitors Pakistan
Based on Vendor and Market Intel
Based on Vendor and Market Intel
M with middle and higher inc, top managers
M A - working on executive level or above

PAKISTAN 2016
Women Kids Main shoppers 61,545 36,534 28,862
– – – – – – – – – – – – – – – – – –
Women Kids Main shoppers0 0 0 – – – – – – – – – – – – – – – – – –
All channels were tracked No
Listed among top data providers No
Listed among top data providers No
Listed among top data providers No
No
No
Top 5 Clients No
Magazines Radio Out of homeAll 18+ All 18+ All 18+M 18+ M 18+ – W 18+ W 18+ – – – – All 18-55 All 18-55 – All 18-30 All 18-30 – 18+ AB 18+ AB –
–
CPM calculation methodology
What vendors have you used?
Are there any changes in methodology vs. last year?
Total spend divided on number of contacts
Total spend divided on number of contacts
Total spend divided on number of contacts
Total spend divided on number of contacts
Total spend divided on number of contacts
Top Three Vendors and OMD Clients
Total spend divided on number of contacts
Top Three Vendors and OMD Clients
Total spend divided on number of contacts
M A - working on executive level or above
M A - working on executive level or above

PAKISTAN 2016
Young adults Upmarket adults Businessmen 51,530 9,566 2,211
– – – – – – – – – – – – – – – – – –
Young adults Upmarket adults Businessmen0 0 0 – – – – – – – – – – – – – – – – – –
Cinema InternetAll 18+ All, 18+M 18+ M 18+W 18+ W 18+All 5-12 – All 18-55 All 18-55All 18-30 All 18-3018+ AB 18+ AB
What assumptions have you made?
M A - working on executive level or above
M 22+ A - The business owner, entrepreneur, hired manager
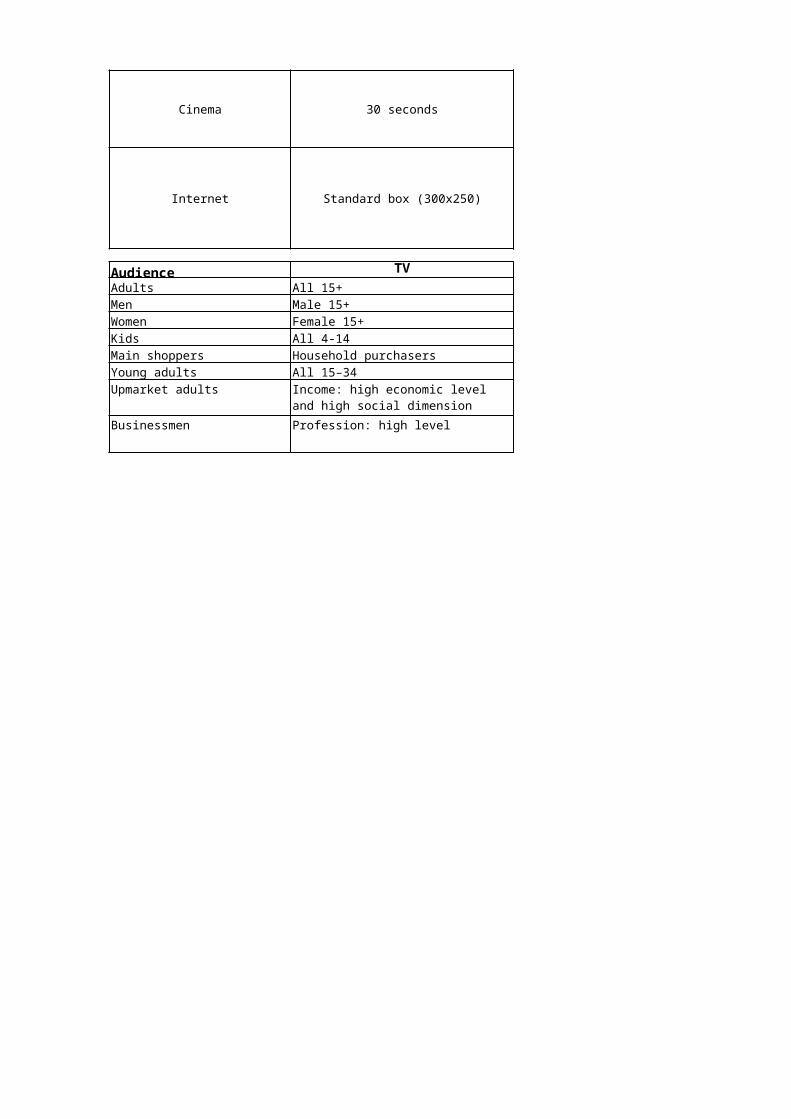
Country:PERU 2015
NOTES
UNIVERSES (000s)Adults Men
Television 9,483 4,518 Newspapers 6,729 3,228 Magazines 6,729 3,228 Radio 16,485 8,038 Out of home 7,057 – Cinema – – Internet 6,812 3,657
CHANGE IN UNIVERSE vs PREVIOUS YEAR (000s)Adults Men
Television 146 67 Newspapers 0 0 Magazines 0 0 Radio 293 137 Out of home 121 – Cinema – – Internet 476 179
SOURCES AND CPM CALCULATION METHODOLOGYMedium Ad size Source
Television 30 seconds IBOPE
Newspapers A3, full colour IBOPE
Magazines Full page colour IBOPE
Radio 30 seconds IBOPE
Out of home Various
Cinema 30 seconds
Internet Banner 468x60 Comscore
Audience TV NewspapersAdults All 18+ All 18-74Men M 18+ M 18-74Women W 18+ W 18-74Kids All 3-10 – Main shoppers All 26+ All 26-74Young adults All 18-37 All 18-37Upmarket adults All 18+ AB All 18+ ABBusinessmen – –
EstudioCLEAR CHANNEL

PERU 2015
Women Kids Main shoppers 4,964 1,796 7,370
3,501 – 5,227 3,501 – 5,227 8,447 – 12,980
– – – – – –
3,155 – 4,892
Women Kids Main shoppers78 -37 91 0 – 0 0 – 0
156 – 314 – – – – – –
297 – 158
– –
– –
– –
– –
– – – –
– –
Magazines Radio Out of homeAll 18-74 All 18+ All 18+M 18-74 M 18+ – W 18-74 W 18+ – – – – All 26-74 All 26+ – All 18-37 All 18-37 – All 18+ AB 18+ AB – – – –
CPM calculation methodology
What vendors have you used?
Are there any changes in methodology vs. last year?
Pauta tipo (Inversión dividido con el Universo)
Pauta tipo (Inversión dividido con el Universo)
Pauta tipo (Inversión dividido con el Universo)
Pauta tipo (Inversión dividido con el Universo)
Pauta tipo (Inversión dividido con el Universo)
Pauta tipo (Inversión dividido con el Universo)
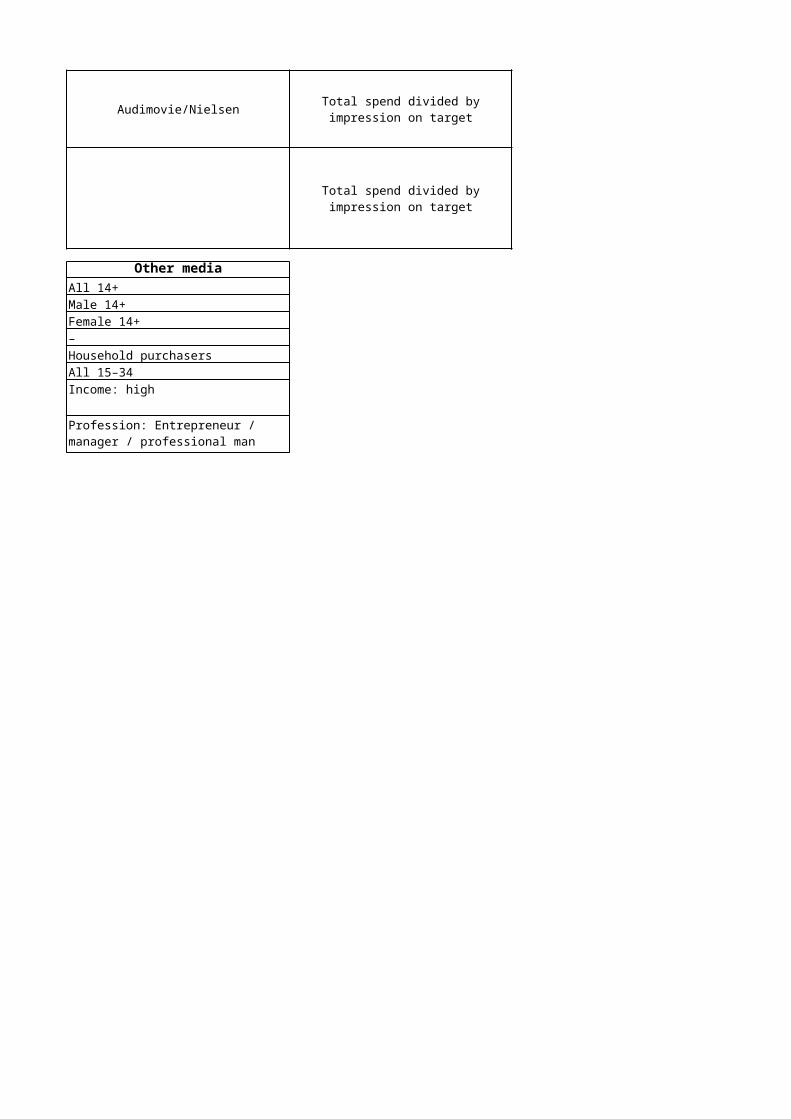
PERU 2015
Young adults Upmarket adults Businessmen 4,653 2,152 –
3,383 1,618 – 3,383 1,618 – 8,160 2,886 –
– – – – – –
4,311 – –
Young adults Upmarket adults Businessmen73 18 – 0 0 – 0 0 –
43 260 – – – – – – –
389 – –
Cinema Internet – All, 18+ – M 18+ – W 18+ – – – All 25+ – All 15-34 – – – –
What assumptions have you made?
Tarifas estimadas principales soportes
Tarifas estimadas principales soportes
Tarifas estimadas principales soportes
Tarifas estimadas principales soportes
Tarifas estimadas principales soportes
Tarifas estimadas principales soportes
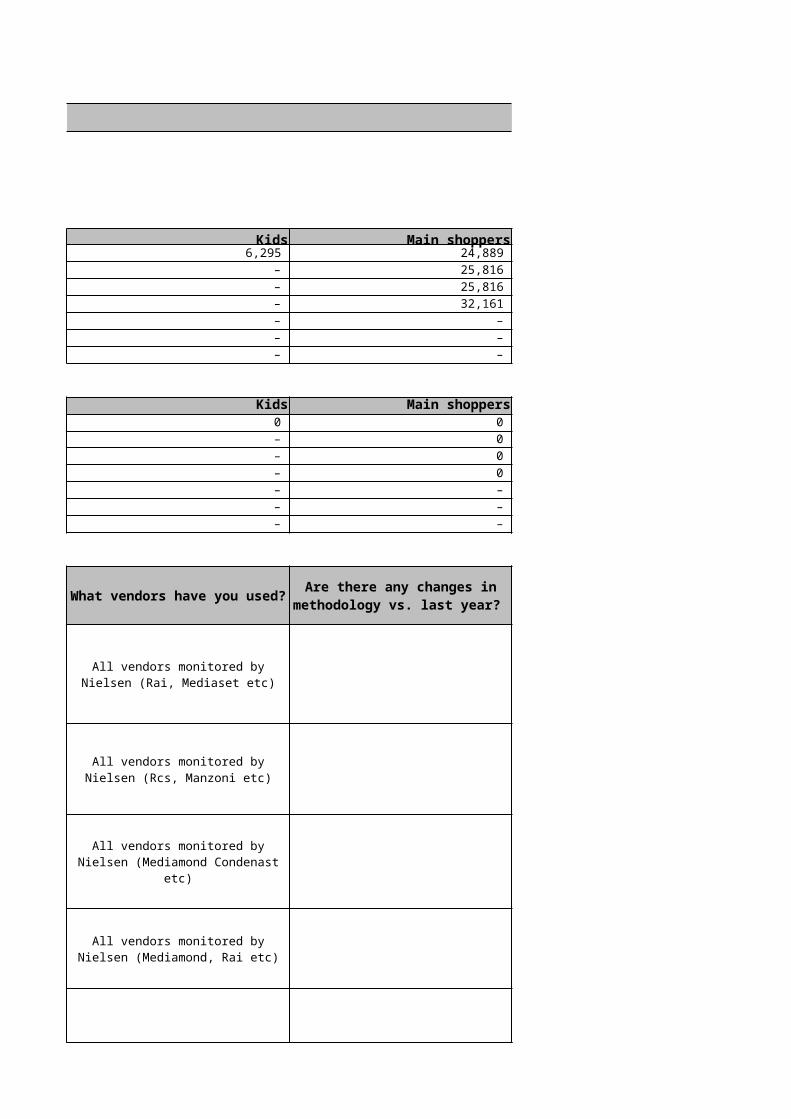
Country:PHILIPPINES 2016
NOTESGeneral OOH, cinema and internet data are not available.
UNIVERSES (000s)Adults Men
Television 18,021 6,940 Newspapers 4,051 1,328 Magazines 688 461 Radio 16,184 7,945 Out of home 13,471 8,839 Cinema 39 51 Internet 1,582 2,680
CHANGE IN UNIVERSE vs PREVIOUS YEAR (000s)Adults Men
Television 1,624 607 Newspapers 1,064 371 Magazines 107 98 Radio 1,325 606 Out of home 1,601 907 Cinema 2 16 Internet 473 814
SOURCES AND CPM CALCULATION METHODOLOGYMedium Ad size Source
Television 30 seconds
Newspapers A3, full colour
Magazines Full page colour
Radio 30 seconds
Out of home VariousCinema 30 secondsInternet Banner 468x60
Audience TV NewspapersAdults ABCD 20-44 ABC 30+ Men ABCD 10-24 ABC 40+Women ABCD 15-44 ABC 25+Kids ABCD 2-14 ABC2-14 Main shoppers ABCD 20-44 ABC 30+ Young adults ABCD 15-19 ABC 15-19Upmarket adults 30-34AB 25+ ABBusinessmen ABC 20+ AB 30-34
ACNielsen Adquest Millenium & Media index
ACNielsen Adquest Millenium & Media index
ACNielsen Adquest Millenium & Media index
ACNielsen Adquest Millenium & Media index

PHILIPPINES 2016
OOH, cinema and internet data are not available.
Women Kids Main shoppers 11,524 5,174 7,377 2,409 385 1,799 581 226 232 8,922 3,498 6,887
9,842 4,293 2,039 80 28 18
3,455 4,652 296
Women Kids Main shoppers1,065 564 -5,069
621 97 453 81 34 0
213 290 563 1,272 484 594
12 11 4 1,034 423 72
total spend divided by universe ALL TV Channels No
total spend divided by universe ALL Newspaper No
total spend divided by universe All Magazines No
total spend divided by universe ALL Radio stations No
Magazines Radio Out of homeABC 20-34 ABCD 20-49 ABCD 20-39 ABC 15-44 ABCD 20-50 ABCD 15-39ABC 15-34 ABCDE 20-50 ABCD 15-44ABC 2-14 CD 2-14 ABCD 2-14 ABC 20-34 ABCD 20-50 ABC 20-39 ABCD 15-19 ABCDE 15-19 ABCDE 15-1920-39 AB 20+ AB 20-49 ABABC1 20-44 ABC 25+ ABC 20+
CPM calculation methodology
What vendors have you used?
Are there any changes in methodology vs. last year?

PHILIPPINES 2016
Young adults Upmarket adults Businessmen 4,580 19 32 680 101 3 639 28 24 4,038 133 363
4,438 117 408 115 7 3
1,852 106 166
Young adults Upmarket adults Businessmen375 8 14 183 50 0
4 15 3 -85 64 33 145 64 60
49 5 1 560 57 37
All People
All People
All People
All People
Cinema InternetABC 25-29 ABC 20-24 ABC 15-19 ABC 10-24ABC 20-34 ABC 10-29CD 2-14 ABCD 2-14 ABC 25-29 ABC 20-24 ABC 15-19 ABC 15-1920-34AB 20-44 ABABC1 35-50 ABC1 20-50
What assumptions have you made?

Country:POLAND 2016NOTESGeneral Kids audience (defined as aged 4-15) not monitored in TGI (respondents panel: aged 15+).
UNIVERSES (000s)Adults Men
Television 27,357 13,206 Newspapers 18,369 9,584 Magazines 25,201 11,424 Radio 27,243 13,497 Out of home 16,368 8,145 Cinema 12,294 5,854 Internet 23,015 11,345
CHANGE IN UNIVERSE vs PREVIOUS YEAR (000s)Adults Men
Television -11 -149 Newspapers -201 -34 Magazines -239 -34 Radio -724 -419 Out of home -720 -230 Cinema 490 137 Internet 253 12
SOURCES AND CPM CALCULATION METHODOLOGY
Medium Ad size Source
Television 30 seconds
Newspapers A3, full colourMagazines Full page colour
Radio 30 seconds
Out of home Billboards (3*6)Cinema 30 secondsInternet Banner 468x60
Audience Television/Internet All other mediaAdults Adults 16+ Adults 16-75Men Men 16+ Men 16-75Women Women 16+ Women 16-75Kids Kids 4-15 –Main shoppers
Young adults All 16-29 All 16-29Upmarket adults All 25-54 educ sec+ inc avg+ All 25-54 educ sec+ inc avg+Businessmen Top management Top management, enterpr. owners
Estimations of media consumption (universe levels) based on data for 2016 Q1 available.Even slight deflation in cinema expected due to monitored higher increase of cinema consumption (wider audience of cinema goers) than average price of insertions/spots exposition in the medium.
Source: info from media & own estimations on price changes; consumption of medium from
Nielsen Audience Measurement
All 25-49 responsible for daily purchase
All 25-49 responsible for daily purchase

POLAND 2016
Kids audience (defined as aged 4-15) not monitored in TGI (respondents panel: aged 15+).
Women Kids Main shoppers 14,150 4,037 9,074 8,784 – 5,898 13,777 – 8,505 13,746 – 9,207 8,223 – 5,591 6,440 – 4,611 11,671 – 8,764
Women Kids Main shoppers139 -40 -233
-167 – -252 -204 – -481 -304 – -424 -489 – -336 353 – 18 242 – -370
–
Top 6 titles –Top 20 titles –
–
Top 3 vendors (70% of market) –Top 2 vendors (85% of market) –
Top 5 vendors –
Estimations of media consumption (universe levels) based on data for 2016 Q1 available.Even slight deflation in cinema expected due to monitored higher increase of cinema consumption (wider audience of cinema goers) than average price of insertions/spots exposition in the
CPM calculation methodology
What vendors have you used?
Are there any changes in methodology vs. last year?
Average price/CPP divided by weighted average consumption of
medium; converted into CPT
Average for all stations (3 saleshouses)
Top 8 stations (nationwide or national nets)
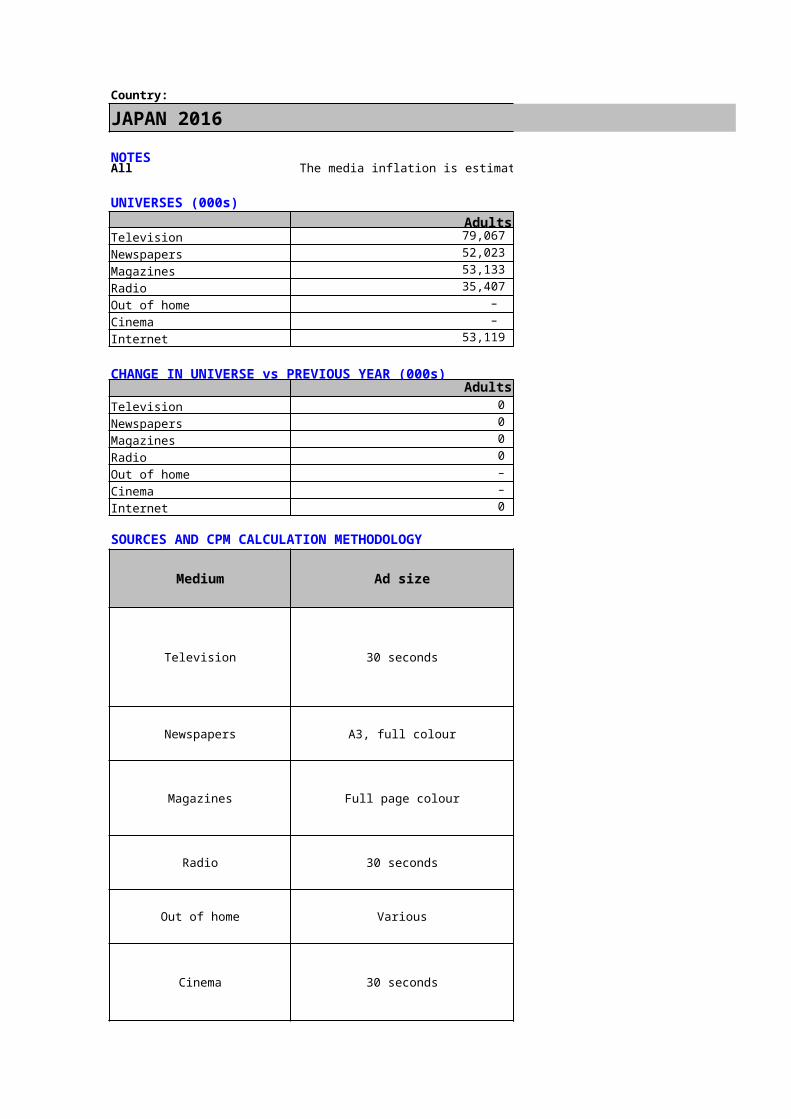
POLAND 2016
Young adults Upmarket adults Businessmen 5,957 7,193 2,992 3,458 5,282 2,455 5,818 6,967 3,024 6,382 7,646 3,227 3,788 4,894 2,306 3,950 4,739 2,416 6,884 7,694 3,301
Young adults Upmarket adults Businessmen-220 29 -60 -513 17 15 -367 59 -42 -480 34 -62 -322 -363 -81 -123 133 132 -189 -49 -88
–
––
–
–––
Even slight deflation in cinema expected due to monitored higher increase of cinema consumption (wider audience of cinema goers) than average price of insertions/spots exposition in the
What assumptions have you made?

Country:
PORTUGAL 2016NOTESTV
UNIVERSES (000s)Adults Men
Television 8,564 4,040 Newspapers 8,564 4,040 Magazines 8,564 4,040 Radio 8,564 4,040 Out of home – – Cinema – – Internet 5,212 2,816
CHANGE IN UNIVERSE vs PREVIOUS YEAR (000s)Adults Men
Television -0 -0 Newspapers 0 0 Magazines 0 0 Radio 0 0 Out of home – – Cinema – – Internet 0 0
SOURCES AND CPM CALCULATION METHODOLOGY
Medium Ad size Source
Television 30 seconds Videotrack/Marktest & Opera
Newspapers A3, full colour ScanPress/Marktest & Opera
Magazines Full page colour ScanPress/Marktest & Opera
Radio 30 seconds Radiotrack/Marktest & Opera
Out of home Billboards (3*6) –
Cinema 30 seconds –
Internet Banner 468x60 NetReport/Marktest & Opera
Audience TV/Internet Print/RadioAdults Aged 15+ Aged 15+Men Male 15+ Male15+Women Female 15+ Female 15+Kids Aged 4/14 –Main shoppers Housewives HousewivesYoung adults Aged 15/24 Aged 15/24Upmarket adults Aged 25+AB Aged 25+ABBusinessmen – QMS
After a period of volume decline, TV now registers an increase on investment. The media owners' goal is to recover the cost price with no excuse to committed investment failure. Aerial TV channels fight for leadership which is being split between the top two. Tough negotiations: each one of 2016 client conditions begin with an increase higher than 15% and this is a strategy to continue for the following years. All variables in price such as length indexes, target audience, sos/sov by day part, play only one rule which is a price increase
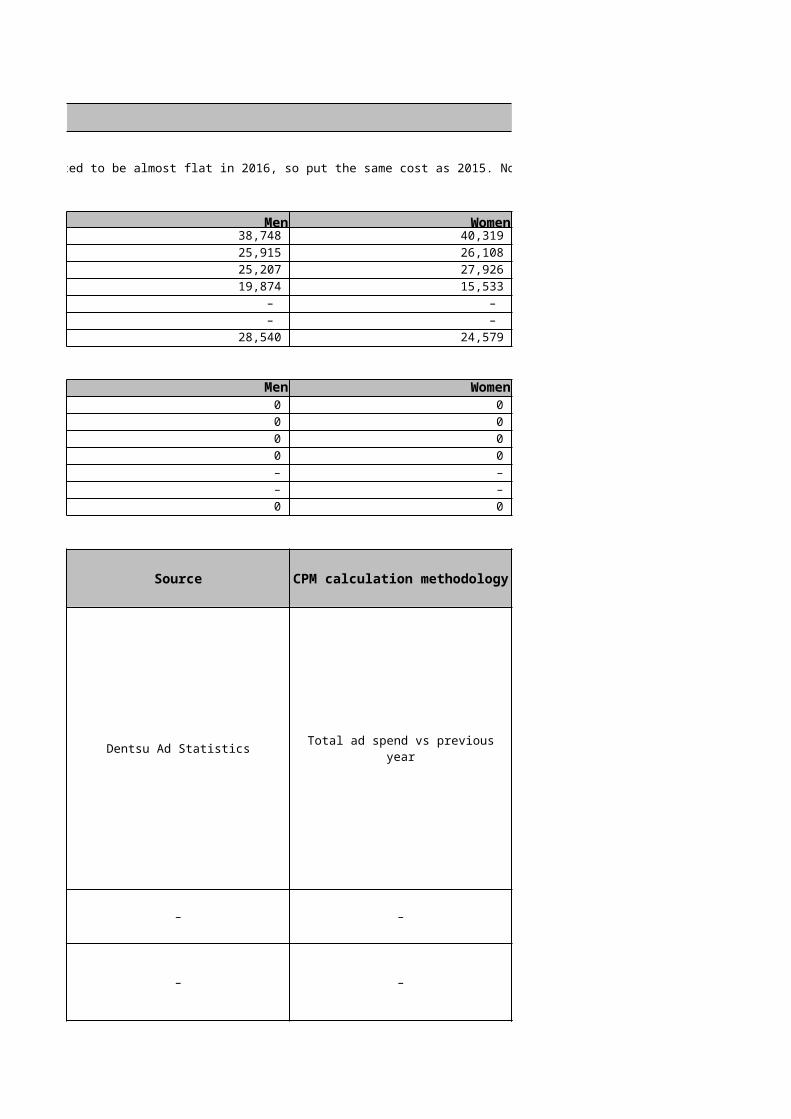
PORTUGAL 2016
Women Kids Main shoppers 4,524 1,121 3,869 4,524 – 3,870 4,524 – 3,870 4,524 – 3,870
– – – – – –
2,396 828 –
Women Kids Main shoppers0 0 0 0 – 0 0 – 0 0 – 0 – – – – – – 0 0 –
Net spend / (Universe/1000) Aerial TV (3 channels) –
Net spend / (Universe/1000) Top 10 Nwp titles (adults) –
Net spend / (Universe/1000) Top 10 Mgz titles (adults) –
Net spend / (Universe/1000) Top 7 national stations (adults) –
– – –
– – –
Net spend / (Universe/1000) –
After a period of volume decline, TV now registers an increase on investment. The media owners' goal is to recover the cost price with no excuse to committed investment failure. Aerial TV channels fight for leadership which is being split between the top two. Tough negotiations: each one of 2016 client conditions begin with an increase higher than 15% and this is a strategy to continue for the following years. All variables in price such as length indexes, target audience, sos/sov by day part, play only one rule which is a price increase
CPM calculation methodology
What vendors have you used?
Are there any changes in methodology vs. last year?
Top 20 sites (adults) with MREC format

PORTUGAL 2016
Young adults Upmarket adults Businessmen 1,080 1,373 na 1,080 1,375 1,053 1,080 1,375 1,053 1,080 1,342 1,053
– – – – – –
1,055 1,111 –
Young adults Upmarket adults Businessmen0 -34 – 0 4 0 0 4 0 0 -1 0 – – – – – – 0 -8 –
–
–
–
–
–
–
–
What assumptions have you made?

Country:RUSSIA 2016NOTESGeneral
UNIVERSES (000s)Adults Men
Television 117,774 54,580 Newspapers 46,205 20,152 Magazines 51,075 21,438 Radio 59,448 26,307 Out of home 38,397 – Cinema 19,379 8,282 Internet 43,416 20,432
CHANGE IN UNIVERSE vs PREVIOUS YEAR (000s)Adults Men
Television 255 112 Newspapers 1,456 894 Magazines 1,565 953 Radio -260 -126 Out of home – – Cinema -593 -262 Internet -1,415 -478
SOURCES AND CPM CALCULATION METHODOLOGY
Medium Ad size Source
Television 30 seconds
Newspapers A3, full colour
Magazines Full page colour
Radio 30 seconds
Out of home Billboards (3*6)
Cinema 30 seconds
Internet Banner 468x60 OMD MD digital expert estimation
Audience Television NewspapersAdults All 18+ All 18+Men M 18+ M 18+
CPT: In 2016 the economic situation stabilized and costs in some media resumed the growth. The OOH contractors still need to raise the prices to recoup their spends at the auctions.
TNS Media Research, TV Index, Russia (cities 100+), RACA, Russia TV Index, OMD MD estimations, Federal State Statistics Service (Russian
Federation)TNS Media Research, NRS,
Russia (cities 100+). Mar - June 2016. OMD MD estimations
TNS Media Research, NRS, Russia (cities 100+). Mar - June
2016. OMD MD estimations
TNS Media Research, Radio Index, Russia (cities 100+). Jan - Jun 2016. OMD MD estimations
Espar Analyst 2016. OMD MD estimations
OMD MD cinema expert estimation

Women W 18+ W 18+Kids All 4-18 – Main shoppers
Young adults All 18-30 All 18-30Upmarket adults
Businessmen
Respondent mostly takes decisions on purchasing food products and consumer goods of everyday demand
Respondent mostly takes decisions on purchasing food products and consumer goods of everyday demand
All 18+ , High income (purchasing capacity in:"Sometimes buy expensive items, but cannot purchase anything they want" + "Can afford anything they want")
All 18+ , High income (purchasing capacity in:"Sometimes buy expensive items, but cannot purchase anything they want" + "Can afford anything they want")
Social status.Managers, individual business, (co-)owner
Social status.Managers, individual business, (co-)owner

RUSSIA 2016
Women Kids Main shoppers 63,194 22,467 53,605 26,054 – 23,677 29,637 – 26,794 33,142 – 28,575
– – – 11,097 – 8,355 22,984 – 3,876
Women Kids Main shoppers143 -313 -334 562 – 574 611 – 786
-134 – -238 – – –
-331 – -151 -937 – -93
no changes
no changes
no changes
no changes
no changes
Various no changes
OMD MD digital expert estimation Yandex, Mail.ru no changes
Magazines Radio OOHAll 18+ All 18+ All 18+M 18+ M 18+ –
CPT: In 2016 the economic situation stabilized and costs in some media resumed the growth. The OOH contractors still need to raise the prices to recoup their spends at the
CPM calculation methodology
What vendors have you used?
Are there any changes in methodology vs. last year?
Cost per thousand is based on estimated total market size in local
currency&total WRP TA
Video International, RTR Media, EvereSTS, Gazprom Media
Cost per thousand is based on estimated(Ad size in account) placement in top 15 national
dailies&overall TA cover
Sanoma Independent Media, Hearst Shkulev Media,
Komsomolskaya pravda, Kommersant, Conde Nast
Cost per thousand is based on estimated(Ad size in account)
placement in top 15 magazines & overall TA cover
Sanoma Independent Media, Hearst Shkulev Media,
Komsomolskaya pravda, Kommersant, Conde Nast
Cost per thousand is based on estimated placement on top 25
national radiostations&overall TA TRP
EMG, Gazprom Media, VI, Multimedia Holding, Krutoy Media
Cost per thousand is based on estimated total market size in local
currency&total WRP TA
Russ Outdoor, Gallery, GEMA, V.E.R.A.-Olymp, Poster
OMD MD cinema expert estimation

W 18+ W 18+ – – – –
– All 18-30 All 18-30 –
–
–
Respondent mostly takes decisions on purchasing food products and consumer goods of everyday demand
Respondent mostly takes decisions on purchasing food products and consumer goods of everyday demand
All 18+ , High income (purchasing capacity in:"Sometimes buy expensive items, but cannot purchase anything they want" + "Can afford anything they want")
All 18+ , High income (purchasing capacity in:"Sometimes buy expensive items, but cannot purchase anything they want" + "Can afford anything they want")
Social status.Managers, individual business, (co-)owner
Social status.Managers, individual business, (co-)owner

RUSSIA 2016
Young adults Upmarket adults Businessmen 27,139 27,253 10,005 10,688 16,077 6,427 12,682 17,927 7,190 15,218 20,360 9,209
– – – 8,141 8,800 2,710 14,544 18,064 5,964
Young adults Upmarket adults Businessmen1,069 487 -49
832 2,343 329 1,249 2,424 279
302 1,060 -530 – – –
211 767 -282 463 1,413 -203
Cinema InternetAll 18+ All 18+ – M 18+
What assumptions have you made?
Universe: all people (Russia, cities 0+)
Universe: only people living in the cities with population 100 000+, half year TA of TOP-15 national
dailiesUniverse: only people living in the cities with population 100 000+, half year TA of TOP-15 national
magazinesUniverse: only people living in the cities with population 100 000+, half year TA of TOP-15 national
stations
Universe: only people living in the measured 50 cities
Universe: only people living in the cities with population 100 000+, visit cinema at least 1 time a half
yearUniverse: only people living in the
cities with population 100 000+ who used internet in a last month

– W 18+ – –
– Housewives – All 18-30
–
– Social status: Managers
All 18+ , High income (purchasing capacity in:"Sometimes buy expensive items, but cannot purchase anything they want" + "Can afford anything they want")
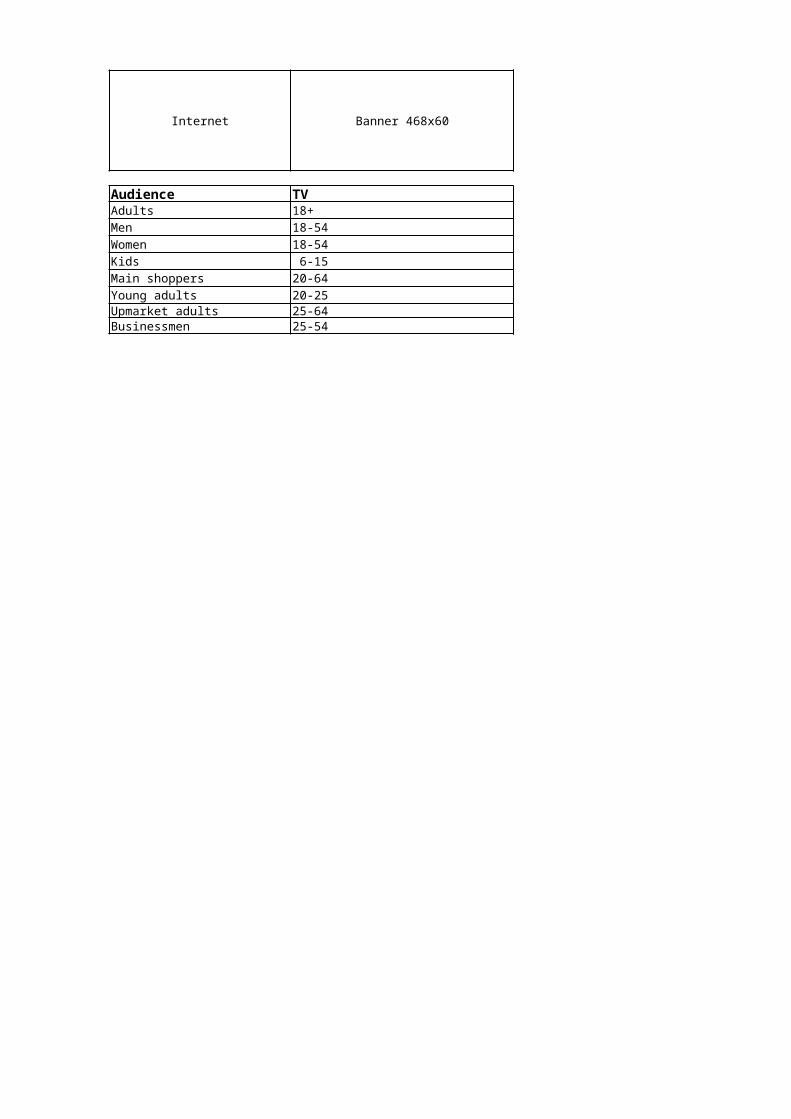
Country:SERBIA 2016NOTES
UNIVERSES (000s)Adults Men
Television 5,419 2,661 Newspapers 5,393 2,640 Magazines 5,393 2,640 Radio – – Out of home – – Cinema – – Internet 2,893 1,528
CHANGE IN UNIVERSE vs PREVIOUS YEAR (000s)Adults Men
Television 308 141 Newspapers 269 140 Magazines 269 140 Radio – – Out of home – – Cinema – – Internet 138 73
SOURCES AND CPM CALCULATION METHODOLOGY
Medium Ad size Source
Television 30 seconds Nielsen Audience Measurement
Newspapers A3, full colour PrAdex Ipsos strategic marketing
Magazines Full page colour PrAdex Ipsos strategic marketing
Radio 30 seconds – Out of home Billboards (3*6) – Cinema 30 seconds – Internet Banner 468x60 –
Audience Television PrintAdults 18-69 18-65Men Male, 18-69 Male 18-65Women Female 18-69 Female 18-65Kids Kids 4-12 –Main shoppers Responsible for shopping 18-69 Responsible for shopping 18-65Young adults All 16-25 All 16-25Upmarket adults All 18+ higher income All 18+ higher incomeBusinessmen All 18+ employed All 18+ employed
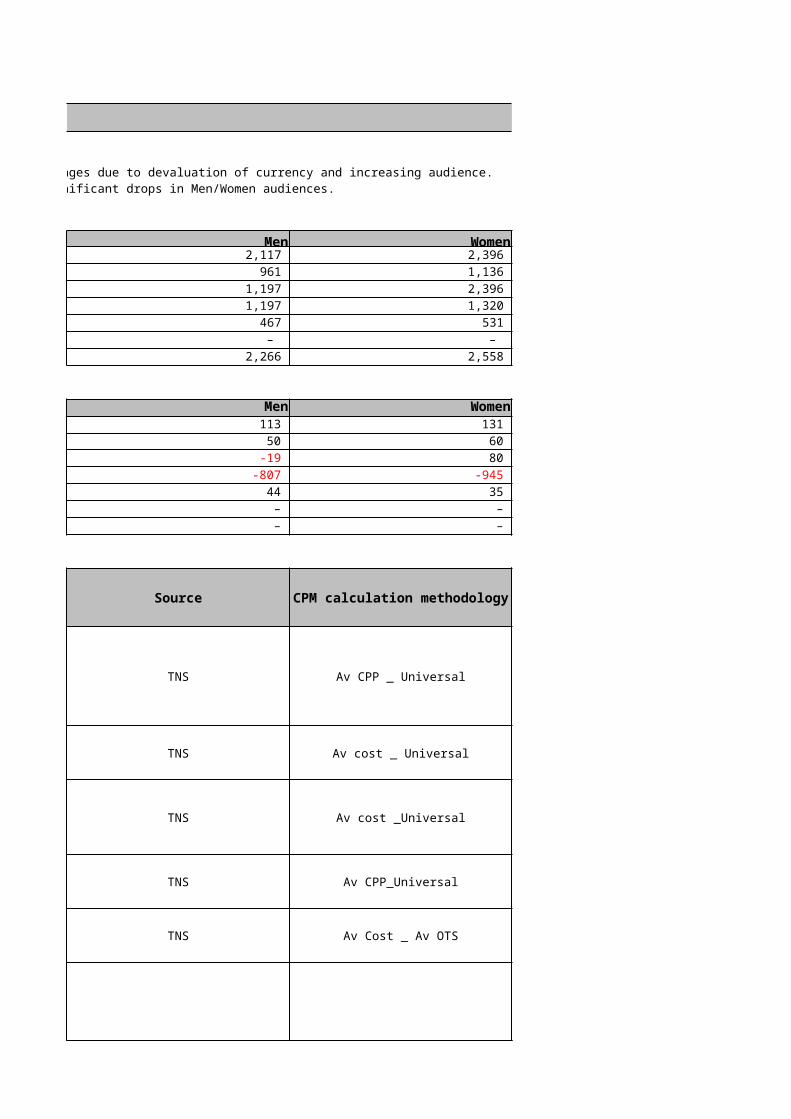
SERBIA 2016
Women Kids Main shoppers 2,757 642 2,232 2,752 – 2,975 2,752 – 2,975
– – – – – – – – –
1,364 – 631
Women Kids Main shoppers166 26 134 128 – 130 128 – 130
– – – – – – – – – 65 – 30
No
Net spend/ apsolute GRP * 1.000 All dailies listed in PrAdex Ipsos No
Net spend/ apsolute GRP * 1.000 No
– – – – – – – – – – – –
Internet20+Male 20+Female 20+–Shoppers, 20+All 15-29All 20+ higher incomeAll 20+ employed
CPM calculation methodology
What vendors have you used?
Are there any changes in methodology vs. last year?
Net spend/(GRPxuniverse/100.000)
All TV channels listed in NA Measurement
All weekly magazines listed in PrAdex Ipsos

SERBIA 2016
Young adults Upmarket adults Businessmen 877 1,248 2,465 906 1,225 4,110 906 1,225 4,110
– – – – – – – – –
1,271 90 1,570
Young adults Upmarket adults Businessmen13 64 117 41 19 83 41 19 83 – – – – – – – – – 61 4 75
– –
– – – – –
What assumptions have you made?
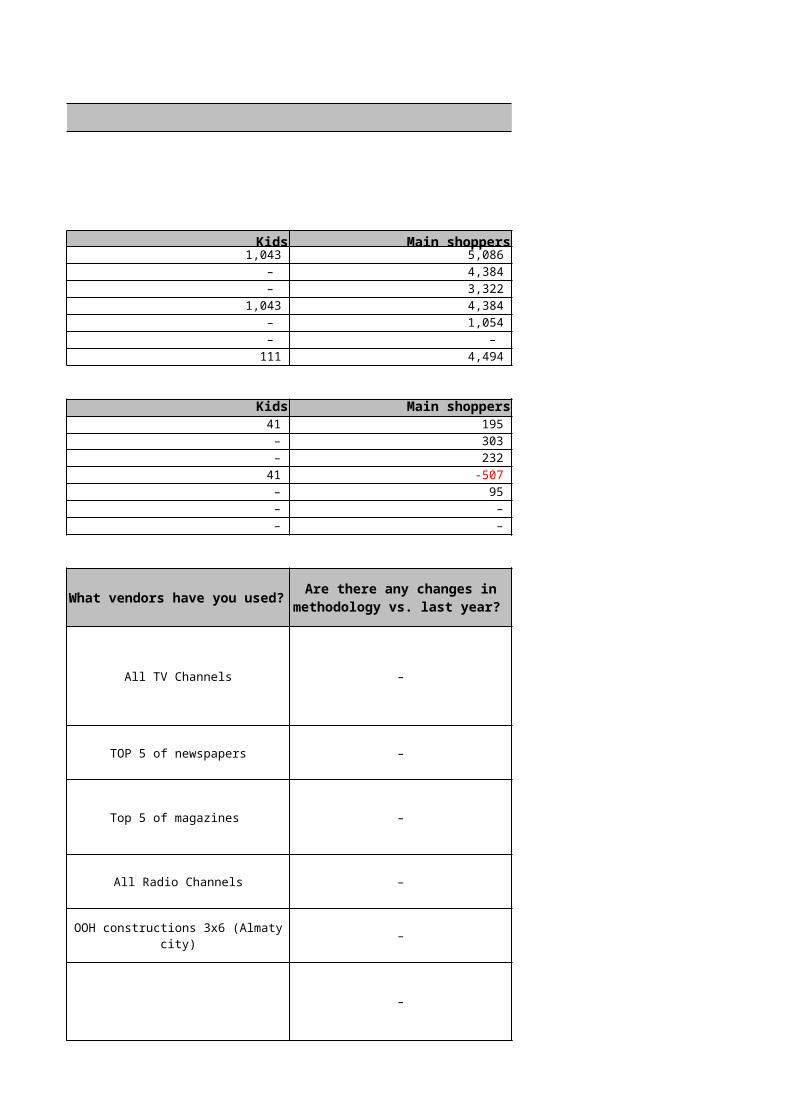
Country:SINGAPORE 2016
NOTESGeneral
UNIVERSES (000s)Adults Men
Television 2,387 1,137 Newspapers 1,448 766 Magazines 86 25 Radio 496 274 Out of home 4,183 2,114 Cinema 543 299 Internet 3,320 1,711
CHANGE IN UNIVERSE vs PREVIOUS YEAR (000s)Adults Men
Television 12 2 Newspapers -652 -339 Magazines -20 -3 Radio -40 26 Out of home 49 27 Cinema 32 16 Internet 142 74
SOURCES AND CPM CALCULATION METHODOLOGYMedium Ad size Source
Television 30 seconds Kantar Media
Newspapers A3, full colour Nielsen IMS Clear Decision R&F
Magazines Full page colour Nielsen IMS Clear Decision R&F
Radio 30 seconds Nielsen Radio Advisor R&F
Out of home Various Clear Channel
Cinema 30 seconds Golden Village
Internet Banner 468x60 Yahoo
Audience All mediaAdults P15+Men M15+
Overall budgets have held year-on-year, along with the general media mix, however there has been a shilft of spend within each media type: -Digital: Shift from banner display ads to programmatic and online video-TV: movement from Terrestrial TV to cable.
There has been a high YoY CPM change across the board because of the increase in universe size for most media types/TG’s, this can be attributed to: -increase in population:- natural migration -simultaneous multimedia consumption -overall increase in media consumption for digital-overall decrease in media consumption for offline (especially for newspapers and magazines

Women W15+Kids Ch5-14Main shoppers Grocery buyersYoung adults P18-34Upmarket adults Income > S$3000Businessmen PMEB

SINGAPORE 2016
Women Kids Main shoppers 1,249 656 1,312 682 436 714 61 24 42 221 165 252 2,069 1,206 2,186 244 160 229 1,609 1,048 1,642
Women Kids Main shoppers9 39 -36
-312 -220 -330 -17 -8 -31 -67 8 -77 22 33 -42 16 36 20 67 59 38
MediaCorp Ch8 No
SPH ST (Sat) No
MediaCorp 8 Days No
MediaCorp Radio Class 95FM No
Clear Channel No
Golden Village No
Yahoo No
Overall budgets have held year-on-year, along with the general media mix, however there has been a shilft of spend within each media type: -Digital: Shift from banner display ads to programmatic and online video
There has been a high YoY CPM change across the board because of the increase in universe size for most media types/TG’s, this can be attributed to:
-overall decrease in media consumption for offline (especially for newspapers and magazines
CPM calculation methodology
What vendors have you used?
Are there any changes in methodology vs. last year?
$9000 less 8% volume discount over 9pm Rtg% against TA
HPFC ROP $19944 less 6.75% volume discount
$3,360 less 5% series discount against TA
$700 less 14% volume discount over ave 5 MDT spots GRP%
against TA $120 per 6 sheet (based on 500K
contract)$850 Top Hall (Blockbuster and
Launch week) less 50% discount (80K contract)
Discounted cost on standard banner (eg 728x90) with targeting
filters (see Cell Q19 - 26).Kindly note that Yahoo is unable
to target Childrn (Age 5 - 14)

SINGAPORE 2016
Young adults Upmarket adults Businessmen 577 616 656 416 625 693 36 25 28 142 243 259 1,236 1,149 1,271 311 207 232 1,226 1,131 1,256
Young adults Upmarket adults Businessmen-8 36 25
-239 -153 -169 12 9 9 66 140 143 12 52 40 8 35 24
19 58 50
There is day-part or day targeting.
What assumptions have you made?
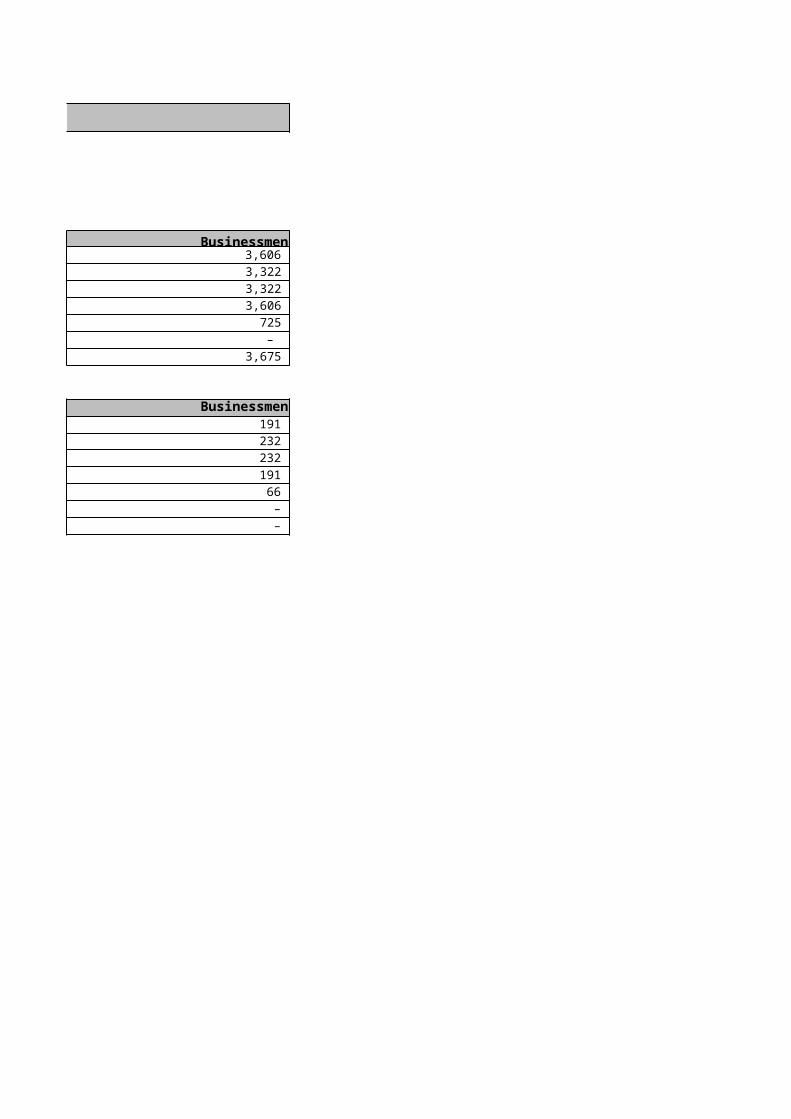
Country:SLOVAKIA 2016NOTESGeneral There is no relevant monitoring for OOH, Cinema and Internet, for CPT calculations. For newspapers, magazines and radio is monitored only audience in age 14-79.
Data for target group "main shopper" are not available for television measurement.
TV Price of TV advertisement is rising significantly due to high clutter and maximum sold out of comercial tv groups.
UNIVERSES (000s)Adults Men
Television 4,251 2,456 Newspapers 4,299 2,198 Magazines 4,299 2,198 Radio 4,299 2,198 Out of home – – Cinema – – Internet – –
CHANGE IN UNIVERSE vs PREVIOUS YEAR (000s)Adults Men
Television -87 -25 Newspapers -19 6 Magazines -19 6 Radio -19 6 Out of home – – Cinema – – Internet – –
SOURCES AND CPM CALCULATION METHODOLOGY
Medium Ad size Source
Television 30 seconds TNS PMT + TNS MI
Newspapers A3, full colour MML TGI + media price lists
Magazines Full page colour MML TGI + media price lists
Radio 30 seconds MML TGI + media price lists
Out of home Billboards (3*6) – Cinema 30 seconds – Internet Banner 468x60 –
Audience Television All Other MediaAdults All 18+ All 18–79 Men Men 0+ Men 14–79Women Women 0+ Women 14–79Kids All 0–12 –Main shoppers – All main shoppers 14–79Young adults All 16–20 All 16–20Upmarket adults All 18+ AB All 18–79 ABBusinessmen Businessmen Businessmen 14–79

SLOVAKIA 2016
There is no relevant monitoring for OOH, Cinema and Internet, for CPT calculations. For newspapers, magazines and radio is monitored only audience in age 14-79. Data for target group "main shopper" are not available for television measurement.
Price of TV advertisement is rising significantly due to high clutter and maximum sold out of comercial tv groups.
Women Kids Main shoppers 2,599 469 n/a 2,256 – 2,902 2,256 – 2,902 2,256 – 2,902
– – – – – – – – –
Women Kids Main shoppers-33 -8 – -28 – 4 -28 – 4 -28 – 4
– – – – – – – – –
No
No
No
No
– – – – – – – – –
CPM calculation methodology
What vendors have you used?
Are there any changes in methodology vs. last year?
Software calculated average CPT (on GRP basis) + net net
adjustment
All monitored channels - weighted average
Software calculated average CPT (on GRP basis) + net net
adjustment
Media with higher than 2% reach - weighted average
Software calculated average CPT (on GRP basis) + net net
adjustment
Media with higher than 2% reach - weighted average
Software calculated average CPT (on GRP basis) + net net
adjustment
Media with higher than 2% reach - weighted average
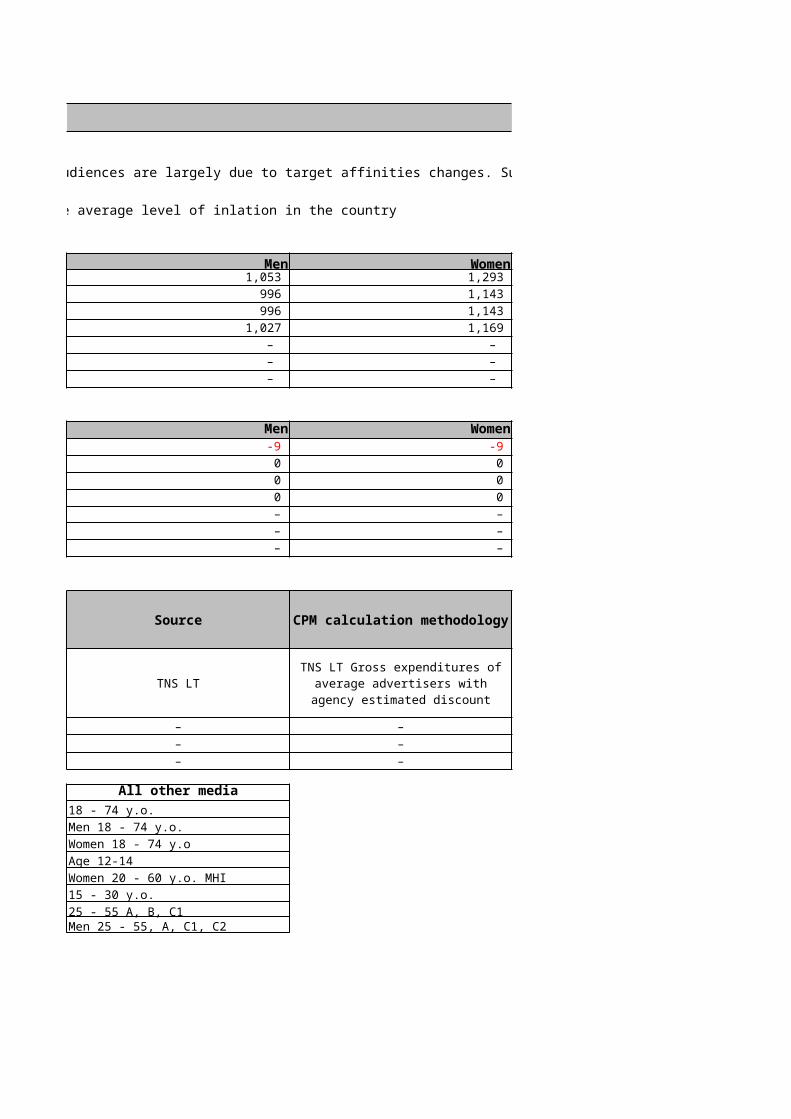
SLOVAKIA 2016
Young adults Upmarket adults Businessmen 413 726 261 388 1,065 268 388 1,065 268 388 1,065 268
– – – – – – – – –
Young adults Upmarket adults Businessmen0 0 0
-11 -4 8 -11 -4 8 -11 -4 8
– – – – – – – – –
–
–
–
– – –
What assumptions have you made?
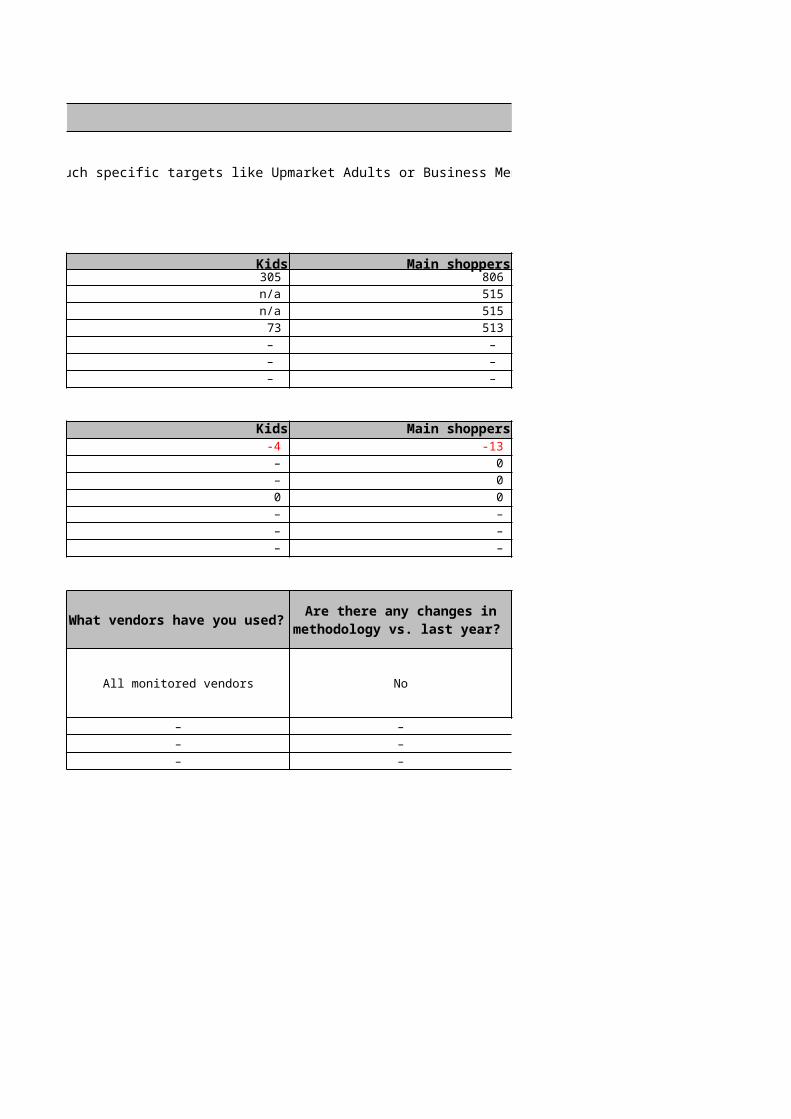
Country:SLOVENIA 2016NOTESTVPrint Non transparent market;major shifts still happerning (new editions with old names, etc.) Cinema Influenced by troubled Kolosej cinemaplexes especially in LjubljanaInternet Average price up under influence of shrinking inventory (a consequence of local publishers pushing new rich media formats to be sold as premium)
UNIVERSES (000s)Adults Men
Television 1,495 966 Newspapers 1,487 833 Magazines 1,487 833 Radio 1,530 847 Out of home 1,487 833 Cinema 1,487 833 Internet 1,149 595
CHANGE IN UNIVERSE vs PREVIOUS YEAR (000s)Adults Men
Television 0 0 Newspapers 0 0 Magazines 0 0 Radio 0 0 Out of home 0 0 Cinema 0 0 Internet 0 0
SOURCES AND CPM CALCULATION METHODOLOGY
Medium Ad size Source
Television 30 seconds AGB Arriana Slovenia
Newspapers A3, full colour IPSOS Media puls
Magazines Full page colour IPSOS Media puls
Radio 30 seconds Radiometrija
Out of home Billboards (3*6) Agency estimation
Cinema 30 seconds Agency estimation
Internet Banner 468x60 agency estimation
TV - average rating drop due to Time shift viewing; major sport events keeping men at TV stations
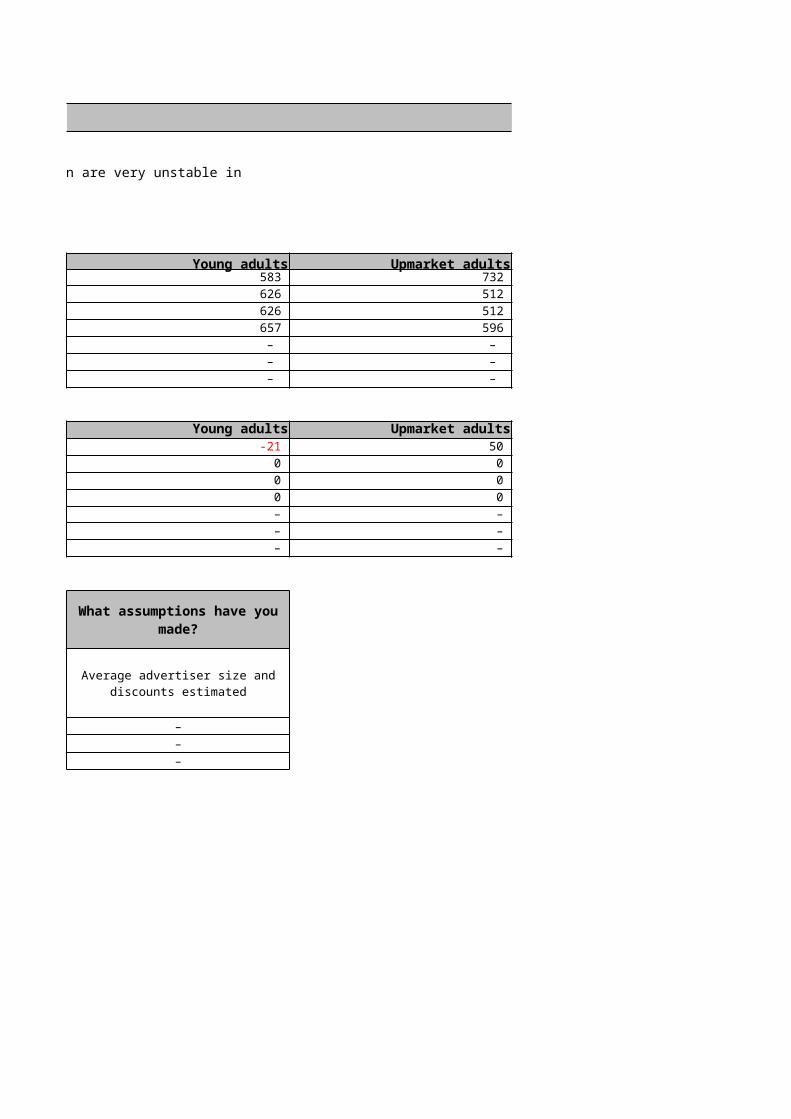
Audience TV All other mediaAdults All 15+ All 15+Men Men 15+ Men 15+Women Women 15+ Women 15+Kids All 4–14 All 10–14Main shoppers – –Young adults All 18–34 All 18–34Upmarket adultsBusinessmen
All 25–59, HH income > 1.3K All 25–59, HH income > 1.3K Managers, white collar employees, private enterprise owners
Managers, white collar employees, private enterprise owners

SLOVENIA 2016
Non transparent market;major shifts still happerning (new editions with old names, etc.) Influenced by troubled Kolosej cinemaplexes especially in LjubljanaAverage price up under influence of shrinking inventory (a consequence of local publishers pushing new rich media formats to be sold as premium)
Women Kids Main shoppers 989 219 693 873 219 650 873 219 650 835 111 770 873 219 650 873 219 650 554 219 513
Women Kids Main shoppers0 0 0 0 0 0 0 0 0 0 0 0 0 0 0 0 0 0 0 0 0
No
No
No
No
No
No
No
TV - average rating drop due to Time shift viewing; major sport events keeping men at TV stations
CPM calculation methodology
What vendors have you used?
Are there any changes in methodology vs. last year?
Net spend per campaign divided by
Main 2 commercial programmes (Pop TV and Kanal A) - Pro Plus,
main national Tv stations RTV Slovenia (TV Slo 1, TV Slo 2, Tv Slo 3), cable TV providers (FOX and CASMEDIA), Planet TV and Sport TV channels (Sport Klub and Newly monitored Sport TV)
1/1 RC price * Est.discount / Abs.RCH * 1000
Top 8 newspaper, different media houses - for classic nation wide
campaign.
1/1 RC price * Est.discount / Abs.RCH * 1000
Different 8 Magazines - different topics (from automotive, beauty
and health, politics etc.
1/1 RC price * Est.discount / Abs.RCH * 1000
We used data for Val 202 and Prvi program (two main national radio stations) and Radio 1, Radio City,
Radio Center (3 biggest commercial stations), all with
nation wide reach. In 2015 we included RA Aktual
that made it to top 5 in listenership
1/1 RC price * Est.discount / Abs.RCH * 1000
1/1 RC price * Est.discount / Abs.RCH * 1000
We used data for 2 main Cinema houses (Kolosej and Planet Tuš)
total spend divided by target group
top 5 internet publishers (24ur.com, najdi.si, siol.net,
bolha.com, rtvslo.si); Youtube, GDN
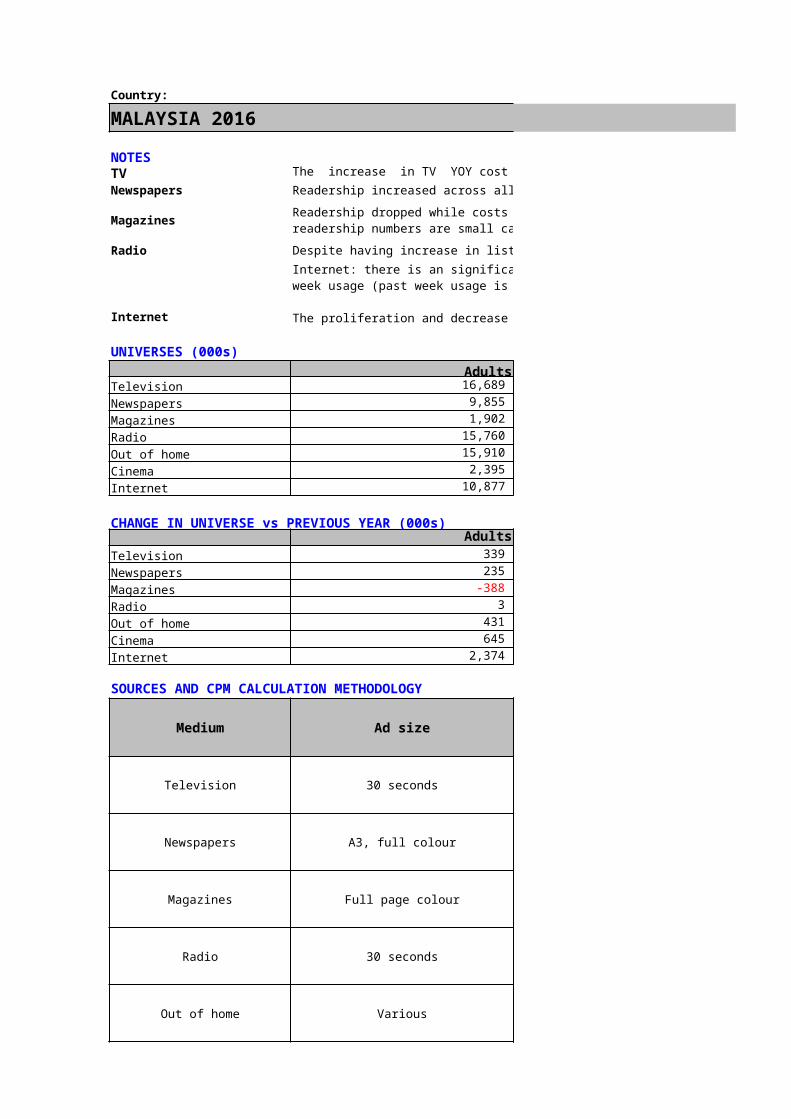
SLOVENIA 2016
Young adults Upmarket adults Businessmen 226 597 310 254 358 194 254 358 194 192 269 236 254 358 194 254 358 194 266 159 145
Young adults Upmarket adults Businessmen0 0 0 0 0 0 0 0 0 0 0 0 0 0 0 0 0 0 0 0 0
Decline of official circulation
Decline of official circulation
Fight for listenership
/
/
What assumptions have you made?
Smaller advertisers shifting budget to cheaper TV channels; Big sport
events influence viewership
Rise of CPM at Youtube, GDN because of clutter
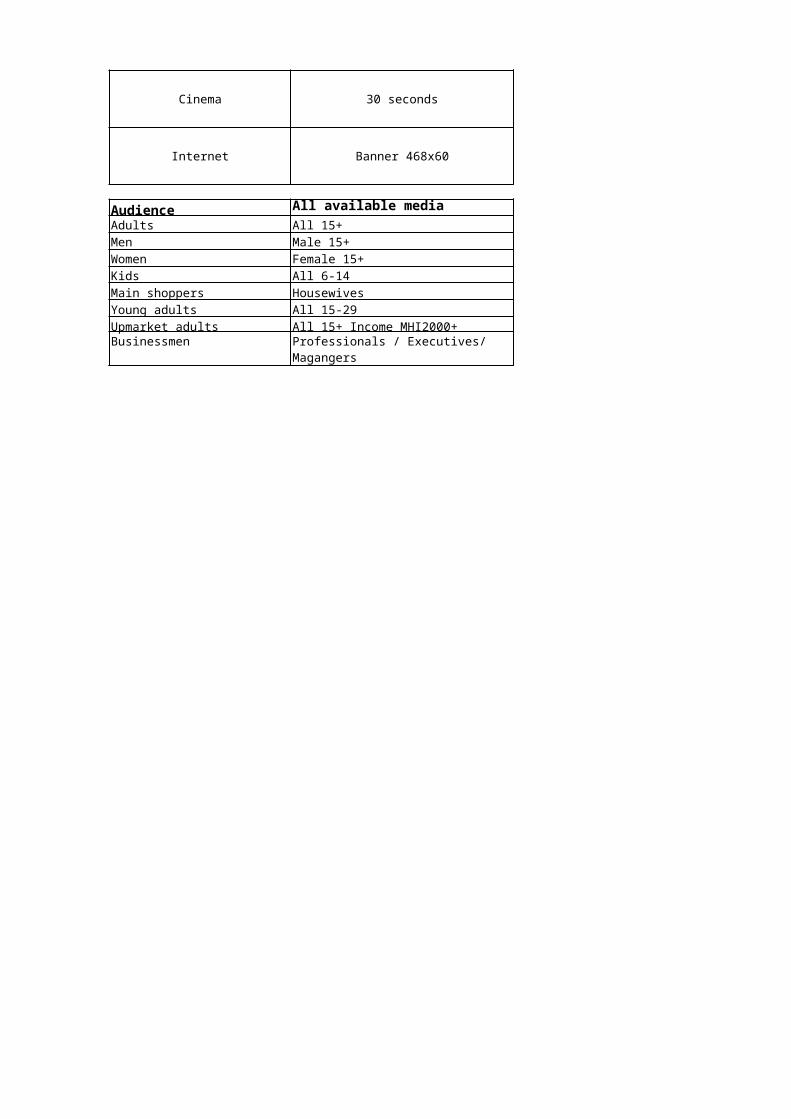
Country:SOUTH AFRICA 2016TV
Newspapers Community newspapers continue to drive their rates aggressively (+6.33%), whereas Weeklies (+3.6%) and Dailies (+4.4%) are more moderate. Radio African-language stations upped their rates by +17.16% whereas other stations increased by ju
UNIVERSES (000s)Adults Men
Television 35,050 17,034 Newspapers 17,419 9,650 Magazines 17,748 8,441 Radio 34,812 17,182 Out of home 32,554 16,068 Cinema 1,467 739 Internet 15,228 7,616
CHANGE IN UNIVERSE vs PREVIOUS YEAR (000s)Adults Men
Television -87 -71 Newspapers 677 175 Magazines 388 17 Radio -206 -76 Out of home -40 -103 Cinema -136 -50 Internet -1,298 -554
SOURCES AND CPM CALCULATION METHODOLOGY
Medium Ad size Source
Television 30 seconds Newspapers A3, full colourMagazines Full page colour
Radio 30 secondsOut of home Billboards (3*6)
Cinema 30 secondsInternet Banner 468x60
Audience All Available MediaAdults Ads 15+Men Men 15+Women Wom 15+KidsMain shoppers HH Purchaser Wholly ResponsibleYoung adults Ads 15–24Upmarket adults Ads LSM 8–10Businessmen Men LSM 9–10
TV rate adjustments would seem to reflect a repositioning of TV relative to competing media platforms, many of which are struggling. This appears to be an opportunistic move ahead of looming changes in the TV landscape occasioned by video on demand and the very uncertain digital migration of the TV
Media inflation sourced from the Ibis Media Inflation Watch -
average of 2015 annual and Q.1 2016 used per medium, on 2015
data.
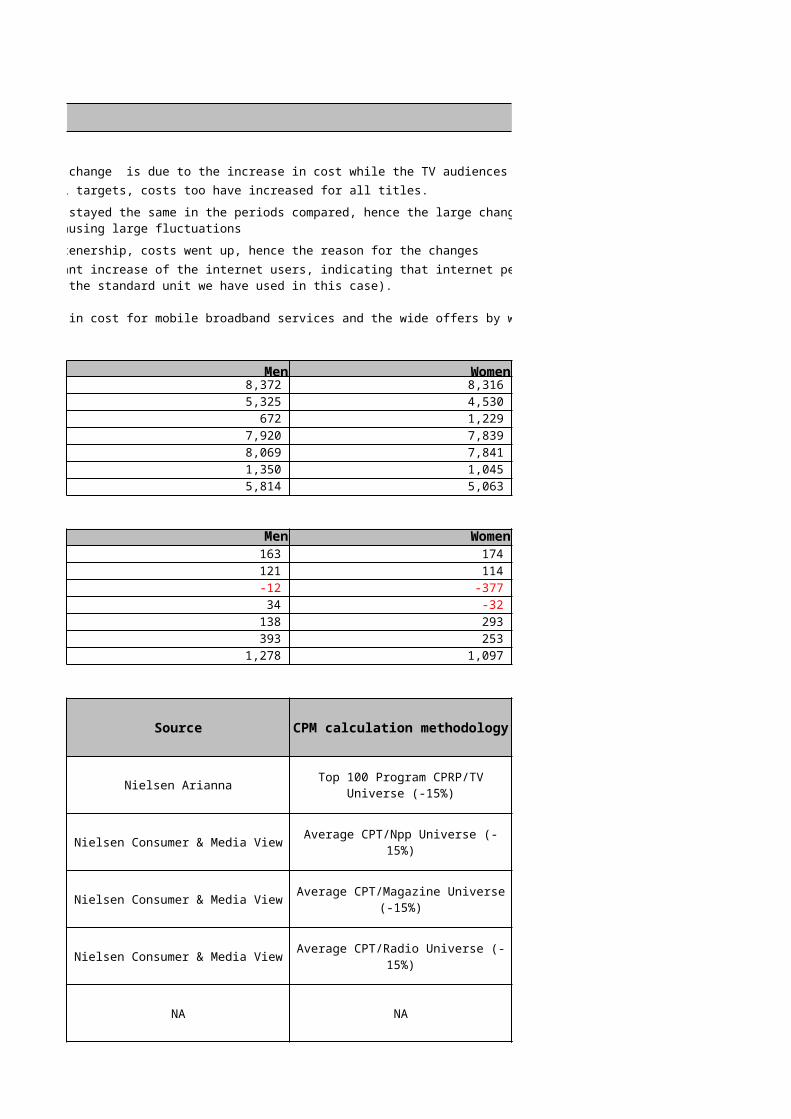
SOUTH AFRICA 2016
Community newspapers continue to drive their rates aggressively (+6.33%), whereas Weeklies (+3.6%) and Dailies (+4.4%) are more moderate. African-language stations upped their rates by +17.16% whereas other stations increased by ju
Women Kids Main shoppers 18,016 11,881 7,769 5,739 9,308 5,828 17,630 12,015 16,486 11,331 727 344 7,611 4,498
Women Kids Main shoppers-15 – -16,336 502 – -7,932 372 – -8,071
-131 – -16,418 63 – -15,128
-87 – -842 -745 – -8,369
TV rate adjustments would seem to reflect a repositioning of TV relative to competing media platforms, many of which are struggling. This appears to be an opportunistic move ahead of looming changes in the TV landscape occasioned by video on demand and the very uncertain digital migration of the TV
CPM calculation methodology
What vendors have you used?
Are there any changes in methodology vs. last year?
Control of TAMS and RAMS research now under the Broadcast
Research Council - no longer under SAARF; revamped panel
and updated meters

SOUTH AFRICA 2016
Young adults Upmarket adults Businessmen 8,880 9,331 3,062 4,042 6,106 2,165 4,979 6,533 1,981 8,765 9,016 2,976 8,180 9,228 3,081 587 1,066 410 5,180 6,698 2,418
Young adults Upmarket adults Businessmen20 232 69
239 478 167 189 173 -62
67 252 39 138 257 77 -28 -67 -16
-421 -355 -92
What assumptions have you made?

Country:SPAIN 2016TV For Kids and Young adult audiences there is a steady drop in the viewing
UNIVERSES (000s)Adults Men
Television 38,816 18,868 Newspapers 39,716 19,337 Magazines 39,716 19,337 Radio 39,716 19,337 Out of home 27,048 13,399 Cinema 39,716 19,337 Internet 29,167 14,751
CHANGE IN UNIVERSE vs PREVIOUS YEAR (000s)Adults Men
Television -21 -32 Newspapers -8 -21 Magazines -8 -21 Radio -8 -21 Out of home 0 0 Cinema -8 -21 Internet 5,135 2,500
SOURCES AND CPM CALCULATION METHODOLOGY
Medium Ad size Source
Television 30 seconds Media auditors (AMS/EBQ)
Newspapers A3, full colour EGM/Infoadex
Magazines Full page colour EGM/InfoadexRadio 30 seconds EGM/Infoadex
Out of home Billboards (3*6) GEOMEX/Infoadex
Cinema 30 seconds EGM/Infoadex
Internet Banner 468x60 COMSCORE/OMG internal pool
Audience Television PrintAdults Adults16+ Adults14+Men Men 16+ Men 14+Women Women 16+ Women 14+Kids Children 4-12 –Main shoppers Housewives HousewivesYoung adults 13-24 14-24Upmarket adults Adults +16 AB Adults +14 ABBusinessmen Men 25-54 AB Men 25-54 AB

SPAIN 2016For Kids and Young adult audiences there is a steady drop in the viewing
Women Kids Main shoppers 19,947 4,358 18,355 20,379 – 18,349 20,379 – 18,349 20,379 – 18,349 13,649 – 11,619 20,379 – 18,349 14,416 1,954 –
Women Kids Main shoppers11 12 53 13 – 52 13 – 52 13 – 52 -0 – -0 13 – 52
2,905 -308 –
No
No
Same as above Same as above NoSame as above Same as above No
Same as above No
Same as above No
Most important + huge long tail No
Radio/OOH/Cinema InternetAdults14+ Adults15+Men 14+ Men 15+Women 14+ Women 16+Children 4-12 Children 4-14Housewives Housewives14-24 15-24Adults +16 AB Adults +16 ABMen 25-54 AB Men 25-54 AB
CPM calculation methodology
What vendors have you used?
Are there any changes in methodology vs. last year?
Ind +16 CPP's converted into the different TA's by Univerese size
differences
4 Major TV channels groups concentrating 85% of the adspend
Annual average CPP's as Net adspend/Net GRP's ratio
converted into different TA's by Universe size differences
All matching both market's data sources
Urban furniture plus conventional billboards, vast majority of
market's adspend All matching both market's data
sourcesAverage Net CPP paid by a wide
range of clients /CPM buying type)
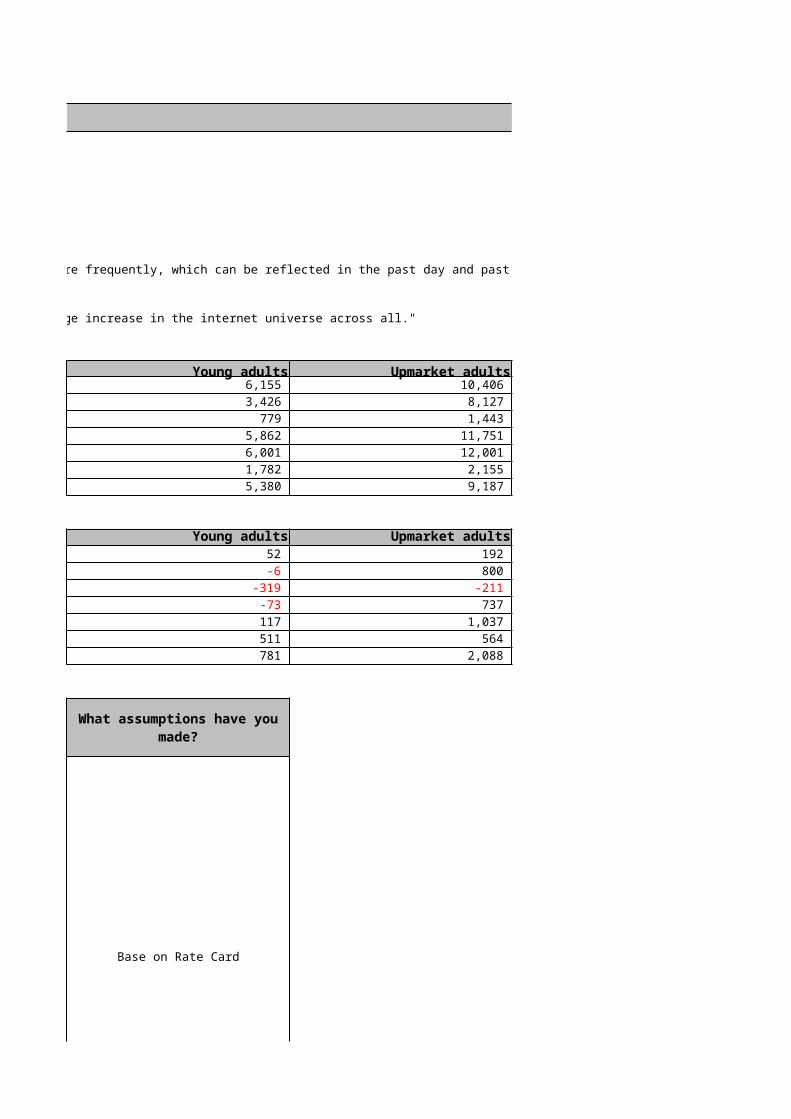
SPAIN 2016
Young adults Upmarket adults Businessmen 5,352 11,223 2,950 4,901 11,661 3,321 4,901 11,661 3,321 4,901 11,661 3,321 4,625 6,318 2,154 4,901 11,661 3,321 4,028 7,360 2,441
Young adults Upmarket adults Businessmen-4 192 237 -9 -154 -10 -9 -154 -10 -9 -154 -10 -0 -0 0 -9 -154 -10
-591 0 0
-
-Flat audience all day long
-
-
-
What assumptions have you made?
All buys done under Ind +16 buying umbrella

Country:
SWEDEN 2016NOTESTV
Radio
UNIVERSES (000s)Adults Men
Television 7,520 3,790 Newspapers 7,520 3,790 Magazines 7,520 3,790 Radio 7,520 3,790 Out of home 7,520 3,790 Cinema 7,520 3,790 Internet 7,520 3,790
CHANGE IN UNIVERSE vs PREVIOUS YEAR (000s)Adults Men
Television -484 -140 Newspapers -484 -140 Magazines -484 -140 Radio -484 -140 Out of home -484 -140 Cinema -484 -140 Internet -484 -140
SOURCES AND CPM CALCULATION METHODOLOGY
Medium Ad size Source
Television 30 seconds MMS/Advantage
Newspapers A3, full colour EGM
Magazines Full page colour EGM
Radio 30 seconds EGM
Out of home Billboards (3*6) GEOMEX
Cinema 30 seconds EGM
Internet Banner 468x60 COMSCORE
Audience All available mediaAdults All 15+Men Male 15+Women Female 15+Kids All 3–11
Although not as high and dramatic as 2015 inflation, the TV inflation for 2016 is still over 5% due to the high sold-out nature of the market as well as a decrease in viewership and subsequent underdeliveries (especially from MTG and SBS media houses). If viewing stays more stable than 2015, the TV market is expected to be a bit more in balance (ie it will not be the same sold-out inventory situation in the market as it has been the previous years).
Due to the underdeliveries and sold-out nature of TV, radio is experiencing spill-over effects leading to inflation over 5%. However, much like TV, 2016 radio will be more stable than 2015 and total radio spend in the market is forecasted to remain the same with a slight increase of 1-2%.
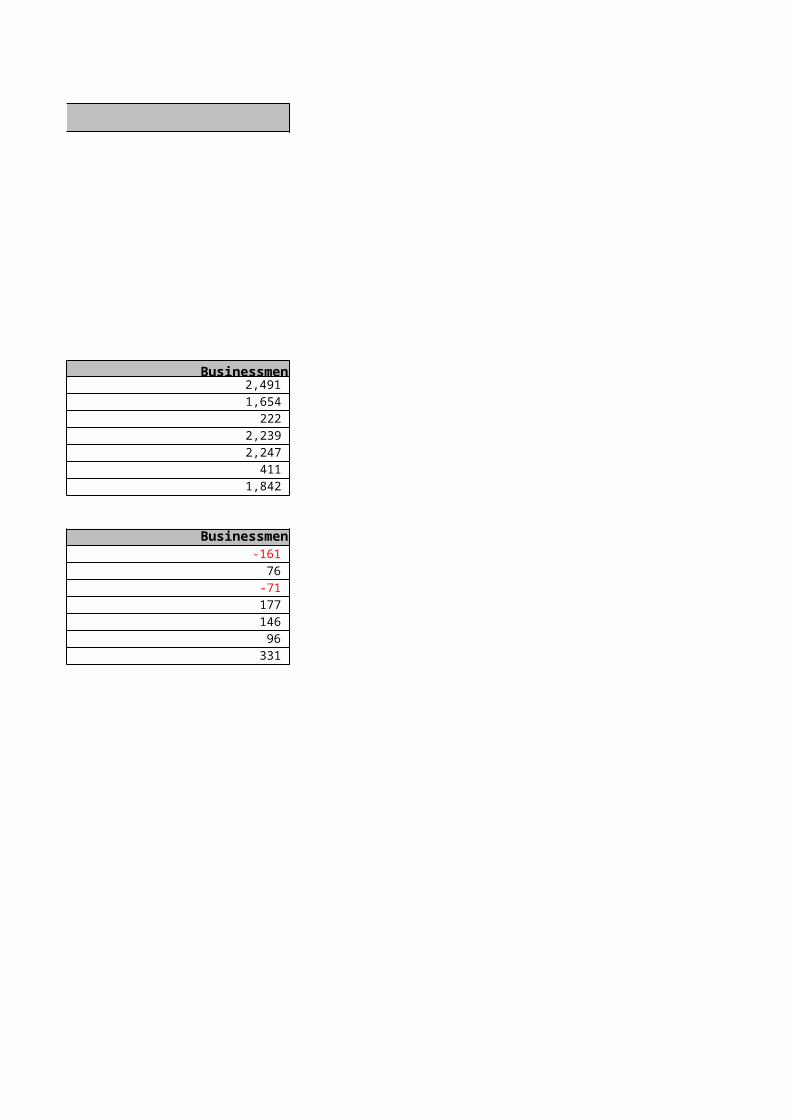
Main shoppers 14–49, ABC1Young adults ~50%< of the household shoppingUpmarket adults All 15–44, annual income of 264,000+Businessmen Full time worker with at least two years' university education
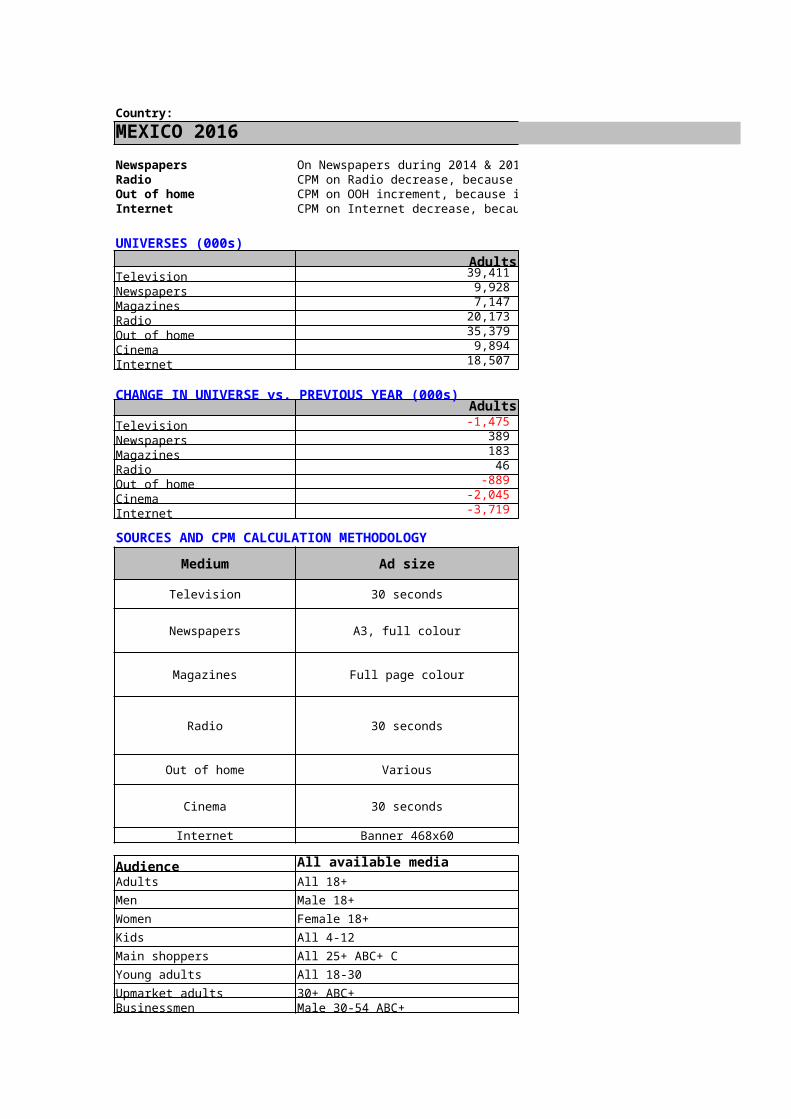
SWEDEN 2016
Women Kids Main shoppers 3,730 1,941 – 3,730 – 4,132 3,730 – 4,132 3,730 – 4,132 3,730 – 4,132 3,730 – 4,132 3,730 – 4,132
Women Kids Main shoppers-344 939 – -344 – -1,278 -344 – -1,278 -344 – -1,278 -344 – -1,278 -344 – -1,278 -344 – -1,278
–
Top 5 vendors –
Top 5 vendors –
All two vendors (SBS, MTG) –
JC Decaux and Clear Channel –
Only one vendor (SF) –
–
Although not as high and dramatic as 2015 inflation, the TV inflation for 2016 is still over 5% due to the high sold-out nature of the market as well as a decrease in viewership and subsequent underdeliveries (especially from MTG and SBS media houses). If viewing stays more stable than 2015, the TV market is expected to be a bit more in balance (ie it will not be the same sold-out inventory situation in the market as
Due to the underdeliveries and sold-out nature of TV, radio is experiencing spill-over effects leading to inflation over 5%. However, much like TV, 2016 radio will be more stable than 2015 and total radio spend in the market is forecasted to remain the same with a slight increase of 1-2%.
CPM calculation methodology
What vendors have you used?
Are there any changes in methodology vs. last year?
2015 Inflation and Seasonality factored in
All three vendors (TV4, MTG, SBS Discovery)
2015 Inflation and Seasonality factored in
2015 Inflation and Seasonality factored in
2015 Inflation and Seasonality factored in
2015 Inflation and Seasonality factored in
2015 Inflation and Seasonality factored in
2015 Inflation and Seasonality factored in
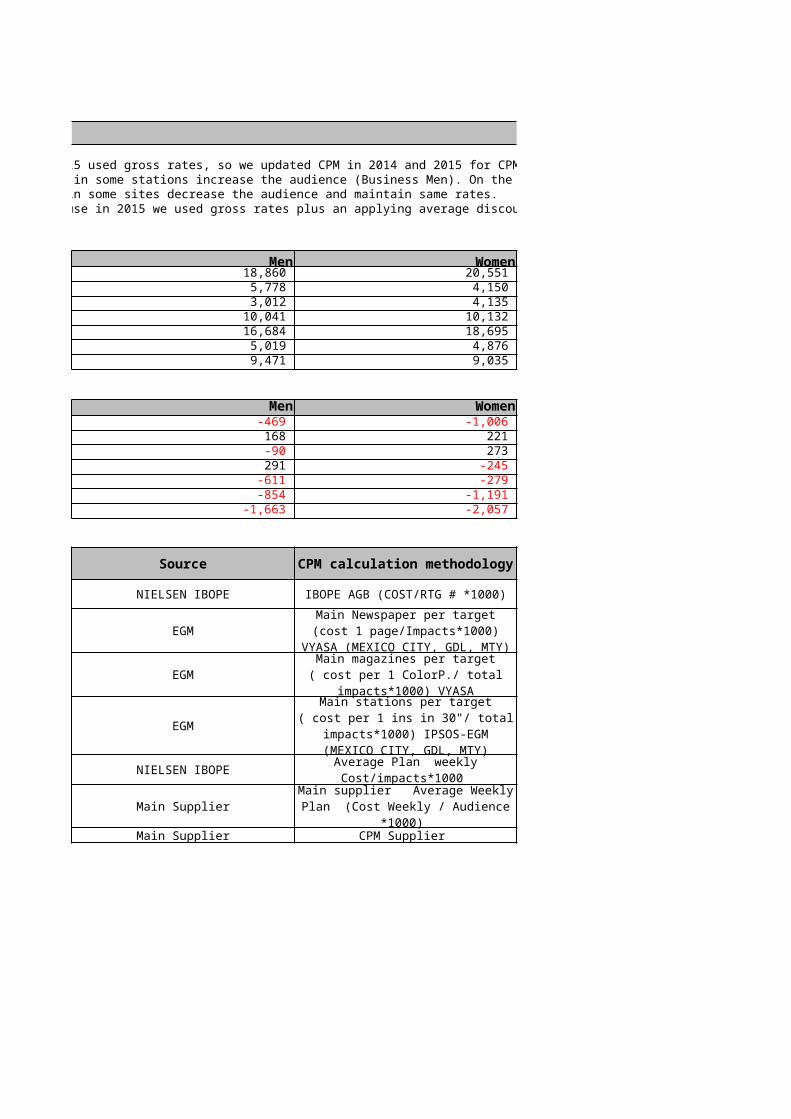
SWEDEN 2016
Young adults Upmarket adults Businessmen 3,619 – – 3,619 1,853 1,411 3,619 1,853 1,411 3,619 1,853 1,411 3,619 1,853 1,411 3,619 1,853 1,411 3,619 1,853 1,411
Young adults Upmarket adults Businessmen-68 – – -68 129 82 -68 129 82 -68 129 82 -68 129 82 -68 129 82 -68 129 82
–
–
–
–
–
–
–
Although not as high and dramatic as 2015 inflation, the TV inflation for 2016 is still over 5% due to the high sold-out nature of the market as well as a decrease in viewership and subsequent underdeliveries (especially from MTG and SBS media houses). If viewing stays more stable than 2015, the TV market is expected to be a bit more in balance (ie it will not be the same sold-out inventory situation in the market as
Due to the underdeliveries and sold-out nature of TV, radio is experiencing spill-over effects leading to inflation over 5%. However, much like TV, 2016 radio will be more stable than 2015 and total radio spend in
What assumptions have you made?
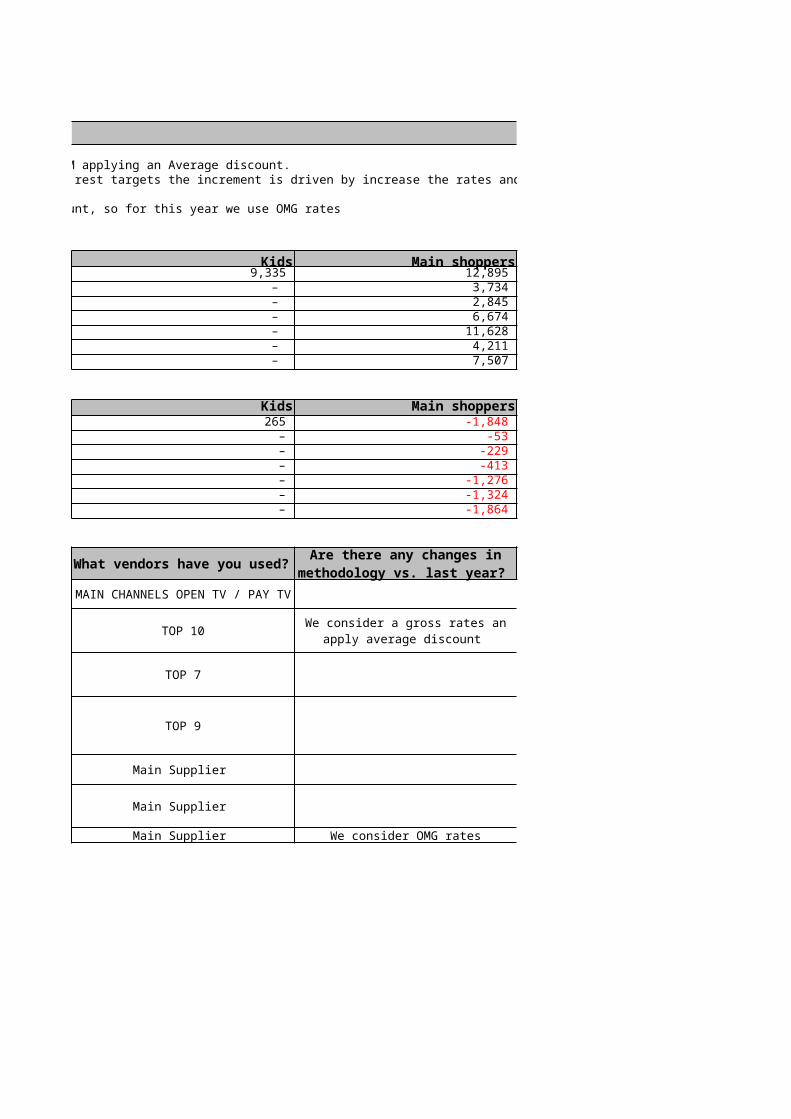
Country:
SWITZERLAND 2016NOTESGeneralTVPrint Stable pricing per page / insertion, but partly significant changes in usage.Cinema New vendor situation (only one vendor left in CH) and new calculation method of cpm, starting with 2015Internet We would recommend to switch from Fullbanner to IAB standards like 160x600, 300x250 and/or 728x90. Partly decreasing average pricings or limited inventory (businessmen)
Adults MenTelevision 5,968 1,627 Newspapers 5,917 1,727 Magazines 5,917 1,727 Radio 6,800 3,350 Out of home 4,497 2,165 Cinema 5,908 1,709 Internet 5,560 1,742
CHANGE IN UNIVERSE vs PREVIOUS YEAR (000s)Adults Men
Television -6 -33 Newspapers 45 6 Magazines 45 6 Radio 26 26 Out of home 2 2 Cinema 0 0 Internet 0 0
SOURCES AND CPM CALCULATION METHODOLOGY
Medium Ad size Source
Television 30 seconds –
Newspapers A3, full colour
Magazines Full page colour
Radio 30 seconds –
Out of home Billboards (3*6) SPR+
Cinema 30 seconds MACH Cinema Consumer 2015
Internet Banner 468x60 –
Audience Television Newspapers
We don’t have explanations for all target groups. It is a change of consumer behaviour and pricing and the small sample size (less stable numbers)In general.Kids always volatile, small Target group and very limited offer (vendor pricing is demand orientated). Adults with higher performance than expected and no pricing change.
MACH Basic 2016-1 - CPM = net/net costs standard campaign
(target group) / reader in '000
MACH Basic 2016-1 - CPM = net/net costs standard campaign
(target group) / reader in '000
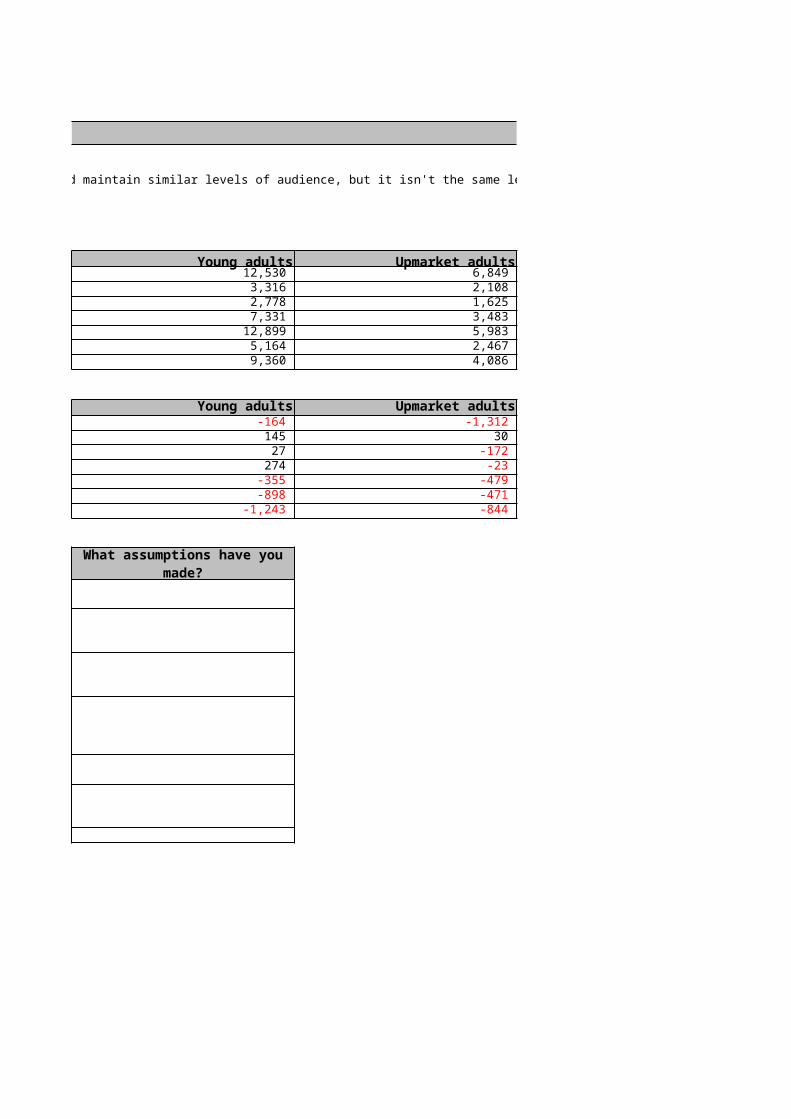
Adults 15-74 15-74Men 18-49 Men, 18-49Women 18-49 Women, 18-49Kids 3-14 –Main shoppers HCM 20-59 HCM allYoung adults 15-24 15-24Upmarket adults – –Businessmen Men all income 6'500++, full time
employed, higher education20+, Income p.a. CHF 100'000+, independent contractor (with at least 4 employees)/entrepreneur with higher education/executive

SWITZERLAND 2016
Stable pricing per page / insertion, but partly significant changes in usage.New vendor situation (only one vendor left in CH) and new calculation method of cpm, starting with 2015We would recommend to switch from Fullbanner to IAB standards like 160x600, 300x250 and/or 728x90. Partly decreasing average pricings or limited inventory (businessmen)
Women Kids Main shoppers 1,607 883 2,160 1,672 – 5,253 1,672 – 5,253 3,470 1,620 2,600 2,336 – 3,496 1,670 – 5,139 1,702 – 1,483
Women Kids Main shoppers-43 -13 -35 -1 – 112 -1 – 112 20 1,703 10 2 – 2 0 – 0 0 – 0
– – –
–
–
– – –
according to SPR+ APG/Clear Channel No
Werbeweischer –
– – –
Magazines Radio OOH
We don’t have explanations for all target groups. It is a change of consumer behaviour and pricing and the small sample size (less stable numbers)
Kids always volatile, small Target group and very limited offer (vendor pricing is demand orientated). Adults with higher performance than expected and no pricing change.
CPM calculation methodology
What vendors have you used?
Are there any changes in methodology vs. last year?
Total costs average campaign divided by target group
Primary top vendors in target group: Ringier, Tamedia
Total costs average campaign divided by target group
Primary top vendors in target group: Ringier, Tamedia
Total costs average campaign divided by target group
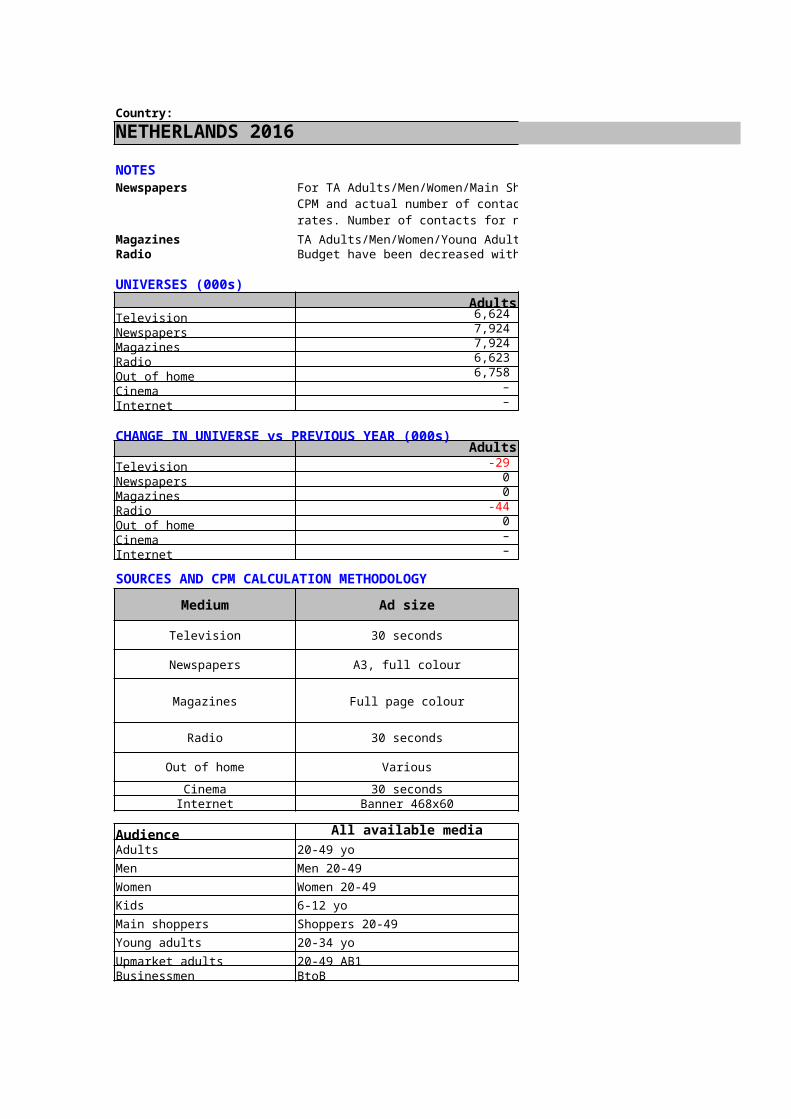
15-74 15+ 15+Men, 18-49 15+ Men, 15+Women, 18-49 15+ Women, 15+– 1-14 –HCM all leading household 30+15-24 15-24 15-29– – –
25+ employed –20+, Income p.a. CHF 100'000+, independent contractor (with at least 4 employees)/entrepreneur with higher education/executive
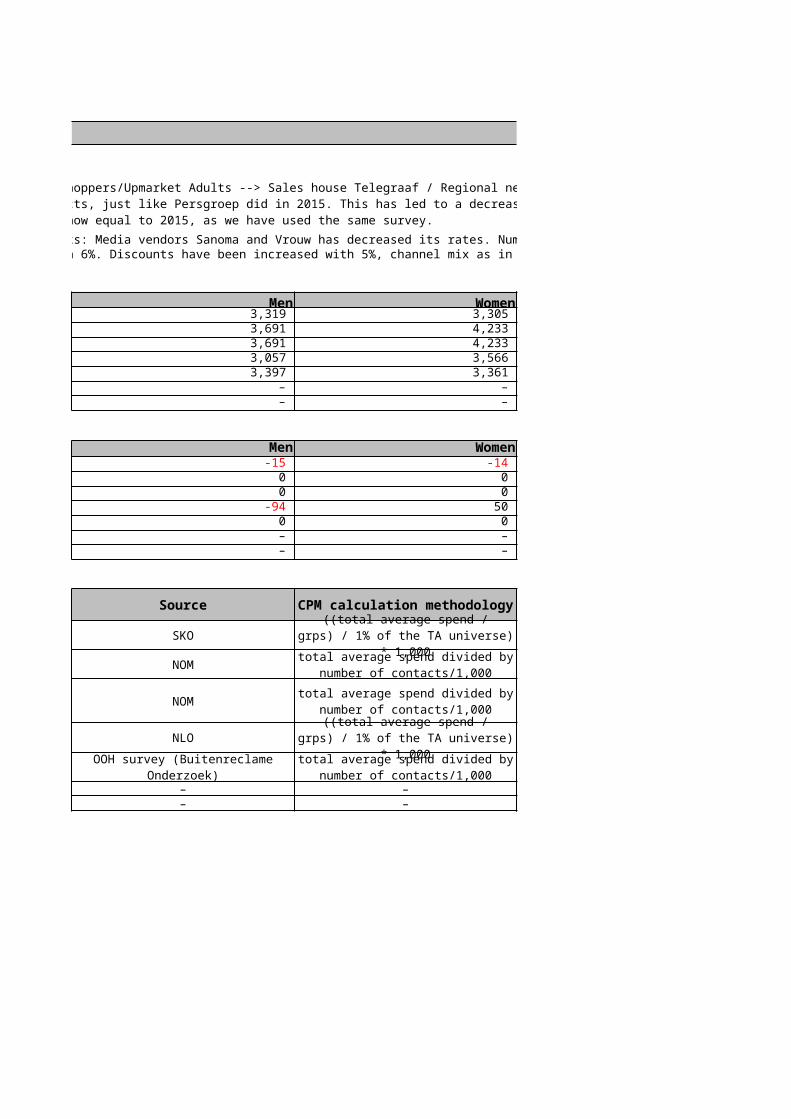
SWITZERLAND 2016
Stable pricing per page / insertion, but partly significant changes in usage.New vendor situation (only one vendor left in CH) and new calculation method of cpm, starting with 2015We would recommend to switch from Fullbanner to IAB standards like 160x600, 300x250 and/or 728x90. Partly decreasing average pricings or limited inventory (businessmen)
Young adults Upmarket adults Businessmen 992 – 1,100 907 – 436 907 – 436 940 – 1,480 1,002 – – 916 – 1,241 945 – 1,255
Young adults Upmarket adults Businessmen60 – 26 2 – 0 2 – 0
11 – 2 2 – – 0 – 0 0 – 0
–
–
–
–
rise in population
–
–
Cinema Internet
Kids always volatile, small Target group and very limited offer (vendor pricing is demand orientated). Adults with higher performance than expected and no pricing change.
What assumptions have you made?
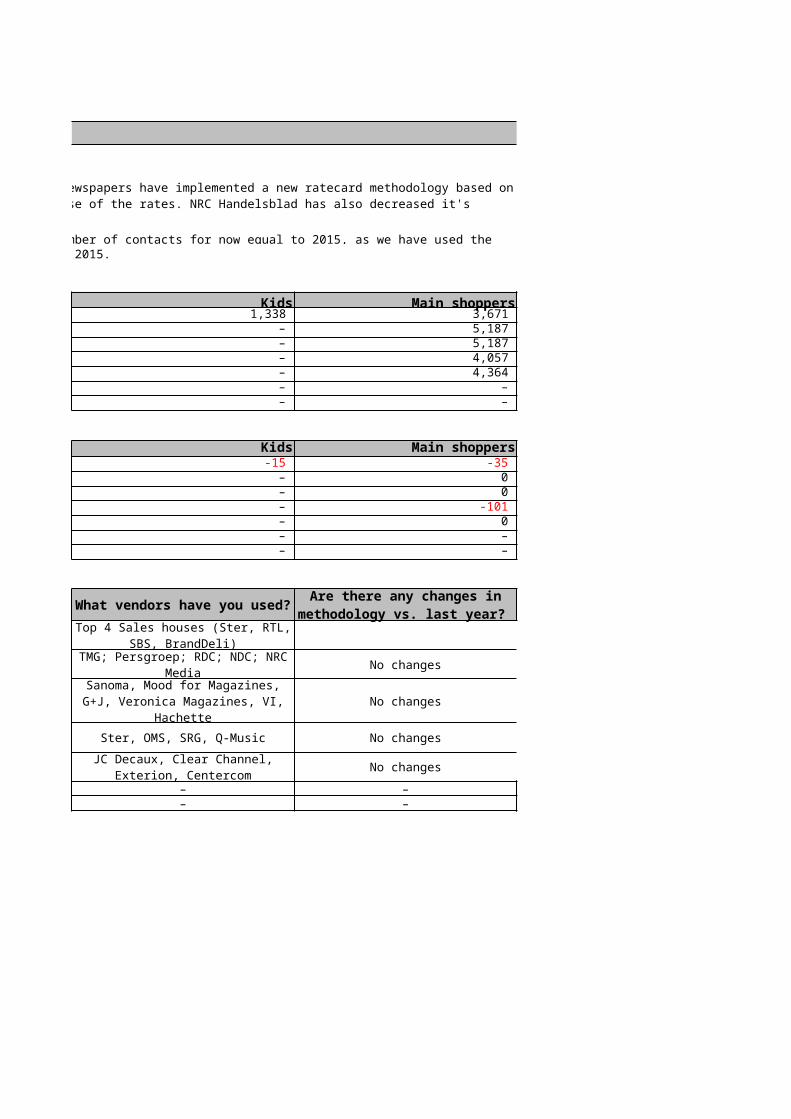
15-74 15-74Men, 18-49 Men, 18-49Women, 18-49 Women, 18-49– –HCM all HCM 15-7415-24 15-24– –20+, houshold income p.m. CHF 10'000+, independent contractor (with at least 4 employees)/entrepreneur with
Employees in Leading Position / HH Income 100TCHF
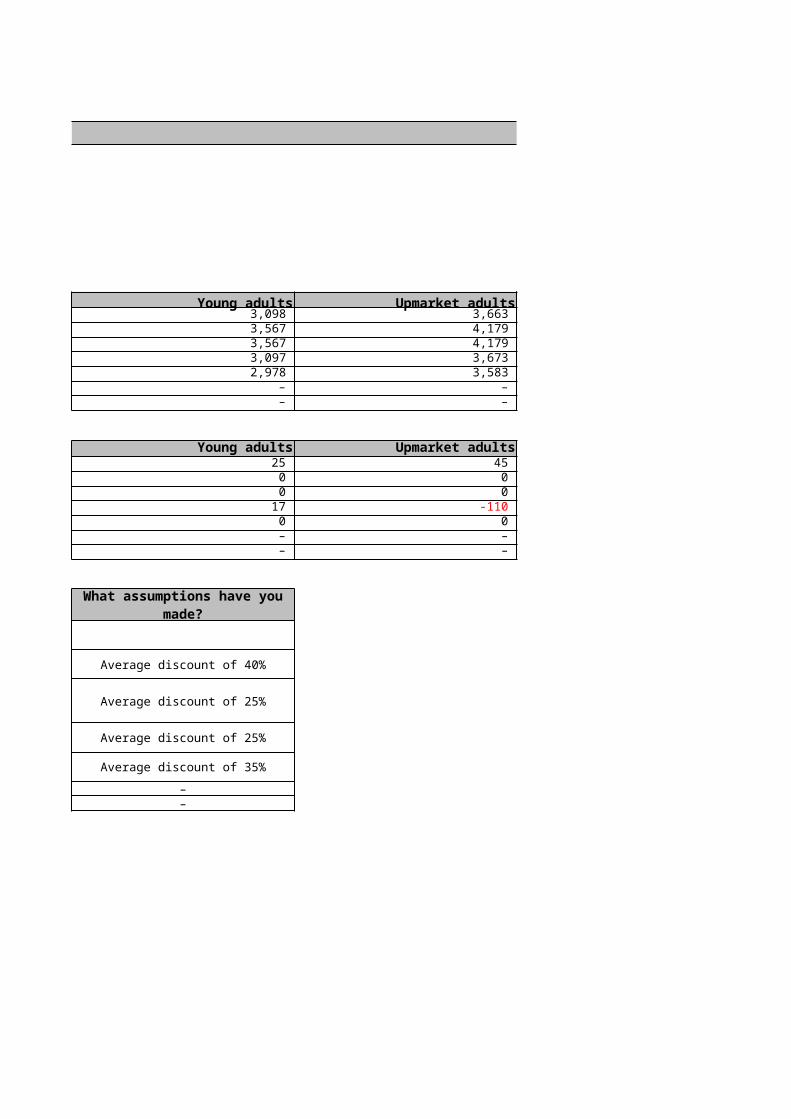
Country:
TAIWAN 2016NOTESGeneral
UNIVERSES (000s)Adults Men
Television 19,727 9,755 Newspapers 5,585 2,934 Magazines 4,516 2,140 Radio 4,018 2,332 Out of home 12,536 6,319 Cinema 2,334 1,208 Internet 14,310 7,179
CHANGE IN UNIVERSE vs PREVIOUS YEAR (000s)Adults Men
Television 62 26 Newspapers -302 -94 Magazines -223 -47 Radio -174 -124 Out of home -341 -155 Cinema -247 -76 Internet 618 304
SOURCES AND CPM CALCULATION METHODOLOGY
Medium Ad size Source
Television 30 seconds Nielsen Arianna 1/1-5/2, 2016
Newspapers A3, full colour
Magazines Full page colour
Radio 30 seconds
Out of home Billboards (3*6)
Cinema 30 seconds
Internet Banner 468x60
Audience All available mediaAdults Adults 15+
Please note we have provided the 2016 estimated figures. 1. The total digital ad-spending was increased by +19.6% based on DMA April 2016 report.2. The FP4C ad cost for Apple Daily in 2016f (Circ. 250,000 currently) are $720,000. 3. The FP4C ad cost for Business Weekly decreased to $165,000 in 2016 currently.4. TV CPRP for Male 15+ estimated to be flat in 2016 estimation. The same situation happened to Kids CPRP 4,800 in 2016 estimation.5. Readership for top 10 Magazines increased over 11% in 2015Q4-2016Q1 for most targets, except F15+.6. Readership for top 4 Newspapers increased significantly among Upmarket adults and Businessmen.
Nielsen Media Index Oct. 2015-Mar.2016
Nielsen Media Index Oct. 2015-Mar.2016
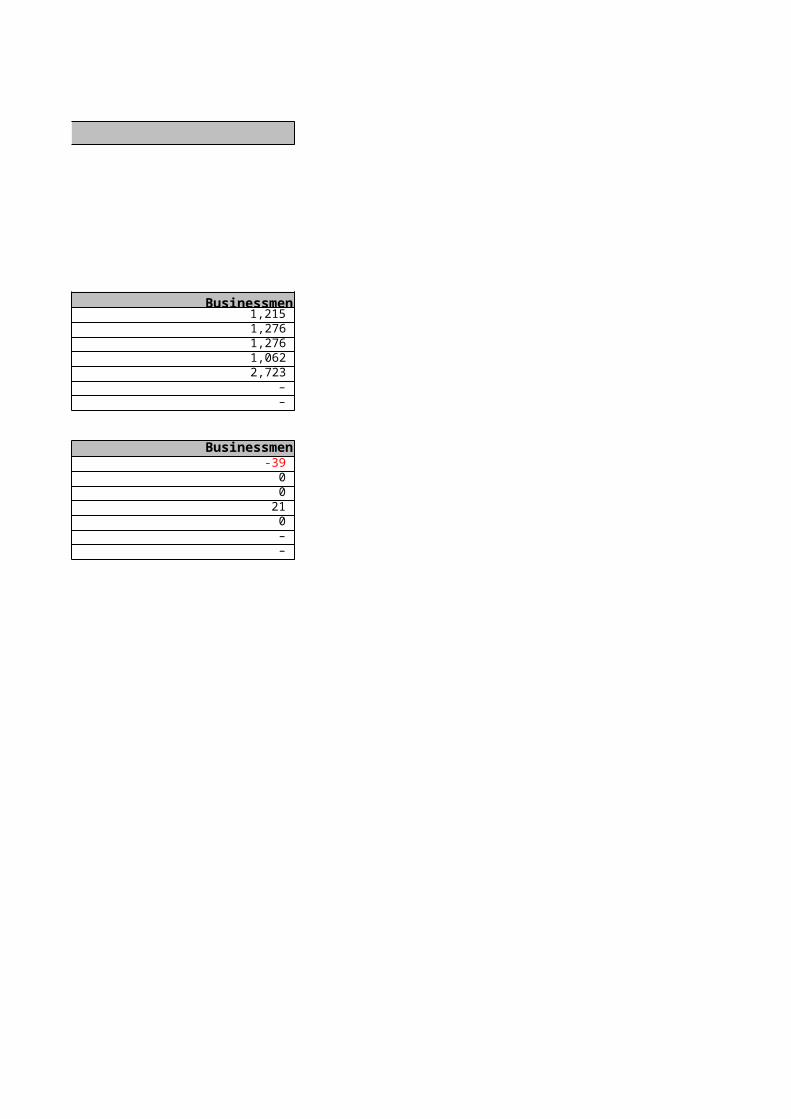
Men Male 15+Women Female 15+Kids 4-9Main shoppers
Young adults P 15-24Upmarket adults
Businessmen
Decision maker of H/H hardware, ie computer, air-conditioning, car,…
P15+ with monthly H/H income NT$70,000+P15+ working with monthly household income NT$70,000+
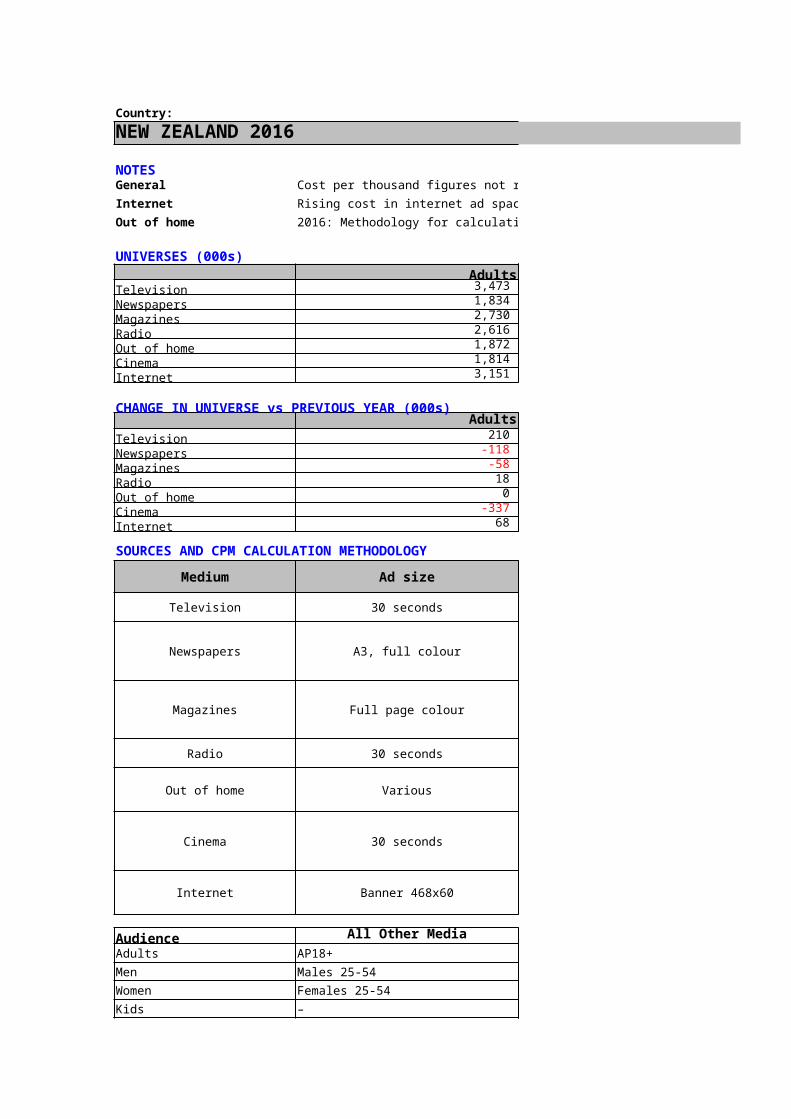
TAIWAN 2016
Women Kids Main shoppers 9,972 1,166 – 2,651 – 5,000 2,377 – 3,951 1,686 – 3,577 6,217 – 10,555 1,126 – 1,942 7,131 – 12,079
Women Kids Main shoppers36 -7 –
-209 – -251 -175 – -194 -50 – -177
-186 – -304 -170 – -211 313 – 547
Average CPRP for all TV stations
CPM=Cost/Reach'000 Top 4 papers
CPM=Cost/Reach'000 Top 10 titles
Please note we have provided the 2016 estimated figures. 1. The total digital ad-spending was increased by +19.6% based on DMA April 2016 report.2. The FP4C ad cost for Apple Daily in 2016f (Circ. 250,000 currently) are $720,000. 3. The FP4C ad cost for Business Weekly decreased to $165,000 in 2016 currently.4. TV CPRP for Male 15+ estimated to be flat in 2016 estimation. The same situation happened to Kids CPRP 4,800 in 2016 estimation.5. Readership for top 10 Magazines increased over 11% in 2015Q4-2016Q1 for most targets, except F15+.6. Readership for top 4 Newspapers increased significantly among Upmarket adults and Businessmen.
CPM calculation methodology
What vendors have you used?
Are there any changes in methodology vs. last year?
CPM=30"CPRP/(Universe'000/100)
FP4C AD positioned at A3 positiom
FP4C AD positioned in the 1st half of book

TAIWAN 2016
Young adults Upmarket adults Businessmen 3,002 13,112 8,819 616 2,970 1,028 831 2,328 831 312 1,949 846 2,392 6,379 1,936 822 1,195 400 3,003 6,734 2,133
Young adults Upmarket adults Businessmen-55 440 224 -84 -8 -46 -91 -10 -44 -72 108 29 -91 123 20
-166 -97 14 4 556 134
What assumptions have you made?
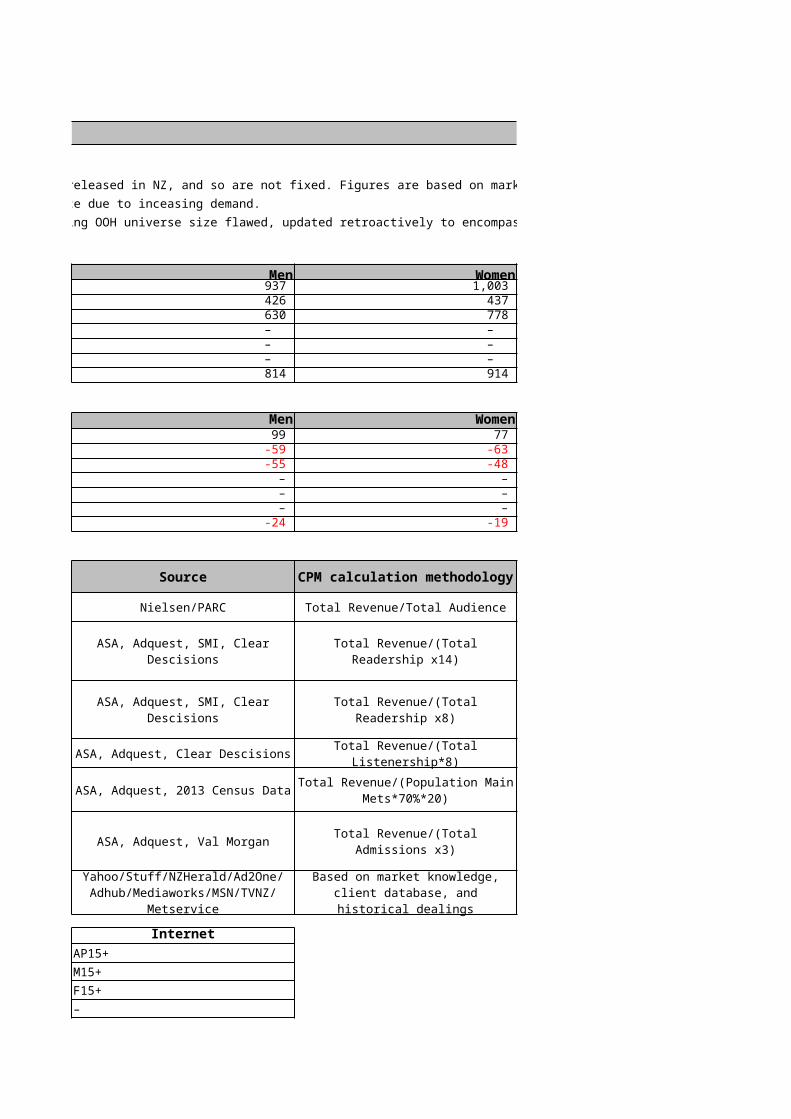
Country:TURKEY 2016NOTESTVNewspapers
Internet Internet universes are decreasing because internet research covers only PC and PC usage is decreasing in Turkey.
UNIVERSES (000s)Adults Men
Television 41,837 20,669 Newspapers 37,317 18,402 Magazines – – Radio – – Out of home – – Cinema – – Internet 15,203 9,906
CHANGE IN UNIVERSE vs PREVIOUS YEAR (000s)Adults Men
Television 1,874 1,008 Newspapers 2 30 Magazines – – Radio – – Out of home – – Cinema – – Internet -1,717 -914
SOURCES AND CPM CALCULATION METHODOLOGY
Medium Ad size Source
Television 30 seconds
Newspapers A3, full colour TNS
Magazines Full page colour – Radio 30 seconds –
Out of home Billboards (3*6) – Cinema 30 seconds – Internet Banner 468x60 OMD & IAB Gemius IPSOS
Audience Television NewspapersAdults All, 20+ All, 20+Men Males, 20+ Males, 20+Women Female, 20+ Female, 20+Kids 5-11 year olds –Main shoppers 20+ ABC1 20+ HousekeeperYoung adults 20-34 year olds 20-34 year oldsUpmarket adults 20+ AB 20+ ABBusinessmen 20+ Male AB 20+ Male AB
At the beginnging of December 2015, TV panel changed according to new establishment survey. AB and C1 sosyo-economic group's universe increased. 5-11 age group's universe decreased. Advertiser mix of newspapers has changed. Some high priced sectors's demand (like construction) increased. Also Zaman (which was one of the main newspapers) was closed by the government. Therefore, inflation rate of newspapers increased.
OMD&TNS&Advertiser association

TURKEY 2016
Internet universes are decreasing because internet research covers only PC and PC usage is decreasing in Turkey.
Women Kids Main shoppers 21,168 6,944 15,422 18,915 19,495
– – – – – – – – – – – –
6,562 1,926 6,519
Women Kids Main shoppers866 -186 2,627 -28 – -184
– – – – – – – – – – – –
-1,018 -314 -2,021
Main 7 TV channels
Estimated cost divided by universe
– – – – – – – – – – – –
InternetAll, 20+Male, 18+Female, 18+12-14 year olds20+ ABC118-3418+ AB25+ Male AB
At the beginnging of December 2015, TV panel changed according to new establishment survey. AB and C1 sosyo-economic group's universe increased. 5-11 age group's Advertiser mix of newspapers has changed. Some high priced sectors's demand (like construction) increased. Also Zaman (which was one of the main newspapers) was closed by the government. Therefore, inflation rate of newspapers increased.
CPM calculation methodology
What vendors have you used?
Are there any changes in methodology vs. last year?
main 7 tv channels' spend divided by total grp and universe
2 measured channel (STV and Kanaltürk) was closed at
November 2015. 2015 data includes STV figures, but 2016
data excludes it.
5 main newspapers (Hurriyet, Milliyet, Sabah, Posta,Sözcü)
Zaman was one of the main newspapers, but in 2015 its
performance decreased. At the beginning of 2016 it was closed by
the government. Therefore we replaced Zaman with Sözcü
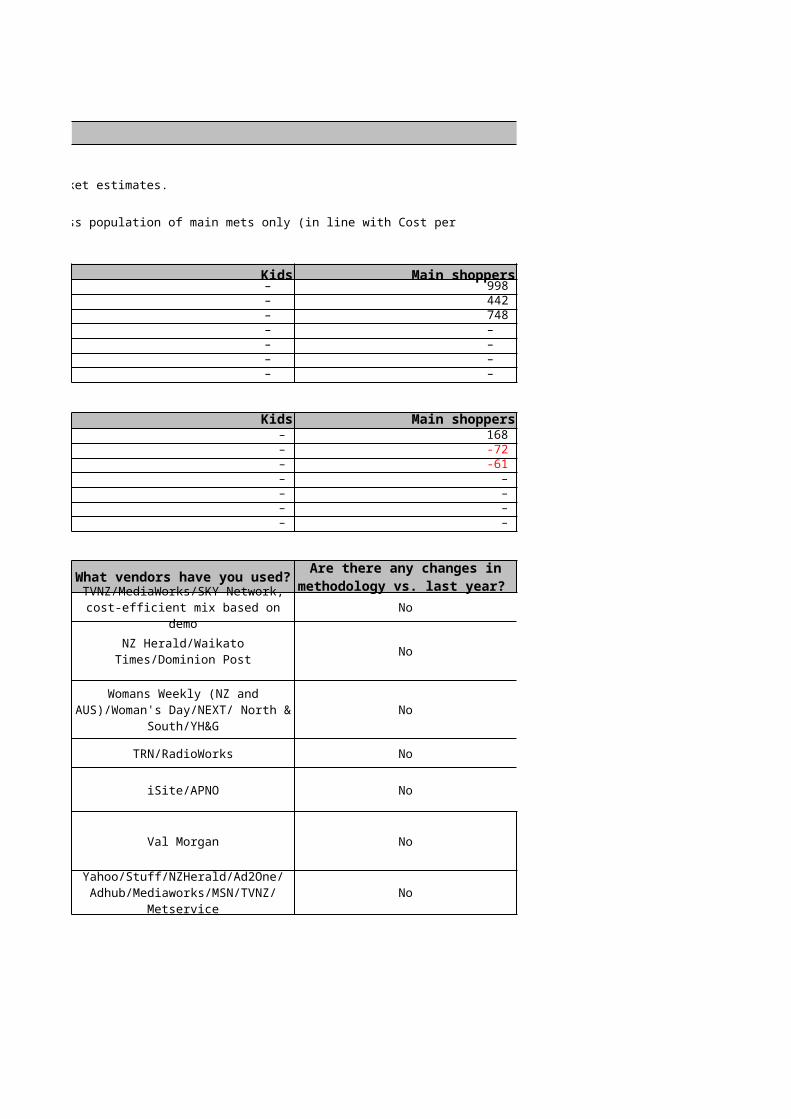
TURKEY 2016
Young adults Upmarket adults Businessmen 15,211 5,811 2,966 14,733 5,540 3,187
– – – – – – – – – – – –
10,366 2,514 1,183
Young adults Upmarket adults Businessmen1,194 1,234 698
3 -22 21 – – – – – – – – – – – –
-1,354 -1,236 -967
– – – –
What assumptions have you made?
We assume that there will be no changes in the panel structure.
Also we assume number of measured channel will not change
in 2016.

Country:UNITED KINGDOM 2016NOTES
UNIVERSES (000s)Adults Men
Television 50,173 24,331 Newspapers 51,814 25,315 Magazines 51,814 25,315 Radio 53,575 26,172 Out of home 50,173 24,331 Cinema 50,173 24,331 Internet 46,533 23,846
CHANGE IN UNIVERSE vs PREVIOUS YEAR (000s)Adults Men
Television 539 259 Newspapers 54 41 Magazines 54 41 Radio 73 55 Out of home 539 259 Cinema 539 259 Internet 1,422 844
SOURCES AND CPM CALCULATION METHODOLOGY
Medium Ad size SourceTelevision 30 seconds NMR / BARB / OPera*
Newspapers A3, full colour NRS
Magazines Full page colour NRS
Radio 30 seconds RAB/OPeraOut of home Billboards (3*6) Talon
Cinema 30 seconds NMR / DCM / OPera**
Internet Banner 468x60 OPera
Audience Television NewspapersAdults Age 16+ Age 15+Men Age 16+ Age 15+Women Age 16+ Age 15+Kids Age <16 –Main shoppers Main Shoppers Main ShoppersYoung adults Age 16–34 Age 15–24Upmarket adults ABC1 ABC1Businessmen AB AB

UNITED KINGDOM 2016
Women Kids Main shoppers 25,842 – 26,521 26,499 – 26,532 26,499 – 26,532 27,404 – 45,156 25,842 – 26,521 25,842 – 26,521 22,688 – –
Women Kids Main shoppers279 – 400
13 – -9,915 13 – -9,915 19 – -89
279 – 10,234 279 – 400 578 – –
ITV, C4, C5 and Sky – All Nationals –
– Global, Bauer –
Talon – DCM, Pearl and Dean –
–
Magazines Radio OOHAge 15+ Age 15+ Age 16+Age 15+ Age 15+ Age 16+Age 15+ Age 15+ Age 16+– – Age <16Main Shoppers Main Shoppers Supermarket shoppersAge 15–24 Age 15–24 Age 16–24ABC1 ABC1 ABC1AB AB AB
CPM calculation methodology
What vendors have you used?
Are there any changes in methodology vs. last year?
Total cost divided by audience 000s Total cost divided by audience 000s
Total cost divided by audience 000s
Time Inc, Bauer, Conde Naste, Hearst
Total cost divided by audience 000s Total cost divided by audience 000s Total cost divided by audience 000s
Total cost divided by audience 000s
Google, MSN, Facebook, Yahoo, Ebay, Amazon
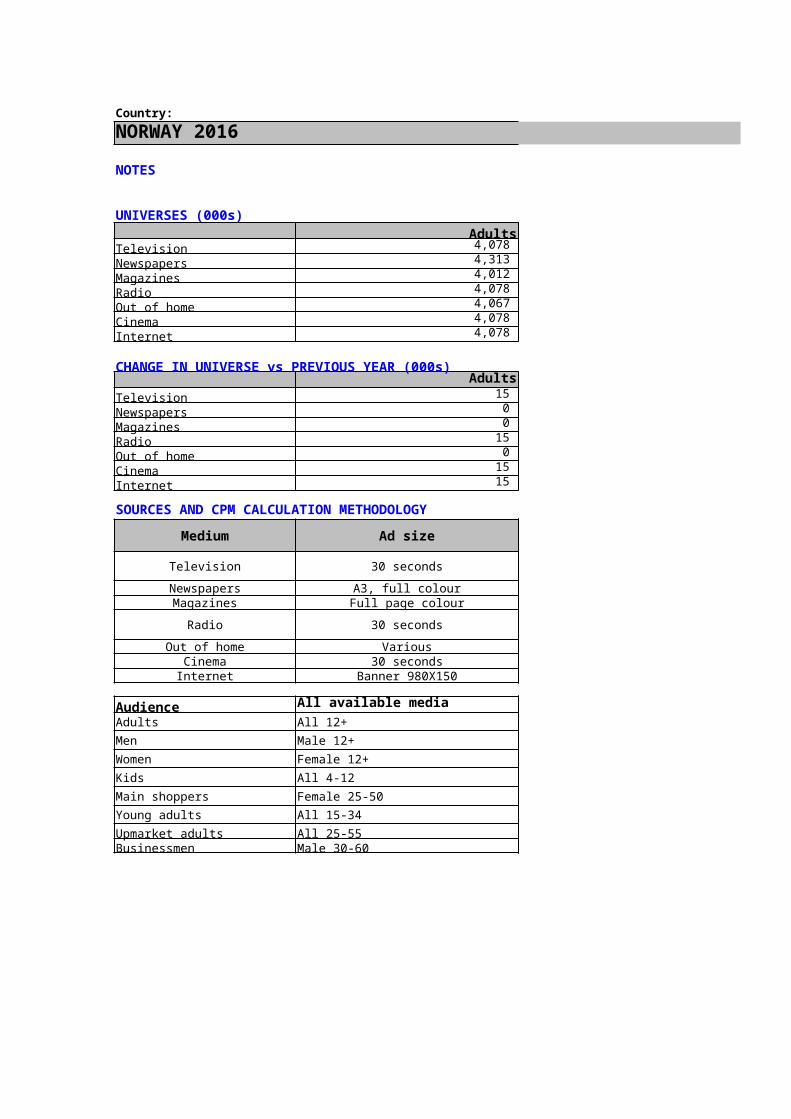
UNITED KINGDOM 2016
Young adults Upmarket adults Businessmen 14,615 27,401 13,210 7,815 28,087 13,988 16,388 28,087 13,988 16,954 28,988 14,074 14,615 27,401 13,210 14,615 27,401 13,210 7,405 28,287 14,957
Young adults Upmarket adults Businessmen-137 167 -245 -111 227 26
8,462 227 26 8,717 -74 – 6,689 167 – 6,378 167 -245
136 922 536
2015 cost with inflation2015 cost with inflation
2015 cost with inflation
2015 cost with inflation2015 cost with inflation2015 cost with inflation
2015 cost with inflation
Cinema InternetAge 15+ Age 16+Age 15+ Age 16+Age 15+ Age 16+– Age <16Main Shoppers Main ShoppersAge 15–24 Age 16–24ABC1 ABC1AB AB
What assumptions have you made?

Country:
UKRAINE 2016NOTESInternet 468x60 banner not used in Ukraine. 730x90 is standard.
UNIVERSES (000s)Adults Men
Television 32,136 14,513 Newspapers 2,753 1,558 Magazines 5,513 2,089 Radio 7,708 3,868 Out of home 15,672 – Cinema – – Internet 21,000 10,247
CHANGE IN UNIVERSE vs PREVIOUS YEAR (000s)Adults Men
Television -416 -155 Newspapers 0 0 Magazines 0 0 Radio 0 0 Out of home -79 – Cinema – – Internet 2,589 1,260
SOURCES AND CPM CALCULATION METHODOLOGY
Medium Ad size Source
Television 30 seconds Nielsen
Newspapers A3, full colour Galileo Print monitoring
Magazines Full page colour Galileo Print monitoring
Radio 30 seconds Supernova Radio monitoring
Out of home Billboards (3*6) Doors Consulting
Cinema 30 seconds
Internet Banner 468x60 InMind OSM AdOpinion

Audience Television NewspapersAdults All 18+ All 18+Men Male, 18+ Male, 18+Women Female, 18+ Female, 18+Kids All 4-14 –Main shoppers All 18-55 All 18-55Young adults All 16-25 All 18-30Upmarket adults All 18+, high income All 18+ ABBusinessmen M with middle and higher inc, top
managersM AB - working on executive level or above

UKRAINE 2016
Women Kids Main shoppers 17,623 4,302 21,361 1,278 – 2,169 3,811 – 4,645 3,841 – 6,481
– – – – – –
10,753 – 18,218
Women Kids Main shoppers-262 36 -412
0 – 0 0 – 0 0 – 0 – – – – – –
1,329 – 1,542
No
Total spend divided by universe No
Total spend divided by universe No
Total spend divided by universe TOP 2 SH - TAVR & UMH No
Total spend divided by universe No
No
Around 5500 sites for monitoring New 800 sites for monitoring
CPM calculation methodology
What vendors have you used?
Are there any changes in methodology vs. last year?
Total spend divided on number of contacts
All channels which being monitored
TOP 4 SH - UMH, Segodnia, Fakts, Vesty
TOP 10 SH - UMH, Burda , Edipress, Hearst Shkulev Ukraine,
Avtocentr, Kartel, Vavilon, MIG, Bauer Media, Blits Inform
We used all of the vendors monitored by Doors Consulting
Consulting
Total spend divided by total number of viewers
"Kinomedia" a leading provider of advertising in Ukraine.
Total spend divided by number of contacts

Magazines Radio OOHAll 18+ All 18+ All 18+Male, 18+ Male, 18+ –Female, 18+ Female, 18+ –– – –All 18-55 All 18-55 –All 18-30 All 18-30 –All 18+ AB All 18+ AB –
–M AB - working on executive level or above
M AB - working on executive level or above

UKRAINE 2016
Young adults Upmarket adults Businessmen 4,589 605 369 589 1,990 72 1,628 3,985 99 2,314 2,597 84
– – – – – –
7,476 13,722 932
Young adults Upmarket adults Businessmen-206 -89 -14
0 0 0 0 0 0 0 0 0 – – – – – –
364 1,605 144
What assumptions have you made?

Cinema InternetAll 18+ All 18+Male, 18+ Male, 18+Female, 18+ Female, 18+All 5-12 –All 18-55 All 18-55All 18-30 All 18-30All 18+ AB All 18+ ABM AB - working on executive level or above
M 22+ AB - The business owner, entrepreneur, hired manager

Country:
USA 2016Internet
UNIVERSES (000s)Adults Men
Television 233,560 112,720 Newspapers 90,753 42,173 Magazines 215,561 100,927 Radio 248,272 120,898 Out of home 245,594 119,377 Cinema 243,947 117,632 Internet 217,142 105,518
CHANGE IN UNIVERSE vs PREVIOUS YEAR (000s)Adults Men
Television 1,230 690 Newspapers -6,526 -3,866 Magazines 1,645 -7 Radio 2,882 1,480 Out of home 0 0 Cinema 11,617 5,602 Internet 2,967 13
SOURCES AND CPM CALCULATION METHODOLOGY
Medium Ad size Source
Television 30 seconds
Investment team
Newspapers A3, full colour
Magazines Full page colour
Radio 30 seconds
Out of home Billboards (3*6)
Cinema 30 seconds
Internet Banner 468x60
Audience Television NewspapersAdults Age 18+ Age 18+Men Age 18+ Age 18+Women Age 18+ Age 18+Kids Kids 2–11 –Main shoppers – –Young adults Adults 18–34 Adults 18–34Upmarket adults Adults 18+ / $100K+ HH Income Adults 18+ / $100K+ HH IncomeBusinessmen Men 18+/Professional or Manager Men 18+/Professional or Manager
within display, more money is being spent on non-standard units such as sponsorships and interactive units. Online spend is not continuously decreasing as a whole but it is decreasing in the display standard unit portion.

USA 2016
Women Kids Main shoppers 120,840 38,970 – 48,580 – 58,785 114,634 N/A 134,790 127,374 – – 126,218 – – 126,315 63,750 – 111,624 24,511 –
Women Kids Main shoppers540 -270 –
-2,660 – -3,444 1,652 – – 1,402 – –
0 – – 6,015 0 – 2,954 – –
– No
– No
– No
– No
– No
– No
– No
Magazines Radio OOHAge 18+ Age 18+ Age 18+Age 18+ Age 18+ Age 18+Age 18+ Age 18+ Age 18+– – –– – –Adults 18–34 Adults 18–24 Adults 18–34Adults 18+ / $100K+ HH Income – –Men 18+/Professional or Manager – –
within display, more money is being spent on non-standard units such as sponsorships and interactive units. Online spend is not continuously decreasing as a whole but it is decreasing in the display standard unit
CPM calculation methodology
What vendors have you used?
Are there any changes in methodology vs. last year?
inflaton was provided to the previous years estimates

USA 2016
Young adults Upmarket adults Businessmen 68,130 66,261 29,078 17,682 25,984 9,548 67,568 61,022 25,358 31,713 – – 75,340 – – 30,272 97,957 93,038 74,786 22,077 –
Young adults Upmarket adults Businessmen170 – –
-1,694 -1,599 – 56 2,392 – 55 – – 0 – –
1,442 4,665 – – – –
–
–
–
–
–
–
–
Cinema InternetAge 18+ Age 18+Age 18+ Age 18+Age 18+ Age 18+Kids 2–17 –Principal shopper –Adults 18–24 –P18+ HHI: 75k+ –
–
within display, more money is being spent on non-standard units such as sponsorships and interactive units. Online spend is not continuously decreasing as a whole but it is decreasing in the display standard unit
What assumptions have you made?
P18+ Professional & Related Occupations or Management, Business and Financial Operations or Sales and Office Occupations
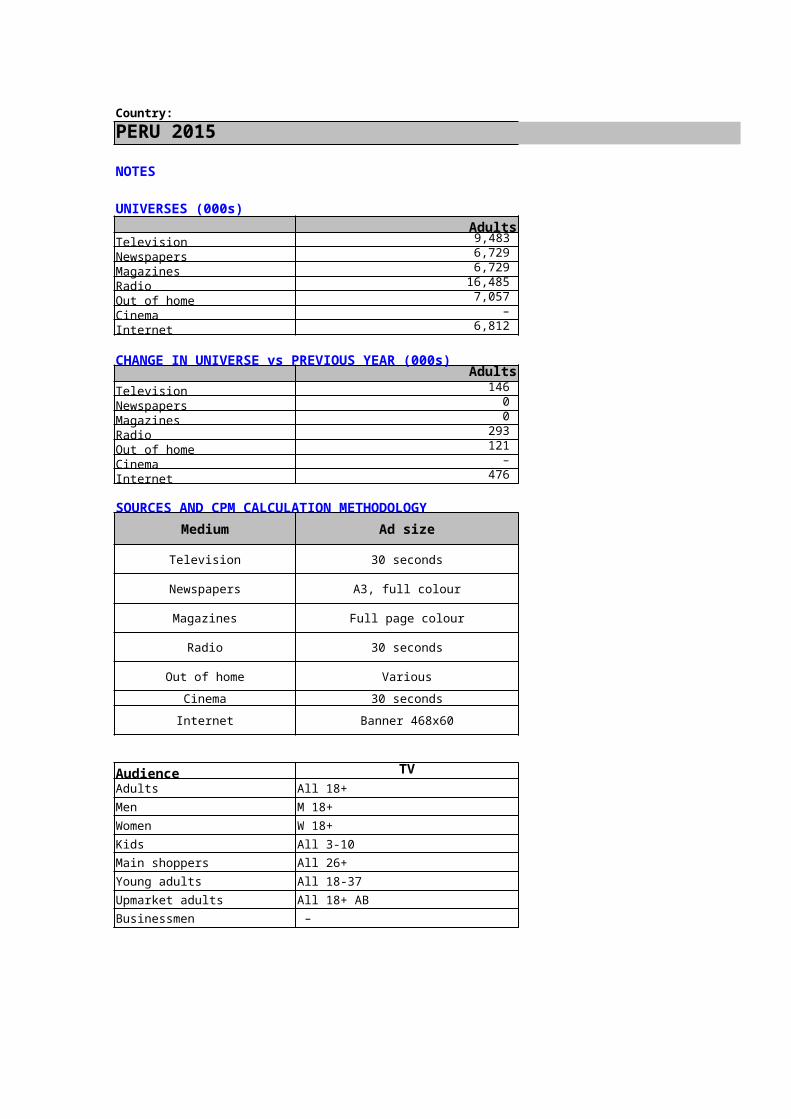
Country:VENEZUELA 2016
NOTESGeneral
UNIVERSES (000s)Adults Men
Television 7,095 3,320 Newspapers – – Magazines – – Radio – – Out of home – – Cinema – – Internet – –
CHANGE IN UNIVERSE vs PREVIOUS YEAR (000s)Adults Men
Television 0 0 Newspapers – – Magazines – – Radio – – Out of home – – Cinema – – Internet – –
SOURCES AND CPM CALCULATION METHODOLOGYMedium Ad size SourceTelevision 30 seconds AGB Nielsen
Newspapers A3, full colour No data availableMagazines Full page colour No data available
Radio 30 seconds No data availableOut of home Various No data available
Cinema 30 seconds No data availableInternet Banner 468x60 No data available
Audience TVAdults W-M 18+ ABCDEMen M 18+ ABCDEWomen W 18+ABCDEKids K 4-12 ABCDEMain shoppers W-M 18+ ABCDEYoung adults W-M 25-44 ABCDEUpmarket adults W-M 18+ ABCDEBusinessmen M 35+ ABC
Venezuela is in a several socioeconomic political crisis that causes hiperinflation, devaluation, scarcity, shortages, Media investments are decline as a consequence, less players in place . Due current conditions TV is the only media measured
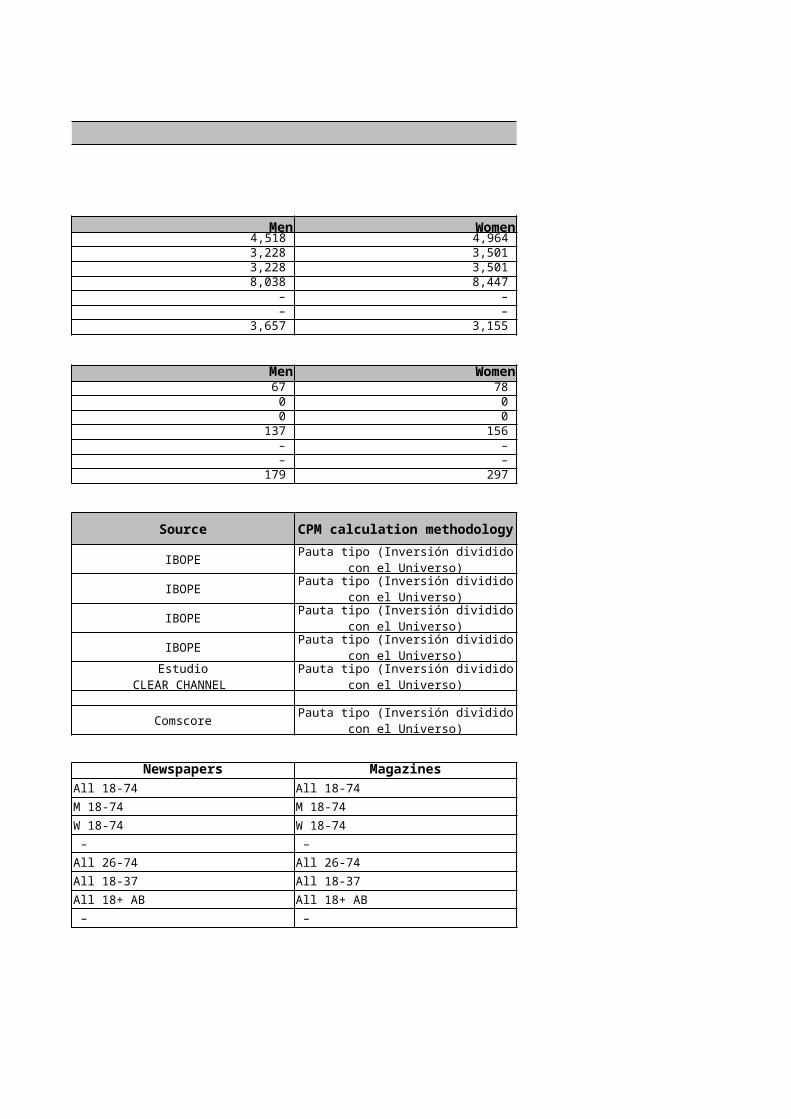
VENEZUELA 2016
Women Kids Main shoppers 3,776 1,259 7,096
– – – – – – – – – – – – – – – – – –
Women Kids Main shoppers0 0 0 – – – – – – – – – – – – – – – – – –
Top 2 Top 2 – – – – – – – – – – – – – – – – – –
Venezuela is in a several socioeconomic political crisis that causes hiperinflation, devaluation, scarcity, shortages, Media investments are decline as a consequence, less players in place . Due current conditions
CPM calculation methodology
What vendors have you used?
Are there any changes in methodology vs. last year?
Avg spot diveded by on spot reach
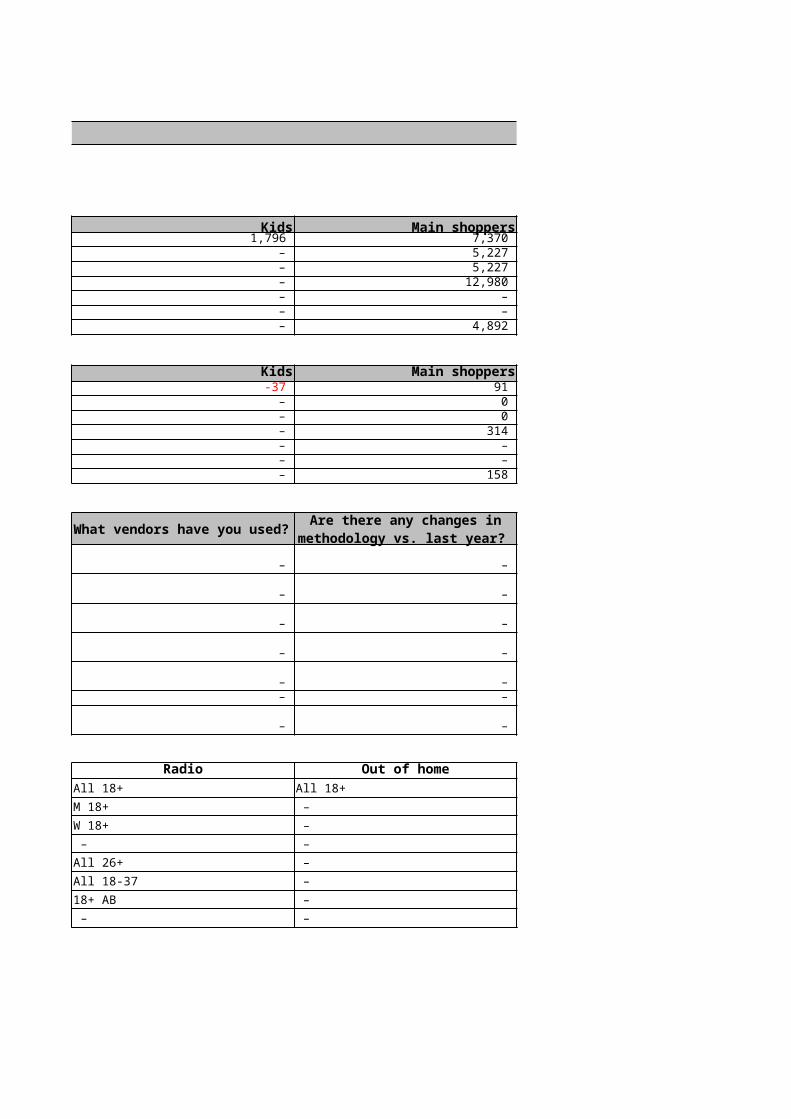
VENEZUELA 2016
Young adults Upmarket adults Businessmen 3,094 7,095 454
– – – – – – – – – – – – – – – – – –
Young adults Upmarket adults Businessmen0 0 – – – – – – – – – – – – – – – – – – –
– – – – – – –
Venezuela is in a several socioeconomic political crisis that causes hiperinflation, devaluation, scarcity, shortages, Media investments are decline as a consequence, less players in place . Due current conditions
What assumptions have you made?