fiji ports corporation limited 2015 - parliament of fiji · . fiji ports corporation limited 1...
TRANSCRIPT

Fiji Ports Corporation LimitedAnnual Report
2015
Vision, Mission, Values & Corporate Culture
Table of Contents
About Us
Vision‘To be the maritime gateway in the Pacific region through facilitating waterborne transport, trade and commerce’
Mission‘To develop, maintain and improve key seaport and ship repair facilities to enhance the economic growth and prosperity of Fiji’
ValuesFPCL’s corporate Vision and Mission will be accomplished by adhering to a set of Values that speak to the economic, social, and environmental responsibilities of FPCL and continuous achievement of Business Excellence, and by demonstrating Professionalism, Progressive leader- ship and Succession Planning, Commercial Stewardship, Corporate Citizenship, Strategic Innova- tion, and Employee Well-being and Diversity
Corporate CultureAs attitude and behaviour define the workplace environment, FPCL’s Board, management and senior staff remain alert to the need for openness when addressing issues that relate to the Com- pany’s Corporate Culture. Plans continue to be enacted to improve Corporate Culture within Fiji Ports with the view to maximising the often unrecorded and unseen benefits that flow from achiev- ing a positive workplace and are open to regular review.
HIgHLIgHTS For THE YEAr In rEVIEW 4
CHAIrMAn’S rEPorT 5
CHIEF ExECuTIVE’S rEPorT 7
BoArD oF DIrECTorS 10
CorPorATE goVErnAnCE 12
ExECuTIVE MAnAgEMEnT 13
SEnIor MAnAgErS 14
orgAnISATIon STruCTurE 15
CorPorATE SErVICES 17
TECHnICAL SErVICES 23
PorT oPErATIonS 26
FInAnCE DIVISIon 30
FIjI SHIPS AnD HEAVY InDuSTrY LIMITED 34
FInAnCIAL STATEMEnTS 38
Fiji Ports Corporation Limited (FPCL) operates the following two main ports of entry into Fiji:Kings Wharf, Suva Queens Wharf, Lautoka
Fiji Ports owns and operates:Levuka Wharf, ovalau
FPCL oversees the operations and ISPS requirements for the following ports:Malau Wharf, Labasa, Vanua Levu (owned by Fiji Sugar Corporation)rotuma Port, rotuma (owned by rotuma Council)Wairiki Wharf, nabouwalu, Vanua Levu (owned by Tropik Woods Industries Ltd)Vuda, Viti Levu (owned by oil multinational companies).
FPCL also oversees and operates port facilities including local interisland, fishing and local and international barge port facilities located at Mualwalu I and II, Walu Bay, Suva, and in Lautoka adjacent to the Queens Wharf, through the provision of ports infrastructure and related services to ensure industry safety and security.
FIJI PORTS CORPORATION LIMITED (FPCLMuiwali HouseWalu Bay Suva FijigPo Box 780 Suva FijiT + 679 331 2700www.fijiports.com.fj
1Fiji Ports CorPoration LimitedAnnuAl report 2014
Letter to the Minister
Fiji Ports Corporation LimitedMuaiwalu House, Walu Bay, Suva, Fiji.
Fiji PORTS CORPORaTiOn LimiTed
July 2015
Hon. Aiyaz Sayed-KhaiyumMinister for Public Enterprise, Minister Public Service, Minister for Finance and Attorney GeneralLevel 7 Suvavou HouseSuva Fiji
Dear Minister
It is with pleasure that I present the Annual Report for the year 2015 for Fiji Ports CorporationLimited (FPCL), and subsidiary company, Fiji Ships and Heavy Industries Limited (FSHIL).
Of major importance for the Fiji Ports Group this year was your Government’s announcement late in the year of part-privatisation of the Company. The announcement came after a significant period of adjustment for the Company as it adapted to its role of Landlord Port/Regulator further to the divestiture of FPTL in 2013.
As we enter a new era for the Fiji Ports Group we do so in the expectation of rewarding things to come. As major shareholder I commend to you this Annual Report for the year 2015, produced in accordance with the provisions provided in the Public Enterprises Act 1996.
Yours sincerely
Tevita KuruvakaduaChairmanFPCL Board of Directors
2 Fiji Ports CorPoration LimitedAnnuAl report 2014
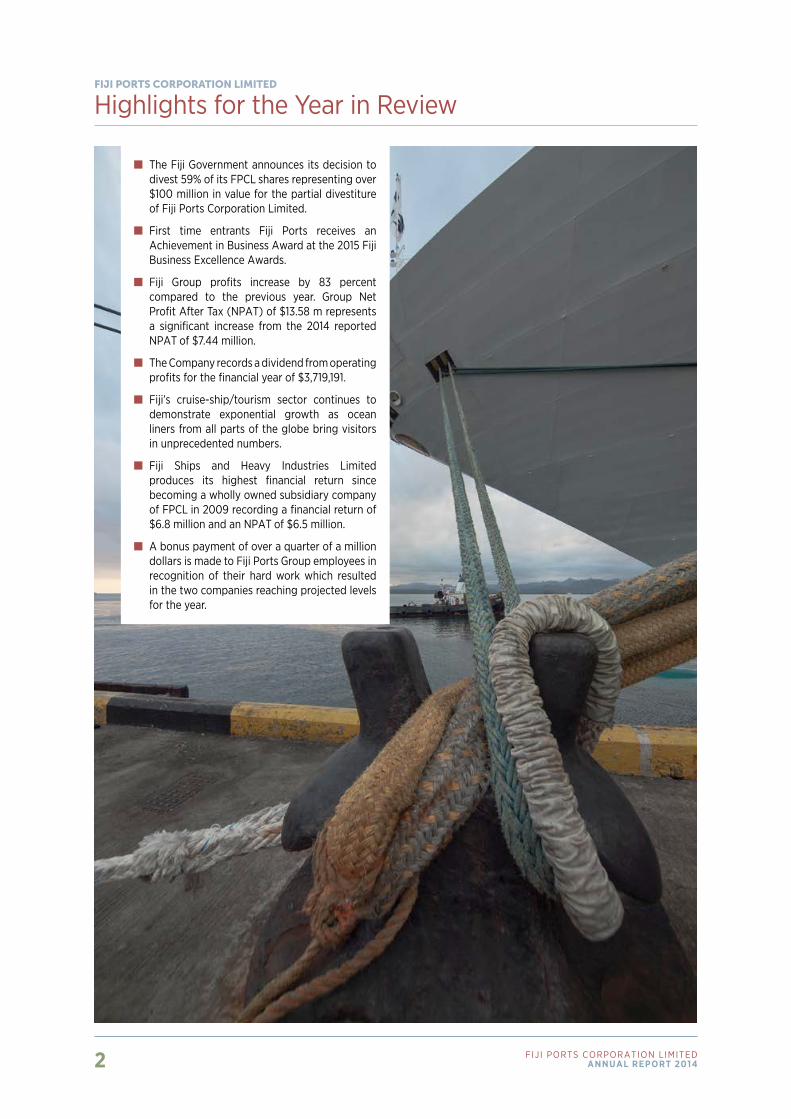
Highlights for the Year in reviewFiji PORTS CORPORaTiOn LimiTed
The Fiji government announces its decision to divest 59% of its FPCL shares representing over $100 million in value for the partial divestiture of Fiji Ports Corporation Limited.
First time entrants Fiji Ports receives an Achievement in Business Award at the 2015 Fiji Business Excellence Awards.
Fiji group profits increase by 83 percent compared to the previous year. group net Profit After Tax (nPAT) of $13.58 m represents a significant increase from the 2014 reported nPAT of $7.44 million.
The Company records a dividend from operating profits for the financial year of $3,719,191.
Fiji’s cruise-ship/tourism sector continues to demonstrate exponential growth as ocean liners from all parts of the globe bring visitors in unprecedented numbers.
Fiji Ships and Heavy Industries Limited produces its highest financial return since becoming a wholly owned subsidiary company of FPCL in 2009 recording a financial return of $6.8 million and an nPAT of $6.5 million.
A bonus payment of over a quarter of a million dollars is made to Fiji Ports group employees in recognition of their hard work which resulted in the two companies reaching projected levels for the year.
3Fiji Ports CorPoration LimitedAnnuAl report 2014
Tevita KuruvakaduaCHAIrMAn
Chairman’s reportFiji PORTS CORPORaTiOn LimiTed
Fiji Ports Corporation Limited’s commitment to returning solid financial returns while ensuring all Port users receive benefits from its operations characterised the Company’s performance in 2015.
This year Fiji Ports concentrated on fulfilling its obligations as Port Landlord/Regulator. With a focus on improving infrastructure and services across its designated Ports, a range of development projects and operational enhancement initiatives were undertaken primarily for the major Ports of Suva and Lautoka.
In its capacity of Landlord/Regulator the Company also addressed the need to operate all facilities in an environmentally sound manner and minimise the impact of operations on the environment. Where feasible and practicable, the emphasis has also been on applying sustainable design principles in future planning and design, and in the decommissioning of facilities.
Pleasing this year for the Group of Companies was FPCL’s subsidiary company, Fiji Ships and Heavy Industries Limited, delivering strong financial returns. In recent years and months the company has also made significant advances in terms of its upgrade and modernisation programs while fulfilling its broader aim of improving key seaport and ship repair facilities.
2015 Financial Performance
The financial performance of FPCL for 2015, once again, represented a very positive outcome.
The operating Group profit for the year was $13,577,091 - significantly up on 2014’s figure of $7,438,382 - after providing for income tax expense of $2,490,896, compared to $1,528,299 last year.
The operating profit for the holding company was $10,141,210
compared to 2014’s figure $6,637,848 after providing for income tax expense of $2,119,835, compared to $1,263,163 in 2014. The total dividend declared, and paid out during 2015, was $3.7 million a figure slightly higher than 2014’s payment of $3.6 million.
This year Fiji Ports not only met its scheduled loan repayments of $8 million, the Company’s strong cash flow has made possible the prepayment of a total of additional $30 million (between December 2012 and December 2014). This substantial reduction in FPCL debt was achieved because of the Company’s strong operational cash flow which translated into a strong balance sheet.
A large component of the prepayments made were to the Asian Development Bank (denominated in US dollars). Had the Company not been able to make the timely debt reductions against the U.S. dollar, it would have been exposed to large losses. Although the Company did incur some losses with the movement of the foreign exchange by making substantial prepayments earlier than was required the Company saved a considerable amount of money both in terms of reduced interest repayments and by reducing its exposure to foreign exchange movements. With the profitability of FPCL protected the Company maintained a very attractive Balance Sheet at the close of the year.
Part-Privitisation Agreement
Without doubt, the most important event for the year was Government’s announcement of part-privitisation of the Company.
The November announcement reflects government’s ongoing commitment for partial divestment of Fiji-owned assets with shareholders of the holding company (the Ministry of Public Enterprises and the Ministry of Finance) divesting 59% of Company shares to private entities.
The terms of the agreement specify that the Ministry of Public Enterprises maintains 41% of the shares in FPCL and Fiji National Provident Fund (FNPF), Fiji’s largest financial institution with total assets valued at $4.9 billion, acquiring 39 percent. The second partner in the agreement is Sri Lankan conglomerate Aitken Spence PLC (ASPLC) which acquired 20 percent of the total number of FPCL shares. A highly credible investor ASPLC brings to the partnership its vast experience in port management and a proven track record in Fiji further to acquiring FPTL in 2013. Of note, and a highly positive outcome of the transaction is that 80 percent of the shares in the Company remain in Fiji hands.
The Shareholders Agreement entitles FNPF to appoint three directors to the FPCL Board, AS PLC will bring in two directors, with the Fiji Government positioned to appoint four members.
Government’s decision to divest shares in FPCL - and bring in suitable partners - is based on the need to better position the Company for development while growing FPCL’s asset base to
4 Fiji Ports CorPoration LimitedAnnuAl report 2014
allow for continued improvements, expansions and overdue modernisation of Fiji’s Ports’ facilities. Of importance, too, is that under the new agreement Fiji Ports is expected to become more profitable as it moves closer to achieving its primary goal of transforming the Port of Suva into a hub port by the year 2020.
Notwithstanding, divesting a significant level of shareholding to a private sector requires the Board and executive management to review operations with the view to maximising value of the Company. Issues of importance in this regard include:
• Dealing with legislative conflicts contained between thevarious maritime legislative environment in Fiji such as Maritime Transport Decree 2012 (MTD) and the Ship Registration Decree 2012 (SRD) as these which impact on our current operational legislation the Sea Port Management Act 2005, and Sea Port Management Regulation 2008.
• A heightened focus on Fiji Port’s role as a Regulator/Landlord port/maritime service provider moving forward as the primary operational model; and
• As Port Landlord/Regulator of one of the Pacific’s biggestports and regional hub for Pacific Is- land trade, Board and executive management accept increased responsibilities, and greater expectation, to deliver at the highest standard in efficiency, safety and security, and environmental leadership.
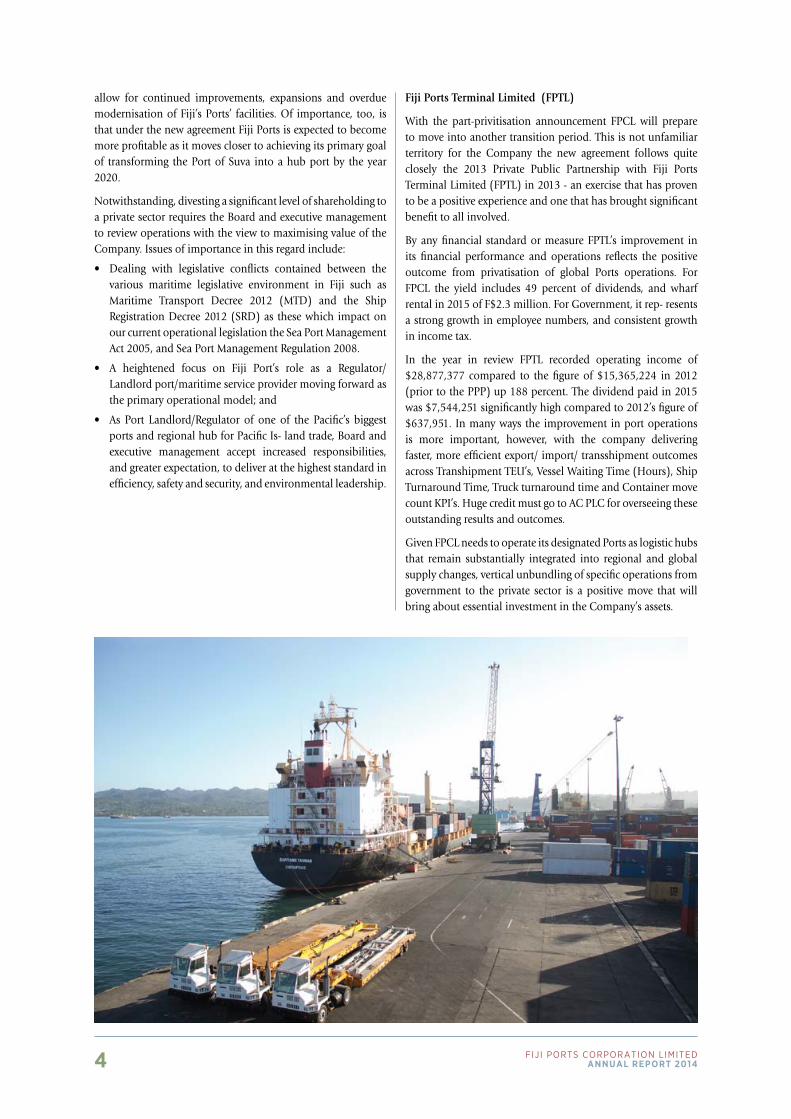
Fiji Ports Terminal Limited (FPTL)
With the part-privitisation announcement FPCL will prepare to move into another transition period. This is not unfamiliar territory for the Company the new agreement follows quite closely the 2013 Private Public Partnership with Fiji Ports Terminal Limited (FPTL) in 2013 - an exercise that has proven to be a positive experience and one that has brought significant benefit to all involved.
By any financial standard or measure FPTL’s improvement in its financial performance and operations reflects the positive outcome from privatisation of global Ports operations. For FPCL the yield includes 49 percent of dividends, and wharf rental in 2015 of F$2.3 million. For Government, it rep- resents a strong growth in employee numbers, and consistent growth in income tax.
In the year in review FPTL recorded operating income of $28,877,377 compared to the figure of $15,365,224 in 2012 (prior to the PPP) up 188 percent. The dividend paid in 2015 was $7,544,251 significantly high compared to 2012’s figure of $637,951. In many ways the improvement in port operations is more important, however, with the company delivering faster, more efficient export/ import/ transshipment outcomes across Transhipment TEU’s, Vessel Waiting Time (Hours), Ship Turnaround Time, Truck turnaround time and Container move count KPI’s. Huge credit must go to AC PLC for overseeing these outstanding results and outcomes.
Given FPCL needs to operate its designated Ports as logistic hubs that remain substantially integrated into regional and global supply changes, vertical unbundling of specific operations from government to the private sector is a positive move that will bring about essential investment in the Company’s assets.
5Fiji Ports CorPoration LimitedAnnuAl report 2014
FCC Approves Tariff Submission
When reviewing the Company’s operating performance for 2015 a significant achievement was gaining approval from the Fiji Commerce Commission to revise current tariff charges.
The positive outcome for the Company is highlighted by the fact that the last increases in Port tariffs occurred in 2009 - and on that occasion only 50 percent of the requested increases were approved. Previous to this, approved tariff increases occurred as far back as 2001, a situation that has resulted in Fiji Ports having to absorb a less than one percent annual increase. Further, the two core charges - dockage and wharfage - had not been revised since 2001 creating a hiatus of 14 years .
Fiji Ports is infrastructure-based and its two greatest costs for the Company are borrowing funds to build infrastructure, and the depreciation on the capital expenditure undertaken. In essence, the reduction of this cost over the past few years has increased FPCL’s profitability, however, overall essential development work is now, in some instances, well overdue.
FPCL looks forward to the tariff increase better positioning the Company in terms of the provision of funds for necessary infrastructure improvements.
Support for Ports Development Plan
In 2013 FPCL’s management recognised the need for a long-term strategy for the development of Port requirements in Fiji, given existing facilities were extremely limited or in need of further attention.
Despite significant work being undertaken on the Kings Wharf, which concluded in 2006, this up- grade was given a limited life span of 15 years. As a consequence funding negotiations with the Asian Development Bank (who funded the upgrade in 2002) began in March 2013.
Subsequently, a draft Terms of Reference was executed and discussions with government led to a draft Memorandum of Understanding also being developed. This document was endorsed by government in December 2015, with a Development Plan now anticipated for July 2016.
A smart, modern approach to sustainable development master planning that encompasses all our Ports will deliver positive long-term benefits and enhanced financial returns to the Company, government, and our new partners. Movement on this front has been extremely well received by Board and management, and anticipation of achieving much needed infrastructure improvements remains high.
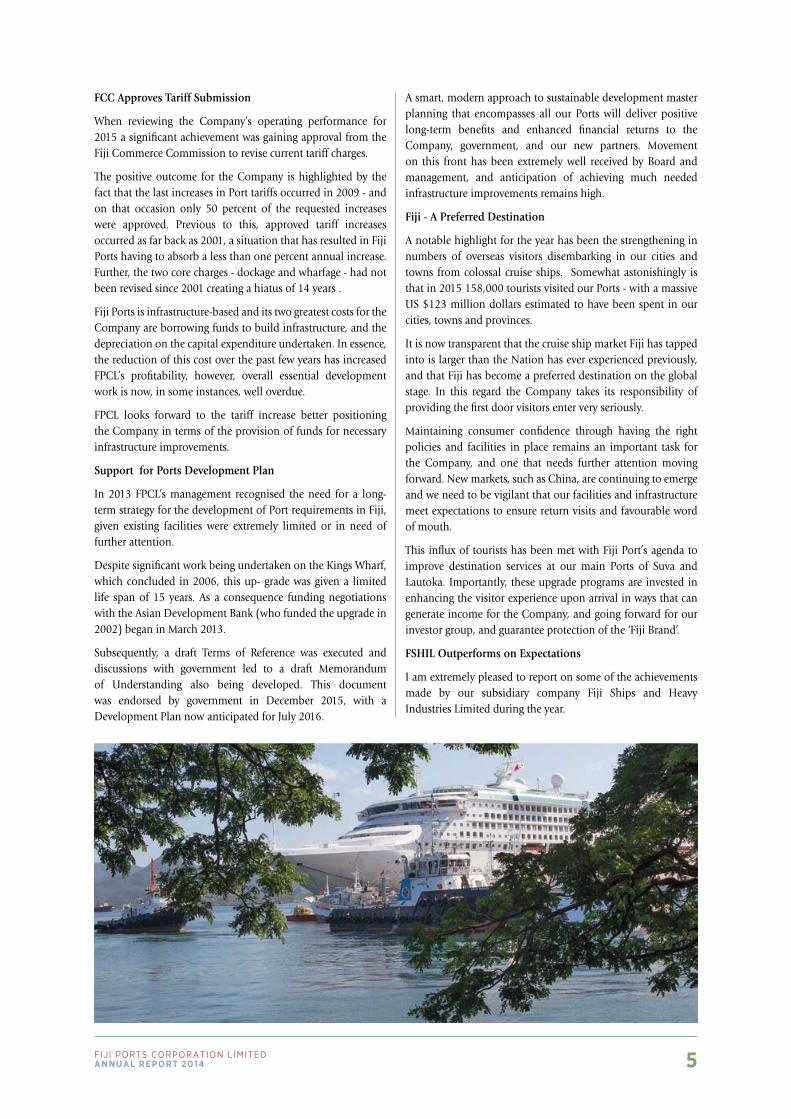
Fiji - A Preferred Destination
A notable highlight for the year has been the strengthening in numbers of overseas visitors disembarking in our cities and towns from colossal cruise ships. Somewhat astonishingly is that in 2015 158,000 tourists visited our Ports - with a massive US $123 million dollars estimated to have been spent in our cities, towns and provinces.
It is now transparent that the cruise ship market Fiji has tapped into is larger than the Nation has ever experienced previously, and that Fiji has become a preferred destination on the global stage. In this regard the Company takes its responsibility of providing the first door visitors enter very seriously.
Maintaining consumer confidence through having the right policies and facilities in place remains an important task for the Company, and one that needs further attention moving forward. New markets, such as China, are continuing to emerge and we need to be vigilant that our facilities and infrastructure meet expectations to ensure return visits and favourable word of mouth.
This influx of tourists has been met with Fiji Port’s agenda to improve destination services at our main Ports of Suva and Lautoka. Importantly, these upgrade programs are invested in enhancing the visitor experience upon arrival in ways that can generate income for the Company, and going forward for our investor group, and guarantee protection of the ‘Fiji Brand’.
FSHIL Outperforms on Expectations
I am extremely pleased to report on some of the achievements made by our subsidiary company Fiji Ships and Heavy Industries Limited during the year.
6 Fiji Ports CorPoration LimitedAnnuAl report 2014
FSHIL has come a long way in a short time in terms of its endeavour to become a regional leader in ship repairs and heavy industry. Of particular note this year is the company’s passion for modernising its infrastructure, and its commitment to capacity building.
The company’s aim of achieving ‘operational excellence’ is evidenced by its return of revenue of $6.8 million before tax for the year - the highest since FPCL took over management of the company in 2009.
Promising, too, is that Fiji Ship’s corporate objectives now extend to identifying new ways to generate revenue through expansion of its services. With the support of its parent company, FSHIL continues to identify and forge new partnerships with similar organisations such as ship repair facilities, suppliers of goods and services, and with ship-owners and other companies in the ship building industry.
The company is also showing improved results due to its comprehensive upgrade of its internal operational systems, communication protocols, and its estimation and assessment practices through use of new technologies. Advances in this area have provided Fiji Ships with a pronounced edge in the region over its competitors.
Acknowledgements
In closing I would like to acknowledge the support of my fellow Board members, Vilash Chand and Vijay Maharaj. I thank them for their insights and dedication to the tasks set before us during another year of adjustment for FPCL.
I would also like to commend, on behalf of the Board, the wonderful work demonstrated by the Company’s executive management team this year. Although the negotiations for the part-privitisation proved to be a comprehensive exercise, our team headed by CEO, Vajira Piyasena, maintained the highest level of professionalism and proficiency at all times. This year
we also welcomed Eranda Kotelawala, to the team as COO - a much anticipated appointment that relieved our CEO of some of the operational duties he had previously absorbed.
We remain indebted to the Fiji Government for its support and guidance, this year, and offer special thanks to those with whom we have been closely associated with in recent months from the Ministry of Public Enterprises and the Ministry of Finance.
To our new investment partners, one of whom we have already built a fruitful association, we look forward to forming a rewarding partnership that will deliver long-term benefits for all.
Tevita Kuruvakadua Chairman
7Fiji Ports CorPoration LimitedAnnuAl report 2014
In November 2015 Prime Minister the Hon. Voreqe Bainimarama publicly announced FPCL would become a partially privatised company.
Government’s 2014 Budget announcement confirming its intention to divest assets alerted the Fiji Ports Board and executive of what was planned for the Company allowing time to prepare for what would dominate events in the coming months.
In the final analysis the divestment process was extremely well managed by all involved, and man- aged under the shared understanding that the proposed changes would bring long-term benefits for the Company, and its new shareholding partners.
Investment in Fiji Ports by the Aitken Spence PLC (AS PLC) comes with the high expectation that it will provide the Company with greater access to critical expertise in port management. Apart from being recognised for three consecutive years by Forbes magazine as one of the most successful publicly traded companies AS PLC has a proven track record with Fiji Ports further to assuming control of Fiji Ports Terminal Limited (FPTL) under a PPP agreement with the Fiji Government in 2013.
In its first full year of management of FPTL our associate company recorded increases in productivity of 60 percent, and improved vessel turnaround time by 33 percent. Under AS PLC’s management FPTL also increased its net profit by 49.5 percent, amounting to an increase of $2,773,235.
Under the terms of the new part-privitisation agreement FPCL transfers its real estate to a government holding company, which in turn leases the assets necessary for port operations back to FPCL, Under the arrangement ownership of all land interests
Chief Executive officer’s reportFiji PORTS CORPORaTiOn LimiTed
Vajira PiyasenaCHIEF ExECuTIVE oFFICEr
remain with the Fiji Government. A further positive outcome of the agreement is that government receives approximately $3.3 million from the sale of land to Fiji Roads Authority (FRA) for the realignment of the road and bridge at Stinson Parade in the city of Suva.
Government’s decision to divest shares in the Company is indicative of its resolve to improve infra- structure and facilities at all FPCL designated Ports - by ensuring the funds and expertise are avail- able to deliver much needed upgrades and modernisation strategies. The agreement also supports the Company’s goal To become a modern seaport operator and transform Port of Suva into a hub port in the South Pacific by the year 2020. The agreement signals a new beginning for the Company as our Board (which will in time include new members), executive management and all our employees make preparations to face the challenges and opportunities ahead.
FBEA Award
This year FPCL enjoyed success at the Fiji Business Excellence Awards. As first year entrant it was indeed a great honour for the Company and staff that it received the Achievement in Business Excellence Award.
The achievement goes a long way in acknowledging the dedication and commitment shown by all at Fiji Ports and ore subsidiary Fiji Ships. The gala evening - a recognised highlight of the Fiji calendar - was held on Denarau Island in October and was attended by approximately 20 Company representatives from Suva, Lautoka and Levuka.
Participation in the Fiji Business Excellence Awards is a complex and lengthy process during which time the Company is able to benchmark against relevant best practices set out in the FBEA criteria - essentially those of leadership, strategic planning, measurement, customer focus, workforce focus, operation focus and results. I am pleased to report that all employees attended the FBEA briefings and criteria familiarisation sessions and were actively engaged in aligning the individual and depart- mental performance goals with corporate objectives as required to meet the guidelines.
The process of engagement in the Fiji Business Excellence Awards also created a unique opportunity for organisational self-assessment. For Fiji Ports this process was aligned with the Company’s stated aim to improve its corporate culture. The process of performance assessment also provided staff with the recognition that corporate management systems that ensure standards of business excellence need to be installed and maintained in order to provide enrichment for all.
Environmental Stewardship
Ensuring environmental stewardship programs and initiatives are included in our business, financial, operational and planning decisions has emerged as a key performance indicator (KPI) for FPCL’s staff as together we endeavour to improve our performance as Port Landlord/regulator.
8 Fiji Ports CorPoration LimitedAnnuAl report 2014
In this regard best practice environmental planning and programs are constantly being developed and refined across all the Company’s operations which relate to categories such as Pollution - Clean air and Greenhouse gases, Sustainability Ethics; Clean Water/Port Habitat Plans; Clean Soil Plans; Users Compliance Measures and Awareness Programs for Corporate Offices and Employee engagement.
Amongst the initiatives put in place this year was the signing of an MOU between FPCL and FNU. Under the agreement environmental research reports are generated by students - the aim of which is to actively contribute to Fiji Ports Environmental Monitoring Program. The MOU also promotes cooperation in the field of scientific research for students enrolled in the FNU’s Bachelor of Science Degrees in Environmental Science. Under the agreement students collect samples of flora, fauna, water and sediment for testing and analysis from the environment adjoining the Ports of Suva and Lautoka as well as from other FPCL designated wharves. Final reports will be used to ensure Department of Environment regulations are being adhered to.
Fiji’s Department of Environment and the Secretariat of the Pacific Regional Environmental Pro- gramme also collaborated to support research being carried out at the Harbour Master’s tower building on the Kings Wharf. Air Quality Measuring Devices have been installed to monitor both air quality and dust levels in the air with the aim of identifying (and abating) major pollution sources.
This was also the first year the Suva Environment Monitoring Vessel was active and its pleasing to note that there was a significant decline in the number of fines for oil spills, due primarily to the vessel’s daily rounds generating Harbour user awareness. Additionally, daily monitoring of Harbour pollution became an issue which featured at regular meetings with Suva City Council and the Department for Environment. It is anticipated that further discussions will lead to the establishment of a City/ Harbour Environment Management Plan in the coming months.
Although much has been achieved this year further work is scheduled be undertaken to ensure current and future action plans are carried out and outcomes registered and refined.
Port Users Safety and Security
Ensuring all designated Port facilities operate with zero incident status in terms of Occupational Health and Safety remains a paramount priority for the Company. I am pleased to report that 2015 has been a very successful year for compliance with the International Ships and Ports Security (ISPS) Code with no adverse reports, or security breaches, reported at Fiji’s international Ports of Entry.
Last year’s substantial upgrade of security infrastructure at the Kings Wharf, Queens Wharf and Muaiwalu I and II (which included the installation of state-of-the-art technology in CCTV cameras) was followed up with a comprehensive traffic and safety study for Suva’s local Muaiwalu wharf. All FPCL stakeholders were consulted about the study as the safety of Muaiwalu Wharf users is a key a concern given the high volume of traffic and pedestrians moving in and around the Wharf area at any given time. FPCL’s Ports Facilities Security Plan, approved by the Maritime Safety Authority of Fiji (MSAF) in 2014, was also successfully implemented during 2015.
Ongoing improvement plans include the introduction of measures to reduce congestion at the Wharf loading area, restricting access and introducing more strict access protocols, and the upgrade of passenger waiting facilities. Better monitoring of traffic on FPCL’s wharfs was also in the spotlight this year with the change that all parking is now controlled and subject to charge rates for the first time. All essential signage was also replaced and or updated, and I am pleased to confirm that all FPCL designated Ports are now “No Smoking” zones.
FPCL Security Policy also dictates that all Port users understand the provisions of the ISPS Code, the OHS and Safety Laws, and safely follow the Port Traffic Flow Plan. In order to ensure this is being addressed our Security team worked tirelessly to ensure all parties intending to use, or wish to continue using, Port facilities for commercial purposes have up-to-date licences. Port users and stakeholders were also required to attend training held by our Port Facility Security Officer.
9Fiji Ports CorPoration LimitedAnnuAl report 2014
Infrastructure Projects
Strong, predictable and secure revenues - combined with a current ratio of between 4 and 5 and a strong debt equity ratio with substantial cash reserves - provides the Company with a solid platform for expansion.
Infrastructure improvement across our Ports is a comprehensive undertaking, and most projects remain ongoing. Prioritised this year, however, were the following:
• WorkonextensionstoSuvaandLautoka’sLocalandFishingWharf facilities, and the installation of the new weighbridge at the Muaiwalu Wharf which provides FPCL with a more accurate tonnage of fish being off-loaded from fishing vessels was substantially advanced this year.
• OngoingdiscussionswiththeFijiNavyregardingtakingovertheir site in Walu Bay (adjacent to Kings Wharf adjoining the FSHIL site) to facilitate the Navy’s planned relocation.
• Developmentofamajorofficecomplex,retailandterminalbuilding at a Walu Bay site owned by FPCL (adjacent to Muaiwalu II) is ongoing.
• Further work on the establishment of a barge operationspecific to the Wharf in Suva.
• RebuildingandrenovationworkattheFSHILsiteinWaluBay to provide a much needed new commercial wharf - Muaiwalu III - continues.
• Expansion and reconfiguration of Lautoka Local andTenant Wharfs including a permanent commercial barge loading facility needed to support Fiji’s booming tourism sector is under development, along with establishment of a commercial dredging operation or purchase of a company in that business.
• PossibleLautokaPortPPPforourcruisevesselprojectandbarge terminal which includes development of a haul-out facility on land adjacent to the Local Fishing Wharf for barging/vessel operators that service the Mamanuca and Yasawa Group of Islands.
• FurtherdevelopmentofShed6,KingsWharfbyestablishinga second floor within the Wharf building and creating a cruise liner terminal.
• AnupgradeoffacilitiesforFPCLstaffandportusersatallWharfs is also planned.
Tariff Charges Workshop
The successful revision of Port tariff charges during the year will mean an increase in revenue for the Company that is capable of impacting on future earnings after years of rates not keeping pace with inflation. Although the success of this submission is a significant achievement for the Company, increases would not have been put into action without first ensuring stakeholders were informed.
Accordingly, further to the August approval to increase rates by the Fiji Commerce Commission a workshop was held for Fiji Port’s customers and maritime industry stakeholders with the view to promoting discussion regarding the need for the increases and to clarify any issues. Attendees were informed that analysis showed that had FPCL increased Port tariff charges by six percent every two years the resulting rates would be well in excess of the revised rates applicable now.
10 Fiji Ports CorPoration LimitedAnnuAl report 2014
Achieving ISO Standards
The Company continues to work towards introducing International Organisation for Standardisation (ISO) standards and relevant goals are already incorporated in its Key Performance Indicators (KPIs).
FPCL has taken the initiative to streamline internal processes before beginning the journey to ISO standards, however, FSHIL is leading the way in this initiative through working towards the introduction of ISO 9001:2008 Quality Management Systems.
FPCL already maintains compliance with the International Maritime Organisation’s (IMO), the Inter- national Ships and Ports Security (ISPS) Code that outlines a standardised, consistent framework for evaluating risk, enabling governments to offset changes in threat with changes in vulnerability for ships and port facilities. This year FPCL began its journey towards introducing the ISO 28000. This international standard sets out stringent requirements for a security management system that incorporates all aspects of business management. The ISO 28000:2007, in particular, was developed in response to industry demands for enhanced supply chain security.
As well as ISO 28000, FPCL is working towards introducing Occupational Health and Safety ISO 18000 Standards that allows organisations to control their OHS risks, and Environmental Management Systems. ISO 14000 helps organisations minimise any adverse impact on the environment. These standards are accepted globally as being instrumental in facilitating and enhancing international trade and FPCL’s compliance allows the company to promote its achievements to the rest of the world.
Given FPCL is linked to the rest of the world by far-reaching international supply chains - the term for describing the overall process whereby goods are transported from the point of production or manufacture to their destination. Supply chains are dynamic systems of resources, organisations, processes, people, activities and information. They have always been vulnerable to misuse and abuse, as evidenced by, for example, the global problems of drugs, arms and people smuggling, acts of piracy and cargo theft. Misuse includes activities such as the falsification of documents to avoid paying import duties or to
import banned items. International shipping companies, their agents, importers and exporters demonstrate their confidence in Fiji Port’s ability to provide safe, secure port facilities. This is evident as 95% of Fiji’s import/export trade crosses the nation’s borders at our ports, making it essential to the nation’s economy that FPCL ensures that the highest standard of security best practice are in place at the international Ports of Entry, Suva, Lautoka and Levuka. In order to meet ISO standards and be accredited by an independent certificating body, FPCL must continue to meet world-class specifications, ensuring the quality, safety and efficiency of FPCL’s services and systems.
FPCL Strategic Plan 2016-2018
Our annual Strategic Plan articulates the requirements of the Company under its role of Port Landlord and creates a range of goals to achieve desired outcomes.
I am pleased to report that our fourth consecutive year of strategic planning took place during November with Board, executive management and departmental staff proactive in the drafting of goals and strategies for the production of the FPCL Strategic Plan 2016-2018.
This planning period again saw a series of stakeholder workshops being held in Suva at Fiji Port’s head office in Walu Bay. This year’s sessions were highlighted by the generous support and valued input from a range of maritime industry stakeholders and associated contributors.
As has been the case in the past this Plan represents an inclusive approach to planning with senior management and staff taking a proactive role in devising the outcomes as is one that utilises input from employees whose contributions are specific to their roles, responsibilities and obligations. Accordingly, all FPCL managers and supervisors were given the opportunity to address their division, department or unit’s strategic goals and provide key objectives.
A number of senior representatives from various government ministries and departments and individuals and organizations were consulted during the planning phase for this Plan - several of whom made presentations at workshop sessions. Amongst those to provide valuable input, and to whom we are most
11Fiji Ports CorPoration LimitedAnnuAl report 2014
grateful, were representatives from the Reserve Bank of Fiji, SPC, Shipowners and Agency Association; National Fire Authority; Department Environment Sciences, Fiji National University; USP School of Executive Management; Sunergise Company; FPTL; ANZ Fiji and Pacific; Sustainable Sea Transport Research Programme PaCE-SD USP; NTPC; Fiji Maritime Academy as well as representatives from Local Wharfs in the Ports of Suva and Lautoka and those from the Fishing Wharfs, Suva.
Advancing Fiji Ships
Our subsidiary company FSHIL continued to prove its worth as a valuable asset well placed to generate even more impressive returns than that of 2015. The company’s record dividend trend also continued with the company contributing an After Tax Profit of $1.5 million for the year.
FSHIL made a number of notable improvements to its business model this year- a process which it began the year before. Featured amongst the many upgrades and modernisation plans was its move to a greater reliance on data entry, and the inevitable replacement paper-based records. Fiji Ship’s advancement towards a ‘greener’ way of doing business has also provided advantages for the Estimations department which is benefiting for the availability of data useful for calculating the true cost of a job.
Protecting the skill base at Fiji Ships is a constant requirement is the company is to continue to meet critical deadlines and maintain its reputation. In response, this year Fiji Ships introduced software advances that allows for recruitment decisions to be more objectively measurable (with job descriptions and minimal qualifications entered into the matrix). Individual competencies and qualifications are also entered making it possible to rank candidates according to their strengths and suitability for any position. It also undertook a Job Evaluation exercise,and is exploring a development framework for a Performance Management System (PMS) aligned with the company’s strategic direction. FSHIL’s goal in this area is to ensure each employee understands in advance what aspects of his or her performance will be measured, and how this measurement will be monitored allow for more detailed analysis of data which can provide a valuable planning tool for the company moving forward.
Importantly, FSHIL achieved a milestone in its journey towards ISO accreditation with the completion of Gap Analysis of the company’s Quality Management System. The final step before FSHIL can apply for an external audit for ISO accreditation is the training of internal auditors within the company as a department cannot audit itself. This must be done cross-departmentally by competent internal auditors.
In terms of operations, the company progressed with its plans to invest in, and/or upgrade facilities and equipment needed to further its reputation as a provider of quality heavy industry services. Being able to deliver these service on budget and on time is at the heart of Fiji Ship’s business model. Diversifying its business portfolio is also expected to assist the company fulfill its longer- term objective of becoming the premier regional provider of maritime ship repair, heavy industry and specialised services.
Appreciation
As we head towards what should be fascinating year I would like to offer my appreciation and thanks our Chairman and Board of Directors, for their enduring commitment to the Company and staff during the year in review. I would also like to acknowledge the hard work of the executive management team and department heads and supervisors from all our designated Ports for their proficiency during another year of adjustment.
To our colleagues at the Ministry of Public Enterprises and the Ministry of Finance, I thank you for your support and guidance. And, to our many stakeholders and associate partners in the maritime industry, we pledge our continued commitment to delivering effective and accountable outcomes as we roll out our plans for infrastructure improvements and upgrades in the months to come.
Vajira Piyasena Chief Executive Officer
12 Fiji Ports CorPoration LimitedAnnuAl report 2014
Operating as a Ports Landlord/Regulator
2015 was the first full year of operation for Fiji Ports since changes were made in 2013 to the Company’s organisation structure. The changes, allowing the Company to operate with more consistent with its role as Landlord Port/Regulator, has seen FPCL transition from operating as a ‘process based organisation’ to one with an enhanced focus on ports facility development.
FPCL continues to work towards meeting expectations as a ‘supervisory body for standards’ relating to Ports of Entry and other local ports throughout Fiji. As such, growing trade through Fiji’s Ports in a sustainable manner that will optimise returns remains vital to FPCL moving forward.
The Company has continued its plans to build on its existing property portfolio and improve on its current and future strategic investments.
Obligations Under Law
Fiji Ports Corporation Limited has significant and growing international and national obligations under law and treaties. The principle legislation under which FPCL is governed by is the Sea Ports Management Act 2005, however, as a government owned commercial company Fiji Ports also has broad responsibilities under the Public Enterprise Act 1996. FPCL’s objectives and responsibilities under the Sea Ports Management Act 2005 are as follows:
- To effectively manage sea ports in Fiji
- To create or enhance opportunities in the provision of port services.
- To manage operation and regulatory responsibilities that include:
a. Manage the processes of declaring of new ports and approaches to ports;
b. Responsibility for management of Fiji’s Ports;
c. Taking action in the event of an emergency;
d. Acquiring land for Port operations:
e. Levy charges for provision of services;
f. Detail vessels in breach of Fiji law;
g. Exempt, reduce or refund, any vessels for dues and rates;
h. Take a lien, and after 21 days (or for perishables after 21 hours) sell goods in relation to charges;
i. Take a lien and after 21 days over vessels in relations to charges;
j. Prosecute offences of evasion of due or rate or charges;
k. License persons to access ports for commercial purposes;
l. Chair meetings of Stakeholders on Ports issues;
m. Removal of derelict and dangerous vessels;
n. Make rules regulating the use and operation of ports and approaches to ports, and the conduct of persons within ports and approaches to ports, and fine for breach of those rules.
Chief Executive officer’s reportFiji PORTS CORPORaTiOn LimiTed
13Fiji Ports CorPoration LimitedAnnuAl report 2014
Business Obligations
Fiji Ports Corporation Limited operates as a Port Landlord and Regulator. Strategically situated in the ‘centre’ of the South Pacific region, Fiji Ports is critical to the local inter-island and regional sea transport industry.
Further to the transfer of ownership of Ports Terminal Limited (FPTL) in 2013, Fiji Ports relinquished freight and storage operations to the associate company, however, continues to operate cruise and other vessel operations of the Kings Wharf, Suva, and the Queens Wharf, Lautoka. Fiji Ports maintains ownership and operation of Levuka Wharf, Ovalau, and oversees the operations and ISPS requirements for the following ports:
- Malau Wharf Labasa, Vanua Levu (owned by Fiji Sugar Corporation)
- Rotuma Port, Rotuma (owned by Rotuma Council)
- Wairiki Wharf, Nabouwalu, Vanua Levu (owned by Tropic Woods Industries Ltd)
- Vuda Viti Levu (owned by oil companies)
FPCL continues to oversee and operate port facilities located at Mualiwalu I and II, Walu Bay,
Suva, and Local Wharf at Lautoka through the provision of ports infrastructure and related services to ensure industry safety and security, and maintains its head office is located at Muaiwalu House, Walu Bay, Suva, Fiji.
Obligations In Partnership
FPCL works with Maritime Safety Authority of Fiji (MSAF) with respect to Fiji’s Port obligations under the International Maritime Organisation (IMO) including Ports State Control, ILO/ IMO requirements for port reception facilities (discharge of sewerage and rubbish) and Code of Practice on Security in Ports. Issues under the heavy regulated Global Cruise industry is a continuing responsibility for FPCL given the number of
cruise ships in our ports continues to increase each year. Any country whose ports, or waters, are visited by cruise ships has authority to examine and take measures to ensure compliance with relevant laws, regulations and international treaties. The cruise industry is subject to the International Ship and Port Facility Security Code (ISPS Code), which requires that access to ships and port facilities be tightly controlled.
Our People’s Obligations
Fiji Port’s Board, management and senior staff are committed to:
- Adopting leading planning principles and management systems;
- Working cooperatively to ensure safe and secure port environments;
- Providing world-class infrastructure; and
- Behaving, at all times, in concert with FPCL’s corporate Values.
Obligations to the Community and Our Environment
In addition to carrying out its corporate obligations, FPCL works to maintain its commitment to the community through social activities with direct and indirect benefit to the broader community and to those in need.
Of importance to the Corporation is its role in environmental protection. Where possible the Corporation’s staff and management generate stakeholder awareness regarding land and sea pollution as part of their daily activities and duties. The growth of the mining industry in Fiji brings new responsibilities. Carrying solid bulk cargoes involves serious risks, which must be managed carefully to safeguard the crew and the ship. These risks include reduced ship stability, and even capsizing, due to cargo liquefaction, fire or explosion due to chemical hazard, and damage to ship structures due to poor loading procedures.

14 Fiji Ports CorPoration LimitedAnnuAl report 2014
Vilash ChandDirector
Mr Chand, a member of the Fiji Ports Terminal Board, is currently working in the position of General Manager at the Unit Trust of Fiji. He also serves as a director on the Board of Home Finance Company, and was appointed to the FINTEL Board in March of 2012. Mr Chand became a Fiji Ports Board member in July 2013.
Board of DirectorsFiji PORTS CORPORaTiOn LimiTed
FPCL’s Board of Directors 2015.
Tevita KuruvakaduaChairman
Mr Kuruvakadua is an accountant by profession and served in various positions in the civil service between the years 2000 and 2008. Mr Kuruvakadua currently holds the position of General Man- ager at the TLTB, and has served as a member of the FNPF and TFL Board since 2010. He was appointed to the Fiji Port’s Board in July 2013, and appointed chairman in August 2013.
Vijay MaharajDirector
Appointed to the FPCL Board in July 2013, Mr Maharaj is also Chairman of the Land Transport Authority. He is principal of M.C. Lawyers Suva Fiji and has been practicing as a barrister and solicitor in Fiji for the last 30 years. He was holds a BA (Hons) UK, and is a Member of the Institute of Marketing (MIM) UK, and Barrister of (Inner Temple) London. He is a former Crown Council at the Office of the Director of Prosecutor, Fiji, and admitted to practice as a Barrister of the High Court of Australia.
15Fiji Ports CorPoration LimitedAnnuAl report 2014
Corporate governanceFiji PORTS CORPORaTiOn LimiTed
The essence of good governance is leadership. Good governance is a fundamental principle to Fiji Ports Corporation Limited (FPCL). The Board of FPCL is aware of the responsibilities it has for stewardship and accountability to its shareholders, the Government of the Republic of Fiji Islands. The Board works closely with management to ensure that issues of disclosure, transparency, due process and probity are continually under review and maintained at consistently high levels.
Role of the Board
The Board is appointed by the Minister of Public Enterprise and Reform Unit in accordance with the provisions Public Enterprise Act:
(i) Responsible for FPCL’s commercial policy and direction;
(ii) Ensuring that FPCL achieves its principal objective as defined in Section 43 of PEU Act 1976:
(a) to operate as a successful business and, to this end, to be as profitable and efficient as comparable businesses which are not owned by the State.
(b) to achieve through the application of the key principles of public enterprise reform and their elements.
Functions of the Board
The main functions of the Board are summarized as:
• ToprovidestewardshipoverFPCL’sfinancialaffairs,protectits financial position and ensure that is able to meet its debt as and when they fall due.
• To lead the development of and approve an ongoing fiveyear Strategic Plan for FPCL which includes:- general and specific goals;- analysis of risks and opportunities for FPCL- financial forecasts and projections
• ApprovinganannualbudgettoFPCLandcomparingactualresults against budget on a monthly basis.
• Approving a clearly defined division of responsibilitiesbetween the Board and the Chief Executive Officer (CEO)
• ApprovingspecificdelegationsofauthoritytotheCEOandother levels of management
• Appointment of the CEO and approving terms andconditions of his or her employment for those of senior management personnel (being all management who report directly to the Chief Executive Officer).
• Approving key performance indication for the CEO andsenior management personnel.
• Ensureadequate successionplans for theCEOand seniormanagement personnel.
• DeterminingthatFPCLhassoundfinancialandoperationalreporting systems and internal controls.
• EstablishingpoliciestoensurethatFPCLcomplieswithallapplicable laws, industry regulations and any major ongoing contractual obligations.
• Determining that Fiji Ports has sound financial andoperational reporting systems and internal controls
• Establishing policies to ensure that Fiji Ports complieswith all applicable laws, industry regulations and major contractual obligations.
• Determining that FPCL has sound systems to regularlymonitor all relevant laws, industry regulations and major contractual obligations
• Determining that theannualfinancial statementsofFPCLare prepared in conformity with the provisions of the Sea Port Management Act and International Financial Reporting Standards.
• Appointment of an external auditor after consideringthe recommendation of the Audit and Finance and Risk Management Sub Committee appointment of internal auditors. Reviewing the balance of skills and competence of Board members and making recommendation to the Minister in respect to proposed new Board appointments.
16 Fiji Ports CorPoration LimitedAnnuAl report 2014
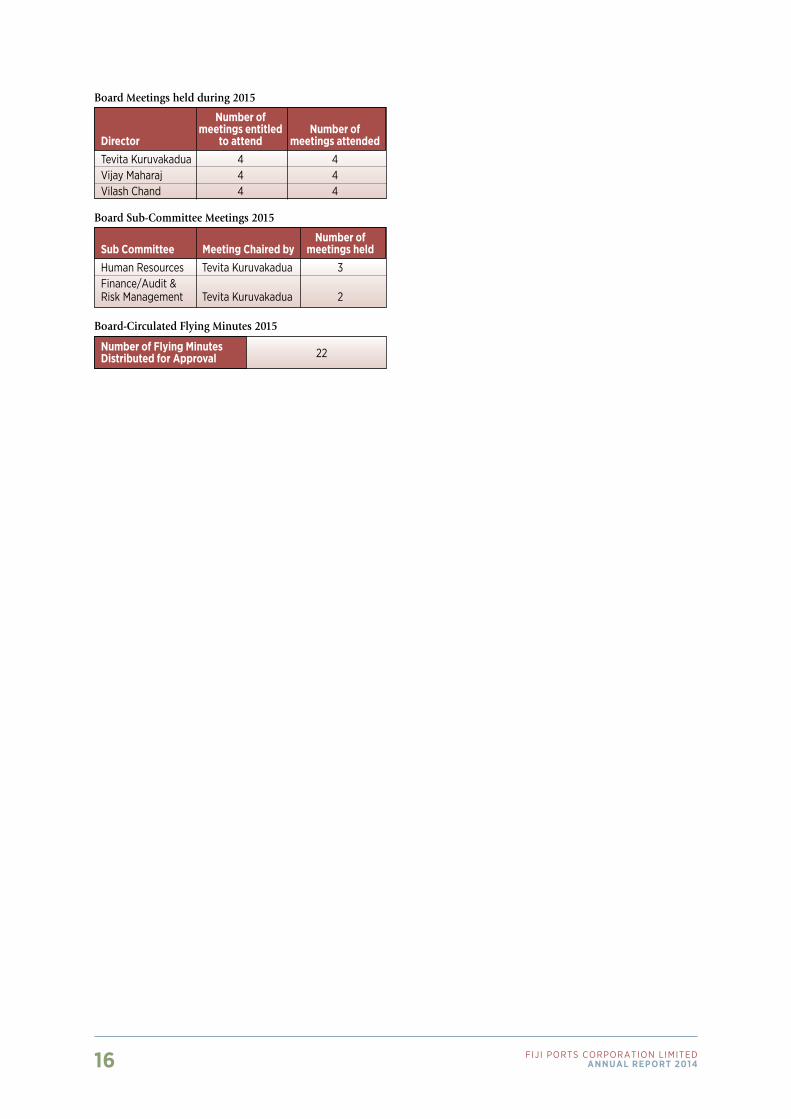
Board Meetings held during 2015
Board Sub-Committee Meetings 2015
Board-Circulated Flying Minutes 2015
Number of meetings entitled Number ofDirector to attend meetings attendedTevita Kuruvakadua 4 4Vijay Maharaj 4 4Vilash Chand 4 4
Number ofSub Committee Meeting Chaired by meetings heldHuman resources Tevita Kuruvakadua 3Finance/Audit &risk Management Tevita Kuruvakadua 2
Number of Flying MinutesDistributed for Approval 22

17Fiji Ports CorPoration LimitedAnnuAl report 2014
Eranda KotelawalaChief operating officer
With more than 20 years professional experience serving local and overseas multinational organizations, Mr Kotelawala joined Fiji Ports in 2015. His credentials include FCMI MSc (UK), CPM(Asia), MIIBA (Canada), MPMI (USA), AMSLIM (Sri Lanka) (Chartered Manager, Certified Professional Marketer). He is also a Fellow of Chartered Management Institute UK. His career path has taken him to many destinations where he worked on projects including Business Process Re engineering Project - TRANSNET, Port of Durban, South Africa (2008); Work Study Project, Business Process Re-engineering, Port Sultan Qaboos, Oman (2010 - 2013); e-Local Government Project, Sri Lanka; and Disaster Management and Recovery Project for Local Government, Sri Lanka.
Vajira PiyasenaChief Executive officer
Vajira Piyasena joined Fiji Ports Corporation Limited as CEO in 2011. He is a Chartered Fellow of the Chartered Institute of Logistics and Transport, Fellow of the Chartered Quality Institute (UK), Chartered Quality Professional (CQP) (UK), Fellow of the Institute of Marine Engineering Science and Technology (UK), Fellow of the Chartered Management Institute (UK) and a Member of the Royal Institution of Naval Architects (UK). He qualified in UK as a Marine Chief Engineer and had a seagoing career serving with major international shipping companies. He is also a Chartered Engineer and Member of Institute of Engineers (India) and an Incorporated Engineer, Engineering Council (UK). His professional career and diverse experience spans over 30 years in the areas of maritime industry, academic sector and management consultancy. His expertise also extends to international shipping, marine engineering, maritime education & training, ship repairs & ship building and maritime safety. As a management consultant he has worked with over 100 companies in projects involving quality systems and policy development, corporate restructuring and international business development. Vajira holds a MBA and a Master’s Degree in Engineering Management including several other post graduate qualifications in the areas of Production and Technology, Quality and Operations Management and International Affairs concentrating on International Law.
Shyman ReddyChief Financial officer
Mr Reddy was appointed to the position of GM Finance (Acting) in August 2012, and appointed CFO in 2014. He joined FPCL in 2011 after departing the ANZ Bank where he held several positions including Assistant Manager Corporate Banking. He was an academic with the University of the South Pacific in the School of Accounting and Finance. Mr Reddy has Post Graduate level qualifications in Accounting and Finance, and is a triple gold medalist of USP. He is a full member of CPA (Aust) and Chartered Accountant (Fiji). Mr Reddy was awarded Fiji Young Accountant of the Year in 2013. Recently he was appointed to the board of state owned food and manufacturing enterprise Foods Processors (Fiji) Ltd.
Executive Management
Department Managers
Fiji PORTS CORPORaTiOn LimiTed
Ronald SuePort Engineer
Penitiko YauvoliHarbour Master - Lautoka
Laisiasa GonewaiActing HarbourMaster - Suva
Lopeti Radravuoperation Manager FSHIL
Jiovilisi BiukotoFPCL Manager Hr
Akeef KhanManager ICT FPCL
Dinesh LingamProperty Manager (Acting)
18 Fiji Ports CorPoration LimitedAnnuAl report 2014
CEO
BOARDSECRETARY
PERSONAL ASSISTANT TO
CEO
BOARD
ChIEF FINANCIAL
OFFICER
FINANCE FPCL
ICT
FINANCELAuTOKA
AuDIT &COMPLIANCE
ChIEFOPERATING
OFFICER
OPERATIONS
PRODuCTION & wORKS
FINANCE
hR & TRAINING
ESTIMATION
huMANRESOuRCES
LEGAL
CuSTOMER &PuBLIC
RELATIONS
TRAINING &QuALITY
SAFETY & ENVIRONMENT
hARBOuRMASTERS SuVA/
LAuTOKA
PORTS SECuRITYSuVA/LAuTOKA
FPCL PORTOPERATIONS
LOCAL whARVESSuVA/LAuTOKA
LEVuKA OFFICE
PORTENGINEERING
PROJECTS
PROPERTYMANAGEMENT
LEGEND:BAnD 7 –BAnD 6 –BAnD 5 –BAnD 4 & Below –rEPorTIng LInK
Finance Div Port operations Div Technical Serv. Div Corporate Serv. Div FSHIL
NOTE 1:THE CoLorS rEPrESEnT THE BAnD oF THE HEAD oF DIVISIon/DEPArTMEnT/unIT
NOTE 2:FSHIL BAnDS ArE AS PEr THE CoMPAnY STruCTurE AnD noT rELATIng To FPCL STruCTurE
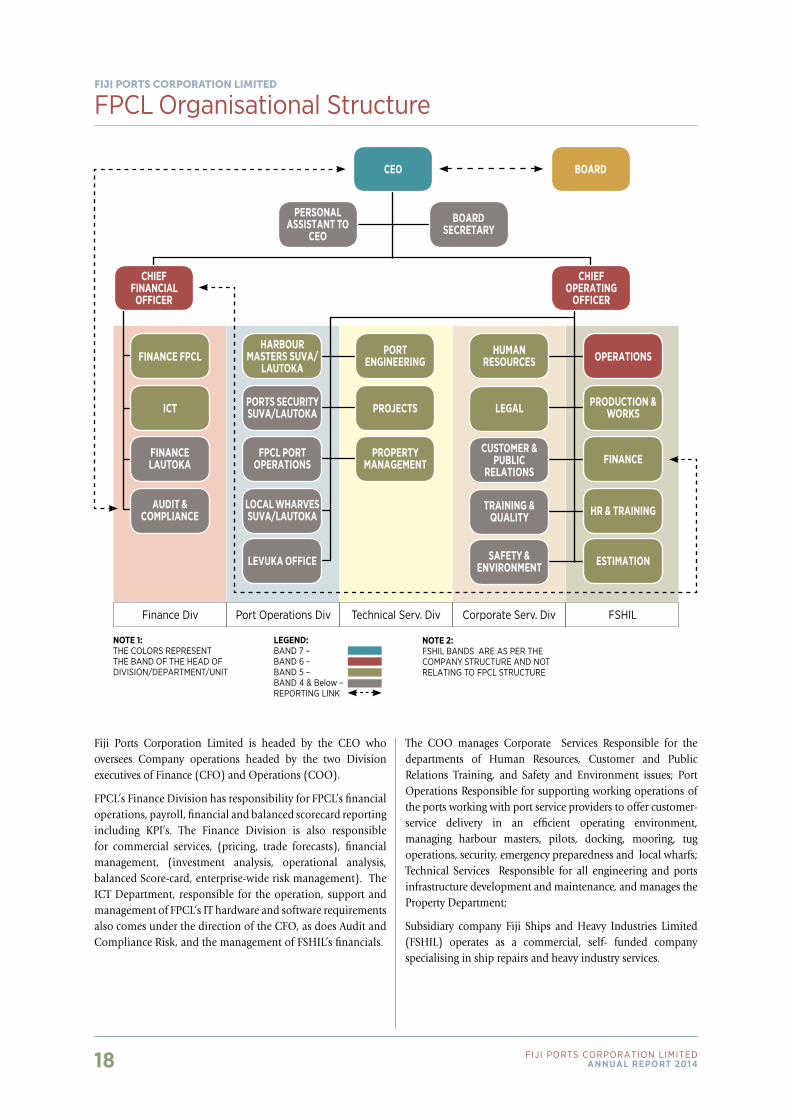
Fiji Ports Corporation Limited is headed by the CEO who oversees Company operations headed by the two Division executives of Finance (CFO) and Operations (COO).
FPCL’s Finance Division has responsibility for FPCL’s financial operations, payroll, financial and balanced scorecard reporting including KPI’s. The Finance Division is also responsible for commercial services, (pricing, trade forecasts), financial management, (investment analysis, operational analysis, balanced Score-card, enterprise-wide risk management). The ICT Department, responsible for the operation, support and management of FPCL’s IT hardware and software requirements also comes under the direction of the CFO, as does Audit and Compliance Risk, and the management of FSHIL’s financials.
The COO manages Corporate Services Responsible for the departments of Human Resources, Customer and Public Relations Training, and Safety and Environment issues; Port Operations Responsible for supporting working operations of the ports working with port service providers to offer customer-service delivery in an efficient operating environment, managing harbour masters, pilots, docking, mooring, tug operations, security, emergency preparedness and local wharfs; Technical Services Responsible for all engineering and ports infrastructure development and maintenance, and manages the Property Department;
Subsidiary company Fiji Ships and Heavy Industries Limited (FSHIL) operates as a commercial, self- funded company specialising in ship repairs and heavy industry services.
FPCL organisational StructureFiji PORTS CORPORaTiOn LimiTed
19Fiji Ports CorPoration LimitedAnnuAl report 2014
Fiji Port’s Chief Operating Officer oversees management of Fiji Port’s Corporate Services which comprises the departments of Human Resources, Staff Training, Legals, Customer and Public Relations and Safety, Health and the Environment.
Human Resources
The Company constantly strives to attract high caliber employees to ensure FPCL is well positioned to carry out its role as Port Landlord/Regulator in the best possible manner. Attracting and maintaining an innovative and motivated workforce also guarantees Fiji Ports remains an employer of choice.
It is the responsibility of the Human Resources department to provide a full range of human resource- based functions for the Company’s 160 employees. In order to safeguard FPCL’s human capital, and ensure the Company remains competitive, a number of new HR initiatives were put into action during the year highlighted by:
• AcomprehensivereviewoftheHarbourMaster’sOfficeandPilot operations was undertaken;
• The continuous audit of HR processes was undertakenacross the Group of Companies;
• EstablishmentofanewmoremodernemployeeTimeandAttendance System;
• Recruitmentofpersonneltotwonewstructuraloperationspositions;
• Inductionof10newemployeesacrosstheGroup;and
• Paymentofaperformancebonusandsalaryincrementbasedon FPCL’s newly introduced Performance Management System (PMS) outcomes;
This year, perhaps more than most, the Human Resources department introduced change in the way it delivers its services to Company employees. An adjustment upgrade of note, which
had a significant impact on operations, was the installation of more electronic-based services. Owing to these up- grades the department has been able to streamline its Leave Application and Time and Attendance Verification System also greatly reducing the need for paper, and saving time perusing leave forms and time sheets. This ‘saved’ time is now being reinvested in improving other HR-related services.
The department is very much aware of the need to of streamline processes and improve policies to ensure the Company is aligned to world’s best practices. In view of this FPCL established a Capability Framework which clearly defined the various functions within the Company, and identified variations within the categories of Core Business, Support Functions, Growth and Development Functions and Corporate Services. The Framework has proved to be a valuable guide in terms of identifying capability priorities, and provides management with a more complete understanding of where best to invest Company resources.
Early in the year a workshop was held for FPCL management that established individual and departmental responsibilities for meeting company Key Performance Indicators (KPIs). The workshop sessions, conducted by an independent consultant, were aligned to the year’s strategic objectives as provided in the FPCL Strategic Plan 2015-2017.
Especially gratifying for the department this year was the Company’s recognition at the Fiji Excellence in Business Awards. From a HR perspective this was important as contributions were made by department heads whose role it was to ensure that Company’s policies and processes were well documented, and that processes were followed in accordance to the required application documentation. Achieving recognition in the next category (at next year’s event) remains the collective ambition of all FPCL employees.
Corporate ServicesFiji PORTS CORPORaTiOn LimiTed
20 Fiji Ports CorPoration LimitedAnnuAl report 2014
Executive Appointments
Further to government’s decision to divest subsidiary company FPTL in 2013 significant revisions to the Company’s organisational structure took place. Part of this change saw the new position of COO created to oversee a large proportion of FPCL’s operations. After an extensive search to identify a suitable candidate, Eranda Kotelawala, joined the Group early in the year.
Fiji Port’s middle management tier was also strengthened with the inclusion of a new position, Manager Finance. Kirtan Lal was appointed to the role which has the responsibility of overseeing the company’s day-to-day financial operations while providing managerial support to the executive management team. The position was also introduced in response to the expanding work loads at the Ports of Suva, Levuka and Lautoka, commitments related to FSHIL expanding operations, and corporate responsibilities required by the Finance Division for associate company, Fiji Ports Terminal Limited.
A new Manager ICT, Akeef Khan, was also appointed during the year. FPCL’s IT Manager plays an ever increasing role in the delivery of efficiently managed functions that support FPCL’s core operations.
In terms of short term assignments, FPCL also engaged a specialist for six months to establish a corporate Document Management System (DMS). The recommended SAP-DMS (Systems, Applications and Products in Data Processing–DMS) meets FPCL’s requirements for coordinating document processing while allowing for automation of the entire life of a document - from its creation to storage, access and updating. Subject to access authorisation, individual documents can now be accessed immediately from any computer linked into the Company’s network. The System also sup- ports archiving and allows for the storage and retrieval of the Company’s important technical drawings, plans, pictures and photographs.
FPCL’S Employees by Contract Breakdown for 2015
Num
ber o
f Sta
ff
0102030
5060
8090
Male
Staff Contract 64 26 90 RRw 66 4 70
Female Total
70
40
FPCL’S Employees by Gender for 2015
Num
ber o
f Sta
ff
0
10
20
30
50
60
70
Male
Staff Contract 64 26 RRw 66 4
Female
40
Succession Planning
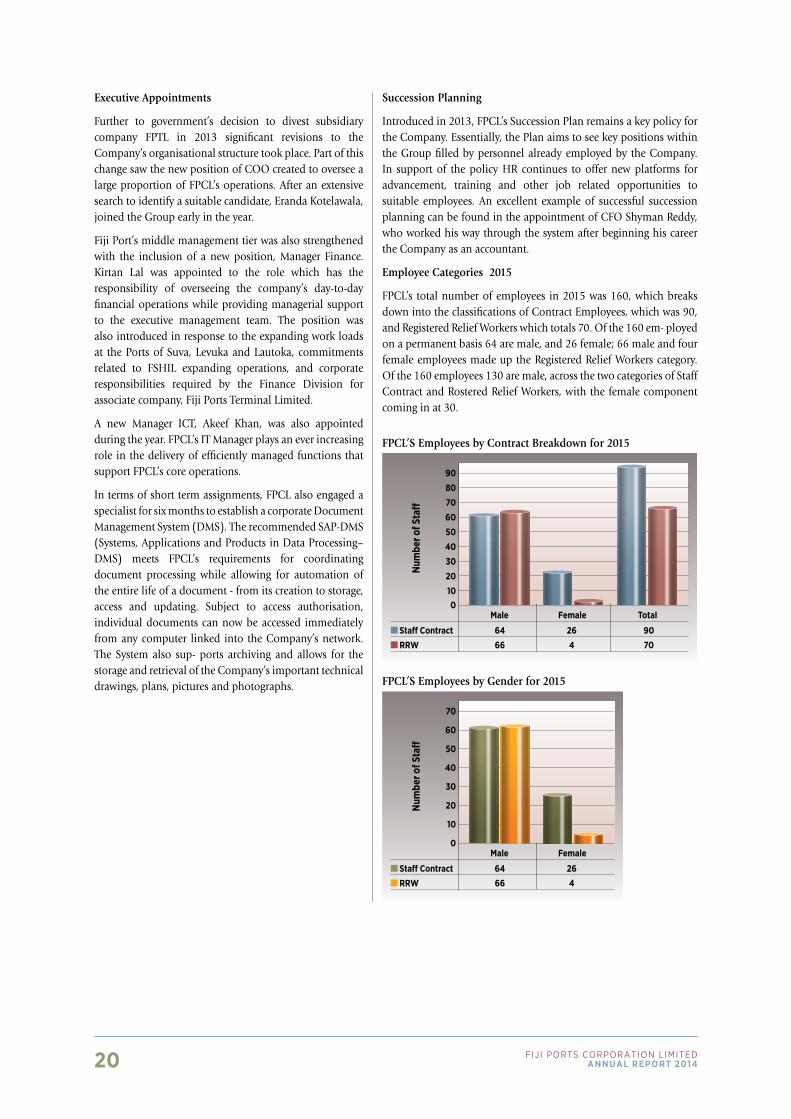
Introduced in 2013, FPCL’s Succession Plan remains a key policy for the Company. Essentially, the Plan aims to see key positions within the Group filled by personnel already employed by the Company. In support of the policy HR continues to offer new platforms for advancement, training and other job related opportunities to suitable employees. An excellent example of successful succession planning can be found in the appointment of CFO Shyman Reddy, who worked his way through the system after beginning his career the Company as an accountant.
Employee Categories 2015
FPCL’s total number of employees in 2015 was 160, which breaks down into the classifications of Contract Employees, which was 90, and Registered Relief Workers which totals 70. Of the 160 em- ployed on a permanent basis 64 are male, and 26 female; 66 male and four female employees made up the Registered Relief Workers category. Of the 160 employees 130 are male, across the two categories of Staff Contract and Rostered Relief Workers, with the female component coming in at 30.

21Fiji Ports CorPoration LimitedAnnuAl report 2014
FPCL’s Staff Training Expenditure for 2015
FJD$
200,000.00180,000.00160,000.00140,000.00120,000.00100,000.0080,000.0060,000.0040,000.0020,000.00
0.00
Traning Category 23,192.00 32,136.54 7,210.84 25,921.61 99,417.37 187,878.36
Training-Inhouse
Training-Overseas
Seminars &Conferences
Training-Professional
Training-FNu/uSP
TotalTraning Cost
Staff Training
Commitment to improving on standards in the area of training remains a priority for the Company - especially given global workplace standards and expectations continue to be more stringent. Ensuring employees are well prepared to deal with tasks expected of them remains an explicit strategic goal and HR priority at Fiji Ports.
In addition to job-specific training provided by the Company during the year, FPCL continued to pro- mote opportunities for qualifying employees to undertake further studies or sign up for job related courses. Under this scheme fees are reimbursed on the understanding beneficiaries are bonded to work for FPCL for an agreed period of time.
Transparently 2015 was a major year for staff capacity building. A total of 507 separate training sessions were executed across FPCL, FSHIL, and associate company FPTL (whose staff continue to receive training as part of the divestiture agreement structured in 2013). Clocking up the majority of training programs was FPTL with 224. FPCL’s staff benefited form 164 training sessions with Fiji Ship’s staff engaging in 119 .
The total expenditure for Group staff training for the year totalled $187,878, significantly up from 2014’s investment of $132,965. As was the case in 2014 a challenge for the Training Unit is balancing the best possible training opportunities against ensuring maximisation of return on the levy paid to the National Training and Productivity Centre.
FPCL (and FPTL) Training Program 2015
Company Number of Training Sessions FPCL 164 FPTL 224 FSHIL 119 ToTAL 507
Levy Paid vs Grant Claim 2009 - 2015
FJD$
40,00035,00030,00025,00020,00015,00010,0005,000
-
Levy Paid 25,184 30,071 31,039 31,741 33,228 37,296 90% of grant Claimable 22,665 27,064 27,935 28,567 29,905 33,566 grant Claim 8,008 15,336 18,248 23,057 22,263 25,668
2009 2011 20132010 2012 2014
FPCL Grant Award 2001 - 2014
Perc
enta
ge (%
)
9080706050403020100
grant Award 50.15 35.42 47.16 38.39 55.78 57.68 43.48 35.47 31.8 51 58.79 72.64 67 76.47
2001 2002 2003 2005 20102007 20122004 20092006 20112008 20132013
22 Fiji Ports CorPoration LimitedAnnuAl report 2014
OS Attachments
In order to bolster employee expertise and offer valuable exposure to global trends FPCL provides for qualifying candidates to take part in overseas short term attachments.
Under the 2015 OS Attachment Program Fiji Ports CFO, Shyman Reddy visited Singapore for the inaugural Port Management and Operations Course. The initiative was funded in part by the Government of Singapore under the Singapore Cooperation Programme/Small Island Developing States. The Course was designed to provide participants with greater insight into planning, organising and use of resources at the highest service levels at the Port of Singapore - one of the world’s largest and busiest ports. The ground-breaking Course was attended by 35 participants from 32 countries.
This year Port Engineer, Ronald Sue, attended the Australasian Coasts and Ports Conference in Auckland, New Zealand. The Coasts and Ports Conference series is the pre-eminent forum in the Australasian region for professionals to meet and discuss issues extending across all disciplines relating to coasts and ports. It brings together engineers, planners, scientists, stakeholders and re- searchers to focus on the technological, scientific, policy, planning and design issues related to the region’s diverse and developing coasts.
Gender Equality
FPCL’s Human Resources Plan determines that women employees at Fiji Ports are provided opportunities to perform roles that are traditionally male dominated. In response female employees Sera Ieli and Stella Hanfakaga were invited to attend the Port Facility Security Officer training sessions organised by the Secretariat of the Pacific Community. Both women successfully completed the program and have been certified as Port Security Officers.
Security Officers Training
Fiji Port’s Security Officers received additional instruction when they attended the Maritime Internal Auditors course this year. The training, conducted in Lautoka, featured four days of theoretical work followed by Officers from Suva and Levuka carrying out an audit on the Port of Lautoka facility.
The following week the Lautoka based officers participated in the audit of the Suva Port facility.
In-house training is aimed at up-skilling staff directly concerned with security matters and is in line with the Company’s Security Policy.
Boat Master Training
Three Company employees attended the Boat Master Engineer, Class 6 training session con- ducted this year by instructors from the Maritime Safety Authority of Fiji (MSAF). The three trainees utilised FPCL’s Pollution patrol boast Dausasamaki, to complete the training exercise which was managed out of the Water Police Headquarters in Lami, Suva.
OHS Training Session
The Ministry of Employment Productivity and Industries Relations conducted training for FPCL and FPTL employees regarding the framework for managing OHS.
23Fiji Ports CorPoration LimitedAnnuAl report 2014
Customer Service Training
Over 50 employees from FPTL, FSHIL and FPTL attended Internal Customer Service Training conducted by a New Zealand specialist.
Fire Emergency Training and Drills
This year the Company undertook further training sessions as part of the Company’s Port-wide and City Emergency Preparations and Contingency Plan. A total of twenty six Fiji Ports fire wardens, along with personnel from FTPL, came together for their bi-annual training sessions with the National Fire Authority (NFA).
The training included sessions on how to manage various types of fire outbreaks, how to conduct a successful evacuation, sessions on emergency facilities and equipment, and risk management. Attention was also paid to meeting requirements associated with ‘hot works’ as welding carries its own dangers. Regular unannounced evacuation drills are also conducted.
In order to hone their skills and remind all employees of the importance of being prepared, Fire Wardens at Lautoka Port underwent the mandatory annual ‘refresher’ training course with the NFA. Eighteen FSHIL Fire Wardens completed their OHS required annual training.
First Aid Training
This year eighteen FPCL First Aid Officers completed the certification process with Fiji Red Cross Society. Assessed on a comprehensive range of potential first aid scenarios - in the work place and the home - Company participants are fully certificated to the internationally recognised New Zealand Red Cross Standards.
FBEA Briefings
2015 also saw FPCL embark on a formal journey of achieving business excellence. Providing quality services to Fiji Port’s customers and stakeholders is an important element of this ambition and several staff members were included in the one-day training program for the Company’s application for the 2015 Fiji Business Excellence Awards. The sessions provided participants with the opportunity to gain an understanding of the framework for the application, undertake implementation of key elements into the various departments with the view to bringing about improvements.
Safety, Health and the Environment
What was once the Safety department at FPCL has evolved over time to include OHS and environment issues. Referred to now as Safety, Health and the Environment department the focus has widened to include policies that safeguard Company’s staff and assets while ensuring stakeholders are aware of important issues regarding Port use.
The department continues to work towards achieving its Zero Harm vision by constantly improving safety measures in workplace, and by taking a lead role in environmental stewardship. As training is at the forefront of improving workplace safety the department works in accord with the Staff Training unit.
Occupational Health and Safety (OHS)
The Company’s Occupational Health and Safety (OHS) procedures and protocols are executed in accordance with the legal requirements of the Health and Safety at Work Act (HASWA) 1996. FPCL also has Occupational and Health Safety Committees in place for the Ports of Suva and Lautoka which operate as per legal compliance with HASAWA 1996. To further ensure FPCL provides a healthy and safe working environment for all its employees a comprehensive, Health and Safety Policy and Procedures Manual drafted in 2014.
As Port Landlord/Regulator FPCL strives to ensure operating mechanisms and training programs remain in place to prevent workplace injury or illness, environmental-related incidents and or property loss or damage. The Company’s policies also dictate that all employees and Port users are regularly updated on the importance of vigilance and are kept aware of critical OHS standards and requirements. To assist in these processes the Company appoints OHS Enforcement Officers who monitor the workplace environment and undertake regular inspections to ensure all operating equipment meets the required standard for safety and is in good operating order. The Company treats non-compliance with the International Ships and Ports Security (ISPS) Code, and Fiji’s Health and Safety in the Workplace Act, with the utmost importance.
24 Fiji Ports CorPoration LimitedAnnuAl report 2014
Making sure that Fiji’s international Ports of Entry remain ISPS and HASWA compliant requires all staff members to be aware of what qualifies as non-compliant, and to be alert should incidents occur. Reporting options in such instances includes advising the Security Officer or Safety Officer, or asking the CCTV department to capture the incident on camera, or even using a mobile phone to record a breach.
Accident Report
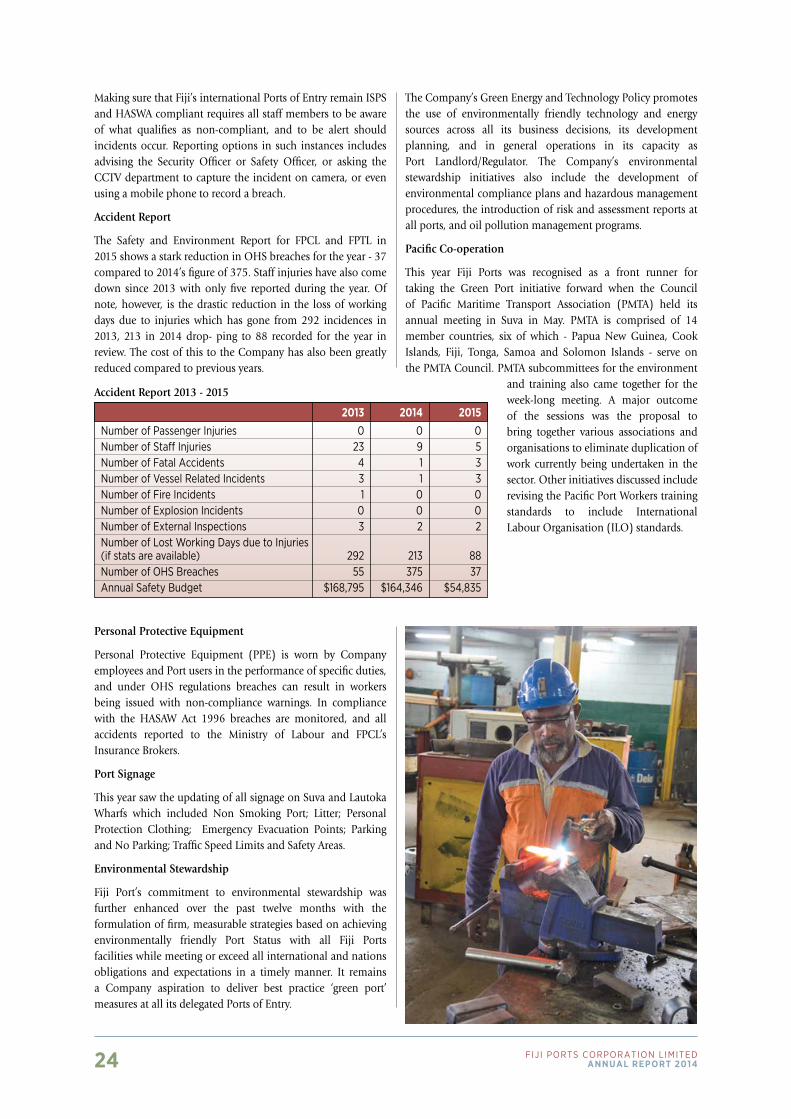
The Safety and Environment Report for FPCL and FPTL in 2015 shows a stark reduction in OHS breaches for the year - 37 compared to 2014’s figure of 375. Staff injuries have also come down since 2013 with only five reported during the year. Of note, however, is the drastic reduction in the loss of working days due to injuries which has gone from 292 incidences in 2013, 213 in 2014 drop- ping to 88 recorded for the year in review. The cost of this to the Company has also been greatly reduced compared to previous years.
2013 2014 2015number of Passenger Injuries 0 0 0number of Staff Injuries 23 9 5number of Fatal Accidents 4 1 3number of Vessel related Incidents 3 1 3number of Fire Incidents 1 0 0number of Explosion Incidents 0 0 0number of External Inspections 3 2 2number of Lost Working Days due to Injuries(if stats are available) 292 213 88number of oHS Breaches 55 375 37Annual Safety Budget $168,795 $164,346 $54,835
Accident Report 2013 - 2015
Personal Protective Equipment
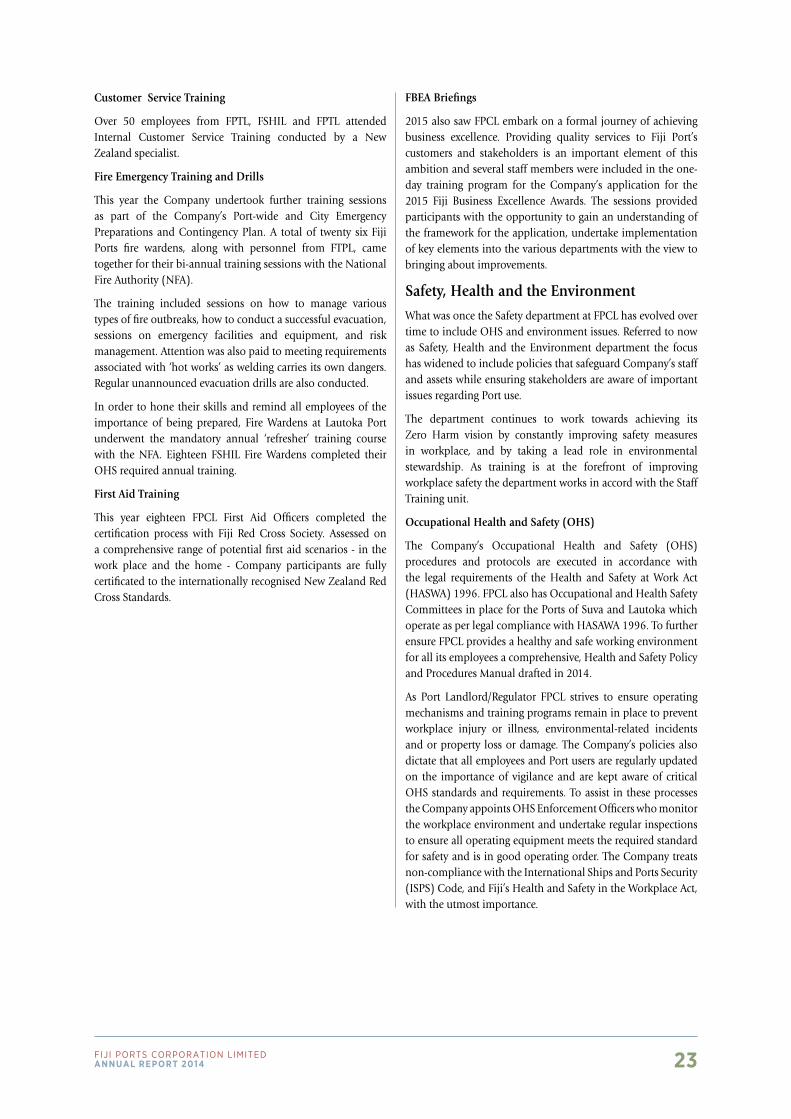
Personal Protective Equipment (PPE) is worn by Company employees and Port users in the performance of specific duties, and under OHS regulations breaches can result in workers being issued with non-compliance warnings. In compliance with the HASAW Act 1996 breaches are monitored, and all accidents reported to the Ministry of Labour and FPCL’s Insurance Brokers.
Port Signage
This year saw the updating of all signage on Suva and Lautoka Wharfs which included Non Smoking Port; Litter; Personal Protection Clothing; Emergency Evacuation Points; Parking and No Parking; Traffic Speed Limits and Safety Areas.
Environmental Stewardship
Fiji Port’s commitment to environmental stewardship was further enhanced over the past twelve months with the formulation of firm, measurable strategies based on achieving environmentally friendly Port Status with all Fiji Ports facilities while meeting or exceed all international and nations obligations and expectations in a timely manner. It remains a Company aspiration to deliver best practice ‘green port’ measures at all its delegated Ports of Entry.
The Company’s Green Energy and Technology Policy promotes the use of environmentally friendly technology and energy sources across all its business decisions, its development planning, and in general operations in its capacity as Port Landlord/Regulator. The Company’s environmental stewardship initiatives also include the development of environmental compliance plans and hazardous management procedures, the introduction of risk and assessment reports at all ports, and oil pollution management programs.
Pacific Co-operation
This year Fiji Ports was recognised as a front runner for taking the Green Port initiative forward when the Council of Pacific Maritime Transport Association (PMTA) held its annual meeting in Suva in May. PMTA is comprised of 14 member countries, six of which - Papua New Guinea, Cook Islands, Fiji, Tonga, Samoa and Solomon Islands - serve on the PMTA Council. PMTA subcommittees for the environment
and training also came together for the week-long meeting. A major outcome of the sessions was the proposal to bring together various associations and organisations to eliminate duplication of work currently being undertaken in the sector. Other initiatives discussed include revising the Pacific Port Workers training standards to include International Labour Organisation (ILO) standards.
25Fiji Ports CorPoration LimitedAnnuAl report 2014
Empowering Tenants and Port Users
The Company continues to encourage its property tenants to update to environmentally friendly energy applications and energy sources. As a Port Landlord/Regulator the issue of regulating property tenants that use of FPCL facilities is of critical importance.
Development of an environmental compliance plan for all Port facilities and tenant leases is currently underway and includes implementing a Water Resources Action Plan with a Sediment Management Plan and Tenant Storm Water Outreach Program. FPCL is also intending to target aid and soft loan funding to develop a plan for shore supply electricity for local fishing vessels to stop emissions in port and promote renewable energy to users.
This year thirty FPCL and FPTL employees participated in a one-day discussion forum, facilitated by an independent consultant, as part of the Company’s strategies to improve environmental management practices. Forum participants prioritised issues considered important such as the environmental impact of daily activities at the Ports of Suva and Lautoka, the need to clarify the environmental responsibilities of all Port users, and the exploration of ways in which current practices can be improved. Further to the forum an Action Plan is being developed to address areas needing immediate improvement.
Pollution Prevention Strategies
Recent published figures confirm an astonishing 5.25 trillion pieces of plastic debris - weighing an in- credible 269,000 tons - float on the ocean’s surface. As a Port Landlord/Regulator FPCL is committed to mitigating the amount of dangerous litter prevalent in and around our harbours and foreshores. Dangerous litter qualifies as any litter deemed dangerous, or is liable to become dangerous, including any litter which if deposited in a public place is likely to endanger someone or cause physical injury, disease or infection to any person coming into contact with it. The term applies to sharp metal, any glass, whether or not it is broken, any substance of a toxic or chemical nature, any oil, diesel, fuel or grease spill, and any abandoned or derelict vehicle.
Plans in this regard put in place during 2015 include Implementing a cost effective recovery plan from responsible parties for contaminated sites owned by FPCL. Plans also include the commissioning a timely and cost-effective Hazardous Materials Management Plan for capital development and a Clean Soil Action Plan for FSHIL.
Pollution fines collected in 2015 totalled $81,000, a figure that represents 12 transgressions. This shows a marked improvement from $273,696, from 24 breaches or oil spills in 2014. This was a pleasing outcome for the Company and is one that came about largely due to daily surveillance and monitoring by the FPCL’s Pollution vessel team.
A review of the Company’s paper disposal processes was also undertaken during the year. Given documents may not be required to be archived further to them being uploaded into the Company’s new Document Management System, a number of disposal methods (in keeping with FPCL’s Environmental Policy and its security needs for confidential material) were investigated. It was concluded that the most effective means of disposal was to contract a local recycle company to collect the paper from the Company’s head office in Walu Bay for recycling.
Energy Consumption
Fiji Port’s carbon footprint for 2015 recorded an average monthly carbon emission of xxxxx This figure is xxx compares favourably with xxxx Tonnes for 2014.
Fiji Port’s Energy Consumption for 2015
250000
200000
150000
100000
50000
0Jan May
Electricity Consumption from january 2015 - Dec 2015
SeptMar July NovFeb Jun OctApr Aug Dec
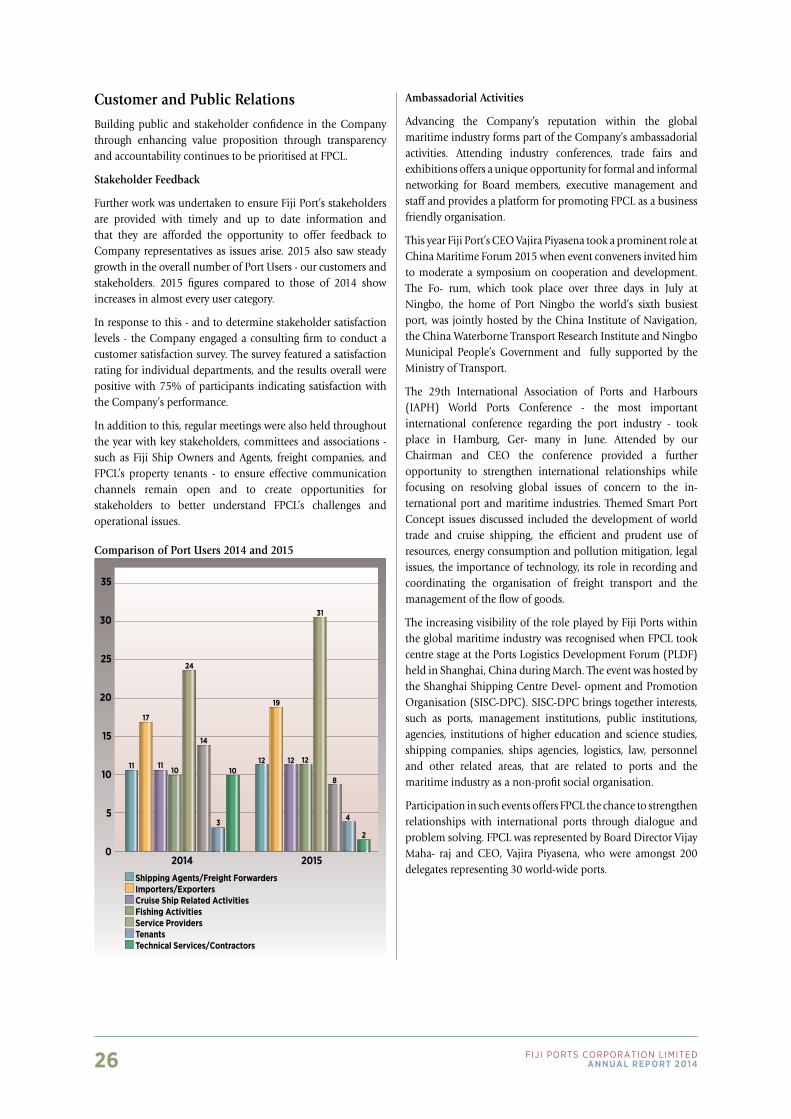
26 Fiji Ports CorPoration LimitedAnnuAl report 2014
Customer and Public Relations
Building public and stakeholder confidence in the Company through enhancing value proposition through transparency and accountability continues to be prioritised at FPCL.
Stakeholder Feedback
Further work was undertaken to ensure Fiji Port’s stakeholders are provided with timely and up to date information and that they are afforded the opportunity to offer feedback to Company representatives as issues arise. 2015 also saw steady growth in the overall number of Port Users - our customers and stakeholders. 2015 figures compared to those of 2014 show increases in almost every user category.
In response to this - and to determine stakeholder satisfaction levels - the Company engaged a consulting firm to conduct a customer satisfaction survey. The survey featured a satisfaction rating for individual departments, and the results overall were positive with 75% of participants indicating satisfaction with the Company’s performance.
In addition to this, regular meetings were also held throughout the year with key stakeholders, committees and associations - such as Fiji Ship Owners and Agents, freight companies, and FPCL’s property tenants - to ensure effective communication channels remain open and to create opportunities for stakeholders to better understand FPCL’s challenges and operational issues.
Comparison of Port Users 2014 and 2015
35
30
25
20
15
10
5
0
11
17
1110
24
2014 2015
14
3
1012
19
12 12
31
8
4
2
Shipping Agents/Freight Forwarders Importers/Exporters Cruise Ship Related Activities Fishing Activities Service Providers Tenants Technical Services/Contractors
Ambassadorial Activities
Advancing the Company’s reputation within the global maritime industry forms part of the Company’s ambassadorial activities. Attending industry conferences, trade fairs and exhibitions offers a unique opportunity for formal and informal networking for Board members, executive management and staff and provides a platform for promoting FPCL as a business friendly organisation.
This year Fiji Port’s CEO Vajira Piyasena took a prominent role at China Maritime Forum 2015 when event conveners invited him to moderate a symposium on cooperation and development. The Fo- rum, which took place over three days in July at Ningbo, the home of Port Ningbo the world’s sixth busiest port, was jointly hosted by the China Institute of Navigation, the China Waterborne Transport Research Institute and Ningbo Municipal People’s Government and fully supported by the Ministry of Transport.
The 29th International Association of Ports and Harbours (IAPH) World Ports Conference - the most important international conference regarding the port industry - took place in Hamburg, Ger- many in June. Attended by our Chairman and CEO the conference provided a further opportunity to strengthen international relationships while focusing on resolving global issues of concern to the in- ternational port and maritime industries. Themed Smart Port Concept issues discussed included the development of world trade and cruise shipping, the efficient and prudent use of resources, energy consumption and pollution mitigation, legal issues, the importance of technology, its role in recording and coordinating the organisation of freight transport and the management of the flow of goods.
The increasing visibility of the role played by Fiji Ports within the global maritime industry was recognised when FPCL took centre stage at the Ports Logistics Development Forum (PLDF) held in Shanghai, China during March. The event was hosted by the Shanghai Shipping Centre Devel- opment and Promotion Organisation (SISC-DPC). SISC-DPC brings together interests, such as ports, management institutions, public institutions, agencies, institutions of higher education and science studies, shipping companies, ships agencies, logistics, law, personnel and other related areas, that are related to ports and the maritime industry as a non-profit social organisation.
Participation in such events offers FPCL the chance to strengthen relationships with international ports through dialogue and problem solving. FPCL was represented by Board Director Vijay Maha- raj and CEO, Vajira Piyasena, who were amongst 200 delegates representing 30 world-wide ports.
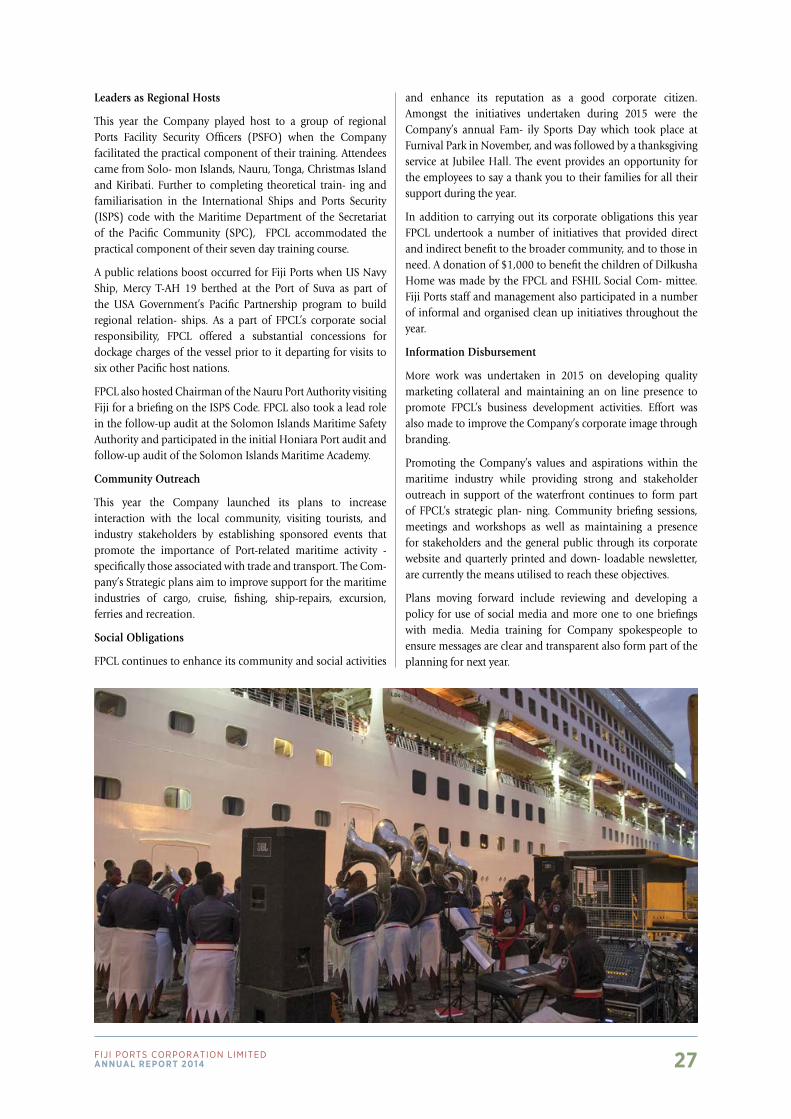
27Fiji Ports CorPoration LimitedAnnuAl report 2014
Leaders as Regional Hosts
This year the Company played host to a group of regional Ports Facility Security Officers (PSFO) when the Company facilitated the practical component of their training. Attendees came from Solo- mon Islands, Nauru, Tonga, Christmas Island and Kiribati. Further to completing theoretical train- ing and familiarisation in the International Ships and Ports Security (ISPS) code with the Maritime Department of the Secretariat of the Pacific Community (SPC), FPCL accommodated the practical component of their seven day training course.
A public relations boost occurred for Fiji Ports when US Navy Ship, Mercy T-AH 19 berthed at the Port of Suva as part of the USA Government’s Pacific Partnership program to build regional relation- ships. As a part of FPCL’s corporate social responsibility, FPCL offered a substantial concessions for dockage charges of the vessel prior to it departing for visits to six other Pacific host nations.
FPCL also hosted Chairman of the Nauru Port Authority visiting Fiji for a briefing on the ISPS Code. FPCL also took a lead role in the follow-up audit at the Solomon Islands Maritime Safety Authority and participated in the initial Honiara Port audit and follow-up audit of the Solomon Islands Maritime Academy.
Community Outreach
This year the Company launched its plans to increase interaction with the local community, visiting tourists, and industry stakeholders by establishing sponsored events that promote the importance of Port-related maritime activity - specifically those associated with trade and transport. The Com- pany’s Strategic plans aim to improve support for the maritime industries of cargo, cruise, fishing, ship-repairs, excursion, ferries and recreation.
Social Obligations
FPCL continues to enhance its community and social activities
and enhance its reputation as a good corporate citizen. Amongst the initiatives undertaken during 2015 were the Company’s annual Fam- ily Sports Day which took place at Furnival Park in November, and was followed by a thanksgiving service at Jubilee Hall. The event provides an opportunity for the employees to say a thank you to their families for all their support during the year.
In addition to carrying out its corporate obligations this year FPCL undertook a number of initiatives that provided direct and indirect benefit to the broader community, and to those in need. A donation of $1,000 to benefit the children of Dilkusha Home was made by the FPCL and FSHIL Social Com- mittee. Fiji Ports staff and management also participated in a number of informal and organised clean up initiatives throughout the year.
Information Disbursement
More work was undertaken in 2015 on developing quality marketing collateral and maintaining an on line presence to promote FPCL’s business development activities. Effort was also made to improve the Company’s corporate image through branding.
Promoting the Company’s values and aspirations within the maritime industry while providing strong and stakeholder outreach in support of the waterfront continues to form part of FPCL’s strategic plan- ning. Community briefing sessions, meetings and workshops as well as maintaining a presence for stakeholders and the general public through its corporate website and quarterly printed and down- loadable newsletter, are currently the means utilised to reach these objectives.
Plans moving forward include reviewing and developing a policy for use of social media and more one to one briefings with media. Media training for Company spokespeople to ensure messages are clear and transparent also form part of the planning for next year.
28 Fiji Ports CorPoration LimitedAnnuAl report 2014
Technical ServicesFiji PORTS CORPORaTiOn LimiTed
Technical Services is responsible for all FPCL engineering and ports infrastructure development and maintenance at FPCL’s designated Ports. Management of FPCL’s substantial Property assets also falls under the auspices of Technical Services.
Port Engineering
Capital Expenditure
FPCL‘s Capex for engineering works in 2015 came in at $16,921.53, however, the actual amount was higher owing to the large budget items having defect liability periods extending into 2016, and these were not captured in the 2015 report.
Repairs and Maintenance (R&M) Expenditure
Total R&M expenditure across the three main Ports of Suva, Lautoka and Levuka came in at $407,921. The majority of this was expended at the Port of Suva which totalled $288,196, followed by the Port of Lautoka where $109,756 was taken up in repairs and maintenance costs. Levuka’s expenditure for the year was $9,969.
Ports and Harbour Works program
Amongst the major projects executed by Ports Engineering during the year in review were:
• Upgrade of the Lautoka Incinerator. Works includedupgrading the facility to operate using a 5000L above ground fuel tank which would allow the fuel supplier to deliver bulk fuel via tanker truck. This upgrade resulted in the following:
+ Reduced transportation costs as previously fuel was supplied via drums which would then require them being transported to and from the Vuda Terminal. Further, the maximum volume obtainable in one trip was 1000L.
+ Safer overall operation due to less handling being required and improved storage of fuel.
• Five30TbollardswereinstalledfortheMuaiwaluIIWharfto facilitate berthing of the RORO fer- ries on the southern section of the Wharf. The original bollards, which had been damaged or lost, had not been replaced for a number of years.
• Thermographic scanning of all electrical switchboardsfor all FPCL properties in Suva, Lautoka and Levuka was completed.
• DredgingoftheLautokaTropikwood/FSCberthtoprovide11m draft was completed.
• ThesaleofFPCL’sKing’sWharfAdministrationBuildingandassociated property for $3.5 million to Fiji Road Authority was finalised. The associated relocation works required because of the sale of the building included the following:
+ Relocation of the main electrical switchboard for Prince’s Wharf and Shed 6 out of the Administration building to the Shed 6 switchboard room; and
+ Relocation of the King’s Wharf Fire Alarm Master Panel to Shed 6.
• StructuralassessmentoftheLevukaWharfwascompleted.
• ThedepartmentsourcednewfendersfortheQueen’sWharfOld Main Face with the work to be finalised in 2016.
• FijiPortsShipyardRedevelopmentProjectwasfinalised.Theproposal for the old Fiji Ships Ship- yard property at Lot 1 Sannergren Drive is based on converting the site into a wharf facility for fishing vessels, barges and/or RORO ferries, and other small vessels.
• Renovation and office fit-out of the Muaiwalu HouseGround Floor was completed.
Dredging for our main Ports of Entry
Amongst the major issues requiring attention this year relates to the harbours of our international Ports of Entry - specifically those of Suva and Lautoka, which are subject to silt buildup on the sea floor. The Port of Lautoka is also subject to silt build-up. Seasonal storms and cyclones - to which Viti Levu is prone - sees large quantities and river silt, sand mud and being washed down stream and into the harbour. It is essential that international vessels using the ports’ facilities do so safely and with sufficient draft.
This year the Company began the process of investigating the development of a scheduled dredg- ing plan that meets PIANC (World Association for Waterborne Transport Infrastructure) standards for criteria such as dredge depth and navigational channel design, with Cardno, Brisbane-based consultants, undertaking the initial scoping exercise for the Ports of Suva and Lautoka.
Dredging the harbour floors is also an issue for the international Ports of Entry in many of the smaller Pacific Island Countries and Territories - many of whom find the cost of the exercise is prohibitive. In mitigation a regional scoping study is underway to assess the feasibility of assisting PMTA member nations in sharing the cost harbour dredging.
Property Management
As Port Landlord, the Company has significant property assets from which it draws income. These assets are managed by FPCL’s Property department.
Essentially the department is tasked with ensuring properties owned or leased by FPCL are man- aged in a sustainable and financially responsible manner throughout its life cycle, and that such man- agement supports the cost-effective and efficient delivery of the Company’s Mission and remains consistent with its Vision.
As such the Property department aims to:
• Achieveeffectiveandefficientmanagementoutcomes thatserve broader Company objectives;
• Exercisefinanciallyresponsiblemanagementthatmaximizesthe long-term economic advantages for the Company, and provide better value for stakeholders, and ultimately FPCL’s shareholders;
29Fiji Ports CorPoration LimitedAnnuAl report 2014
• Provide barrier-free stakeholder access, and use of FPCLproperty and services that ensures inclusiveness and non-discrimination;
• Ensureculturalandenvironmentalstewardshipisexercisedin a manner that contributes to the preservation and protection of Fiji’s heritage and the environment; and
•Promotestheuseoffair,openandtransparenttransactions.
The Property department manages all issues related to the Company’s 121 tenants located across Fiji’s three main Ports. Tenants primarily include shipping agents, engineering companies, and fish- ing companies, with 16 lots at Rokobili leased to fish processing companies and for container stor- age, and one tenant, Technix Bitumen Pacific, Fiji’s only Bitumen supplier.
Traditionally, long-term tenants at Rokobili in Suva were issued to leases for up to 75 years, however, this policy has been revised to a maximum of 15 years with options for renewal depending upon the type of activities the tenant is undertaking. Notwithstanding, most FPCL tenancy agreements are for three to five years creating an on-going process as rentals become due for renewal. Policy dictates that all renewed leases require an evaluation process to ensure that all necessary requirements of the Commerce Commission and the Lands Department are met and any Stamp Duty necessary is paid. The renewal processes has become more streamlined over the years and is usually completed within two weeks. Where a tenant chooses not to renew, and a property becomes available as a new lease, the process of advertising for tenders takes place.
All Fiji Port’s tenants are obliged to adhere to the Litter, Environmental and Safety Decrees that are now in place. To enforce this FPCL carries out regular audits to ensure that all tenants are compliant with regulations. The Property department also assists the Finance Division in the collection of any overdue rent, however, this is generally an unusual situation as due diligence is carried out on any prospective tenant before the signing of a lease agreement.
The Property department is also responsible for monitoring the cleaning the Company’s head of- fice at Muaiwalu House, and overseeing cleaning operations are properly carried out at the Suva, Lautoka and Levuka Wharfs as well as at Muaiwalu I and Mualwalu II Wharfs in Suva. It is also the Property department’s responsibility to ensure registration and regular maintenance is undertaken for the Company’s fleet of vehicles.
The department is also tasked with the planning and implementation of business and property strat- egies and the sourcing new property tenancies with the view to generating trade and or services through Fiji’s ports that generate new income streams for the Company.
Revenue from Property Assets 2015
The overall number of FPCL-owned and managed properties has grown significantly over time with increases in revenue being registered annually. This year’s income from assets over the three main Ports of Suva, Lautoka and Levuka totalled $1,999,704 from 121 properties. (This figure excludes rent from FPCL’s associated company FPTL). The number of tenants is down from 126 in 2014, how- ever, income for the year in review was up compared to 2014, by $17,144.
The negative figure of $717 for Lautoka Port was due to the cancellation of one of the long-term land leases in September. This property carried a monthly rental rate of $4,908, and cancellation occurred because of a breach of the terms and conditions by the lessee. The matter is currently before the court.
No. of Rental Income Rental IncomePort Tenancies Annual 2015 Budget 2015 Variance VacancySuva 71 $1,095,491 $1,042,369 $53,122.00 0%Lautoka 44 $873,457 $874,174 $(717.00) 5%Levuka 6 $30,756 $30,606 $150 0%Total $1,999,704 $1,947,149 $52,555
Income from FPCL Property Tenancies 2015
Suva Lautoka Levuka Totalnew Tenancies 3 7 - 10renewals 16 6 1 23relinquish 3 8 - 11Terminated - 1 - 1
Breakdown of FPCL Property Tenancies 2015

30 Fiji Ports CorPoration LimitedAnnuAl report 2014
Tenancy Income Breakdown
Tenancy Income Breakdown %
$1,000,000$900,000$800,000$700,000$600,000$500,000$400,000$300,000$200,000$100,000
$-
50.045.040.035.030.025.020.015.010.05.00.0
Kings wharf Muaiwalu 1 & 2 Rokobili Lautoka Port Levuka Port 2013 $353,563 $614,290 $201,148 $848,527 $30,297 2014 $225,932 $636,353 $208,826 $868,772 $30,606 2015 $224,431 $645,705 $225,355 $873,458 $30,756
Kings wharf Muaiwalu 1 & 2 Rokobili Lautoka Port Levuka Port 2013 17.3 30.0 9.8 41.4 1.5 2014 11.5 32.3 10.6 44.1 1.6 2015 11.2 32.3 11.3 43.7 1.5
Perc
enta
ge %
Tenants’ Feedback
FPCL’s Customer Survey provides FPCL’s tenants leasing commercial space from the Company with the opportunity to voice their opinions and concerns regarding issues related to their tenancies. The Customer Survey was initiated as a result of briefings for the Fiji Business Excellence Awards application framework, and will be conducted annually.
This year’s Survey results showed positive outcomes overall. Customers responded well to the opportunity to discuss individual needs and the initiative offered the department staff a broader perspective on how to move closer to meeting Key Performance Indicators (KRIs) based on international standards for best practice. The Survey process has the additional positive outcome of generating enthusiasm amongst the team for enhancing the profile of FPCL amongst its stakeholders as a good corporate entity.
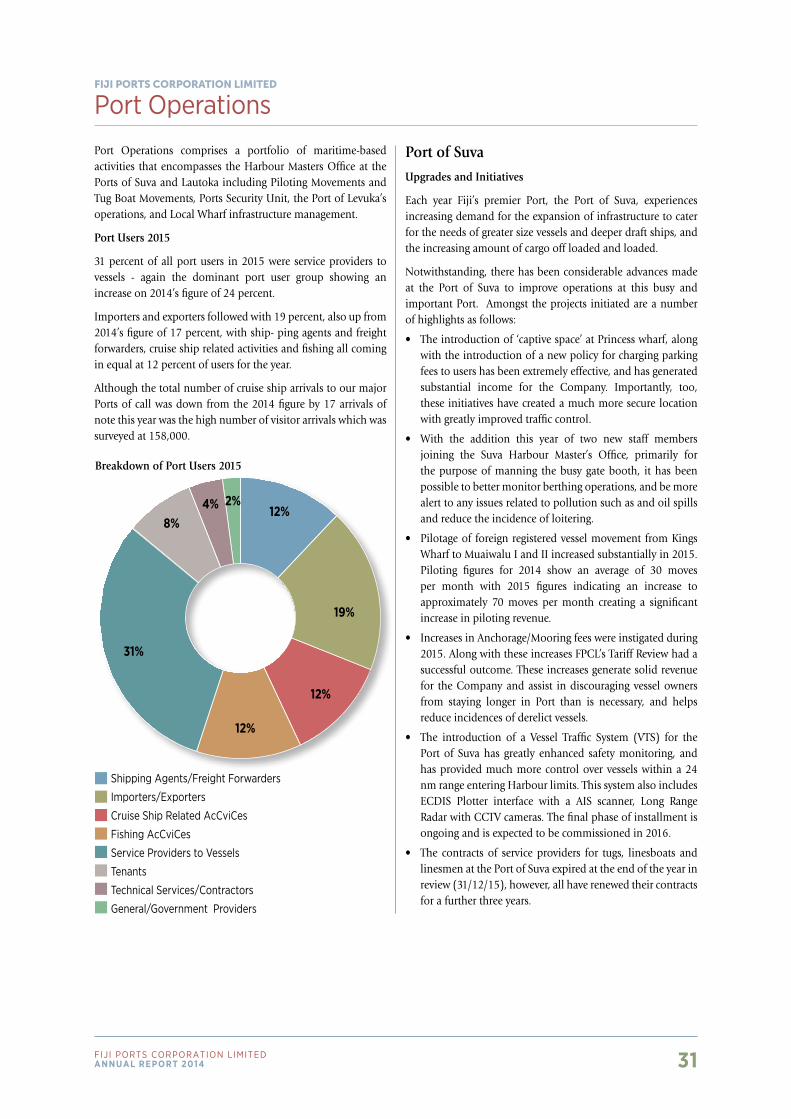
31Fiji Ports CorPoration LimitedAnnuAl report 2014
Breakdown of Port Users 2015
Port operationsFiji PORTS CORPORaTiOn LimiTed
Port Operations comprises a portfolio of maritime-based activities that encompasses the Harbour Masters Office at the Ports of Suva and Lautoka including Piloting Movements and Tug Boat Movements, Ports Security Unit, the Port of Levuka’s operations, and Local Wharf infrastructure management.
Port Users 2015
31 percent of all port users in 2015 were service providers to vessels - again the dominant port user group showing an increase on 2014’s figure of 24 percent.
Importers and exporters followed with 19 percent, also up from 2014’s figure of 17 percent, with ship- ping agents and freight forwarders, cruise ship related activities and fishing all coming in equal at 12 percent of users for the year.
Although the total number of cruise ship arrivals to our major Ports of call was down from the 2014 figure by 17 arrivals of note this year was the high number of visitor arrivals which was surveyed at 158,000.
Port of Suva
Upgrades and Initiatives
Each year Fiji’s premier Port, the Port of Suva, experiences increasing demand for the expansion of infrastructure to cater for the needs of greater size vessels and deeper draft ships, and the increasing amount of cargo off loaded and loaded.
Notwithstanding, there has been considerable advances made at the Port of Suva to improve operations at this busy and important Port. Amongst the projects initiated are a number of highlights as follows:
• Theintroductionof‘captivespace’atPrincesswharf,alongwith the introduction of a new policy for charging parking fees to users has been extremely effective, and has generated substantial income for the Company. Importantly, too, these initiatives have created a much more secure location with greatly improved traffic control.
• With the addition this year of two new staff membersjoining the Suva Harbour Master’s Office, primarily for the purpose of manning the busy gate booth, it has been possible to better monitor berthing operations, and be more alert to any issues related to pollution such as and oil spills and reduce the incidence of loitering.
• Pilotageof foreignregisteredvesselmovement fromKingsWharf to Muaiwalu I and II increased substantially in 2015. Piloting figures for 2014 show an average of 30 moves per month with 2015 figures indicating an increase to approximately 70 moves per month creating a significant increase in piloting revenue.
• IncreasesinAnchorage/Mooringfeeswereinstigatedduring2015. Along with these increases FPCL’s Tariff Review had a successful outcome. These increases generate solid revenue for the Company and assist in discouraging vessel owners from staying longer in Port than is necessary, and helps reduce incidences of derelict vessels.
• The introduction of a Vessel Traffic System (VTS) for thePort of Suva has greatly enhanced safety monitoring, and has provided much more control over vessels within a 24 nm range entering Harbour limits. This system also includes ECDIS Plotter interface with a AIS scanner, Long Range Radar with CCTV cameras. The final phase of installment is ongoing and is expected to be commissioned in 2016.
• The contracts of service providers for tugs, linesboats andlinesmen at the Port of Suva expired at the end of the year in review (31/12/15), however, all have renewed their contracts for a further three years.
2%12%
19%
12%
12%
31%
8%4%
Shipping Agents/Freight Forwarders
Importers/Exporters
Cruise Ship related AcCviCes
Fishing AcCviCes
Service Providers to Vessels
Tenants
Technical Services/Contractors
general/government Providers
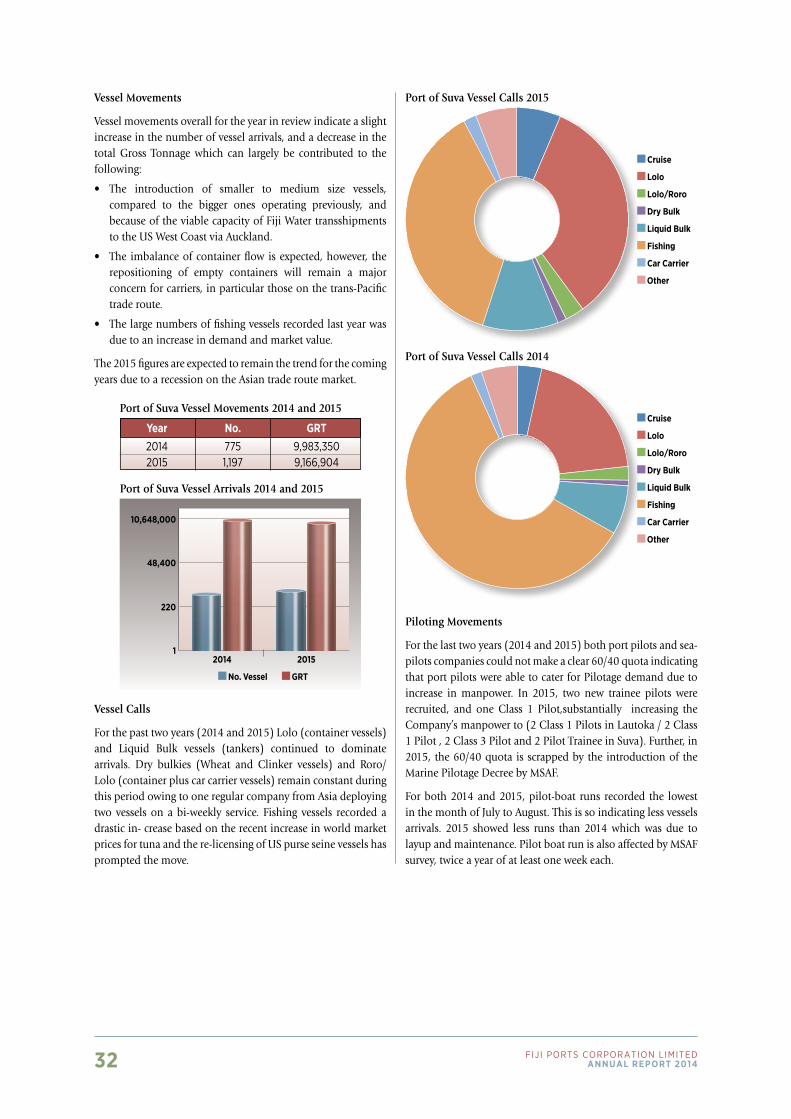
32 Fiji Ports CorPoration LimitedAnnuAl report 2014
Vessel Movements
Vessel movements overall for the year in review indicate a slight increase in the number of vessel arrivals, and a decrease in the total Gross Tonnage which can largely be contributed to the following:
• The introduction of smaller to medium size vessels,compared to the bigger ones operating previously, and because of the viable capacity of Fiji Water transshipments to the US West Coast via Auckland.
• The imbalanceofcontainerflowisexpected,however, therepositioning of empty containers will remain a major concern for carriers, in particular those on the trans-Pacific trade route.
• Thelargenumbersoffishingvesselsrecordedlastyearwasdue to an increase in demand and market value.
The 2015 figures are expected to remain the trend for the coming years due to a recession on the Asian trade route market.
Port of Suva Vessel Arrivals 2014 and 2015
Port of Suva Vessel Calls 2015
Port of Suva Vessel Calls 2014
Port of Suva Vessel Movements 2014 and 2015
Year No. GRT 2014 775 9,983,350 2015 1,197 9,166,904
1
220
No. Vessel
Cruise
Lolo
Lolo/Roro
Dry Bulk
Liquid Bulk
Fishing
Car Carrier
Other
Cruise
Lolo
Lolo/Roro
Dry Bulk
Liquid Bulk
Fishing
Car Carrier
Other
GRT
48,400
10,648,000
2014 2015
Vessel Calls
For the past two years (2014 and 2015) Lolo (container vessels) and Liquid Bulk vessels (tankers) continued to dominate arrivals. Dry bulkies (Wheat and Clinker vessels) and Roro/Lolo (container plus car carrier vessels) remain constant during this period owing to one regular company from Asia deploying two vessels on a bi-weekly service. Fishing vessels recorded a drastic in- crease based on the recent increase in world market prices for tuna and the re-licensing of US purse seine vessels has prompted the move.
Piloting Movements
For the last two years (2014 and 2015) both port pilots and sea-pilots companies could not make a clear 60/40 quota indicating that port pilots were able to cater for Pilotage demand due to increase in manpower. In 2015, two new trainee pilots were recruited, and one Class 1 Pilot,substantially increasing the Company’s manpower to (2 Class 1 Pilots in Lautoka / 2 Class 1 Pilot , 2 Class 3 Pilot and 2 Pilot Trainee in Suva). Further, in 2015, the 60/40 quota is scrapped by the introduction of the Marine Pilotage Decree by MSAF.
For both 2014 and 2015, pilot-boat runs recorded the lowest in the month of July to August. This is so indicating less vessels arrivals. 2015 showed less runs than 2014 which was due to layup and maintenance. Pilot boat run is also affected by MSAF survey, twice a year of at least one week each.
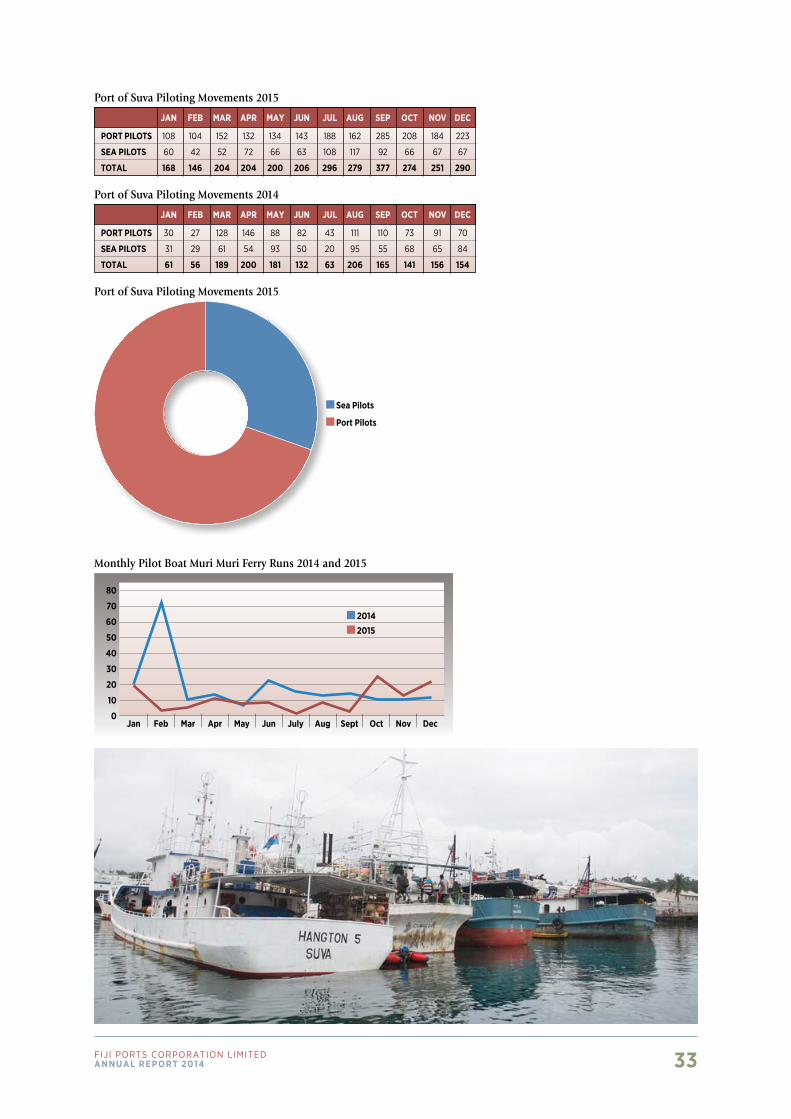
33Fiji Ports CorPoration LimitedAnnuAl report 2014
Port of Suva Piloting Movements 2015
Sea Pilots
Port Pilots
Port of Suva Piloting Movements 2015
JAN FEB MAR APR MAY JuN JuL AuG SEP OCT NOV DEC
PORT PILOTS 108 104 152 132 134 143 188 162 285 208 184 223
SEA PILOTS 60 42 52 72 66 63 108 117 92 66 67 67
TOTAL 168 146 204 204 200 206 296 279 377 274 251 290
Port of Suva Piloting Movements 2014
JAN FEB MAR APR MAY JuN JuL AuG SEP OCT NOV DEC
PORT PILOTS 30 27 128 146 88 82 43 111 110 73 91 70
SEA PILOTS 31 29 61 54 93 50 20 95 55 68 65 84
TOTAL 61 56 189 200 181 132 63 206 165 141 156 154
Monthly Pilot Boat Muri Muri Ferry Runs 2014 and 2015
80
70
60
50
40
30
20
10
0Jan May SeptMar July NovFeb Jun OctApr Aug Dec
2014 2015
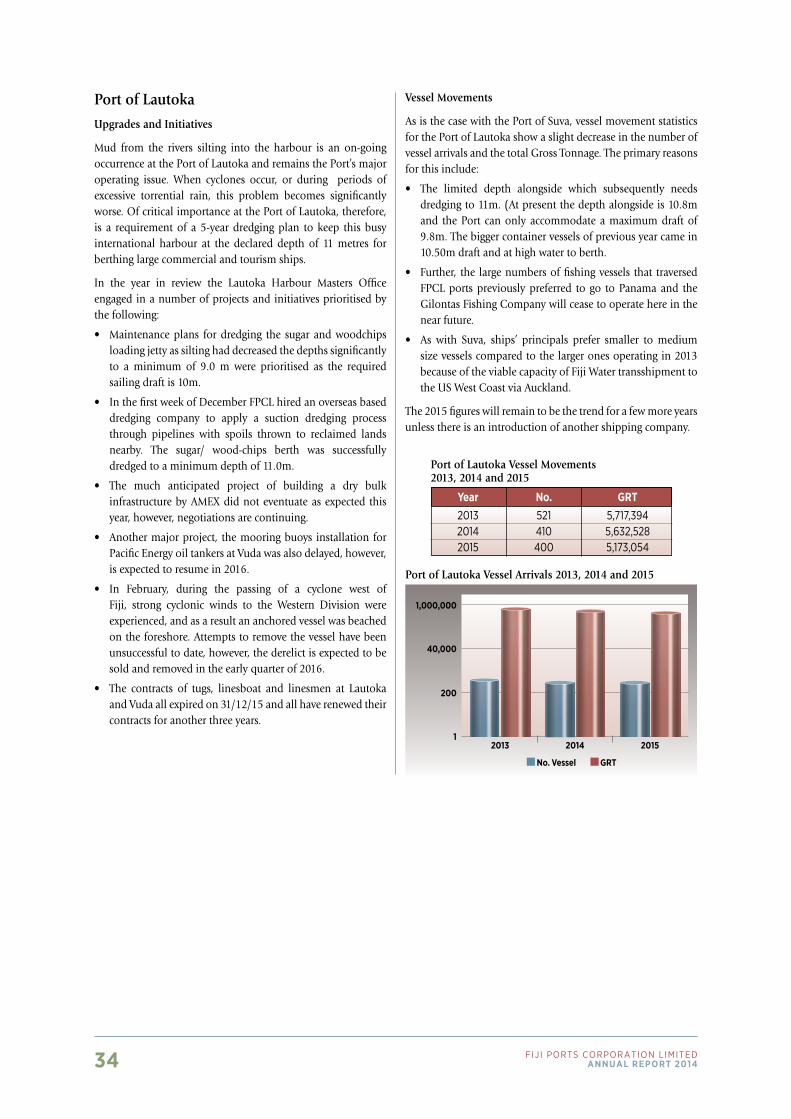
34 Fiji Ports CorPoration LimitedAnnuAl report 2014
Port of Lautoka
Upgrades and Initiatives
Mud from the rivers silting into the harbour is an on-going occurrence at the Port of Lautoka and remains the Port’s major operating issue. When cyclones occur, or during periods of excessive torrential rain, this problem becomes significantly worse. Of critical importance at the Port of Lautoka, therefore, is a requirement of a 5-year dredging plan to keep this busy international harbour at the declared depth of 11 metres for berthing large commercial and tourism ships.
In the year in review the Lautoka Harbour Masters Office engaged in a number of projects and initiatives prioritised by the following:
• Maintenance plans for dredging the sugar and woodchipsloading jetty as silting had decreased the depths significantly to a minimum of 9.0 m were prioritised as the required sailing draft is 10m.
• InthefirstweekofDecemberFPCLhiredanoverseasbaseddredging company to apply a suction dredging process through pipelines with spoils thrown to reclaimed lands nearby. The sugar/ wood-chips berth was successfully dredged to a minimum depth of 11.0m.
• The much anticipated project of building a dry bulkinfrastructure by AMEX did not eventuate as expected this year, however, negotiations are continuing.
• Anothermajorproject, themooringbuoys installationforPacific Energy oil tankers at Vuda was also delayed, however, is expected to resume in 2016.
• In February, during the passing of a cyclone west ofFiji, strong cyclonic winds to the Western Division were experienced, and as a result an anchored vessel was beached on the foreshore. Attempts to remove the vessel have been unsuccessful to date, however, the derelict is expected to be sold and removed in the early quarter of 2016.
• The contracts of tugs, linesboat and linesmen at Lautokaand Vuda all expired on 31/12/15 and all have renewed their contracts for another three years.
Vessel Movements
As is the case with the Port of Suva, vessel movement statistics for the Port of Lautoka show a slight decrease in the number of vessel arrivals and the total Gross Tonnage. The primary reasons for this include:
• The limited depth alongside which subsequently needsdredging to 11m. (At present the depth alongside is 10.8m and the Port can only accommodate a maximum draft of 9.8m. The bigger container vessels of previous year came in 10.50m draft and at high water to berth.
• Further, the largenumbersoffishingvessels that traversedFPCL ports previously preferred to go to Panama and the Gilontas Fishing Company will cease to operate here in the near future.
• As with Suva, ships’ principals prefer smaller to mediumsize vessels compared to the larger ones operating in 2013 because of the viable capacity of Fiji Water transshipment to the US West Coast via Auckland.
The 2015 figures will remain to be the trend for a few more years unless there is an introduction of another shipping company.
Port of Lautoka Vessel Movements2013, 2014 and 2015
Year No. GRT 2013 521 5,717,394 2014 410 5,632,528 2015 400 5,173,054
Port of Lautoka Vessel Arrivals 2013, 2014 and 2015
1
200
No. Vessel GRT
40,000
1,000,000
2013 2014 2015
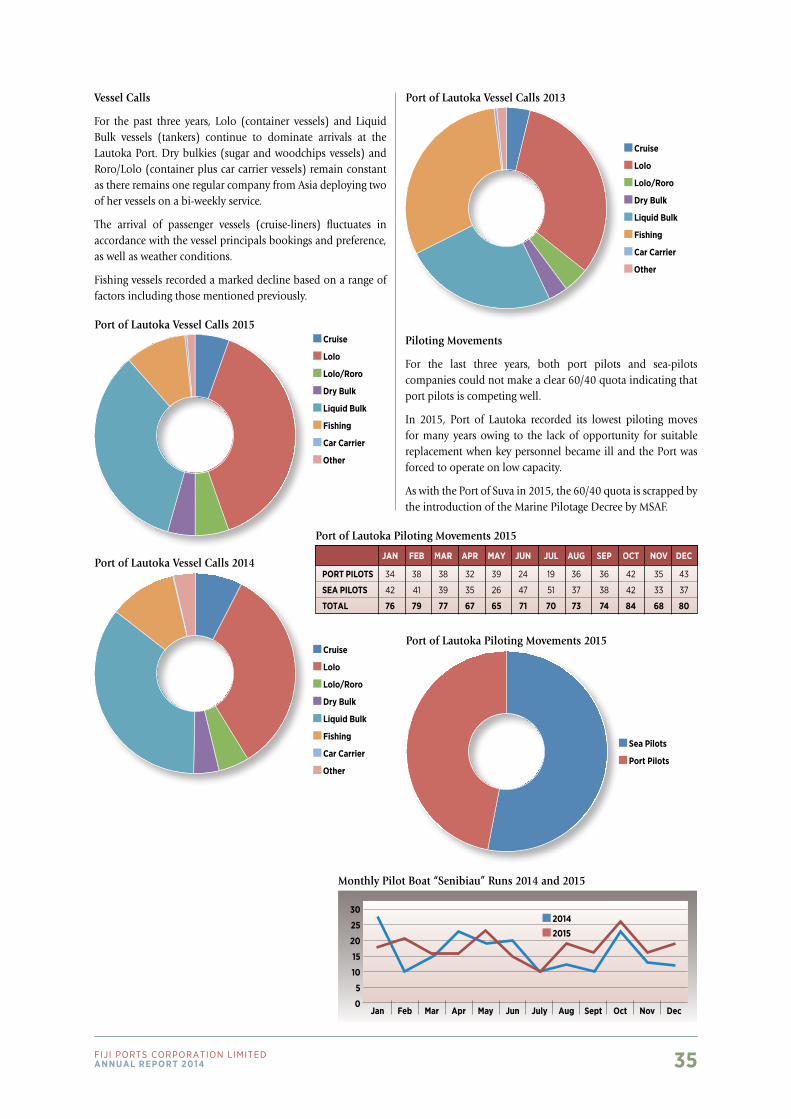
35Fiji Ports CorPoration LimitedAnnuAl report 2014
Vessel Calls
For the past three years, Lolo (container vessels) and Liquid Bulk vessels (tankers) continue to dominate arrivals at the Lautoka Port. Dry bulkies (sugar and woodchips vessels) and Roro/Lolo (container plus car carrier vessels) remain constant as there remains one regular company from Asia deploying two of her vessels on a bi-weekly service.
The arrival of passenger vessels (cruise-liners) fluctuates in accordance with the vessel principals bookings and preference, as well as weather conditions.
Fishing vessels recorded a marked decline based on a range of factors including those mentioned previously.
Cruise
Lolo
Lolo/Roro
Dry Bulk
Liquid Bulk
Fishing
Car Carrier
Other
Cruise
Lolo
Lolo/Roro
Dry Bulk
Liquid Bulk
Fishing
Car Carrier
Other
Cruise
Lolo
Lolo/Roro
Dry Bulk
Liquid Bulk
Fishing
Car Carrier
Other
Port of Lautoka Vessel Calls 2015
Port of Lautoka Vessel Calls 2014
Port of Lautoka Vessel Calls 2013
Piloting Movements
For the last three years, both port pilots and sea-pilots companies could not make a clear 60/40 quota indicating that port pilots is competing well.
In 2015, Port of Lautoka recorded its lowest piloting moves for many years owing to the lack of opportunity for suitable replacement when key personnel became ill and the Port was forced to operate on low capacity.
As with the Port of Suva in 2015, the 60/40 quota is scrapped by the introduction of the Marine Pilotage Decree by MSAF.
Port of Lautoka Piloting Movements 2015
JAN FEB MAR APR MAY JuN JuL AuG SEP OCT NOV DEC
PORT PILOTS 34 38 38 32 39 24 19 36 36 42 35 43
SEA PILOTS 42 41 39 35 26 47 51 37 38 42 33 37
TOTAL 76 79 77 67 65 71 70 73 74 84 68 80
Sea Pilots
Port Pilots
Port of Lautoka Piloting Movements 2015
Monthly Pilot Boat “Senibiau” Runs 2014 and 2015
30
25
20
15
10
5
0Jan May SeptMar July NovFeb Jun OctApr Aug Dec
2014 2015
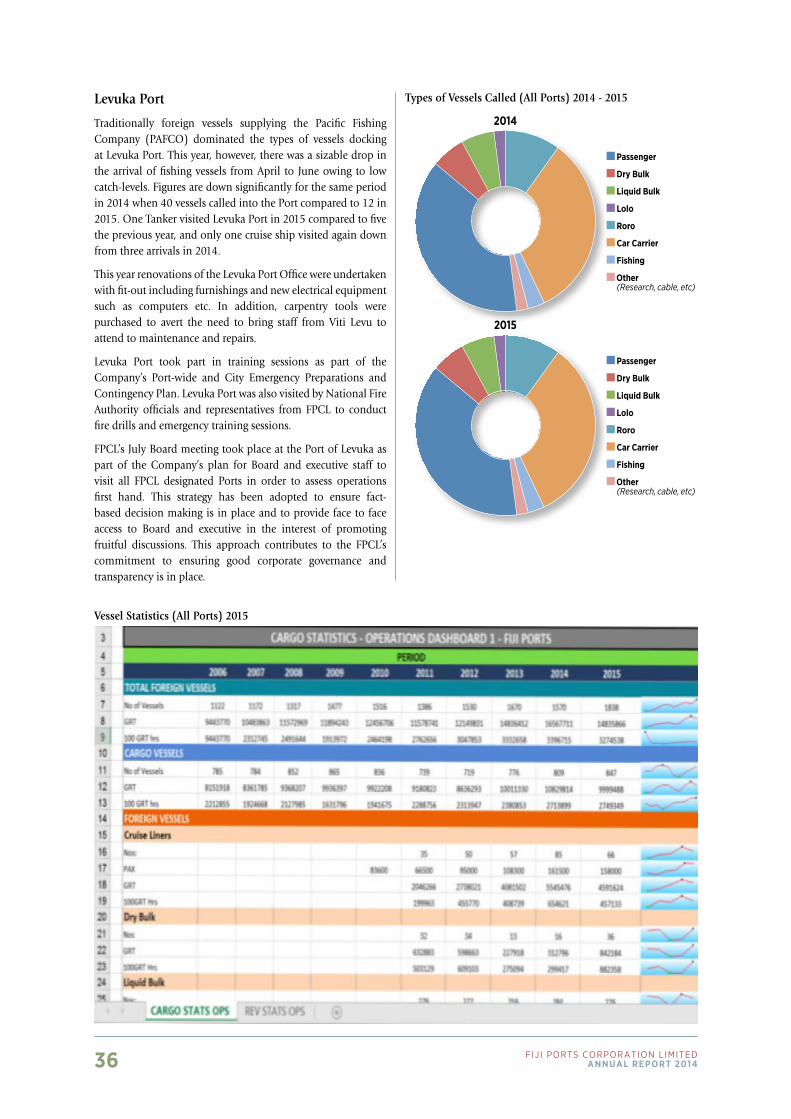
36 Fiji Ports CorPoration LimitedAnnuAl report 2014
Levuka Port
Traditionally foreign vessels supplying the Pacific Fishing Company (PAFCO) dominated the types of vessels docking at Levuka Port. This year, however, there was a sizable drop in the arrival of fishing vessels from April to June owing to low catch-levels. Figures are down significantly for the same period in 2014 when 40 vessels called into the Port compared to 12 in 2015. One Tanker visited Levuka Port in 2015 compared to five the previous year, and only one cruise ship visited again down from three arrivals in 2014.
This year renovations of the Levuka Port Office were undertaken with fit-out including furnishings and new electrical equipment such as computers etc. In addition, carpentry tools were purchased to avert the need to bring staff from Viti Levu to attend to maintenance and repairs.
Levuka Port took part in training sessions as part of the Company’s Port-wide and City Emergency Preparations and Contingency Plan. Levuka Port was also visited by National Fire Authority officials and representatives from FPCL to conduct fire drills and emergency training sessions.
FPCL’s July Board meeting took place at the Port of Levuka as part of the Company’s plan for Board and executive staff to visit all FPCL designated Ports in order to assess operations first hand. This strategy has been adopted to ensure fact-based decision making is in place and to provide face to face access to Board and executive in the interest of promoting fruitful discussions. This approach contributes to the FPCL’s commitment to ensuring good corporate governance and transparency is in place.
Passenger
Dry Bulk
Liquid Bulk
Lolo
Roro
Car Carrier
Fishing
Other (Research, cable, etc)
Passenger
Dry Bulk
Liquid Bulk
Lolo
Roro
Car Carrier
Fishing
Other (Research, cable, etc)
Types of Vessels Called (All Ports) 2014 - 2015
Vessel Statistics (All Ports) 2015
2014
2015
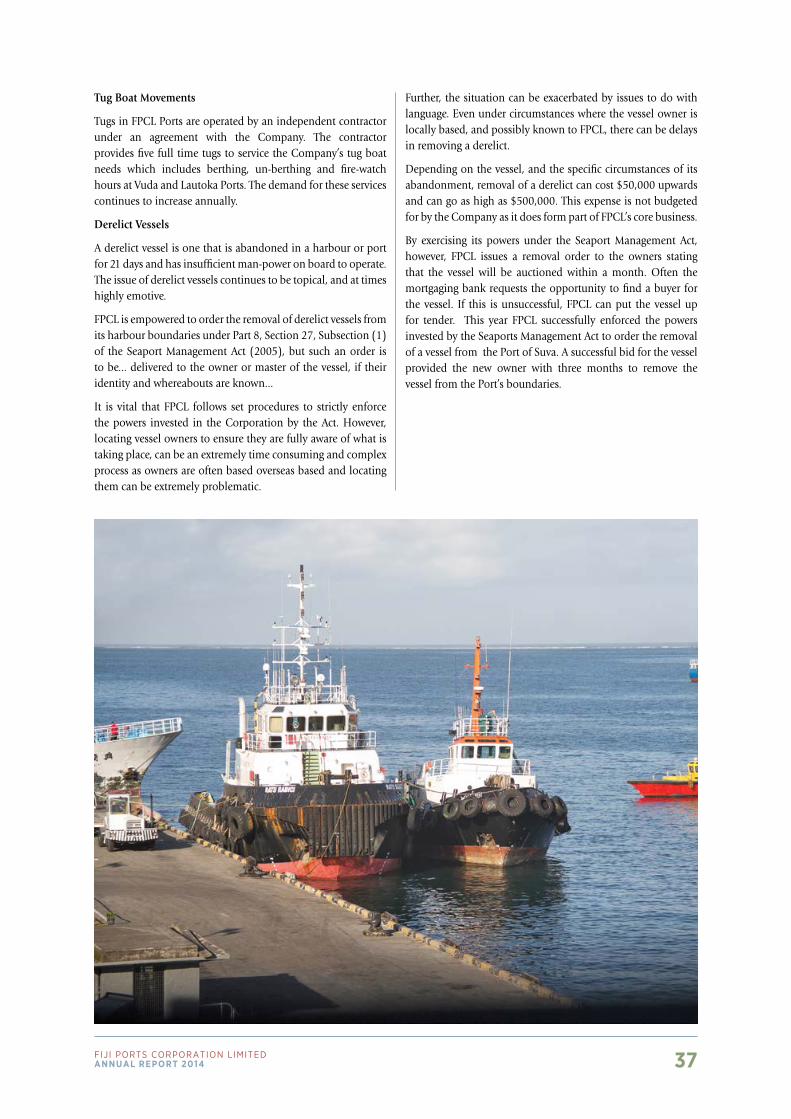
37Fiji Ports CorPoration LimitedAnnuAl report 2014
Tug Boat Movements
Tugs in FPCL Ports are operated by an independent contractor under an agreement with the Company. The contractor provides five full time tugs to service the Company’s tug boat needs which includes berthing, un-berthing and fire-watch hours at Vuda and Lautoka Ports. The demand for these services continues to increase annually.
Derelict Vessels
A derelict vessel is one that is abandoned in a harbour or port for 21 days and has insufficient man-power on board to operate. The issue of derelict vessels continues to be topical, and at times highly emotive.
FPCL is empowered to order the removal of derelict vessels from its harbour boundaries under Part 8, Section 27, Subsection (1) of the Seaport Management Act (2005), but such an order is to be... delivered to the owner or master of the vessel, if their identity and whereabouts are known...
It is vital that FPCL follows set procedures to strictly enforce the powers invested in the Corporation by the Act. However, locating vessel owners to ensure they are fully aware of what is taking place, can be an extremely time consuming and complex process as owners are often based overseas based and locating them can be extremely problematic.
Further, the situation can be exacerbated by issues to do with language. Even under circumstances where the vessel owner is locally based, and possibly known to FPCL, there can be delays in removing a derelict.
Depending on the vessel, and the specific circumstances of its abandonment, removal of a derelict can cost $50,000 upwards and can go as high as $500,000. This expense is not budgeted for by the Company as it does form part of FPCL’s core business.
By exercising its powers under the Seaport Management Act, however, FPCL issues a removal order to the owners stating that the vessel will be auctioned within a month. Often the mortgaging bank requests the opportunity to find a buyer for the vessel. If this is unsuccessful, FPCL can put the vessel up for tender. This year FPCL successfully enforced the powers invested by the Seaports Management Act to order the removal of a vessel from the Port of Suva. A successful bid for the vessel provided the new owner with three months to remove the vessel from the Port’s boundaries.
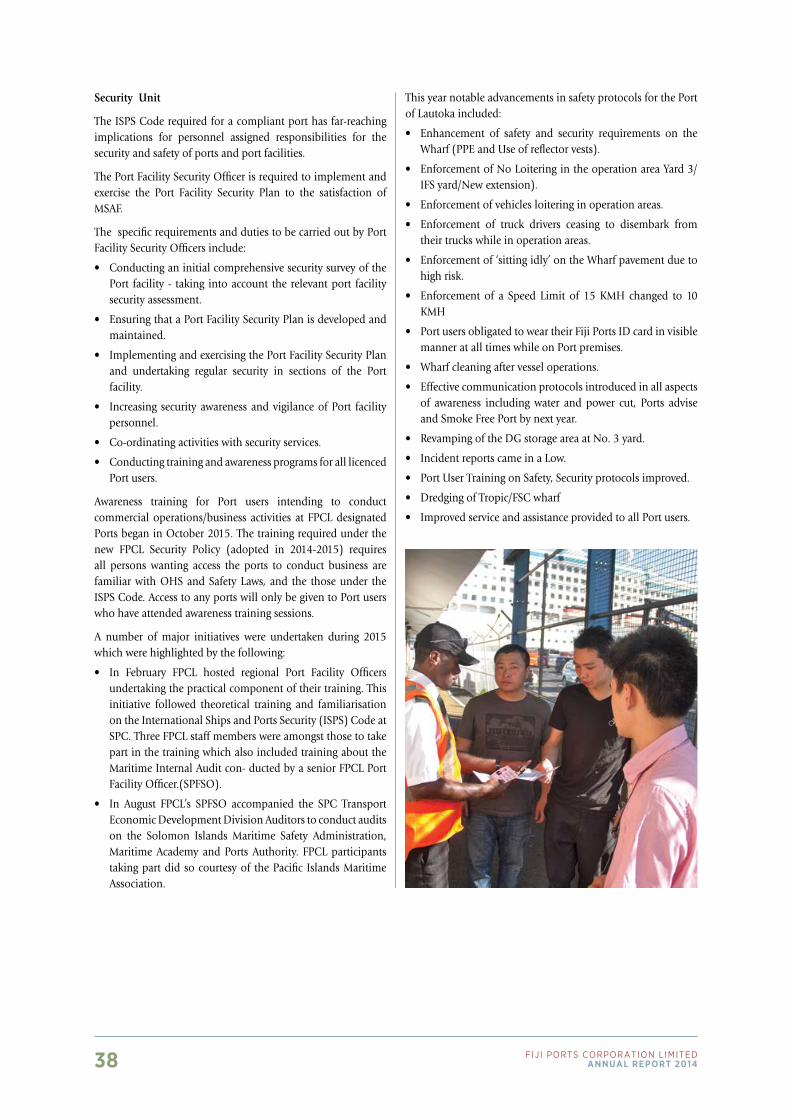
38 Fiji Ports CorPoration LimitedAnnuAl report 2014
Security Unit
The ISPS Code required for a compliant port has far-reaching implications for personnel assigned responsibilities for the security and safety of ports and port facilities.
The Port Facility Security Officer is required to implement and exercise the Port Facility Security Plan to the satisfaction of MSAF.
The specific requirements and duties to be carried out by Port Facility Security Officers include:
• ConductinganinitialcomprehensivesecuritysurveyofthePort facility - taking into account the relevant port facility security assessment.
• EnsuringthataPortFacilitySecurityPlanisdevelopedandmaintained.
• ImplementingandexercisingthePortFacilitySecurityPlanand undertaking regular security in sections of the Port facility.
• Increasing securityawarenessandvigilanceofPort facilitypersonnel.
• Co-ordinatingactivitieswithsecurityservices.
• ConductingtrainingandawarenessprogramsforalllicencedPort users.
Awareness training for Port users intending to conduct commercial operations/business activities at FPCL designated Ports began in October 2015. The training required under the new FPCL Security Policy (adopted in 2014-2015) requires all persons wanting access the ports to conduct business are familiar with OHS and Safety Laws, and the those under the ISPS Code. Access to any ports will only be given to Port users who have attended awareness training sessions.
A number of major initiatives were undertaken during 2015 which were highlighted by the following:
• In February FPCL hosted regional Port Facility Officersundertaking the practical component of their training. This initiative followed theoretical training and familiarisation on the International Ships and Ports Security (ISPS) Code at SPC. Three FPCL staff members were amongst those to take part in the training which also included training about the Maritime Internal Audit con- ducted by a senior FPCL Port Facility Officer.(SPFSO).
• In August FPCL’s SPFSO accompanied the SPC TransportEconomic Development Division Auditors to conduct audits on the Solomon Islands Maritime Safety Administration, Maritime Academy and Ports Authority. FPCL participants taking part did so courtesy of the Pacific Islands Maritime Association.
This year notable advancements in safety protocols for the Port of Lautoka included:
• Enhancement of safety and security requirements on theWharf (PPE and Use of reflector vests).
• EnforcementofNoLoiteringintheoperationareaYard3/IFS yard/New extension).
• Enforcementofvehiclesloiteringinoperationareas.
• Enforcement of truck drivers ceasing to disembark fromtheir trucks while in operation areas.
• Enforcementof‘sittingidly’ontheWharfpavementduetohigh risk.
• Enforcement of a Speed Limit of 15 KMH changed to 10KMH
• PortusersobligatedtoweartheirFijiPortsIDcardinvisiblemanner at all times while on Port premises.
• Wharfcleaningaftervesseloperations.
• Effectivecommunicationprotocolsintroducedinallaspectsof awareness including water and power cut, Ports advise and Smoke Free Port by next year.
• RevampingoftheDGstorageareaatNo.3yard.
• IncidentreportscameinaLow.
• PortUserTrainingonSafety,Securityprotocolsimproved.
• DredgingofTropic/FSCwharf
• ImprovedserviceandassistanceprovidedtoallPortusers.
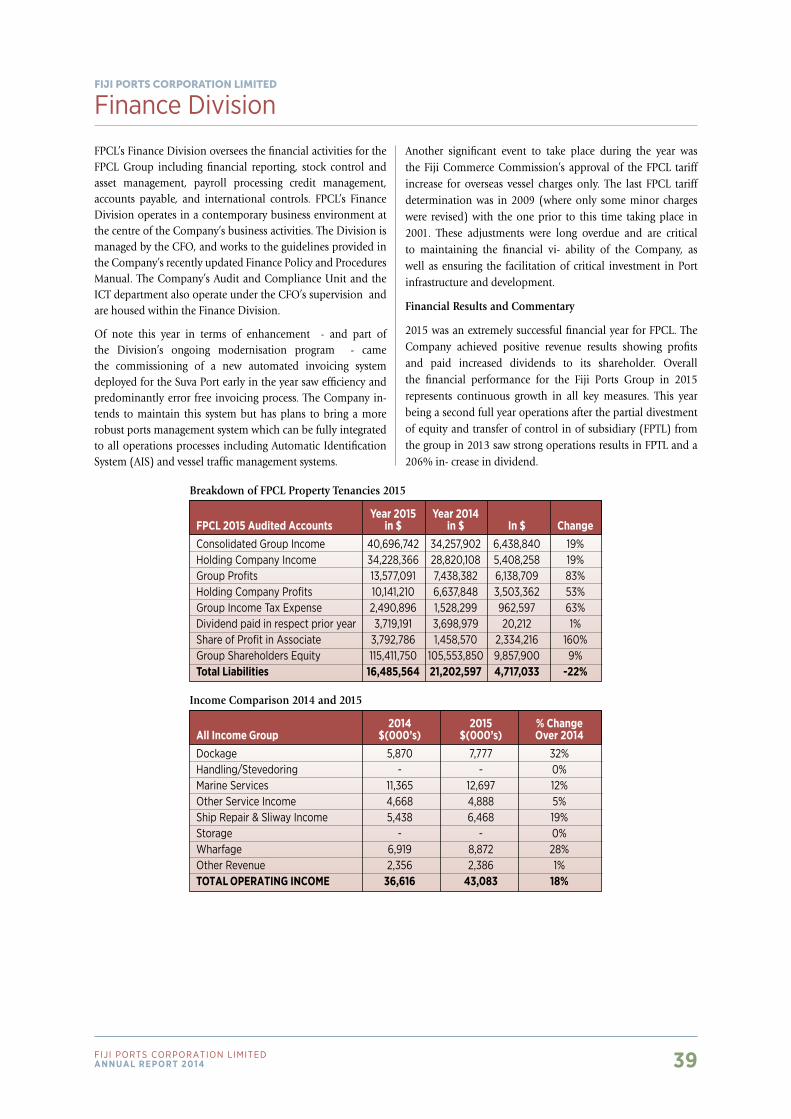
39Fiji Ports CorPoration LimitedAnnuAl report 2014
Finance DivisionFiji PORTS CORPORaTiOn LimiTed
FPCL’s Finance Division oversees the financial activities for the FPCL Group including financial reporting, stock control and asset management, payroll processing credit management, accounts payable, and international controls. FPCL’s Finance Division operates in a contemporary business environment at the centre of the Company’s business activities. The Division is managed by the CFO, and works to the guidelines provided in the Company’s recently updated Finance Policy and Procedures Manual. The Company’s Audit and Compliance Unit and the ICT department also operate under the CFO’s supervision and are housed within the Finance Division.
Of note this year in terms of enhancement - and part of the Division’s ongoing modernisation program - came the commissioning of a new automated invoicing system deployed for the Suva Port early in the year saw efficiency and predominantly error free invoicing process. The Company in- tends to maintain this system but has plans to bring a more robust ports management system which can be fully integrated to all operations processes including Automatic Identification System (AIS) and vessel traffic management systems.
Year 2015 Year 2014 FPCL 2015 Audited Accounts in $ in $ In $ ChangeConsolidated group Income 40,696,742 34,257,902 6,438,840 19%Holding Company Income 34,228,366 28,820,108 5,408,258 19%group Profits 13,577,091 7,438,382 6,138,709 83%Holding Company Profits 10,141,210 6,637,848 3,503,362 53%group Income Tax Expense 2,490,896 1,528,299 962,597 63%Dividend paid in respect prior year 3,719,191 3,698,979 20,212 1%Share of Profit in Associate 3,792,786 1,458,570 2,334,216 160%group Shareholders Equity 115,411,750 105,553,850 9,857,900 9%Total Liabilities 16,485,564 21,202,597 4,717,033 -22%
2014 2015 % ChangeAll Income Group $(000’s) $(000’s) Over 2014Dockage 5,870 7,777 32%Handling/Stevedoring - - 0%Marine Services 11,365 12,697 12%other Service Income 4,668 4,888 5%Ship repair & Sliway Income 5,438 6,468 19%Storage - - 0%Wharfage 6,919 8,872 28%other revenue 2,356 2,386 1%TOTAL OPERATING INCOME 36,616 43,083 18%
Breakdown of FPCL Property Tenancies 2015
Income Comparison 2014 and 2015
Another significant event to take place during the year was the Fiji Commerce Commission’s approval of the FPCL tariff increase for overseas vessel charges only. The last FPCL tariff determination was in 2009 (where only some minor charges were revised) with the one prior to this time taking place in 2001. These adjustments were long overdue and are critical to maintaining the financial vi- ability of the Company, as well as ensuring the facilitation of critical investment in Port infrastructure and development.
Financial Results and Commentary
2015 was an extremely successful financial year for FPCL. The Company achieved positive revenue results showing profits and paid increased dividends to its shareholder. Overall the financial performance for the Fiji Ports Group in 2015 represents continuous growth in all key measures. This year being a second full year operations after the partial divestment of equity and transfer of control in of subsidiary (FPTL) from the group in 2013 saw strong operations results in FPTL and a 206% in- crease in dividend.
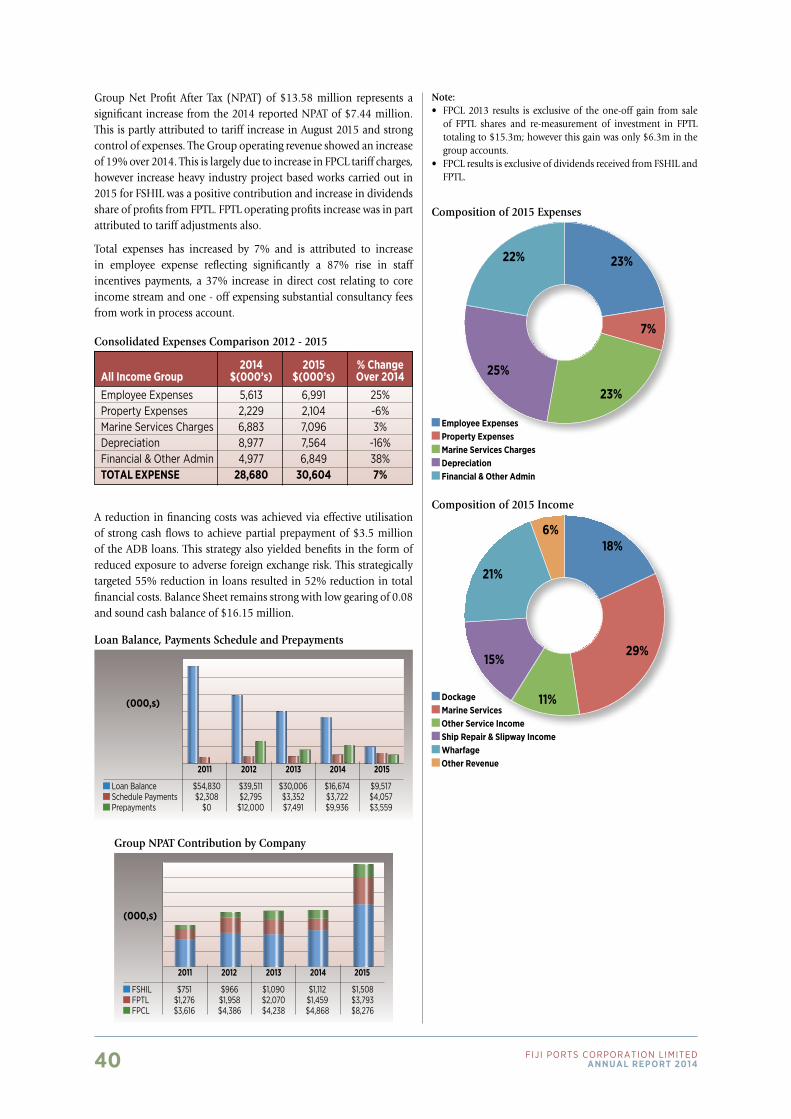
40 Fiji Ports CorPoration LimitedAnnuAl report 2014
Group Net Profit After Tax (NPAT) of $13.58 million represents a significant increase from the 2014 reported NPAT of $7.44 million. This is partly attributed to tariff increase in August 2015 and strong control of expenses. The Group operating revenue showed an increase of 19% over 2014. This is largely due to increase in FPCL tariff charges, however increase heavy industry project based works carried out in 2015 for FSHIL was a positive contribution and increase in dividends share of profits from FPTL. FPTL operating profits increase was in part attributed to tariff adjustments also.
Total expenses has increased by 7% and is attributed to increase in employee expense reflecting significantly a 87% rise in staff incentives payments, a 37% increase in direct cost relating to core income stream and one - off expensing substantial consultancy fees from work in process account.
2014 2015 % ChangeAll Income Group $(000’s) $(000’s) Over 2014Employee Expenses 5,613 6,991 25%Property Expenses 2,229 2,104 -6%Marine Services Charges 6,883 7,096 3%Depreciation 8,977 7,564 -16%Financial & other Admin 4,977 6,849 38%TOTAL ExPENSE 28,680 30,604 7%
Consolidated Expenses Comparison 2012 - 2015
A reduction in financing costs was achieved via effective utilisation of strong cash flows to achieve partial prepayment of $3.5 million of the ADB loans. This strategy also yielded benefits in the form of reduced exposure to adverse foreign exchange risk. This strategically targeted 55% reduction in loans resulted in 52% reduction in total financial costs. Balance Sheet remains strong with low gearing of 0.08 and sound cash balance of $16.15 million.
Loan Balance, Payments Schedule and Prepayments
(000,s)
Loan Balance $54,830 $39,511 $30,006 $16,674 $9,517 Schedule Payments $2,308 $2,795 $3,352 $3,722 $4,057 Prepayments $0 $12,000 $7,491 $9,936 $3,559
2011 2013 20152012 2014
Group NPAT Contribution by Company
(000,s)
FSHIL $751 $966 $1,090 $1,112 $1,508 FPTL $1,276 $1,958 $2,070 $1,459 $3,793 FPCL $3,616 $4,386 $4,238 $4,868 $8,276
2011 2013 20152012 2014
Note:• FPCL2013 results is exclusiveof theone-off gain fromsale
of FPTL shares and re-measurement of investment in FPTL totaling to $15.3m; however this gain was only $6.3m in the group accounts.
• FPCLresultsisexclusiveofdividendsreceivedfromFSHILandFPTL.
23%
7%
23%
25%
22%
Employee Expenses Property Expenses Marine Services Charges Depreciation Financial & Other Admin
Dockage Marine Services Other Service Income Ship Repair & Slipway Income wharfage Other Revenue
Composition of 2015 Expenses
Composition of 2015 Income
18%
29%
11%
15%
21%
6%
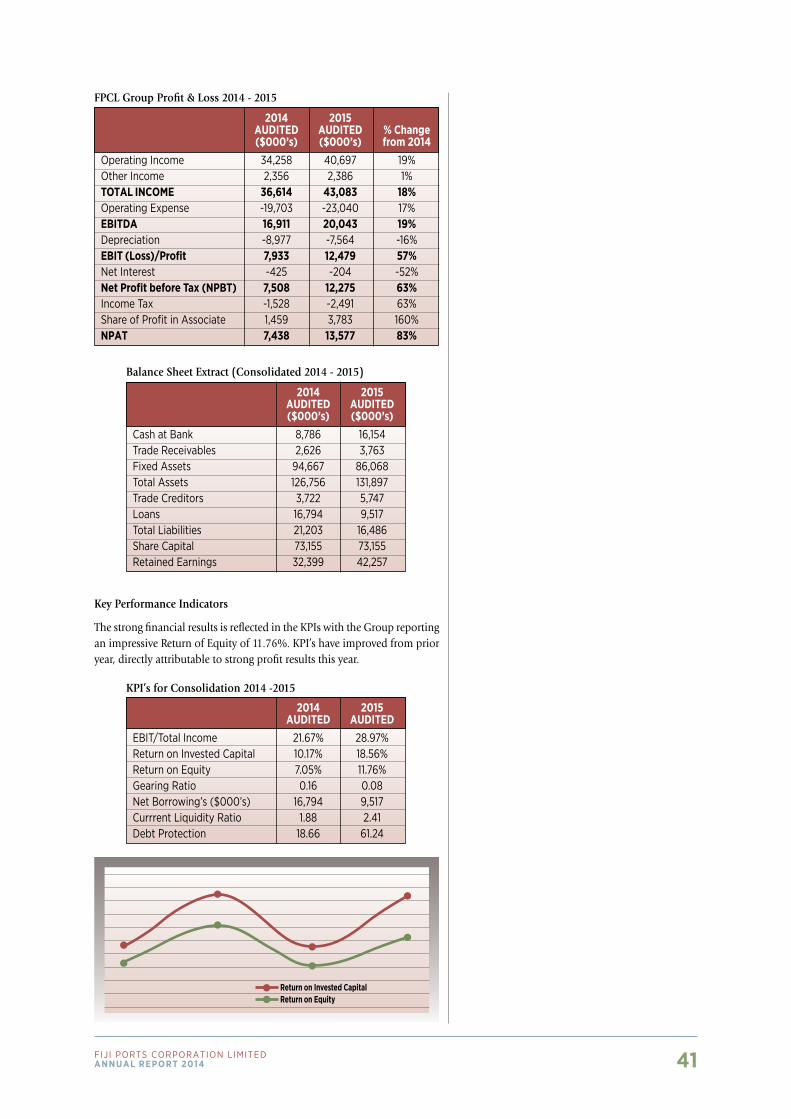
41Fiji Ports CorPoration LimitedAnnuAl report 2014
2014 2015 AuDITED AuDITED ($000’s) ($000’s)Cash at Bank 8,786 16,154Trade receivables 2,626 3,763Fixed Assets 94,667 86,068Total Assets 126,756 131,897Trade Creditors 3,722 5,747Loans 16,794 9,517Total Liabilities 21,203 16,486Share Capital 73,155 73,155retained Earnings 32,399 42,257
Balance Sheet Extract (Consolidated 2014 - 2015)
2014 2015 AuDITED AuDITEDEBIT/Total Income 21.67% 28.97%return on Invested Capital 10.17% 18.56%return on Equity 7.05% 11.76%gearing ratio 0.16 0.08net Borrowing’s ($000’s) 16,794 9,517Currrent Liquidity ratio 1.88 2.41Debt Protection 18.66 61.24
KPI’s for Consolidation 2014 -2015
2014 2015 AuDITED AuDITED % Change ($000’s) ($000’s) from 2014operating Income 34,258 40,697 19%other Income 2,356 2,386 1%TOTAL INCOME 36,614 43,083 18%operating Expense -19,703 -23,040 17%EBITDA 16,911 20,043 19%Depreciation -8,977 -7,564 -16%EBIT (Loss)/Profit 7,933 12,479 57%net Interest -425 -204 -52%Net Profit before Tax (NPBT) 7,508 12,275 63%Income Tax -1,528 -2,491 63%Share of Profit in Associate 1,459 3,783 160%NPAT 7,438 13,577 83%
FPCL Group Profit & Loss 2014 - 2015
Return on Invested CapitalReturn on Equity
Key Performance Indicators
The strong financial results is reflected in the KPIs with the Group reporting an impressive Return of Equity of 11.76%. KPI’s have improved from prior year, directly attributable to strong profit results this year.
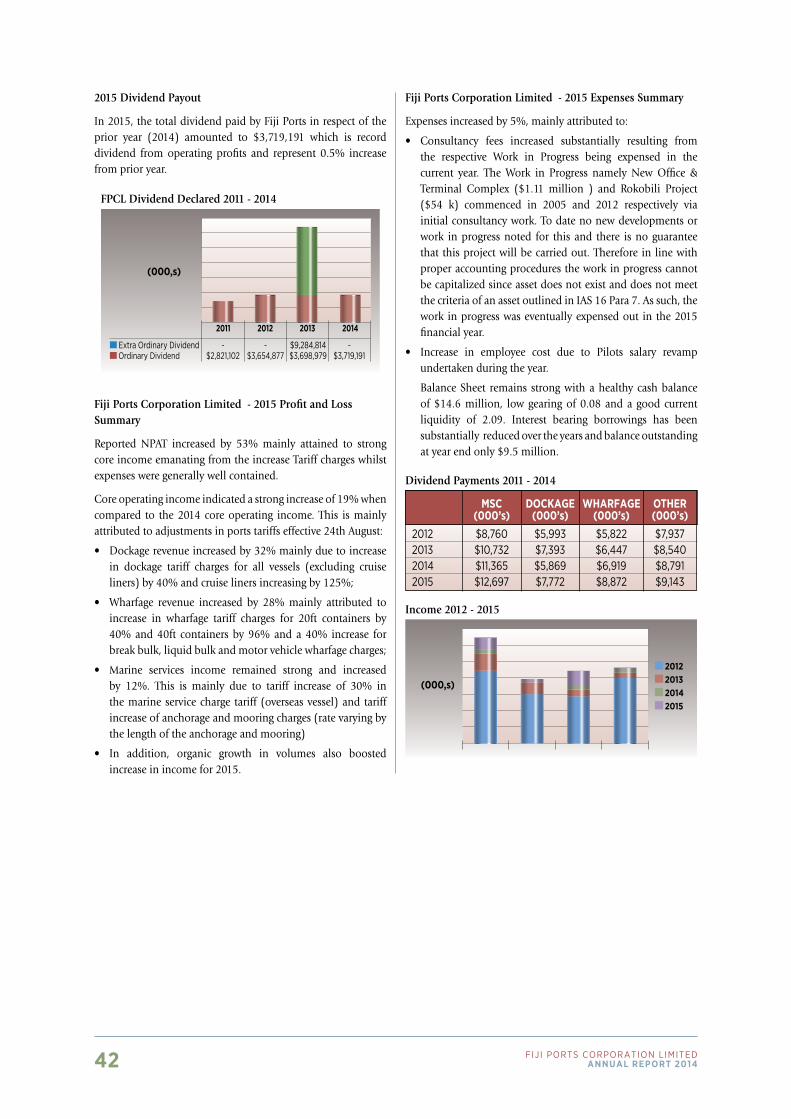
42 Fiji Ports CorPoration LimitedAnnuAl report 2014
2015 Dividend Payout
In 2015, the total dividend paid by Fiji Ports in respect of the prior year (2014) amounted to $3,719,191 which is record dividend from operating profits and represent 0.5% increase from prior year.
Fiji Ports Corporation Limited - 2015 Profit and Loss Summary
Reported NPAT increased by 53% mainly attained to strong core income emanating from the increase Tariff charges whilst expenses were generally well contained.
Core operating income indicated a strong increase of 19% when compared to the 2014 core operating income. This is mainly attributed to adjustments in ports tariffs effective 24th August:
• Dockagerevenueincreasedby32%mainlyduetoincreasein dockage tariff charges for all vessels (excluding cruise liners) by 40% and cruise liners increasing by 125%;
• Wharfage revenue increased by 28% mainly attributed toincrease in wharfage tariff charges for 20ft containers by 40% and 40ft containers by 96% and a 40% increase for break bulk, liquid bulk and motor vehicle wharfage charges;
• Marine services income remained strong and increasedby 12%. This is mainly due to tariff increase of 30% in the marine service charge tariff (overseas vessel) and tariff increase of anchorage and mooring charges (rate varying by the length of the anchorage and mooring)
• In addition, organic growth in volumes also boostedincrease in income for 2015.
Fiji Ports Corporation Limited - 2015 Expenses Summary
Expenses increased by 5%, mainly attributed to:
• Consultancy fees increased substantially resulting fromthe respective Work in Progress being expensed in the current year. The Work in Progress namely New Office & Terminal Complex ($1.11 million ) and Rokobili Project ($54 k) commenced in 2005 and 2012 respectively via initial consultancy work. To date no new developments or work in progress noted for this and there is no guarantee that this project will be carried out. Therefore in line with proper accounting procedures the work in progress cannot be capitalized since asset does not exist and does not meet the criteria of an asset outlined in IAS 16 Para 7. As such, the work in progress was eventually expensed out in the 2015 financial year.
• Increase in employee cost due to Pilots salary revampundertaken during the year.
Balance Sheet remains strong with a healthy cash balance of $14.6 million, low gearing of 0.08 and a good current liquidity of 2.09. Interest bearing borrowings has been substantially reduced over the years and balance outstanding at year end only $9.5 million.
FPCL Dividend Declared 2011 - 2014
(000,s)
Extra ordinary Dividend - - $9,284,814 - ordinary Dividend $2,821,102 $3,654,877 $3,698,979 $3,719,191
2012 20142011 2013
MSC DOCKAGE whARFAGE OThER (000’s) (000’s) (000’s) (000’s)2012 $8,760 $5,993 $5,822 $7,9372013 $10,732 $7,393 $6,447 $8,5402014 $11,365 $5,869 $6,919 $8,7912015 $12,697 $7,772 $8,872 $9,143
Dividend Payments 2011 - 2014
Income 2012 - 2015
(000,s)
2012 2013 2014 2015

43Fiji Ports CorPoration LimitedAnnuAl report 2014
Fiji Ships and Heavy Industries Limited - Profit & Loss Summary 2015
Fiji Ships and Heavy Industries Limitedrecorded highest profits ever in its history for the 2015 finan- cial year. Aggressive marketing within the Pacific Islands has led to an increase in regional vessels coming for ship repairs. Incomes were strongly supported by project based works on Fiji Navy patrol boat “RFNS Kikau” and refurbishment of local tourist boat “Spirit of the Pacific”.
Also the Heavy Industries income stream recorded incomes from repairs to FPCL shore crane and fuel tank maintenance for FEA Kinoya substation. Expenses also increased fairly as increase in in- come of 21.24% was noted. Income and some expenses (e.g. Production) are co-related. As income increases, production cost will increase accordingly. The new Biometrics and Time and Attendance software was implemented in July 2015, replacing the old time cards for pay processing.
This initiative has led to a greater monitoring of labour in terms of their clock in and clock off time and has greatly impacted on payment for productive labour hours. Moreover, other operating expenses were controlled through prudent and effective management of Fiji Ship’s operations. Hence 2015 fi- nancial year had been a very successful year generating after tax profit of $1.5m, an increase of 7% compared to year 2014, continuing profit growth momentum since 2010.
FSHIL Net Profit After Tax 2014 - 2015
Amou
nt $
Total Income $5,567,765 $6,750,549 Total Expenses $4,121,126 $4,848,249 nPAT $1,111,751 $1,508,256
20152014
$7,000,000
$6,000,000
$5,000,000
$4,000,000
$3,000,000
$2,000,000
$1,000,000
$-
Ratios 2014 2015return on Equity 14% 17%Working Capital 3.4 4.6gearing 0.21 0.16
Return on Equity 2014 -2015
Return on Equity is an impressive 17% and Balance Sheet also remains stable as noted by strong Working Capital of 4.6 and Gearing ratios of 0.16. Due to strong cash flows, FSHIL was able to invest $1m in term deposits in July 2015. ANZ loan was fully paid off in October 2015 and another term deposit of $750k was re-invested in November 2015.
FSHIL Dividend Declared 2013 - 2014
Amou
nt $
$600,000
$500,000
$400,000
$300,000
$200,000
$100,0002013
Dividend $544,792 $555,876
2014
Due to strong incomes and increasing NPAT over the last four years, FSHIL dividend payment to parent company FPCL has also increased significantly. The dividend paid in 2015 with respect to the 2014 financial year, represents a massive 48% increase over a three year time frame.
Risk and Compliance Unit
Effective risk management is regarded as essential for FPCL to achieve its objectives and pro-actively manage risks in order to provide greater certainty and security for all Port users.
As a statutory undertaker and a critical service provider, the Company also actively engages in this process to ensure a robust approach is maintained towards providing a greater understanding of risk management practices.
With this in mind, the Risk Management Policy, Framework and Risk Register for the Company was developed and implemented during the year. Part of the on-going exercise for the year was to identify risks, re-assess it and update Risk Register for the company which saw relevant risks and its exposures were identified. However, after the assessment of appropriate controls, the Register was updated with clear timeline for Risk Owners to mitigate those risks. As per the nature of Company’s operation, this exercise has been on-going.
As required under the Framework and to ensure that sound risk management practices are in place, the company has determined and set up Risk Appetite which was also proposed to the Finance Audit and Risk Management Sub Committee for approval. This enables the Company to become more pro- active because it becomes a measurable criteria for managing risks. On the other aspects, it allows the Company to know how much risk it is willing to take in order to achieve its business objectives.
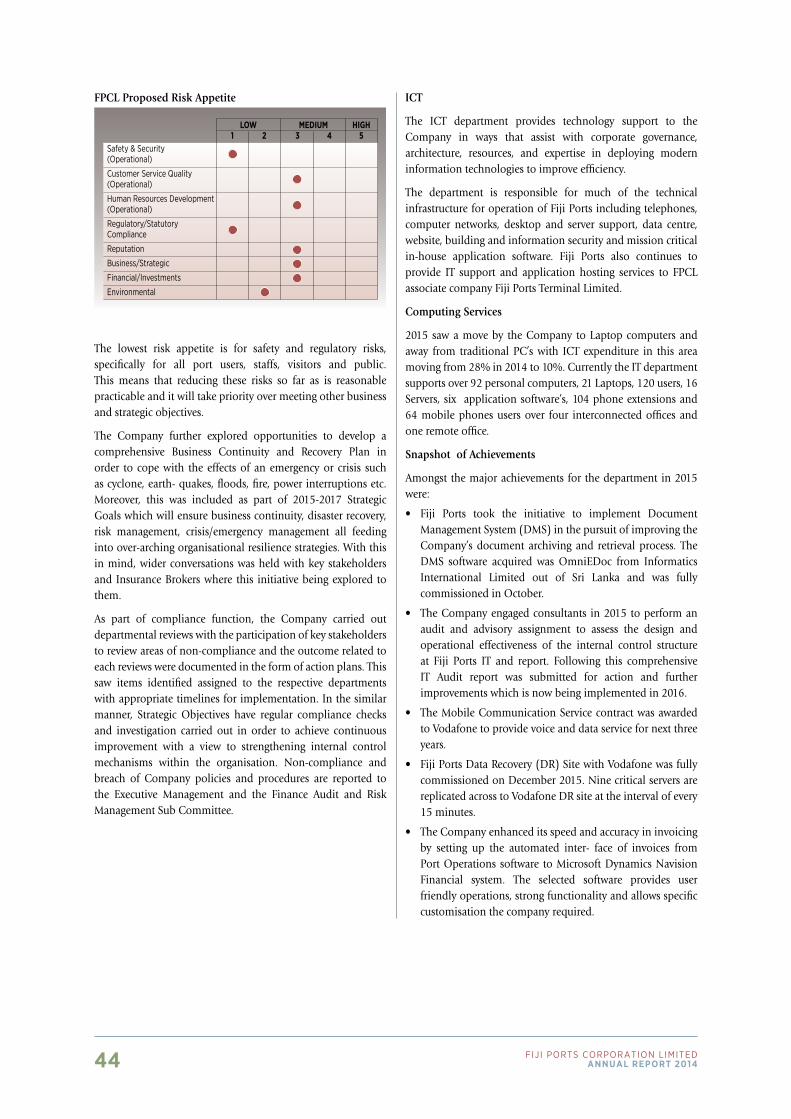
44 Fiji Ports CorPoration LimitedAnnuAl report 2014
FPCL Proposed Risk Appetite
LOw MEDIuM hIGh 1 2 3 4 5Safety & Security(operational)
Customer Service Quality(operational)
Human resources Development(operational)
regulatory/StatutoryCompliance
Reputation
Business/Strategic
Financial/Investments
Environmental
The lowest risk appetite is for safety and regulatory risks, specifically for all port users, staffs, visitors and public. This means that reducing these risks so far as is reasonable practicable and it will take priority over meeting other business and strategic objectives.
The Company further explored opportunities to develop a comprehensive Business Continuity and Recovery Plan in order to cope with the effects of an emergency or crisis such as cyclone, earth- quakes, floods, fire, power interruptions etc. Moreover, this was included as part of 2015-2017 Strategic Goals which will ensure business continuity, disaster recovery, risk management, crisis/emergency management all feeding into over-arching organisational resilience strategies. With this in mind, wider conversations was held with key stakeholders and Insurance Brokers where this initiative being explored to them.
As part of compliance function, the Company carried out departmental reviews with the participation of key stakeholders to review areas of non-compliance and the outcome related to each reviews were documented in the form of action plans. This saw items identified assigned to the respective departments with appropriate timelines for implementation. In the similar manner, Strategic Objectives have regular compliance checks and investigation carried out in order to achieve continuous improvement with a view to strengthening internal control mechanisms within the organisation. Non-compliance and breach of Company policies and procedures are reported to the Executive Management and the Finance Audit and Risk Management Sub Committee.
ICT
The ICT department provides technology support to the Company in ways that assist with corporate governance, architecture, resources, and expertise in deploying modern information technologies to improve efficiency.
The department is responsible for much of the technical infrastructure for operation of Fiji Ports including telephones, computer networks, desktop and server support, data centre, website, building and information security and mission critical in-house application software. Fiji Ports also continues to provide IT support and application hosting services to FPCL associate company Fiji Ports Terminal Limited.
Computing Services
2015 saw a move by the Company to Laptop computers and away from traditional PC’s with ICT expenditure in this area moving from 28% in 2014 to 10%. Currently the IT department supports over 92 personal computers, 21 Laptops, 120 users, 16 Servers, six application software’s, 104 phone extensions and 64 mobile phones users over four interconnected offices and one remote office.
Snapshot of Achievements
Amongst the major achievements for the department in 2015 were:
• Fiji Ports took the initiative to implement DocumentManagement System (DMS) in the pursuit of improving the Company’s document archiving and retrieval process. The DMS software acquired was OmniEDoc from Informatics International Limited out of Sri Lanka and was fully commissioned in October.
• TheCompanyengagedconsultants in2015toperformanaudit and advisory assignment to assess the design and operational effectiveness of the internal control structure at Fiji Ports IT and report. Following this comprehensive IT Audit report was submitted for action and further improvements which is now being implemented in 2016.
• TheMobileCommunicationServicecontractwasawardedto Vodafone to provide voice and data service for next three years.
• FijiPortsDataRecovery(DR)SitewithVodafonewasfullycommissioned on December 2015. Nine critical servers are replicated across to Vodafone DR site at the interval of every 15 minutes.
• TheCompanyenhanceditsspeedandaccuracyininvoicingby setting up the automated inter- face of invoices from Port Operations software to Microsoft Dynamics Navision Financial system. The selected software provides user friendly operations, strong functionality and allows specific customisation the company required.
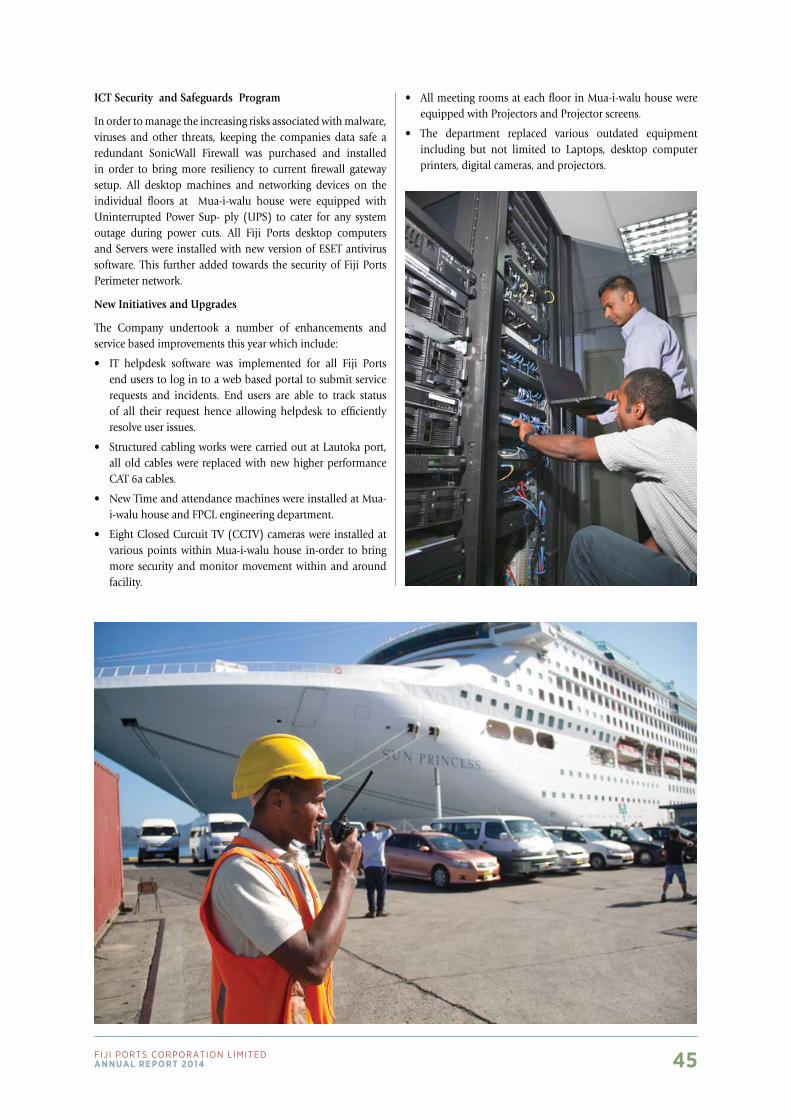
45Fiji Ports CorPoration LimitedAnnuAl report 2014
ICT Security and Safeguards Program
In order to manage the increasing risks associated with malware, viruses and other threats, keeping the companies data safe a redundant SonicWall Firewall was purchased and installed in order to bring more resiliency to current firewall gateway setup. All desktop machines and networking devices on the individual floors at Mua-i-walu house were equipped with Uninterrupted Power Sup- ply (UPS) to cater for any system outage during power cuts. All Fiji Ports desktop computers and Servers were installed with new version of ESET antivirus software. This further added towards the security of Fiji Ports Perimeter network.
New Initiatives and Upgrades
The Company undertook a number of enhancements and service based improvements this year which include:
• IT helpdesk software was implemented for all Fiji Portsend users to log in to a web based portal to submit service requests and incidents. End users are able to track status of all their request hence allowing helpdesk to efficiently resolve user issues.
• StructuredcablingworkswerecarriedoutatLautokaport,all old cables were replaced with new higher performance CAT 6a cables.
• NewTimeandattendancemachineswereinstalledatMua-i-walu house and FPCL engineering department.
• EightClosedCurcuitTV(CCTV)cameraswereinstalledatvarious points within Mua-i-walu house in-order to bring more security and monitor movement within and around facility.
• AllmeetingroomsateachfloorinMua-i-waluhousewereequipped with Projectors and Projector screens.
• The department replaced various outdated equipmentincluding but not limited to Laptops, desktop computer printers, digital cameras, and projectors.
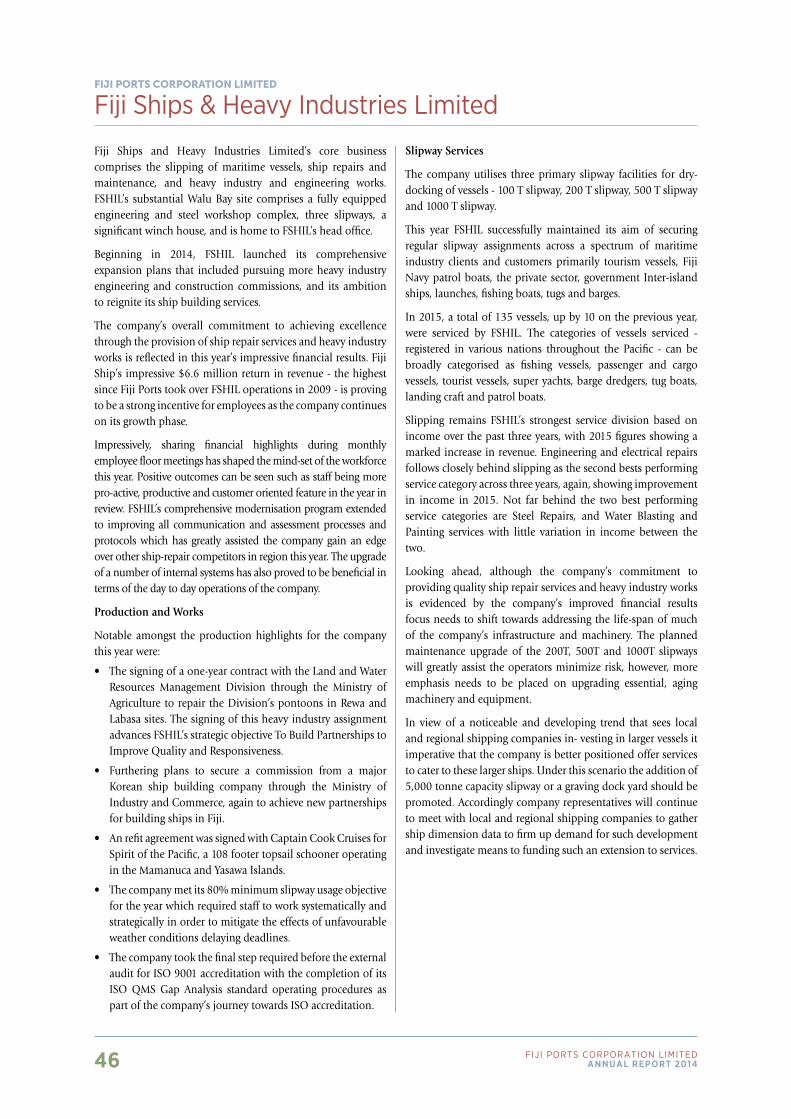
46 Fiji Ports CorPoration LimitedAnnuAl report 2014
Fiji Ships & Heavy Industries LimitedFiji PORTS CORPORaTiOn LimiTed
Fiji Ships and Heavy Industries Limited’s core business comprises the slipping of maritime vessels, ship repairs and maintenance, and heavy industry and engineering works. FSHIL’s substantial Walu Bay site comprises a fully equipped engineering and steel workshop complex, three slipways, a significant winch house, and is home to FSHIL’s head office.
Beginning in 2014, FSHIL launched its comprehensive expansion plans that included pursuing more heavy industry engineering and construction commissions, and its ambition to reignite its ship building services.
The company’s overall commitment to achieving excellence through the provision of ship repair services and heavy industry works is reflected in this year’s impressive financial results. Fiji Ship’s impressive $6.6 million return in revenue - the highest since Fiji Ports took over FSHIL operations in 2009 - is proving to be a strong incentive for employees as the company continues on its growth phase.
Impressively, sharing financial highlights during monthly employee floor meetings has shaped the mind-set of the workforce this year. Positive outcomes can be seen such as staff being more pro-active, productive and customer oriented feature in the year in review. FSHIL’s comprehensive modernisation program extended to improving all communication and assessment processes and protocols which has greatly assisted the company gain an edge over other ship-repair competitors in region this year. The upgrade of a number of internal systems has also proved to be beneficial in terms of the day to day operations of the company.
Production and Works
Notable amongst the production highlights for the company this year were:
• Thesigningofaone-yearcontractwiththeLandandWaterResources Management Division through the Ministry of Agriculture to repair the Division’s pontoons in Rewa and Labasa sites. The signing of this heavy industry assignment advances FSHIL’s strategic objective To Build Partnerships to Improve Quality and Responsiveness.
• Furthering plans to secure a commission from a majorKorean ship building company through the Ministry of Industry and Commerce, again to achieve new partnerships for building ships in Fiji.
• AnrefitagreementwassignedwithCaptainCookCruisesforSpirit of the Pacific, a 108 footer topsail schooner operating in the Mamanuca and Yasawa Islands.
• Thecompanymetits80%minimumslipwayusageobjectivefor the year which required staff to work systematically and strategically in order to mitigate the effects of unfavourable weather conditions delaying deadlines.
• Thecompanytookthefinalsteprequiredbeforetheexternalaudit for ISO 9001 accreditation with the completion of its ISO QMS Gap Analysis standard operating procedures as part of the company’s journey towards ISO accreditation.
Slipway Services
The company utilises three primary slipway facilities for dry-docking of vessels - 100 T slipway, 200 T slipway, 500 T slipway and 1000 T slipway.
This year FSHIL successfully maintained its aim of securing regular slipway assignments across a spectrum of maritime industry clients and customers primarily tourism vessels, Fiji Navy patrol boats, the private sector, government Inter-island ships, launches, fishing boats, tugs and barges.
In 2015, a total of 135 vessels, up by 10 on the previous year, were serviced by FSHIL. The categories of vessels serviced - registered in various nations throughout the Pacific - can be broadly categorised as fishing vessels, passenger and cargo vessels, tourist vessels, super yachts, barge dredgers, tug boats, landing craft and patrol boats.
Slipping remains FSHIL’s strongest service division based on income over the past three years, with 2015 figures showing a marked increase in revenue. Engineering and electrical repairs follows closely behind slipping as the second bests performing service category across three years, again, showing improvement in income in 2015. Not far behind the two best performing service categories are Steel Repairs, and Water Blasting and Painting services with little variation in income between the two.
Looking ahead, although the company’s commitment to providing quality ship repair services and heavy industry works is evidenced by the company’s improved financial results focus needs to shift towards addressing the life-span of much of the company’s infrastructure and machinery. The planned maintenance upgrade of the 200T, 500T and 1000T slipways will greatly assist the operators minimize risk, however, more emphasis needs to be placed on upgrading essential, aging machinery and equipment.
In view of a noticeable and developing trend that sees local and regional shipping companies in- vesting in larger vessels it imperative that the company is better positioned offer services to cater to these larger ships. Under this scenario the addition of 5,000 tonne capacity slipway or a graving dock yard should be promoted. Accordingly company representatives will continue to meet with local and regional shipping companies to gather ship dimension data to firm up demand for such development and investigate means to funding such an extension to services.
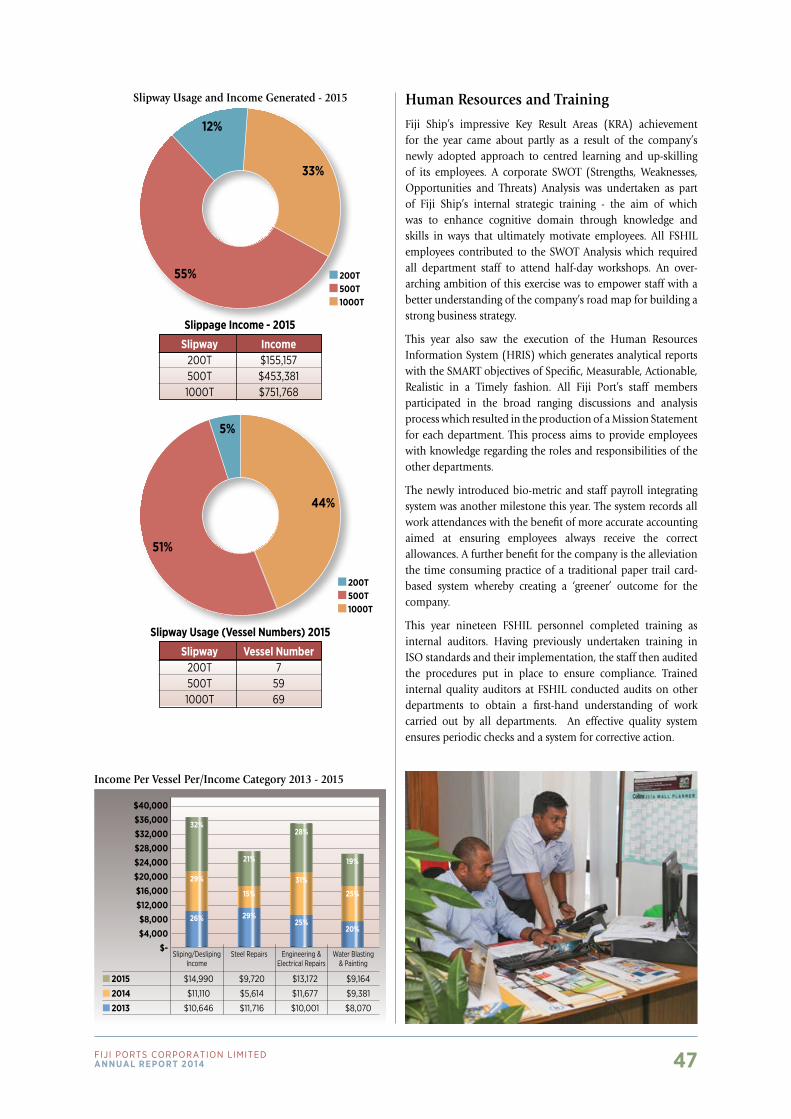
47Fiji Ports CorPoration LimitedAnnuAl report 2014
33%
12%
55%
44%
5%
51%
Slipway Income 200T $155,157 500T $453,381 1000T $751,768
Slippage Income - 2015
Slipway usage (Vessel Numbers) 2015
Slipway Vessel Number 200T 7 500T 59 1000T 69
Slipway Usage and Income Generated - 2015
200T 500T 1000T
200T 500T 1000T
Income Per Vessel Per/Income Category 2013 - 2015
$40,000$36,000$32,000$28,000$24,000$20,000$16,000$12,000$8,000$4,000
$-Sliping/Desliping
IncomeSteel Repairs Engineering &
Electrical repairsWater Blasting
& Painting
2015 $14,990 $9,720 $13,172 $9,164
2014 $11,110 $5,614 $11,677 $9,381
2013 $10,646 $11,716 $10,001 $8,070
26% 29%25%
20%
25%
19%
31%
28%
15%
21%
29%
32%
Human Resources and Training
Fiji Ship’s impressive Key Result Areas (KRA) achievement for the year came about partly as a result of the company’s newly adopted approach to centred learning and up-skilling of its employees. A corporate SWOT (Strengths, Weaknesses, Opportunities and Threats) Analysis was undertaken as part of Fiji Ship’s internal strategic training - the aim of which was to enhance cognitive domain through knowledge and skills in ways that ultimately motivate employees. All FSHIL employees contributed to the SWOT Analysis which required all department staff to attend half-day workshops. An over- arching ambition of this exercise was to empower staff with a better understanding of the company’s road map for building a strong business strategy.
This year also saw the execution of the Human Resources Information System (HRIS) which generates analytical reports with the SMART objectives of Specific, Measurable, Actionable, Realistic in a Timely fashion. All Fiji Port’s staff members participated in the broad ranging discussions and analysis process which resulted in the production of a Mission Statement for each department. This process aims to provide employees with knowledge regarding the roles and responsibilities of the other departments.
The newly introduced bio-metric and staff payroll integrating system was another milestone this year. The system records all work attendances with the benefit of more accurate accounting aimed at ensuring employees always receive the correct allowances. A further benefit for the company is the alleviation the time consuming practice of a traditional paper trail card-based system whereby creating a ‘greener’ outcome for the company.
This year nineteen FSHIL personnel completed training as internal auditors. Having previously undertaken training in ISO standards and their implementation, the staff then audited the procedures put in place to ensure compliance. Trained internal quality auditors at FSHIL conducted audits on other departments to obtain a first-hand understanding of work carried out by all departments. An effective quality system ensures periodic checks and a system for corrective action.
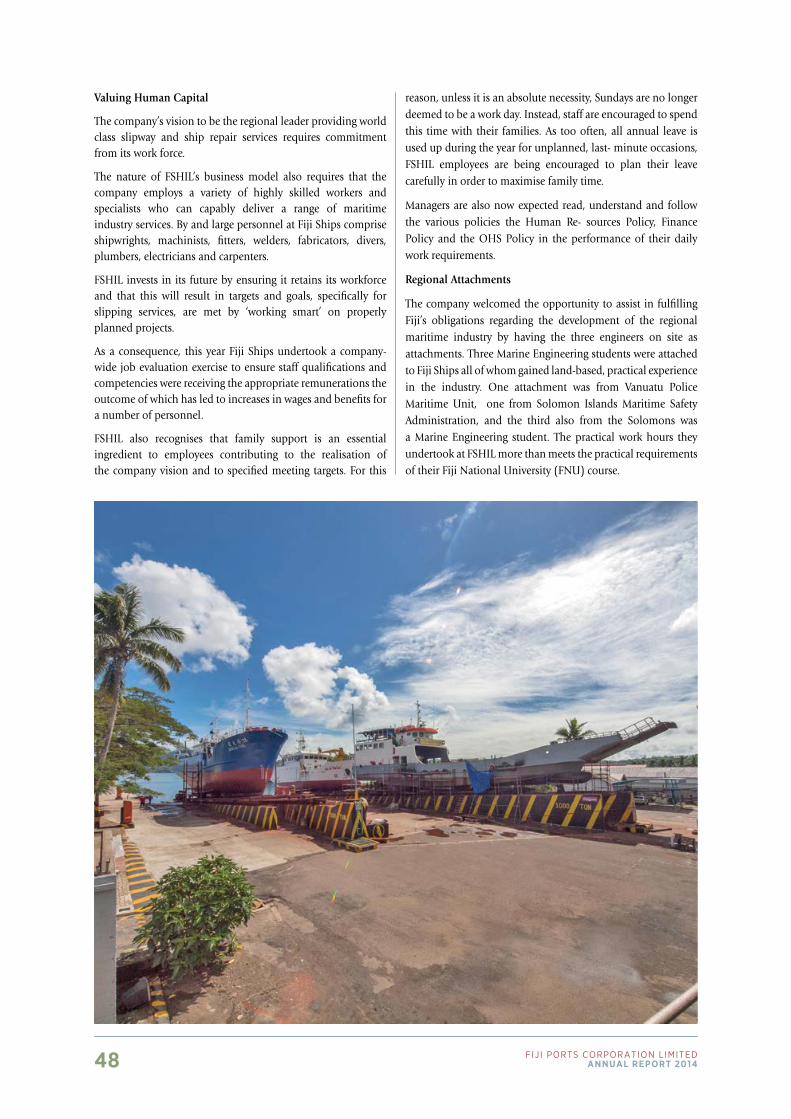
48 Fiji Ports CorPoration LimitedAnnuAl report 2014
Valuing Human Capital
The company’s vision to be the regional leader providing world class slipway and ship repair services requires commitment from its work force.
The nature of FSHIL’s business model also requires that the company employs a variety of highly skilled workers and specialists who can capably deliver a range of maritime industry services. By and large personnel at Fiji Ships comprise shipwrights, machinists, fitters, welders, fabricators, divers, plumbers, electricians and carpenters.
FSHIL invests in its future by ensuring it retains its workforce and that this will result in targets and goals, specifically for slipping services, are met by ‘working smart’ on properly planned projects.
As a consequence, this year Fiji Ships undertook a company-wide job evaluation exercise to ensure staff qualifications and competencies were receiving the appropriate remunerations the outcome of which has led to increases in wages and benefits for a number of personnel.
FSHIL also recognises that family support is an essential ingredient to employees contributing to the realisation of the company vision and to specified meeting targets. For this
reason, unless it is an absolute necessity, Sundays are no longer deemed to be a work day. Instead, staff are encouraged to spend this time with their families. As too often, all annual leave is used up during the year for unplanned, last- minute occasions, FSHIL employees are being encouraged to plan their leave carefully in order to maximise family time.
Managers are also now expected read, understand and follow the various policies the Human Re- sources Policy, Finance Policy and the OHS Policy in the performance of their daily work requirements.
Regional Attachments
The company welcomed the opportunity to assist in fulfilling Fiji’s obligations regarding the development of the regional maritime industry by having the three engineers on site as attachments. Three Marine Engineering students were attached to Fiji Ships all of whom gained land-based, practical experience in the industry. One attachment was from Vanuatu Police Maritime Unit, one from Solomon Islands Maritime Safety Administration, and the third also from the Solomons was a Marine Engineering student. The practical work hours they undertook at FSHIL more than meets the practical requirements of their Fiji National University (FNU) course.
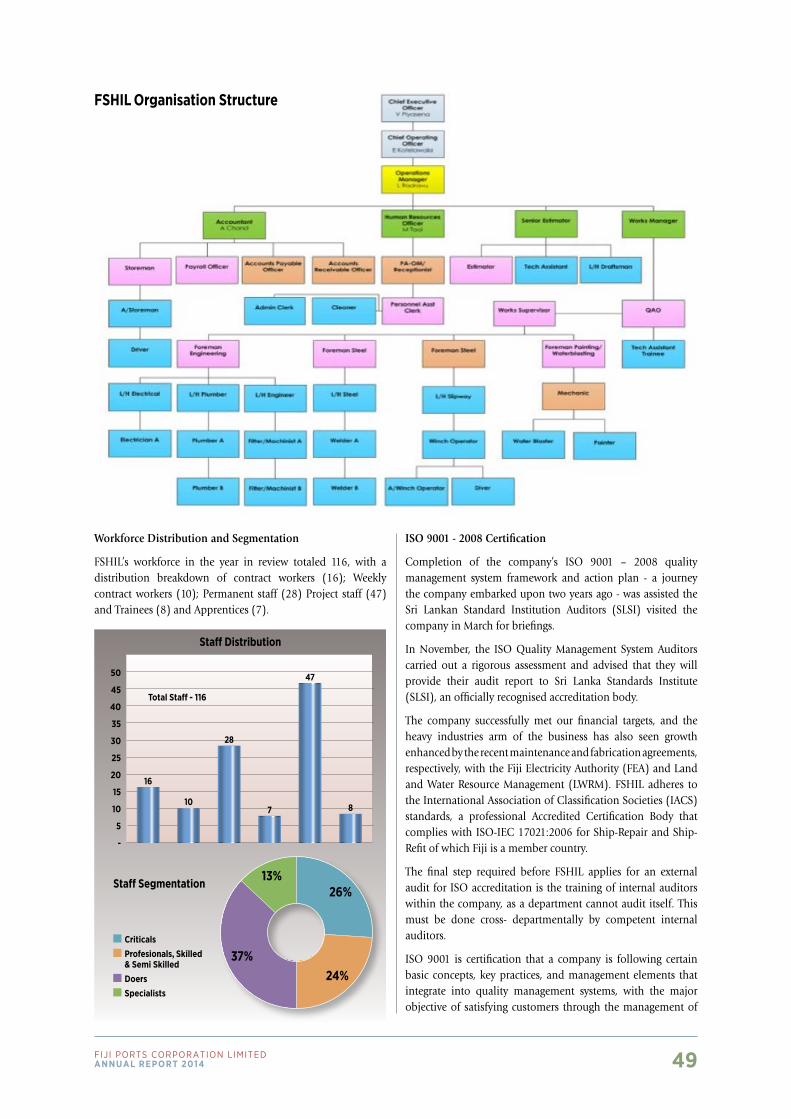
49Fiji Ports CorPoration LimitedAnnuAl report 2014
FShIL Organisation Structure
Workforce Distribution and Segmentation
FSHIL’s workforce in the year in review totaled 116, with a distribution breakdown of contract workers (16); Weekly contract workers (10); Permanent staff (28) Project staff (47) and Trainees (8) and Apprentices (7).
13%26%
24%37%
Staff Distribution
Staff Segmentation
Total Staff - 116
50
45
40
35
30
25
20
15
10
5
-
16
10
28
7
47
8
Criticals Profesionals, Skilled & Semi Skilled
Doers Specialists
ISO 9001 - 2008 Certification
Completion of the company’s ISO 9001 – 2008 quality management system framework and action plan - a journey the company embarked upon two years ago - was assisted the Sri Lankan Standard Institution Auditors (SLSI) visited the company in March for briefings.
In November, the ISO Quality Management System Auditors carried out a rigorous assessment and advised that they will provide their audit report to Sri Lanka Standards Institute (SLSI), an officially recognised accreditation body.
The company successfully met our financial targets, and the heavy industries arm of the business has also seen growth enhanced by the recent maintenance and fabrication agreements, respectively, with the Fiji Electricity Authority (FEA) and Land and Water Resource Management (LWRM). FSHIL adheres to the International Association of Classification Societies (IACS) standards, a professional Accredited Certification Body that complies with ISO-IEC 17021:2006 for Ship-Repair and Ship-Refit of which Fiji is a member country.
The final step required before FSHIL applies for an external audit for ISO accreditation is the training of internal auditors within the company, as a department cannot audit itself. This must be done cross- departmentally by competent internal auditors.
ISO 9001 is certification that a company is following certain basic concepts, key practices, and management elements that integrate into quality management systems, with the major objective of satisfying customers through the management of
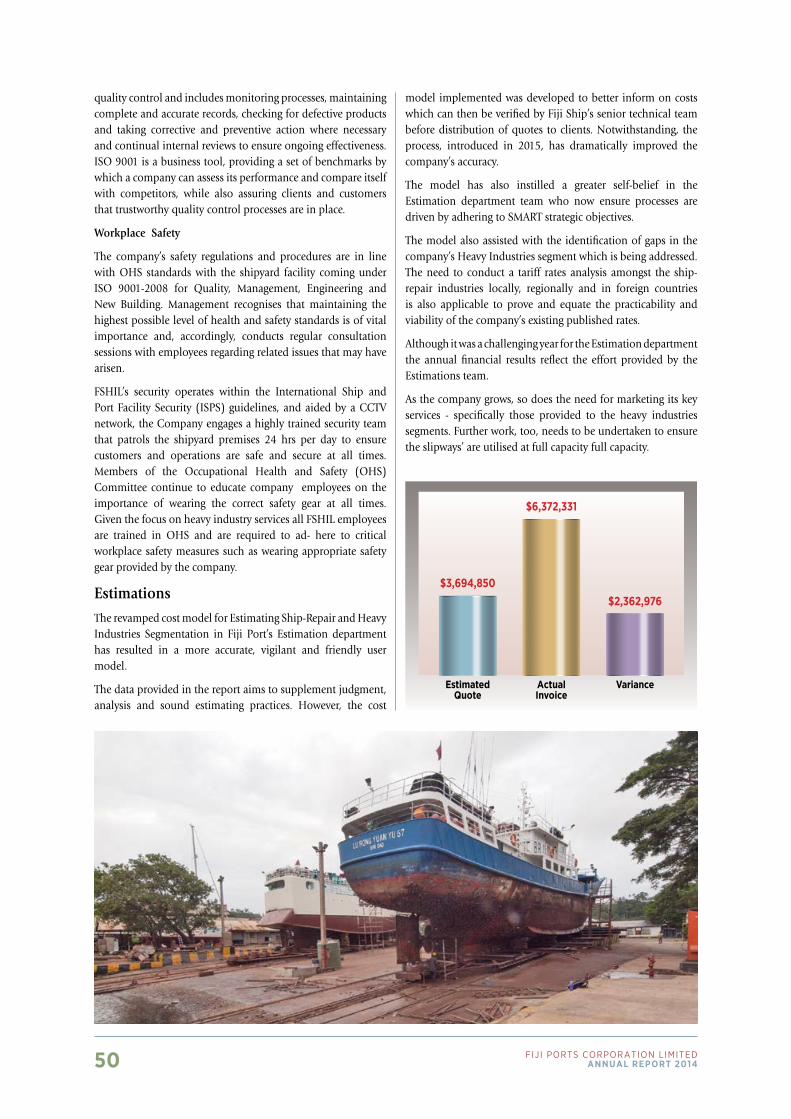
50 Fiji Ports CorPoration LimitedAnnuAl report 2014
quality control and includes monitoring processes, maintaining complete and accurate records, checking for defective products and taking corrective and preventive action where necessary and continual internal reviews to ensure ongoing effectiveness. ISO 9001 is a business tool, providing a set of benchmarks by which a company can assess its performance and compare itself with competitors, while also assuring clients and customers that trustworthy quality control processes are in place.
Workplace Safety
The company’s safety regulations and procedures are in line with OHS standards with the shipyard facility coming under ISO 9001-2008 for Quality, Management, Engineering and New Building. Management recognises that maintaining the highest possible level of health and safety standards is of vital importance and, accordingly, conducts regular consultation sessions with employees regarding related issues that may have arisen.
FSHIL’s security operates within the International Ship and Port Facility Security (ISPS) guidelines, and aided by a CCTV network, the Company engages a highly trained security team that patrols the shipyard premises 24 hrs per day to ensure customers and operations are safe and secure at all times. Members of the Occupational Health and Safety (OHS) Committee continue to educate company employees on the importance of wearing the correct safety gear at all times. Given the focus on heavy industry services all FSHIL employees are trained in OHS and are required to ad- here to critical workplace safety measures such as wearing appropriate safety gear provided by the company.
Estimations
The revamped cost model for Estimating Ship-Repair and Heavy Industries Segmentation in Fiji Port’s Estimation department has resulted in a more accurate, vigilant and friendly user model.
The data provided in the report aims to supplement judgment, analysis and sound estimating practices. However, the cost
model implemented was developed to better inform on costs which can then be verified by Fiji Ship’s senior technical team before distribution of quotes to clients. Notwithstanding, the process, introduced in 2015, has dramatically improved the company’s accuracy.
The model has also instilled a greater self-belief in the Estimation department team who now ensure processes are driven by adhering to SMART strategic objectives.
The model also assisted with the identification of gaps in the company’s Heavy Industries segment which is being addressed. The need to conduct a tariff rates analysis amongst the ship-repair industries locally, regionally and in foreign countries is also applicable to prove and equate the practicability and viability of the company’s existing published rates.
Although it was a challenging year for the Estimation department the annual financial results reflect the effort provided by the Estimations team.
As the company grows, so does the need for marketing its key services - specifically those provided to the heavy industries segments. Further work, too, needs to be undertaken to ensure the slipways’ are utilised at full capacity full capacity.
$3,694,850
$6,372,331
$2,362,976
EstimatedQuote
ActualInvoice
Variance
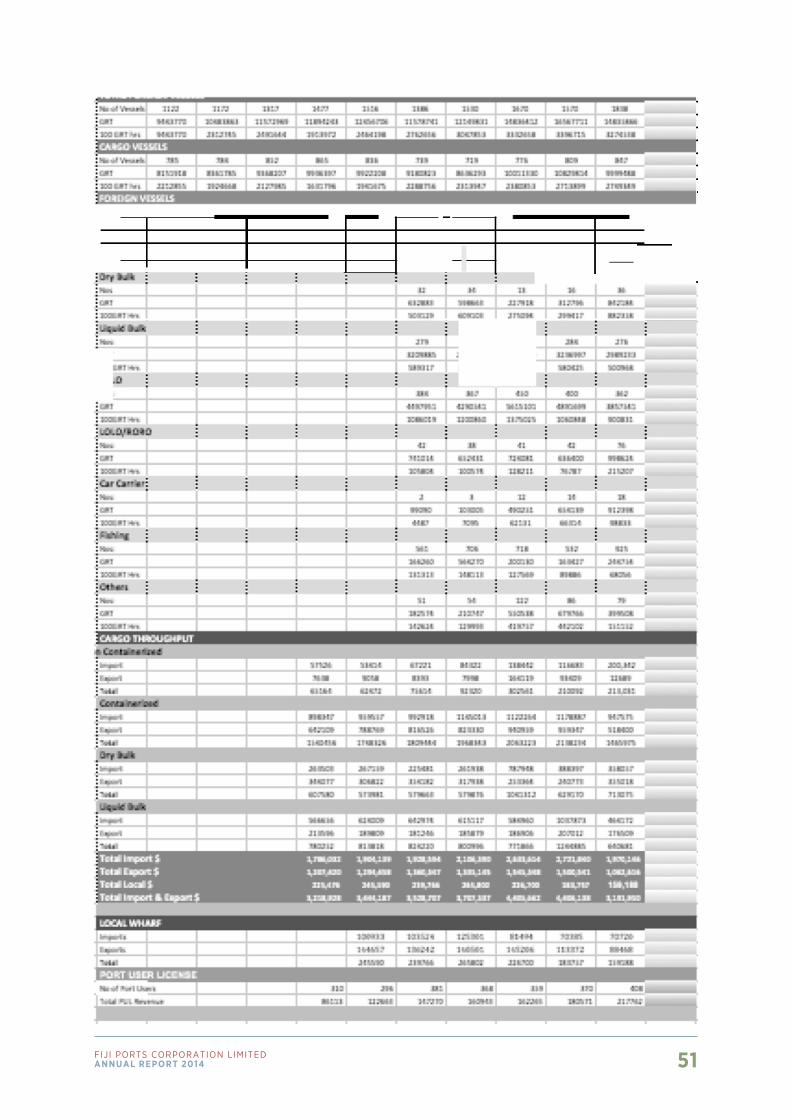
51Fiji Ports CorPoration LimitedAnnuAl report 2014
52 Fiji Ports CorPoration LimitedAnnuAl report 2014
Directors’ report 39-40
Statement by Directors 41
Independent Auditor’s report 42
Consolidated statement of comprehensive income 43
Consolidated statement of changes in equity 44
Consolidated statement of financial position 45
Consolidated statement of cash flows 46
Notes to the consolidated financial statements 47-66
For the Year ended 31 december, 2014
Financial Statements
Fiji PortS corPoration Limited and Subsidiary
53Fiji Ports CorPoration LimitedAnnuAl report 2014
In accordance with a resolution of the Board of Directors, the directors herewith submit the consolidated statement of financial position of the company and the group as at 31 December 2015, the consolidated statement of comprehensive income, the consolidated statement of changes in equity and the consolidated statement of cash flows for the year ended on that date and report as follows:
Directors
The names of the directors of the holding company at the date of this report are:
Tevita Kuruvakadua (Chairman)Vilash ChandVijay Maharaj
Principal activities
The principal activity of the parent company is providing and managing the port infrastructure and services within declared ports. The principal activity of the subsidiary trading as “Fiji Ships and Heavy Industries Limited” is the provision of ship repair and slipway services.
There has been no significant change in these activities during the year.
Results
The operating group profit for the year was $13,577,091 (2014: $7,438,382) after providing for income tax expense of $2,490,896 (2014: $1,528,299). The operating profit for the holding company for the year was $10,141,210 (2014: $6,637,848) after providing for income tax expense of $2,119,835 (2014: $1,263,163).
Dividends
The total dividend declared and paid during the year 2015 by the company and group in respect of the prior year (2014) amounted to $3,719,191 and dividend declared and paid in 2014 in respect of the prior year 2013 amounted to $3,698,979.
Going concern
The financial statements have been prepared on a going concern basis, which contemplates the continuity of business activities and the realisation of assets and the payments of liabilities in the normal course of business.
Bad and doubtful debts
Prior to the completion of the company’s and the group’s financial statements, the directors took reasonable steps to ascertain that action had been taken in relation to writing off bad debts and the allowance for doubtful debts. In the opinion of directors, adequate allowance has been made for doubtful debts.
As at the date of this report, the directors are not aware of any circumstances which would render the amount written off for bad debts or the provision for doubtful debts in the company and the group, inadequate to any substantial extent.
Non-current assets
Prior to the completion of the financial statements, the directors took reasonable steps to ascertain whether any non-current assets were unlikely to be realised in the ordinary course of business compared to their values as recorded in the accounting records of the company and the group. Where necessary these assets have been written down or adequate allowance has been made to bring the values of such assets to an amount that they might be expected to realise through ongoing operation or sale. A disclosure has been made under “events subsequent to balance date” on the sale and leaseback arrangements of all real estate assets of the company.
As at the date of this report, the directors are not aware of any circumstances, which would render the values attributed to non-current assets in the company’s and the group’s financial statements misleading.
Unusual transactions
In the opinion of the directors, the results of the operations of the company and the group during the financial year were not substantially affected by any item, transaction or event of a material unusual nature, nor has there arisen between the end of the financial year and the date of this report any item, transaction or event of a material unusual nature likely, in the opinion of the directors, to affect substantially the results of the operations of the company or the group in the current financial year, other than those reflected in the financial statements.
For the Year ended 31 december, 2015
Directors’ ReportFIjI PorTS CorPorATIon LIMITED and its Subsidiary
54 Fiji Ports CorPoration LimitedAnnuAl report 2014
Significant event
On 5 November 2015, the shareholders of the holding company (the Ministry of Public Enterprises and the Ministry of Finance) divested 59% of the company shares to private entities. The Ministry of Public Enterprises maintains 41% of the shares in the company, while Fiji National Provident Fund acquired 39% and Aitken Spence, a Sri Lankan company, acquired 20% of the shares in the company.
Events subsequent to balance date
As part of the divestment agreements signed on 5 November 2015, the holding company will transfer all real estate to a Government owned holding company (Assets Fiji Limited), which in turn will lease the assets necessary for port operations back to the holding company. The subsidiary company, Fiji Ships and Heavy Industries Limited (“FSHIL”), will transfer all interests in land currently owned or held to Assets Fiji Limited which in turn will lease the assets back to FSHIL. Ownership of all land interests will remain with the Fiji Government. The effective date of transfer and lease back of assets is unclear at the date of this report and will likely be effected in early 2016.
The holding company entered into an agreement with Ministry of Lands on 19 November 2015 to sell land and administration building located at Stinson Parade and Usher Street, Suva for a sum of $3,531,890 Vat Exclusive Price plus any applicable sales tax to allow Fiji Road Authority to commence the Stinson Bridge Project. The property was vacated and officially handed over to Fiji Roads Authority on 7th January 2016.
Apart from the matters disclosed above, there has not arisen in the interval between the end of the financial year and the date of this report any item, transaction or event of a material and unusual nature likely, in the opinion of the directors, to affect significantly the operations of the company or the group, the results of those operations or the state of affairs of the company or the group in the subsequent financial year.
Other circumstances
As at the date of this report:
(i) no charge on the assets of the company and the group has been given since the end of the financial year to secure the liabilities of any other person;
(ii) no material contingent liabilities have arisen since the end of the financial year for which the company and the group could become liable; and
(iii) no contingent liabilities or other liabilities of the company and the group have become or are likely to become enforceable within the year of twelve months after the end of the financial year which, in the opinion of the directors, will or may substantially affect the ability of the company to meet its obligations as and when they fall due.
As at the date of this report, the directors are not aware of any circumstances that have arisen, not otherwise dealt with in this report or the company’s and the group’s financial statements, which would make adherence to the existing method of valuation of assets or liabilities of the company misleading or inappropriate.
Directors’ benefits
Since the end of the previous financial year, no director has received or become entitled to receive a benefit (other than those included in the aggregate amount of emoluments received or due and receivable by directors shown in the financial statements or received as the fixed salary of a full-time employee of the company and the group or of a related corporation) by reason of a contract made by the company or by a related corporation with the director or with a firm of which he is a member, or with a company in which he has a substantial financial interest.
For and on behalf of the Board of Directors and in accordance with a resolution of the directors.
Dated this day of 2016.
.......................................................... ..........................................................
Director Director
For the Year ended 31 december, 2015
Directors’ Report continued
FIjI PorTS CorPorATIon LIMITED and its Subsidiary
55Fiji Ports CorPoration LimitedAnnuAl report 2014
For the Year ended 31 december, 2015
Statement of Directors’FIjI PorTS CorPorATIon LIMITED and its Subsidiary
In accordance with a resolution of the directors of Fiji Ports Corporation Limited and its subsidiary, we state that in the opinion of the directors:
(i) the accompanying consolidated statement of comprehensive income of the company and and the group is drawn up so as to give a true and fair view of the results of the company and the group for the year ended 31 December 2015;
(ii) the accompanying consolidated statement of changes in equity of the company and the group is drawn up so as to give a true and fair view of the changes in equity of the company and the group for the year ended 31 December 2015;
(iii) the accompanying consolidated statement of financial position of the company and the group is drawn up so as to give a true and fair view of the state of affairs of the company and the group as at 31 December 2015;
(iv) the accompanying consolidated statement of cash flows of the company and the group is drawn up so as to give a true and fair view of the cash flows of the company and the group for the year ended 31 December 2015;
(v) at the date of this statement there are reasonable grounds to believe the company and the group will be able to pay its debts as and when they fall due; and
(vi) all related party transactions have been adequately recorded in the books of the company and the group.
For and on behalf of the Board of Directors and in accordance with a resolution of the directors.
Dated this day of 2016.
.......................................................... ..........................................................
Director Director
56 Fiji Ports CorPoration LimitedAnnuAl report 2014
We have audited the accompanying consolidated Financial Statements of Fiji Ports Corporation Limited and its subsidiary, which comprise the consolidated statement of financial position as at 31 December 2015, the consolidated statement of comprehensive income, the consolidated statement of changes in equity, the consolidated statement of cash flows for the year then ended and a summary of significant accounting policies and other explanatory notes.
Directors’ and Management’s Responsibility for the Financial Statements
The directors and management are responsible for the preparation and fair presentation of these consolidated Financial Statements in accordance with International Financial Reporting Standards and the requirements of the Fiji Companies Act, 1983. This responsibility includes: designing, implementing and maintaining internal control relevant to the preparation and fair presentation of consolidated financial statements that are free from material misstatement, whether due to fraud or error; selecting and applying appropriate accounting policies; and making estimates that are reasonable in the circumstances.
Auditor’s Responsibility
Our responsibility is to express an opinion on these consolidated Financial Statements based on our audit. We conducted our audit in accordance with International Standards on Auditing. Those standards require that we comply with ethical requirements and plan and perform the audit to obtain reasonable assurance about whether the consolidated financial statements are free from material misstatement.
An audit involves performing procedures to obtain audit evidence about the amounts and disclosures in the consolidated financial statements. The procedures selected depend on the auditor’s judgment, including the assessment of the risks of material misstatement of the consolidated financial statements, whether due to fraud or error. In making those risk assessments, the auditor considers internal control relevant to the preparation and fair presentation of the consolidated financial statements in order to design audit procedures that are appropriate in the circumstances, but not for the purpose of expressing an opinion on the effectiveness of the entity’s internal control. An audit also includes evaluating the appropriateness of accounting policies used and the reasonableness of accounting estimates made by management, as well as evaluating the overall presentation of the consolidated financial statements.
We believe that the audit evidence we have obtained is sufficient and appropriate to provide a basis for our audit opinion.
Opinion
In our opinion:
a) proper books of account have been kept by the company and the group, so far as it appears from our examination of those books, and
b) the accompanying consolidated Financial Statements which have been prepared in accordance with International Financial Reporting Standards:
i) are in agreement with the books of account; and
ii) to the best of our information and according to the explanations given to us:
a) give a true fair view of the state of affairs of the company and the group as at 31 December 2015 and of the company’s and the group’s financial performance, changes in equity and its cash flows of the year ended on that date; and
b) give the information required by the Fiji Companies Act, 1983 in the manner so required.
We have obtained all the information and explanations, which to the best of our knowledge and belief were necessary for the purposes of our audit.
Suva, Fiji 2016 Ernst & Young Chartered Accountants
to the members oF Fiji Ports corPoration Limited
Independent Audit ReportFIjI PorTS CorPorATIon LIMITED and its Subsidiary
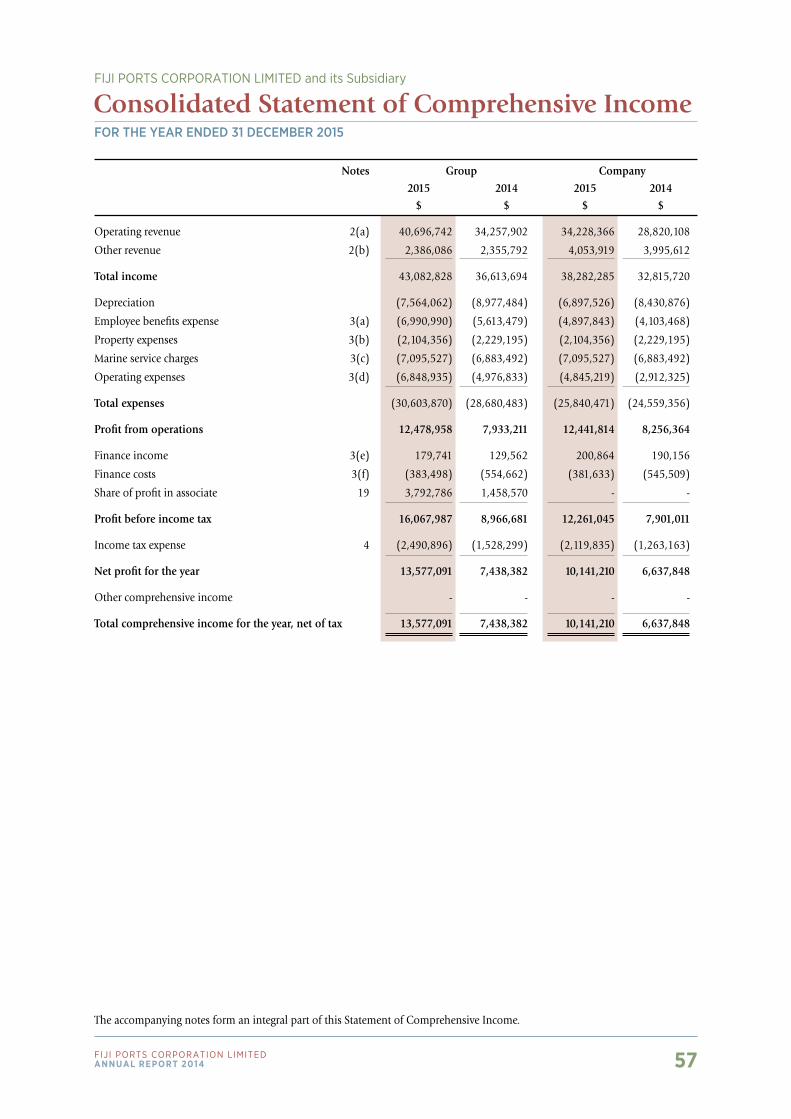
57Fiji Ports CorPoration LimitedAnnuAl report 2014
For the Year ended 31 december 2015
Consolidated Statement of Comprehensive IncomeFIjI PorTS CorPorATIon LIMITED and its Subsidiary
Notes Group Company 2015 2014 2015 2014 $ $ $ $
Operating revenue 2(a) 40,696,742 34,257,902 34,228,366 28,820,108
Other revenue 2(b) 2,386,086 2,355,792 4,053,919 3,995,612
Total income 43,082,828 36,613,694 38,282,285 32,815,720
Depreciation (7,564,062) (8,977,484) (6,897,526) (8,430,876)
Employee benefits expense 3(a) (6,990,990) (5,613,479) (4,897,843) (4,103,468)
Property expenses 3(b) (2,104,356) (2,229,195) (2,104,356) (2,229,195)
Marine service charges 3(c) (7,095,527) (6,883,492) (7,095,527) (6,883,492)
Operating expenses 3(d) (6,848,935) (4,976,833) (4,845,219) (2,912,325)
Total expenses (30,603,870) (28,680,483) (25,840,471) (24,559,356)
Profit from operations 12,478,958 7,933,211 12,441,814 8,256,364
Finance income 3(e) 179,741 129,562 200,864 190,156
Finance costs 3(f) (383,498) (554,662) (381,633) (545,509)
Share of profit in associate 19 3,792,786 1,458,570 - -
Profit before income tax 16,067,987 8,966,681 12,261,045 7,901,011
Income tax expense 4 (2,490,896) (1,528,299) (2,119,835) (1,263,163)
Net profit for the year 13,577,091 7,438,382 10,141,210 6,637,848
Other comprehensive income - - - -
Total comprehensive income for the year, net of tax 13,577,091 7,438,382 10,141,210 6,637,848
The accompanying notes form an integral part of this Statement of Comprehensive Income.
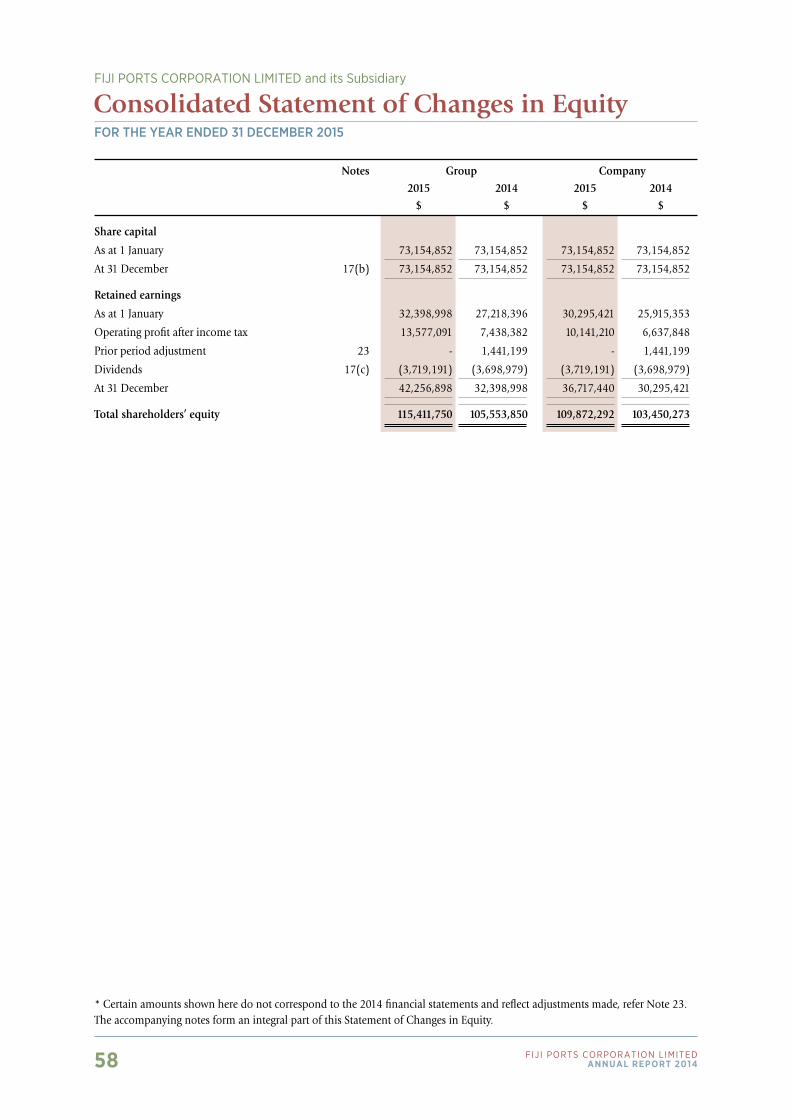
58 Fiji Ports CorPoration LimitedAnnuAl report 2014
For the Year ended 31 december 2015
Consolidated Statement of Changes in EquityFIjI PorTS CorPorATIon LIMITED and its Subsidiary
Notes Group Company 2015 2014 2015 2014 $ $ $ $
Share capital
As at 1 January 73,154,852 73,154,852 73,154,852 73,154,852
At 31 December 17(b) 73,154,852 73,154,852 73,154,852 73,154,852
Retained earnings
As at 1 January 32,398,998 27,218,396 30,295,421 25,915,353
Operating profit after income tax 13,577,091 7,438,382 10,141,210 6,637,848
Prior period adjustment 23 - 1,441,199 - 1,441,199
Dividends 17(c) (3,719,191) (3,698,979) (3,719,191) (3,698,979)
At 31 December 42,256,898 32,398,998 36,717,440 30,295,421
Total shareholders’ equity 115,411,750 105,553,850 109,872,292 103,450,273
* Certain amounts shown here do not correspond to the 2014 financial statements and reflect adjustments made, refer Note 23.The accompanying notes form an integral part of this Statement of Changes in Equity.
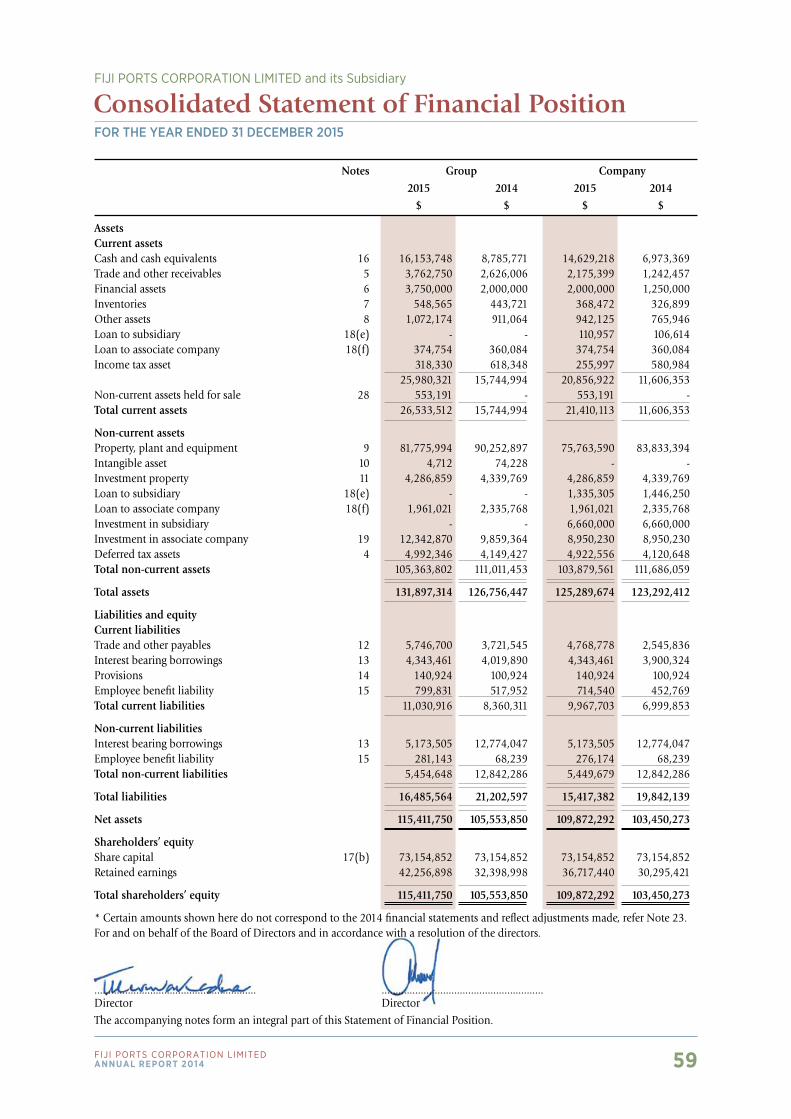
59Fiji Ports CorPoration LimitedAnnuAl report 2014
For the Year ended 31 december 2015
Consolidated Statement of Financial PositionFIjI PorTS CorPorATIon LIMITED and its Subsidiary
Notes Group Company 2015 2014 2015 2014 $ $ $ $
AssetsCurrent assetsCash and cash equivalents 16 16,153,748 8,785,771 14,629,218 6,973,369Trade and other receivables 5 3,762,750 2,626,006 2,175,399 1,242,457Financial assets 6 3,750,000 2,000,000 2,000,000 1,250,000Inventories 7 548,565 443,721 368,472 326,899Other assets 8 1,072,174 911,064 942,125 765,946Loan to subsidiary 18(e) - - 110,957 106,614Loan to associate company 18(f) 374,754 360,084 374,754 360,084Income tax asset 318,330 618,348 255,997 580,984 25,980,321 15,744,994 20,856,922 11,606,353Non-current assets held for sale 28 553,191 - 553,191 -Total current assets 26,533,512 15,744,994 21,410,113 11,606,353
Non-current assetsProperty, plant and equipment 9 81,775,994 90,252,897 75,763,590 83,833,394Intangible asset 10 4,712 74,228 - -Investment property 11 4,286,859 4,339,769 4,286,859 4,339,769Loan to subsidiary 18(e) - - 1,335,305 1,446,250Loan to associate company 18(f) 1,961,021 2,335,768 1,961,021 2,335,768Investment in subsidiary - - 6,660,000 6,660,000Investment in associate company 19 12,342,870 9,859,364 8,950,230 8,950,230Deferred tax assets 4 4,992,346 4,149,427 4,922,556 4,120,648Total non-current assets 105,363,802 111,011,453 103,879,561 111,686,059
Total assets 131,897,314 126,756,447 125,289,674 123,292,412
Liabilities and equityCurrent liabilitiesTrade and other payables 12 5,746,700 3,721,545 4,768,778 2,545,836Interest bearing borrowings 13 4,343,461 4,019,890 4,343,461 3,900,324Provisions 14 140,924 100,924 140,924 100,924Employee benefit liability 15 799,831 517,952 714,540 452,769Total current liabilities 11,030,916 8,360,311 9,967,703 6,999,853
Non-current liabilitiesInterest bearing borrowings 13 5,173,505 12,774,047 5,173,505 12,774,047Employee benefit liability 15 281,143 68,239 276,174 68,239Total non-current liabilities 5,454,648 12,842,286 5,449,679 12,842,286
Total liabilities 16,485,564 21,202,597 15,417,382 19,842,139
Net assets 115,411,750 105,553,850 109,872,292 103,450,273
Shareholders’ equityShare capital 17(b) 73,154,852 73,154,852 73,154,852 73,154,852Retained earnings 42,256,898 32,398,998 36,717,440 30,295,421
Total shareholders’ equity 115,411,750 105,553,850 109,872,292 103,450,273
* Certain amounts shown here do not correspond to the 2014 financial statements and reflect adjustments made, refer Note 23.For and on behalf of the Board of Directors and in accordance with a resolution of the directors.
.......................................................... ..........................................................Director Director
The accompanying notes form an integral part of this Statement of Financial Position.
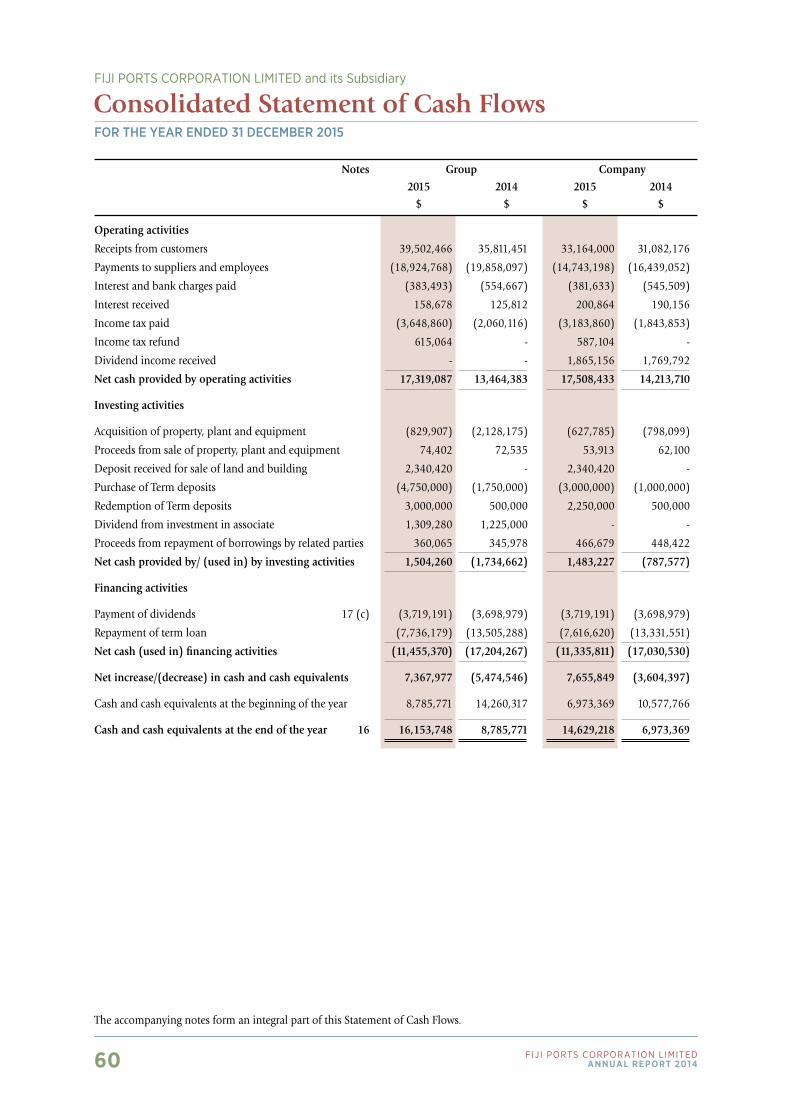
60 Fiji Ports CorPoration LimitedAnnuAl report 2014
Notes Group Company 2015 2014 2015 2014 $ $ $ $
Operating activities
Receipts from customers 39,502,466 35,811,451 33,164,000 31,082,176
Payments to suppliers and employees (18,924,768) (19,858,097) (14,743,198) (16,439,052)
Interest and bank charges paid (383,493) (554,667) (381,633) (545,509)
Interest received 158,678 125,812 200,864 190,156
Income tax paid (3,648,860) (2,060,116) (3,183,860) (1,843,853)
Income tax refund 615,064 - 587,104 -
Dividend income received - - 1,865,156 1,769,792
Net cash provided by operating activities 17,319,087 13,464,383 17,508,433 14,213,710
Investing activities
Acquisition of property, plant and equipment (829,907) (2,128,175) (627,785) (798,099)
Proceeds from sale of property, plant and equipment 74,402 72,535 53,913 62,100
Deposit received for sale of land and building 2,340,420 - 2,340,420 -
Purchase of Term deposits (4,750,000) (1,750,000) (3,000,000) (1,000,000)
Redemption of Term deposits 3,000,000 500,000 2,250,000 500,000
Dividend from investment in associate 1,309,280 1,225,000 - -
Proceeds from repayment of borrowings by related parties 360,065 345,978 466,679 448,422
Net cash provided by/ (used in) by investing activities 1,504,260 (1,734,662) 1,483,227 (787,577)
Financing activities
Payment of dividends 17 (c) (3,719,191) (3,698,979) (3,719,191) (3,698,979)
Repayment of term loan (7,736,179) (13,505,288) (7,616,620) (13,331,551)
Net cash (used in) financing activities (11,455,370) (17,204,267) (11,335,811) (17,030,530)
Net increase/(decrease) in cash and cash equivalents 7,367,977 (5,474,546) 7,655,849 (3,604,397)
Cash and cash equivalents at the beginning of the year 8,785,771 14,260,317 6,973,369 10,577,766
Cash and cash equivalents at the end of the year 16 16,153,748 8,785,771 14,629,218 6,973,369
The accompanying notes form an integral part of this Statement of Cash Flows.
For the Year ended 31 december 2015
Consolidated Statement of Cash FlowsFIjI PorTS CorPorATIon LIMITED and its Subsidiary
61Fiji Ports CorPoration LimitedAnnuAl report 2014
For the Year ended 31 december 2015
Notes to the Consolidated Financial StatementsFIjI PorTS CorPorATIon LIMITED and its Subsidiary
1.0 Corporate Information
Fiji Ports Corporation Limited was a government owned entity incorporated under the Fiji Companies Act, 1983 and a Government Commercial Company under the Public Enterprises Act of 1996, domiciled in Fiji till 12 November 2015. Minister for Public Enterprises via gazette declared Fiji Ports Corporation Limited (“FPCL”) and Fiji Ships and Heavy Industries Limited (“FSHIL”) on 13 November 2015 a Re-organisation Enterprises under the Public Enterprise Act 1996. This facilitated the changes under the privatisation and divestment initiative of the Government.
The address of the company’s registered office is at Muaiwalu House, Walu Bay. The principal place of business is Suva Kings Wharf, Port of Suva, Fiji. The consolidated Financial Statements were authorised for issue by the directors on 4th April, 2016.
1.1 Basis of accounting
The consolidated Financial Statements of the company have been drawn up in accordance with the provisions of the Fiji Companies Act, 1983 and International Financial Reporting Standards (“IFRS”) as issued by the International Accounting Standards Board (“IASB”). The consolidated Financial Statements have been prepared primarily on the basis of historical costs and except where specifically stated, do not take into account current valuations of non-current assets.
Where necessary, comparative information has been reclassified to achieve consistency in disclosure with the current financial year amounts and other disclosures.
The accounting policies have been consistently applied, and except where there is a change in accounting policy, are consistent with those of the previous year.
1.2 Principles of consolidation
The group Financial Statements consolidate the Financial Statements of Fiji Ports Corporation Limited and its subsidiary are drawn up to 31 December 2015.
Subsidiary
Subsidiary are all those entities over which the group has the power to govern the financial and operating policies, generally accompanying a shareholding of more than one half of the voting rights. The existence and effect of potential voting rights that are currently exercisable or convertible are considered when assessing whether the group controls another entity.
The consolidated financial statements include the information contained in the financial statements of Fiji Ports Corporation Limited and its controlled company from the date the holding company obtains control until such time as the control ceases. From 1st August 2013 onwards, Ports Terminal Limited was assessed to be an associate company and is accounted for using equity accounting.
The Financial Statements of the subsidiary are prepared for the same reporting year as the parent company, using consistent accounting policies. Adjustments are made to bring into line any dissimilar accounting policies which may exist.
All intra-group balances, income and expenses and unrealised gains and losses resulting from intra-group transactions are eliminated in full.
1.3 Significant accounting judgments, estimates and assumptions
The preparation of the company’s and the group’s financial statements requires management to make judgments, estimates and assumptions that affect the reported amounts of revenue, expenses, assets and liabilities, and the disclosure of contingent liabilities at the reporting date. However, uncertainty about these assumptions and estimates could result in outcomes that could require a material adjustment to the carrying amount of the asset or liability affected in the future.
Judgments
In the process of applying the company’s accounting policies, management has made the following judgment, apart from those involving estimations, which has the most significant effect on the amounts recognised in the financial statements:
Estimations and assumptions
The key assumptions concerning the future and other key sources of estimation uncertainty at the balance date, that have a significant risk of causing a material adjustments to the carrying amount of assets and liabilities within the next financial year are discussed below:
Impairment of non-financial assets
The company assesses whether there are any indicators of impairment for all non-financial assets at each reporting date. Non-financial assets are tested for impairment when there are indicators that the carrying amounts may not be recoverable.
62 Fiji Ports CorPoration LimitedAnnuAl report 2014
1.3 Significant accounting judgments, estimates and assumptions continued
Impairment losses on receivables
The company and the group reviewed its problem accounts at each reporting date to assess whether an allowance for impairment should be recorded in the Statement of Comprehensive Income. In particular, judgement by management is required in the estimation of the amount and timing of future cash flows when determining the level of allowance required. Such estimates are based on assumptions about a number of factors and actual results may differ, resulting in future changes to the allowance.
In addition to specific allowances against individually significant receivables, the company and the group also makes collective impairment allowances against exposures which, although not specifically identified as requiring a specific allowance, have a greater risk of default than when originally granted. This takes into consideration factors such as any deterioration in industry risk and technology obsolescence, as well as identified structural weaknesses or deterioration in cash flows.
1.4 Statement of significant accounting policies
(a) Functional and presentation currency
These financial statements are presented in Fiji dollars (“FJD”), which is the company’s and the group’s functional currency. Except as indicated, financial information presented in FJD has been rounded to the nearest dollar.
(b) Foreign currencies
Transactions in foreign currencies are initially recorded at the functional currency rate ruling at the date of the transaction. Monetary assets and liabilities denominated in foreign currencies are retranslated at the functional currency rate of exchange ruling at the balance date. All differences are taken to the Statement of Comprehensive Income. Non monetary items that are measured in terms of historical cost in a foreign currency are translated using the exchange rates as at the date of the initial transaction. Non monetary items measured at fair value in a foreign currency are translated using the exchange rates when the fair value is determined.
(c) Revenue recognition
Income comprising sales revenue from providing port services and managing port infrastructure is brought to account on an accrual basis as services are provided.
Revenue is recognised to the extent that it is probable that the economic benefits will flow to the entity and revenue can be reliably measured.
The following specific recognition criteria must also be met for the subsidary (Fiji Ships and Heavy Industries Limited) before revenue is recognised:
Slipway charges
Some slipping charges are received in advance. The revenue is recognised in the statement of comprehensive income when the vessels actually come on the slipway.
Ship repair charges
Revenue is recognised when work on the vessel has been performed. Billing is performed/done upon completion of work on stages.
(d) Expense recognition
All expenses are recognised in the statement of comprehensive income on an accrual basis.
(e) Property, plant and equipment
Property, plant and equipment is stated at cost less accumulated depreciation and accumulated impairment losses. Such costs includes the cost of replacing part of the plant and equipment when that cost is incurred, if the recognition criteria is met. Likewise, when a major inspection is performed, its cost is recognised in the carrying amount of the plant and equipment as a replacement if the recognition criteria are satisfied. All other repair and maintenance costs are recognised in the statement of comprehensive income as incurred.
Depreciation is calculated on a straight line basis over the useful life of the asset as follows:
Wharves 5% - 20% Buildings 5% - 20% Motor vehicles and motorised equipment 10% - 33% Plant and equipment 10% - 33% Office equipment 10% - 33% Furniture and fittings 10% - 33%
An item of property, plant and equipment is derecognised upon disposal or when no future economic benefits are expected from its use or disposal. Any gain or loss arising on derecognition of the asset (calculated as the difference between the net disposal proceeds and the carrying amount of the asset) is included in statement of comprehensive income in the year the asset is derecognised.
The asset’s residual values, useful lives and methods of depreciation are reviewed, and adjusted if appropriate, at each financial year
For the Year ended 31 december 2015
Notes to the Consolidated Financial Statements (cont’d)
FIjI PorTS CorPorATIon LIMITED and its Subsidiary
63Fiji Ports CorPoration LimitedAnnuAl report 2014
For the Year ended 31 december 2015
Notes to the Consolidated Financial Statements (cont’d)
FIjI PorTS CorPorATIon LIMITED and its Subsidiary
1.4 Statement of significant accounting policies continued
(f) Impairment of non-financial assets
The company and the group assesses at each reporting date whether there is an indication that an asset may be impaired. If any such indication exists, or when annual impairment testing for an asset is required, the company and the group estimates the asset’s recoverable amount. An asset’s recoverable amount is the higher of an asset’s or cash-generating unit’s fair value less costs to sell and its value in use and is determined for an individual asset, unless the asset does not generate cash inflows that are largely independent of those from other assets or groups of assets.
When the carrying amount of an asset exceeds its recoverable amount, the asset is considered impaired and is written down to its recoverable amount. In assessing value in use, the estimated future cash flows are discounted to their present value using a pre-tax discount rate that reflects current market assessments of the time value of money and the risks specific to the asset. In determining fair value less costs to sell, an appropriate value model is used.
For assets, an assignment is made at each reporting date as to whether there is any indication that previously recognised impairment losses may no longer exist or may have decreased. If such indication exists, the company and the group makes an estimate of recoverable amount. A previously recognised impairment loss is reversed only if there has been a change in the estimates used to determine the asset’s recoverable amount since the last impairment loss was recognised. If that is the case the carrying amount of the asset is increased to its recoverable amount. The increased amount cannot exceed the carrying amount that would have been determined, net of depreciation, had no impairment loss been recognised for the asset in prior years. Such a reversal is recognised in the statement of comprehensive income.
(g) Taxes
Current income tax
Current income tax assets and liabilities for the current and prior periods are measured at the amount expected to be recovered from or paid to the taxation authorities. The tax rates and tax laws used to compute the amount are those that are enacted or substantively enacted by the balance date.
Current income tax relating to items recognised directly in equity is recognised in equity and not in the Statement of Comprehensive Income.
Deferred income tax
Deferred income tax is provided, using the liability method, on all temporary differences at the balance date between the tax bases of assets and liabilities and their carrying amounts for financial reporting purposes. Deferred income tax liabilities are recognised for all taxable temporary differences:
- where the deferred income tax liability arises from goodwill amortisation or the initial recognition of an asset or liability in a transaction that is not a business combination and, at the time of the transaction, affects neither the accounting profit nor taxable profit or loss; and
- in respect of taxable temporary differences associated with investments in subsidiaries, associates and interest in joint ventures, except where the timing of the reversal of the temporary difference can be controlled and it is probable that the temporary difference will not reverse in the foreseeable future.
Deferred income tax assets are recognised for all deductible temporary differences, carry forward of unused tax credits and unused tax losses, to the extent that it is probable that taxable profit will be available against which the deductible temporary differences, and the carry forward of unused tax credits and unused tax losses can be utilised except:
- where the deferred tax asset relating to the deductible temporary difference arises from the initial recognition of an asset or liability in a transaction that it is not a business combination and, at the time of the transaction, affects neither the accounting profit nor taxable profit or loss; and
- in respect of deductible temporary differences associated with investments in subsidiaries, associates and interests in joint ventures, deferred tax assets are recognised only to the extent that it is probable that the temporary differences will reverse in the foreseeable future and taxable profit will be available against which the temporary differences can be utilised.
The carrying amount of deferred income tax assets is reviewed at each balance date and reduced to the extent that it is no longer probable that sufficient taxable profit will be available to allow all or part of the deferred income tax asset to be utilised. Unrecognised deferred income tax assets are reassessed at each balance date and are recognised to the extent that it has become probable that future taxable profit will allow the deferred tax asset to be recovered.

64 Fiji Ports CorPoration LimitedAnnuAl report 2014
For the Year ended 31 december 2015
Notes to the Consolidated Financial Statements (cont’d)
FIjI PorTS CorPorATIon LIMITED and its Subsidiary
1.4 Statement of significant accounting policies continued
(g) Taxes continued Deferred income tax continued
Deferred income tax assets and liabilities are measured at the tax rates that are expected to apply to the year when the asset is realised or the liability is settled, based on tax rates (and tax laws) that have been enacted or substantively enacted at the balance date. Deferred income tax relating to items recognised directly in equity is recognised in equity and not in the Statement of Comprehensive Income.
Deferred income tax assets and deferred income tax liabilities are offset, if a legally enforceable right exists to set off current tax assets against current income tax liabilities and the deferred income taxes related to the same taxable entity and the same taxation authority.
Value Added Tax
Revenue, expenses and assets are recognised net of the amount of Value Added Tax (VAT) except:
- where the VAT incurred on a purchase of assets or services is not recoverable from the taxation authority, in which case the VAT is recognised as part of the acquisition of the asset or as part of the expense item as applicable; and
- receivables and payables are stated with the amount of VAT included.
The net amount of VAT recoverable from, or payable to, the taxation authority is included as part of receivables or payables in the statement of financial position.
(h) Cash and cash equivalents
Cash and cash equivalents comprise cash at bank and in hand and short term deposits with an original maturity of three months or less. For the purposes of the Statement of Cash Flows, cash and cash equivalents consist of cash and cash equivalents as defined above.
(i) Financial assets
Financial assets within the scope of IAS 39 are classified as financial assets at fair value through profit or loss, loans and receivables, held-to-maturity investments, or available-for-sale financial assets, as appropriate. When financial assets are recognised initially, they are measured at fair value, plus, in the case of investments not at fair value through profit or loss, directly attributable transaction costs.
The company and the group determines the classification of its financial assets on initial recognition and, where allowed and appropriate, re-evaluates this designation at each financial year end.
All regular way purchases and sales of financial assets are recognised on the trade date that the company and the group commits to purchase the asset. Regular way purchases or sales are purchases or sales of financial assets that require delivery of assets within the period generally established by regulation or convention in the marketplace.
Held-to-maturity investments
Non-derivative financial assets with fixed or determinable payments and fixed maturities are classified as held-to-maturity when the company has the positive intention and ability to hold to maturity. After initial measurement held-to-maturity investments are measured at amortised cost using the effective interest rate method. Gains and losses are recognised in the statement of comprehensive income when the investments are derecognised or impaired, as well as through the amortisation process.
Loans and receivables
Loans and trade receivables are non-derivative financial assets with fixed or determinable payments that are not quoted in an active market. Loans and trade receivables are initially recognised at cost and original invoice amount (inclusive of VAT where applicable). After initial measurement, loans and receivables are carried at amortised cost using the effective interest method less any allowance for impairment. Gains and losses are recognised in the statement of comprehensive income when the receivables are derecognised or impaired, as well as through the amortisation process. Bad debts are written-off as incurred.
(j) Inventories
Inventories are measured at the lower of cost and net realisable value. The cost of inventories is based on the first-in-first-out principle. The cost of the inventories includes expenditure incurred in acquiring the inventories and bringing them to their existing location and condition.
65Fiji Ports CorPoration LimitedAnnuAl report 2014
For the Year ended 31 december 2015
Notes to the Consolidated Financial Statements (cont’d)
FIjI PorTS CorPorATIon LIMITED and its Subsidiary
1.4 Statement of significant accounting policies continued
(k) Investment property
Investment property is stated at cost less depreciation and impairment losses. When an item of property, plant and equipment becomes an investment property following a change in its use, any difference arising at the date of transfer between the carrying amount of the item and its fair value is recognised directly in equity if it is gain. Upon disposal of the item, the gain is transferred to retained earnings. Any loss is recognised in the statement of comprehensive income immediately.
(l) Intangible assets
Intangible assets acquired separately are measured on initial recognition at cost. Following initial recognition, intangible assets are carried at cost less any accumulated amortisation and any accumulated impairment losses. Internally generated intangible assets, excluding capitalised development costs, are not capitalised and expenditure is reflected in statement of comprehensive income in the year in which the expenditure is incurred.
The useful lives of intangible assets for the company are assessed to be finite.
Intangible assets with finite lives are amortised over the useful economic life and assessed for impairment whenever there is an indication that the intangible asset may be impaired. The amortisation period and the amortisation method for an intangible asset with a finite useful life is renewed at least at each financial year end. Changes in the expected useful life or expected pattern of consumption in future economic benefits embodied in the asset is accounted for by changing the amortisation period or method, as appropriate, and are treated as changes in accounting estimates. The amortisation expense on intangible assets with finite lives is recognised in statement of comprehensive income in the expense category consistent with the function of the intangible assets.
Gains or losses arising from the derecognition of an intangible asset are measured as the difference between the net disposal proceeds and the carrying amount of the asset and are recognised in statement of comprehensive income when the asset is derecognised.
(m) Impairment of non-financial assets
The company and the group assesses at each reporting date whether there is an indication that an asset may be impaired. If any such indication exists, or when annual impairment testing for an asset is required, the company estimates the asset’s recoverable amount. An asset’s recoverable amount is the higher of an asset’s or cash-generating unit’s fair value less costs to sell and its value in use and is determined for an individual asset, unless the asset does not generate cash inflows that are largely independent of those from other assets or groups of assets.
When the carrying amount of an asset exceeds its recoverable amount, the asset is considered impaired and is written down to its recoverable amount. In assessing value in use, the estimated future cash flows are discounted to their present value using a pre-tax discount rate that reflects current market assessments of the time value of money and the risks specific to the asset. In determining fair value less costs to sell, an appropriate value model is used.
For assets, an assignment is made at each reporting date as to whether there is any indication that previously recognised impairment losses may no longer exist or may have decreased. If such indication exists, the company makes an estimate of recoverable amount. A previously recognised impairment loss is reversed only if there has been a change in the estimates used to determine the asset’s recoverable amount since the last impairment loss was recognised. If that is the case the carrying amount of the asset is increased to its recoverable amount. The increased amount cannot exceed the carrying amount that would have been determined, net of depreciation, had no impairment loss been recognised for the asset in prior years. Such a reversal is recognised in the statement of comprehensive income.
(n) Trade and other payables
Liabilities for trade payables and other amounts are carried at cost (inclusive of VAT where applicable) which is the fair value of the consideration to be paid in the future for goods and services received whether or not billed to the entity. Amounts payable that have been denominated in foreign currencies have been translated to local currency using the rates of exchange ruling at the end of the financial year.
(o) Employee entitlements
Provisions are made for wages and salaries, incentive payments, annual and long service leave estimated to be payable to employees at balance date on the basis of statutory and contractual requirements.
66 Fiji Ports CorPoration LimitedAnnuAl report 2014
For the Year ended 31 december 2015
Notes to the Consolidated Financial Statements (cont’d)
FIjI PorTS CorPorATIon LIMITED and its Subsidiary
1.4 Statement of significant accounting policies continued
(p) Provisions
Provisions are recognised when the company and the group has a present obligation (legal or constructive) as a result of a past event, it is probable that an outflow of resources embodying economic benefits will be required to settle the obligation and reliable estimate can be made of the amount of the obligation. Where the company and the group expects a provision to be reimbursed, the reimbursement is recognised as a separate asset but only when reimbursement is virtually certain. If the effect of time value of money is material, provisions are determined by discounting the expected future cash flows at a pre-tax rate that reflects current market assessments of the time value of money and, where appropriate, the risks specific to the liability. Where discounting is used, the increase in the provision due to the passage of time is recognised as an interest expense.
(q) Financial liabilities
Interest bearing loans and borrowings
All loans and borrowings are initially recognised at fair value less directly attributable transaction costs, and have not been designated ‘as at fair value through the profit and loss’.
After initial recognition, interest bearing loans and borrowings are subsequently measured at amortised cost using the effective interest method.
Gains and losses are recognised on the Statement of Comprehensive Income when the liabilities are derecognised as well as through the amortisation process.
(r) Dividend distribution
Dividends are recorded in the company’s and the group’s financial statements in the year in which they are paid.
Dividends paid during the year are subject to the provisions of the Fiji Income Tax Act.
(s) Leased assets
The determination of whether an arrangement is, or contains a lease is based on the substance of the arrangement at inception date of whether the fulfillment of the arrangement is dependent on the use of a specific asset or assets or the arrangement conveys a right to use the asset.
Company and the group as a lessee
Finance leases, which transfer to the company and the group substantially all the risks and benefits incidental to ownership of the leased item, are capitalised at the inception of the lease at the fair value of the leased property or, if lower, at the present value of the minimum lease payments. Lease payments are apportioned between the finance charges and reduction of the lease liability so as to achieve a constant rate of interest on the remaining balance of the liability. Finance charges are reflected in the statement of comprehensive income.
Capitalised leased assets are depreciated over the shorter of the estimated useful life of the asset and the lease term, if there is no reasonable certainty that the company and the group will obtain ownership by the end of the lease term.
Operating lease payments are recognised as an expense in the statement of comprehensive income on a straight line basis over the lease term.
Company and the group as a lessor
Leases where the company and the group does not transfer substantially all the risks and benefits of ownership of the asset are classified as operating leases. Initial direct costs incurred in negotiating an operating lease are added to the carrying amount of the leased asset and recognised over the lease term on the same bases as rental income. Contingent rents are recognised as revenue in the period in which they are earned.
(t) Comparative figures
Where necessary, comparative information has been re-classified to achieve consistency in disclosure with current financial year amounts.
(u) Segment information
A business segment is a group of assets and operations engaged in providing products or services that are subject to risks and returns that are different from those of other business segments. A geographical segment is engaged in providing products and services within a particular economic environment that are subject to risks and returns that are different from those of segments operating in other economic environment.
(a) Industry segment
The company operates predominantly in the shipping industry.
(b) Geographical segment
The company and the group operates predominantly in Fiji and has therefore one geographical area for reporting purposes.
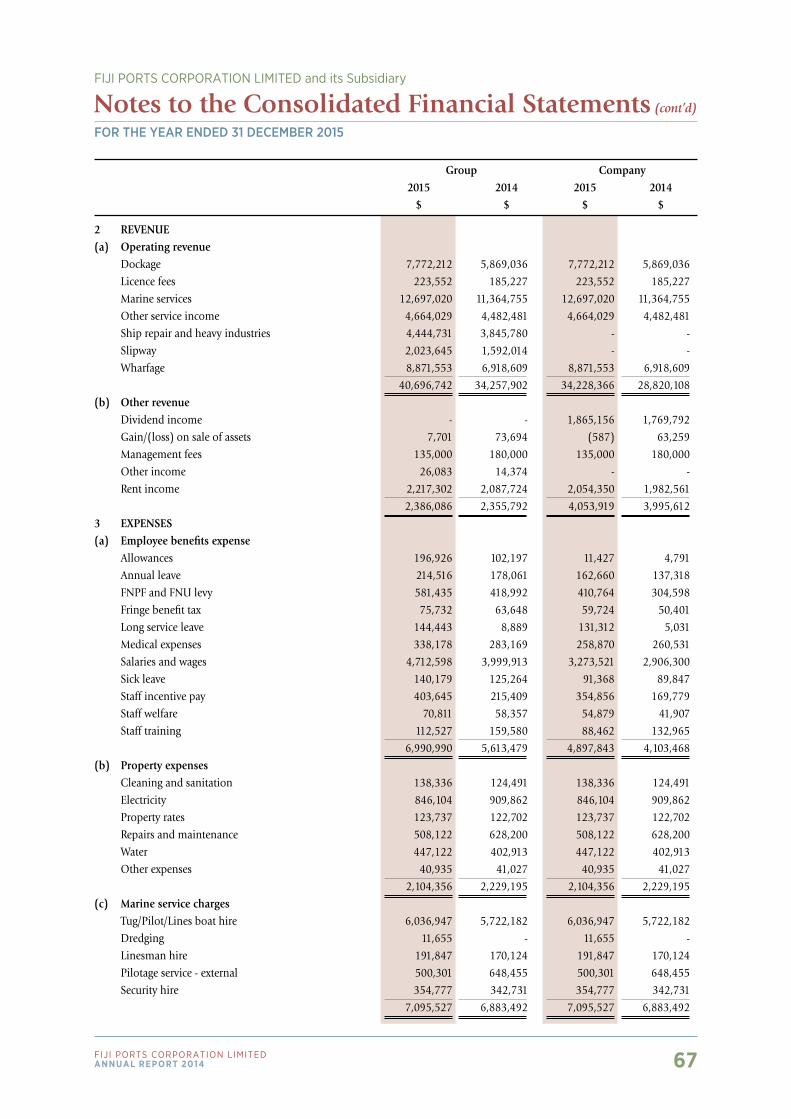
67Fiji Ports CorPoration LimitedAnnuAl report 2014
For the Year ended 31 december 2015
Notes to the Consolidated Financial Statements (cont’d)
FIjI PorTS CorPorATIon LIMITED and its Subsidiary
Group Company 2015 2014 2015 2014 $ $ $ $
2 REVENUE(a) Operating revenue Dockage 7,772,212 5,869,036 7,772,212 5,869,036
Licence fees 223,552 185,227 223,552 185,227
Marine services 12,697,020 11,364,755 12,697,020 11,364,755
Other service income 4,664,029 4,482,481 4,664,029 4,482,481
Ship repair and heavy industries 4,444,731 3,845,780 - -
Slipway 2,023,645 1,592,014 - -
Wharfage 8,871,553 6,918,609 8,871,553 6,918,609
40,696,742 34,257,902 34,228,366 28,820,108
(b) Other revenue Dividend income - - 1,865,156 1,769,792
Gain/(loss) on sale of assets 7,701 73,694 (587) 63,259
Management fees 135,000 180,000 135,000 180,000
Other income 26,083 14,374 - -
Rent income 2,217,302 2,087,724 2,054,350 1,982,561
2,386,086 2,355,792 4,053,919 3,995,612
3 EXPENSES(a) Employee benefits expense Allowances 196,926 102,197 11,427 4,791
Annual leave 214,516 178,061 162,660 137,318
FNPF and FNU levy 581,435 418,992 410,764 304,598
Fringe benefit tax 75,732 63,648 59,724 50,401
Long service leave 144,443 8,889 131,312 5,031
Medical expenses 338,178 283,169 258,870 260,531
Salaries and wages 4,712,598 3,999,913 3,273,521 2,906,300
Sick leave 140,179 125,264 91,368 89,847
Staff incentive pay 403,645 215,409 354,856 169,779
Staff welfare 70,811 58,357 54,879 41,907
Staff training 112,527 159,580 88,462 132,965
6,990,990 5,613,479 4,897,843 4,103,468
(b) Property expenses Cleaning and sanitation 138,336 124,491 138,336 124,491
Electricity 846,104 909,862 846,104 909,862
Property rates 123,737 122,702 123,737 122,702
Repairs and maintenance 508,122 628,200 508,122 628,200
Water 447,122 402,913 447,122 402,913
Other expenses 40,935 41,027 40,935 41,027
2,104,356 2,229,195 2,104,356 2,229,195
(c) Marine service charges Tug/Pilot/Lines boat hire 6,036,947 5,722,182 6,036,947 5,722,182
Dredging 11,655 - 11,655 -
Linesman hire 191,847 170,124 191,847 170,124
Pilotage service - external 500,301 648,455 500,301 648,455
Security hire 354,777 342,731 354,777 342,731
7,095,527 6,883,492 7,095,527 6,883,492
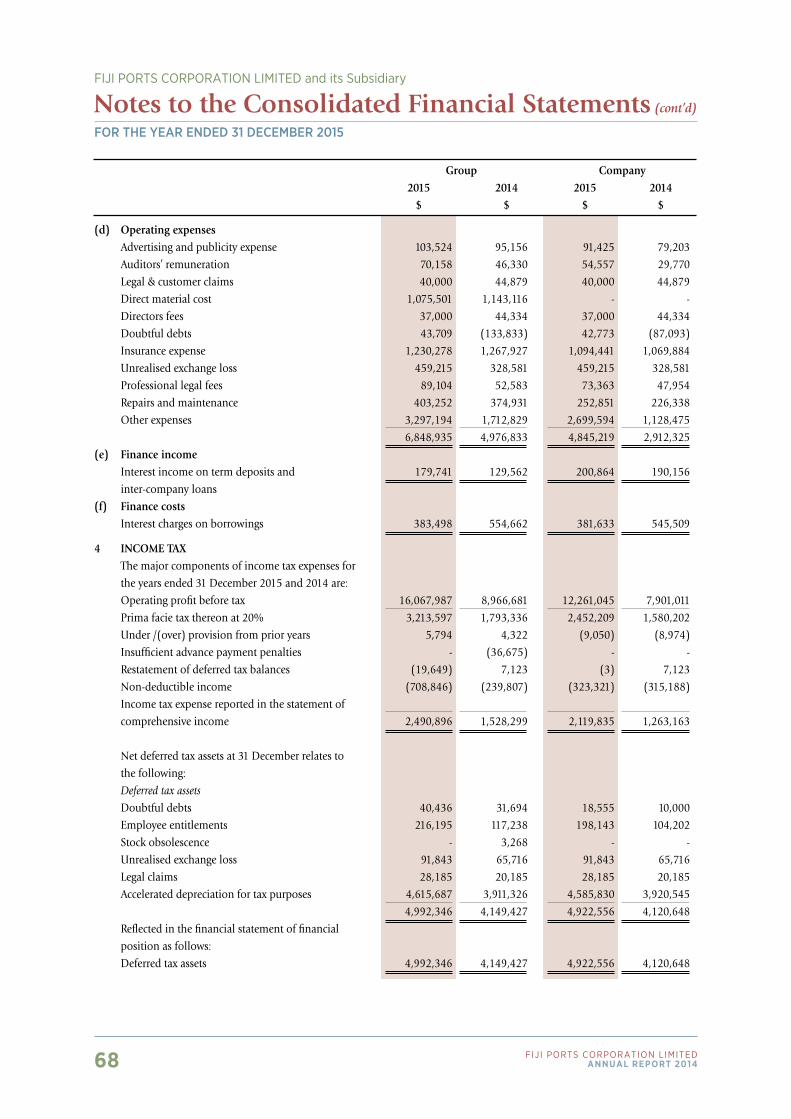
68 Fiji Ports CorPoration LimitedAnnuAl report 2014
For the Year ended 31 december 2015
Notes to the Consolidated Financial Statements (cont’d)
FIjI PorTS CorPorATIon LIMITED and its Subsidiary
Group Company 2015 2014 2015 2014 $ $ $ $
(d) Operating expenses Advertising and publicity expense 103,524 95,156 91,425 79,203
Auditors’ remuneration 70,158 46,330 54,557 29,770
Legal & customer claims 40,000 44,879 40,000 44,879
Direct material cost 1,075,501 1,143,116 - -
Directors fees 37,000 44,334 37,000 44,334
Doubtful debts 43,709 (133,833) 42,773 (87,093)
Insurance expense 1,230,278 1,267,927 1,094,441 1,069,884
Unrealised exchange loss 459,215 328,581 459,215 328,581
Professional legal fees 89,104 52,583 73,363 47,954
Repairs and maintenance 403,252 374,931 252,851 226,338
Other expenses 3,297,194 1,712,829 2,699,594 1,128,475
6,848,935 4,976,833 4,845,219 2,912,325
(e) Finance income Interest income on term deposits and 179,741 129,562 200,864 190,156
inter-company loans
(f) Finance costs Interest charges on borrowings 383,498 554,662 381,633 545,509
4 INCOME TAX The major components of income tax expenses for
the years ended 31 December 2015 and 2014 are:
Operating profit before tax 16,067,987 8,966,681 12,261,045 7,901,011
Prima facie tax thereon at 20% 3,213,597 1,793,336 2,452,209 1,580,202
Under /(over) provision from prior years 5,794 4,322 (9,050) (8,974)
Insufficient advance payment penalties - (36,675) - -
Restatement of deferred tax balances (19,649) 7,123 (3) 7,123
Non-deductible income (708,846) (239,807) (323,321) (315,188)
Income tax expense reported in the statement of
comprehensive income 2,490,896 1,528,299 2,119,835 1,263,163
Net deferred tax assets at 31 December relates to
the following:
Deferred tax assets
Doubtful debts 40,436 31,694 18,555 10,000
Employee entitlements 216,195 117,238 198,143 104,202
Stock obsolescence - 3,268 - -
Unrealised exchange loss 91,843 65,716 91,843 65,716
Legal claims 28,185 20,185 28,185 20,185
Accelerated depreciation for tax purposes 4,615,687 3,911,326 4,585,830 3,920,545
4,992,346 4,149,427 4,922,556 4,120,648
Reflected in the financial statement of financial
position as follows:
Deferred tax assets 4,992,346 4,149,427 4,922,556 4,120,648
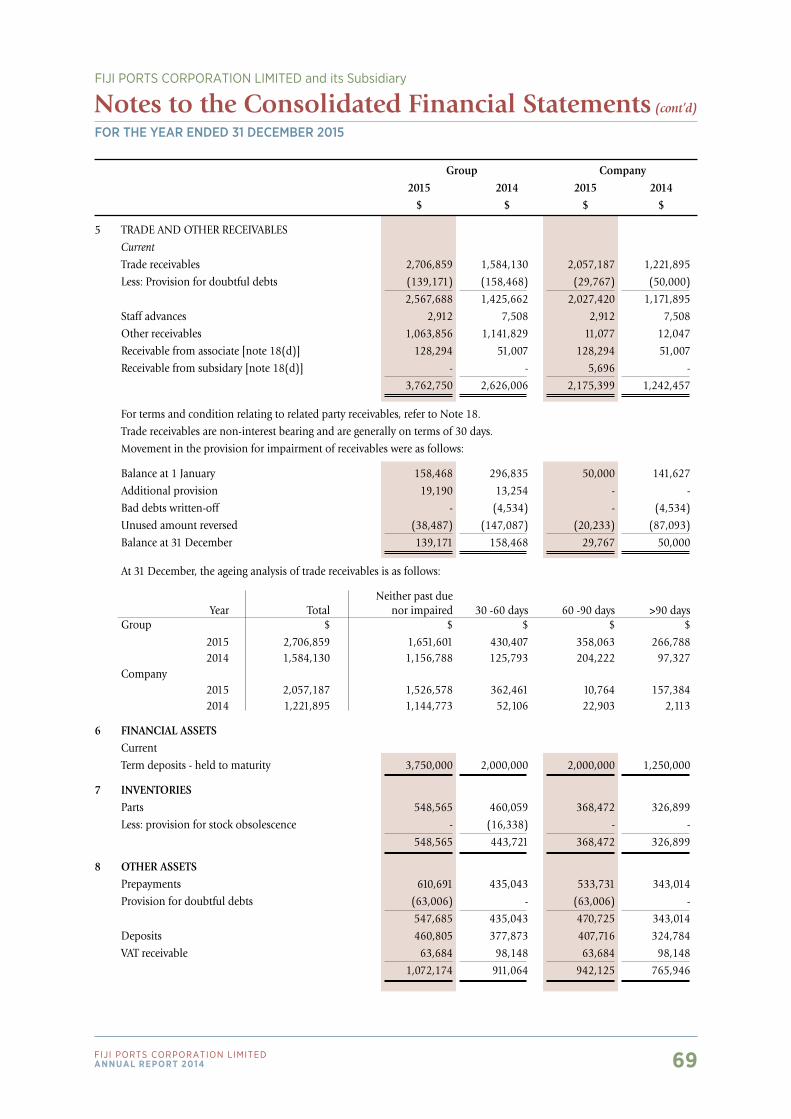
69Fiji Ports CorPoration LimitedAnnuAl report 2014
For the Year ended 31 december 2015
Notes to the Consolidated Financial Statements (cont’d)
FIjI PorTS CorPorATIon LIMITED and its Subsidiary
Group Company 2015 2014 2015 2014 $ $ $ $
5 TRADE AND OTHER RECEIVABLES
Current
Trade receivables 2,706,859 1,584,130 2,057,187 1,221,895
Less: Provision for doubtful debts (139,171) (158,468) (29,767) (50,000)
2,567,688 1,425,662 2,027,420 1,171,895
Staff advances 2,912 7,508 2,912 7,508
Other receivables 1,063,856 1,141,829 11,077 12,047
Receivable from associate [note 18(d)] 128,294 51,007 128,294 51,007
Receivable from subsidary [note 18(d)] - - 5,696 -
3,762,750 2,626,006 2,175,399 1,242,457
For terms and condition relating to related party receivables, refer to Note 18.
Trade receivables are non-interest bearing and are generally on terms of 30 days.
Movement in the provision for impairment of receivables were as follows:
Balance at 1 January 158,468 296,835 50,000 141,627
Additional provision 19,190 13,254 - -
Bad debts written-off - (4,534) - (4,534)
Unused amount reversed (38,487) (147,087) (20,233) (87,093)
Balance at 31 December 139,171 158,468 29,767 50,000
At 31 December, the ageing analysis of trade receivables is as follows:
Neither past due Year Total nor impaired 30 -60 days 60 -90 days >90 days Group $ $ $ $ $
2015 2,706,859 1,651,601 430,407 358,063 266,788 2014 1,584,130 1,156,788 125,793 204,222 97,327 Company 2015 2,057,187 1,526,578 362,461 10,764 157,384 2014 1,221,895 1,144,773 52,106 22,903 2,113
6 FINANCIAL ASSETS Current
Term deposits - held to maturity 3,750,000 2,000,000 2,000,000 1,250,000
7 INVENTORIES Parts 548,565 460,059 368,472 326,899
Less: provision for stock obsolescence - (16,338) - -
548,565 443,721 368,472 326,899
8 OTHER ASSETS Prepayments 610,691 435,043 533,731 343,014
Provision for doubtful debts (63,006) - (63,006) -
547,685 435,043 470,725 343,014
Deposits 460,805 377,873 407,716 324,784
VAT receivable 63,684 98,148 63,684 98,148
1,072,174 911,064 942,125 765,946
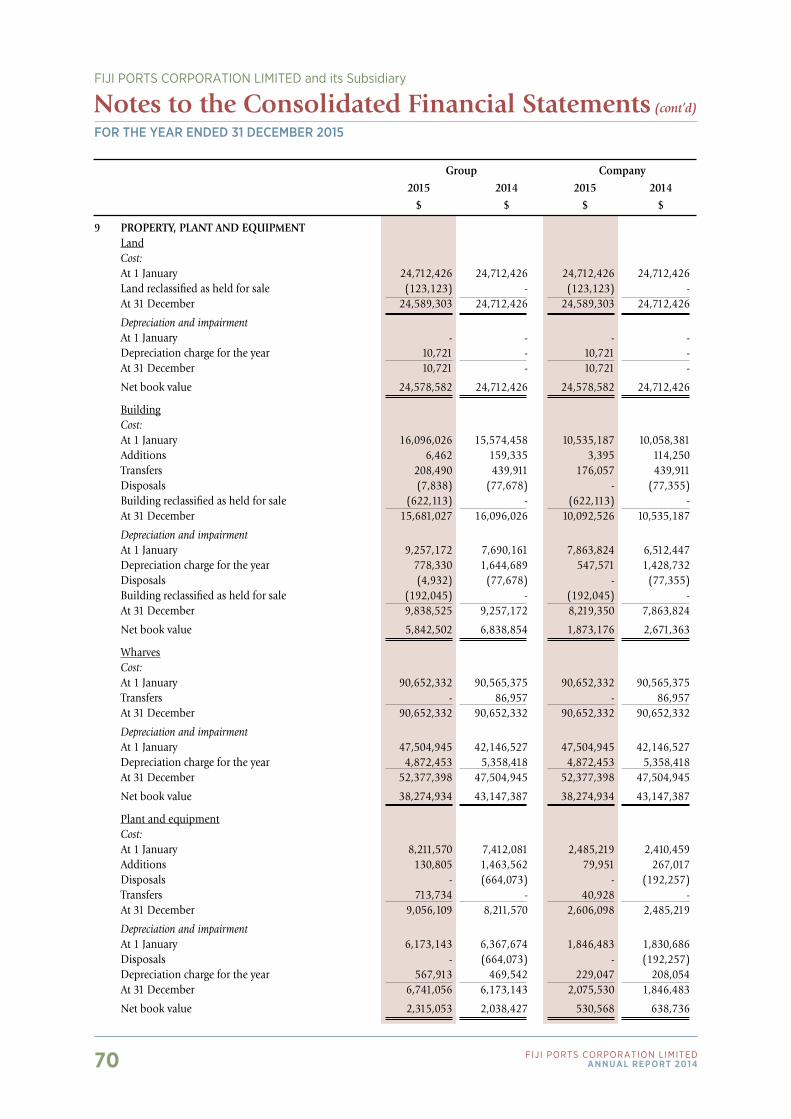
70 Fiji Ports CorPoration LimitedAnnuAl report 2014
Group Company 2015 2014 2015 2014 $ $ $ $
9 PROPERTY, PLANT AND EQUIPMENT Land Cost: At 1 January 24,712,426 24,712,426 24,712,426 24,712,426 Land reclassified as held for sale (123,123) - (123,123) - At 31 December 24,589,303 24,712,426 24,589,303 24,712,426
Depreciation and impairment At 1 January - - - - Depreciation charge for the year 10,721 - 10,721 - At 31 December 10,721 - 10,721 -
Net book value 24,578,582 24,712,426 24,578,582 24,712,426
Building Cost: At 1 January 16,096,026 15,574,458 10,535,187 10,058,381 Additions 6,462 159,335 3,395 114,250 Transfers 208,490 439,911 176,057 439,911 Disposals (7,838) (77,678) - (77,355) Building reclassified as held for sale (622,113) - (622,113) - At 31 December 15,681,027 16,096,026 10,092,526 10,535,187
Depreciation and impairment At 1 January 9,257,172 7,690,161 7,863,824 6,512,447 Depreciation charge for the year 778,330 1,644,689 547,571 1,428,732 Disposals (4,932) (77,678) - (77,355) Building reclassified as held for sale (192,045) - (192,045) - At 31 December 9,838,525 9,257,172 8,219,350 7,863,824
Net book value 5,842,502 6,838,854 1,873,176 2,671,363
Wharves Cost: At 1 January 90,652,332 90,565,375 90,652,332 90,565,375 Transfers - 86,957 - 86,957 At 31 December 90,652,332 90,652,332 90,652,332 90,652,332
Depreciation and impairment At 1 January 47,504,945 42,146,527 47,504,945 42,146,527 Depreciation charge for the year 4,872,453 5,358,418 4,872,453 5,358,418 At 31 December 52,377,398 47,504,945 52,377,398 47,504,945
Net book value 38,274,934 43,147,387 38,274,934 43,147,387
Plant and equipment Cost: At 1 January 8,211,570 7,412,081 2,485,219 2,410,459 Additions 130,805 1,463,562 79,951 267,017 Disposals - (664,073) - (192,257) Transfers 713,734 - 40,928 - At 31 December 9,056,109 8,211,570 2,606,098 2,485,219
Depreciation and impairment At 1 January 6,173,143 6,367,674 1,846,483 1,830,686 Disposals - (664,073) - (192,257) Depreciation charge for the year 567,913 469,542 229,047 208,054 At 31 December 6,741,056 6,173,143 2,075,530 1,846,483
Net book value 2,315,053 2,038,427 530,568 638,736
For the Year ended 31 december 2015
Notes to the Consolidated Financial Statements (cont’d)
FIjI PorTS CorPorATIon LIMITED and its Subsidiary
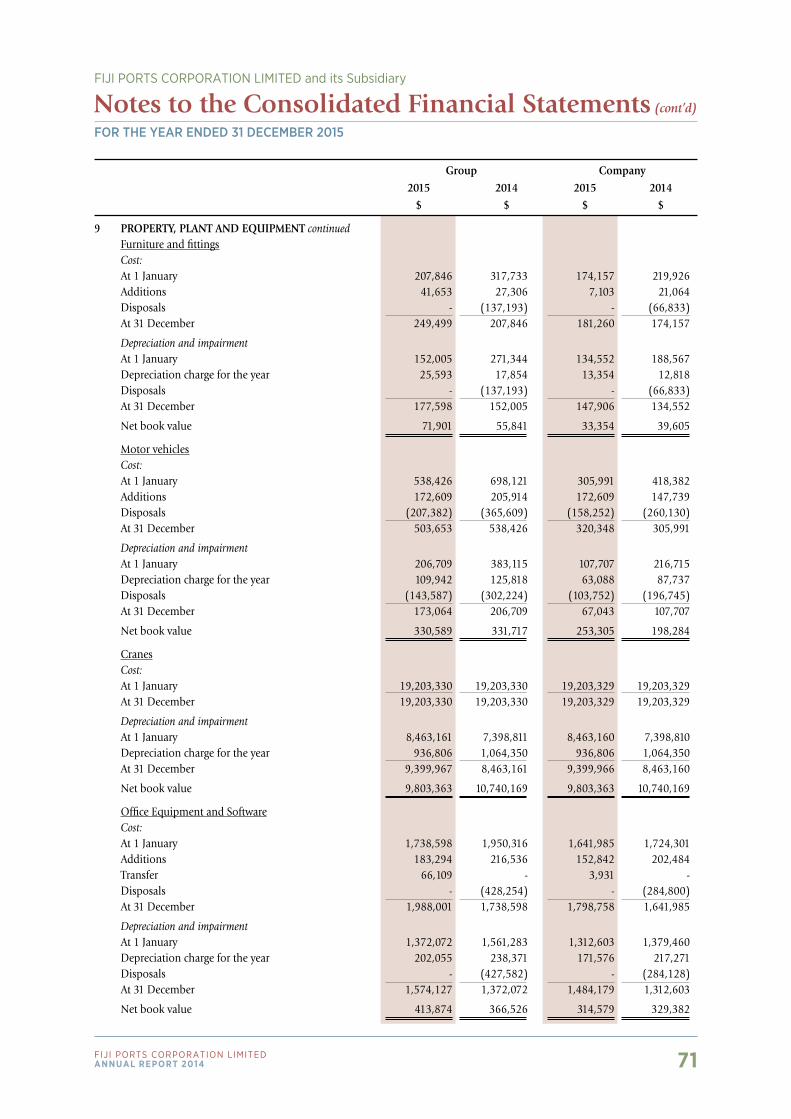
71Fiji Ports CorPoration LimitedAnnuAl report 2014
For the Year ended 31 december 2015
Notes to the Consolidated Financial Statements (cont’d)
FIjI PorTS CorPorATIon LIMITED and its Subsidiary
Group Company 2015 2014 2015 2014 $ $ $ $
9 PROPERTY, PLANT AND EQUIPMENT continued Furniture and fittings Cost: At 1 January 207,846 317,733 174,157 219,926 Additions 41,653 27,306 7,103 21,064 Disposals - (137,193) - (66,833) At 31 December 249,499 207,846 181,260 174,157
Depreciation and impairment At 1 January 152,005 271,344 134,552 188,567 Depreciation charge for the year 25,593 17,854 13,354 12,818 Disposals - (137,193) - (66,833) At 31 December 177,598 152,005 147,906 134,552
Net book value 71,901 55,841 33,354 39,605
Motor vehicles Cost: At 1 January 538,426 698,121 305,991 418,382 Additions 172,609 205,914 172,609 147,739 Disposals (207,382) (365,609) (158,252) (260,130) At 31 December 503,653 538,426 320,348 305,991
Depreciation and impairment At 1 January 206,709 383,115 107,707 216,715 Depreciation charge for the year 109,942 125,818 63,088 87,737 Disposals (143,587) (302,224) (103,752) (196,745) At 31 December 173,064 206,709 67,043 107,707
Net book value 330,589 331,717 253,305 198,284
Cranes Cost: At 1 January 19,203,330 19,203,330 19,203,329 19,203,329 At 31 December 19,203,330 19,203,330 19,203,329 19,203,329
Depreciation and impairment At 1 January 8,463,161 7,398,811 8,463,160 7,398,810 Depreciation charge for the year 936,806 1,064,350 936,806 1,064,350 At 31 December 9,399,967 8,463,161 9,399,966 8,463,160
Net book value 9,803,363 10,740,169 9,803,363 10,740,169
Office Equipment and Software Cost: At 1 January 1,738,598 1,950,316 1,641,985 1,724,301 Additions 183,294 216,536 152,842 202,484 Transfer 66,109 - 3,931 - Disposals - (428,254) - (284,800) At 31 December 1,988,001 1,738,598 1,798,758 1,641,985
Depreciation and impairment At 1 January 1,372,072 1,561,283 1,312,603 1,379,460 Depreciation charge for the year 202,055 238,371 171,576 217,271 Disposals - (427,582) - (284,128) At 31 December 1,574,127 1,372,072 1,484,179 1,312,603
Net book value 413,874 366,526 314,579 329,382
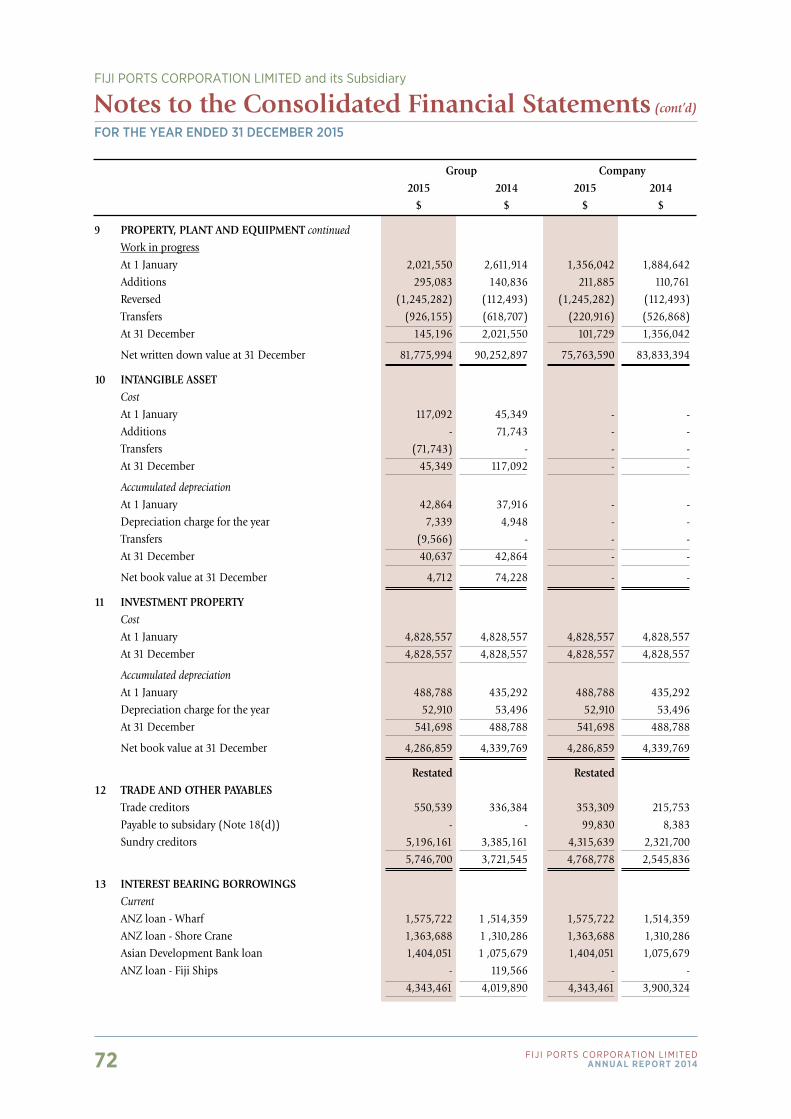
72 Fiji Ports CorPoration LimitedAnnuAl report 2014
Group Company 2015 2014 2015 2014 $ $ $ $
9 PROPERTY, PLANT AND EQUIPMENT continued
Work in progress
At 1 January 2,021,550 2,611,914 1,356,042 1,884,642
Additions 295,083 140,836 211,885 110,761
Reversed (1,245,282) (112,493) (1,245,282) (112,493)
Transfers (926,155) (618,707) (220,916) (526,868)
At 31 December 145,196 2,021,550 101,729 1,356,042
Net written down value at 31 December 81,775,994 90,252,897 75,763,590 83,833,394
10 INTANGIBLE ASSET Cost
At 1 January 117,092 45,349 - -
Additions - 71,743 - -
Transfers (71,743) - - -
At 31 December 45,349 117,092 - -
Accumulated depreciation
At 1 January 42,864 37,916 - -
Depreciation charge for the year 7,339 4,948 - -
Transfers (9,566) - - -
At 31 December 40,637 42,864 - -
Net book value at 31 December 4,712 74,228 - -
11 INVESTMENT PROPERTY Cost
At 1 January 4,828,557 4,828,557 4,828,557 4,828,557
At 31 December 4,828,557 4,828,557 4,828,557 4,828,557
Accumulated depreciation
At 1 January 488,788 435,292 488,788 435,292
Depreciation charge for the year 52,910 53,496 52,910 53,496
At 31 December 541,698 488,788 541,698 488,788
Net book value at 31 December 4,286,859 4,339,769 4,286,859 4,339,769
Restated Restated12 TRADE AND OTHER PAYABLES Trade creditors 550,539 336,384 353,309 215,753
Payable to subsidary (Note 18(d)) - - 99,830 8,383
Sundry creditors 5,196,161 3,385,161 4,315,639 2,321,700
5,746,700 3,721,545 4,768,778 2,545,836
13 INTEREST BEARING BORROWINGS Current
ANZ loan - Wharf 1,575,722 1 ,514,359 1,575,722 1,514,359
ANZ loan - Shore Crane 1,363,688 1 ,310,286 1,363,688 1,310,286
Asian Development Bank loan 1,404,051 1 ,075,679 1,404,051 1,075,679
ANZ loan - Fiji Ships - 119,566 - -
4,343,461 4,019,890 4,343,461 3,900,324
For the Year ended 31 december 2015
Notes to the Consolidated Financial Statements (cont’d)
FIjI PorTS CorPorATIon LIMITED and its Subsidiary
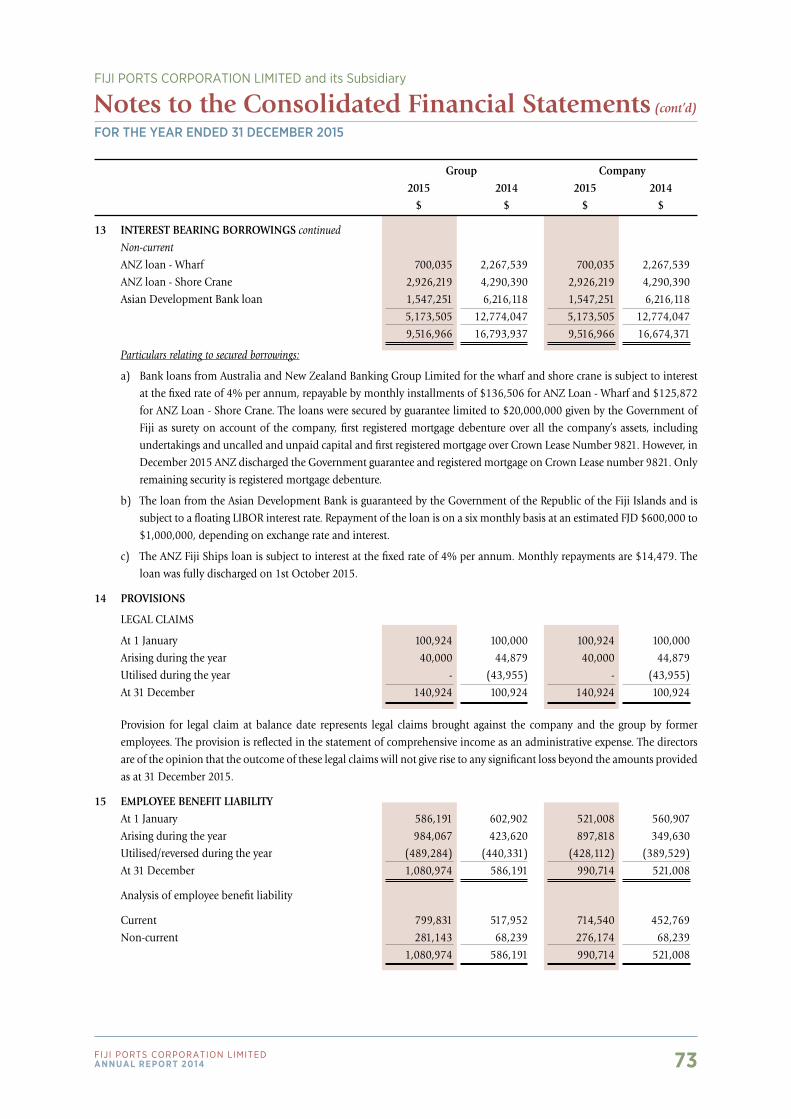
73Fiji Ports CorPoration LimitedAnnuAl report 2014
For the Year ended 31 december 2015
Notes to the Consolidated Financial Statements (cont’d)
FIjI PorTS CorPorATIon LIMITED and its Subsidiary
Group Company 2015 2014 2015 2014 $ $ $ $
13 INTEREST BEARING BORROWINGS continued
Non-current
ANZ loan - Wharf 700,035 2,267,539 700,035 2,267,539
ANZ loan - Shore Crane 2,926,219 4,290,390 2,926,219 4,290,390
Asian Development Bank loan 1,547,251 6,216,118 1,547,251 6,216,118
5,173,505 12,774,047 5,173,505 12,774,047
9,516,966 16,793,937 9,516,966 16,674,371
Particulars relating to secured borrowings:
a) Bank loans from Australia and New Zealand Banking Group Limited for the wharf and shore crane is subject to interest
at the fixed rate of 4% per annum, repayable by monthly installments of $136,506 for ANZ Loan - Wharf and $125,872
for ANZ Loan - Shore Crane. The loans were secured by guarantee limited to $20,000,000 given by the Government of
Fiji as surety on account of the company, first registered mortgage debenture over all the company’s assets, including
undertakings and uncalled and unpaid capital and first registered mortgage over Crown Lease Number 9821. However, in
December 2015 ANZ discharged the Government guarantee and registered mortgage on Crown Lease number 9821. Only
remaining security is registered mortgage debenture.
b) The loan from the Asian Development Bank is guaranteed by the Government of the Republic of the Fiji Islands and is
subject to a floating LIBOR interest rate. Repayment of the loan is on a six monthly basis at an estimated FJD $600,000 to
$1,000,000, depending on exchange rate and interest.
c) The ANZ Fiji Ships loan is subject to interest at the fixed rate of 4% per annum. Monthly repayments are $14,479. The
loan was fully discharged on 1st October 2015.
14 PROVISIONS
LEGAL CLAIMS
At 1 January 100,924 100,000 100,924 100,000
Arising during the year 40,000 44,879 40,000 44,879
Utilised during the year - (43,955) - (43,955)
At 31 December 140,924 100,924 140,924 100,924
Provision for legal claim at balance date represents legal claims brought against the company and the group by former
employees. The provision is reflected in the statement of comprehensive income as an administrative expense. The directors
are of the opinion that the outcome of these legal claims will not give rise to any significant loss beyond the amounts provided
as at 31 December 2015.
15 EMPLOYEE BENEFIT LIABILITY At 1 January 586,191 602,902 521,008 560,907
Arising during the year 984,067 423,620 897,818 349,630
Utilised/reversed during the year (489,284) (440,331) (428,112) (389,529)
At 31 December 1,080,974 586,191 990,714 521,008
Analysis of employee benefit liability
Current 799,831 517,952 714,540 452,769
Non-current 281,143 68,239 276,174 68,239
1,080,974 586,191 990,714 521,008
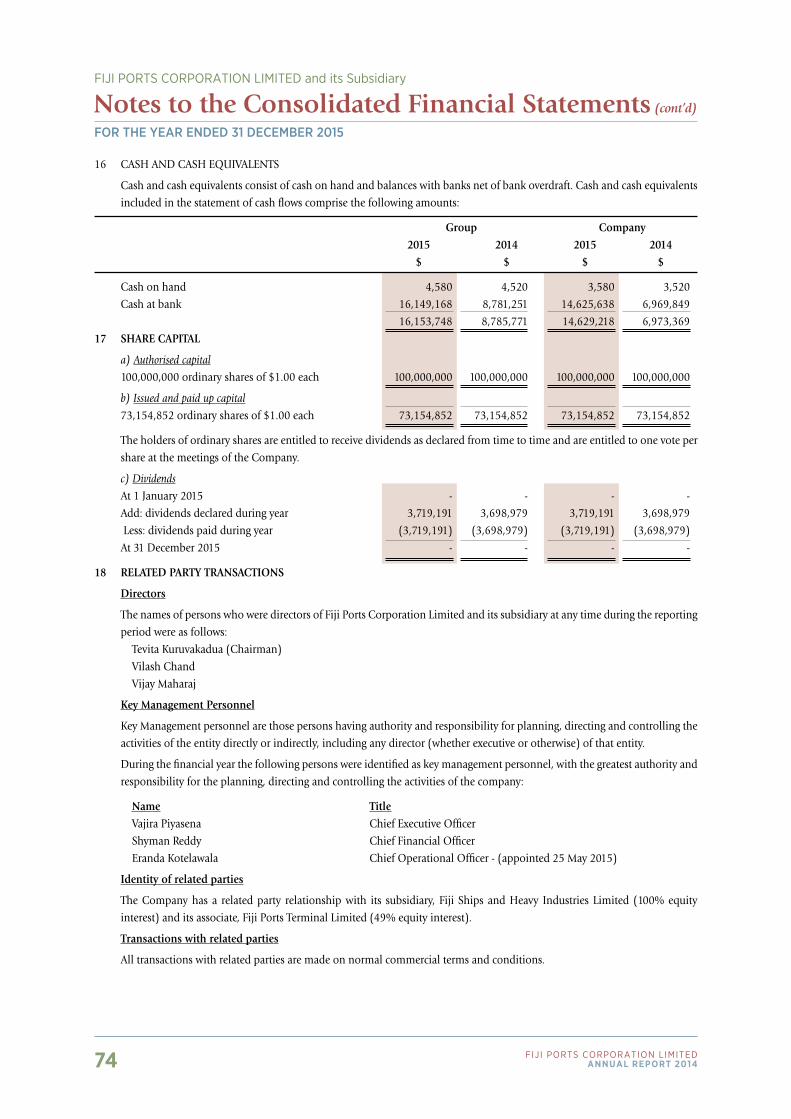
74 Fiji Ports CorPoration LimitedAnnuAl report 2014
16 CASH AND CASH EQUIVALENTS
Cash and cash equivalents consist of cash on hand and balances with banks net of bank overdraft. Cash and cash equivalents
included in the statement of cash flows comprise the following amounts:
Group Company 2015 2014 2015 2014 $ $ $ $
Cash on hand 4,580 4,520 3,580 3,520
Cash at bank 16,149,168 8,781,251 14,625,638 6,969,849
16,153,748 8,785,771 14,629,218 6,973,369
17 SHARE CAPITAL
a) Authorised capital
100,000,000 ordinary shares of $1.00 each 100,000,000 100,000,000 100,000,000 100,000,000
b) Issued and paid up capital
73,154,852 ordinary shares of $1.00 each 73,154,852 73,154,852 73,154,852 73,154,852
The holders of ordinary shares are entitled to receive dividends as declared from time to time and are entitled to one vote per
share at the meetings of the Company.
c) Dividends
At 1 January 2015 - - - -
Add: dividends declared during year 3,719,191 3,698,979 3,719,191 3,698,979
Less: dividends paid during year (3,719,191) (3,698,979) (3,719,191) (3,698,979)
At 31 December 2015 - - - -
18 RELATED PARTY TRANSACTIONS
Directors
The names of persons who were directors of Fiji Ports Corporation Limited and its subsidiary at any time during the reporting
period were as follows:
Tevita Kuruvakadua (Chairman)
Vilash Chand
Vijay Maharaj
Key Management Personnel
Key Management personnel are those persons having authority and responsibility for planning, directing and controlling the
activities of the entity directly or indirectly, including any director (whether executive or otherwise) of that entity.
During the financial year the following persons were identified as key management personnel, with the greatest authority and
responsibility for the planning, directing and controlling the activities of the company:
Name Title Vajira Piyasena Chief Executive Officer
Shyman Reddy Chief Financial Officer
Eranda Kotelawala Chief Operational Officer - (appointed 25 May 2015)
Identity of related parties
The Company has a related party relationship with its subsidiary, Fiji Ships and Heavy Industries Limited (100% equity
interest) and its associate, Fiji Ports Terminal Limited (49% equity interest).
Transactions with related parties
All transactions with related parties are made on normal commercial terms and conditions.
For the Year ended 31 december 2015
Notes to the Consolidated Financial Statements (cont’d)
FIjI PorTS CorPorATIon LIMITED and its Subsidiary
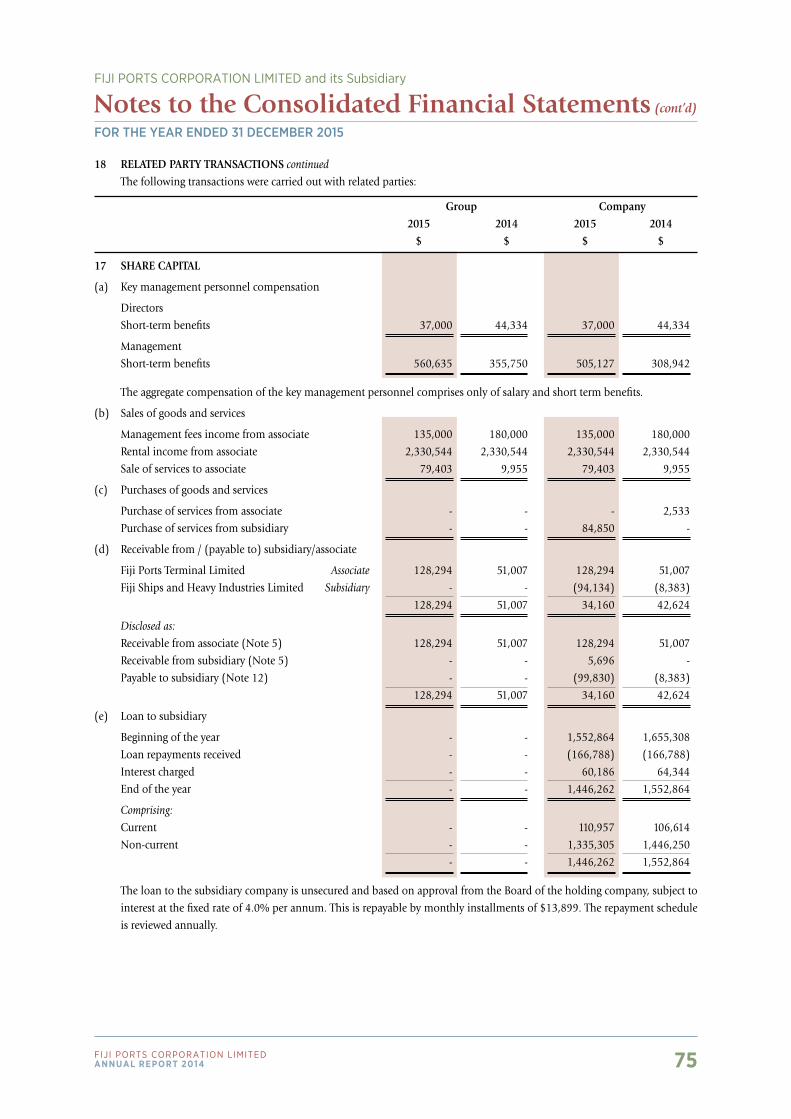
75Fiji Ports CorPoration LimitedAnnuAl report 2014
For the Year ended 31 december 2015
Notes to the Consolidated Financial Statements (cont’d)
FIjI PorTS CorPorATIon LIMITED and its Subsidiary
18 RELATED PARTY TRANSACTIONS continued
The following transactions were carried out with related parties:
Group Company 2015 2014 2015 2014 $ $ $ $
17 SHARE CAPITAL
(a) Key management personnel compensation
Directors
Short-term benefits 37,000 44,334 37,000 44,334
Management
Short-term benefits 560,635 355,750 505,127 308,942
The aggregate compensation of the key management personnel comprises only of salary and short term benefits.
(b) Sales of goods and services
Management fees income from associate 135,000 180,000 135,000 180,000
Rental income from associate 2,330,544 2,330,544 2,330,544 2,330,544
Sale of services to associate 79,403 9,955 79,403 9,955
(c) Purchases of goods and services
Purchase of services from associate - - - 2,533
Purchase of services from subsidiary - - 84,850 -
(d) Receivable from / (payable to) subsidiary/associate
Fiji Ports Terminal Limited Associate 128,294 51,007 128,294 51,007
Fiji Ships and Heavy Industries Limited Subsidiary - - (94,134) (8,383)
128,294 51,007 34,160 42,624
Disclosed as:
Receivable from associate (Note 5) 128,294 51,007 128,294 51,007
Receivable from subsidiary (Note 5) - - 5,696 -
Payable to subsidiary (Note 12) - - (99,830) (8,383)
128,294 51,007 34,160 42,624
(e) Loan to subsidiary
Beginning of the year - - 1,552,864 1,655,308
Loan repayments received - - (166,788) (166,788)
Interest charged - - 60,186 64,344
End of the year - - 1,446,262 1,552,864
Comprising:
Current - - 110,957 106,614
Non-current - - 1,335,305 1,446,250
- - 1,446,262 1,552,864
The loan to the subsidiary company is unsecured and based on approval from the Board of the holding company, subject to
interest at the fixed rate of 4.0% per annum. This is repayable by monthly installments of $13,899. The repayment schedule
is reviewed annually.
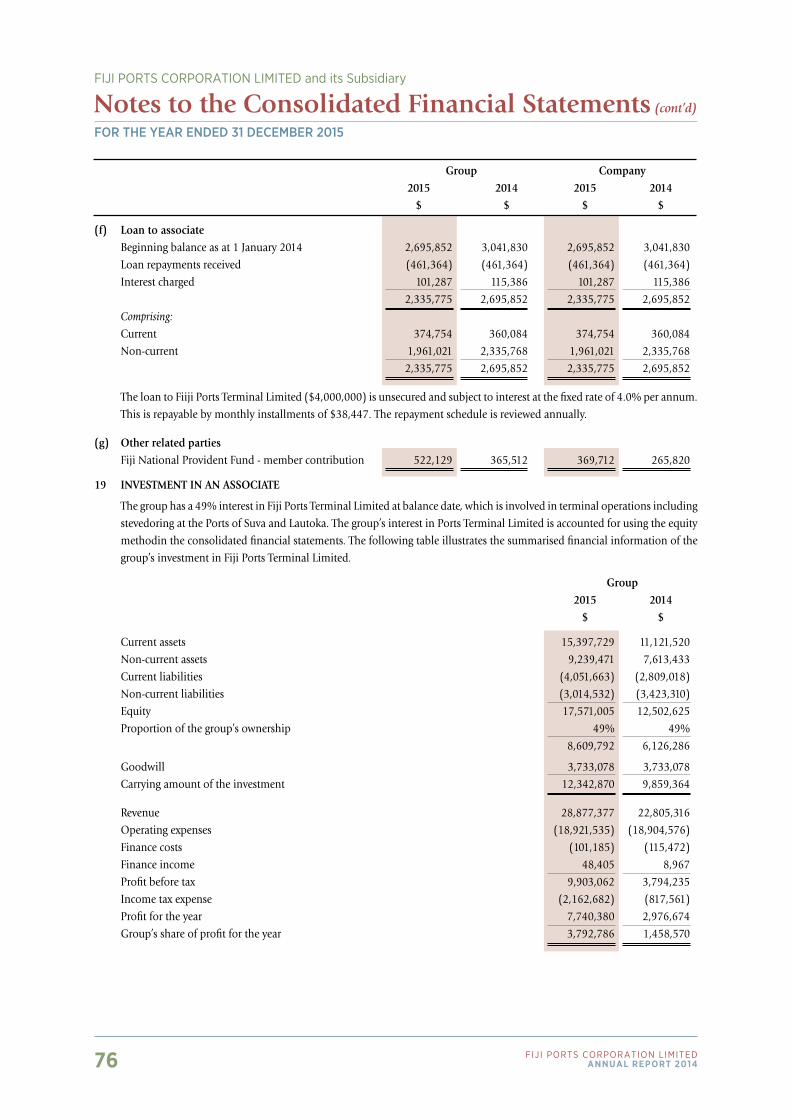
76 Fiji Ports CorPoration LimitedAnnuAl report 2014
For the Year ended 31 december 2015
Notes to the Consolidated Financial Statements (cont’d)
FIjI PorTS CorPorATIon LIMITED and its Subsidiary
Group Company 2015 2014 2015 2014 $ $ $ $
(f) Loan to associate Beginning balance as at 1 January 2014 2,695,852 3,041,830 2,695,852 3,041,830
Loan repayments received (461,364) (461,364) (461,364) (461,364)
Interest charged 101,287 115,386 101,287 115,386
2,335,775 2,695,852 2,335,775 2,695,852
Comprising:
Current 374,754 360,084 374,754 360,084
Non-current 1,961,021 2,335,768 1,961,021 2,335,768
2,335,775 2,695,852 2,335,775 2,695,852
The loan to Fiiji Ports Terminal Limited ($4,000,000) is unsecured and subject to interest at the fixed rate of 4.0% per annum.
This is repayable by monthly installments of $38,447. The repayment schedule is reviewed annually.
(g) Other related parties Fiji National Provident Fund - member contribution 522,129 365,512 369,712 265,820
19 INVESTMENT IN AN ASSOCIATE
The group has a 49% interest in Fiji Ports Terminal Limited at balance date, which is involved in terminal operations including
stevedoring at the Ports of Suva and Lautoka. The group’s interest in Ports Terminal Limited is accounted for using the equity
method in the consolidated financial statements. The following table illustrates the summarised financial information of the
group’s investment in Fiji Ports Terminal Limited.
Group 2015 2014 $ $
Current assets 15,397,729 11,121,520
Non-current assets 9,239,471 7,613,433
Current liabilities (4,051,663) (2,809,018)
Non-current liabilities (3,014,532) (3,423,310)
Equity 17,571,005 12,502,625
Proportion of the group’s ownership 49% 49%
8,609,792 6,126,286
Goodwill 3,733,078 3,733,078
Carrying amount of the investment 12,342,870 9,859,364
Revenue 28,877,377 22,805,316
Operating expenses (18,921,535) (18,904,576)
Finance costs (101,185) (115,472)
Finance income 48,405 8,967
Profit before tax 9,903,062 3,794,235
Income tax expense (2,162,682) (817,561)
Profit for the year 7,740,380 2,976,674
Group’s share of profit for the year 3,792,786 1,458,570
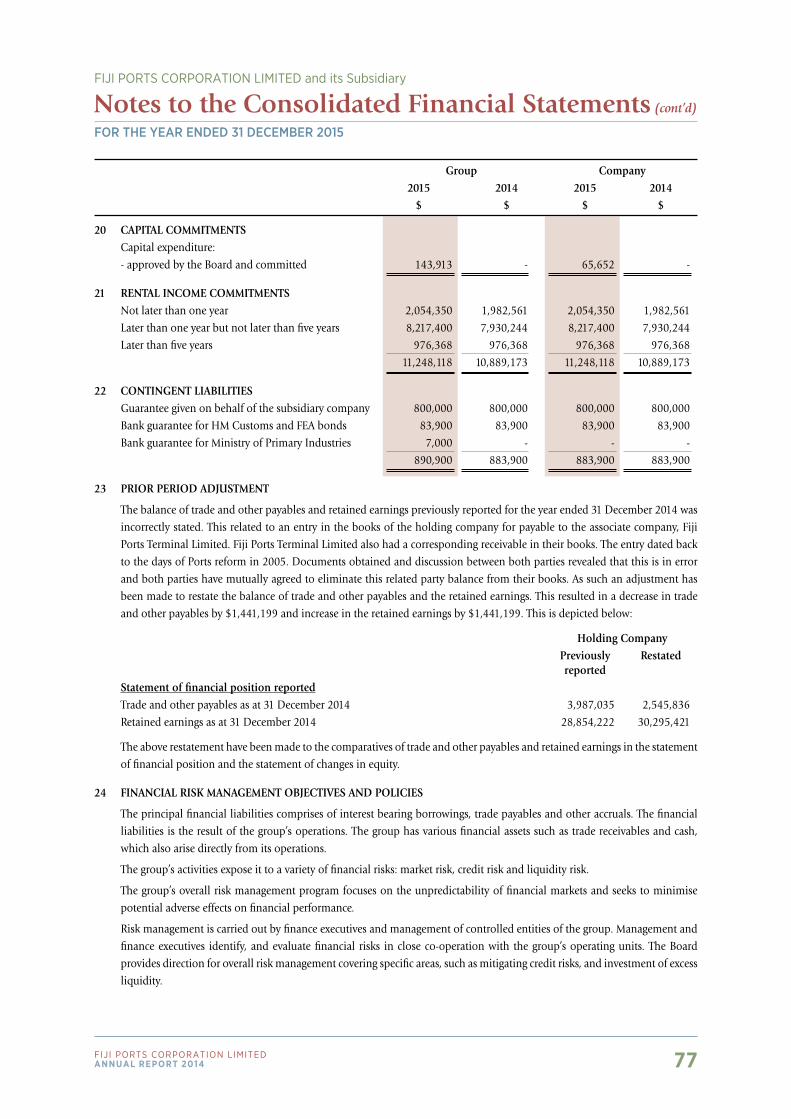
77Fiji Ports CorPoration LimitedAnnuAl report 2014
For the Year ended 31 december 2015
Notes to the Consolidated Financial Statements (cont’d)
FIjI PorTS CorPorATIon LIMITED and its Subsidiary
Group Company 2015 2014 2015 2014 $ $ $ $
20 CAPITAL COMMITMENTS Capital expenditure:
- approved by the Board and committed 143,913 - 65,652 -
21 RENTAL INCOME COMMITMENTS Not later than one year 2,054,350 1,982,561 2,054,350 1,982,561
Later than one year but not later than five years 8,217,400 7,930,244 8,217,400 7,930,244
Later than five years 976,368 976,368 976,368 976,368
11,248,118 10,889,173 11,248,118 10,889,173
22 CONTINGENT LIABILITIES Guarantee given on behalf of the subsidiary company 800,000 800,000 800,000 800,000
Bank guarantee for HM Customs and FEA bonds 83,900 83,900 83,900 83,900
Bank guarantee for Ministry of Primary Industries 7,000 - - -
890,900 883,900 883,900 883,900
23 PRIOR PERIOD ADJUSTMENT
The balance of trade and other payables and retained earnings previously reported for the year ended 31 December 2014 was
incorrectly stated. This related to an entry in the books of the holding company for payable to the associate company, Fiji
Ports Terminal Limited. Fiji Ports Terminal Limited also had a corresponding receivable in their books. The entry dated back
to the days of Ports reform in 2005. Documents obtained and discussion between both parties revealed that this is in error
and both parties have mutually agreed to eliminate this related party balance from their books. As such an adjustment has
been made to restate the balance of trade and other payables and the retained earnings. This resulted in a decrease in trade
and other payables by $1,441,199 and increase in the retained earnings by $1,441,199. This is depicted below:
Holding Company Previously Restated reported Statement of financial position reported Trade and other payables as at 31 December 2014 3,987,035 2,545,836
Retained earnings as at 31 December 2014 28,854,222 30,295,421
The above restatement have been made to the comparatives of trade and other payables and retained earnings in the statement
of financial position and the statement of changes in equity.
24 FINANCIAL RISK MANAGEMENT OBJECTIVES AND POLICIES
The principal financial liabilities comprises of interest bearing borrowings, trade payables and other accruals. The financial
liabilities is the result of the group’s operations. The group has various financial assets such as trade receivables and cash,
which also arise directly from its operations.
The group’s activities expose it to a variety of financial risks: market risk, credit risk and liquidity risk.
The group’s overall risk management program focuses on the unpredictability of financial markets and seeks to minimise
potential adverse effects on financial performance.
Risk management is carried out by finance executives and management of controlled entities of the group. Management and
finance executives identify, and evaluate financial risks in close co-operation with the group’s operating units. The Board
provides direction for overall risk management covering specific areas, such as mitigating credit risks, and investment of excess
liquidity.
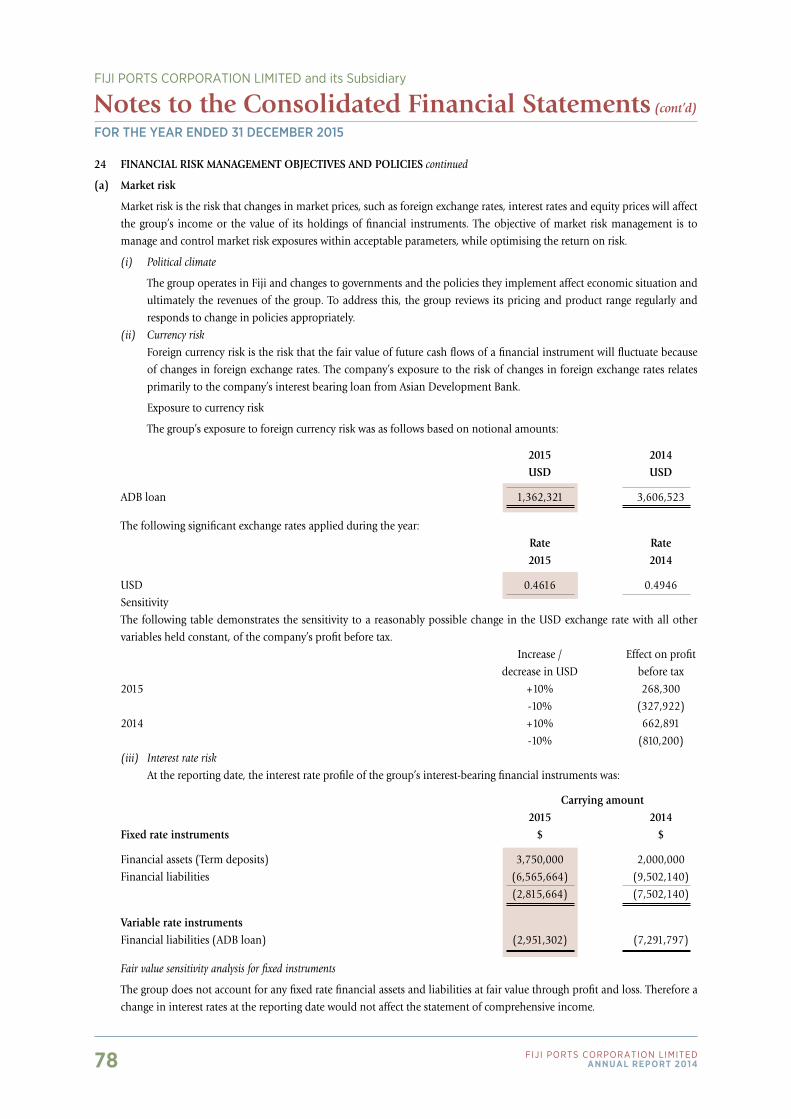
78 Fiji Ports CorPoration LimitedAnnuAl report 2014
24 FINANCIAL RISK MANAGEMENT OBJECTIVES AND POLICIES continued
(a) Market risk
Market risk is the risk that changes in market prices, such as foreign exchange rates, interest rates and equity prices will affect
the group’s income or the value of its holdings of financial instruments. The objective of market risk management is to
manage and control market risk exposures within acceptable parameters, while optimising the return on risk.
(i) Political climate
The group operates in Fiji and changes to governments and the policies they implement affect economic situation and
ultimately the revenues of the group. To address this, the group reviews its pricing and product range regularly and
responds to change in policies appropriately.
(ii) Currency risk
Foreign currency risk is the risk that the fair value of future cash flows of a financial instrument will fluctuate because
of changes in foreign exchange rates. The company’s exposure to the risk of changes in foreign exchange rates relates
primarily to the company’s interest bearing loan from Asian Development Bank.
Exposure to currency risk
The group’s exposure to foreign currency risk was as follows based on notional amounts:
2015 2014 USD USD
ADB loan 1,362,321 3,606,523
The following significant exchange rates applied during the year:
Rate Rate 2015 2014
USD 0.4616 0.4946
Sensitivity
The following table demonstrates the sensitivity to a reasonably possible change in the USD exchange rate with all other
variables held constant, of the company’s profit before tax.
Increase / Effect on profit
decrease in USD before tax
2015 +10% 268,300
-10% (327,922)
2014 +10% 662,891
-10% (810,200)
(iii) Interest rate risk
At the reporting date, the interest rate profile of the group’s interest-bearing financial instruments was:
Carrying amount 2015 2014 Fixed rate instruments $ $
Financial assets (Term deposits) 3,750,000 2,000,000
Financial liabilities (6,565,664) (9,502,140)
(2,815,664) (7,502,140)
Variable rate instruments Financial liabilities (ADB loan) (2,951,302) (7,291,797)
Fair value sensitivity analysis for fixed instruments
The group does not account for any fixed rate financial assets and liabilities at fair value through profit and loss. Therefore a
change in interest rates at the reporting date would not affect the statement of comprehensive income.
For the Year ended 31 december 2015
Notes to the Consolidated Financial Statements (cont’d)
FIjI PorTS CorPorATIon LIMITED and its Subsidiary
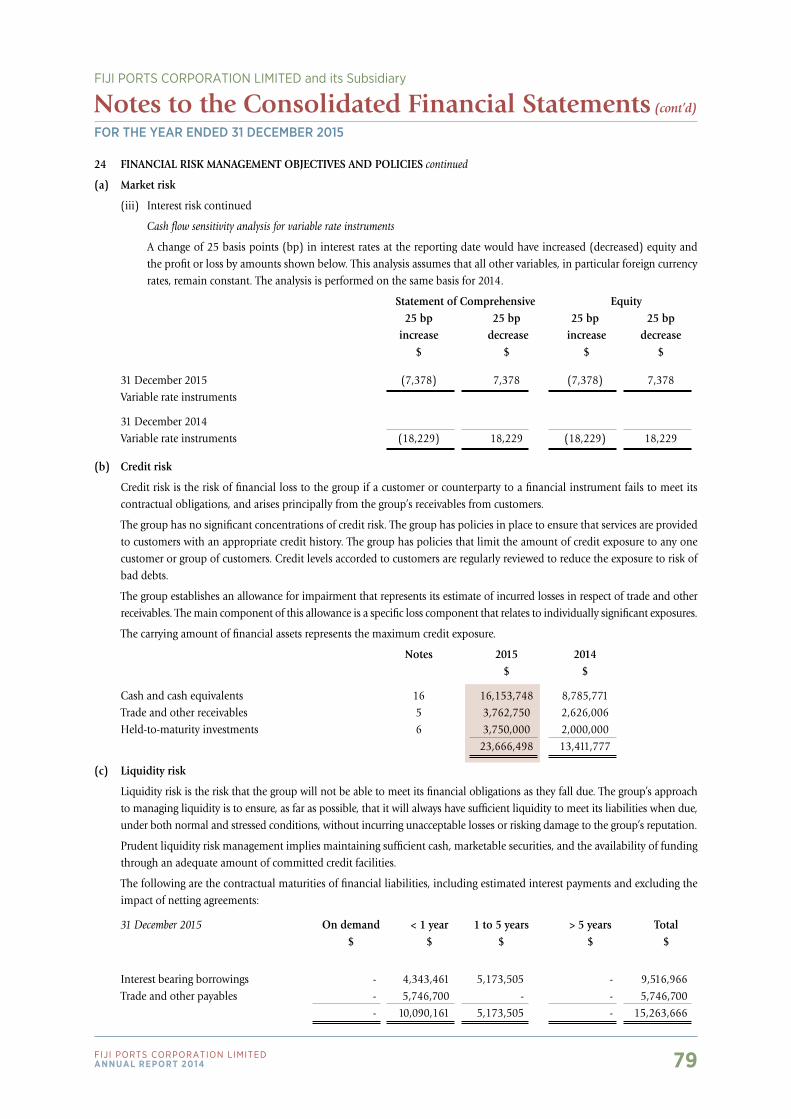
79Fiji Ports CorPoration LimitedAnnuAl report 2014
For the Year ended 31 december 2015
Notes to the Consolidated Financial Statements (cont’d)
FIjI PorTS CorPorATIon LIMITED and its Subsidiary
24 FINANCIAL RISK MANAGEMENT OBJECTIVES AND POLICIES continued
(a) Market risk
(iii) Interest risk continued
Cash flow sensitivity analysis for variable rate instruments
A change of 25 basis points (bp) in interest rates at the reporting date would have increased (decreased) equity and the profit or loss by amounts shown below. This analysis assumes that all other variables, in particular foreign currency rates, remain constant. The analysis is performed on the same basis for 2014.
Statement of Comprehensive Equity 25 bp 25 bp 25 bp 25 bp increase decrease increase decrease $ $ $ $
31 December 2015 (7,378) 7,378 (7,378) 7,378 Variable rate instruments
31 December 2014 Variable rate instruments (18,229) 18,229 (18,229) 18,229
(b) Credit risk
Credit risk is the risk of financial loss to the group if a customer or counterparty to a financial instrument fails to meet its contractual obligations, and arises principally from the group’s receivables from customers.
The group has no significant concentrations of credit risk. The group has policies in place to ensure that services are provided to customers with an appropriate credit history. The group has policies that limit the amount of credit exposure to any one customer or group of customers. Credit levels accorded to customers are regularly reviewed to reduce the exposure to risk of bad debts.
The group establishes an allowance for impairment that represents its estimate of incurred losses in respect of trade and other receivables. The main component of this allowance is a specific loss component that relates to individually significant exposures.
The carrying amount of financial assets represents the maximum credit exposure.
Notes 2015 2014 $ $
Cash and cash equivalents 16 16,153,748 8,785,771 Trade and other receivables 5 3,762,750 2,626,006 Held-to-maturity investments 6 3,750,000 2,000,000 23,666,498 13,411,777
(c) Liquidity risk
Liquidity risk is the risk that the group will not be able to meet its financial obligations as they fall due. The group’s approach to managing liquidity is to ensure, as far as possible, that it will always have sufficient liquidity to meet its liabilities when due, under both normal and stressed conditions, without incurring unacceptable losses or risking damage to the group’s reputation.
Prudent liquidity risk management implies maintaining sufficient cash, marketable securities, and the availability of funding through an adequate amount of committed credit facilities.
The following are the contractual maturities of financial liabilities, including estimated interest payments and excluding the impact of netting agreements:
31 December 2015 On demand < 1 year 1 to 5 years > 5 years Total $ $ $ $ $
Interest bearing borrowings - 4,343,461 5,173,505 - 9,516,966 Trade and other payables - 5,746,700 - - 5,746,700 - 10,090,161 5,173,505 - 15,263,666
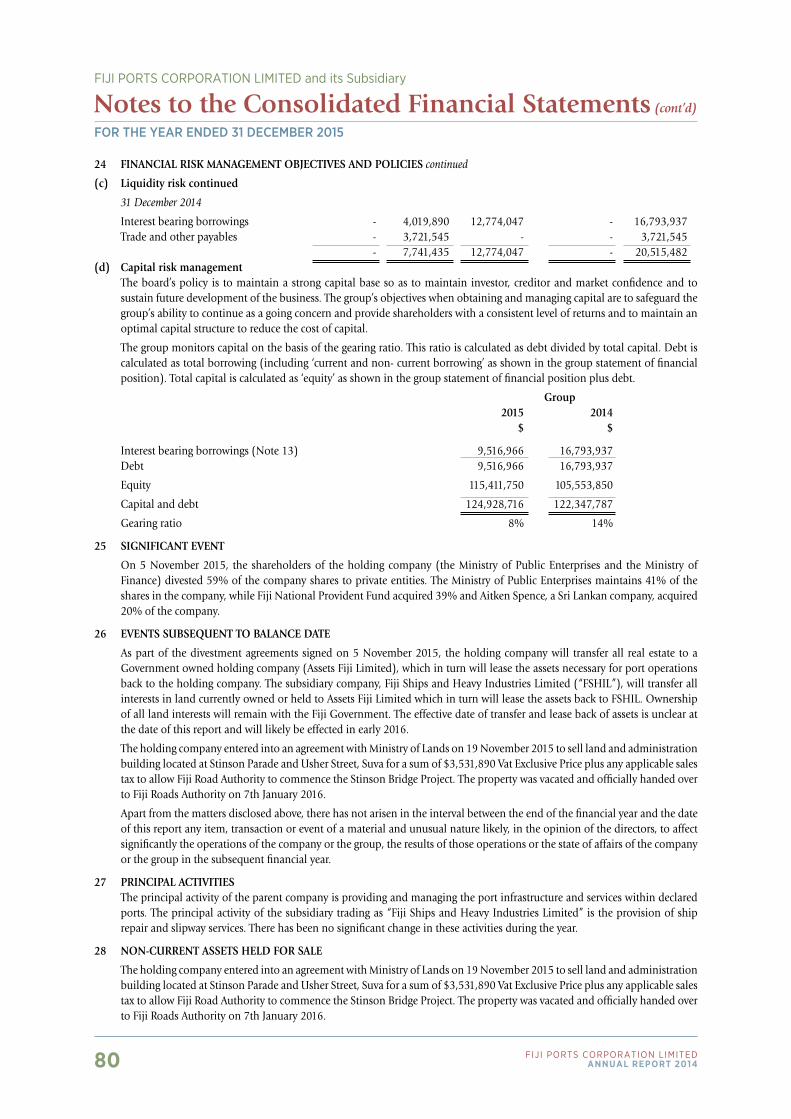
80 Fiji Ports CorPoration LimitedAnnuAl report 2014
24 FINANCIAL RISK MANAGEMENT OBJECTIVES AND POLICIES continued
(c) Liquidity risk continued
31 December 2014
Interest bearing borrowings - 4,019,890 12,774,047 - 16,793,937 Trade and other payables - 3,721,545 - - 3,721,545 - 7,741,435 12,774,047 - 20,515,482(d) Capital risk management The board’s policy is to maintain a strong capital base so as to maintain investor, creditor and market confidence and to
sustain future development of the business. The group’s objectives when obtaining and managing capital are to safeguard the group’s ability to continue as a going concern and provide shareholders with a consistent level of returns and to maintain an optimal capital structure to reduce the cost of capital.
The group monitors capital on the basis of the gearing ratio. This ratio is calculated as debt divided by total capital. Debt is calculated as total borrowing (including ‘current and non- current borrowing’ as shown in the group statement of financial position). Total capital is calculated as ‘equity’ as shown in the group statement of financial position plus debt.
Group 2015 2014 $ $
Interest bearing borrowings (Note 13) 9,516,966 16,793,937 Debt 9,516,966 16,793,937
Equity 115,411,750 105,553,850
Capital and debt 124,928,716 122,347,787
Gearing ratio 8% 14%
25 SIGNIFICANT EVENT
On 5 November 2015, the shareholders of the holding company (the Ministry of Public Enterprises and the Ministry of Finance) divested 59% of the company shares to private entities. The Ministry of Public Enterprises maintains 41% of the shares in the company, while Fiji National Provident Fund acquired 39% and Aitken Spence, a Sri Lankan company, acquired 20% of the company.
26 EVENTS SUBSEQUENT TO BALANCE DATE
As part of the divestment agreements signed on 5 November 2015, the holding company will transfer all real estate to a Government owned holding company (Assets Fiji Limited), which in turn will lease the assets necessary for port operations back to the holding company. The subsidiary company, Fiji Ships and Heavy Industries Limited (“FSHIL”), will transfer all interests in land currently owned or held to Assets Fiji Limited which in turn will lease the assets back to FSHIL. Ownership of all land interests will remain with the Fiji Government. The effective date of transfer and lease back of assets is unclear at the date of this report and will likely be effected in early 2016.
The holding company entered into an agreement with Ministry of Lands on 19 November 2015 to sell land and administration building located at Stinson Parade and Usher Street, Suva for a sum of $3,531,890 Vat Exclusive Price plus any applicable sales tax to allow Fiji Road Authority to commence the Stinson Bridge Project. The property was vacated and officially handed over to Fiji Roads Authority on 7th January 2016.
Apart from the matters disclosed above, there has not arisen in the interval between the end of the financial year and the date of this report any item, transaction or event of a material and unusual nature likely, in the opinion of the directors, to affect significantly the operations of the company or the group, the results of those operations or the state of affairs of the company or the group in the subsequent financial year.
27 PRINCIPAL ACTIVITIES The principal activity of the parent company is providing and managing the port infrastructure and services within declared
ports. The principal activity of the subsidiary trading as “Fiji Ships and Heavy Industries Limited” is the provision of ship repair and slipway services. There has been no significant change in these activities during the year.
28 NON-CURRENT ASSETS HELD FOR SALE
The holding company entered into an agreement with Ministry of Lands on 19 November 2015 to sell land and administration building located at Stinson Parade and Usher Street, Suva for a sum of $3,531,890 Vat Exclusive Price plus any applicable sales tax to allow Fiji Road Authority to commence the Stinson Bridge Project. The property was vacated and officially handed over to Fiji Roads Authority on 7th January 2016.
For the Year ended 31 december 2015
Notes to the Consolidated Financial Statements (cont’d)
FIjI PorTS CorPorATIon LIMITED and its Subsidiary


Fiji Ports Corporation Limited