fifth framework programme thematic programme: energy ... · fifth framework programme thematic...
TRANSCRIPT
Fifth Framework Programme
Thematic Programme: Energy Environment and Sustainable Development
ISHTAR PROJECT
EVK4-CT-2000-00034
Integrated Software for Health, Transport efficiency and Artistic heritage Recovery
Deliverable 11.6
PUBLISHABLE FINAL REPORT
FINAL DRAFT
Authors : ISHTAR Partners
Editors : A. Agostini; S. Fanou; E. Negrenti (ENEA)
Issued by : ENEA
November 2005

ISHTAR Project Publishable Final Report
2
ISHTAR Project Publishable Final Report
3
Foreword Citizens’ health and monuments are every day attacked by air pollution and noise, and traffic congestion causes stress to citizens and economic inefficiency. Most of the difficulties encountered in planning improvements in urban mobility and environment are due to the absence of multidisciplinary integrated tools allowing, during the decision making process, to take into account all the effects (on economy, environment, health and monuments) of the measures under analysis. Hence, the European Commission co-funded (5th FP EESD Programme, Key Action ‘City of Tomorrow and cultural heritage’) the ISHTAR Project (Integrated Software for Health, Transport efficiency and Artistic Heritage Recovery), coordinated by ENEA and involving a total of 19 European organisations.
Abstract The ISHTAR Project aims at building an innovative decision support tool for advanced urban planning and management through the integrated analysis of the various environmental effects of technical and non technical measures. The suite includes both existing and newly developed models, covering the areas of citizens behaviour, transport, vehicles safety and emissions of pollutants and noise, pollutants dispersion and noise propagation, exposure to pollutants, noise and accident and related risk assessment, impacts on monuments assessment and a tool for the overall analysis. These modules are integrated by a software Manager, a Suite Data Base, a commercial Geographic information System and a user-friendly interface. This integration represents a significant technical achievement. Standard models suites normally include only a few of these models. The suite represents a strong enlargement of the applicability area of urban planning tools, since with this kind of ‘multi-impacts’ software tool the user is able to analyse in an integrated and ‘coherent’ way the various aspects of ‘global’ urban policies, without having to perform separate studies relying on different input information and so providing less credible conclusions. Besides the modelling and software integration, the scientific core value of the ISHTAR Suite is represented by a few crucial modelling developments that can be summarized as: prediction of the effects of citizens reaction to postulated measures; improvement of the vehicle emissions modelling; development of an urban road safety model; detailed estimate of pollution effects on citizens health based on the analysis of population groups movements during the day and the temporal-spatial maps of air pollution and noise. The high spatial and temporal flexibility in the use of the Suite maximizes the possibility of application from local short-term actions to widespread long-term policies, thus being of interest for different categories of users. The suite and its internal modules have been tested in the seven sites involved in the ISHTAR Project: Athens and Attiki region, Bologna Province, Brussels, Graz, Grenoble, Paris and Rome.
Acknowledgments The first acknowledgement goes to the European Commission for the trust they gave to a consortium proposing a challenging project considered by several of the partners themselves as too ambitious for really being able to get concrete results. In particular all the partners wish to thank our Project Officer for the patience and the professionalism adopted for supporting project partners in the difficult moments of ISHTAR project life. Acknowledgements are here made also to the nineteen companies having contributed to the building up of a successful proposal and having enthusiastically carried on the research activities, notwithstanding the difficulties and the internal conflicts that had to be overcome for the fulfilment of all the project objectives.
ISHTAR Project Publishable Final Report
4
Table of Contents Foreword................................................................................................................................................ 3 Abstract.................................................................................................................................................. 3 Acknowledgments................................................................................................................................. 3 Table of Contents.................................................................................................................................. 4 Executive summary............................................................................................................................... 6
Methodology ..................................................................................................................................... 6 Project results .................................................................................................................................... 7 Case Studies ...................................................................................................................................... 9 Summary Conclusions...................................................................................................................... 9
Abbreviations and Acronyms............................................................................................................. 10 PART I – Why the ISHTAR project ? ................................................................................................... 11
1.1 Social and Technical contexts................................................................................................ 11 1.2 Objectives of the project ....................................................................................................... 12 1.3 Structure of ISHTAR project................................................................................................. 13
1.3.1 The overall methodology ............................................................................................... 13 1.3.2 Roles of the various WPs in the overall design of ISHTAR ....................................... 14 1.3.3 ISHTAR Work-programme.......................................................................................... 16
PART II – Methodologies for integrated planning and assessment..................................................... 20 2.1 From single impacts evaluation to integrated analysis......................................................... 20 2.2 Policies and Behaviour of people .......................................................................................... 22 2.3 Transport modelling ............................................................................................................... 24 2.4 Transport Direct Impacts modelling..................................................................................... 27 2.5 Air Pollutants Dispersion modelling .................................................................................... 29 2.6 Noise Propagation modelling................................................................................................. 31 2.7 Population Exposure modelling............................................................................................. 33 2.8 Health Impacts modelling ..................................................................................................... 34 2.9 Monuments damage modelling.............................................................................................. 36 2.10 Overall analysis of policy scenarios...................................................................................... 38 2.11 Models integration approach ................................................................................................. 40
2.11.1 Message communication.................................................................................................... 40 2.11.2 Processes monitoring........................................................................................................... 40
PART III – ISHTAR suite software realisation .................................................................................... 41 3.1 ISHTAR suite architecture..................................................................................................... 41
3.1.1 General composition of Ishtar Suite.................................................................................... 41 3.1.2 Realisation of data exchanges by use of tool connectors.................................................... 41
3.2 ISHTAR suite user interface .................................................................................................. 43 3.2.1 The BOARD ......................................................................................................................... 43 3.2.2 The graphical user interface.................................................................................................. 44
3.3 ISHTAR Data Model & Time Loop Description ................................................................. 45 3.4 Cellular Transport Methodology (CTM) description........................................................... 47 3.5 VISUPOLIS description........................................................................................................ 49 3.6 Transport Energy Environment (TEE) software description.............................................. 51 3.7 ARIA IMPACT description.................................................................................................. 54 3.8 SOUNDPLAN description.................................................................................................... 56 3.9 Transport EXposure (TEX) description............................................................................... 58 3.10 Health Impact of Transport (HIT) description..................................................................... 59
ISHTAR Project Publishable Final Report
5
3.11 MOnuments DAmage (MODA) description ........................................................................ 61 3.12 Model for Overall Scenario Evaluation and Synthesis (MOSES) software description.... 63
PART IV – Suite and modules applications.......................................................................................... 67 4.1 Cases studies introduction...................................................................................................... 67
4.1.1 Attica Region case study................................................................................................ 70 4.1.2 Bologna Province case study......................................................................................... 75 4.1.3 Brussels case study......................................................................................................... 80 4.1.4 Graz case study............................................................................................................... 84 4.1.5 Grenoble case study ....................................................................................................... 89 4.1.6 Paris case study .............................................................................................................. 93 4.1.7 Rome case study............................................................................................................. 97
4.2 Application conclusions....................................................................................................... 104 PART V – Conclusions......................................................................................................................... 105
5.1 Achievements of objectives ................................................................................................. 105 5.2 Exploitation Plans................................................................................................................. 107 5.3 Recommendations and Further Work ................................................................................. 107
PART VI : References .......................................................................................................................... 108 Appendices .................................................................................................................................... 109 App1 : ISHTAR Flow Chart ....................................................................................................... 110 App2 : Contacts Details ............................................................................................................... 121
ISHTAR Project Publishable Final Report
6
Executive summary The Project ISHTAR [1] aimed at building an Integrated Suite of software models for assessing the impacts of various types of urban policies and actions on the quality of life of citizens, and in particular on traffic congestion, air quality, citizens health and conservation of cultural heritage. The ISHTAR Project (Negrenti [2]) has several scientific and technological objectives: • The integration of a large number of software tools and the creation of specific modules for the simulation of key processes such as transport behaviour and its direct impacts on the urban environment. • The achievement of a high spatial and temporal flexibility in the use of the tool, for maximizing the possibilities of application from local short-term actions to widespread long-term policies. • Development of specific modelling areas such as the representation of policies effects on citizens behaviour, the integrated 24 hours simulation of traffic emissions, noise and safety, and the microscopic analysis of air pollution effects on health and monuments. The exploitation of the models suite has begun within the Project with the application of the tool to the analysis of measures tested or planned in the seven involved cities: Athens, Bologna, Brussels, Graz, Grenoble, Paris and Rome.
Methodology Integration of a relevant number of modelling tools The ISHTAR Suite is based on a high number of software tools whose aim is the modelling of various aspects of the impact analysis of short-term actions and long-term policies. Standard models suites normally include only a few of those models. It also represents a strong enlargement of the applicability area, since with this kind of ‘multi-impacts’ suite the users is able to analyse in an integrated and ‘coherent’ way the various aspects of ‘global’ urban policies, without having to perform separate studies relying on different input information providing very likely less credible conclusions. The wide scope of applicability offers the potential for easing the cooperation between different departments in municipal authorities: in fact the tool will be of interest for various activities of planning and assessment in the transport, environment, health and artistic heritage sectors. Evolution of modelling techniques in crucial impact areas The scientific core value of the ISHTAR Suite is largely linked to a few crucial modelling developments on which the accuracy and the significance of the results deriving from the Suite application strongly depend. These areas of ‘modelling development’ can be summarized as: a) prediction of the effects of citizens reaction to postulated measures. b) improvement of the modelling of vehicle emissions, particularly concerning the consideration of speed variability along the network links, and the spatial-temporal distribution of ‘cold-emissions’ depending on the representation of trip origins (e.g. parking places). c) development of an urban road safety model, which can take into account the variable flow and speed levels in the network and the adverse factors such as the presence of intersections. d) detailed estimate of pollution effects on citizens health based on the analysis of population groups movements during the day and the temporal-spatial maps of air pollution and noise.
ISHTAR Project Publishable Final Report
7
Realisation of integrated specific modules inside the suite The ISHTAR Suite is globally aiming at the highest flexibility of use: this is particularly reflected in some of the tools. The choice of building an ‘Integrated Transport Module’ which makes use of different models, having complementary characteristics in terms of applicability field, is of particular significance. Also relevant is the consequence of this flexibility in transport modelling: the downstream models (emission, noise, safety, exposure models) will have to be flexible in their input characteristics in order to give the proper accuracy whichever transport model is used in a given analysis. This implies the use of ‘advanced’ emission, noise and safety models capable of treating flexible input information. The suite includes a module dedicated to the direct impacts of traffic: emissions, noise and accidents. This module is based on such common and flexible traffic input. Also the module dedicated to the overall evaluation of the policy scenarios includes parallel elements: in this case a Cost Benefit Analysis tool is complemented by a Multi criteria Analysis software. Space and time total flexibility Among the crucial characteristics of the ISHTAR Suite, a total flexibility in space and time plays an essential role. The starting point for the achievement of this goal was the realization of the so called 24 hours capability’: traffic flows, vehicles speed, emissions, noise levels, pollution levels are calculated (when needed) hour by hour thanks to the characteristics of the citizens behaviour, transport, emission, noise and dispersion models that have been selected or developed. This flexibility enhances the scope of applicability of the tool that can be used for both short term scenarios and measures having a longer time horizon (months, year).
Project results The ISHTAR Suite (Negrenti [3]) was built over the following software modules including one or more software tools. The Cellular Transport Methodology The Cellular Transport Methodology (CTM) is a completely new software tool developed by ISIS (Italy) that simulates the effects of policies and measures on the behaviour of citizens in terms of movements, mainly producing the modified Origin-Destination matrices. This tool is considered as an ‘ancillary element’ of the suite because it is likely that the city teams wishing to use the ISHTAR software will already have a ‘mobility demand model’ or alternative techniques for estimating the modification of the trip matrices. The Transport toolbox After an analysis of the available transport models, the VISUPOLIS model has been described as the best tool to integrate within the suite. This model, rather recent, has been developed by PTV (Germany) integrating VISUM and the innovative tool ‘Metropolis’ by Prof. A. De Palma from the University of Clergy Pontoise (F). However the potential users are free to continue to use their own traffic model (as most of the cities participating in ISHTAR Project). VISUPOLIS is going to be tested in the Paris case study. It is likely that a significant fraction of the future users of the suite will use the PTV software, while the majority of the user will have their own traffic model and will have to export the related output into the ISHTAR database. The Transport Direct impacts module The direct impact model chosen for the suite is TEE2004, developed by ENEA and ASTRAN (Italy). This tool is particularly flexible in terms of space and time, includes advanced modelling of
ISHTAR Project Publishable Final Report
8
kinematics and cold start effects on the emissions, and feeds several downstream suite elements by calculating the emissions of pollutants and noise and the occurrence of accidents. This tool is compatible with most of the traffic models output. In facts the large number of options about the description of vehicle kinematics, the definition of the local fleet at link level and the approach for estimating the fraction of cold vehicles should guarantee an easy coupling between TEE2004 and most upstream used traffic models. Noise propagation and pollutants dispersion module The pollutants dispersion can be calculated with one of the two tools provided by ARIA Technologies depending on the spatial and time scale. For urban scale and long term analysis the suite will rely on ARIA Impacts, while for meso scale and short term events ARIA Regional will be the future reference, not yet fully integrated in the suite. For the noise propagation the Soundplan software (by Braunstein & Berndt GmbH, Germany) has been integrated within the Suite. These software tools operate on a common and harmonised set of input data needed for representing the dispersion processes. Exposure and Impacts on Health module For assessing population exposure to pollutants and noise, a completely new software called TEX (Transport Exposure) has been developed by WHO (ECEH office in Rome). Such a tool provides exposure of population groups in their residential areas or along the trips in the city network. The evaluation of the health risk related to the exposure to pollutants, noise and accidents is run with the H.I.T. software, also developed by WHO. This tools provides estimates of life years lost due to the effects of air pollution, noise annoyance and accidents effects. Impacts on monuments The air pollutants impact on monuments is simulated by a software purposely developed for ISHTAR by ENEA (Italy) and PHAOS (Greece). This software named MODA (Monuments Damage) can assess the loss of material or the deposition of crust and the money needed for maintenance. This module receives information from the air pollution software and gives useful output data to the module for the overall evaluation of the scenarios. The model can provide estimates of damage for specific monuments or for types of monuments and buildings. Overall scenarios analysis tool For the overall analysis of the policy scenarios two methodologies and software pieces are available: the Cost-Benefit Analysis and the Multi-Criteria Analysis. These tools gather the data from the upstream models (following the required aggregations) and give the results of the comparison of the scenarios developed. In any case the MCA takes into account the results of the CBA. Both of them are developed by TRaC – LMU (UK). This module needs the availability of a commercial software denominated LDW. Software Integration As important as the previous tools is the software developed by INRETS (F) for integrating the various tools in a Suite. The integration is made by a Software Manager that launches the so called ‘software connectors’. The connectors are pieces of software that upload the data needed by the single tool in the appropriate format, launches the tool and then download the results of the run in the ISHTAR Suite Database making them available for other tools or for the output through the Geographic Information System (ARCGIS) used for managing geographic data.
ISHTAR Project Publishable Final Report
9
Case Studies The suite was tested with seven case studies involving the local administrations of ISHTAR project: Athens, Bologna Province, Brussels, Graz, Grenoble, Paris and Rome. These studies can be summarised as follows. The Athens case study ‘Attiki Odos’ addresses the new roadway construction, Attica Periphery Road, which is assessed in terms of traffic, toll strategy and pricing, and environmental impacts. The Bologna Provincial Authority case study concerns the evaluation of infrastructure scenarios for the city of Imola with reference of alternative road paths. The aim of the Belgian case study is to prepare the implementation of traffic banning measures in the Brussels area, according to the Plan Ozone of the Federal Government. In the Brussels case study the focus is on the population behaviour, the modelling of traffic flows and the effects of the measure on pollutant emissions. The Graz case study is based on the traffic and noise impact evaluation of a 600 m long new road tunnel causing a relevant local traffic rerouting. Grenoble case study is intended to monitor the effects of the installation of reserved lanes for public transportation and new traffic lights on boulevards with heavy traffic. The focus in this case is on traffic and emissions. Every September 22nd the city of Paris takes part in a car free day. This typical short term event can be modelled with the ISHTAR suite of modules. For this case the usage of the new traffic model Visupolis is planned. The results include emissions of pollutants and air pollution. The Rome large scale case study involves the Heaven Project area banning the more polluting vehicles. In the northern part of the city centre a number of models of the suite have been used, from the locally available traffic model (Transcad) to the Overall Evaluation module.
Summary Conclusions The ISHTAR Suite has the potential to become a reference tool for the future planning of urban policies in terms of traffic, environment, health, monuments protection (Negrenti [4]). The integrated tool will enhance cooperation among the planning departments of municipalities and will be of interest also for environmental agencies, consultants, transport companies, ministries. Project conclusion in May 2005 is being followed by a pre-commercialisation phase allowing the involved partners to transform a research project result into a marketable tool or a software system for running calculation services. Along this phase an extensive demonstration activity in European cities is planned and is subject to negotiation at the time this paper is being finalised. Future users of the suite are expected in a fully international environment, having assessed the high interest by technical and scientific audiences worldwide (Negrenti [5] and [6]).

ISHTAR Project Publishable Final Report
10
Abbreviations and Acronyms B&B : Braunstein & Berndt Gmbh : provider of the noise software CBA: Cost Benefit Analysis CTM: Cellular Transport Methodology HIT: Health Impact of Transport ISHTAR: Integrated Software for Health, Transport efficiency and Artistic heritage Recovery LMU London Metropolitan University MCA: Multi Criteria Analysis MODA: MOnuments Damage MOSES: Model for the Overall Scenarios Evaluation and Synthesis TEE: Transport Energy & Environment TEX: Transport Exposure TRAC: Transport Research and Consultancy VISUPOLIS: derived from the merging of VISUM with METROPOLIS WHO World Health Organisation

ISHTAR Project Publishable Final Report
11
PART I – Why the ISHTAR project ?
1.1 Social and Technical contexts The ISHTAR Projects covered a number of issues – related to the urban quality of life – which have remarkable significance for many of the Community Social Objectives. Namely these areas are : environmental quality, safety, health, employment, preservation of the cultural heritage, transportation quality. The development of integrated methodologies and tools for the prediction of policies impacts and therefore for their improvement and optimisation will spontaneously bring improvements (or at least will slow down the worsening) in each of these areas, whose social significance is evident at first sight. In the global economy, successful cities are not those which attract “export industries” , but those which are able to supply the best services and resources which enhance the overall productivity of the economic activities performed in the urban arena. The most basic services which make a city attractive for citizens and business are those related to mobility. Sustainable transport is a goal to achieve in urban areas to enhance both the productivity of economic and social activities, reducing the waste of time caused by congestion, and the quality of life, because unsustainable transport patterns are the main cause of current environmental pollution. Integrated urban planning is an essential pre-condition to obtain a sustainable transport in the city of tomorrow, and this aspect has been addressed in depth by the ISHTAR research, with the aim of creating a new awareness of the issues at stake among the national, regional and local administrations in charge of urban management and planning and regulation in EU and CEEC countries. The development of improved transportation policies has also the potential of an additional positive influence on employment due to the creation of new functions and connected jobs:
- surveying transportation processes - collecting and interpreting data - monitoring transportation processes - updating control systems’ parameters and set-ups
Furthermore the ISHTAR suite allows the analysis of the impacts of various kind of short term actions and long term measures/policies on some fundamental indicators of urban quality of life:
- environmental quality (air pollution, noise) - health risks due to air and noise pollution - traffic accidents causing victims at various level of severity.
The social burden of urban pollution health effect and urban road accidents is huge, and becoming more and more evident to the citizens, both in human and economic terms. Making a contribution to reduce such problems, the ISHTAR Project provides a social impact of high significance. Given the increasing relevance given by the public opinion to these issues, it can be concluded that – as for the mobility paradigm – an improved ‘environmental’ condition in a city is nowadays a crucial factor for attracting people and activities. The social effect is twofold: we might observe the improvement of the ‘environmental condition’ followed by a positive feedback providing economic opportunities. If such development will follow a ‘sustainability’ pattern a virtuous spiral can start and evolve.

ISHTAR Project Publishable Final Report
12
1.2 Objectives of the project The main target of the ISHTAR Project was to develop a model Suite which allows the evaluation of the impacts of various types of urban policies and actions on the quality of life of citizens, and in particular on traffic congestion, air quality, citizens health, conservation of monuments and cultural heritage. Specific scientific and technical objectives of the ISHTAR Suite of models were :
?? integration of a relevant number of software tools, either already existing or to be enhanced/developed;
?? evolution of modelling techniques in some policy impact areas that are crucial for the environmental reliability of the results;
?? creation of flexible integrated software modules inside the whole Suite, allowing alternative tool choices by the user as a function of the kind of policy or action to be analysed;
?? Space and Time flexibility in the operation of the Suite, allowing the applicability to a virtually unlimited set of policies and actions, from 1-day actions for environmental emergency management to year-long policies acting on various fronts of the ‘quality of life’ battle.
This factor represents a significant technical achievement, since standard models suites normally include only a few of those models, and a strong enlargement of the applicability area, since with this kind of ‘multi-impacts’ suite the city administrations and their consultants are able to analyse in an integrated and coherent way the various aspects of ‘global’ urban policies, without having to perform separate studies relying on different input information and therefore less credible in their conclusions. The scientific core value of the ISHTAR project is largely linked to a few crucial modelling developments from which the accuracy and the significance of the results deriving from the Suite application strongly depend. Namely these areas of ‘development’ can be so summarised:
?? prediction of the effects of citizens reaction to postulated actions and policies (WP1). ?? improvement of the modelling of vehicles emissions (WP3), particularly for what concerns
the consideration of speed variability along the network links, and the spatial-temporal distribution of ‘cold-emissions’ depending on the representation of trip origins (e.g. parking places).
?? detailed estimate of pollution effects on citizens (WP6) based on an analysis of population groups and the 4-dimensional maps of pollution and noise produced by the tools selected in WP4 : this represents a great step forward compared to aggregated approaches, and can be used for predicting both short term and long term effects on health.
The ISHTAR project was also aiming at maximum flexibility of use : this is particularly reflected in some of the Work Packages. Relevant is the choice made to build an ‘Integrated Transport Module’ which will contain 2 or 3 different models, having complementary characteristics in terms of applicability field, so that the future user will be theoretically in condition of analysing ‘any’ kind of urban policy involving (as nowadays is the rule…) transport system planning and/or management. Also relevant is the accepted consequence of this flexibility in transport modelling : the downstream models (emission, noise, safety, exposure) had to be flexible in their input characteristics in order to give the proper accuracy whichever transport model is used in a given analysis. This implies the use of ‘advanced’ emission, noise and safety models capable of treating flexible input information. Another crucial objective of the ISHTAR Project, is the total flexibility in space and time domains of analysis.

ISHTAR Project Publishable Final Report
13
The starting point for the achievement of this goal is the realisation of the 24h capability : traffic flows, vehicles speed, emissions, noise levels, pollution levels will be calculated (when needed) hour by hour thanks to the characteristics of the transport, emission, noise and dispersion models that are selected. This capability to run impact analysis ‘hour by hour’ (or ‘day by day’ on a longer scale) is a guarantee of accuracy that many standard current analyses based only on peak hour conditions cannot reach. The space flexibility is normally not a problem for whatever network transport model: but it is evident that having (e.g.) 3 different transport models in the WP2 integrated module (such as a classic assignment model, an advanced dynamic traffic model and a micro-simulator) will allow inherent ‘zooming capability’. This spatial flexibility is demonstrated by the variability of city cases tested : the consortium includes cities interested in policies impacting the whole territory, or a part of it, a province administration, a regional administration : variety of spatial dimensions is certainly guaranteed. From the point of view of the anticipated users of the ISHTAR Suite, the following considerations can be added. The ISHTAR research originated from the identification of problems which need to be overcome in urban areas to obtain sustainable urban development and recovery of quality of life in urban centres. Policy makers need an input of continuous strategic thinking, and planning departments are devoted to it. Policy makers are interested in a balanced view of all the approaches available. As consultants tend to provide partial answers, the policy makers may want to engage in processes of impacts analysis of policies and actions which can include in an integrated way the manifold impacts of measures taken in the urban context. Thus, a relevant final target of ISHTAR project is the creation of a common understanding and a reference common tool among European transport, environment, health and artistic heritage authorities, policy makers and practitioners.
1.3 Structure of ISHTAR project
1.3.1 The overall methodology The ISHTAR has been structured on six technical Work Packages for the simulation of the impacts of the measures under analysis: WP 1 simulates the citizens behaviour, WP2 the transport system, WP3 the transport system direct impacts, WP4 noise and pollutants dispersion, WP6 Exposure and Health effects, WP7 the effects on monuments plus one Work Package (WP9) for the collection of the data from the upstream models and the elaboration of the parameters and indicators for the assessment of the measure under exam. One more technical work package is dedicated to the integration of the tools (WP8) and finally there are the Coordination and management (WP10) and the Dissemination and Exploitation (WP11) Work Packages. See the list below.
?? WP1 : Urban Policies and Actions selection and analysis ?? WP2 : Integrated Transport Analysis Module ?? WP3 : Integrated Transport Direct Impacts ?? WP4 : Pollutants and Noise Dispersion Module ?? WP5 : Models suite validation : Simulation of case studies ?? WP6 : Advanced Health Impact Module ?? WP7 : Damage reduction on Artistic Heritage ?? WP8 : Software Integration and Interfacing ?? WP9 : Overall Analysis of Case studies ?? WP10 : Project Management and Co-ordination (PMC) ?? WP11 : Dissemination and Exploitation (D&E)

ISHTAR Project Publishable Final Report
14
1.3.2 Roles of the various WPs in the overall design of ISHTAR The following list presents the role of each WP within the ISHTAR framework:
??WP1 has the role of defining the urban policies and actions to be tested in the involved Cities, and of starting the impact analysis by considering their effects on citizens behaviour.
??WP2, WP3, WP4 have the task of constituting the upper part of the models Suite, a cluster of
models whose results will be assessed on the basis of independent data and data collected in involved cities during the testing of the actions and policies.
??WP5 is a central WP, starting with data definition for test cases analysis and concluding with
the running and validation of the Suite of Models applied to the city defined case studies. ??WP6 and WP7 constitute the lower section of the models chain: they include simulation
activities have not be validated as in the upper part of the chain (due to time limits for the impacts) but will be assessed with independent data and will provide anyway estimates of two crucial effects of urban pollution.
??WP8 is another central point for the Project: it represents the place where the various software
tools are integrated and interfaced, and finally transformed in a user friendly software system that consultants and administrations will be able to use in the framework of an integrated analysis of the effects of their possible choices for the improvement of life quality in our cities.
??WP9 includes an overall analysis of the results from the case studies, receiving inputs directly
from cities and from the models in the integrated Suite, thus demonstrating global conclusions on the social effectiveness of the selected actions and policies
??WP10 (Management and Co-ordination) and WP11 (Dissemination and Exploitation), last but
not least, performs a number of services for the consortium in order to guarantee maximum internal efficiency and harmonisation, extended visibility by the potential users across EU and beyond, optimised co-operation with the Commission, fruitful liaison with other FP5 Projects involved in activities of clear synergy with ISHTAR Project.
The research has developed a continuous learning process, involving consultants and representatives from European cities and administrations which are involved in policies of protection of health and artistic heritage, environment and quality of transport and urban life in general. In Figure 1.3.2.1 the following aspects of ISHTAR Work Packages are highlighted: 1) The existence of a fundamental ‘chain of models’ (and therefore of ‘work-packages’) which ranges from WP1 (citizens behaviour models) to WP9 (overall analysis); 2) The extremely high level of interactions to-from WP5 – 8 – 10 – 11 (Validation, Integration, Management and Co-ordination, Dissemination and Exploitation); 3) The typology of expertise involved in each work-package.

ISHTAR Project Publishable Final Report
15
Figure 1.3.2.1 : ISHTAR WORKPACKAGES LINKAGES
ISHTAR Project Publishable Final Report
16
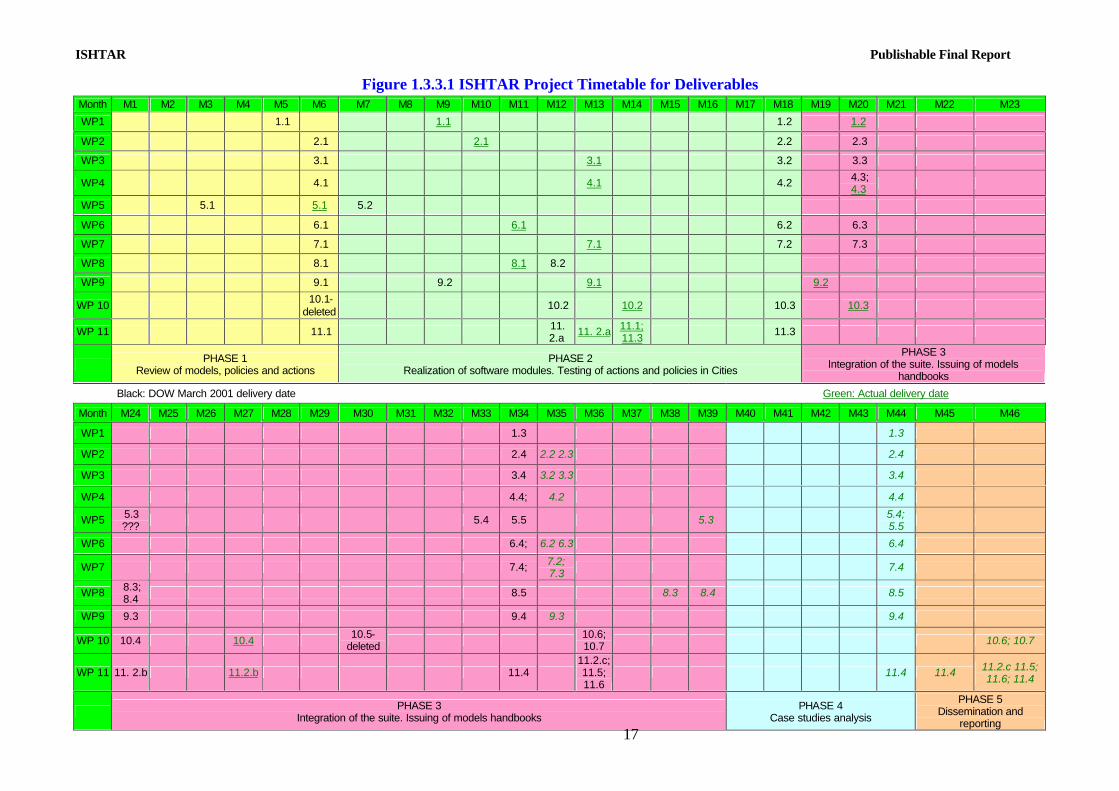
1.3.3 ISHTAR Work-programme The flow diagrams and the explanatory figures of ISHTAR activities are shown in the following pages. It has to be considered together with the 10 months Project extension that the consortium agreed with European Commission in order to recover the delay accumulated during the integration phase. The research process has been s articulated in five fundamental phases (see scheme in figure 1.3.3.1):
?? the first phase was devoted to the running of reviews in the various involved areas of scientific and technological knowledge and to the analysis and selection of the policies and-or actions to be tested in the involved cities
?? the second phase has seen the realisation and separate testing of the various modelling
modules and the beginning of the collection of data for the overall analysis. This second phase was concluded by achieving availability of the various modelling sections of the ISHTAR Suite.
?? the third phase was focused on the Software tools integration in the Suite. Manuals
concerning the various tool sets have been issued. All the test actions and policies were concluded at the end of this stage, so that all the needed data were available for the validation and application of the ISHTAR Suite by month 39.
?? the fourth phase, from month 40 to month 44 was dedicated to the running of the Suite
validation study and the analysis of the selected case studies tested in all the actively involved cities (Partner cities and ‘sponsor cities’). Independent reports on the application of the various tools have been prepared..
?? The fifth final phase (months 45 and 46) were devoted to the final dissemination and
reporting of results. The final conference and two dissemination workshops have been organized in this period.
ISHTAR Publishable Final Report
17
Figure 1.3.3.1 ISHTAR Project Timetable for Deliverables Month M1 M2 M3 M4 M5 M6 M7 M8 M9 M10 M11 M12 M13 M14 M15 M16 M17 M18 M19 M20 M21 M22 M23
WP1 1.1 1.1 1.2 1.2
WP2 2.1 2.1 2.2 2.3
WP3 3.1 3.1 3.2 3.3
WP4 4.1 4.1 4.2 4.3; 4.3
WP5 5.1 5.1 5.2
WP6 6.1 6.1 6.2 6.3
WP7 7.1 7.1 7.2 7.3
WP8 8.1 8.1 8.2
WP9 9.1 9.2 9.1 9.2
WP 10 10.1-deleted 10.2 10.2 10.3 10.3
WP 11 11.1 11. 2.a 11. 2.a 11.1;
11.3 11.3
PHASE 1 Review of models, policies and actions
PHASE 2 Realization of software modules. Testing of actions and policies in Cities
PHASE 3 Integration of the suite. Issuing of models
handbooks
Black: DOW March 2001 delivery date Green: Actual delivery date
Month M24 M25 M26 M27 M28 M29 M30 M31 M32 M33 M34 M35 M36 M37 M38 M39 M40 M41 M42 M43 M44 M45 M46
WP1 1.3 1.3
WP2 2.4 2.2 2.3 2.4
WP3 3.4 3.2 3.3 3.4
WP4 4.4; 4.2 4.4
WP5 5.3 ??? 5.4 5.5 5.3 5.4;
5.5
WP6 6.4; 6.2 6.3 6.4
WP7 7.4; 7.2; 7.3 7.4
WP8 8.3; 8.4 8.5 8.3 8.4 8.5
WP9 9.3 9.4 9.3 9.4
WP 10 10.4 10.4 10.5-deleted 10.6;
10.7 10.6; 10.7
WP 11 11. 2.b 11.2.b 11.4 11.2.c; 11.5; 11.6
11.4 11.4 11.2.c 11.5; 11.6; 11.4
PHASE 3 Integration of the suite. Issuing of models handbooks
PHASE 4 Case studies analysis
PHASE 5 Dissemination and
reporting
ISHTAR Project Publishable Final Report
18
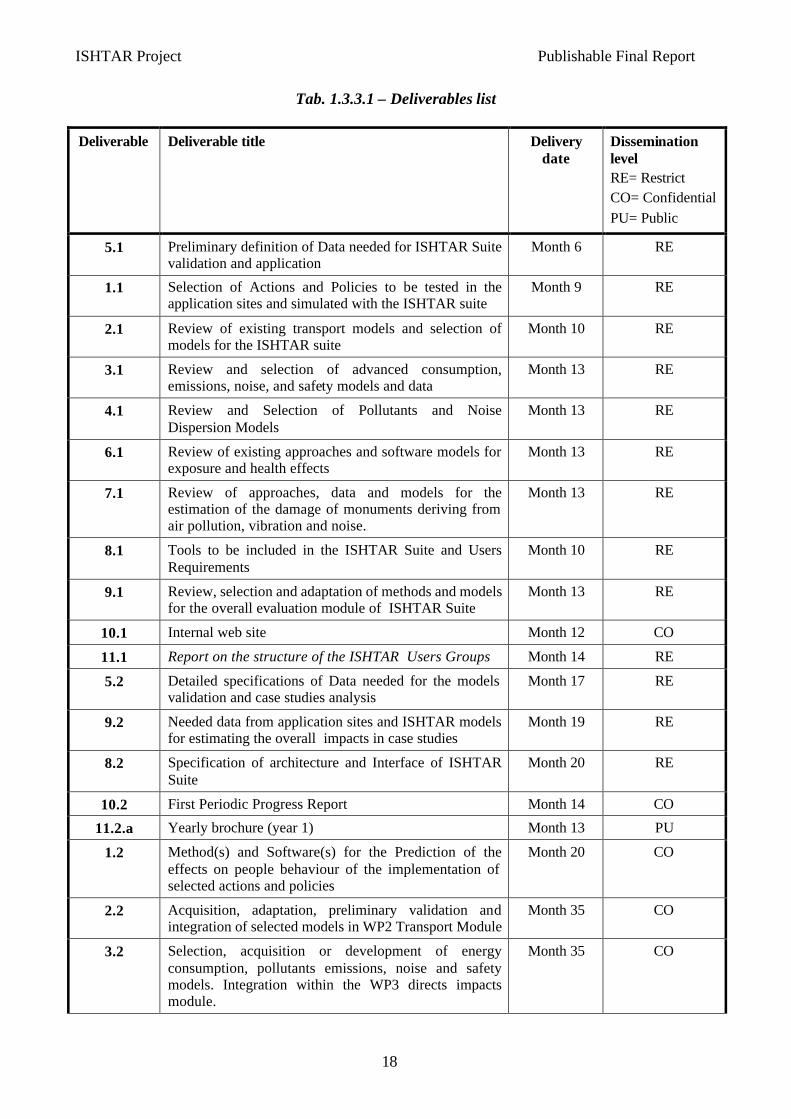
Tab. 1.3.3.1 – Deliverables list
Deliverable
Deliverable title Delivery date
Dissemination level RE= Restrict CO= Confidential PU= Public
5.1 Preliminary definition of Data needed for ISHTAR Suite validation and application
Month 6 RE
1.1 Selection of Actions and Policies to be tested in the application sites and simulated with the ISHTAR suite
Month 9 RE
2.1 Review of existing transport models and selection of models for the ISHTAR suite
Month 10 RE
3.1 Review and selection of advanced consumption, emissions, noise, and safety models and data
Month 13 RE
4.1 Review and Selection of Pollutants and Noise Dispersion Models
Month 13 RE
6.1 Review of existing approaches and software models for exposure and health effects
Month 13 RE
7.1 Review of approaches, data and models for the estimation of the damage of monuments deriving from air pollution, vibration and noise.
Month 13 RE
8.1 Tools to be included in the ISHTAR Suite and Users Requirements
Month 10 RE
9.1 Review, selection and adaptation of methods and models for the overall evaluation module of ISHTAR Suite
Month 13 RE
10.1 Internal web site Month 12 CO
11.1 Report on the structure of the ISHTAR Users Groups Month 14 RE
5.2 Detailed specifications of Data needed for the models validation and case studies analysis
Month 17 RE
9.2 Needed data from application sites and ISHTAR models for estimating the overall impacts in case studies
Month 19 RE
8.2 Specification of architecture and Interface of ISHTAR Suite
Month 20 RE
10.2 First Periodic Progress Report Month 14 CO
11.2.a Yearly brochure (year 1) Month 13 PU
1.2 Method(s) and Software(s) for the Prediction of the effects on people behaviour of the implementation of selected actions and policies
Month 20 CO
2.2 Acquisition, adaptation, preliminary validation and integration of selected models in WP2 Transport Module
Month 35 CO
3.2 Selection, acquisition or development of energy consumption, pollutants emissions, noise and safety models. Integration within the WP3 directs impacts module.
Month 35 CO
ISHTAR Publishable Final Report
19
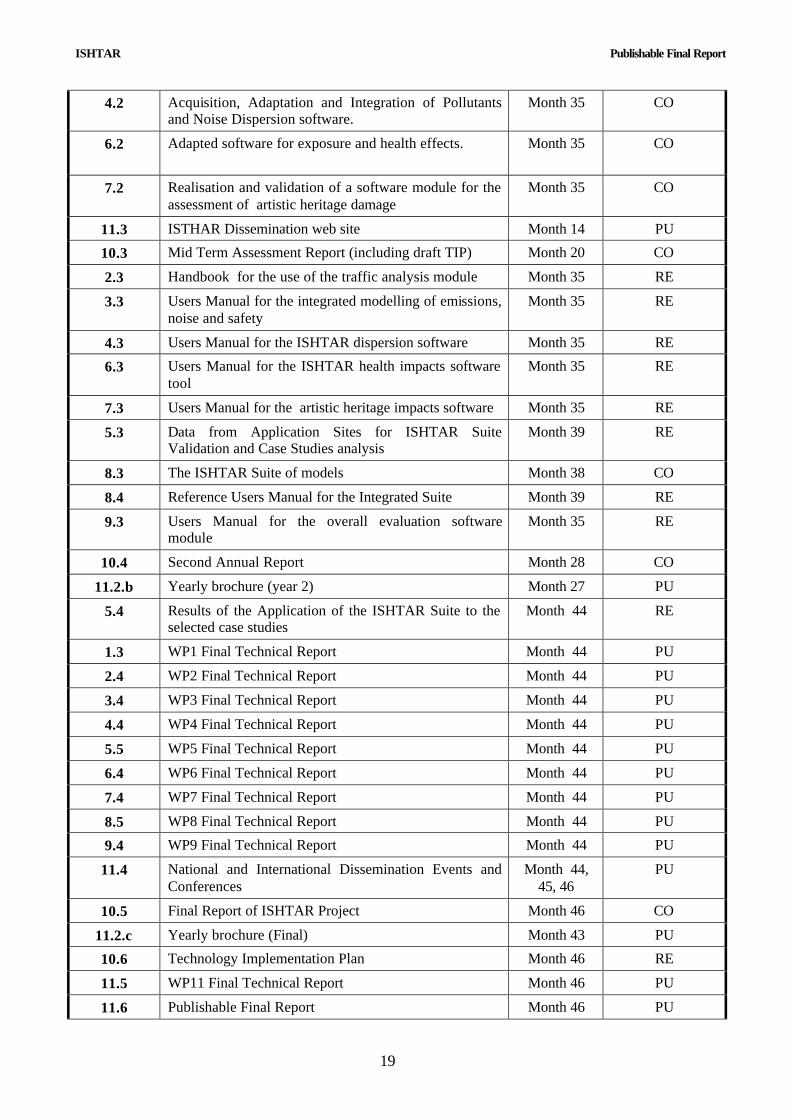
4.2 Acquisition, Adaptation and Integration of Pollutants and Noise Dispersion software.
Month 35 CO
6.2 Adapted software for exposure and health effects.
Month 35 CO
7.2 Realisation and validation of a software module for the assessment of artistic heritage damage
Month 35 CO
11.3 ISTHAR Dissemination web site Month 14 PU
10.3 Mid Term Assessment Report (including draft TIP) Month 20 CO
2.3 Handbook for the use of the traffic analysis module Month 35 RE
3.3 Users Manual for the integrated modelling of emissions, noise and safety
Month 35 RE
4.3 Users Manual for the ISHTAR dispersion software Month 35 RE
6.3 Users Manual for the ISHTAR health impacts software tool
Month 35 RE
7.3 Users Manual for the artistic heritage impacts software Month 35 RE
5.3 Data from Application Sites for ISHTAR Suite Validation and Case Studies analysis
Month 39 RE
8.3 The ISHTAR Suite of models Month 38 CO
8.4 Reference Users Manual for the Integrated Suite Month 39 RE
9.3 Users Manual for the overall evaluation software module
Month 35 RE
10.4 Second Annual Report Month 28 CO
11.2.b Yearly brochure (year 2) Month 27 PU
5.4 Results of the Application of the ISHTAR Suite to the selected case studies
Month 44 RE
1.3 WP1 Final Technical Report Month 44 PU
2.4 WP2 Final Technical Report Month 44 PU
3.4 WP3 Final Technical Report Month 44 PU
4.4 WP4 Final Technical Report Month 44 PU
5.5 WP5 Final Technical Report Month 44 PU
6.4 WP6 Final Technical Report Month 44 PU
7.4 WP7 Final Technical Report Month 44 PU
8.5 WP8 Final Technical Report Month 44 PU
9.4 WP9 Final Technical Report Month 44 PU
11.4 National and International Dissemination Events and Conferences
Month 44, 45, 46
PU
10.5 Final Report of ISHTAR Project Month 46 CO
11.2.c Yearly brochure (Final) Month 43 PU
10.6 Technology Implementation Plan Month 46 RE
11.5 WP11 Final Technical Report Month 46 PU
11.6 Publishable Final Report Month 46 PU
ISHTAR Publishable Final Report
20
PART II – Methodologies for integrated planning and assessment
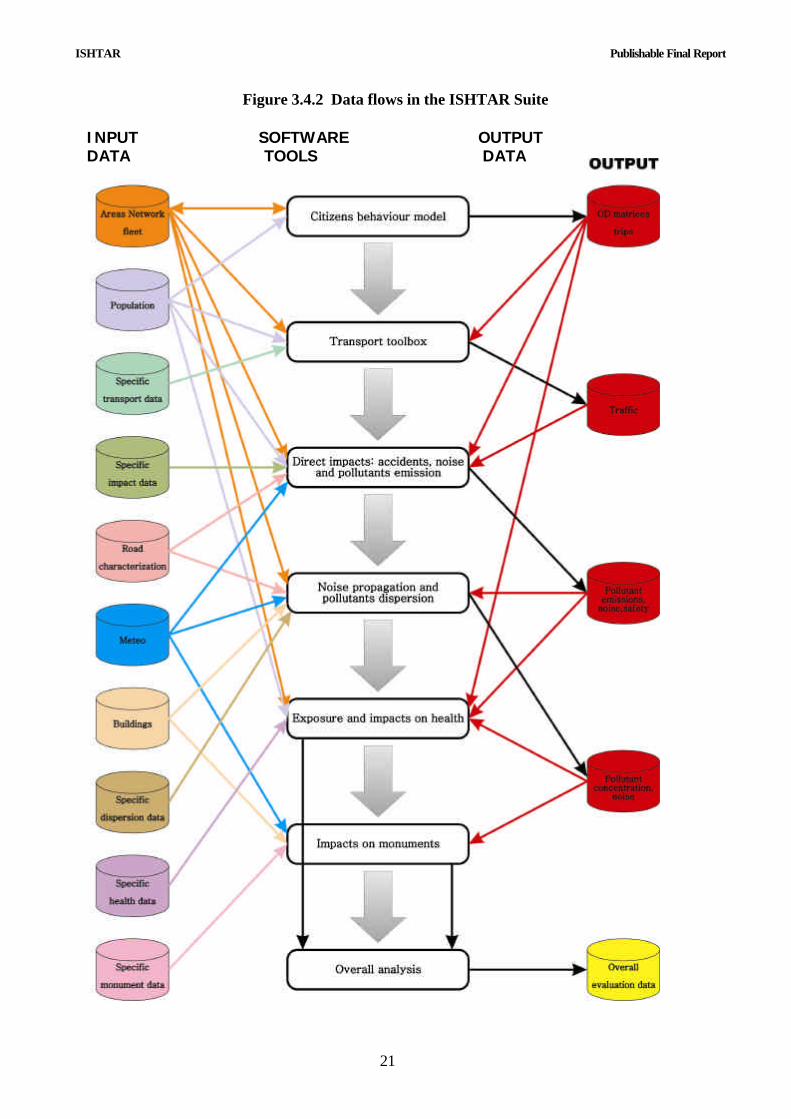
2.1 From single impacts evaluation to integrated analysis The ISHTAR Suite is based on a high number of distinct software tools whose aim is the modelling of various aspects of the impact analysis of short-term actions and long-term policies. This integration represents a significant technical achievement. Standard models suites normally include only a few of those models. It also represents a strong enlargement of the applicability area, since with this kind of ‘multi-impacts’ suite the users is able to analyse in an integrated and ‘coherent’ way the various aspects of ‘global’ urban policies, without having to perform separate studies relying on different input information providing very likely less credible conclusions. The wide scope of applicability of the suite has the potential to ease cooperation between different departments in municipal authorities: in fact the tool will be of interest for various activities of planning and assessment in the transport, environment, health and artistic heritage sectors. The scientific core value of the ISHTAR Suite is largely linked to a few crucial modelling developments on which the accuracy and the significance of the results deriving from the Suite application strongly depend. These areas of ‘modelling development’ can be summarized as: a) prediction of the effects of citizens reaction to postulated measures. b) improvement of the modelling of vehicle emissions, particularly concerning the consideration of speed variability along the network links, and the spatial-temporal distribution of ‘cold-emissions’ depending on the representation of trip origins (e.g. parking places). c) development of an urban road safety model, which can take into account the variable flow and speed levels in the network and the adverse factors such as the presence of intersections. d) detailed estimate of pollution effects on citizens health based on the analysis of population groups movements during the day and the temporal-spatial maps of air pollution and noise. The ISHTAR Suite is globally aiming at the highest flexibility of use: this is particularly reflected in some of the tools. The choice of building an ‘Integrated Transport Module’ which makes use of different models, having complementary characteristics in terms of applicability field, is of particular significance. Also relevant is the consequence of this flexibility in transport modelling: the downstream models (emission, noise, safety, exposure models) will have to be flexible in their input characteristics in order to give the proper accuracy whichever transport model is used in a given analysis. This implies the use of ‘advanced’ emission, noise and safety models capable of treating flexible input information. The suite includes a module dedicated to the direct impacts of traffic: emissions, noise and accidents. This module is based on such common and flexible traffic input. Also the module dedicated to the overall evaluation of the policy scenarios includes parallel elements: in this case a Cost Benefit Analysis tool is complemented by a Multicriteria Analysis software. Among the crucial characteristics of the ISHTAR Suite, a total flexibility in space and time plays an essential role. The starting point for the achievement of this goal was the realization of the so called ’24 hour capability’: traffic flows, vehicles speed, emissions, noise levels, pollution levels are calculated (when needed) hour by hour thanks to the characteristics of the citizens behaviour, transport, emission, noise and dispersion models that have been selected or developed. This flexibility enhances the scope of applicability of the tool that can be used for both short term scenarios and measures having a longer time horizon (months, year).
ISHTAR Publishable Final Report
21
Figure 3.4.2 Data flows in the ISHTAR Suite INPUT SOFTWARE OUTPUT
DATA TOOLS DATA
ISHTAR Project Publishable Final Report
22
2.2 Policies and Behaviour of people Each city in Europe has to cope with different behavioural response to transport policies. For instance, transport policies dealing with congestion problems can choose a different mix of regulation, planning, economic and/or technology-based measures. Each city should select the policy scenario that is most suitable for the kind of problems the city is experiencing. When facing increasing congestion, individuals experience growing dissatisfaction, which may reach some threshold level that triggers a reassessment of the situation. Salomon and Mokhtarian1 have suggested that the following process takes place. A search is initiated when a certain level of dissatisfaction has been reached. Given the experience they have gained, namely prior adjustment to congestion, individuals identify the potential options for adjustment, evaluate them and choose a course of action, which is likely to reduce dissatisfaction, at least temporarily. Thus, there is time to achieve a threshold where individuals are triggered to take some initiative, and this time depends on the nature of the option considered for action. Understanding this issue of the time required for deliberation about change is important for policy-making considerations. This is likely to be a function of the transaction costs implicit in any change. For instance, residential relocation is not a decision made on the spur of the moment, while route change may be. Thus, when a situation changes, or when a policy is introduced, there is a span of time in which each potential response may be employed. This is a very important point from a policy evaluation perspective. If a policy measure is evaluated before the range of likely responses has been adopted, premature conclusions may result. There is a wide range of reasonable responses to changing congestion. Each individual may not face this full range, but a subset of the options available, depending on the personal situation. Based on Salomon and Mokhtarian, the following range of responses should be considered:
1 Accept travel costs: this “do-nothing” situation seems to be a prevailing response. It may indicate that despite the public and political grievance about congestion, it may not be as severe a problem as commonly believed. In economic terms, it implies that the costs of adopting any other response strategy are greater than the costs of congestion to the individual.
2 Reduce travel costs/discomfort: the automobile and car gadget manufacturers seem to cater to the frustrated driver by offering an increasingly pleasant and functional commuting environment: air-conditioning, a quality music system, a cellular telephone, and other elements of comfort make the time spent travelling by auto more acceptable.
3 Change route: by changing to a route with less stop-and-go traffic, the traveller may reduce commuting stress even though the new route may be longer or slower.
4 Adapt departure time: this strategy can reduce travel time, if the peak period is relatively narrow. It will be less effective in those areas where congestion prevails for many hours continuously. Constraints such as rigid work schedules or needing to drive family members limit the ability to adopt this response.
5 Buy time: by paying access tolls one can buy travel time, while paying parking fees may reduce access time.Temporal changes (flex-time, compressed work week, and changes from full- to part-time jobs): temporal changes allow diversion of trips from peak periods to other periods, either by the adoption of flex-time or by adopting ten-hour four day work weeks, with work days staggered across the week.
1 Salomon, I. and Mokhtarian P., 1997, “Coping with Congestion: Reconciling Behavioural Responses and Policy Analysis”, Transportation Research D, 2(2), 107-23
ISHTAR Project Publishable Final Report
23
6 Change mode: switching to other, more efficient modes of travel is often the solution suggested by transport professionals, environmentalists and politicians. However, based on experience, the success of that particular approach is limited to situations where congestion is very severe and shared-ride modes are competitive in time and cost to the automobile (for example in CBD-bound trips where parking is limited and costly)
7 Telework (telecommute) from home or from a local work centre: alternative work arrangements which allow flexibility not only in time, but also in space, facilitates responses which allow the individual to avoid congestion.
8 Relocation of workplace or home: avoiding congestion by locational adjustments is an option for long-term response. It can either reduce distance or facilitate travel on routes which do not suffer from congestion.
9 Start a home-based business: this strategy entails costs for the individual along with potential benefits like monetary gain, time, lower stress (greater control of one’s work), and convenience (schedule flexibility).
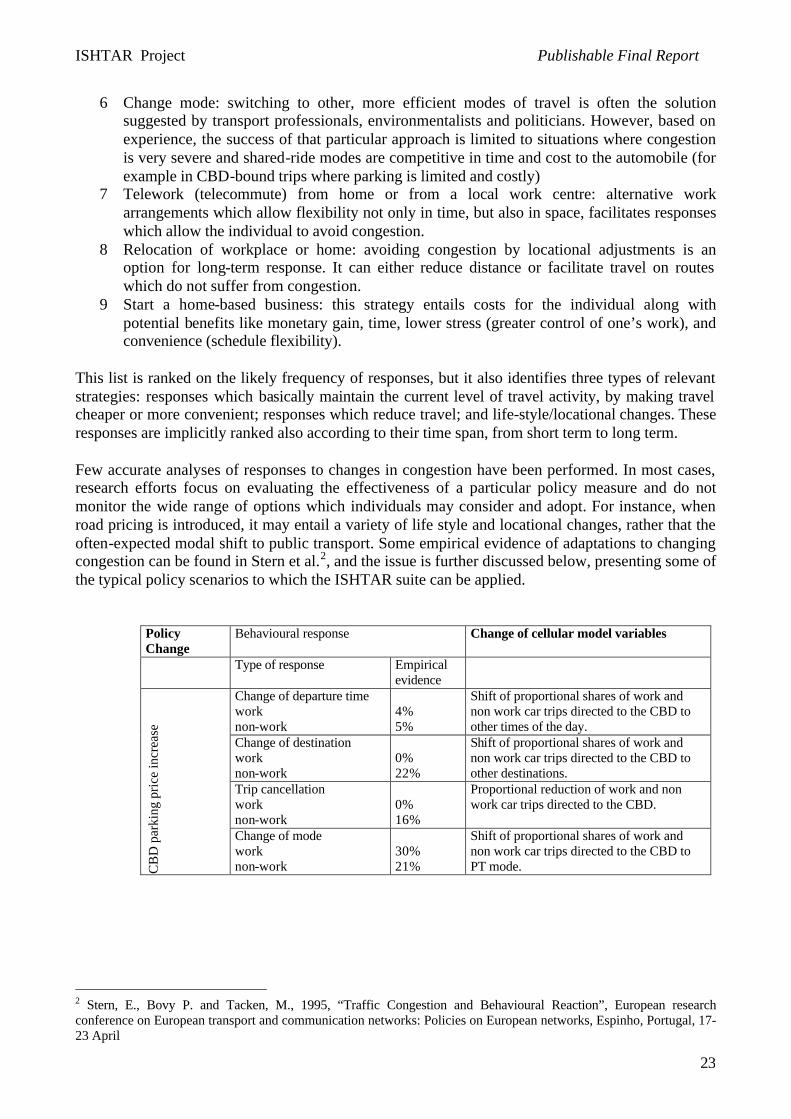
This list is ranked on the likely frequency of responses, but it also identifies three types of relevant strategies: responses which basically maintain the current level of travel activity, by making travel cheaper or more convenient; responses which reduce travel; and life-style/locational changes. These responses are implicitly ranked also according to their time span, from short term to long term. Few accurate analyses of responses to changes in congestion have been performed. In most cases, research efforts focus on evaluating the effectiveness of a particular policy measure and do not monitor the wide range of options which individuals may consider and adopt. For instance, when road pricing is introduced, it may entail a variety of life style and locational changes, rather that the often-expected modal shift to public transport. Some empirical evidence of adaptations to changing congestion can be found in Stern et al.2, and the issue is further discussed below, presenting some of the typical policy scenarios to which the ISHTAR suite can be applied.
Policy Change
Behavioural response Change of cellular model variables
Type of response Empirical evidence
Change of departure time work non-work
4% 5%
Shift of proportional shares of work and non work car trips directed to the CBD to other times of the day.
Change of destination work non-work
0% 22%
Shift of proportional shares of work and non work car trips directed to the CBD to other destinations.
Trip cancellation work non-work
0% 16%
Proportional reduction of work and non work car trips directed to the CBD.
CB
D p
arki
ng p
rice
incr
ease
Change of mode work non-work
30% 21%
Shift of proportional shares of work and non work car trips directed to the CBD to PT mode.
2 Stern, E., Bovy P. and Tacken, M., 1995, “Traffic Congestion and Behavioural Reaction”, European research conference on European transport and communication networks: Policies on European networks, Espinho, Portugal, 17-23 April
ISHTAR Project Publishable Final Report
24
2.3 Transport modelling The aim of the work package 2 of the ISHTAR project was to determine potential road traffic modelling tools to be included in the ISHTAR suite, for producing accurate speed and flow estimates in order to feed the emission and dispersion components of the suite. This work package begun studying the on the market available software. From this preliminary survey, conventional static models and mesoscopic dynamic models were retained for in depth analysis and comparison. SATURN STATIC was kept as representative of the static models. SATURN DYNAMIC and METROPOLIS were kept as representatives of the dynamic models family. Three models of the Brussels road network were built and calibrated with the selected software tools and their outputs (speed and flow estimates) were compared with the results of a intensive campaign of speeds on flows measurements performed on selected routes. This validation procedure was realised for morning peak hours and has shown that:
?? SATURN static model fails to give acceptable speed and flow estimates on the congested part of the test routes
?? SATURN DYNAMIC gives results that fit very well with the field observations results ?? METROPOLIS gives good and sufficient results for radial routes.
Finally, METROPOLIS was selected because of its abilities to use classical static model data and to produce reasonably good dynamic traffic flows estimations. Moreover, METROPOLIS is a good compromise between cost and results. Presently, many cities have at their disposal static models. For these cities, METROPOLIS could be a solution. Indeed, METROPOLIS is a software tool model which can easily transform a conventional static model into a dynamic one. This operation is not expensive and would provide much better estimates of the speed and flow characteristics of a congested network than the original static model. That is also the reason why PTV has decided to get the commercialisation rights of METROPOLIS and to develop a new version of its static VISUM to offer this dynamic modelling opportunities at relatively low cost. The overall objective of WP2 is to design and implement a methodological tool box for evaluating by means of transport software tools the detailed transport system status needed for the accurate impacts analysis of the actions and policies identified in WP1 in terms of effects on motorized vehicles mobility. Actions and policies are assumed to have an impact on traffic conditions on the whole road network of the concerned urban area. The referred software tools have to be able to reproduce, accurately enough, average traffic conditions at the scale of a street section. From current and future (short-term or long term) Origin-Destination matrices and modified modal split distributions estimated in WP1 or from WP1 results, the traffic software will calculate traffic flows and speed distribution in the network, link by link, in order to describe accurately what is essential for a reliable prediction of vehicles consumption and emissions, noise and accidents. As forecasting air pollutants concentrations by mean of dispersion models (see WP4) is among the aims of ISHTAR, traffic flows and speeds estimation process needalso to forecast as accurately as possible the variations in vehicular traffic on each modelled road section in the course of the day.
ISHTAR Project Publishable Final Report
25
Results The study team has achieved the following results:
?? Classification of the available software tools ?? Analysis of the suitability and comparison of the software tools for producing the needed
outputs ?? Elaborating guidelines for implementing the best performing tools ?? Application of the tools in case studies
METROPOLIS is a dynamic model that has been designed for large-scale urban areas. It computes a stationary regime by using an iterative day-to-day process, furthermore METROPOLIS attempts to suppress the drawbacks of static models and of dynamic micro-simulation. METROPOLIS uses almost the same congestion method as static models: speed-density functions. However, the functions bind dynamic variables instead of time averages. Since it basically uses the same data as static models, METROPOLIS can be set up very quickly with an initial static database. METROPOLIS is a simulation model but it is based on strong theoretical sub-models (logit model, Vickrey's departure time model, dynamic shortest paths). Its mesoscopic level of details allows it to compute larger problems and to model the equilibrium between supply and demand, which is often absent from micro-simulation tools. Statistical test check for stationarity of the final solution. METROPOLIS is best suited for the study of disaggregated impacts on large scale transportation systems. METROPOLIS has been developed by Pr André De Palma (http://www.adpc.be). METROPOLIS is a good compromise between realistic results and workload. A SATURN model is a better choice in terms of traffic results, but the codification of the SATURN network is much more heavy than the codification of a METROPOLIS network. Therefore, a city already owning a SATURN network has an advantage in using it. However, this is not the case for a city which has to build the complete network, would prefer using METROPOLIS. Why is it so important for the calculation of emissions? Looking at a pollutant emission function, you can observe a minimum is located at about 70 km/h. In the static model, there is a lot of vehicles (4000 evp/h) going through the one-lane way at a very low speed (for example 5 km/h). This involves that the emission model will give that a huge quantity of pollutants is supposed to be emitted, which is not true in practical. The emission in the tighter section can be overestimated by a coefficient of 50. Therefore static models fail to provide useful answers for the planning of several innovative policies in congested areas, which explicitly involve time of the day, such as:
?? Modular pricing, ?? Modular access control, ?? Implementation of flexible and staggered hours, ?? Parking management, ?? Information to road users.
During the course of the ISHTAR project, PTV acquired the commercial rights of METROPOLIS and has included its core algorithms into the VISUM suite so that the last version of VISUM contents as well a conventional static assignment algorithm as the dynamic demand algorithm (departure time modelling) and the dynamic traffic flow model (queue modelling) of METROPOLIS. VISUM and Metropolis are linked in a way that VISUM works as fronted with a GUI using the METROPOLIS dynamic assignment model. The result of the Metropolis assignment will be traffic volumes per link and per time slice. That new version of VISUM, called VISUPOLIS, can be used very easily by most cities in order to "dynamise" their existing static model.
ISHTAR Project Publishable Final Report
26
Formerly, the main aim of the transport authorities when making use of road traffic models was to adjust infrastructure capacities to the growing demand. Conventional static models were perfectly fitted for this aim. Presently, the traffic simulation models are more and more used, in very congested areas, for estimating environmental impacts of demand management policies and traffic calming measures. But the ISHTAR research has proven that the conventional static models that are the most widely used in Europe fail to produce accurate estimates of the main traffic characteristics and are not appropriate for giving proper input data to the emission models. Therefore, the need to replace the old conventional tactical traffic models of most of the transport agencies with appropriate congestion responsive traffic models becomes evident. But the cost of calibrating a SATURN or CONTRAM dynamic model is very high, because it has to be done from scratch and has to include all the details on the junctions design and the traffic light settings. As an example, for the Brussels area, it lasted 2 years for 3 persons. On the contrary, updating a conventional static model into a METROPOLIS model, by mean of the most recent release of the PTV-VISUM software will only need a couple of weeks. It why we believe that include the METROPOLIS algorithms (by mean of PTV-VISUM) within the ISHTAR suite could provide to the transport authorities, which are already operating a conventional static model, a dramatic improvement of their environmental impact assessment capabilities at a very low cost.
ISHTAR Project Publishable Final Report
27
2.4 Transport Direct Impacts modelling
Emissions from transport vehicles are modelled in a number of different ways, but this variability includes some ‘fundamental rules’ that give the ‘essence’ of emissions calculation: emissions are in practice the sum of at least two main components: ‘hot emissions’ and ‘cold start emissions’. If the modeller is interested in VOC emissions, then also the ‘evaporative term’ has to be added. Hot emissions are the emissions emitted when engine and abatement devices have reached a regime temperature. They are influenced by a number of parameters: vehicle kinematics, gradient of the road, altitude, maintenance level, vehicle age, vehicle loading, electric loads. Normally models refer to hot emissions as a function of kinematics (e.g. average speed or instantaneous speed and acceleration) and then multiply the ‘ideal’ hot emission value for a number of corrective factors taking into account the other mentioned parameters. Cold Start emissions are the emissions emitted from the start up until the vehicle reaches an almost steady state thermal condition. The cold start emissions affect in practice the first 3 or 4 kms of trip and are particularly relevant for catalyst vehicles: for CO and VOC the ‘cold start emission’ is roughly 10 times higher than the hot emission term. Evaporative emissions are the emissions of unburned fuel from the ‘weak points’ of the vehicle: tank and canister. Current classic modelling recognises three different contributions to evaporative emissions: a) ‘running emissions’, emitted when vehicles are driven (emissions at tank level), b) ‘Hot Soak’ emissions, emitted from the canister at trip conclusion, and ‘Diurnal emissions’, emitted at tank level by vehicles already parked. Evaporative emissions are a relevant fraction of total transport related VOC emissions, and so have a major role in the planning of measures for reducing VOC related pollution (e.g. critical benzene air pollution in Southern European cities). Two fundamental paths for increasing the accuracy of link based emission models are the more realistic modelling of vehicle kinematics and parking processes. The other direct impacts deriving from transports are noise and accidents. The noise emission calculation is rather standard, as the EC has recommended using the emission values and formulas provided by ‘La guide des bruite’, while regarding the accident occurrence there are several models available in literature. The accuracy of the models selected for any impact evaluation or inventory is a crucial point for the analyst. The accuracy of emission models is strongly related to the quality of the experimental data on which the model is developed. The information provided in the summarising tables on the models source data can therefore be regarded as a first element for the evaluation of models accuracy. Spatial and time scale of the calculations also have an impact on the accuracy of models in general. It is common perception and experience that models perform better in large scale calculations (long time windows and large areas): probably this is also the case for emission models. To calculate pollutant emissions in very short episodes in small urban areas such as intersections is clearly more difficult than estimating the same quantities in terms of average values over larger domains and/or for longer time windows. This general conclusion must not, however,discourage model users from trying small scale calculations (so important in some impacts analysis): there are indeed cases where the accuracy obtainable in micro-scale is reasonably good (it will depend on the quality of the description of the site and of the vehicles, and on the quality of the model source data such as speed dependent emission factors). Crucial for the confidence in a selected emission model is the quality of the fundamental input data: traffic flows and vehicles behaviour. This corresponds to the general problem of all simulation models: which part of their inaccuracy is due to the input inaccuracies? Such a question is likely to remain partly unanswered also for emission models, simply because it displaces part of the
ISHTAR Project Publishable Final Report
28
responsibility on the up-stream model inside the calculation chain. Nevertheless the problem must be carefully taken into account by model users, especially for those aimed at developing 'delicate' calculations as those involved in impacts analysis are (often differences of a few percent are searched). Any error in traffic flow rate will cause by itself a proportional error in road emissions calculation, but if the speeds should be derived from such a flow rate, the error on emissions could increase further due to speed effect on some pollutants (it could be the case of CO and HC). There is no general rule on the preference of sophisticated models as compared to simplified ones, or vice versa. Sophisticated models are potentially more accurate but need more input data, while simplified models require less input but usually do not represent correctly complex processes. When it is possible to have detailed and reliable input data, the use of advanced models (capable of minimising the 'modelling error') is advisable. When such data are not available, simpler models can be used, provided that .their own input data show adequate accuracy. Such a conclusion is not an invitation to quietly rely on the use of simple models fed with a few 'reasonably good' input data.. On the contrary, the area of transport impacts assessment clearly appears as an area of research where a continuous upgrading of data and models is really needed. So all emission models users are invited to develop evaluation activities capable of bringing the best possible data compatible with currently available (and economically compatible) technologies and methodologies. The selection criteria used for the choice of the optimal model to be used in the ISHTAR Suite are summarised as follows :
1. capability to predict impacts in terms of sensitivity to the parameters likely to be affected by the measures considered (e.g. fleet composition, vehicle kinematics…);
2. not only simulation of emissions but also accident occurrence and noise emission 3. adequate modelling of vehicles kinematics and cold emissions which are the two most
relevant factors affecting emission absolute values and changes between two scenarios. 4. capability to provide results related both to a single link in a single hour and to a complete
domain of the network in a flexible time interval. 5. capability to consider all the vehicle categories belonging to the European fleet. 6. advanced cold emissions distribution modelling based on parking process representation. 7. capability to describe vehicle kinematics in a reasonably simple fashion allowing the
applicability to the analysis of extended urban networks 8. capability to utilise in a flexible way the data provided by the various traffic models
available in the involved cities. 9. possibility for the consortium to involve model owner for both marketing issues
simplification and possible model upgrade objectives. Practically only TEE 2004 has the above characteristics, there aren’t other Software tools that simulate noise emission of pollutant and noise together with the accidents occurrence. Furthermore there is a specific advantage represented by the fact that TEE is developed by a partner - capable of implementing further functionalities possibly requested by the consortium.
ISHTAR Project Publishable Final Report
29
2.5 Air Pollutants Dispersion modelling The demands of the ISHTAR suite concerning air-quality models is determined one side by the demands of WP6 (health effects) and WP7 (damage of monuments) and on the other hand by the air quality requirements of the EC, WHO and national legislation. The major influences on human health are determined by the concentrations of particulate matter with aerodynamic diameters up to 10 µm or 2.5 µm (PM10, PM2.5), nitrogen oxides (NOx), nitrogen dioxide (NO2), carbon-monoxide (CO), ozone (O3), volatile organic compounds (VOCs), polycyclic aromatic hydrocarbons (PAHs) and benzene (C6H6). The temporal resolution for a reasonable exposure modelling starts at 10 minutes up to yearly averages. The precise demands from EC are given by the COUNCIL DIRECTIVE 1999/30/EC, in which the concentrations of SO2, NOx, NO2, PM10 and lead is restricted. The shortest time interval starts from 1 hour mean values and goes up to yearly averages. In addition ozone is restricted in AOT40 threshold values, which are difficult to model. AOT40 (expressed in (µg/m³)·hours) means the sum of the difference between hourly concentrations greater than 80 µg/m³ (= 40 parts per billion) and 80 µg/m³ over a given period using only the 1 hour values measured between 8:00 and 20:00. WHO has guideline values for the "classical" air pollutants, and Guidelines based on non-carcinogenic health endpoints and the Guidelines based on carcinogenic health endpoints. There are many pollutants which can not be modelled due to the fact that emissions are unknown and chemical reactions are sometimes complex. From all the demands only a restricted number of pollutants can be estimated by models. In addition, the more species a model should be able to treat the higher the computational demand grows. Many local (urban) pollutant concentrations are influenced by long and medium range transport and chemical reactions. Typically a large fraction of PM10 and PM2.5 is transported from outside the city contributing to the urban PM- concentrations. Also ozone is - to a large amount - influenced by regional transport. Therefore the models suite should be capable of treating the regional scale with the effects of chemical reactions. For many pollutants the local emissions determine the air quality values in urban environments. Typical examples are traffic emissions, domestic heating or industrial sources. From traffic, which is the major concern in ISHTAR, the concentrations of NOx and NO2 are mainly influenced. In order to get these values the models should be able to cope with the local emission sources. There are two different approaches available (a) a simple (mostly Gaussian) dispersion model where many sources and a large area up to a whole city can be treated and (b) (Computational fluid dynamics) CFD-modelling with a good resolution of the obstacles. The latter can treat only small areas due to the enormous computational effort. Another drawback is the effort for getting reasonable 3-d data of the obstacles. Both groups of models can treat the conversion of NO to NO2 in a diagnostic way. Concluding the above mentioned demands and the model capabilities in the different scales, one must state that modelling can always only be a compromise. The compromise must be made between the number of pollutants and the time and space resolution. The model suite must be able to calculate the basic requirements of the law and the other workpackages of ISHTAR on PCs. Therefore the ISHTAR suite should comprise both a simple Gaussian model for local scale dispersion and a complex prognostic mesoscale model with a chemical reaction scheme. For the use of the Gaussian dispersion model for urban areas the influence of street canyons should be included. From the demand that the ISHTAR suite should be sold to city authorities, there must be a reasonable support available. If the models are build together by partners, which to not sell the software commercially, there will be a big demand in the future on solving problems, answering questions of different users European wide. This led to the choice of the ISTHAR partner ARIA for the air quality models. ARIA is commercially dealing with air quality software and has therefore the infrastructure to deal with support. The models of ARIA fulfil all the major demands which are requested and can be fulfilled by other models. The two model packages ARIA-Impact (already completely integrated within the
ISHTAR Project Publishable Final Report
30
Suite) and ARIA-Regional (not yet integrate, but the integration is easy to implement if required) are the two tools that are part of the ISTHAR suite. Nevertheless there should also be a possibility to fit in another Gaussian model e.g. from US-EPA. This should be possible by making all the interfaces well described and with a clear concept. Especially for the Gaussian models this should be possible. Gaussian models are the most common air pollution models. They are based on the simple formula that describes the three-dimensional concentration field generated by different sources under stationary meteorological and emission conditions. In a general reference system, the Gaussian plume formula for a single point source is expressed by:
??
?
?
??
?
????
????
? ??
???
?
?
???
?
?
???
????
??
?
22
21
21
2z
re
y
r zhy
zh
eeu
QC
??
??? with: u ….. the average horizontal wind speed he …. effective emission height yr, zr .. coordinates in a wind-oriented coordinate system (u // x) s y, s z . standard deviations (horizontal and vertical) of the plume concentration spatial distribution Concentrations computed with the Gaussian equation depend strongly upon a correct calculation of s y and s z. Several schemes are available which allow the computation of s y, and s z from atmospheric stability class and the downwind distance. The stability class can be achieved using Pasquill or Turner methods or from measurements of either ? ? or ? w (standard deviation of wind direction or vertical wind) or vertical temperature gradient. There exist sigma functions e.g. from Briggs (1973) especially for urban conditions. Special dispersion conditions can be treated using several modifications of the Gaussian equation: The Gaussian equation can be spatially integrated to simulate the effects of line, area, and volume sources. The integration is often carried out numerically. There exist many Gaussian dispersion models from US-EPA and many other authors. ARIA Impact contains the simple Gaussian dispersion model with the following typical objectives:
?? Statistical assessment of long-term impact of industrial and traffic emissions on air quality ?? Comparison of concentration levels with regulatory norms (annual averages, percentiles) ?? Statistical analysis of meteorological data (time series, wind roses)
Main features: ?? Space scale : From 5*5 km to 30*30 km. ?? Meteorological data input : series of 1- or 3-hourly data from a meteorological station or
during a particular meteorological situation. ?? Emission data input : pollutant description (gas and particles). Emissions and characteristics
of point (industries), linear (traffic), area or volume (domestic heating, diffused VOC emission, etc.) sources. Monthly, weekly, and hourly modulations for each source.
?? Meteorological model :Vertical meteorological profiles computed from ground measurement time series.
?? Dispersion model : Gaussian dispersion model. Industrial plume rise. Simplified topography. Dust settling velocity.
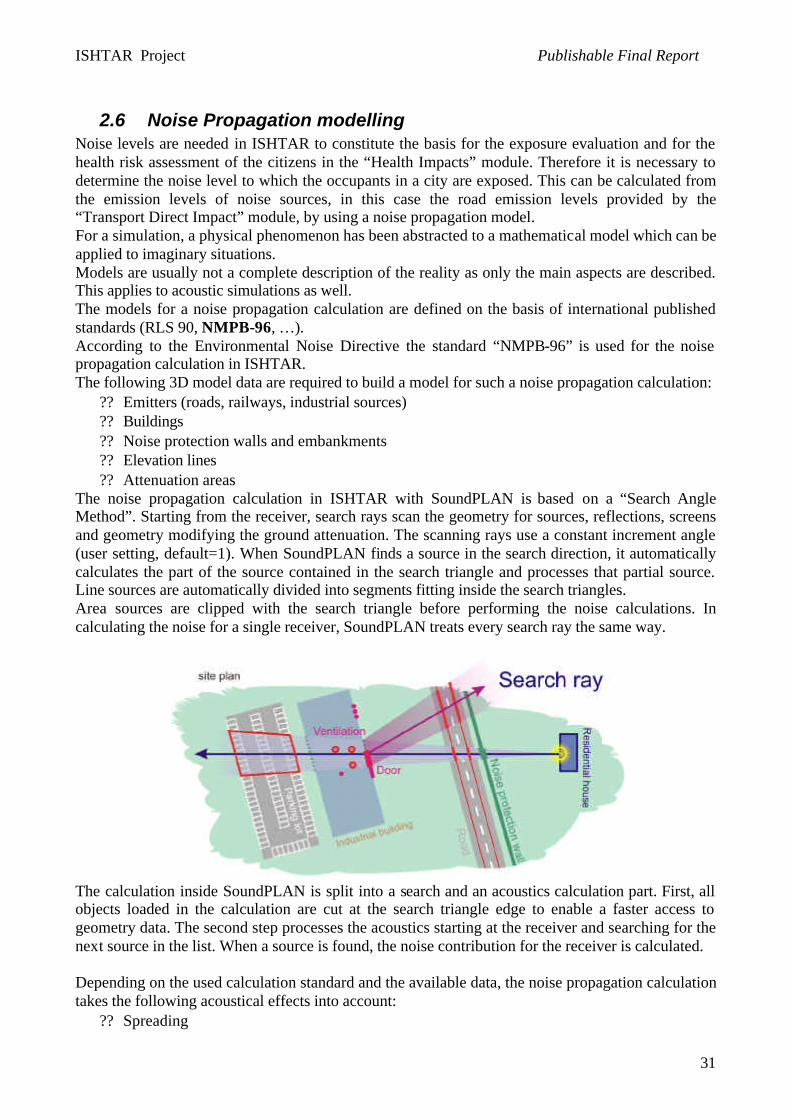
ISHTAR Project Publishable Final Report
31
2.6 Noise Propagation modelling Noise levels are needed in ISHTAR to constitute the basis for the exposure evaluation and for the health risk assessment of the citizens in the “Health Impacts” module. Therefore it is necessary to determine the noise level to which the occupants in a city are exposed. This can be calculated from the emission levels of noise sources, in this case the road emission levels provided by the “Transport Direct Impact” module, by using a noise propagation model. For a simulation, a physical phenomenon has been abstracted to a mathematical model which can be applied to imaginary situations. Models are usually not a complete description of the reality as only the main aspects are described. This applies to acoustic simulations as well. The models for a noise propagation calculation are defined on the basis of international published standards (RLS 90, NMPB-96, …). According to the Environmental Noise Directive the standard “NMPB-96” is used for the noise propagation calculation in ISHTAR. The following 3D model data are required to build a model for such a noise propagation calculation:
?? Emitters (roads, railways, industrial sources) ?? Buildings ?? Noise protection walls and embankments ?? Elevation lines ?? Attenuation areas
The noise propagation calculation in ISHTAR with SoundPLAN is based on a “Search Angle Method”. Starting from the receiver, search rays scan the geometry for sources, reflections, screens and geometry modifying the ground attenuation. The scanning rays use a constant increment angle (user setting, default=1). When SoundPLAN finds a source in the search direction, it automatically calculates the part of the source contained in the search triangle and processes that partial source. Line sources are automatically divided into segments fitting inside the search triangles. Area sources are clipped with the search triangle before performing the noise calculations. In calculating the noise for a single receiver, SoundPLAN treats every search ray the same way.
The calculation inside SoundPLAN is split into a search and an acoustics calculation part. First, all objects loaded in the calculation are cut at the search triangle edge to enable a faster access to geometry data. The second step processes the acoustics starting at the receiver and searching for the next source in the list. When a source is found, the noise contribution for the receiver is calculated. Depending on the used calculation standard and the available data, the noise propagation calculation takes the following acoustical effects into account:
?? Spreading
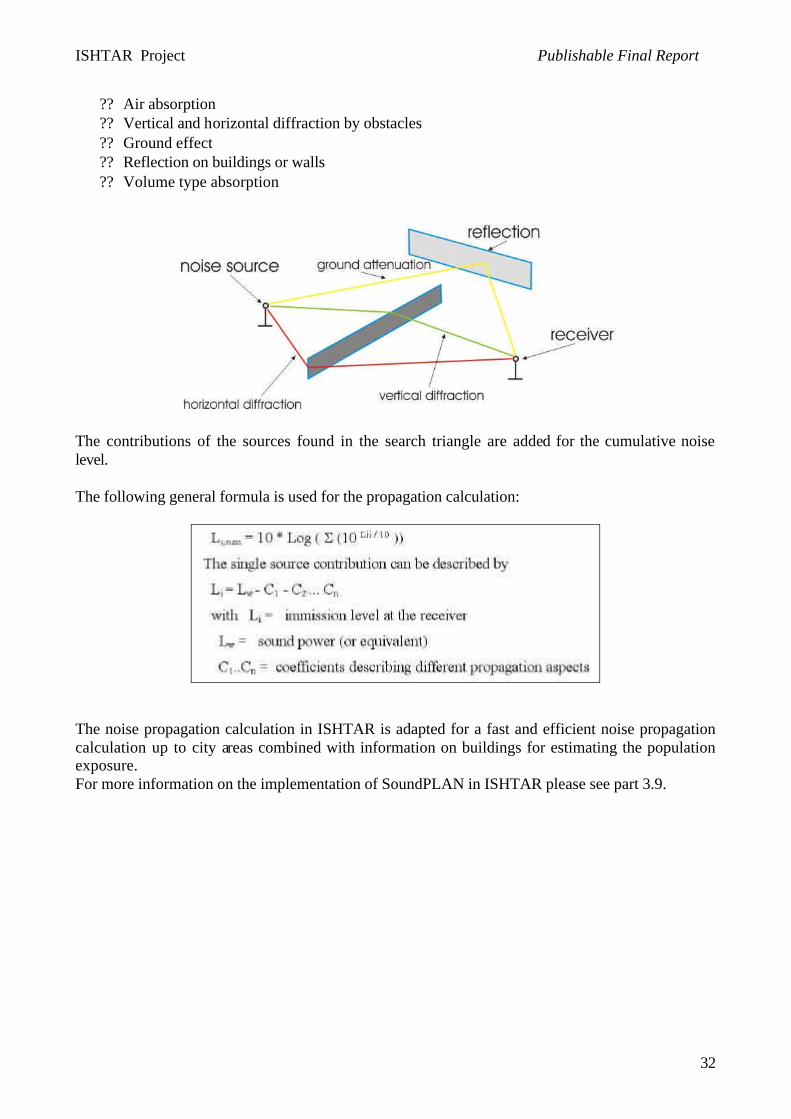
ISHTAR Project Publishable Final Report
32
?? Air absorption ?? Vertical and horizontal diffraction by obstacles ?? Ground effect ?? Reflection on buildings or walls ?? Volume type absorption
The contributions of the sources found in the search triangle are added for the cumulative noise level. The following general formula is used for the propagation calculation:
The noise propagation calculation in ISHTAR is adapted for a fast and efficient noise propagation calculation up to city areas combined with information on buildings for estimating the population exposure. For more information on the implementation of SoundPLAN in ISHTAR please see part 3.9.
ISHTAR Project Publishable Final Report
33
2.7 Population Exposure modelling The distribution of exposure in the population is an important issue. Exposure models try to highlight the different aspects that concern the different microenvironments of population activities. Measuring exposure to a pollutant requires information on the pollutant concentration at a considered location and the duration of contact with individuals or population groups. When the concentration of a pollutant to which a person is exposed can be measured or modelled, exposure is determined from concentration and time spent in contact with the pollutant. Fundamentally, there are currently three types of exposure model: 1) a model that estimates exposure in different microenvironments, 2) a model that describes the distribution of the population across these microenvironments, and 3) a model that assess exposure based on the fraction of emissions from each source that is inhaled. In the first case the microenvironment exposures are modelled on the basis of concentrations at fixed monitoring site. Microenvironment exposures are then calculated using either empirical data on I/O ratios. These types of models use time-activity data to model individual (deterministic) exposure, or population (stochastic) exposures from time activity patterns of population. In addition to providing exposure concentrations, several of these models have the ability to model dose. The second type of model uses a combination of dispersion modelling and GIS to model concentrations at outdoor locations. The third type of models can be calculated as the product of the emission rate for a specific source and the relevant intake fraction for that source. Three different intake routes can be considered: inhalation, ingestion and dermal uptake. Data on time activity patterns are crucial inputs to exposure models. These may either be obtained empirically (e.g. from surveys) or by simulation (e.g. using Monte Carlo techniques). Data on activity patterns should include the type of micro-environment (e.g. home, work, leisure), specified for each time interval, geographical co-ordinates of each location, including the start and end locations of journeys, and travel time and mode. Usually the Time Activity Patterns data give a broad picture of the percentage of time spent in different microenvironments during one day (24 hours) by the population of a city. A number of exposure models have been developed in recent years, but very few of these are readily available. More recent models have generally been developed within a Geographical Information System (GIS) environment, in order to provide relevant spatial analysis capability, e.g. by intersecting air pollution maps with time activity patterns of individuals or population sub-groups. A GIS-based exposure model was recommended and developed for ISHTAR. Within a GIS framework it is possible to make exposure estimates at the individual or the cohort level. Broad-scale estimates of population exposure to air pollution can also be made by overlaying population distribution, e.g. at the scale of census districts, onto maps of long-term average pollution concentrations (no account thus need to be taken of detailed time-activity patterns). The improvement of exposure measurements can support decision-making processes because:
?? exposure assessment is fundamental to health impact assessment; ?? space/time activity patterns are not uniform across the population and there is a need for
distinguishing the exposure among different vulnerable sub-groups particularly sensitive to traffic risks (e.g. elderly and children);
?? the use of relative changes in exposure/effects resulting from different policy alternatives, compared to a reference value, can offer an estimate of the benefits that would be achieved by reducing average concentrations and exposures.
More precise methods for assessing the exposure of population to traffic risks are not only a direction of research but are also needed for better scenario simulation and policy applications.
ISHTAR Project Publishable Final Report
34
2.8 Health Impacts modelling The impacts of traffic on health can produce several effects. Among the negative effects, air pollution, noise and accidents were evaluated in ISHTAR. The scientific evidence on the health effects of ambient air pollution has been growing in recent years. Several questions remain open, but many epidemiological studies have demonstrated the importance of air pollution as a risk factor for mortality and morbidity. Among the air-pollutants, the role of suspended particulate matter (PM) has been especially investigated with regards to its short- and long-term effects on mortality and morbidity. Most of the scientific evidence available to date concerns PM10 and PM2.5 (particles less than 10 and 2.5 mm across). The consistency of the findings of epidemiological studies and the availability of reliable concentration-response models, together with the availability of extensive concentration data routinely collected by monitoring stations, have recently enabled the quantitative estimation of the health impact of PM on the health of populations of several countries in the world. In these evaluations, PM has been used as a summary indicator of air quality, and the findings indicate the burden imposed on health by PM pollution, and in some cases the associated economic costs, on the assumption that PM might be responsible for direct effects but also capture the effects of other correlated pollutants. The general approach that has been followed is based on these steps: (1) establish a set of health endpoints that are known to be associated to PM exposure and for each of these do the following; (2) identify a concentration-response coefficient and its confidence interval, using data published in the epidemiological literature; (3) estimate the proportion of the events observed in the study population that is attributable to PM concentration, and the corresponding absolute number of cases over a given time period; this is a function of the concentration-response coefficients, the measured PM10 concentrations, and the observed incidence rates or prevalence of the health endpoints in the study population. This approach provided a methodology for implementation in a software package integrated within the ISHTAR suite. The health impact of outdoor urban air pollution can be derived on the basis of predicted or measured PM concentrations and population data. More specifically, given a city or an area within a city, the input information should consist of: PM10 and/or PM2.5 concentration data for the city/area. These should be calculated as the average of concentrations measured over a period of time of at least one year; when data from several monitoring stations are available, homogeneous stations should be used, selecting those that are representative of the urban environment. For example, background stations located within large parks should be omitted. Demographic data: age-sex structure of the resident population would be ideal, or at least number of residents of age 0-14 and 30+. Incidence or prevalence data for the outcomes listed above. It is possible that some of those can be estimated using data in the literature, for example when surveys on respiratory health are not available for the local population. Data on mortality and hospital admissions, however, should be collected directly, again by age as for demographic data. With this information as input, it is possible to produce estimates of the impact for different health endpoints (with confidence interval) through appropriate algorithms, using dose-response coefficients as described above. Results would also be a function of the reference concentration level considered. There is an increasing perception of traffic-related noise among European populations and, in the last years, several studies have investigated the impact of noise. Exposure to noise may result in adverse effects on health. The review on health impact due to noise exposure draws attention to the fact that there is sufficient evidence for developing dose-response curves between noise exposure and annoyance and sleep disturbance. Noise can also produce cardio-vascular effects and children
ISHTAR Project Publishable Final Report
35
can represent in some circumstances a vulnerable group. Another conclusion of policy relevance is that no definitive thresholds have been identified below which it is unlikely that impacts on health occur. The main negative effect of traffic on the population is represented by crashes that every year provoke thousands of deaths and injured people. There are two kinds of risk models in traffic safety, one developed by traffic engineers and another used by epidemiologists. The first group includes predictive models for the number of accidents. One limitation is that those models cannot be used to estimate individual risks or identify a “dose”-effect relationship. The models used by epidemiologists on the other hand try to identify the form of the relationship between a critical risk factor such as speed and the frequency or the severity of a collision between moving vehicles and road users. While general risk indicators are available at the scale of the whole road network based on a measure of exposure to the risk, uncertainties remain concerning the type of road-user and the most appropriate measure of exposure for pedestrians or bicyclists. The most referenced models concern the probability of being killed in relation to the speed of impact. The average travelling speed has to be considered as the main risk factor of the severity of an accident. A relationship between the relative risk of the fatal and injury accident rates has been established on the basis of all the experiments conducted on speed limitations and used in ISHTAR. The principal need is for more integrated methods for health risk assessment which consider the full range of exposures and health effects, and can be applied early in the policy or planning process. In this reversing the political decisions process that most of the times are based on very limited ex-post assessment of traffic risks and exposure of the population
ISHTAR Project Publishable Final Report
36
2.9 Monuments damage modelling The main objective of WP7 was to develop a software tool assisting in: - Expert estimation of damage of monuments and buildings due to the level of specific
atmospheric pollutants. - Assessment of the impact of environmental urban policies in the long term. These will imply a
reduction of costs for restoration. The expert estimation of damage – first module of the software - is based on a methodology given in previous deliverables. The development of the methodology concerned the: ?? collection of information on the atmospheric pollutants - in particular those deriving from traffic
and buildings - and the possible effects on the artistic heritage and monuments in particular. ?? definition of Input and Output data, in the two Options of the WP7 tool. ?? data base construction The second module of the software has modelled the damage produced by a single pollutant or a combination of pollutants on the surface of monuments. As a consequence of policies in the long term, a reduction both in damage and restoration cost can this way be estimated. In order to respond to the different priorities associated with the user different expertise, it was decided to provide the user with two options for damage assessment differing at the level of monument treatment. ??Option 1 calculates the damage based on specific conditions given by the user without taking
into account a specific monument but considering specific categories of monument materials (i.e. calcareous stones) for which generic damage equations are available.
??Option 2 assesses the damage induced on a specific monument.
The first option serves better the impact evaluation of certain traffic conditions / transport policy at a large scale. It provides general results showing the increase or decrease in damage rate that certain monument materials will undergo. In other words Option 1 gives an index of potential damage rate of certain materials under a set of predefined conditions, and, can also be used to assign an index of danger resulting from a set of traffic conditions/policies. The index of danger adopted here results from a comparison of the damage induced by the conditions under investigation with a set of predefined limits of pollutant concentrations. Option 2 views a specific monument and how the pollutant conditions can affect it. It is more suitable for a monument preservation expert than a transport policy maker. The usefulness of option 2 lies with the fact that the expert can make his/her own judgement of the potential damage and the associated risk due to pollutants by taking into account simultaneously several factors that all influence the pollutant deposition and therefore, the damage. The most relevant factors are given below:
?? microclimatic conditions around the monument ?? pollutant concentrations ?? pollutant deposition ?? characteristics of the surrounding built space ?? environmental characteristics

ISHTAR Project Publishable Final Report
37
The provision of two options was foreseen for the following reasons: ?? Option 1 may be used when a large scale –i.e. urban or rural area- estimation of potential
damage on monument materials is needed. The estimation is performed via empirical equations suitable to few general categories of materials with specific properties. The results are general and cannot be used for a specific monument. However, they can be obtained with very little effort from the user and can be subsequently used to characterise the severity of prevailing environmental conditions with respect to damage.
?? Option 2, can be used for specific monuments. The assessment of damage is qualitative and semi-quantitative and can be performed by a monument conservation expert mainly. Also this option can lead to the characterisation of the severity of prevailing environmental conditions. However, it requests a good deal of effort for data input.
Option 2, though the quantitative results may not have the desired accuracy (due to the fact that data are currently missing) offers to the expert user the possibility of improving the methodology used. In the future the methodology can be enriched, not so much with quantitative output, but with qualitative ones concerning the damage evolution. Such qualitative output could be the association of micro- climatic with macro-environmental conditions and their overall association with damage evolution. Another interesting point for future research is to be able to associate the exposure, orientation, tilt and microclimate with the geometry of monument surfaces and the condition of their materials. The estimation of damage caused by pollutants is made by empirical generic equations available in the current literature. It is clear that the use of empirical equations may possibly result in predictions with reduced levels of accuracy. This is due to many factors such as the directionality of damage that is associated with the prevailing exposure conditions, the material that the monument is made of etc. For example, different characteristics (i.e. porosity) in the same category of material -e.g. calcareous stones- may lead to greater or less damage. Such specific situations are not taken into account by the available equations to be used in the software. The damage functions, developed in order to describe the deterioration of the materials in relation with the atmospheric pollutants, together with other guide parameters (i.e. climatic and microclimatic parameters) are continuous functions, the main part of them of linear type. This linearity does not permit the identification of a threshold value about the critical concentration of pollutants in order to determine a ‘jump of quality’ in the condition of conservation of monuments exposed to the external environment. Though the results produced by the use of the existing empirical equations are rather limited regarding the emissions and materials, MODA s/w concentrates and reflects in an easy and useful way the whole knowledge, currently available, on damage of monument surfaces that could be measured in a quantified way. An interesting point that the software will aim at is to associate the micro-environmental conditions with damage evolution. Because research on materials is advancing - though a large part of them are not applicable to monuments – it is important to establish an updating procedure and apply, after having filtered, this new knowledge to monument materials. Thus the accuracy of MODA results will improve. Other interesting points that MODA s/w will aim at, are related to micro climatic and environmental conditions as detailed in the following subchapter. To co-operate with the competent bodies (i.e. ministries of cultural heritage, curators, municipal technical services of towns with historical centres, etc.) in order to adapt the s/w to the needs of potential users. That is the s/w from the current research level, will evolve to a more operational stage that can support the every day work of the monument curators. In order to make the s/w user-friendlier there is an imperative need to develop simplified input data regarding both climatic and pollution conditions.
ISHTAR Project Publishable Final Report
38
2.10 Overall analysis of policy scenarios The ISHTAR software suite is constructed from a range of software tools developed in workpackages 2, 3, 4, 6 & 7. In assessing the benefits from measures the changes in the direct impacts of transport and the indirect impacts on health and damage to artistic heritage are to be input from WPs 3, 6 & 7. The changes in the transport efficiency as a result of the measures can also be calculated using the data in WP 3 which originated in the traffic models used in WP 2. However, as there is now a common database, the information all comes directly from there. Monetary values are ascribed to the benefits and disbenefits arising from the transport and urban planning measures. However, this provides an incomplete analysis as it excludes effects that cannot be monetised and distorts others due to the assumptions required to estimate monetary values. Therefore, a multi-criteria analysis technique is used which can analyse impacts which have no, or imprecise, monetary values. A framework approach combines CBA and MCA; the framework includes the social and policy priorities of the decision makers representing local communities need to be brought in so that indicators of the disparate elements can be given appropriate weights and so be evaluated in a coherent way. Two types of models are needed for this module. These have been integrated into an overall assessment framework model adapted from EUNET which includes a methodology for weighting decision-makers' priorities. This evaluation framework includes and combines three fundamental and related elements
?? A conventional cost-benefit calculation, which informs of economic realities through a monetary assessment of the benefits and costs associated with a scheme
?? Numerical or qualitative measures (e.g. pollution and noise levels, comparative descriptors - a form of multi-criteria analysis)
?? An analysis of decision-makers' policy priorities, i.e. relative importance weights The framework analysis uses these elements as inputs, and provides an assessment of the extent to which the implemented measures, in terms of social and environmental outputs (proxied in health and monuments models) corresponds to the decision-takers’ aims and values. The cost-benefit analysis tool is required to assess the economic implications of the outputs of WP3. Cost-benefit analysis seeks to value the expected impacts of an option in monetary terms. This tool is therefore capable of providing monetised assessments of changes in:
?? Fuel consumption ?? Emissions ?? Heritage ?? Noise ?? Safety ?? Changes in travel time by users of all modes (congestion) ?? Vehicle operating costs (non fuel costs) ?? Scheme capital costs ?? Scheme operating costs
The economic impacts or traffic and environmental policies, programmes and measures cannot all be assessed under the standard cost-benefit analysis format. Macro effects, which are national and regional impacts, such as employment effects or the impacts on regeneration and regeneration initiatives, have to be assessed using other techniques. They are not, in any case relevant to the objectives of the ISHTAR project and are therefore not included.

ISHTAR Project Publishable Final Report
39
The chosen multi-criteria evaluation method is able to judge the extent to which quality of life has changed as a result of implemented measures in accordance with the wishes of decision-takers, bearing in mind the existence of
?? multiple criteria, ?? the objectives of decision-takers
It combines
?? quantitative criteria, ?? subjective judgements ?? objective judgements
In simple circumstances, the process of identifying objectives and criteria could possibly provide enough information for decision-makers to choose between alternative possibilities.3 However the ex-post evaluation of the case studies in the ISHTAR project is a complex task which requires a substantial amount of detail and the combination and assessment of many disparate types of information.
3 DTLR, London 2000 Multi Criteria Analysis: A Manual
ISHTAR Project Publishable Final Report
40
2.11 Models integration approach Very early there appeared a need to allow the original WPs softwares to be as little f modified as possible, to be able to follow their evolutions and to permit new modules to be integrated with the suite.
Then, for each WPs software a kind of plug-in, called connector, had to be written to interface the application in a common way.
It was also necessary to have a central application “integration manager” communicating in a unique language with the different WPs.
The application integration in Ishtar Suite is based on 3 principles ?? The integration function is assumed by a central application, called an "integration manager" ?? The exchanges between the application manager and the applications are done by means of
messages ?? The pivot format for data exchanged between applications is XML
2.11.1 Message communication The messages are the support of exchanges between WP tools and the integration manager. They contain the requests for data and central monitoring of the execution.
The integration manager provides a message broker which undertakes the routing of messages coming from applications, the transformation of data transferred and the sending of messages to applications. This management is done with a database of rules for messages routing and transformation.
2.11.2 Processes monitoring The integration manager controls the execution of processes in the suite of applications, according to the rules of chain. It manages the launching of applications, the checking of their execution and the recovery of errors.
It has also to manage an archive database, storing all the context data used during the execution of a scenario: various parameters of the scenario, corresponding input data and results of the execution.
In this way, the successive executions of the suite can be kept and re-used.