fiffffifi˙ˆˇfi˙ - cpm€¦ · 35 demystifying artificial intelligence & how it will make...
TRANSCRIPT

THE MEASURABLE NEWS
2018.01The Quarterly Magazine of the College of Performance Management
mycpm.org
INSIDETHISISSUE
09 13 21 25Cost Risk Management
By David Graham
Why Compliance Needs to Change
By Raimund Laqua
Accounting for Software: Understanding CAPEX and OPEX
By Frank Scavo
What is Risk?
By Glen B. Alleman, Thomas J. Coonce, and Rick A. Price

CONTENTS05 Letter from the Editor(s)
07 Message from the President
09 Cost Risk ManagementBy David Graham
13 Why Compliance Needs to ChangeBy Raimund Laqua
21 Accounting for Software: Understanding CAPEX and OPEXBy Frank Scavo
25 What is Risk?By Glen B. Alleman, Thomas J. Coonce, and Rick A. Price
35 Demystifying Artificial Intelligence & How it Will Make Project Planning BetterBy Dr. Dan Patterson, PhD and Paul Self
41 Under-Spend: An Earned Value Analysis of 60 Projects in the SahelBy Stephen Fierbaugh, PMP
51 Vendors/Services
2018 ISSUE 01
THE MEASURABLE NEWS
2018.01The Quarterly Magazine of the College of Performance Management
mycpm.org

THE COLLEGE OF PERFORMANCE MANAGEMENT
2018 BOARD & STAFFPRESIDENTWayne Abba 703-658-1815 • [email protected]
EXECUTIVE VICE PRESIDENTKym Henderson +61 414 428 537 • [email protected]
VICE PRESIDENT OF FINANCEBrian Evans 703-201-3278 • [email protected]
VICE PRESIDENT OF ADMINISTRATIONLauren Bone +44 (0) 7766 97 40 63 • [email protected]
VICE PRESIDENT OF CONFERENCE & EVENTSKathy Evans703-201-3278 • [email protected]
VICE PRESIDENT OF EDUCATION & CERTIFICATIONBill Mathis703-825-5588 • [email protected]
VICE PRESIDENT OF RESEARCH & STANDARDSMarty Doucette317-727-1237 • [email protected]
VICE PRESIDENT OF COMMUNICATIONSLisa Mathews301-802-0627 • [email protected]
PAST PRESIDENTGary W. Troop 310-365-3876 • [email protected]
EXECUTIVE DIRECTORDon Kaiser703-370-7885 • [email protected]
THE MEASURABLE NEWS IS AN OFFICIAL PUBLICATION OF THE COLLEGE OF PERFORMANCE MANAGEMENT
EDITORIAL STAFFPublisher: College of Performance ManagementStory Editors: Glen B. Alleman and Rick PriceDesign: id365 Design + CommunicationsCommunications VP: Lisa Mathews
EDITORIAL COPY Editorial contributions, photos, and miscellaneous inquiries should be addressed and sent to the editor at the College of Performance Management (CPM) headquarters. Please follow the author guidelines posted on the CPM web site. Letters submitted to the editor will be considered for publication unless the writer requests otherwise. Letters are subject to editing for style, accuracy, space, and propriety. All letters must be signed, and initials will be used on request only if you include your name. CPM reserves the right to refuse publication of any letter for any reason. We welcome articles relevant to project management. The Measurable News does not pay for submissions. Articles published in The Measurable News remain the property of the authors.
ADVERTISINGAdvertising inquiries, submissions, and payments (check or money order made payable to the College of Performance Management) should be sent to CPM headquarters. Advertising rates are $1000 for inside front or back cover (full-page ad only), $800 for other full-page ads, $500 for half-page ads, and $300 for quarter-page ads. Issue sponsorships are available at $2,500 per issue. Business card ads are available for $100 per issue (or free with full-page ad). Rates are good from January 1, 2018 – December 31, 2018. College of Performance Management reserves the right to refuse publication of any ad for any reason.
SUBSCRIPTIONSAll College of Performance Management publications are produced as a benefit for College of Performance Management members. All change of address or membership inquiries should be directed to:
College of Performance Management 11130 Sunrise Valley Drive, Suite 350Reston, VA 20191 Ph 703-370-7885 • Fx 703-370-1757 www.mycpm.org
All articles and letters represent the view of the authors and not necessarily those of College of Performance Management. Advertising content does not signify endorsement by College of Performance Management. Please notify College of Performance Management for single copy or reproduction requests. Appropriate charges will apply.
© 2018 by the College of Performance Management. All rights reserved.

SOLUTIONS THAT BRING ALL THE PIECES TOGETHER
�t S�� So�ware we have combined the latest, most powerful business intelligence technology with the exper�se of the best minds in project management to deliver powerful Business Intelligence, Business �naly�cs, and Integrated �rogram Management solu�ons. These solu�ons are transforming the way both government and industry conducts business.
The fusion of COTS domain knowledge augmented by an open, powerful, business intelligence pla�orm will put your organiza-�on ahead of the power curve rela�ve to your compe�tors, maximizing your return on investment and allowing you to build your corporate knowledge and exper�se to meet your current and future needs. This COTS/BI approach enables you to address your immediate needs, realizing immediate ROI, while providing flexibility for new and emergent requirements.
Our �roteus and Envision solu�ons eliminate redundancy, transform, and op�mize data, regardless of size, or source, or for-mat. �e have moved organiza�ons away from needing to manage the confusion of di�ering terminologies and applica�on, to an organiza�on with one source of truth that provides mul�ple pathways of analysis.
S��’s fourth genera�on so�ware is agnos�c to underlying data, and provides an open system that puts your organiza�on and SMEs back in the driver’s seat in determining how and which analysis they view. Our low-code environment allows changes and new func�onality to be released in a ma�er of days or weeks, rather than the structured yearly or bi-yearly releases that require new applica�on installa�ons found in tradi�onal third genera�on so�ware.
B������� I����������� P������ P�������� ���������� S�������������� E�� S������ P������ ���� I���������� ��� A�������� ����������� S����� A��������� � C���������
� �0�8 S�� SO�T��RE, ��C ��� R����� R�������. O�� T�� ����, ��� ��� ����� ���������� ��� ��� �������� �� ����� ���������� ������
866-389-6750 sna-so�ware.com

THE MEASURABLE NEWS
The Quarterly Magazine of the College of Performance Management | mycpm.org
2018.01
05
This edition’s papers cover a wide variety of topics connected to Integrated Program Performance Management. David Graham’s paper started as a proposed section in a NASA handbook on cost management. David makes the case for Continuous Cost Risk Management in the same way Continuous Risk Management found at the Software Engineering Institute and other risk management guidance does. This means tightly integrated cost risk management goes hand-in-hand with technical and schedule risk management. This section did not make it into the NASA handbook, but it needs to be part of any credible Integrated Program Performance Management process.
Ray Lagua is a new comer to our community. I worked with Ray in the OSHA 1910.119 domain of Process Safety Management. Ray and I have kept in touch on a regular basis and one of our discussion topics is compliance. In our EVM community compliance is one of the critical success factor for an EVMS. Ray’s experience in Safety Management has been that seeking compliance can mask the underlying processes that benefit the recipients of the compliance process.
Frank Scavo and I have corresponded for several years. I wrote a short blog post on Accounting for software costs and Frank took that work and turned it into a publishable paper. This topic becomes important when we apply EVM to software development in industry–government collaborative projects as well as commercial software projects. Separating capital expenditures (CAPEX) from operating expenditures (OPEX) is critical in the commercial world, as is separating the color of money on government development projects.
The risk management paper is a derivative from a much larger Joint Space Cost Council paper, written by Tom Coonce, Rick Price, and Glen Alleman. There is much confusion in the risk management domain about what is risk, where does it come from, and what can we do to deal with it. This paper established the foundation needed to answer those question. This foundation is based on principles of managing in the presence of uncertainty and the resulting risks in the medical, science, and finance domains. Our EVM domain and even our Systems Engineering domain doesn’t treat risk in the same way. As such there are unaddressed issues that create risks themselves. This paper describes how to fix that gap.
Building Information Model (BIM) is a new topic at EV World. The Editors Bookshelf contains some background on this topic and a topology of how BIM is interwoven with program planning and controls. BIM is now standard in federal building projects, starting with GSA guidance. There are BIM–like models for shipbuilding, which has similar modular construction processes as vertical buildings. Connecting EVM to BIM is a natural next step in applying good Integrate Program Performance Management.
Dr. Dan Patterson and Paul Self provide an overview of artificial intelligence and how it can be combined with human intelligence to improve the realism of inputs used to plan complex programs. Accurate forecasting (time and money) are complicated by variabilities and uncertainties in our plans. Dan and Paul offer their approach called BASIS as a means of applying artificial intelligence to mine and learn from vast amounts of data combined with expert opinion as the foundation of establishing a more reliable and achievable program baseline.
Stephen Fierbaugh explores using Earned Value Management techniques to evaluate projects in Africa and look for insight into underspending. Although there may be some confusion in terminology, this article reinforces some key concepts advanced by proponents of EVM. Paramount to these is the understanding that EVM analysis is “only as good as the data it is based on”. This includes the original estimates and baselines and progress tracking data. To be useful management information, this not only requires the right data but good systems and standardized processes for providing the data. The article also reinforces the idea that good data alone does not ensure program success. You have to have the resources and apply them in a timely matter to successfully finish on time.
LETTER FROM THE EDITORSGlen B. Alleman and Rick Price

®
34th Annual International WorkshopMay 30 - June 1, 2018 • The Westin Fort Lauderdale, FL954-467-1111 • www.westinftlauderdalebeach.com
• Update your skills with the latest Earned Value Management (EVM) trends, tools, and techniques
• Learn through training, practice symposia, as well as workshops
• Earn PDUs (for PMPs)
• Network with earned value professionals from around the world
For more information visit:
www.mycpm.org or www.evmworld.org
©2017 CPM. EVM World is a registered trademark of CPM. R.E.P. PMI, and the Registered Education Provider logo are registered marks of the Project Management Institute, Inc.
SAVETHE DATE
“Intelligently Linking Information for Better Program Management”
EVM World 2018INTEGRATED PROGRAM PERFORMANCE MANAGEMENT (IPPM)

THE MEASURABLE NEWS
The Quarterly Magazine of the College of Performance Management | mycpm.org
2018.01
07
Springtime – finally! – finds us busily preparing for EVM World in Ft. Lauderdale, Florida May 30 – June 1, 2018. Our exciting program features two keynotes that promise to be interesting and informative. One is by Pat Finneran, President of Accelerated Performance Solutions LLC, an independent business consulting company and an experienced aerospace executive who will present case studies showing how he implemented performance management in several different programs at the Boeing company.
The other keynote will be delivered by Crispin “Kik” Piney, author of the book Earned Benefit Program Management, published by CRC Press in October 2017. The timing is serendipitous, as benefits realization is a key element of CPM’s new Integrated Program Performance Management (IPPM) certification scheme.
Kik’s background includes the IT Group at CERN (the European Laboratory for Particle Physics), the Digital Equipment Corporation (DEC), and extensive volunteer work with the Project Management Institute (PMI®) on a variety of topics including project, program, portfolio, risk, Earned Value, Organizational Project Management, scheduling, Work Breakdown Structures, and competency development. He currently works as an independent trainer and consultant.
And the keynotes are just the tip of the proverbial iceberg, with excellent workshops, practice symposia and training sessions rounding out the EVM World program. With 50 years of EVM experience as formal US government policy behind us, CPM continues to define the future of EVM-based performance management – IPPM. See you in Ft. Lauderdale!
MESSAGE FROM THE PRESIDENTWayne Abba

Since 1978, Humphreys & Associates, Inc. has passionately advocated and promoted the integration of technical, schedule, and cost components to achieve the full benefit of using a performance measurement system to enhance management visibility and control. We have a long tradition of leadership in the industry and creativity seeking a balance of proven and innovative EVMS processes to apply to project management challenges.
H&A is unique in the common sense approach we bring to organizing, planning, and controlling projects. We use proven methods and techniques that have been honed over decades of hands-on experience to achieve the most appropriate, timely, and cost effective results. Our solutions are always compliant with the ANSI-748 Standard for Earned Value Management Systems. We are the “911” of EVMS because government and industry both call us when they absolutely and positively must resolve an issue with an EVMS.
Humphreys & Associates offers a complete range of EVMS consulting services for the entire project life cycle. From proposal preparation and management system gap analysis to mock compliance reviews or contractor self-surveillance and third party validations, H&A is the authority in EVMS.
Because of our unparalleled breadth of knowledge and hands-on experience, H&A is the industry recognized leader in EVMS trainingand hands-on mentoring for project managers and control account managers.
Interested in learning more?
Visit our website at www.humphreys-assoc.com or call us today at (714)685-1730

THE MEASURABLE NEWS
The Quarterly Magazine of the College of Performance Management | mycpm.org
2018.01
09
ABSTRACT Management of cost-risk involves mainly the cost estimating and EVM processes. Other disciplines support these two main processes such as procurement, source selection, cost data collection and storage and cost data analysis. All of these disciplines are identified, organized and sequenced in the continuous cost-risk management process (CCRM). Programs/projects shall manage cost-risk in accordance with the CCRM process.
5.1.1 CONTINUOUS COST-RISK MANAGEMENT (CCRM) DEFINITIONA multi-step approach to cost estimating and project cost management that seeks to integrate the various project management activities that involve cost and cost risk. CCRM encompasses the following: cost-effectiveness trades detailed project definitions (CADRe development) and probabilistic, risk-based Life Cycle Cost Estimates (project cost S-curve) documented in the CADRe; RFP data requirement development; proposal evaluation; Earned Value Management for continuous management and reporting of risky WBS elements; disciplined cost and schedule rebaselining; periodic updates of the CADRe for continual reassessment of project cost estimates and cost-risk performance; and end-of-project data collection and storage in the One NASA Cost Engineering (ONCE) database for cost analysis improvement. CCRM emphasizes that the high-risk elements in the WBS most likely to cause adverse cost and schedule impacts are the common focus of these activities.
In the past, cost management has functioned as a set of “stovepipe” activities. In reality, cost management is a series of related cost activities and involves three main Stages that are linked together through a shared set of project risks. Cost management, in effect, is the management of cost-risk and can be characterized as continuous feedback on cost-risk. Feedback is essential to the transformation of cost management into a dynamic, continually reacting system where focused reporting of metrics on medium and high-risk drivers alert the project manager that negative cost trends have been identified and require action or positive cost trends have been identified signifying successful risk management. The three Stages of continuous cost-risk management (CCRM): Preparation for cost-risk feedback; Development of cost-risk feedback; and, Application of cost-risk feedback, occur at different points in time during an acquisition phase and involve the collaboration among cost estimators, project engineers, project managers, procurement analysts and Earned Value Management (EVM) specialists in managing the challenges presented by the risks. Cost management is not a grouping of unrelated stove-piped cost activities but is a "system of cost systems" based on viewing mainline cost and cost support activities normally treated as stovepipes as a continuum of activities interconnected through risk. The steps in CCRM are not new, however, much like the Lucent Technology slogan, “We don’t make the products you buy, we make the products you buy better”, the CCRM mindset makes the disciplines of cost management work better. CCRM repeats in most acquisition phases.
COST RISK MANAGEMENTBy David Graham

10 The Measurable News 2018.01 | mycpm.org
12
CADReDevelop Reference Point Cost Estimate
Identify & Assess WBS Element Risk
Risk &Risk &CostCost--RiskRisk
Translate Risk into Cost-Risk
PREPARATION STAGEPREPARATION STAGE
Develop RFP EVM & CADRe Cost DRD’s
Do EVM PerformanceMeasurement & CADRe
“S”-curve Analysis
Evaluate EVMS & LCCE in
Proposals
Do EVM Integrated Baseline
Review
DEVELOPMENT STAGEDEVELOPMENT STAGE
Compile End-of-ContractCost-Risk Data for
Evaluation, Analysis& Database
Updates APPLICATION STAGEAPPLICATION STAGE
Continuous Continuous CostCost--Risk Risk
ManagementManagement
This overall process can be visualized as a three-way Venn diagram with risk and cost-risk as their overlapping areas. Each part of the Venn diagram is a separate stage of the overall process. The first stage, “preparation” contains the activities that lead up to the identification of risk and its quantification as cost-risk. This information is migrated into the “development” stage for transmission to the feedback mechanisms of EVM and CADRe. That information is then used in the “application” stage to give the project manager the highest quality cost management information upon which to base his or her management actions. The overall process is termed “continuous cost-risk management” for its constant focus on those risky WBS elements most likely to cause the project manager cost and schedule problems.
5.1.1.1 CCRM Stage 1: Preparation The first Stage in CCRM, Preparation for cost-risk feedback, involves NASA project teams performing three main activities: cost/performance trades; developing a definition of the program (e.g., part of the Cost Analysis Data Requirements (CADRe)) and, producing a statistically-expressed range of possible costs (e.g., probability density function (PDF) and cumulative distribution function (CDF) or “S”-curve). Cost/performance trades are the first opportunity for representing the potential cost impacts due to risk. The CADRe will contain the definition of the project (analogous to the DoD Cost Analysis Requirements Description or CARD) for use by cost estimators where the traceability from Work Breakdown Structure (WBS) element, through functions, to initial requirements will be clearly identifiable. The cost range exemplified in a PDF and CDF involves developing a reference point cost estimate from a cost model (e.g., NAFCOM, ACEIT, PRICE, SEER, etc.) first and then incorporating cost estimating relationship (CER), cost model input (e.g., weight, power, etc.), and technical/programmatic (e.g., TRL, schedule, design/engineering, etc.) uncertainty with element correlation to produce a
This overall process can be visualized as a three-way Venn diagram with risk and cost-risk as their overlapping areas. Each part of the Venn diagram is a separate stage of the overall process. The first stage, “preparation” contains the activities that lead up to the identification of risk and its quantification as cost-risk. This information is migrated into the “development” stage for transmission to the feedback mechanisms of EVM and CADRe. That information is then used in the “application” stage to give the project manager the highest quality cost management information upon which to base his or her management actions. The overall process is termed “continuous cost-risk management” for its constant focus on those risky WBS elements most likely to cause the project manager cost and schedule problems.
5.1.1.1 CCRM STAGE 1: PREPARATIONThe first Stage in CCRM, Preparation for cost-risk feedback, involves NASA project teams performing three main activities: cost/performance trades; developing a definition of the program (e.g., part of the Cost Analysis Data Requirements (CADRe)) and, producing a statistically-expressed range of possible costs (e.g., probability density function (PDF) and cumulative distribution function (CDF) or “S”-curve). Cost/performance trades are the first opportunity for representing the potential cost impacts due to risk. The CADRe will contain the definition of the project (analogous to the DoD Cost Analysis Requirements Description or CARD) for use by cost estimators where the traceability from Work Breakdown Structure (WBS) element, through functions, to initial requirements will be clearly identifiable. The cost range exemplified in a PDF and CDF involves developing a reference point cost estimate from a cost model (e.g., NAFCOM, ACEIT, PRICE, SEER, etc.) first and then incorporating cost estimating relationship (CER), cost model input (e.g., weight, power, etc.), and technical/programmatic (e.g., TRL, schedule, design/engineering, etc.) uncertainty with element correlation to produce a quantification of cost-risk expressed in statistical distribution terms. Participants in the Preparation for cost-risk feedback Stage of CCRM are mainly cost estimators, project engineers and project managers. This represents the starting point for cost-risk management. From this point forward the challenge will be in managing to the cost level chosen, no matter what cost confidence level. Information on specific approaches, techniques and models for cost estimating and cost-risk, as well as information on the make-up of the CADRe, can be found in the NASA Cost Estimating Handbook (CEH) at www.ceh.nasa.gov or www.nasa.gov/office/pae/organization/cost_analysis_division.html.
5.1.1.2 CCRM STAGE 2: DEVELOPMENTThe second Stage in CCRM is Development of the feedback to manage the cost-risks. When hardware contractors are selected to develop NASA systems, they must be informed about the potential cost-risk impacts identified by the NASA cost teams for their attention, monitoring, management, and reporting to the NASA project office. They must

11The Measurable News 2018.01 | mycpm.org
be informed in the Request for Proposal’s (RFP) Data Requirement Descriptions (DRD) to produce multiple products that reflect the status and trends of these potential cost-risks, for example, CADRe and EVM Contract Performance Reports (CPR). If the work is done at NASA in-house, these data requirements are included in the Project Plan. As part of the CADRe, they will be required to produce a Life Cycle Cost Estimate (LCCE) for the proposal and LCCE updates at significant contract milestones. .The “S”-curve products of this CADRe data requirement will enable the measurement of variance changes in the cost-risk distribution over time reflecting the management of risk and cost-risk. The CADRe will also require that initial key technical parameters, and changes to them over time, be documented along with actual costs associated with all WBS elements. These data will eventually populate the One NASA Cost Engineering (ONCE) database, keeping a record of project cost behavior for updating NASA cost models and be available for cost analysis. Requirements to monitor, manage, and report monthly on the top medium and high-risk WBS elements identified during the CCRM Preparation Stage will also be included in the RFP in the form of a solicitation clause for Earned Value Management (EVM) and a DRD for an EVM Contract Performance Report (CPR). When EVM is required, the CPR will require performance measurement, variance analysis and corrective action reporting on all WBS elements, with a special focus on medium and high-risk WBS elements. These reports will require monthly Estimates at Completion (EAC) on all elements with a special focus on medium and high-risk WBS elements. Electronic access to these data will also be required. A template for an EVM CPR DRD can be found in the EVM Handbook located on the Office of the Chief Engineer’s (OCE) website at http://oce.nasa.gov/oce/home/index.html and on the CEH website. Based in part on the way bidders address these RFP requirements in the cost proposals submitted, NASA will select a winning bidder and set up a post-award meeting with the selected contractor to verify the proposed cost-risk management methods. If EVM is required on the effort, the post-award meeting at which this discussion takes place (along with baseline validation) is called an Integrated Baseline Review (IBR). Participants in Development of cost-risk feedback are the cost estimators, project engineers, project managers, procurement analysts and EVM specialists.
5.1.1.3 CCRM STAGE 3: APPLICATIONThe third CCRM Stage is the Application of the cost-risk feedback for managing costs. If the first two CCRM Stages, Preparation for cost-risk feedback and Development of cost-risk feedback, have been properly accomplished, the cost-risk feedback from the EVM (or similar) system will give the project manager the highest quality information possible for managing those risky WBS elements most likely to drive cost and schedule growth. The focus for reporting, analysis and action will be on medium and high-risk WBS elements since they were identified for specific reporting in the contract and addressed by the winning contractor in his proposal or in the Project Plan in the case of in-house NASA work. If cost and schedule performance analysis indicates problems, a decision to reiterate a cost/performance trade (part of the Preparation for cost-risk feedback Stage above) may have to be made, for a possible adjustment to a system requirement. EVM performance analysis, focused on risk impacts to cost and schedule, will enable development of monthly EACs providing the project manager crucial feedback on the potential cost effects of the risks. This information provides the project manager with focused insight into the cost-risk in order to better manage his/her costs. CADRe-required updates to the initial LCCE estimate at significant milestones (at least annually) can be analyzed for changes (hopefully reductions) in “S”-curve variances, indicating progress in managing risks and cost-risks. At the end of the effort a volume of high-quality cost, risk, and cost-risk information will have been collected that can be added to the ONCE database for follow-on contractor performance analysis, cost-risk methodology calibration and updating cost models in order to better cost estimate future projects. Participants in Application of cost-risk feedback are primarily project engineers, project managers and EVM specialists with cost estimator involvement during cost/performance trades (if required), and updating “S”-curves, databases and cost models. Again, information on approaches, techniques, cost models, EVM and CADRe can be found at the websites noted above.
5.1.2 HOW CCRM AND CRM ARE COMPLEMENTARYWhile quite similar in overall flow and sequence, CRM’s focus is on identifying, analyzing, planning, tracking and controlling the risk itself, CCRM’s focus is on quantification of the cost impacts due to risks and controlling those cost impacts. Even though dealing with the same risks as CRM, CCRM moves in a parallel direction once the risks have been identified from the CRM process. The Identify risks part of CRM is a necessary input to the ‘Risk Assessment’ Step in the Preparation Stage of CCRM. The risks the engineers we engage in CCRM Identify can augment the risks identified in the CRM process. Much of the Analyze part of CRM can provide input into the Preparation Stage of CCRM. Outputs from the

Analyze part of CRM would be used as inputs in the ‘Risk Assessment’ and ‘Translation of Risk into Cost Impact’ activities within the Preparation Stage of CCRM. In like manner, as the CCRM engineering team come up with risk assessments, they too can be passed to the CRM engineers for inclusion in their assessments. The Plan part of CRM provides the opportunity for the Preparation Stage of CCRM to iterate the assessment and resulting cost impacts due to risks as risk handling strategies are proposed. Here the complementarity between CRM and CCRM is most evident. As the assessment of risks changes over time, the resulting cost impacts change also. As these cost impacts due to risks are quantified and that information is communicated back to the CRM engineers and Project Managers, the value of synergies between CRM and CCRM become obvious. The Plan part of CRM also contributes to the cost-risk focus of the Earned Value Management System (EVMS) in the Development Stage of CCRM. As mitigation strategies prove themselves (or not) that information is apparent in the trends coming out of the EVM system that are focused on the risky elements in Control Accounts and Work Packages with the EVMS. The Track part of CRM assists not only with EVM tracking of cost-risk but also provides input for the update of the cost estimate as required by the CADRe as part of the Application Stage of CCRM. Total cumulative distribution functions (“S”-curves) developed at slightly different points in time as part of the CADRe updates, whether within a particular NASA life cycle Phase or between different Phases, are dependent on the assessment of risk and cost-risk and their comparison illustrates successful (or not) risk handling. This information is quite valuable as it is communicated back to the engineers concerned with the overall reduction of risk in the project. The Control part of CRM corresponds to the “Data Compilation” and “Analysis” Steps within the Application Stage of CCRM and provides input for any updates to the performance/cost trades when too-challenging developments require a fall-back plan. The data compiled with the summation of both EVM and CADRe cost information also identifies what technically changed over time to explain why the costs changed over time. As cost-risk algorithms are updated based on this empirical technical risk and cost-risk information, besides providing more accurate tools, techniques and models for future assessment and quantification of cost-risk, the drivers for the observed changes is communicated back to the CRM engineers for updating of their risk assessment approaches.
ProjStream.com | 800.914.1710
Software that works together. Seamlessly.
“Cutting-edge technology in EVM capabilities, customizable software development options, resolution-based technical support and effective tool training. “ Bob Harbaugh, EVM Director, Southwest Research Institute

THE MEASURABLE NEWS
The Quarterly Magazine of the College of Performance Management | mycpm.org
2018.01
13
ABSTRACT More and more organizations are observing that their compliance programs are not accomplishing their intended outcomes. Compliance is seen as ineffective, too expensive, and unable to keep up with the emerging standards and regulations. In other words, compliance is failing and, in the process, exposing organizations to unnecessary risk.
The Cost of compliance is estimated at 8-10% of a worker’s time and salary. In highly regulated industries this can easily be between 20%-30% to support all the necessary items: quality, safety, regulatory, environmental, and dozens of other programs. If compliance continues on its present course, it is not hard to imagine that eventually compliance will require: for every person doing work another person to check and monitor that it is compliant.
Clearly, this is not sustainable or desirable.
There are a number of factors that contribute to poor compliance outcomes that include:
• Poorly designed or misunderstood regulatory frameworks
• Lack of defined compliance obligations, outcomes and objectives
• Lack of appropriate models, measures, indicators, and controls
• Lack of effective risk management
• A focus on conformance to standards at the expense of achieving outcomes
• A prevailing reactive approach based on inspections and audits
• Viewing compliance as a necessary evil
Perhaps the one that is most fatal is the last one. Considering compliance as a necessary evil instead of a necessary good will establish the course which will shape the effort, priority, and funding associated with compliance initiatives:
Raimund Laqua, PMP, PEng. | Founder, Chief Compliance Architect | LEAN COMPLIANCE CONSULTING, INC.
Why Compliance Needs to Change
More and more organizations are observing that their compliance programs are not accomplishing their intended outcomes. Compliance is seen as ineffective, too expensive, and unable to keep up with the emerging standards and regulations. In other words, compliance is failing and, in the process, exposing organizations to unnecessary risk.
The Cost of compliance is estimated at 8-10% of a worker’s time and salary. In highly regulated industries this can easily be between 20%-30% to support all the necessary items: quality, safety, regulatory, environmental, and dozens of other programs. If compliance continues on its present course, it is not hard to imagine that eventually compliance will require:
for every person doing work another person to check and monitor that it is compliant
Clearly, this is not sustainable or desirable.
There are a number of factors that contribute to poor compliance outcomes that include:
• Poorly designed or misunderstood regulatory frameworks • Lack of defined compliance obligations, outcomes and objectives • Lack of appropriate models, measures, indicators, and controls • Lack of effective risk management • A focus on conformance to standards at the expense of achieving outcomes • A prevailing reactive approach based on inspections and audits • Viewing compliance as a necessary evil
Perhaps the one that is most fatal is the last one. Considering compliance as a necessary evil instead of a necessary good will establish the course which will shape the effort, priority, and funding associated with compliance initiatives:
WHY COMPLIANCE NEEDS TO CHANGEBy Raimund Laqua

14 The Measurable News 2018.01 | mycpm.org
WHAT IS COMPLIANCE?Compliance has different meanings depending on industry, business, and business function. At a basic level it is about conforming to official requirements. These requirements can be in the form of mandatory or voluntary commitments that a company promises to keep. These requirements may come from a variety of sources, including both internal and external to a business:
• Regulation
• Industry Standard
• Policy
• Program Charter
• Standard Operating Procedure
• Etc.
These requirements vary in how they are described and can be categorized across micro/macro and means/end dimensions:
• Micro-Means (“Prescriptive”)
• Macro-Ends (“Management Based”)
• Micro-Ends (“Performance”)
• Macro-Ends (“General Duty/Liability”)
In practice, standards and regulations usually adopt a primary approach although may contain elements from each. For example, ISO 9001 started out as predominately prescriptive which facilitated an audit approach to compliance. However, recently, it is has become a “management-based” standard that requires companies to establish their own objectives and outcomes. This no longer lends itself to an auditing approach based on conformance to prescriptive requirements.
Standards and regulations allow more autonomy to organizations to decide for themselves what they should do. Autonomy is one of the antecedents to proactive behavior which is an antidote to the reactive approaches currently in use. However, although standards and regulations have changed, many organizations have not.
Compliance has changed in other ways particularly by adopting continuous improvement and risk-based approaches. These are both proactive in nature as they involve: “anticipating, planning, and striving to have an impact.”
2
What is Compliance?
Compliance has different meanings depending on industry, business, and business function. At a basic level it is about conforming to official requirements. These requirements can be in the form of mandatory or voluntary commitments that a company promises to keep. These requirements may come from a variety of sources, including both internal and external to a business:
• Regulation • Industry Standard • Policy • Program Charter • Standard Operating Procedure • Etc.
These requirements vary in how they are described and can be categorized across micro/macro and means/end dimensions:
• Micro-Means (“Prescriptive”) • Macro-Ends (“Management Based”) • Micro-Ends (“Performance”) • Macro-Ends (“General Duty/Liability”)
In practice, standards and regulations usually adopt a primary approach although may contain elements from each. For example, ISO 9001 started out as predominately prescriptive which facilitated an audit approach to compliance. However, recently, it is has become a “management-based” standard that requires companies to establish their own objectives and outcomes. This no longer lends itself to an auditing approach based on conformance to prescriptive requirements.
Standards and regulations allow more autonomy to organizations to decide for themselves what they should do. Autonomy is one of the antecedents to proactive behavior which is an antidote to the reactive approaches currently in use. However, although standards and regulations have changed, many organizations have not.
Compliance has changed in other ways particularly by adopting continuous improvement and risk-based approaches. These are both proactive in nature as they involve: “anticipating, planning, and striving to have an impact.”
These will be explored later in this article, but first we need to understand what role compliance has in relationship to the overall business model.
ROLE OF COMPLIANCEFundamentally, the role of compliance is to manage risk.
One way to understand this is by considering the concept of a value chain developed by Michael Porter. A value chain considers the effects on margin resulting from primary activities, .e., those that generate direct value. In addition, secondary activities, those that support the primary activities, are also evaluated. The role of secondary activities is to improve productivity leading to an increase in margin.

15The Measurable News 2018.01 | mycpm.org
3
These will be explored later in this article, but first we need to understand what role compliance has in relationship to the overall business model.
Role of Compliance Fundamentally, the role of compliance is to manage risk.
One way to understand this is by considering the concept of a value chain developed by Michael Porter. A value chain considers the effects on margin resulting from primary activities, .e., those that generate direct value. In addition, secondary activities, those that support the primary activities, are also evaluated. The role of secondary activities is to improve productivity leading to an increase in margin.
In a similar way, compliance’s role is to ensure that margins are achieved by managing risk.
This requires (among other things), that the compliance programs are effective in both their own systems and in the outcomes they intend to achieve. For example, it is possible to have conformance to the ISO 9001 quality standard while at the same time not improve overall quality outcomes – you need both.
The Prevailing Approach to Compliance - Reactive The current approach to compliance both in terms of regulatory/standards design and the way in which compliance is achieved is reactive. Compliance is based on a reactive model driven by lagging indicators and audits. This has led organizations to wait until they have an audit finding before making any improvements to their compliance.
In a similar way, compliance’s role is to ensure that margins are achieved by managing risk.
3
These will be explored later in this article, but first we need to understand what role compliance has in relationship to the overall business model.
Role of Compliance Fundamentally, the role of compliance is to manage risk.
One way to understand this is by considering the concept of a value chain developed by Michael Porter. A value chain considers the effects on margin resulting from primary activities, .e., those that generate direct value. In addition, secondary activities, those that support the primary activities, are also evaluated. The role of secondary activities is to improve productivity leading to an increase in margin.
In a similar way, compliance’s role is to ensure that margins are achieved by managing risk.
This requires (among other things), that the compliance programs are effective in both their own systems and in the outcomes they intend to achieve. For example, it is possible to have conformance to the ISO 9001 quality standard while at the same time not improve overall quality outcomes – you need both.
The Prevailing Approach to Compliance - Reactive The current approach to compliance both in terms of regulatory/standards design and the way in which compliance is achieved is reactive. Compliance is based on a reactive model driven by lagging indicators and audits. This has led organizations to wait until they have an audit finding before making any improvements to their compliance.
This requires (among other things), that the compliance programs are effective in both their own systems and in the outcomes they intend to achieve. For example, it is possible to have conformance to the ISO 9001 quality standard while at the same time not improve overall quality outcomes – you need both.
THE PREVAILING APPROACH TO COMPLIANCE - REACTIVEThe current approach to compliance both in terms of regulatory/standards design and the way in which compliance is achieved is reactive. Compliance is based on a reactive model driven by lagging indicators and audits. This has led organizations to wait until they have an audit finding before making any improvements to their compliance.
Audits were first introduced by financial institutions to identify and prevent fraud. Their focus was to test the integrity of accounting procedures and financial data. Since then, audit practices have developed alongside of changes to standardized accountancy to become a crucial role in governance, risk, and compliance activities.
The audit function has grown beyond the financial function to cover other compliance programs such as occupational health and safety, process safety management, environmental, quality, security, and so on. However, there are important differences between auditing financial statements and ensuring compliance outcomes; particularly when it involves safety, risk, and physical objectives.
Not understanding these differences has resulted in the misapplication of audits as outlined in the following four misuses:

16 The Measurable News 2018.01 | mycpm.org
4
Audits were first introduced by financial institutions to identify and prevent fraud. Their focus was to test the integrity of accounting procedures and financial data. Since then, audit practices have developed alongside of changes to standardized accountancy to become a crucial role in governance, risk, and compliance activities.
The audit function has grown beyond the financial function to cover other compliance programs such as occupational health and safety, process safety management, environmental, quality, security, and so on. However, there are important differences between auditing financial statements and ensuring compliance outcomes; particularly when it involves safety, risk, and physical objectives.
Not understanding these differences has resulted in the misapplication of audits as outlined in the following four misuses:
1. Audits are focused on activity instead of outcomes
The role of audits should be to validate program outcomes and verify that compliance reports are accurate. However, all too often, audits are used to prescribe "how" compliance should be met. This happens frequently with both external and internal auditors that have their own view of how compliance should be done. This practice was rightly stopped in the financial sector as audit firms cannot provide advice of this kind. Unfortunately, this correction has not yet taken hold across many regulatory, standards and certification organizations.
2. Audit findings are used to set compliance obligations
All too often audit findings produce a list of corrective actions that are used directly by compliance managers without first revising and obtaining approval for the affected compliance obligations. This poses several problems particularly when the audit findings inappropriately prescribe remedies. Another problem, often experienced, is that findings can be based on an auditor's interpretation of the standard or regulation. This leaves companies struggling to revise their approaches only to have them change again the following year when a different auditor conducts the audit.
1. Audits are focused on activity instead of outcomesThe role of audits should be to validate program outcomes and verify that compliance reports are accurate. However, all too often, audits are used to prescribe "how" compliance should be met. This happens frequently with both external and internal auditors that have their own view of how compliance should be done. This practice was rightly stopped in the financial sector as audit firms cannot provide advice of this kind. Unfortunately, this correction has not yet taken hold across many regulatory, standards and certification organizations.
2. Audit findings are used to set compliance obligationsAll too often audit findings produce a list of corrective actions that are used directly by compliance managers without first revising and obtaining approval for the affected compliance obligations. This poses several problems particularly when the audit findings inappropriately prescribe remedies. Another problem, often experienced, is that findings can be based on an auditor's interpretation of the standard or regulation. This leaves companies struggling to revise their approaches only to have them change again the following year when a different auditor conducts the audit.
Companies should not immediately accept remedies or an auditor's particular interpretation. Instead, companies should make up their own minds as to the level of commitment and hold management accountable for the means by which they are met.
Compliance responsibility is a managerial role andnot that of an audit committee or auditor.
3. Audit findings are used as the only source for compliance improvementMany companies only use audit findings to drive change to their compliance programs. However, this is not enough as audit findings are too slow to provide feedback and are too late since they are based on outcomes that happen after the fact. Everyone knows that this doesn't make sense when it comes to safety, quality or dealing with the environment. This is like waiting until you hit the guard rail before you realize that you were driving outside the lines. Companies need to use leading indicators and actions instead of waiting for an audit to tell them they are off side.
Also, findings never specify aspirational or voluntary goals that companies may choose to pursue. Standards along with regulations are at best minimum specifications and companies may choose to go above and beyond them. Doing so would help promote trust, strengthen a company's social license and demonstrate that compliance is valued. The argument that we are doing enough by doing the minimum that regulation demands is a weak argument especially when it comes to safety.
4. The audit function inappropriately assumes managerial accountability for complianceThe lack of clear accountability for compliance obligations often results in the audit function taking on this role and determining how compliance should be met and what the obligations should be. This diminishes the responsibility of managers who have the compliance role and should be the ones who are accountable.
In addition, the audit function requires significant resources to fill in the accountability gap which they are unable to do. This results in many companies being uncertain of where the
17The Measurable News 2018.01 | mycpm.org
goal line is and where they are in relationship to it. Therefore, they invest tremendous effort in preparing for and conducting audits every year to discover the status of their compliance.
Companies are now conducting pre-audits to get ready for internal audits to get ready for external audits. All of these are in hope that they satisfy a benchmark specified by an external auditor or regulator which is something that companies should already know and be certain of. When it comes to safety, waiting for an audit every year (or every other year) is far too late to find this out and creates unnecessary risk for employees and stakeholders.
All of this misuse result in the audit function being too expensive and not capable of meeting the increasing demands of compliance. However, more importantly, the audit function ends up being on the wrong side of compliance.
Companies should take ownership of their compliance obligations and execute proactive steps to ensure that they are met. They should not defer or wait for an external auditor to tell them if they have achieved their own compliance obligations.
Meeting compliance obligations is a performance processjust like anything else a company does, and it is
time to bring it back inside and in front where it belongs.
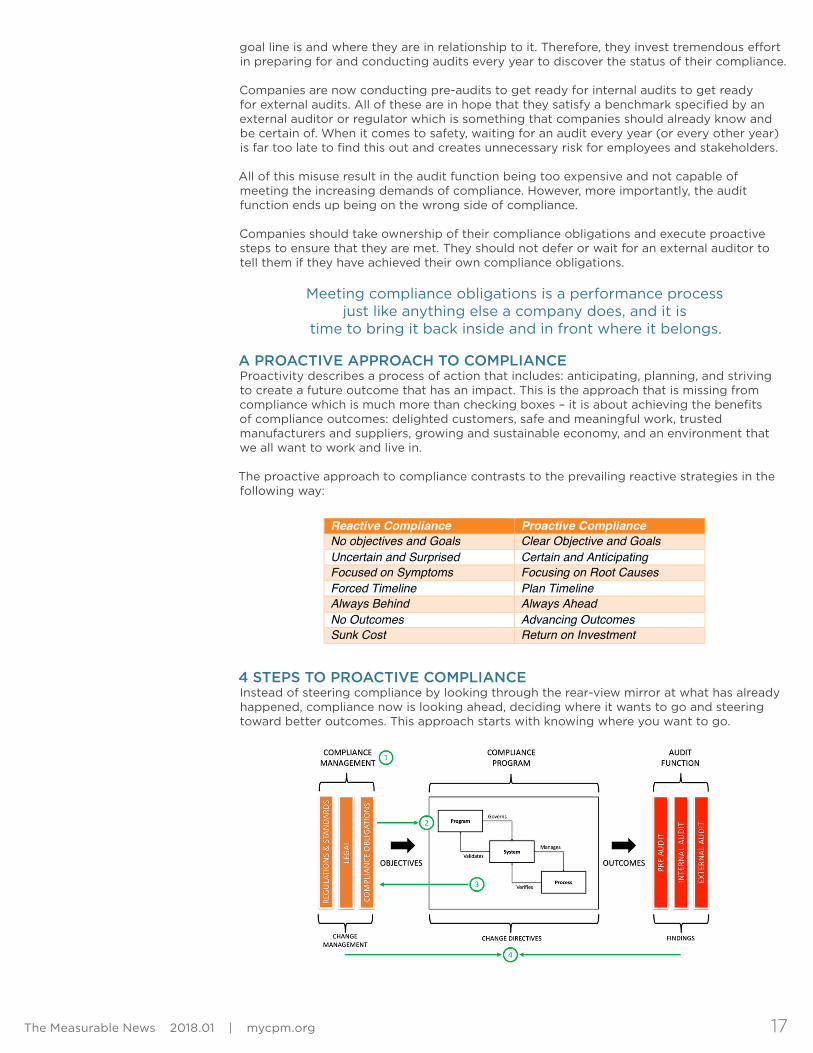
A PROACTIVE APPROACH TO COMPLIANCEProactivity describes a process of action that includes: anticipating, planning, and striving to create a future outcome that has an impact. This is the approach that is missing from compliance which is much more than checking boxes – it is about achieving the benefits of compliance outcomes: delighted customers, safe and meaningful work, trusted manufacturers and suppliers, growing and sustainable economy, and an environment that we all want to work and live in.
The proactive approach to compliance contrasts to the prevailing reactive strategies in the following way:
6
A Proactive Approach to Compliance
Proactivity describes a process of action that includes: anticipating, planning, and striving to create a future outcome that has an impact. This is the approach that is missing from compliance which is much more than checking boxes – it is about achieving the benefits of compliance outcomes: delighted customers, safe and meaningful work, trusted manufacturers and suppliers, growing and sustainable economy, and an environment that we all want to work and live in.
The proactive approach to compliance contrasts to the prevailing reactive strategies in the following way:
Reactive Compliance Proactive Compliance No objectives and Goals Clear Objective and Goals Uncertain and Surprised Certain and Anticipating Focused on Symptoms Focusing on Root Causes Forced Timeline Plan Timeline Always Behind Always Ahead No Outcomes Advancing Outcomes Sunk Cost Return on Investment
4 Steps to Proactive Compliance Instead of steering compliance by looking through the rear-view mirror at what has already happened, compliance now is looking ahead, deciding where it wants to go and steering toward better outcomes. This approach starts with knowing where you want to go.
1. Take ownership of all obligations (mandatory and voluntary)
Taking ownership means more than simply complying with a given guideline, standard or regulation. Ownership means being responsible and answering for the outcomes of compliance obligations (i.e., the promises made to stakeholders). It is therefore necessary to have clear and unambiguous objectives for what you want compliance to
4 STEPS TO PROACTIVE COMPLIANCEInstead of steering compliance by looking through the rear-view mirror at what has already happened, compliance now is looking ahead, deciding where it wants to go and steering toward better outcomes. This approach starts with knowing where you want to go.
6
A Proactive Approach to Compliance
Proactivity describes a process of action that includes: anticipating, planning, and striving to create a future outcome that has an impact. This is the approach that is missing from compliance which is much more than checking boxes – it is about achieving the benefits of compliance outcomes: delighted customers, safe and meaningful work, trusted manufacturers and suppliers, growing and sustainable economy, and an environment that we all want to work and live in.
The proactive approach to compliance contrasts to the prevailing reactive strategies in the following way:
Reactive Compliance Proactive Compliance No objectives and Goals Clear Objective and Goals Uncertain and Surprised Certain and Anticipating Focused on Symptoms Focusing on Root Causes Forced Timeline Plan Timeline Always Behind Always Ahead No Outcomes Advancing Outcomes Sunk Cost Return on Investment
4 Steps to Proactive Compliance Instead of steering compliance by looking through the rear-view mirror at what has already happened, compliance now is looking ahead, deciding where it wants to go and steering toward better outcomes. This approach starts with knowing where you want to go.
1. Take ownership of all obligations (mandatory and voluntary)
Taking ownership means more than simply complying with a given guideline, standard or regulation. Ownership means being responsible and answering for the outcomes of compliance obligations (i.e., the promises made to stakeholders). It is therefore necessary to have clear and unambiguous objectives for what you want compliance to

18 The Measurable News 2018.01 | mycpm.org
1. Take ownership of all obligations (mandatory and voluntary)Taking ownership means more than simply complying with a given guideline, standard or regulation. Ownership means being responsible and answering for the outcomes of compliance obligations (i.e., the promises made to stakeholders). It is therefore necessary to have clear and unambiguous objectives for what you want compliance to accomplish. The following will help clarify compliance objectives so that those accountable will know what and how compliance outcomes will be accomplished:
– Document the context and expectations for each obligation – Define what constitutes evidence of compliance – Define how progress against outcomes will be measured – Identify what standard will be used to establish normative processes (ex. ISO
9001:2015, ISO 31000, etc.) – Identify what is needed (structure, resources, technology, culture, etc.) by the
organization to achieve the desired outcomes – Identify and evaluate risks (both threats and opportunities) for each obligation – Embed obligations, controls, and risk treatment into compliance programs, systems
and processes
2. Embed compliance into programs, systems and processesCompliance requirements manifest themselves inside a business in many ways. However, there are two contexts that address the majority of a company's compliance obligations: (1) management systems such as: quality, safety, environmental, risk management, and audit, and (2) compliance-critical processes such as: human resources, security, finance, design, manufacturing, maintenance, supplier management, and other processes under regulation.In all these cases, compliance benefits from being directly embedded into each process rather than only by means of inspections or audits. Embedding will enable the level compliance to be known at all times rather than after an audit. With this in mind the following are important measures to collect:
• Measures of Effectiveness (MoE) – critical to program success, independent of any technical implementation.
• Measures of Compliance (MoC) – critical to compliance, where failure maybe cause for reassessment of the program
• Measures of Performance (MoP) – measures that relate to the operations of the compliance program, systems, and processes.
3. Monitor in real-time the status and the ability to stay in complianceRegulators (and proactive companies) are interested in knowing the level of compliance right now, in the past, and more importantly if there is sufficient capability of being in compliance tomorrow. Unfortunately, many companies are not certain of their level of compliance until an audit has been conducted. This is far too late to be used as a means of governing compliance programs. Even still, they may not know if they have adequate capacity or capability to sustain compliance against changing and increasing demands.
Companies should establish real-time monitoring, so they are always certain of their level and capacity to meet compliance. Many are already spending excessive effort conducting pre-audits, internal audits, and third-party audits only to discover that they have been to some degree out of compliance.
Less effort can be expended by achieving and staying in compliance all the time. This is similar to losing weight. It is easier to keep the weight off rather than to gain and lose it time after time. However, what is more important is that, by keeping the weight off, you can experience the benefits of a healthier lifestyle all the time. You will have the energy to do the things that really matter and are important to you.
With compliance, why wait for an audit when you can experience the benefits of being in compliance right now? The reason that companies do wait is that they do not understand that there are benefits beyond passing an audit. They are not aware that the reason for compliance is to achieve the outcomes which include greater customer satisfaction, better quality, reduced safety incidents, less impact on the environment, lower risks, and many more. These outcomes are what really matter and who wouldn't want these benefits right now?
4. Improve compliance on an incremental and continuous basisImprovements of any kind need to be made in a safe manner and in a way that maintains compliance. It is easier to make these changes incrementally and on a continuous

basis. LEAN has taught us that improvements made this way can add up to substantial savings as well as increased capacity over time. It is no wonder that many standards require continuous improvement and have adopted the Plan-Do-Check-Act (PDCA) cycle introduced first by Deming.
There are several sources for improvements: – Proactive strategies (ex. LEAN, process maturity, risk-based thinking, etc.) – Internal continuous feed-back and feed-forward processes – External audits and review – Adopting or modifying existing obligations
Organizations that continue with a reactive approach to compliance may find that they are not able to sustain even their existing level of compliance under the weight of increasing regulations. For them, the result will be increased risk, loss of trust from their stakeholders, and for some, loss of their business.
However, companies that follow the steps outlined above will find that they no longer wait for customer complaints to arrive, audit findings to be found, or for issues to mount up before they make improvements. They also will not see compliance as a tax on productivity that must always be reduced. Being proactive will become for them an ethical choice about keeping their promises and embedding them into the DNA of the organization.
References1. Merriam-Webster, Definition for Compliance, 2. Guidelines for Risk Based Process Safety3. Harvard Business Review – Why Compliance Programs Fail – and How to Fix them4. Designing Safety Regulations for High-Hazardous Industries5. The dynamics of proactivity at work, 6. Understanding governance, risk and compliance information systems (GRC IS): the experts view7. Technical Performance Measurement, Earned Value, and Risk Management: An Integrated
Diagnostic Tool for Program Management, 8. ISO 9001, ISO 31000, ISO 196009. API RP 1173 – Pipeline Safety Management System10. Value Chain Analysis, Michael Porter
The absolute go-to company for effective program planning & control solutions for the most complex industry programs
Program Planning – Proposal, Startup, Surge, ReplansProgram Control System Setup & Operations Program Cost ManagementEfficient Earned Value Management (EVM) ComplianceProgram Control Tools & Technology
ClearPlan has built the strongest team of experts in the industryOur experts in program controls make an immediate impact to your teamWe bring ensured compliance when you need it mostTell the clear, winning story in your proposal
Contact Us:[email protected]
888.249.7990
Nationwide Team of ExpertsCost Effective Solutions

MEMBERS GET MORE
BECOME A MEMBER NOW!
www.mycpm.org/membership
Voice - Be heard on the CPM blog, in the Measurable News Magazine and as a speaker at one of CPM’s annual events or webinars.
Discounts - Members get discounts on annual confer-ences, free webinars and free PEP Program testing as well as other events conducted by CPM partners.
Network - Join a local chapter for free and connect with colleagues in your area; join our LinkedIn and Twitter forums for information sharing.
Visibility - Stand out and get noticed as an active member of your community.
Credibility - Your reputation matters! Being a part of CPM allows you access to the most cutting edge and up-to-date information in the �eld.
Growth - Grow your knowledge, grow your career; access to the EVM library will greatly expand your resources; Members are allowed the PEP testing for free.
The College of Performance Management (CPM),an independent entity, is the premier organization for earned value
management (EVM) and project planning and controls.
As an international non-pro�t organization, CPM is dedicated to sustained improvement in project and performance management.

THE MEASURABLE NEWS
The Quarterly Magazine of the College of Performance Management | mycpm.org
2018.01
21
ABSTRACT For IT managers, understanding the software accounting rules can be a confusing subject. This report provides a primer on the difference between capital expenditures (CAPEX) and operational expenditures (OPEX) and how they related to accounting for software costs. We also outline how these principles vary according to the application development method, whether a traditional waterfall approach or a newer iterative process, such as agile development. Finally, we highlight the factors that drive business leaders to favor CAPEX or OPEX in accounting for software.
Money comes in many colors—green in the United States, much prettier colors around the world. There is a saying in project management that money comes in two colors: green and blue. Green money has a dead president on one side. Blue money is referred to as budget. Budget is not spendable money, because it is not actually currency. It is funds allocated to a project.
But in the software development world, the domain of IT, there are two other colors of money: CAPEX and OPEX. CAPEX (capital expenditures) represents investments that generate future benefits. CAPEX is used to build the substantial assets of the company, such as the plant, property, equipment, and IT systems. Within the domain of IT, investment in new systems is included in the CAPEX budget.
The cost color of money in a business is OPEX. OPEX (operating expenditures) represents day-to-day expenses, the effects of which can be measured within a short timeframe. Unlike an asset, an operational expense is not an investment that builds something of lasting value. It’s just that—an expense within a short period of time.
TWO TYPES OF SOFTWAREThere are two types of software that are developed for a business: 1) internal-use software, and 2) software developed to be sold, leased, or marketed (“software to be sold”). The accounting and capitalization requirements for these two types of software are very different. Here is a high-level comparison of how each type of software is capitalized.
For internal-use software, there are three stages defined by accounting guidance: 1. Preliminary project phase (i.e. planning, evaluating alternatives, conceptual formation); 2. Application development (i.e. design, coding, integration with hardware); and 3. Post-implementation phase (i.e. testing, maintenance).
For internal-use software, the capitalization of costs should start after the preliminary project phase and is contingent on management committing to funding the continued development of the software and the completion of the project being probable. Costs should cease to be capitalized after the project is substantially finished (generally, close to the start of the post-implementation phase). All costs outside of this capitalization window should be expensed as incurred. The costs qualifying for capitalization are also restricted, but that discussion is beyond the scope of this report.
For software to be sold, the accounting guidelines are completely different. Accounting guidance requires that costs associated with the development of software to be sold are charged to expense as incurred, until the point at which technological feasibility has been established. Technological feasibility is established once an entity has completed planning, designing, coding, and testing the software to ensure that the software will work for its intended function.
ACCOUNTING FOR SOFTWARE: UNDERSTANDING CAPEX AND OPEXBy Frank Scavo

22 The Measurable News 2018.01 | mycpm.org
As a general guideline, technological feasibility is sometimes considered established once software enters beta testing. Capitalization must cease when the software is ready for general release to customers. Accordingly, the window for capitalization is extremely small, and often, startup companies expense all costs during development.
ACCOUNTING RULES FOR IT: WATERFALL VS. AGILEThere are always rules in any business. Accounting rules are always present, no matter the business size or whether it is a public or private firm.
So what do the accounting rules cover? The answer depends on which phase the software development is in. Let's start with the traditional waterfall development process. Agile will come next, but waterfall (a term no longer allowed in U.S. Department of Defense procurement but an acceptable accounting term), provides the easiest framework for software development cost accounting.
U.S. GAAP (generally accepted accounting principles) is explicit in terms of accounting for software development costs (expensed versus capitalized):
• Internal and external costs incurred during the preliminary project stage shall be expensed as they are incurred.
• Internal and external costs incurred to develop internal-use software during the application development stage shall be capitalized.
• Costs to develop or obtain software that allows for access to or conversion of old data by new systems shall also be capitalized.
• For internal-use software, training costs are not software development costs and, if incurred during software development, shall be expensed as incurred.
• Data conversion costs, except as noted in paragraph 350-40-25-3, shall be expensed as incurred.
• Internal and external training costs and maintenance costs during the post-implementation operation stage shall be expensed as incurred.
Waterfall software development accounting comprises three phases:
• Preliminary project stage or evaluation phase, which establishes the technical feasibility of the project. These are essentially R&D costs and are charged to OPEX, because, if the project ended here, there would be no asset to speak of.
• Software development or application configuration phase. All development and configuration work subsequent to technological feasibility is CAPEX. The end result is an asset, comprising software (bought or built), hardware, and infrastructure.
• Post-implementation or production phase. This is OPEX because these are day-to-day running costs.
MANY MITIGATING FACTORSIt's never this simple, of course, no matter how much we'd like it to be. For example:
• Enterprise software licenses are CAPEX, but the annual maintenance costs are OPEX.
• Functional design is OPEX, and technical design is CAPEX. The connections between functional design and technical design is blurred when done by collaborative teams.
• Production upgrades or enhancements are capitalizable. Maintenance and bug fixing are not, even though they both have development costs. This is because the former significantly enhances the value of the asset, whilst the latter does not.
• An ERP-to-CRM-order-entry interface is a capital cost, whereas a one-time, ERP-to-CRM-data-migration interface is an expense. This is because the former is an integral part of an IT asset, which generates long-term value, while the latter is a one-off with no alternative future use.
• T&E (Travel and Expenses) are normal expenses—except when they are part of a capitalizable activity.
• Software as a service (SaaS) is pure OPEX. Even if you end up customizing a SaaS application, the development costs will still be OPEX because you are renting the software. You don’t own the asset; that is, it doesn’t sit on the company’s balance sheet. This is one reason that financial executives often find SaaS an attractive option.

23The Measurable News 2018.01 | mycpm.org
One critical concept here is that it is not the work activity by itself that is capitalizable (development), but the outcome of that activity and the ownership of the resulting asset. So when we say, “development and testing can be capitalized,” what we are really saying is that they can be capitalized because of their outcome, in that they are being used to build a wholly-owned asset that will generate long-term economic value.
There is enough latitude here to drive a truck through, resulting in differences in the way companies capitalize IT costs. So how does the average project or application manager do proper budgeting and cost management that can stand up to an audit? Organizations often turn to outside financial advisors to justify their rationale.
AGILE DEVELOPMENT PROCESSESBecause the accounting rules discussed thus far are based on the waterfall methodology, they cannot be applied directly to iterative or agile development with its collaborative approach, short cycles, and absence of a big upfront design. This means that there is no clear process milestone for technological feasibility, which therefore requires a different approach to identify the start of capitalization.
According to the FASB (Financial Accounting Standards Board), technological feasibility can be based on either a detailed design or a working product:
• Detailed design: “The detailed design of a computer software product that takes product function, feature, and technical requirements to their most detailed, logical form and is ready for coding.”
• Working model (or prototype): “An operative version of the computer software product that is completed in the same software language as the product to be ultimately marketed, performs all the major functions planned for the product, and is ready for initial customer testing (usually identified as beta testing).”
In iterative or agile development, as consultant and agile specialist Craig Larman explains, technological feasibility is reached after a number of iterations (called sprints in the scrum methodology), after which capitalization can start.
Another key difference between waterfall and agile is the amount of development costs that can be capitalized. In general, under agile development these will be less than under waterfall’s detailed program design approach. This is because the initial development is done during iterations prior to reaching technological feasibility; whereas, in waterfall all development is done after technological feasibility (which underscores the point made earlier that it is the outcome rather than the activity which is the main criteria for CAPEX vs. OPEX). But this is perhaps a moot point, because iterative development generally requires far less time to reach technological feasibility compared to waterfall, which is heavily front-loaded with OPEX prior to the start of development.
In any case, these agile vs. waterfall distinctions are not seen very often in practice, because not only is agile development not the norm in IT departments, those that do practice it do not do so on a scale large enough to warrant capitalization. And those companies that practice large-scale iterative or agile development are usually product development companies that don’t capitalize anyway (discussed below).
A FASB accounting standard—SOP 98-1, Accounting for the Costs of Computer Software Developed or Obtained for Internal Use (ACC Section 10,720)—provides legal guidance on the appropriate way to account for corporate investment in software. This accounting standard provides clear guidance in one area: In a waterfall method of software development, with phased gates where all of the feasibility, analysis, and design activities and tasks are completed before development begins, and individual team members track their time to specific tasks associated with discrete project phases. These include a preliminary phase of feasibility analysis and high-level design; a development phase of development, testing, implementation, integration and deployment; and a deployment phase of stabilization and maintenance.
However, as agile gains prominence, the phased-gate language results in significant confusion and challenges of interpreting how to map the iterative work that happens throughout an agile project lifecycle and is becoming an increasingly urgent issue.

24 The Measurable News 2018.01 | mycpm.org
MINIMIZING CAPITAL EXPENSES AND TAX BURDENSAs mentioned earlier, some companies capitalize their software development while others expense it. What drives such decisions?
We should first make the distinction between product development companies (in which IT is their core business, e.g., software vendors) and companies whose core business is not IT, e.g. manufacturing or pharmaceutical companies.
• Product development companies understand that IT is indistinguishable from R&D—indeed, as Larman points out, IT in software companies used to be called R&D or systems development or engineering. Consequently, software development firms have been doing the appropriate accounting for as long as they’ve been around, often based on concurrent engineering and cross-functional teams. The norm for product development companies is to expense IT.
• In companies that do not develop software for sale, IT departments and their financial controllers generally don’t view IT as R&D. For example, in a pharmaceutical company, R&D means making drugs, not building software. So the dominant waterfall methodology prevails, with accounting practices that lend themselves more to the FASB CAPEX vs. OPEX rules outlined in this article. However, that does not mean they all capitalize software. Some do and some don’t.
A key reason for expensing, identified by both Luigi Paraboschi, VP of Finance at HP in Geneva, and Eugene Nisker, CEO of Evident Point Software in Vancouver, is to account for the cost sooner and therefore minimize the tax burden in the short term.
Other reasons include a combination of a low total project cost, a short useful life, and a short time between technological feasibility, and the completion of software development. I polled a number of people on this in Europe, the U.S., and Canada, and answers ranged from none or very few projects charged as Opex to 50/50 (Suraj Nekram, CEO of SteelGlass Consulting in New Jersey). A financial maturity survey in June 2011 showed that more than 80% of IT departments capitalize their software development. I have personally worked far more with IT departments that capitalize than with those who expense.
Conventional wisdom holds that CIOs prefer CAPEX because it avoids inflating the current year IT budget, whereas investors prefer OPEX because capitalization can be seen as artificially boosting current-year profits. In addition, as noted earlier, treating software cost as an expense lowers the tax liability in the current period.
Echoing this view, the financial website Investopedia, in an article on cash flow, says that “Verizon chose to include capitalized software in capital expenditures,” whereas, “Microsoft responsibly classifies all such development costs … which improves the quality of its reported cash flow from operations” (the term “responsibly” says it all). For Paraboschi, affordability is a key criterion: If your P&L can afford it, it is better to expense.
ResourcesThe following resources provide additional information and references for this subject.
1. Capitalization and Amortization of Software Costs (Putra), 2009 2. Capitalization of Software Development Costs: A Survey of Accounting Practices in the
Software Industry (Georgia Tech, College of Management), 2006 3. An Introduction to IT Project Financials – Budgeting, Cost Management and Chargebacks
(Michael Gentle), 2010 4. Accounting for Software Development, DBB McKennon5. Why Should Agilest Care About Capitalization?, InfoQ 6. FASB Section 10,720 – Accounting for Internal Use Software7. FASB Handbook of Federal Accounting Standards and Other Pronouncements, as Amended

THE MEASURABLE NEWS
The Quarterly Magazine of the College of Performance Management | mycpm.org
2018.01
25
ABSTRACT Cost and schedule growth for federal programs is created by unrealistic technical performance expectations, unrealistic cost and schedule estimates, inadequate risk assessments, unanticipated technical issues, and poorly performed and ineffective risk management, all contributing to program technical and programmatic shortfalls, shown in Figure 1 and documented in a wide range of sources. [12], [13], [16], [18], [25], [30], [31], [38], [57], [58], [59], [62], [67], [69]
What is Risk? Glen B. Alleman, Thomas J. Coonce, and Rick A. Price
Cost and schedule growth for federal programs is created by unrealistic technical performance expectations,
unrealistic cost and schedule estimates, inadequate risk assessments, unanticipated technical issues, and poorly performed and ineffective risk management, all contributing to program technical and programmatic shortfalls, shown in Figure 1Figure 1 and documented in a wide range of sources. [12], [13], [16], [18], [25], [30], [31], [38], [57], [58], [59], [62], [67], [69]
Figure 1 ‒ Four summary sources of program cost and schedule overruns and technical shortfalls are from a more detailed assessment of the root cause of program cost, schedule, and performance shortfalls [32].
Risk is the effect of uncertainty of objectives. Uncertainty is a state or condition that involves a deficiency of information and
leads to inadequate or incomplete knowledge of or understanding. In the context of risk management, uncertainty exists whenever the knowledge or understanding of an event, consequence, or likelihood is inadequate or incomplete
‒ ISO 31000:2009, ISO 17666:2016, and ISO 11231:2010 Risk is Uncertainty that Matters [29]
Risk can be the potential consequence of a specific outcome that affects the system’s ability to meet cost, schedule, and/or technical objectives. Risk has three primary components: [32] ▪ Probability of the activity or event occurring or not occurring, described by a Probability Distribution Function. ▪ Consequence or effect resulting from the activity or event occurring or not occurring, described by a Probability
Distribution Function. ▪ Root Cause (condition and activity) of a future outcome, which when reduced or eliminated, will prevent
occurrence, non‒occurrence, or recurrence of the cause of the risk. For the program manager, there are three risk categories that must be identified and handled: ▪ Technical ‒ risks that may prevent the end item from performing as intended or not meeting performance
expectations. Measures of Effectiveness, Measures of Performance, Technical Performance Measures, and Key Performance Parameters describe the measures of these expectations.
▪ Programmatic ‒ risks that affect the cost and schedule measures of the program. The programmatic risks are within the control or influence of the Program Management or Program Executive Office, through managerial actions applied to the work activities contained in the Integrated Master Schedule. [17]
▪ Business ‒ risks that originate outside the program office or are not within the control or influence of the Program Manager or Program Executive Office.
Commented [ML[1]: Yes, I pulled the ISO to check.
Figure 1 - Four summary sources of program cost and schedule overruns and technical shortfalls are from a more detailed assessment of the root cause of program cost, schedule, and performance
shortfalls [32].
Risk is the effect of uncertainty of objectives. Uncertainty is a state or condition that involves a deficiency of information and leads to inadequate or incomplete knowledge or understanding. In the context of risk management, uncertainty exists whenever the knowledge or understanding of an event, consequence, or likelihood is inadequate or incomplete - ISO 31000:2009, ISO 17666:2016, and ISO 11231:2010Risk is Uncertainty that Matters [29]
Risk can be the potential consequence of a specific outcome that affects the system’s ability to meet cost, schedule, and/or technical objectives. Risk has three primary components: [32]
• Probability of the activity or event occurring or not occurring, described by a Probability Distribution Function.
• Consequence or effect resulting from the activity or event occurring or not occurring, described by a Probability Distribution Function.
• Root Cause (condition and activity) of a future outcome, which when reduced or eliminated, will prevent occurrence, non-occurrence, or recurrence of the cause of the risk.
WHAT IS RISK?By Glen B. Alleman, Thomas J. Coonce, and Rick A. Price

26 The Measurable News 2018.01 | mycpm.org
For the program manager, there are three risk categories that must be identified and handled:
• Technical - risks that may prevent the end item from performing as intended or not meeting performance expectations. Measures of Effectiveness, Measures of Performance, Technical Performance Measures, and Key Performance Parameters describe the measures of these expectations.
• Programmatic - risks that affect the cost and schedule measures of the program. The programmatic risks are within the control or influence of the Program Management or Program Executive Office, through managerial actions applied to the work activities contained in the Integrated Master Schedule. [17]
• Business - risks that originate outside the program office or are not within the control or influence of the Program Manager or Program Executive Office.
Uncertainty comes from the lack information to describe a current state or to predict future states, preferred outcomes, or the actions needed to achieve them . Error! Reference source not found., [51], [70] This uncertainty can originate from the naturally (randomly) occurring processes of the program (Aleatory Uncertainty). Or it can originate from the lack of knowledge about the future outcomes from the work on the program (Epistemic Uncertainty). [37], [60]
RISKS, THEIR SOURCES, AND THEIR HANDLING STRATEGIESRisk identification during early design phases of complex systems is commonly implemented but often fails to identify events and circumstances that challenge program performance. Inefficiencies in cost and schedule estimates are usually held accountable for cost and schedule overruns, but the true root cause is often the realization of programmatic risks. A deeper understanding of frequent risk identification trends and biases pervasive during system design and development is needed, for it would lead to improved execution of existing identification processes and methods. [52], [53], [54]
Risk management means building a model of the risk, the impact of the risk on the program, and a model for handling of the risk, since it is a risk, the corrective or preventive action has not occurred yet. [19], [35], [46], [60], [66]
Probabilistic Risk Assessment (PRA) is the basis of these models and provides the Probability of Program Success. Probabilities result from uncertainty and are central to the analysis of the risk. Scenarios, model assumptions, with model parameters based on current knowledge of the behavior of the system under a given set of uncertainty conditions. [43]
The source of uncertainty must be identified, characterized, and the impact on program success modeled and understood, so decisions can be made about corrective and preventive actions needed to increase the Probability of Program Success.
Since risk is the outcome of Uncertainty, distinguishing between the types of uncertainty in the definition and management of risk on complex systems is useful when building risk assessment and management models. [8], [25], [27], [35], [43], [71]
• Epistemic uncertainty - from the Greek επιστηµη (episteme), meaning knowledge of uncertainty due to a lack of knowledge of quantities or processes of the system or the environment. Epistemic uncertainty is represented by the ranges of values for parameters, a range of workable models, the level of model detail, multiple expert interpretations, and statistical confidence. Epistemic uncertainty derives from a lack of knowledge about the appropriate value to use for a quantity that is assumed to have a fixed value in the context of a particular analysis. The accumulation of information and implementation of actions reduce epistemic uncertainty to eliminate or reduce the likelihood and/or impact of risk. This uncertainty is modeled as a subjective assessment of the probability of our knowledge and the probability of occurrence of an undesirable event.
Incomplete knowledge about some characteristics of the system or its environment are primary sources of Epistemic uncertainty.

27The Measurable News 2018.01 | mycpm.org
• Aleatory uncertainty - from the Latin alea (a single die in Latin) is the inherent variation associated with a physical system or the environment. Aleatory uncertainty arises from an inherent randomness, natural stochasticity, environmental or structural variation across space and time in the properties or behavior of the system under study. [1] The accumulation of more data or additional information cannot reduce aleatory uncertainty. This uncertainty is modeled as a stochastic process of an inherently random physical model. The projected impact of the risk produced by Aleatory uncertainty can be managed through cost, schedule, and/or technical margin.
Naturally occurring variations associated with the physical system are primary sources of Aleatory uncertainty.
There is a third uncertainty found on some programs in the Federal Systems community that is not addressed by this White Paper, since this uncertainty is not correctable
• Ontological Uncertainty - is attributable to the complete lack of knowledge of the states of a system. This is sometimes labeled an Unknowable Risk. Ontological uncertainty cannot be measured directly.
Ontological uncertainty creates risk from Inherent variations and incomplete information that is not knowable.
SEPARATING ALEATORY AND EPISTEMIC UNCERTAINTY FOR RISK MANAGEMENTAleatory is mentioned 55 times and Epistemic 120 times in NASA/SP-2011-3421, Probabilistic Risk Assessment Procedure Guide for NASA Managers and Practitioners. [42]Knowing the percentage of reducible uncertainty versus irreducible uncertainty is needed to construct a credible risk model. Without the separation, knowing what uncertainty is reducible and what uncertainty is irreducible inhibits the design of the corrective and preventive actions needed to increase the probability of program success.
Separating the types of uncertainty serves to increase the clarity of risk communication, making it clear which type of uncertainty can be reduced and which types cannot be reduced. For the latter (irreducible risk), only margin can be used to protect the program from the uncertainty. [9], [37]
As uncertainty increases, the ability to precisely measure the uncertainty is reduced to where a direct estimate of the risk can no longer be assessed through a mathematical model. While a decision in the presence of uncertainty must still be made, deep uncertainty and poorly characterized risks lead to the absence of data and risk models in the Defense and Space Acquisition domain. [39], [42]
EPISTEMIC UNCERTAINTY CREATES REDUCIBLE RISKThe risk created by Epistemic Uncertainty represents resolvable knowledge, with elements expressed as probabilistic uncertainty of a future value related to a loss in a future period of time. [3], [72] Awareness of this lack of knowledge provides the opportunity to reduce this uncertainty through direct corrective or preventive actions. [36]
Epistemic uncertainty, and the risk it creates, is modeled by defining the probability that the risk will occur, the time frame in which that probability is active, and the probability of an impact or consequence from the risk when it does occur, and finally, the probability of the residual risk when the handing of that risk has been applied.
Epistemic uncertainty statements define and model these event-based risks:
• If-Then - if we miss our next milestone then the program will fail to achieve its business value during the next quarter.
• Condition-Concern - our subcontractor has not provided enough information for us to status the schedule, and our concern is the schedule is slipping and we do not know it.
• Condition-Event-Consequence - our status shows there are some tasks behind schedule, so we could miss our milestone, and the program will fail to achieve its business value in the next quarter.
For these types of risks, an explicit or an implicit risk handling plan is needed. The word handling is used with special purpose. “We Handle risks” in a variety of

28 The Measurable News 2018.01 | mycpm.org
ways. Mitigation is one of those ways. In order to mitigate the risk, new effort (work) must be introduce into the schedule. We are buying down the risk, or we are retiring the risk by spending money and/or consuming time to reduce the probability of the risk occurring. Or we could be spending money and consuming time to reduce the impact of the risk when it does occur. In both cases actions are taken to address the risk.
REDUCIBLE COST RISKReducible cost risk is often associated with unidentified reducible Technical risks, changes in technical requirements and their propagation that impacts cost. [7] Understanding the uncertainty in cost estimates supports decision making for setting targets and contingencies, risk treatment planning, and the selection of options in the management of program costs. Before reducible cost risk can take place, the cost structure must be understood. Cost risk analysis goes beyond capturing the cost of WBS elements in the Basis of Estimate and the Cost Estimating Relationships. This involves:
• Development of quantitative modelling of integrated cost and schedule, incorporating the drivers of reducible uncertainty in quantities, rates and productivities, and the recording of these drivers in the Risk Register.
• Determining how cost and schedule uncertainty can be integrated in the analysis of the cost risk model.
• Performing sensitivity analysis to provide understanding of the effects of reducible uncertainty and the allocation of contingency amounts across the program.
REDUCIBLE SCHEDULE RISK
While there is significant variability, for every 10% in Schedule Growth there is a corresponding 12% Cost Growth. [10]
Schedule Risk Analysis (SRA) is an effective technique to connect the risk information of program activities to the baseline schedule, to provide sensitivity information of individual program activities to assess the potential impact of uncertainty on the final program duration and cost.
Schedule risk assessment is performed in 4 steps:1. Baseline Schedule - Construct a credible activity network compliant with GAO-16-
89G, “Schedule Assessment Guide: Best Practices for Project Schedule.”2. Define Reducible Uncertainties - for activity durations and cost distributions from
the Risk Register and assign these to work activities affected by the risk and/or the work activities assigned to reduce the risk.
3. Run Monte-Carlo simulations - for the schedule using the assigned Probability Distribution Functions (PDFs), using the Min/Max values of the distribution, for each work activity in the IMS.
4. Interpret Simulation Results - using data produced by the Monte Carlo Simulation, including at least: [61]
• Criticality Index (CI): Measures the probability that an activity is on the critical path. [14], [15]
• Significance Index (SI): Measures the relative importance of an activity. [63], [64]
• Schedule Sensitivity Index (SSI): Measures the relative importance of an activity taking the CI into account. [49], [63], [64]
• Cruciality Index (CRI): Measures the correlation between the activity duration and the total program duration. [63], [64]
REDUCIBLE TECHNICAL RISKTechnical risk is the impact on a program, system, or entire infrastructure when the outcomes from engineering development do not work as expected, do not provide the needed technical performance, or create higher than planned risk to the performance of the system. Failure to identify or properly manage this technical risk results in performance degradation, security breaches, system failures, increased maintenance time, and significant amount of technical debt1 and addition cost and time for end item deliver for the program.
REDUCIBLE COST ESTIMATING RISKReducible cost estimating risk is dependent on technical, schedule, and programmatic risks, which must be assessed to provide an accurate picture of program cost. Cost risk
29The Measurable News 2018.01 | mycpm.org
1) Technical debt is a term used in the Agile community to describe eventual consequences of deferring complexity or implementing incomplete changes. As a development team progresses there may be additional coordinated work that must be addressed in other places in the schedule. When these changes do not get addressed within the planned time or get deferred for a later integration, the program accumulates a debt that must be paid at some point in the future.2) The use of Design Structure Matrix provides visibility and modeling of these dependencies. Many models consider the dependencies as statistic or fixed at some value. But the dependencies are dynamic driven by non-stationary stochastic processes, that evolve as the program evolves.
estimating assessment addresses the cost, schedule, and technical risks that impact the cost estimate. To quantify these cost impacts from the reducible risk, sources of risk need to be identified. This assessment is concerned with three sources of risk and ensure that the model calculating the cost also accounts for these risks: [23]
• The risk inherent in the cost estimating method. The Standard Error of the Estimate (SEE), confidence intervals, and prediction intervals.
• Risk inherent in technical and programmatic processes. The technology’s maturity, design and engineering, integration, manufacturing, schedule, and complexity. [68]
• The risk inherent in the correlation between WBS elements, which decides to what degree one WBS element’s change in cost is related to another and in which direction. WBS elements within federal systems have positive correlations with each other, and the cumulative effect of this positive correlation increases the range of the costs.2
Unidentified reducible Technical Risks are often associated with Reducible Cost and Schedule risk.
ALEATORY UNCERTAINTY CREATES IRREDUCIBLE RISKAleatory uncertainty and the risk it creates comes not from the lack of information, but from the naturally occurring processes of the system. For aleatory uncertainty, more information cannot be bought nor specific risk reduction actions taken to reduce the uncertainty and resulting risk. The objective of identifying and managing aleatory uncertainty to be preparing to handle the impacts when risk is realized.
The method for handling these impacts is to provide margin for this type of risk, including cost, schedule, and technical margin.
Using the NASA definition, Margin is the difference between the maximum possible value and the maximum expected Value and separate from Contingency. Contingency is the difference between the current best estimates and maximum expected estimate. For systems under development, the technical resources and the technical performance values carry both margin and contingency.
Schedule Margin should be used to cover the naturally occurring variances in how long it takes to do the work. Cost Margin is held to cover the naturally occurring variances in the price of something being consumed in the program. Technical margin is intended to cover the naturally occurring variation of technical products.
Aleatory uncertainty and the resulting risk is modeled with a Probability Distribution Function (PDF) that describes the possible values the process can take and the probability of each value. The PDF for the possible durations for the work in the program can be determined. Knowledge can be bought about the aleatory uncertainty through Reference Class Forecasting and past performance modeling. [11], [21], [71] This new information then allows us to update - adjust - our past performance on similar work will provide information about our future performance. But the underlying processes is still random, and our new information simply created a new aleatory uncertainty PDF.
The first step in handling Irreducible Uncertainty is the creation of Margin. Schedule margin, Cost margin, Technical Margin, to protect the program from the risk of irreducible uncertainty. Margin is defined as the allowance in budget, programed schedule … to account for uncertainties and risks. [44]
Margin needs to be quantified by:
• Identifying WBS elements that contribute to margin.
• Identifying uncertainty and risk that contributes to margin.
IRREDUCIBLE SCHEDULE RISKPrograms are over budget and behind schedule, to some extent because uncertainties are not accounted for in schedule estimates. Research and practice is now addressing this problem, often by using Monte Carlo methods to simulate the effect of variances in work package costs and durations on total cost and date of completion. However, many such program risk approaches ignore the significant impact of probabilistic correlation on work package cost and duration predictions. [5], [33]

30 The Measurable News 2018.01 | mycpm.org
Irreducible schedule risk is handled with Schedule Margin which is defined as the amount of added time needed to achieve a significant event with an acceptable probability of success. [2] Significant events are major contractual milestones or deliverables. [48]
With minimal or no margins in schedule, technical, or cost present to deal with unanticipated risks, successful acquisition is susceptible to cost growth and cost overruns. Error! Reference source not found.
The Program Manager owns the schedule margin. It does not belong to the client nor can it be negotiated away by the business management team or the customer. This is the primary reason to CLEARLY identify the Schedule Margin in the Integrated Master Schedule. [17] It is there to protect the program deliverable(s). Schedule margin is not allocated to over-running tasks, rather is planned to protect the end item deliverables.
The schedule margin should protect the delivery date of major contract events or deliverables. This is done with a Task in the IMS that has no budget (BCWS). The duration of this Task is derived from Reference Classes or Monte Carlo Simulation of aleatory uncertainty that creates risk to the event or deliverable. [11], [47]
The IMS, with schedule margin to protect against the impact aleatory uncertainty, represents the most likely and realistic risk-based plan to deliver the needed capabilities of the program.
IRREDUCIBLE TECHNICAL RISKThe last 10 percent of the technical performance generates one-third of the cost and two-thirds of the problems - Norman Augustine’s 15th Law. [6]
Using the NASA definition, Margin is the difference between the maximum possible value and the maximum expected Value and separate that from contingency is the difference between the current best estimates and maximum expected estimate, then for the systems under development, the technical outcome and technical performance values both carry margin and contingency.
• Technical Margin and Contingency serve several purposes: – Describe the need for and use of resource margins and contingency in system
development. – Define and distinguish between margins and contingency. – Demonstrate that, historically, resource estimates grow as designs mature. – Provide a representative margin depletion table showing prudent resource
contingency as a function of program phase.
For any system, in any stage of its development, there is a maximum possible, maximum expected, and current best estimate for every technical outcome. The current best estimate of a technical performance changes as the development team improves the design and the understanding of that design matures.
For a system in development, most technical outcomes should carry both margin and contingency. As designs mature, the estimate of any technical resource usually grows. This is true historically and, independent of exactly why, development programs must plan for it to occur. [41]
The goal of Technical Margin (unlike Cost and Schedule Margin) is to reduce the margins (for example Size Weight and Power) to as close to zero as possible, to maximize mission capabilities. The technical growth and its handling include:
• Expected technical growth - contingency accounts for expected growth – Recognize mass growth is historically inevitable. – As systems mature through their development life cycle, with better understanding of
the design emerging from conceptual to actual designs. – Requirements changes often increase resource use
• Unplanned technical growth - margins account for unexpected growth – Recognize all system development is challenging – Programs encounter “unknown unknowns” with the use of new technology that is
difficult to gauge, that develop into uncertainties in design and execution of the program, all the way to manufacturing variations.

31The Measurable News 2018.01 | mycpm.org
3) Apologies to Mulder and Scully and the X-Files 4) Retired United States Air Force Major General who served as United States Assistant Secretary of the Army for Acquisition, Logistics, and Technology from 2002 to 2008.
ONTOLOGICAL UNCERTAINTYOn the scale of uncertainty - from random naturally occurring processes (aleatory) to the Lack of Knowledge (epistemic), Ontological uncertainty lies at the far end of this continuum and is a state of complete ignorance. Not only are the uncertainties not known, the uncertainties may not be knowable. While the truth is out there,3 it cannot be accessed because it is simply not known where to look in the first instance. NASA calls it operating outside the experience base, where things are done for the first time and operate in a state of ignorance.
Management of uncertainty is the critical success factor of effective program management. Complex programs and the organizations that deliver them organizations can involve people with different genders, personality types, cultures, first languages, social concerns, and/or work experiences.
Such differences can lead to ontological uncertainty and semantic uncertainty. Ontological uncertainty involves different parties in the same interactions having different conceptualizations about what kinds of entities inhabit their world; what kinds of interactions these entities have; how the entities and their interactions change as a result of these interactions. Semantic uncertainty involves different participants in the same interactions giving different meanings to the same term, phrase and/or actions. Ontological uncertainty and semantic uncertainty can lead to intractable misunderstandings between people. [22], [55]
When new technologies are introduced into these complex organizations, concepts, principles and techniques may be fundamentally unfamiliar and carry a higher degree of ontological uncertainty than more mature technologies. A subtler problem is these uncertainties are often implicit rather than explicit and become an invisible and unquestioned part of the system. When epistemic and ontological uncertainty represents our lack of knowledge, then reducing the risks produced by this uncertainty requires improvement in our knowledge of the system of interest or avoiding situations that increase these types of uncertainty. To reduce Epistemic and Ontological uncertainty there must be a reduction in the uncertainty of the model of system behavior (ontology) or in the model’s parameters (epistemology).
CALL TO ACTIONA great deal of work has been done on improving risk identification and analysis. The knowledge created by these efforts provides a more complete list of risks and better estimates of their likelihood and consequences, but the fruits of this effort have NOT been powerful enough to change the written guidance of DOD and other agencies.
Successful risk management can be applied to increase the probability of program success, but only if it can be assured that:
• The models of Aleatory and Epistemic uncertainty properly represent the actual uncertainties on the program.
• The corrective and preventive actions for the risks created by Epistemic uncertainty and margins used for the Aleatory uncertainties will reduce risk as well as increase the probability of program success.
In 2002, Claude Bolton4 said, there are still too many surprises, using traditional metrics for poorly performing and failing programs in a briefing to Army senior leadership. [28] Past efforts to build dashboards, provide guidance to services (USAF, Navy, and ARMY) have fallen into disuse.
Two Critical Steps start the path toward Increasing Probability of Program Success 3. Fix budgeting process and 6. Align Technical Plan with Budgeting

32 The Measurable News 2018.01 | mycpm.org
Two Critical Steps start the path toward Increasing Probability of Program Success 3. Fix budgeting process and 6. Align Technical Plan with Budgeting
Table 1 ‒ Corrective and preventive actions for programmatic root causes reducing probability of program success
Condition or Action (Cause) Undesirable Outcome (Effect) Corrective Action
1. Government fails to define what Done looks like in units of measure meaningful to the decision makers, prior to RFP.
Systems are delivered that don’t provide the desired capabilities, arrive too late, and cost more than budgeted.
Government defines the MoE’s for the program prior to issuing the RFP.
2. Different participants in the acquisition process impose conflicting demands on programs. [24]
Participants do what is in their own best interest versus the best interest of technical, cost, and schedule performance for the program.
Agreed upon MoP’s defined at IBR for each program deliverable.
3. Budget processes force funding decisions to be made in advance of program decisions. [12], [69]
Budget process encourages undue optimism that creates program risk for cost, schedule, and technical performance.
Government provides a risk adjusted cost loaded Integrated Master Plan prior to Milestone‒B/KDP-B.
4. Program managers’ short tenures, limitations in experience, and lack of formal training. [4], Error! Reference source not found.
The program manager focused on minimizing risk to Keep the Program Sold and creating the opportunity for career advancement.
Program Manager assigned from start of development (KDP-B) to completion.
Table 2 ‒ Corrective and preventive actions for cost, schedule, and technical root causes reducing probability of program success
A fundamental responsibility in the acquisition of major systems is to ensure that visibility of progress is sufficient to reliably assess the results being obtained. [56]
Without the integration of the risk adjusted cost, schedule, and technical performance measures, and preventive and corrective actions needed to reduce or eliminate the impact of these risks, the probability of program success is not likely to meet the
needs of those paying for the outcomes.
Condition or Action (Cause) Undesirable Outcome (Effect) Corrective Action 5. Schedule and Cost Margin not assigned to
protect key contractual deliverables or end items. [10], [34]
Lack of cost and schedule margin causes the program to under deliver technical, go over budget, and deliver late.
Maintain the required schedule and cost margin to protect key contractual deliverables.
6. Technical Plan not aligned with Budget and Spend Plan, with missing Schedule Margin and risk buy down plan. [69]
Lack of integrated cost, schedule, technical progress gives wrong information of future performance.
Develop resource loaded Integrated Master Schedule, aligned with Technical and Budget adjusted with Margin at (IBR).
7. Alternative Points of Integration not considered in IMS when risk becomes an issue. [50]
No Plan-B means Probability of Success is reduced.
Have a Plan-B on baseline in the form an alternative points of integration.
8. Cost, Schedule, and Technical Uncertainties impact Probability of Program Success without handling plans. [26]
Without a credible risk strategy, there is no credible plan for success.
Develop risk models for integrated cost, schedule, and technical performance.
9. Missing Resource Loaded Schedule to assure staff, facilities, and other resources available when needed. [45]
If resources are not available when needed, there is no credible plan for success.
Develop and maintain a resource loaded schedule.
10. Propagation of Aleatory and Epistemic Uncertainty not considered in risk profile or handling plans. [2], [20], [40], [65]
Without understanding the dynamics of risk and its propagation, there is no credible plan to Keep the Program Green. Error! Reference source not found.
Model network of activities to reveal risk propagation using DSM.
Table 1 - Corrective and preventive actions for programmatic root causes reducing probability of program success
Two Critical Steps start the path toward Increasing Probability of Program Success 3. Fix budgeting process and 6. Align Technical Plan with Budgeting
Table 1 ‒ Corrective and preventive actions for programmatic root causes reducing probability of program success
Condition or Action (Cause) Undesirable Outcome (Effect) Corrective Action
1. Government fails to define what Done looks like in units of measure meaningful to the decision makers, prior to RFP.
Systems are delivered that don’t provide the desired capabilities, arrive too late, and cost more than budgeted.
Government defines the MoE’s for the program prior to issuing the RFP.
2. Different participants in the acquisition process impose conflicting demands on programs. [24]
Participants do what is in their own best interest versus the best interest of technical, cost, and schedule performance for the program.
Agreed upon MoP’s defined at IBR for each program deliverable.
3. Budget processes force funding decisions to be made in advance of program decisions. [12], [69]
Budget process encourages undue optimism that creates program risk for cost, schedule, and technical performance.
Government provides a risk adjusted cost loaded Integrated Master Plan prior to Milestone‒B/KDP-B.
4. Program managers’ short tenures, limitations in experience, and lack of formal training. [4], Error! Reference source not found.
The program manager focused on minimizing risk to Keep the Program Sold and creating the opportunity for career advancement.
Program Manager assigned from start of development (KDP-B) to completion.
Table 2 ‒ Corrective and preventive actions for cost, schedule, and technical root causes reducing probability of program success
A fundamental responsibility in the acquisition of major systems is to ensure that visibility of progress is sufficient to reliably assess the results being obtained. [56]
Without the integration of the risk adjusted cost, schedule, and technical performance measures, and preventive and corrective actions needed to reduce or eliminate the impact of these risks, the probability of program success is not likely to meet the
needs of those paying for the outcomes.
Condition or Action (Cause) Undesirable Outcome (Effect) Corrective Action 5. Schedule and Cost Margin not assigned to
protect key contractual deliverables or end items. [10], [34]
Lack of cost and schedule margin causes the program to under deliver technical, go over budget, and deliver late.
Maintain the required schedule and cost margin to protect key contractual deliverables.
6. Technical Plan not aligned with Budget and Spend Plan, with missing Schedule Margin and risk buy down plan. [69]
Lack of integrated cost, schedule, technical progress gives wrong information of future performance.
Develop resource loaded Integrated Master Schedule, aligned with Technical and Budget adjusted with Margin at (IBR).
7. Alternative Points of Integration not considered in IMS when risk becomes an issue. [50]
No Plan-B means Probability of Success is reduced.
Have a Plan-B on baseline in the form an alternative points of integration.
8. Cost, Schedule, and Technical Uncertainties impact Probability of Program Success without handling plans. [26]
Without a credible risk strategy, there is no credible plan for success.
Develop risk models for integrated cost, schedule, and technical performance.
9. Missing Resource Loaded Schedule to assure staff, facilities, and other resources available when needed. [45]
If resources are not available when needed, there is no credible plan for success.
Develop and maintain a resource loaded schedule.
10. Propagation of Aleatory and Epistemic Uncertainty not considered in risk profile or handling plans. [2], [20], [40], [65]
Without understanding the dynamics of risk and its propagation, there is no credible plan to Keep the Program Green. Error! Reference source not found.
Model network of activities to reveal risk propagation using DSM.
Table 2 - Corrective and preventive actions for cost, schedule, and technical root causes reducing probability of program success
A fundamental responsibility in the acquisition of major systems is to ensure that visibility of progress is sufficient to reliably assess the results being obtained. [56]
Without the integration of the risk adjusted cost, schedule, and technical performance measures, and preventive and corrective actions needed to reduce or eliminate the impact of these risks, the probability of program success is not likely to meet the needs of those
paying for the outcomes.
Bibliography1. Ali, T., Boruah, H., and Dutta, P., “Modeling Uncertainty in Risk Assessment Using Double Monte Carlo
Method,” International Journal of Engineering and Innovation Technology (IJEIT), Volume 1, Issue 4, April 2012.
2. Alleman, G. B., Coonce, T. J., and Price, R. A., “Building a Credible Performance Measurement Baseline,” The Measureable News, 2014, Issue 4.
3. Apeland, S., Aven, T., and Nilsen, T., “Quantifying Uncertainty under a Predictive, Epistemic Approach to Risk Analysis,”
4. Arena, M. V., et. al., “Managing Perspectives Pertaining to Root Cause Analyses of Nunn-McCrudy Breaches, Volume 4: Program Manager Tenure, Oversight of Acquisition Category II Programs, and Framing Assumptions” RAND MG1171/4, Rand Corporation, 2013.
5. Arízaga, J. F. O, “A Methodology for Project Risk Analysis Using Bayesian Belief Networks Within A Monte Carlo Simulation Environment,” PhD Dissertation, University of Maryland, 2007.
6. Atin, A., “Project Risk Propagation Modeling of Engineering, Procurement and Construction,” Ph. D. Thesis Wayne State University, 2016.
7. Becerril, L., Sauer, M., and Lindemann, U., “Estimating the effects of Engineering Changes in Early Stage Product Development,” 18th International Dependency and Structural Modeling Conference, August 29-30, 2016.
8. Bartolomei, J. E., et. al., “Engineering Systems Matrix: An Organizing Framework for Modeling Large-Scape Complex Systems,” Systems Engineering, 15.1, 2012, pp. 41-61.
9. Beer, M., “Alternative Approaches to the Treatment of Epistemic Uncertainties in Risk Assessment,” Institute for Risk and reliability, Leibniz Universität Hannover, 2016.
10. Blickstein, I., et. al., “Root Cause Analyses of Nunn-McCurdy Breaches: Volume 2,” Rand Corporation, MG1171z2.
11. Bordley, R. F., “Reference Class Forecasting: Resolving Its Challenge to Statistical Modeling,” The American Statistician, 68:4, 221-229, 2014.
12. Charette, R., Dwinnell, L., and McGarry, J., “Understanding the Roots of Process Performance Failure,” CROSSTALK: The Journal of Defense Software Engineering, August, 2004, pp. 18-24.
13. Clemen, R. T., Making Hard Decisions: An Introduction to Decision Analysis, Second Edition, Duxbury Press, 1996.

33The Measurable News 2018.01 | mycpm.org
14. Covert, R., “Analytic Method for Probabilistic Cost and Schedule Risk Analysis, Final Report,” prepared by Raymond Covert, for National Aeronautics and Space Administration (NASA) Office of Program Analysis and Evaluation (PA&E) Cost Analysis Division (CAD), 5 April 2013.
15. Covert, R., "Final Report Briefing Analytic Methods for Cost and Schedule Risk Analysis," March 4, 2013.16. Davis, D., and Philip, A. S., “Annual Growth of Contract Costs for Major Programs in Development and
Early Production,” Acquisition Policy Analysis Center, Performance Assessments and Root-Cause Analyses, OUSD AT&L, March 21, 2016.
17. DOD, “Integrated Program Management Report (IPMR), DI-MGMT-81861, June 20, 2012.18. van Dorp, J. R., and Duffey, M. R., “Statistical Dependence in Risk Analysis for Project Networks using
Monte Carlo Methods,” International Journal of Production Economics, 58, pp. 17-29, 1999.19. Faber, M. H., “On the treatment of uncertainties and probabilities in engineering decision analysis,”
Journal of Offshore Mechanics and Arctic Engineering, 127:243-248. 20. Fang, C., Marle, F., and Xio, M., “Applying Importance Measures to Risk Analysis in Engineering Project
Using a Risk Network Model,” IEEE Systems Journal, 2016.21. Flyvbjerg, B., “From Noble Prize to Project Management: Getting Risk Right,” Project Management
Journal, Vol. 37, No. 3, August 2006, pp. 5-15.22. Fox, S.,” Ontological Uncertainty and Semantic Uncertainty in Global Network Organizations,” VTT
Working Papers 102, 2008.23. Galway, L. A., “Subjective Probability Distribution Elicitation in Cost Risk Analysis: A Review,” RAND
Corporation, TR-410-AF, 2007. 24. Gerstein, D. M. et. al., “Developing a Risk Assessment Methodology for the National Aeronautics and
Space Administration,” RAND Corporation, RR 1537, 2015.25. Grady, J. O., Systems Requirements Analysis, Academic Press, 2006.26. Hamaker, J. W., “But What Will It Cost? The History of NASA Cost Estimating,” Readings in Program
Control, pp. 25-37, 1994.27. Helton, J. C. and Burmaster, D. E., “Treatment of aleatory and epistemic uncertainty in performance
assessments for complex systems,” Reliability Engineering and System Safety, vol. 54, no. 2-3, pp. 91–94, 1996.
28. Higbee, J. (2004), In Program Success Probability, “Tasking from ASA (ALT), Claude Bolton,” March 2002, Defense Acquisition University, 2 June 2004.
29. Hillson, D. and Simon, P., Practical Risk Management: The ATOM Method, Management Concepts, 2007.30. Hofbauer, et al., “Cost and time overruns for major defense Acquisition programs: An annotated brief,”
Center for Strategic and International Studies, Washington, DC, 2011.31. Hulett, D. T. and Hillson, D., “Branching Out: Decision Trees Offer a Realistic Approach to Risk Analysis,”
PM Network, May 2006, p. 43.32. IDA, “Root Cause of Nunn-McCrudy Breaches - A Survey of PARCA Root Causes Analyses, 2010-2011,
Interim Report, IDA Paper P-4911, August 2012.33. Karim, A. B. A., “The Development of an Empirical-Based Framework for Project Risk Management,”
Ph. D. Thesis, University of Manchester, 2014.34. Kerzner, H., Project Management: A Systems Approach to Planning, Scheduling and Controlling, John
Wiley & Sons, 1998.35. der Kiureghian, A., “Aleatory or Epistemic? Does it matter?” Special Workshop on Risk Acceptance and
Risk Communication, March 26-27, 2007, Stanford University.36. Kwak, Y. H, and Smith, B. M., “Managing Risks in Mega Defense Acquisition Projects: Performance,
Policy, and Opportunities,” International Journal of Project Management, 27, pp. 812-820, 2009.37. Laitonen, J. (Project manager) Losoi, H., Losoi, M., and Ylilammi, K., “Tools for analyzing epistemic
uncertainties in probabilistic risk analysis Final report,” Mat-2.4177 Seminar on Case Studies in Operations Research, 24 May 2013.
38. Lorell, M. A., Lowell, J. F., and Younossi, O., “Implementation Challenges for Defense Space Programs,” MG-431-AF, Rand Corporation 2006.
39. Lempert, R. and Collins, M., “Managing the Risk on Uncertain Threshold Responses: Comparison of Robust, Optimum, and Precautionary Responses,” Risk Analysis 27 August 2007, pp. 1009-1026, Rand Corporation.
40. Maier, M. and Rechtin, E., The Art of Systems Architecting, Third Edition, 200941. NASA, “Margins and Contingency Module Space Systems Engineering,” Version 1.0, Lisa Guerra
of NASA’s Exploration Systems Mission Directorate, Department of Aerospace Engineering at the University of Texas at Austin, 2008
42. NASA, “Probabilistic Risk Assessment Procedure Guide for NASA Managers and Practitioners,” NASA/SP-2011-3421, Second Edition, December 2011.
43. NASA, “NASA Risk Management Handbook,” NASA/SP-2011-3422, 201144. NASA, “NPR 7120.5E, NASA Space Flight Program and Project Management Handbook,” NASA/SP-
2014-3705, September 2014.45. NDIA, “Planning & Executing Excellence Guide (PASEG),” National Defense Industry Association,
Procurement Division - Program Management Systems Committee (PMSC), June 22, 2012.46. DePasquale, D. and Charania, A. C., “I-RaCM: A Fully Integrated Risk and Life Cycle Cost Model,”
American Institute of Aeronautics and Astronautics, 2008.47. Pawlikowski, E., Loverro, D., and Cristler, T., “Disruptive Challenges, New Opportunities, and New
Strategies, Strategic Studies Quarterly, Maxwell Air Force Base, Spring 2012, pp. 27-54.48. Petković, I., “Risk Management using Dependency Structure Matrix,” Workshop in Opatija, September
2 - 8, 2012, German Academic Exchange Service.49. PM Knowledge Center, “Schedule Risk Analysis: How to measure your baseline schedule sensitivity?”
https://goo.gl/jpMxuy 50. Price, R. A. and Alleman, G. B., “Critical Thinking on Critical Path Analysis,” College of Performance
Management, EVM World 2016.51. Public Works and Government Services Canada, “Project Complexity and Risk Assessment Manual,”
May 2015, Version 5.52. Raiffa, H., Decision Analysis: Introductory Lectures on Choice Under Uncertainty, Addison Wesley, 1968.53. Razaque, A., Bach, C., Salama, N. Alotaibi, A., “Fostering Project Scheduling and Controlling Risk
Management,” International Journal of Business and Social Science, Vol. 3 No. 14, Special Issue, July 2012.54. Reeves, J. D., “The Impact of Risk Identification and Trend on Space Systems Project Performance,”
Ph. D. Thesis Schools of Engineering and Applied Science, The George Washington University, May 19th, 2013.

55. Riesch, Hauke, “Levels of Uncertainty,” in Handbook of Risk Theory: Epistemology, Decision Theory, Ethics, and Social Implications of Risk, Rosener, S. and Hillebrand R. Editors, Springer, 2011.
56. Salado, A. and Nilchiani, R. R., “The Concept of Problem Complexity,” Conference on Systems Engineering Research (CSER 2014), Procedia Computer Science, 28
57. Scheinin, W. “Start Early and Often: the Need for Persistent Risk Management in the Early Acquisition Phases,” Paper to the Aerospace Corporation / Air Force SMC / NASA Seventh Symposium on Space Systems Engineering & Risk Management Conference, 27-29 February, 2008.
58. Schwartz M., “Reform of the Defense Acquisition System,” United States Senate Committee on Armed Services, Congressional Research Service, April 30, 2014.
59. SMC, “Space and Missile Systems Center Risk Management Process Guide,” Version 2.0 - 5 September 2014.
60. Siu, N. and Marble, J., “Aleatory vs. Epistemic Uncertainties: Principles and Challenges,” ASME PVP Conference, Baltimore, MD., July 20, 2011.
61. USAF, “Air Force Instruction 63-101/20-101, Integrated Life Cycle Management,” 9 May 2014.62. U. S. Congress, Redesigning Defense: Planning the Transition to the Future U. S. Defense Industrial
Base, Office of Technology Assessment, Government Printing Office, July 1991.63. Vanhoucke, M., Measuring Time: Improving Project Performance Using Earned Value Management,
Springer, 2009.64. Vanhoucke, M., Integrated Project Management Sourcebook: A Technical Guide to Project Scheduling,
Risk, and Control, Springer, 2016.65. Vidal, L. and Marle, F., “Modeling project complexity,” International Conference on Engineering Design,
2007.66. Vrouwenvelder, A.C.W.M., “Uncertainty analysis for flood defense systems in the Netherland,”
Proceedings, ESREL, 2003.67. Williams, T., “The Nature of Risk in Complex Projects,” Project Management Journal, 48(4), pp. 55-66,
2017.68. Wood, H. L. and Ashton, P., “The Factors of Project Complexity,” 18th CIB World Building Congress,
Salford, United Kingdom, 10 May 2010.69. Younossi, Obaid et. al., “Improving the Cost Estimation of Space Systems: Past Lessons and Future
Recommendations,” RAND Project Air Force, MG-690.70. Zack, M. H., “Managing Organizational Ignorance, Knowledge Directions, Volume 1, Summer, 1999, pp.
36-49.71. Zarikas, V. and Kitsos, C. P., “Risk Analysis with Reference Class Forecasting Adopting Tolerance
Regions,” in Theory and Practice of Risk Assessment, Chapter: 18, Springer International, June 2015.72. Zhang, Y., Bai, S., and Guo, Y., “The Application of Design Structure Matrix in Project Schedule
Management,” 2010 International Conference on E-Business and E-Gov
The Program Optimization & Project Controls Solutions team works with a wide variety of clients, ranging from well-established aerospace & defense contractors to small business government contractors, as well as life sciences, natural resources, and construction companies. We have extensive experience providing Project Controls and EVM Systems design, implementation, and, support services.
© 2018 BDO USA, LLP. All rights reserved.
Dave Scott, Managing Director, Program Optimization & Project Controls Solutions703-336-1562 / [email protected]
Accountants and Advisors www.bdo.com
BDO INDUSTRY SPECIALTY SERVICES IS PROUD TO SUPPORT THE
COLLEGE OF PERFORMANCE MANAGEMENT (CPM) as a Silver Sponsor of the 2018 EVM World Conference.
Come visit us at EVM World @ Booth #10.

THE MEASURABLE NEWS
The Quarterly Magazine of the College of Performance Management | mycpm.org
2018.01
35
ABSTRACT This article describes and explains the concepts and terminology behind what is today being termed as Artificial Intelligence. Further, it illustrates how these concepts relate to the field of project management, offering opportunity for better, more effective project planning and control.
WHAT EXACTLY IS ARTIFICIAL INTELLIGENCE?There are many definitions of Artificial Intelligence or AI. In fact, a Google search today returns 1.18 billion results. One of the funniest definitions we have run across is “AI is whatever hasn’t been done yet” – now there’s a vague and unhelpful answer!
One of the more useful definitions we have found is “AI is the ability of a computer program or a machine to think and learn. In general use, the term ‘artificial intelligence’ means a machine which mimics human cognition" (Wikipedia, 2018).
So, machines being able to think and learn seems to be the crux of AI…
The way humans think is through what is called cognition (stems from the Latin word for “know” or “recognize”). It is the scientific word for a thought process...the mental action of acquiring knowledge and understanding through thought and experience.
The way humans learn is through either observational or associative means. Observational learning is watching others behavior, such as watching your parent drive a car. You learn from watching which levers and switches they push as they drive along. Associative learning, on the other hand, is learning by establishing connections between events. You know you will hear thunder when you see a lightning strike.
Humans make decisions based on thought and learning. We make sound or good decisions based on observational reasoning as well as associative patterns. We also sometimes make bad decisions that we can learn from to make us smarter the next time around. So as our thought process gets smarter, the more we learn.
If a machine can acquire knowledge and understand or recognize it, then it too can start to make informed (and hopefully good) decisions for us. AI is really about a machine being able to make an informed decision that is a sound one. AI is a decision support system (DSS) that helps me make a better decision faster than I could have otherwise made.
THE PROBLEM WITH PROJECT PLANNING TODAYOne of the hardest challenges in project management is accurately forecasting future outcomes (project completion date, total cost) of very complicated and highly uncertain endeavors (projects) – we call this planning.
As an industry, we have developed some tried and trusted techniques such as Critical Path Method (CPM) to assist in modeling project outcomes but these models are only as good as the inputs we feed into them. Any worthy planning tool today uses CPM as its underlying forecasting engine. As the planner, we are still left with the onerous task of knowing not only which activities to include in our plan, but worse, what should their durations, cost and even sequence be? CPM does little more than convert durations and sequences of durations into a series of dates. It doesn’t help one bit with:
• Is my plan realistic based upon my historical performance?
• What scope should I focus on when building my plan?
DEMYSTIFYING ARTIFICIAL INTELLIGENCE & HOW IT WILL MAKE PROJECT PLANNING BETTERBy Dr. Dan Patterson, PhD and Paul Self
36 The Measurable News 2018.01 | mycpm.org
• What activities should we include?
• What should our durations be?
• What is the true sequence and logic between our activities?
• What risks or opportunities can I expect to encounter?
If CPM were a complete solution, then we wouldn’t continue to experience project cost and schedule overruns. The problem isn’t CPM though. The problem is our inability to accurately model what we think will happen during project execution because:
• There is a huge number of variables (tasks and sequence)
• There is a huge number of uncertainties associated with those variables (duration or scope uncertainty)
Schedule risk analysis tools help tell us how bad our forecast may be, but they do nothing in terms of telling us what the inputs to our schedule should have been in the first place.
This is why we believe AI can massively help project planning. If AI can assist the planner by making suggestions that are sound, then the immense challenge described above starts to become surmountable. Added to that, if our planning tool can also start to make better suggestions by observational or associative learning, then we are headed down a seriously valuable and exciting path…
ARTIFICIAL INTELLIGENCE CATEGORIESIf you thought the number of AI definitions was daunting, Google returns 754,000 results when searching for Types of AI. Sadly, very few of those results return a common set of type definitions.
It may be most beneficial to categorize AI into the following three types:
1) Artificial Narrow Intelligence (ANI)Artificial Narrow Intelligence (ANI), also referred to as Weak or Applied AI, is a type of AI that specializes in one area. Examples of this would be the IBM Deep Blue computer beating a chess master at a game of chess. The machine was programmed to be very good at one thing – playing chess. You might be surprised to learn that Apple’s Siri is also an example of ANI. She is programmed to respond to a limited set of questions but if the user goes beyond those questions, she cannot give an informed answer. The majority of today’s AI solutions are ANI-based. In our opinion, given the current state of AI-related technologies, ANI-based technologies are the most likely to support advancing the science of planning.
2) Artificial General Intelligence (AGI)Artificial General Intelligence (AGI) is also referred to as Strong AI or Human AI. AGI refers to a computer that is as smart as a human across multiple domains. Computer science is nowhere close to achieving AGI yet.
3) Artificial Superintelligence (ASI)Artificial Superintelligence (ASI) is “an intellect that is much smarter than the best human brains in practically every field, including scientific creativity, general wisdom and social skills.” This is an even greater leap than AGI, so let’s just move on!
CURRENT APPROACHES TO ARTIFICIAL NARROW INTELLIGENCEToday, our implementation of ANI-based AI can be loosely classified into two categories: expert systems and neural networks.
Expert (Knowledge-Based) SystemsOriginally developed for use in the 1980’s, expert (or knowledge-based) systems (ES) came into their own as computing power got strong enough in the 1990’s. An expert system is a program running on a computer that uses a set of rules to answer a question (typically in the form of IF…THEN).
When asked a question, an ES will filter a set of data, based on rules, to establish a subset of what it believes is the answer. In general, the more rules that can be used to answer the question, the stronger the chance that a correct answer will be given. For example, if I wanted to determine a type of 2-legged animal, simply querying “IF number_of_legs = 2” doesn’t narrow down our search enough to give us a useful answer since there are a large number of animals with 2 legs. Combine this with an additional set of questions relating to height, weight, habitat, pouch, etc. and we can quickly deduce a more reasonable answer.

37The Measurable News 2018.01 | mycpm.org
An expert system is comprised of a knowledge base and an inference engine. For a project planning tool, the knowledge base would contain data pertaining to activities and their durations for different types of project. The inference engine is then responsible for trying to return a subset of this knowledge base back to the planner based on the question they may ask, such as, “How does my current plan benchmark against my historical projects or standards?” Or, "What activities should I include for my engineering scope of my hospital project?"
BASIS Planning Revolution Blog www.basisplanning.com/planning-revolution
4
Expert (Knowledge-Based) Systems
Originally developed for use in the 1980’s, expert (or knowledge-based) systems (ES) came into their own as computing power got strong enough in the 1990’s. An expert system is a program running on a computer that uses a set of rules to answer a question (typically in the form of IF…THEN).
When asked a question, an ES will filter a set of data, based on rules, to establish a subset of what it believes is the answer. In general, the more rules that can be used to answer the question, the stronger the chance that a correct answer will be given. For example, if I wanted to determine a type of 2-legged animal, simply querying “IF number_of_legs = 2” doesn’t narrow down our search enough to give us a useful answer since there are a large number of animals with 2 legs. Combine this with an additional set of questions relating to height, weight, habitat, pouch, etc. and we can quickly deduce a more reasonable answer.
An expert system is comprised of a knowledge base and an inference engine. For a project planning tool, the knowledge base would contain data pertaining to activities and their durations for different types of project. The inference engine is then responsible for trying to return a subset of this knowledge base back to the planner based on the question they may ask, such as, “How does my current plan benchmark against my historical projects or standards?” Or, "What activities should I include for my engineering scope of my hospital project?"
In this example, what is further useful is to understand how confident the computer is that the returned suggestion is correct. This is where concepts like fuzzy logic come into play. Rather than returning a definitive list of activities, the AI engine should return a subset of activities with associated degrees of confidence about their relevance.
Neural Networks
A neural network (NN) tries to simulate the way a brain processes, learns and remembers information. Learning from experience, it looks for similarities in information that it is provided, as well as in previous data and then makes a decision based on that process – it looks for patterns. This pattern matching is called machine learning – you must teach a NN what is a match and what is not. Feed in enough examples of characteristics of an alive human (breathing, pulse, eye movement) and a neural network will start to establish a pattern as to whether those inputs drive toward a correct diagnosis of "alive or dead?"
In this example, what is further useful is to understand how confident the computer is that the returned suggestion is correct. This is where concepts like fuzzy logic come into play. Rather than returning a definitive list of activities, the AI engine should return a subset of activities with associated degrees of confidence about their relevance.
Neural NetworksA neural network (NN) tries to simulate the way a brain processes, learns and remembers information. Learning from experience, it looks for similarities in information that it is provided, as well as in previous data and then makes a decision based on that process – it looks for patterns. This pattern matching is called machine learning – you must teach a NN what is a match and what is not. Feed in enough examples of characteristics of an alive human (breathing, pulse, eye movement) and a neural network will start to establish a pattern as to whether those inputs drive toward a correct diagnosis of "alive or dead?"
BASIS Planning Revolution Blog www.basisplanning.com/planning-revolution
5
There are various forms of machine learning in a neural network including:
• Supervised: For example, feed in an activity that has zero total float and tell the NN that the activity is ‘on the critical path’. After feeding in enough of these activities, it will establish a pattern that matches zero float activities to critical path activities.
• Unsupervised: Feed in activities but don’t tell the NN which are on the critical path or not and let the NN try and categorize the activities based on its various attributes (e.g., total float). In this instance, the NN will perhaps group into zero and non-zero float without knowing this relates to critical path – it simply groups activities together.
• Reinforcement: This is teaching through reward, like teaching a dog good behavior by offering a treat. With regards to our planning software examples, perhaps the license cost of the software should automatically go up or down depending on how good the AI engine suggestions are!!!
Which AI Approach is Best for Helping with Project Planning? Unlike neural networks, expert systems do not require up-front learning nor do they necessarily require large amounts of data to be effective. Yes, expert systems can and do absolutely learn and get smarter over time (by adjusting or adding rules in the inference engine) but they have the benefit of not needing to be ‘trained up front’ in order to function correctly.
Capturing planning knowledge can be a daunting task and arguably very specific and unique to individual organizations. If all organizations planned using the same knowledge (e.g., standard sub-nets), then we could simply put our heads together as an industry and establish a global ‘planning bible’ to which we could all subscribe. This of course isn’t the case and so for a neural network to be effective in helping us in project planning, we would need to mine a lot of data that, even if we could get our hands on it, wouldn’t be consistent enough to actually help with pattern recognition.
Neural networks have been described as black boxes – you feed in inputs, they establish algorithms based on learned patterns and then spit out an answer. The problem is, they don’t tell you why because neural networks don’t understand context! As a diligent planning community, it is likely that we should rely on a system that doesn’t have understanding or even
There are various forms of machine learning in a neural network including:
• Supervised: For example, feed in an activity that has zero total float and tell the NN that the activity is ‘on the critical path’. After feeding in enough of these activities, it will establish a pattern that matches zero float activities to critical path activities.
• Unsupervised: Feed in activities but don’t tell the NN which are on the critical path or not and let the NN try and categorize the activities based on its various attributes (e.g., total float). In this instance, the NN will perhaps group into zero and non-zero float without knowing this relates to critical path – it simply groups activities together.
• Reinforcement: This is teaching through reward, like teaching a dog good behavior by offering a treat. With regards to our planning software examples, perhaps the license cost of the software should automatically go up or down depending on how good the AI engine suggestions are!!!
WHICH AI APPROACH IS BEST FOR HELPING WITH PROJECT PLANNING?Unlike neural networks, expert systems do not require up-front learning nor do they necessarily require large amounts of data to be effective. Yes, expert systems can and do absolutely learn and get smarter over time (by adjusting or adding rules in the inference engine) but they have the benefit of not needing to be ‘trained up front’ in order to function correctly.
Capturing planning knowledge can be a daunting task and arguably very specific and unique to individual organizations. If all organizations planned using the same knowledge (e.g., standard sub-nets), then we could simply put our heads together as an industry and establish a global ‘planning bible’ to which we could all subscribe. This of course isn’t the case and so for a neural network to be effective in helping us in project planning, we would
38 The Measurable News 2018.01 | mycpm.org
need to mine a lot of data that, even if we could get our hands on it, wouldn’t be consistent enough to actually help with pattern recognition.
Neural networks have been described as black boxes – you feed in inputs, they establish algorithms based on learned patterns and then spit out an answer. The problem is, they don’t tell you why because neural networks don’t understand context! As a diligent planning community, it is unlikely that we should rely on a system that doesn’t have understanding or even worse, cannot explain why a tool can come to a given answer. A computer providing guidance indicating “You need activities 1, 2 and 3” is not as useful as “you need these activities based on previous projects X, Y, Z and your currently defined scope and the phase of the project in which you are currently”. The context is the key to us understanding and ultimately accepting the suggestions made.
Expert systems tend to excel in environments that are more sequential, logical and can be ‘tamed’ by rules – doesn’t that remind you of a CPM network? Neural networks pertain more to problems such as recognition through pictures, e.g., project drawings and BIM.
Planning can still benefit from a neural network approach as a way to make the tool smarter. As mentioned, expert systems can get smarter, but they need to be trained. If we can track a planner’s reaction to suggestions made by our expert system, then those reactions can be used to potentially adjust the weights we give to the various attributes in our expert system.
So then relating back to our original definition of AI, for a project planning tool, use an expert system to think and use a neural network to learn. Combine these two, and we have at our disposal, an incredibly powerful planning aid. That is exactly what we have developed at BASIS.
WE ARE EMBRACING AI WITH BASISBASIS is designed to drive greater confidence and realism into your plans via benchmarking. We developed the software to make the process of calibrating and validating your plan faster and with greater accuracy. We achieve this through a combination of AI as well as what we are calling HI or human intelligence.
Within BASIS, there is an expert system AI engine. The knowledge base (or library) contains an organization’s historical as-builts, standards, benchmarks, sub-net templates and even project risk registers. When developing a plan in BASIS, the AI engine makes informed suggestions to the planner as to:
• Is my plan realistic based upon my historical benchmarks?
• What activities should be included?
• In what sequence should the activities be established?
• What risks should be considered?
Add to that BASIS' ability to learn from its planner and team-member users. By utilizing machine learning, the suggestions that BASIS makes actually evolve and get smarter over time.

BASIS Planning Revolution Blog www.basisplanning.com/planning-revolution
7
Once a plan has been benchmarked in BASIS, Human Intelligence offers team members an opportunity to give their expert input and opinion to help drive towards a consensus-based plan. A plan that has a higher degree of buy-in from the team (validation) and one that is also benchmarked by the knowledge from the knowledge library (calibration).
By combining the power of AI computing and human input into the plan, BASIS provides a better / faster / more reliable means of establishing an achievable baseline against which to execute your project. A giant leap forward.
website: www.CBTWorkshop.com phone:
Let The CBT Workshop Assist You!
Staff Augmentation
Tools Implementation and Training
Skilled EVMS Planners, Schedulers, Program Control Analysts, Estimators, and EVMS Consultants
Short or Long Term Assignments Contract-to-hire personnel
We have EVMS tools experts who can implement, train, integrate, and migrate EVMS data in the following tools:
Microsoft Project and Project Server Deltek MPM, wInsight, Cobra, Open Plan Primavera
Everyone is Looking for Skilled EVMS Resources…We Have Them
EVMS Services
Web Based EVMS Training
EVMS Gap Analysis System Description Design and Development Desktop Operating Procedures IBR Preparation and Dispositioning CAM Training and Mock Interviews
EVMS Fundamentals and EVMS Advanced training,
Call UsToday!

The most complete project performance management and EVMS available in a single system
IPM includes all of the features you need for your entire program management team in one package, eliminating the need to connect multiple third party software solutions. IPM’s integrated cost engine replaces MPM and includes:
(256) 881-1038 | [email protected] | www.opdec.com
Comply with government standards
ANSI 748, OMB Circular No. A-11 Exhibit 300 and 53,
C/SSR DFARS clauses, EVMIG of the DCMA and NASA
Interim Directive to NPR 7120.5C
More efficient licensing for small organizationsIPM is a single licensed web based EVMS
software that is licensed per user.
IPM should be considered if you are…
Cost/ScheduleIntegration
CostManagement
ScheduleManagement
EVM ComplianceReports & Analysis
Wanting the benefits of an
integrated EVMS
“We need something
more robust than Excel
and Microsoft Project*
to get the job done, but
not as complicated or
expensive as other
EVM systems.”
“Since we have to move
away from MPM, we are
interested in exploring
our options.”
With our data conversion utility, it
can take just minutes to convert MPM projects to IPM!
An organization who uses MPM and is seeking a
replacement
New in2018!

THE MEASURABLE NEWS
The Quarterly Magazine of the College of Performance Management | mycpm.org
2018.01
41
ABSTRACT
1) There are 7099 living languages in the world. The top 10 languages (Chinese, Spanish, English, Arabic, Hindi, Bengali, Portuguese, Russian, Japanese, and Lahnda) combined are spoken by slightly less than half of the world's population. (https://www.ethnologue.com/statistics/size)
UNDER-SPEND: AN EARNED VALUE ANALYSIS OF 60 PROJECTS IN THE SAHELBy Stephen Fierbaugh, PMP
Earned Value Management (EVM) is a rigorous and widely used analysis technique that provides valuable information about projects' costs and schedules. A brief introduction is provided in this paper.
Two superficially similar projects in the Sahel are compared using EVM, and then conclusions are shared for all of the analyzed projects. EVM is used to answer the following questions:
1. How is each project progressing?2. How significant is the under-spending?3. Is each project using resources efficiently?4. Is there a way to compare the projects to each other?5. How much funding is necessary to complete each project?
KEY FINDING: If present trends continue, most Sahel projects will complete reasonably close to their original budget but take longer than planned.
KEY FINDING: Only 26 of 60 projects contained data suitable for analysis. Progress tracking systems need improvement.
KEY FINDING: EVM provides a useful way for Field Coordinators and Area Directors to determine which projects need additional focus. Dev Reps may use it to assess future investment opportunities.
INTRODUCTIONSeed Company is a $40M/year grant-making organization affiliated with Wycliffe Bible Translators. It encourages, funds, and monitors over 800 minority language1 development projects per year, scattered around the world. The projects are generally planned and ran by local nationals. They report quarterly to Seed Company about finances and progress.
Many translation projects that Seed Company sponsors are struggling with under-spending. They have approved budgets but are not spending available funds. This has negative implications for investor relations and Development Representative workloads. This paper is an analysis of sixty projects in the Sahel area. It uses the Earned Value Management technique to rank the projects and look for insights into underspending.
The Sahel is the semi-arid region of Africa south of the Sahara Desert and north of the tropical coastal region. It stretches from Guinea in the west to the Red Sea on the east. As a practical matter, it encompasses most of the countries overlapping these regions.
RedactionIn keeping with standard and established Seed Company policy regarding projects in sensitive areas, this paper has been redacted from the original. The redactions are of specific project names and a few other details for safety purposes. Redactions are noted with square braces: [REDACTED]

42 The Measurable News 2018.01 | mycpm.org
2) This computation is one of the key metrics of Earned Value management, called Planned Value; see below for more details. 3) Transitions would potentially have ample data, but the systems seem to be treating them as a new project from a reporting standpoint. It is possible that a custom EVM report could take this into account.
MethodologyEarned Value Management (EVM) is a mathematical technique widely used to measure performance and progress of projects in an objective manner. It is included in the Project Management Institute's PMBOK standard. EVM is academically rigorous and is commonly used in the largest projects. It is standardized as ANSI EIA 748-B.
See the Inputs and Outputs sections for descriptions of key values and computations used in Earned Value Management.
Assumptions1. All projects in Seed Company's record-keeping system are up to date as of mid-
July 2017.2. The ProjectExpenseVariance and LanguageProgress reports are accurate
reflections of field reality.2.1 The expense value on the ProjectExpenseVariance report is derived from
transfers to the field + direct charges. (An example of a direct charge is a new computer purchased & billed in the United States, then shipped to the project overseas.)
2.2 There is a many-to-many relationship between languages and projects. Seed Company tracks budgets per project but progress per language. This analysis assumes that each language comprises an equal part of the project budget.
SIMPLE UNDER-SPENDIntuitively, spending less money seems like a good thing. But if it causes the organization to exert too much effort on unnecessary investment, this can unduly stress the Development Team. It also skews administrative cost ratios and raises potential audit compliance issues on designated funds. The Seed Company's goal is the same as the Project Management Institute PMBOK standard: that actual spending matches planned spending.
Planned Value (PV) = Budget At Completion (BAC) * Planned % Complete (PPC)
Simple Over/Under-Spend = Actual Cost (AC) – Planned Value (PV)
A simple approach to the under-spend issue is to multiply the overall budget by the planned complete value to generate the amount that the project should have spent by this date2, and then compare that to actual spending. Indeed, it turns out that nearly all of the Sahel projects are under-spent by this measure. Appendix B contains the simple under-spend data for this analysis.
However, this gross under-spend masks a distressing lack of insight. There is a big difference between a project which has only spent 25% of its budget because it isn't doing anything and a project which is just being fiscally frugal and efficient.
It would be helpful to know things like:
• How significant is the under-spend?
• Are there any trends?
• Which projects are better or worse?
Earned Value Management provides a toolset for answering these questions by considering another important variable: Earned Value. Planned Value tells us how much the project planned to get done. Earned Value tells us how much work the project actually accomplished. "Are we doing what we said we would?"
PROGRESS TRACKING SYSTEMS NEED IMPROVEMENTThe Sahel Area team has 60 open projects in July 2017. However, one or more of the key inputs are missing for just over half of them. These have not been included in this analysis.
The un-analysable projects fall into three broad categories:1. Internships2. Non-written translation (Stories, Oral, Trauma-healing)3. Transitions and brand new projects
For transitions3 and brand new projects, there simply isn't sufficient financial data available yet. Seed Company's financial oversight systems for projects seem to provide good data in appropriate formats and quantities. The projects which lacked this were just too new to have a track record yet.

43The Measurable News 2018.01 | mycpm.org
4) Some projects pick up where a previous effort left off. It might be a recent Seed Company-sponsored project, or it may have been done many decades in the past. This category encompasses a wide variety of situations.5) Depending on how the data is organized, PC and PPC may be one or two numbers. Because of the organization of the SC data, it was most convenient to use two numbers. This does not affect the output or conclusions.
However, Seed Company's systems and methodology for tracking progress are not at the same maturity as its systems for tracking finances. For Internships and non-written projects, Seed Company lacks strong metrics for judging progress, and there was no easy way to generate a "% Complete".
Even some of the traditional written translation projects struggled with good progress tracking. A sophisticated methodology has been built in the Plan and Progress spreadsheet, but is not carried over to the newer online app. The data points look similar but lack key behind the scenes "business knowledge" of what the tracking data actually means, which prevents correct calculation. With its newer systems, Seed Company has lost abilities that it once had. UBS's ParaTExt 8 promises to automate some of this in the future, but additional work is needed in Seed Company's internal systems as well.
On projects which are continuations of previous work4, Field Coordinators must choose how to initially account for work already completed. This requires judgment calls on complex issues The existing systems don't facilitate this entry, and even if they did, the choices will necessarily be somewhat arbitrary.
Lastly, updating progress is rarely high on anyone's TODO list. Additional emphasis on this mundane chore would enable more accurate future analysis.
INPUTS TO EVMOne of the major advantages of Earned Value Management is that it requires only a limited set of data in order to compare otherwise different projects in a way that is "apples to apples".
This analysis needs only four inputs:1. Budget At Completion (BAC) – The full budgeted cost of the project when all
pre-planned expenses over its lifetime are included. Seed Company calls this "SC Lifetime Field Budget".
2. Actual Cost (AC) – How much money has been spent on the project to date? See the Assumptions for an important note about how this has been calculated for this analysis.
3. % Complete (PC) – How many of the project's goals have actually been accomplished to date?
4. Planned % Complete (PPC)5 – How many of the project's goals were planned to have been accomplished by now?
Data for this whitepaper was collected in mid-July from the ProjectExpenseVariance and LanguageProgress reports. This process required repeated manual running of the reports. A custom-made EVM report could extract similar data from Seed Company systems with higher efficiency in the future.
Appendix C contains the input data for this analysis.
OVERVIEW OF EVMEarned Value Management is able to produce a variety of metrics which may prove useful in analysis. The index numbers may be compared or ranked even when the projects are quite different.
Earned Value Management gets its name from the comparison of Planned Value (PV) to Earned Value (EV), which is at its core. These lead to the Cost Performance Index (CPI) and Schedule Performance Index (SPI), which measure how efficiently the project is spending money and how quickly the work is being accomplished.Each project is judged only by its own planned budget ("How much did we spend/get done?" vs "How much did we say we were going to spend/get done?"). In a project that is on time & on budget, both CPI and SPI are exactly 1.0 (one). Less than one is bad, while greater than one is generally good.
Another useful metric for translation projects is Estimate To Complete (ETC). If present performance trends continue, how much money is it actually going to take to finish this project? This may be vastly different than the budgeted amount.
The following are some common Earned Value metrics, how they are computed, and what their implications are for translation projects:

44 The Measurable News 2018.01 | mycpm.org
6. See the section "What now?" for a discussion of the accuracy of this data. This study assumes that Seed Company reports are accurate.
Metric Formula ExplanationKey Metrics
PV Planned Value BAC * PPC How much work did we plan on accomplishing by now?
EV Earned Value BAC * PC How much work did we actually accomplish?
CPI Cost Performance Index EV / Actual Cost (AC)
How much work is being done compared to what we said would be done for this amount of money?
(> 1 = good)
SPI Schedule Performance Index
EV / PV How efficiently are we progressing compared to our planned schedule?
(> 1 = ahead of schedule)
Secondary MetricsCV Cost Variance EV - AC The difference between the value of the work we've actually
done and how much it has actually cost us.
(> $0 = good)
SV Schedule Variance EV - PV The difference between the value of the work we've actually done and the work we scheduled. I.e. how far behind or ahead are we?
(> $0 = good)
Completion ProjectionsEAC Estimate At Completion Budget At
Completion BAC / CPI
If present trends continue, how much is the project going to cost when complete?
ETC Estimate To Complete EAC - AC If present trends continue, how much more money will be needed in order to finish the project?
VAC Variance At Completion BAC - EAC How much over or under budget will the project be at completion?
Appendix D contains the output data for this analysis.
EARNED VALUE ANALYSIS OF THE SAHELTwenty-six Sahel Area projects appear to contain sufficient data in internal reporting systems to analyze them using Earned Value Management. These are all written translation projects with various goals.
[REDACTION: The two projects of focus have been relabeled AAA and BBB.]
AAA and BBBLet's begin by considering two projects, the AAA (#21095) and the BBB (#20154). These projects are both in West Africa and were originally scheduled to last three years. The AAA is an Initial Goals project based on [REDACTED], while the BBB is a [REDACTED]. The AAA's total budget is $70,088 over three years, while the BBB are budgeted at $74,119. As of July, 2017, the AAA are scheduled to be 61% complete while the BBB should be 86% complete.6
The AAA have only spent $17,050 while the BBB have spent $43,719, but the BBB are schedule to be further along (86% vs 61%), so both are significantly under-spent relative to what they were scheduled to spend by this time. The AAA are under-spent $25,704 while the BBB are under-spent $20,023.
# ProjectBAC (SC
Lifetime Field Budget)
Planned % Complete (PPC) Actual Cost (AC)
Planned Value(BAC * PPC)
Simple Over/Under Spend
(AC - PV)21095 AAA $70,088 61% $17,050 $42,754 -$25,704
20154 BBB $74,119 86% $43,719 $63,742 -$20,023
The AAA and BBB appear to be broadly similar projects in many ways related to scope, size, and finances, even though they have different goals. Seed Company would like to be able to compare the projects and answer the following questions:
1. How is each project progressing?2. How significant is the under-spending?3. Is each project using resources efficiently?4. Is there a way to compare the projects to each other?5. How much funding is necessary to complete each project?
How is each project progressing?

45The Measurable News 2018.01 | mycpm.org
The LanguageProgress report indicates that the AAA should be at 61% but are only at 16%. The BBB should be at 86% but are only at 71%. At a superficial glance, both projects are behind schedule and may be in trouble.
Earned Value Management paints a more complex picture. The AAA had planned on spending $42,754 (61% of their $70,088 lifetime field budget). The BBB had planned on spending $63,742 (86% of their $74,119 budget). These are their Planned Values (PV). In reality, the AAA have spent $17,050 while the BBB have spent $43,719 (Actual Cost AC). Both are significantly under-spent from their plan.
# ProjectBAC
(SC Lifetime Field Budget)
Planned % Complete
(PPC)
Actual Cost (AC)
Planned Value
(BAC * PPC)
% Complete (PC)
Earned Value (BAC * PC)
21095 AAA $70,088 61% $17,050 $42,754 16% $11,214
20154 BBB $74,119 86% $43,719 $63,742 71% $52,624
However, a better question might be, "How are they doing compared to how they planned to be doing?" Multiplying the project budget by the actual progress reveals how much Earned Value (EV) the projects have generated: $11,214 for the AAA and $52,624 for the BBB.
How significant is the underspending?Earned Value is an important metric. Instead of asking, "How much money have they spent?", the question becomes "How much value have they delivered?" The AAA have spent $17,050 but only generated $11,214 of value, while the BBB have spent $43,719 but have generated $52,624 of value.
By this more sophisticated spending analysis, called Cost Variance (CV), the AAA have not under-spent at all, but rather overspent $5,836! The BBB, on the other hand, have actually under-spent, $8,905, but only because they have delivered more value for their budget money.
# Project Actual Cost (AC) Earned Value (BAC * PC) Cost Variance (EV - AC)21095 AAA $17,050 $11,214 -$5,836
20154 BBB $43,719 $52,624 $8,905
Is each project using resources efficiently?Knowing the Planned Value and the Earned Value allow calculation of a number of other useful metrics. The ratio of Earned Value to Actual Cost is the Cost Performance Index, or CPI. This is a number that tells how efficiently the project is getting its work done. In an ideal project, the CPI is 1.0 (one). A CPI less than one is spending more money than budgeted to do the planned work. A CPI of greater than one indicates that the work is getting done with less money.
The AAA's CPI is 0.66 while the BBB's is 1.20. Another way of looking at this is the AAA are only getting 66 cents worth of work for every dollar spent while the BBB are getting $1.20 of planned work for every dollar actually spent.
# Project Earned Value (BAC * PC) Actual Cost (AC) Cost Performance Index (EV / AC)
21095 AAA $11,214 $17,050 0.66
20154 BBB $52,624 $43,719 1.20
Is there a way to compare the projects to each other?The CPI is computed relative only to what is in an individual project's plan, but it is an index, not a dollar value. This means that it can be compared legitimately across projects. The CPI says that the BBB are almost twice as efficient in their work as the AAA!
The ratio of Earned Value to Planned Value is another helpful metric called the Schedule Performance Index (SPI). CPI measures how efficiently a project spends money, but SPI measures whether it is getting work accomplished on time.
In an ideal project, the SPI is 1.0 (one). An SPI less than one indicates that the project has not completed as much as they planned on; they are behind schedule. An SPI of greater than one indicates that the project has completed more work than they planned on at this point; they are ahead of schedule. The AAA's SPI is 0.26, while the BBB's is 0.83. Both projects are behind schedule: the BBB slightly, but the AAA badly.
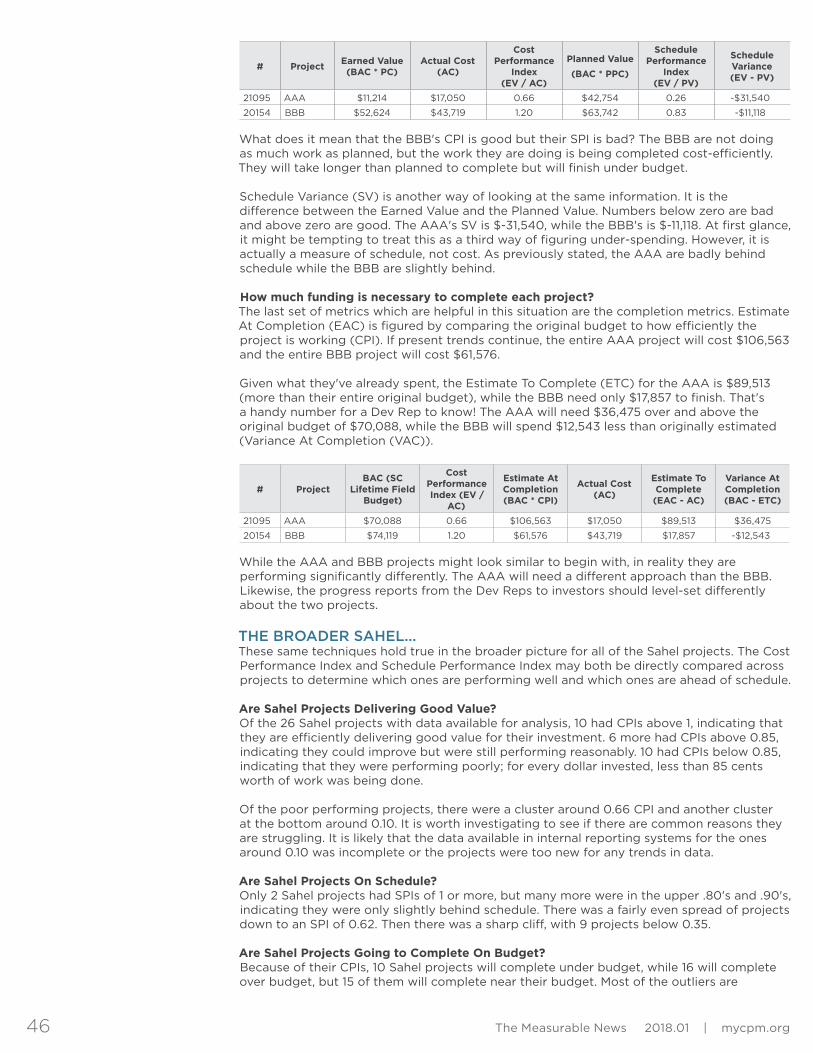
46 The Measurable News 2018.01 | mycpm.org
# Project Earned Value (BAC * PC)
Actual Cost (AC)
Cost Performance
Index (EV / AC)
Planned Value(BAC * PPC)
Schedule Performance
Index (EV / PV)
Schedule Variance (EV - PV)
21095 AAA $11,214 $17,050 0.66 $42,754 0.26 -$31,540
20154 BBB $52,624 $43,719 1.20 $63,742 0.83 -$11,118
What does it mean that the BBB's CPI is good but their SPI is bad? The BBB are not doing as much work as planned, but the work they are doing is being completed cost-efficiently. They will take longer than planned to complete but will finish under budget.
Schedule Variance (SV) is another way of looking at the same information. It is the difference between the Earned Value and the Planned Value. Numbers below zero are bad and above zero are good. The AAA's SV is $-31,540, while the BBB's is $-11,118. At first glance, it might be tempting to treat this as a third way of figuring under-spending. However, it is actually a measure of schedule, not cost. As previously stated, the AAA are badly behind schedule while the BBB are slightly behind.
How much funding is necessary to complete each project?The last set of metrics which are helpful in this situation are the completion metrics. Estimate At Completion (EAC) is figured by comparing the original budget to how efficiently the project is working (CPI). If present trends continue, the entire AAA project will cost $106,563 and the entire BBB project will cost $61,576.
Given what they've already spent, the Estimate To Complete (ETC) for the AAA is $89,513 (more than their entire original budget), while the BBB need only $17,857 to finish. That's a handy number for a Dev Rep to know! The AAA will need $36,475 over and above the original budget of $70,088, while the BBB will spend $12,543 less than originally estimated (Variance At Completion (VAC)).
# ProjectBAC (SC
Lifetime Field Budget)
Cost Performance Index (EV /
AC)
Estimate At Completion (BAC * CPI)
Actual Cost (AC)
Estimate To Complete (EAC - AC)
Variance At Completion (BAC - ETC)
21095 AAA $70,088 0.66 $106,563 $17,050 $89,513 $36,475
20154 BBB $74,119 1.20 $61,576 $43,719 $17,857 -$12,543
While the AAA and BBB projects might look similar to begin with, in reality they are performing significantly differently. The AAA will need a different approach than the BBB. Likewise, the progress reports from the Dev Reps to investors should level-set differently about the two projects.
THE BROADER SAHEL...These same techniques hold true in the broader picture for all of the Sahel projects. The Cost Performance Index and Schedule Performance Index may both be directly compared across projects to determine which ones are performing well and which ones are ahead of schedule.
Are Sahel Projects Delivering Good Value?Of the 26 Sahel projects with data available for analysis, 10 had CPIs above 1, indicating that they are efficiently delivering good value for their investment. 6 more had CPIs above 0.85, indicating they could improve but were still performing reasonably. 10 had CPIs below 0.85, indicating that they were performing poorly; for every dollar invested, less than 85 cents worth of work was being done.
Of the poor performing projects, there were a cluster around 0.66 CPI and another cluster at the bottom around 0.10. It is worth investigating to see if there are common reasons they are struggling. It is likely that the data available in internal reporting systems for the ones around 0.10 was incomplete or the projects were too new for any trends in data.
Are Sahel Projects On Schedule?Only 2 Sahel projects had SPIs of 1 or more, but many more were in the upper .80's and .90's, indicating they were only slightly behind schedule. There was a fairly even spread of projects down to an SPI of 0.62. Then there was a sharp cliff, with 9 projects below 0.35.
Are Sahel Projects Going to Complete On Budget?Because of their CPIs, 10 Sahel projects will complete under budget, while 16 will complete over budget, but 15 of them will complete near their budget. Most of the outliers are

47The Measurable News 2018.01 | mycpm.org
probably caused by inconsistent data, but if not, some of them require drastic intervention.
It is possible to predict the amount of additional money necessary to complete each project, and in some cases this value is quite different (either above or below) the originally budgeted amount.
CONCLUSIONIf present trends continue, most Sahel projects will complete reasonably close to their original budget but take longer than anticipated.
As detailed in the "Progress Tracking Systems Need Improvements" section, Seed Company needs improved systems to track project progress.
What now?It cannot be reiterated strongly enough, this analysis is only as good as the data it is based on. It would be poor judgment to take action solely based upon internal reporting systems. The best people to use this data are the Area Directors and individual Field Coordinators, who are familiar with individual projects and can validate and verify before taking action on issues.
As a concrete example of this, the analysis indicates that the AAA are under-performing while the BBB are over-performing. Based upon available report data, that is a valid conclusion. However, discussions with the AD and FC reveal that the AAA have actually accomplished more than indicated because Seed Company's progress reports currently measure only direct translation while ignoring "Other Goals" such as startup tasks. The BBB performance, on the other hand, may be overstated because of how previous work was credited and because timeliness of their financials is difficult (several different organizations' reports must be integrated).
Future ImprovementsA carefully designed report could make assembling Earned Value Management analysis much easier. In fact, Seed Company's systems appear to contain information to produce historical EVM reports that may shed additional light on project efficiencies.
EVM depends upon accurate financials and accurate progress. Seed Company has excellent financial controls and reporting in place. It has basic progress measurement for traditional written translations, but it is sometimes out of date. It lacks rigorous tracking of progress for internships or non-traditional projects such as oral translation.
There is a many-to-many relationship between languages and projects. Seed Company currently tracks budgets on a per-project basis but progress on a per language basis. This analysis assumes that each language in a project contributes an equal amount to its costs. In an ideal world, these would be tracked at the same level.
With additional experience, it should be possible to fine-tune Seed Company's EVM analysis to establish data-driven benchmarks indicating at which CPI and SPI levels project managers should become concerned.
Appendix A: Raw Data URLThe spreadsheet containing the raw data is located at https://docs.google.com/spreadsheets/[Redacted]
Appendix B: Simple Under-Spend Data
Account Number Name
Budget At Completion Actual Cost Planned %
Complete Planned Value Simple Over/Under Spend
BAC AC PPC PVFrom Reports
(SC Lifetime Field Budget)
From Reports From Reports BAC * PPC AC - PV
21144 [Redacted] $113,399 $19,314 28% $31,752 -$12,438
20374 [Redacted] $87,471 $36,728 82% $71,726 -$34,998
20324 [Redacted] $94,804 $31,578 55% $52,142 -$20,564
26232 [Redacted] $579,064 $227,612 77% $445,879 -$218,267
20224 [Redacted] $257,352 $95,991 96% $247,058 -$151,067
25711 [Redacted] $491,392 $425,587 52% $257,489 $168,098

48 The Measurable News 2018.01 | mycpm.org
Account Number Name
Budget At Completion Actual Cost Planned %
Complete Planned Value Simple Over/Under Spend
BAC AC PPC PVFrom Reports
(SC Lifetime Field Budget)
From Reports From Reports BAC * PPC AC - PV
26994 [Redacted] $171,053 $92,355 99% $168,915 -$76,560
26192 [Redacted] $453,070 $208,104 87% $394,171 -$186,067
20376 [Redacted] $63,428 $7,737 30% $19,028 -$11,291
21095 AAA $70,088 $17,050 61% $42,754 -$25,704
25360 [Redacted] $261,419 $244,587 100% $261,419 -$16,832
26593 [Redacted] $153,516 $128,678 100% $153,516 -$24,838
21064 [Redacted] $93,065 $85,246 90% $83,759 $1,488
20705 [Redacted] $116,194 $35,019 35% $40,668 -$5,649
26743 [Redacted] $238,123 $178,497 98% $233,956 -$55,459
25440 [Redacted] $166,321 $168,669 100% $166,321 $2,348
26202 [Redacted] $300,195 $204,131 100% $300,195 -$96,064
26943 [Redacted] $111,883 $76,379 93% $104,051 -$27,672
28300 [Redacted] $359,794 $330,020 100% $359,794 -$29,774
26693 [Redacted] $57,233 $45,948 98% $56,088 -$10,140
26913 [Redacted] $242,465 $78,586 53% $128,506 -$49,920
20154 BBB $74,119 $43,719 86% $63,742 -$20,023
20454 [Redacted] $64,660 $37,534 100% $64,660 -$27,126
20765 [Redacted] $317,604 $114,462 96% $303,312 -$188,850
20375 [Redacted] $125,529 $58,308 86% $107,955 -$49,647
21066 [Redacted] $111,185 $19,474 36% $40,027 -$20,553
Appendix C: Input Data for Sahel Projects
Account Number Name
Budget At Completion Actual Cost % Complete Planned %
CompleteBAC AC PC PPC
From Reports
(SC Lifetime Field Budget)
From Reports From Reports From Reports
21144 [Redacted] $113,399 $19,314 0% 28%
20374 [Redacted] $87,471 $36,728 4% 82%
20324 [Redacted] $94,804 $31,578 4% 55%
26232 [Redacted] $579,064 $227,612 14% 77%
20224 [Redacted] $257,352 $95,991 17% 96%
25711 [Redacted] $491,392 $425,587 42% 52%
26994 [Redacted] $171,053 $92,355 35% 99%
26192 [Redacted] $453,070 $208,104 30% 87%
20376 [Redacted] $63,428 $7,737 8% 30%
21095 AAA $70,088 $17,050 16% 61%
25360 [Redacted] $261,419 $244,587 82% 100%
26593 [Redacted] $153,516 $128,678 75% 100%
21064 [Redacted] $93,065 $85,246 82% 90%
20705 [Redacted] $116,194 $35,019 28% 35%
26743 [Redacted] $238,123 $178,497 73% 98%
25440 [Redacted] $166,321 $168,669 100% 100%
26202 [Redacted] $300,195 $204,131 70% 100%
26943 [Redacted] $111,883 $76,379 71% 93%
28300 [Redacted] $359,794 $330,020 97% 100%
26693 [Redacted] $57,233 $45,948 86% 98%
26913 [Redacted] $242,465 $78,586 37% 53%
20154 BBB $74,119 $43,719 71% 86%
20454 [Redacted] $64,660 $37,534 76% 100%
20765 [Redacted] $317,604 $114,462 59% 96%
20375 [Redacted] $125,529 $58,308 80% 86%
21066 [Redacted] $111,185 $19,474 38% 36%
Appendix D: Output Data for Sahel Projects
Primary Metrics

49The Measurable News 2018.01 | mycpm.org
Account Number Name
Planned Value Earned Value Cost Performance Index
Schedule Performance Index
PV EV CPI SPIBAC * PPC BAC * PC EV / AC EV / PV
21144 [Redacted] $31,752 $0 0.00 0.00
20374 [Redacted] $71,726 $3,499 0.10 0.05
20324 [Redacted] $52,142 $3,792 0.12 0.07
26232 [Redacted] $445,879 $81,069 0.36 0.18
20224 [Redacted] $247,058 $43,750 0.46 0.18
25711 [Redacted] $257,489 $204,419 0.48 0.79
26994 [Redacted] $168,915 $59,869 0.65 0.35
26192 [Redacted] $394,171 $135,921 0.65 0.34
20376 [Redacted] $19,028 $5,074 0.66 0.27
21095 AAA $42,754 $11,214 0.66 0.26
25360 [Redacted] $261,419 $214,364 0.88 0.82
26593 [Redacted] $153,516 $114,369 0.89 0.75
21064 [Redacted] $83,759 $76,313 0.90 0.91
20705 [Redacted] $40,668 $32,534 0.93 0.80
26743 [Redacted] $233,956 $173,234 0.97 0.74
25440 [Redacted] $166,321 $166,321 0.99 1.00
26202 [Redacted] $300,195 $210,137 1.03 0.70
26943 [Redacted] $104,051 $79,437 1.04 0.76
28300 [Redacted] $359,794 $349,000 1.06 0.97
26693 [Redacted] $56,088 $49,220 1.07 0.88
26913 [Redacted] $128,506 $89,712 1.14 0.70
20154 BBB $63,742 $52,624 1.20 0.83
20454 [Redacted] $64,660 $49,142 1.31 0.76
20765 [Redacted] $303,312 $187,386 1.64 0.62
20375 [Redacted] $107,955 $100,423 1.72 0.93
21066 [Redacted] $40,027 $42,250 2.17 1.06
Secondary Metrics
Account Number Name
Cost Variance Schedule Variance
Estimate At Completion
Estimate To Completion
Variance At Completion
CV SV EAC ETC VACEV - AC EV - PV BAC / CPI EAC - AC BAC - EAC
21144 [Redacted] -$19,314 -$31,752 #DIV/0! #DIV/0! #DIV/0!
20374 [Redacted] -$33,229 -$68,227 $918,200 $881,472 -$830,729
20324 [Redacted] -$27,786 -$48,350 $789,450 $757,872 -$694,646
26232 [Redacted] -$146,543 -$364,810 $1,625,800 $1,398,188 -$1,046,736
20224 [Redacted] -$52,241 -$203,308 $564,653 $468,662 -$307,301
25711 [Redacted] -$221,168 -$53,070 $1,023,046 $597,459 -$531,654
26994 [Redacted] -$32,486 -$109,046 $263,871 $171,516 -$92,818
26192 [Redacted] -$72,183 -$258,250 $693,680 $485,576 -$240,610
20376 [Redacted] -$2,663 -$13,954 $96,713 $88,976 -$33,285
21095 AAA -$5,836 -$31,540 $106,563 $89,513 -$36,475
25360 [Redacted] -$30,223 -$47,055 $298,277 $53,690 -$36,858
26593 [Redacted] -$14,309 -$39,147 $172,722 $44,044 -$19,206
21064 [Redacted] -$8,933 -$7,445 $103,959 $18,713 -$10,894
20705 [Redacted] -$2,485 -$8,134 $125,068 $90,049 -$8,874
26743 [Redacted] -$5,263 -$60,721 $245,357 $66,860 -$7,234
25440 [Redacted] -$2,348 $0 $168,669 $0 -$2,348
26202 [Redacted] $6,006 -$90,059 $291,616 $87,485 $8,579
26943 [Redacted] $3,058 -$24,614 $107,576 $31,197 $4,307
28300 [Redacted] $18,980 -$10,794 $340,227 $10,207 $19,567
26693 [Redacted] $3,272 -$6,868 $53,428 $7,480 $3,805
26913 [Redacted] $11,126 -$38,794 $212,395 $133,809 $30,070
20154 BBB $8,905 -$11,118 $61,576 $17,857 $12,543
20454 [Redacted] $11,608 -$15,518 $49,387 $11,853 $15,273
20765 [Redacted] $72,924 -$115,925 $194,003 $79,541 $123,601
20375 [Redacted] $42,115 -$7,532 $72,885 $14,577 $52,644
21066 [Redacted] $22,776 $2,224 $51,247 $31,773 $59,938

BibliographyA Guide to the Project Management Body of Knowledge (PMBOK¨ Guide)–Sixth Edition. (2017).
Newtown Square, Pennsylvania: Project Management InstituteANSI/EIA. (2005). Standard for Earned Value Management Systems (748-B). Arlington, Virginia:
National Defense Industrial AssociationSummary by language size. (n.d.). Ethnologue. Retrieved November 6, 2017, from https://www.
ethnologue.com/statistics/sizeFile:Map of the Sahel.png. (2015, August 31). Wikimedia Commons, the free media repository. Retrieved
22:29, November 6, 2017 from https://commons.wikimedia.org/w/index.php?title=File:Map_of_the_Sahel.png&oldid=170292957.
About the Author Stephen Fierbaugh, PMP - Stephen Fierbaugh is a PMI-certified Project Management Professional (PMP). He holds an MA in Intercultural Studies with a focus on Information and Communication Technologies (ICT). Stephen has extensive experience with projects which involve cross-cultural communications and geographically diverse project teams. Past roles include Director of Software Development and Director of IT. Stephen also has six years of experience as a consultant with IBM Global Services.
forProject Technology, Inc. 4020 N. MacArthur Blvd. Suite 122-304 Irving, Texas 75038 USA Phone: (214) 550-8156 Email: [email protected] Web: www.forproject.com
www.forproject.com
Tired of fighting with your current EVMS Software?
EVMS forProject™ is the easy-to-use, configurable EVMS solution that can help to simplify your EVMS process and reduce the effort required for effective cost/schedule performance measurement and reporting.
Designed to work closely with Microsoft Project, Project Server and Primavera P6, EVMS forProject™ simplifies the process of cost/schedule integration, freeing your users for more important analysis.
EVMS forProject™ is designed to be scalable from simple to complex projects and can be configured to match your unique standards and business rules. Flexible integration tools allow you to integrate with your ERP or financial systems, avoiding errors and reducing the effort required for cost integration.
If you have a formal EVMS requirement, the tool is designed to support the principles of EIA 748 and to generate your required EVMS reports, all in a modern, easy-to-use interface that will save your users time and effort.
Give us a call if you’d like to learn more about how a modern, flexible EVMS solution can help your organization to stop fighting and get more done.
Earned Value Management. Simplified.

VENDORS & SERVICES
P.O. Box 20996Sarasota, FL 34276
Phone: (888) 644-5613
www.CBTWorkshop.com
www.steelray.com
Schedule quality for Project and P6
www.bdo.com
www.humphreys-assoc.com
Planning every step — Every step as planned™
EVPrep™ Exam Study Guide EVPrep™ Exam Prep Workshops
www.mgmt-technologies.com*Earned Value Professional
Get it now!
Got your ?*
www.sna-software.com
Get Involved In CPM:Become A VolunteerMost people agree that the value of membership in any organization is greatly impacted by one’s involvement in that organization. CPM has many opportunities for you to become engaged in your organization.
You can help with our certificate program, become a leader in our two conferences each year or other volunteer opportunities as they appear on the website. Take the time to read each of the job descriptions and ask questions of the point of contact for each if you are not sure what is expected. PDU’s are available for volunteering in CPM.
These opportunities are listed on our website:www.mycpm.org./ABOUT US/VOLUNTEERS
see our ad on p. 34
see our ad on p. 8
see our ad on p. 39
see our ad on p. 4

mycpm.org