fiber testin g and troubleshooting fluke networks roland schlehuber
TRANSCRIPT

Fiber Testing and gTroubleshooting
Fluke NetworksFluke NetworksRoland Schlehuber

Objective
Fib T d• Fiber Trends
• Understand Issues that Impact Fiber Optic Link and Channel Performance
• Understand How to Determine Installed Link and Channel Performance.
• Along the way, learn about encircled flux launchAlong the way, learn about encircled flux launch condition control and Tier 1 and Tier 2 testing “gotchas”gotchas

Fiber TrendsFiber Trends
3

Growth Drivers
40/100 GB Ethernet40/100 GB Ethernet
– Approved by IEEE in June 2010
– The trend continues…
100000
6000080000
100000120000
bps Higher SpeedsHigher Speeds
15002000250030003500
eter
s
13 12.5 1311
12.510 11
68
101214
dB
1000
40000
4 10 16 100 10 52 26610010000
0200004000060000
Mb E- n 16 TP E- M el E- SX E- E- AS 0
Mb
0500
10001500
n Mb
SE-
L en 16 TP D SE-
TM e nel
SE-
0 SX SE-
SE-
AS 0
Me
Shorter DistancesShorter Distances 1.9 1.9
63.56
2.60246
en Mb
ASE
-IL ke
ng
16
DI/T
PM
DA
SE-
L ATM re nn
elA
SE-
BA
SX ASE
-
EE 3ba
EE 3ba
d
Smaller loss budgetsSmaller loss budgets
Toke
nR
ing
4 M
10BA
SE
FOIL
Toke
nRi
ng 1
FDD
I/TPM
D10
BAS
EFL AT
Fibr
eC
hann
e10
0BAS
EFX 10
00BA
SE- S
10G
BAS
ES
40G
BAS
ESR
410
0GB A
E-S
R10
1986 1987 1989 1992 1993 1993 1994 1995 1998 2002 2010 2010
Toke
nR
ing
4 M
10B
AS
FOIL
Toke
Rin
g FD
DI/
PMD
10B
AS
FL AT
Fibr
eC
hann
100B
AS
FX 100 0
BA
SE-
10G
BA
SS
40G
BA
SSR
410
0GB
AE-
SR1
1986 1987 1989 1992 1993 1993 1994 1995 1998 2002 2010 2010
Toke
Rin
g 4
10B
AFO
ITo
kR
ing
FDD PM
10B
A FL A
Fib
Cha
n10
0BA
FX10
00B
E-S
10G
BA S IEE
802.
3IE
E80
2.3
1986 1987 1989 1992 1993 1993 1994 1995 1998 2002 2010 2010

Factors Affecting Signal Lossg g
• Intrinsic
– Raleigh Scattering
– Water Peak Absorption (except of zero water peak fiber)
• Splice & Connector LossSplice & Connector Loss
– Fusion: core alignment
– Mechanical: core alignment, dirt on end face, reflection
d i ld i i Si l d ib– Mode Field Diameter in Single Mode Fibers
– Numerical Aperture Mismatch in Multimode Fibers

More Factors Affecting Loss
M b di (Si l M d Fib )• Macrobending (Single Mode Fiber)
– Bending radius ~ 2 – 15 mm
– Affects long wavelengths first
– Affected mostly by fiber design
• Microbending (All Fiber)
– Bending radius ~ radius of coreBending radius radius of core
– Can occur during optical fiber manufacturing process
– Can be induced during installation due to point pressures
Aff t ll l th b t i li htl ith l th– Affects all wavelengths, but increases slightly with wavelength
– Order of Sensitivity (least to highest): SM, 62.5 µ, 50 µ
– Affected by Coating and Cable Design

Factors Affecting Performance
Ch i Di i (Si l M d Fib )• Chromatic Dispersion (Single Mode Fibers)
– Laser output is distribution of wavelengths
– Different wavelengths travel different speeds
• Polarization Mode Dispersion (Single Mode Fibers)
– Radially imperfect core
– Causes delay in 1 of 2 Orthogonal ModesCauses delay in 1 of 2 Orthogonal Modes
• Modal Dispersion (Multi‐mode Fibers)
– Mode is quantum level in light pulse
E h d i diff t f– Each mode occupies different area of core
– Imperfect core structure causes modes to have different speeds

Dispersion or Pulse Broadening

Measuring Modal Dispersiong p
• Over‐Filled Launch (OFL)– Uses LED– Completely fills all modes of multimode fiber
• Differential Modal Dispersion– Uses Laser– Injects pulses of light from one side of the core to the other at micron
intervals– Measures Pulse Intensity and Time of Arrival– Effective Modal Bandwidth is determined from this test

Multimode Performance
Comparison at 850 nm
Fiber Type
Bandwidth (MHz-km @ 850 nm)
1 GB/s Link Length (@850 nm)
10 GB/s Link Length (@850 nm)
FDDI 62.5 µ 160 220 m 26 m µOM1 62.5 µ 220 275 m 33 m
OM2 50 µ 500 550 m 82 m
OM3 50 µ 1500 (2000)* 1000 m * 300 m
OM4 50 µ 3500 (4700)* 1040 m * 500-550 m *
* Effective Modal * Lengths unsupported by application Bandwidth
OM4 grade multimode fiber was approved asEIA/TIA 492AAAD A t 5 2009
standards
EIA/TIA 492AAAD on August 5, 2009

Effect of Modal Dispersion
FDDI Grade 62.5µ fiber Laser Optimized 50µ fiber10 Gb/s
Bit Period10 Gb/s
Bit Period
FiberCoreCore
Center
Received pulse at 10 GB/s over 300 meters

Smart Testing & Troubleshooting g g
• Eliminate common problems with good practices during installation and maintenance
– Verify continuity polarity adequate end‐face condition with basic tools to– Verify continuity, polarity, adequate end‐face condition with basic tools to ensure best termination and installation practices
• Perform complete cable certification per TIA 568 C• Perform complete cable certification per TIA‐568‐C
– Basic certification (Tier 1): Mandatory
– Extended certification (Tier 2): Optional

Tier 1: OLTS (Optical Loss Test Set)( p )
− Conforms to TIA‐526‐14A and TIA‐526‐7(Most closely simulates system)
− Measures the total loss of a fiber channel
f l− Verify polarity using OLTS or VFL
Main Remote

Measuring Optical Loss
M d i dB• Measured in dB:Not a linear scale, but a logarithmic scale
• For every 3 dB down
Loss(in dB)
PowerLost (%)
PowerReceived (%)
3 50 50• For every 3 dB down,
received power drops by a factor of 2
• For every 10 dB down,
10 90 1020 99 130 99.9 0.1 y ,
received power drops by a factor of 10
40 99.99 0.0150 99.999 0.001
Loss (dB) = 10* Log
Power (received)Power (transmitted)

Loss Is Measured As A Difference In Power
1. First measure power coming out of the source
Patch Cable
Source Example: Measures ‐ 20 dBmMeter
2. Then measure power after coming out of the fiber link
Source Example: Measures 20 dBmMeter
Fiber PatchCable
PatchCable
Source
Link
MeterAdapterExample: Measures ‐23 dBm
AdapterMeter
3. The loss is the difference in dB (3 dB in this example)

Pass/Fail Limit: TIA Loss Budget CalculationCalculation
7
8
9Application Loss (dB) λ (nm) Length (m)
Multimode ≤3.5/km + 0.75/conn + 0 3/spl
850 ≤ 2000
3
4
5
6
loss
(dB
) 850 MMF1300 MMFISP SMFOSP SMF
0.3/spl≤1.5/km + 0.75/conn + 0.3/spl
1300 ≤ 2000
Singlemode ≤1.0/km + 0.75/conn + 1310 ≤ 3000
0
1
2
0 500 1000 1500 2000 2500 3000
g0.3/spl (Inside) 1550
≤0.5/km + 0.75/conn + 0.3/spl (outside)
1310 1550
≤ 3000
TIA/EIA-568-C definition length (m)
Note: There is no longer a horizontal specification in 568-Cg p

Pass/Fail Limit: IEEE Gigabit Ethernet
• 1000BASE‐SX (850 nm VCSEL) MBW Loss Distance
Ethernet
– 62.5 micron multimode fiber: 160 2.38 dB 220 m
– 62.5 micron multimode fiber: 200 2.60 dB 275 m
– 50 micron multimode fiber: 400 3 37 dB 500 m50 micron multimode fiber: 400 3.37 dB 500 m
– 50 micron multimode fiber: 500 3.56 dB 550 m
• 1000BASE‐LX (1310 nm laser)
62 i l i d fib 00 2 3 d 00– 62.5 micron multimode fiber: 500 2.35 dB 500 m
– 50 micron multimode fiber: 400 2.35 dB 550 m
– 50 micron multimode fiber: 500 2.35 dB 550 m• For multimode links >300 m, a mode conditioning patch cord may be required
– singlemode fiber: 4.70 dB 5000 m

Pass/Fail Limit: IEEE 10 Gigabit Ethernet
• 10GBASE‐S (850 nm laser) MBW Loss Distance
62 5 i lti d fib 160 2 60 dB 26
Ethernet
– 62.5 micron multimode fiber: 160 2.60 dB 26 m
– 62.5 micron multimode fiber: 200 2.50 dB 33 m
– 50 micron multimode fiber: 400 2.20 dB 66 m
– 50 micron multimode fiber: 500 2.30 dB 82 m
– 50 micron multimode fiber: 2000 2.60 dB 300 m
• 10GBASE‐LX4 (1310 nm laser)10GBASE LX4 (1310 nm laser)
– 62.5 micron multimode fiber: 500 2.50 dB 300 m
– 50 micron multimode fiber: 400 2.00 dB 240 m
50 i lti d fib 500 2 00 dB 300– 50 micron multimode fiber: 500 2.00 dB 300 m
– 50 micron multimode fiber: 2000 2.00 dB 300 m
– singlemode fiber: 6.30 dB 5000 m

Tier 1 FAQ‐What is the correct way to set a reference?
1. Set the reference using the test reference cord (sets P0 to 0dB).g ( )2. Attach tail cord to cable under test and measure P1 Loss = - (P1 - P0)3. Measures loss of two connectors and cable (fiber).
Most accurate and repeatable reference method:Most accurate and repeatable reference method:1Jumper Reference Method (also called “method B”)

Tier 1 FAQ‐Why am I required to use a mandrel?
Mandrel wrap with LED allows testing 50um and 62.5um

Tier 1 FAQ‐When to use LED (MFM) and when to use VCSEL (GFM) source?use VCSEL (GFM) source?
CladdingCore
Light
LED for Warranty CertificationVCSEL to match light source to actual electronics (Gig, 10G)

Pessimistic result
Impact of Source on loss testingPessimistic result
LED Over‐filled launch = over estimates loss
Optimistic result
VCSEL Under‐filled launch = under estimates loss
Network might not work with “wrong” source

The “Encircled Flux” standard
EF is a new multimode launch condition metric that:
1. Reduces link loss variation
2 Was developed to keep up with components2. Was developed to keep up with components used in high speed networks (850 nm VCSEL, OM3/4 fiber)OM3/4 fiber)
3. Was intended for >1GbE
4 T 850 d 50 bli4. Targets 850 nm and 50 um cabling
5. Can be used for all sources and links
6. Improves supplier to supplier consistencyEF tightly controls the number of mode groups

How is EF measured?
EF
output Test cord
output
Near field
measurement
Reference grade
test cord
Source
Measured at output of test cordmandrel

Encircled Flux solves the problem by:
1. Controlling the number of mode groups launched1. Controlling the number of mode groups launched from the test cord
2. Requiring better test cords from suppliersq g f pp
3. Formulating a tight standards‐based template
4. Advising all test equipment suppliers to use the4. Advising all test equipment suppliers to use the same template.

Launch Controller in use

Tier 1 Fiber Certification
• Basic (Tier 1) certification of fiberBasic (Tier 1) certification of fiber links
– Required for standards– Required for standards compliance
– Uses absolute power/loss measurementmeasurement
– Best for measuring TOTAL (end‐to‐end) loss of a fiber channelchannel
– Test against loss limits based on industry standards for current applicationcurrent application

Tier 2 Test with OTDR
• Single-ended testing of fibers
• Shows loss per eventC ti & li• Connections & splices
• Fiber segments• Troubleshoot faulty fiber• Troubleshoot faulty fiber
links

Tier 2 Fiber Certification
• Extended (Tier 2) ( )certification of a fiber link
– Complements Tier 1 fiber certification
– Increases the quality ofIncreases the quality of the fiber link
– Ensure that the fiber link meets expectations for current and future applicationsapplications

Test Example: Extended (Tier 2) certification
100 m 7 m 110 m
Pass/Fail loss budget is 3.56 dB noted for IEEE 1000Base-SX
R l f Ti 1 C ifi i i 2 67 dBResult of Tier 1 Certification is 2.67 dB

Test Example: ‐Extended (Tier 2) certification100 m 7 m 110 m
Location(m)
850nm(dB)
Event Pass/Fail
0 .18 Reflect Pass100 .14 Reflect Pass107 1 4 R fl t F il
1.91db loss at connections plus .76db loss for cable = 2.67db total link loss 107 1.4 Reflect Fail
217 .19 Reflect Pass
total link loss

Reflectance:The silent killer of high speedThe silent killer of high speed
networks
32

What is reflectance?
• When light moves from a medium of a given refractive index n1 into a second medium with refractive index n2, both reflection and refraction of the light may
• These Fresnel reflections are what you see when looking at a window
medium with refractive index n2, both reflection and refraction of the light may occur.
see when looking at a window.
– Caused by the refractive index difference between air and glass.
If t t b d till– If not too bad, you can still see through the glass.
• An air gap between the end faces of a fib l F l fl ti tfiber also cause Fresnel reflections to occur.

Why should you care?
• High reflectance causes increased Bit Error Rates (CRC errors) on the network
– Laser light reflected back into the transmitter increases the Relative Intensity Noise (RIN) of the laser.of the laser.
– If the reflection is caused by contamination that results in Mode Selective Losses (e.g. caused by dirt) then Modal Noise is increased.
– Noise on the network increases Bit Error Rates (adversely affecting the user’s experience)
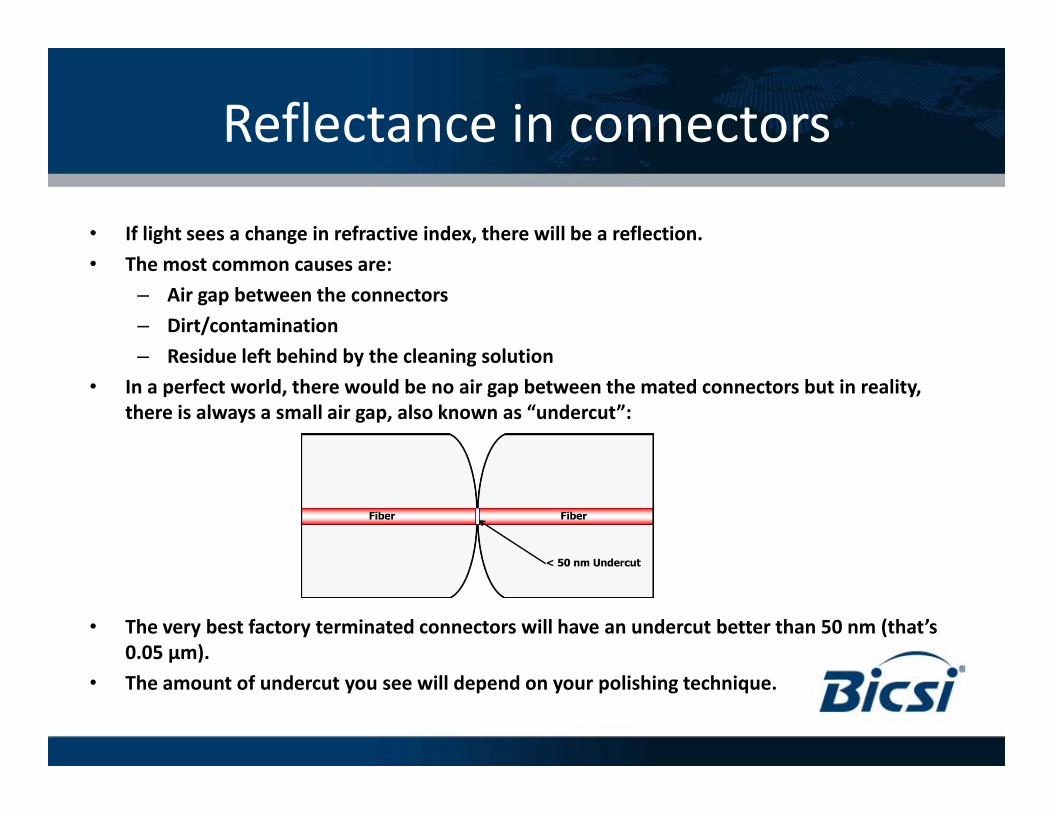
Reflectance in connectors
• If light sees a change in refractive index, there will be a reflection.
• The most common causes are:
– Air gap between the connectors
– Dirt/contamination
Residue left behind by the cleaning solution– Residue left behind by the cleaning solution
• In a perfect world, there would be no air gap between the mated connectors but in reality, there is always a small air gap, also known as “undercut”:
• The very best factory terminated connectors will have an undercut better than 50 nm (that’s 0.05 µm).
• The amount of undercut you see will depend on your polishing technique.

Field polishing – not the best wayp g y
• The quality of field polishing heavily depends upon operator’s skill and the polishing process that is followed.
– They must have a good day EVERY day.
Problems often enco ntered• Problems often encountered:
– Over polishing the connector (air gap, poor reflectance)
– Trying to save money or time by not replacing the final polishing paper on a regular basis (final polishing paper is only good for 5 polishes)
– Skipping the final paper because the Loss/Length testing will probably pass with a limit of 0.75 dB per connector
• Achieving a low reflectance connection is harder than achieving a low loss connection• Achieving a low reflectance connection is harder than achieving a low loss connection.
– You can get away with some “sloppy” practices and still pass Loss/Length testing but OTDR testing will reveal the sloppy practices.

The OTDR Port• A dirty OTDR port will cause FAIL results.
• The port needs to be inspected and cleaned before you connect the launch fiber.The port needs to be inspected and cleaned before you connect the launch fiber.
– All fiber connections need to be cleaned before connecting

Inspecting and Cleaning• Isopropyl Alcohol (IPA)
– Must use as a minimum 98% IPA• Hybrid Cleaners
– Evaporate much quicker
– Anything less will leave a thin film behind, causing a change in reflectance.
• But IPA has issues
– Are more aggressive at cleaning
– Have antistatic properties
• Having a cleaner with an antistatic properties reduces the chance of dustBut IPA has issues
– Relatively slow evaporation result in halo effect
• There is a preference amongst professional h b id l
properties reduces the chance of dust being attracted to the end face of the connector.
– According to the EPA, the typicallyd i l i h ffi i bto move to hybrid cleaners. dust particle in the office is between2 and 10 µm.

The measurement
• Good example.
• Spikes are small (good reflectance).Spikes are small (good reflectance).
• Launch + Receive Compensation enabled.
• Configure a custom test limit with a ‐32dB reflection limit for multimode fiber.

Traces from two typical multimode links
Link 01 Link 02
• Poor reflectance widens the deadzone.
– Short multimode links require shorter deadzones.
The height of the event indicates the amount of reflectance.
Short multimode links require shorter deadzones.
• Poor reflectance may cause “negative” loss.– or the measurement may be impossible to make.

Event table from two typical multimode links
Link 01 Link 02
U bl tUnable to measure
Excellent reflectance. Poor reflectance.
• The OTDR event table is generated from automatic analysis.
– The measured reflectance value may be inspected.
– Pass/Fail details may be inspected.

Traces from two typical multimode links– Digging DeeperDeeper
Th f th i fib bl t f th i t• The use of the receive fiber enables measurement of the receive event.
• The tailing caused by the poor reflectance limits the useful information available.
• Note the “ghost” caused by the poor reflectance.

Summary• Know your application and what pass/fail limits to use
• Dirt is fiber enemy #1Dirt is fiber enemy #1
– You need a visual inspection device and proper cleaning materials and procedures
• Tier 1 Optical Loss testing is mandatory:
– Dual fiber , dual wavelength testers will calculate length and speed up testing compared to stand alone power meter/light sources
• Tier 2 OTDR testing will show loss per event and measure reflectance:
– Consider creating a custom limit with reflectance set at ‐35 dB (‐40 dB for SM), so the OTDR will fail highly reflective events
– Use a launch and receive fiber with excellent end face geometry (under cut of 50 l )nm or less).
• If necessary, retrain technicians on field polishing:
– Do it with an OTDR to see what it takes to get good reflectance.
f h 3 d ( 0d f S ) b i l– If they cannot get ‐35 dB (‐40dB for SM) or better consistently,
– consider moving to factory polish connectors.