fiber optic train tracking - phase 1
TRANSCRIPT

DOT/FRA/ORD-19/14 Final Report May 2019
U.S. Department of Transportation
Federal Railroad Administration
Fiber Optic Train Tracking – Phase 1
Office of Research, Development and Technology Washington, DC 20590

NOTICE
This document is disseminated under the sponsorship of the Department of Transportation in the interest of information exchange. The United States Government assumes no liability for its contents or use thereof. Any opinions, findings and conclusions, or recommendations expressed in this material do not necessarily reflect the views or policies of the United States Government, nor does mention of trade names, commercial products, or organizations imply endorsement by the United States Government. The United States Government assumes no liability for the content or use of the material contained in this document.
NOTICE
The United States Government does not endorse products or manufacturers. Trade or manufacturers’ names appear herein solely because they are considered essential to the objective of this report.

i
REPORT DOCUMENTATION PAGE Form Approved OMB No. 0704-0188
Public reporting burden for this collection of information is estimated to average 1 hour per response, including the time for reviewing instructions, searching existing data sources, gathering and maintaining the data needed, and completing and reviewing the collection of information. Send comments regarding this burden estimate or any other aspect of this collection of information, including suggestions for reducing this burden, to Washington Headquarters Services, Directorate for Information Operations and Reports, 1215 Jefferson Davis Highway, Suite 1204, Arlington, VA 22202-4302, and to the Office of Management and Budget, Paperwork Reduction Project (0704-0188), Washington, DC 20503.
1. AGENCY USE ONLY (Leave blank)
2. REPORT DATE May 2019
3. REPORT TYPE AND DATES COVERED Technical Report – 5/26/17–9/30/18
4. TITLE AND SUBTITLE Fiber Optic Train Tracking – Phase 1
5. FUNDING NUMBERS Task Order 0047
Contract Number DTFR5311D00008L
6. AUTHOR(S) Kane Sutton, Matthew Holcomb
7. PERFORMING ORGANIZATION NAME(S) AND ADDRESS(ES) Transportation Technology Center, Inc. 55500 DOT Road Pueblo, CO 81001
8. PERFORMING ORGANIZATION REPORT NUMBER
9. SPONSORING/MONITORING AGENCY NAME(S) AND ADDRESS(ES) U.S. Department of Transportation Federal Railroad Administration Office of Railroad Policy and Development Office of Research, Development and Technology Washington, DC 20590
10. SPONSORING/MONITORING AGENCY REPORT NUMBER
DOT/FRA/ORD-19/14
11. SUPPLEMENTARY NOTES COR: Richard Orcutt 12a. DISTRIBUTION/AVAILABILITY STATEMENT This document is available to the public through the FRA website.
12b. DISTRIBUTION CODE
13. ABSTRACT (Maximum 200 words) The Federal Railroad Administration (FRA) contracted Transportation Technology Center, Inc. (TTCI) to test the train tracking capabilities of fiber optic acoustic detection (FOAD). Testing was performed to simulate train movements typically seen in normal operations on North American Freight railroads. The testing included a single train at variable speeds as well as multiple trains running on the same and parallel tracks. This testing evaluated the FOAD system capabilities to track train speed, length, direction of travel, and to determine track occupancy in parallel track territory.
14. SUBJECT TERMS Fiber Optic Acoustic Detection, FOAD, fiber optic, testing, North American railroad, train tracking
15. NUMBER OF PAGES 80
16. PRICE CODE
17. SECURITY CLASSIFICATION OF REPORT Unclassified
18. SECURITY CLASSIFICATION OF THIS PAGE Unclassified
19. SECURITY CLASSIFICATION OF ABSTRACT Unclassified
20. LIMITATION OF ABSTRACT
NSN 7540-01-280-5500 Standard Form 298 (Rev. 2-89) Prescribed by ANSI Std. 239-18
298-102

ii
METRIC/ENGLISH CONVERSION FACTORS ENGLISH TO METRIC METRIC TO ENGLISH
LENGTH (APPROXIMATE) LENGTH (APPROXIMATE) 1 inch (in) = 2.5 centimeters (cm) 1 millimeter (mm) = 0.04 inch (in) 1 foot (ft) = 30 centimeters (cm) 1 centimeter (cm) = 0.4 inch (in)
1 yard (yd) = 0.9 meter (m) 1 meter (m) = 3.3 feet (ft) 1 mile (mi) = 1.6 kilometers (km) 1 meter (m) = 1.1 yards (yd)
1 kilometer (km) = 0.6 mile (mi)
AREA (APPROXIMATE) AREA (APPROXIMATE) 1 square inch (sq in, in2) = 6.5 square centimeters (cm2) 1 square centimeter (cm2) = 0.16 square inch (sq in, in2)
1 square foot (sq ft, ft2) = 0.09 square meter (m2) 1 square meter (m2) = 1.2 square yards (sq yd, yd2) 1 square yard (sq yd, yd2) = 0.8 square meter (m2) 1 square kilometer (km2) = 0.4 square mile (sq mi, mi2) 1 square mile (sq mi, mi2) = 2.6 square kilometers (km2) 10,000 square meters (m2) = 1 hectare (ha) = 2.5 acres
1 acre = 0.4 hectare (he) = 4,000 square meters (m2)
MASS - WEIGHT (APPROXIMATE) MASS - WEIGHT (APPROXIMATE) 1 ounce (oz) = 28 grams (gm) 1 gram (gm) = 0.036 ounce (oz) 1 pound (lb) = 0.45 kilogram (kg) 1 kilogram (kg) = 2.2 pounds (lb)
1 short ton = 2,000 pounds (lb)
= 0.9 tonne (t) 1 tonne (t)
= =
1,000 kilograms (kg) 1.1 short tons
VOLUME (APPROXIMATE) VOLUME (APPROXIMATE) 1 teaspoon (tsp) = 5 milliliters (ml) 1 milliliter (ml) = 0.03 fluid ounce (fl oz)
1 tablespoon (tbsp) = 15 milliliters (ml) 1 liter (l) = 2.1 pints (pt) 1 fluid ounce (fl oz) = 30 milliliters (ml) 1 liter (l) = 1.06 quarts (qt)
1 cup (c) = 0.24 liter (l) 1 liter (l) = 0.26 gallon (gal) 1 pint (pt) = 0.47 liter (l)
1 quart (qt) = 0.96 liter (l) 1 gallon (gal) = 3.8 liters (l)
1 cubic foot (cu ft, ft3) = 0.03 cubic meter (m3) 1 cubic meter (m3) = 36 cubic feet (cu ft, ft3) 1 cubic yard (cu yd, yd3) = 0.76 cubic meter (m3) 1 cubic meter (m3) = 1.3 cubic yards (cu yd, yd3)
TEMPERATURE (EXACT) TEMPERATURE (EXACT)
[(x-32)(5/9)] °F = y °C [(9/5) y + 32] °C = x °F
QUICK INCH - CENTIMETER LENGTH CONVERSION10 2 3 4 5
InchesCentimeters 0 1 3 4 52 6 1110987 1312
QUICK FAHRENHEIT - CELSIUS TEMPERATURE CONVERSIO -40° -22° -4° 14° 32° 50° 68° 86° 104° 122° 140° 158° 176° 194° 212°
°F
°C -40° -30° -20° -10° 0° 10° 20° 30° 40° 50° 60° 70° 80° 90° 100°
For more exact and or other conversion factors, see NIST Miscellaneous Publication 286, Units of Weights and Measures. Price $2.50 SD Catalog No. C13 10286 Updated 6/17/98

iii
Contents
Executive Summary ........................................................................................................................ 1
1. Introduction ................................................................................................................................ 2 1.1 Background ......................................................................................................................... 2 1.2 Objectives ........................................................................................................................... 3 1.3 Overall Approach ................................................................................................................ 3 1.4 Scope ................................................................................................................................... 4 1.5 Organization of report ......................................................................................................... 4
2. RTT FOAD Test Bed ................................................................................................................. 5 2.1 Test Bed Installation Details ............................................................................................... 5 2.2 Test Bed Test Configuration ............................................................................................... 7
3. FOAD Testing ............................................................................................................................ 8 3.1 Test Implementation Plan ................................................................................................... 8 3.2 RTK GPS ............................................................................................................................ 8 3.3 Train Tracking Testing and Analysis .................................................................................. 9 3.4 Track Identification Testing and Analysis ........................................................................ 11
4. Train Tracking Test Results ..................................................................................................... 13 4.1 Optimizing FOAD for Train Tracking .............................................................................. 13
5. Track Occupancy Identification Test Results .......................................................................... 40 5.1 Parallel Track Two Trains Testing ................................................................................... 41 5.2 Switching Track Single Train ........................................................................................... 51 5.3 Switching Cars Out of Train ............................................................................................. 52 5.4 Wheel Sensor Integration .................................................................................................. 57
6. Conclusion ................................................................................................................................ 58
7. References ................................................................................................................................ 59
Appendix A. FOAD Train Tracking Test Implementation Plan .................................................. 59
Appendix B. FOAD Train Tracking Test Matrix ......................................................................... 66
Appendix C. Box and Whisker Plot Example .............................................................................. 67
Abbreviations and Acronyms ....................................................................................................... 68

iv
Illustrations
Figure 1: FOAD System ................................................................................................................. 3
Figure 2: RTT Fiber Optic Test Bed ............................................................................................... 5
Figure 3: Fiber Optic Cable ............................................................................................................ 6
Figure 4: Fiber Optic Trough .......................................................................................................... 7
Figure 5: Locomotive (HOT) and GPS Car (EOT) Equipped with GPS ........................................ 8
Figure 6: Example of GPS Data Output ......................................................................................... 9
Figure 7: Example of FOAD Data Output .................................................................................... 10
Figure 8: Example of GPS and FOAD Data Combined ............................................................... 11
Figure 9: Constant Speed Train Tracking Averages ..................................................................... 14
Figure 10: Constant Speed HOT Position and HOT Mean Position Error ................................... 14
Figure 11: Constant Speed EOT Position ..................................................................................... 15
Figure 12: Constant Speed HOT Speed Averages ........................................................................ 16
Figure 13: Constant Speed EOT Speed Averages ........................................................................ 17
Figure 14: Constant Speed Train Length Averages ...................................................................... 18
Figure 15: Percentage of Time Tracked for Single Train Acceleration Tests .............................. 19
Figure 16: Average HOT Position for Single Train Acceleration Testing ................................... 20
Figure 17: Average EOT Position for Single Train Acceleration Testing .................................... 21
Figure 18: HOT Speed Error Average Single Train Testing ........................................................ 22
Figure 19: EOT Speed Averages for Single Train Testing ........................................................... 23
Figure 20: Single Train Average Train Length Error ................................................................... 24
Figure 21: Tracking Percentages for Stop and Go Train Testing ................................................. 25
Figure 22: HOT Average Position for Error Stop and Go Testing ............................................... 26
Figure 23: EOT Average Position for Error Stop and Go Testing ............................................... 27
Figure 24: HOT Speed Tracking Averages for Stop and Go Testing ........................................... 28
Figure 25: EOT Speed Tracking Averages for Stop and Go Testing ........................................... 29
Figure 26: Train Length Averages for Stop and Go Testing ........................................................ 30
Figure 27: Head of Train Position Average for all Single Train Tests ......................................... 31
Figure 28: End of Train Position Error Averages for all Single Train Tests ................................ 32
Figure 29: Train Length Error Averages for all Single Train Tests ............................................. 33
Figure 30: Train Tracking Statistics for Single Track Two Train Testing ................................... 34
Figure 31: HOT Position Error Averages for Two Trains on Same Track Testing ...................... 35

v
Figure 32: EOT Position Error Averages for Two Trains on Same Track Testing ...................... 36
Figure 33: HOT Speed Error Averages for Two Trains on Same Track Testing ......................... 37
Figure 34: EOT Speed Error Averages for Two Trains on Same Track Testing ......................... 38
Figure 35: Train Length Error Averages for Two Trains on Same Track Testing ....................... 39
Figure 36: RTT – TTT Track ID Test Bed ................................................................................... 40
Figure 37: Parallel Train Test ....................................................................................................... 42
Figure 38: Train Tracking Statistics for Parallel Trains in Opposite Directions .......................... 42
Figure 39: Two Trains on Paralleling Track Running Opposite Directions (Train 1) .................. 44
Figure 40: Two Trains on Paralleling Track Running Opposite Directions (Train 2) .................. 45
Figure 41: Train Tracking Statistics for Parallel Trains Same Direction ..................................... 46
Figure 42: Parallel Trains Running Same Direction 1,000 feet Separation (Train 3) .................. 47
Figure 43: Parallel Trains Running Same Direction 1,000 feet Separation (Train 2) .................. 48
Figure 44: Train Statistics for Overlapped Trains on Parallel Track Testing ............................... 49
Figure 45: EOT Position for Overlapped Trains on Parallel Track Testing (Train 1) .................. 49
Figure 46: EOT Position for Overlapped Trains on Parallel Track Testing (Train 1 Optimized) 50
Figure 47: HOT Position for Overlapped Trains on Parallel Track Testing (Train 2) ................. 50
Figure 48: HOT Position for Overlapped Trains on Parallel Track Testing (Train 2 Optimized) 51
Figure 49: Train Length for Two Car Siding Drop Off Test ........................................................ 57

1
Executive Summary
From May 2017 to September 2018, the Federal Railroad Administration (FRA) sponsored a test conducted by Transportation Technology Center, Inc. (TTCI) to evaluate the capability of fiber optic acoustic detection (FOAD) to track trains and determine track identification of track occupied in multiple track territories. Results showed that FOAD is capable of tracking a train, but spatial resolution can be influenced by the speed and weight of the train. Identifying the track being occupied by the train using FOAD is problematic at this time, without secondary data input such as wheel sensors. Due to the known limitations of FOAD for track identification, the participating FOAD vendor installed wheel sensors at the crossover points between the Railroad Test Track (RTT) and the Transit Test Track (TTT) at the Transportation Technology Center (TTC) in Pueblo, CO, to provide supplemental data to the FOAD data. The intention of the wheel sensor data is to provide the FOAD system with definitive data about the track being occupied by the train. Once the identification of the track occupied has been determined, the FOAD system can track movement of the train. At the time of testing, the two systems were not yet integrated so only standalone FOAD data was provided to TTCI by the participating vendor. To accomplish this test, TTCI solicited participation from FOAD vendors to install FOAD systems on the RTT fiber optic test bed at TTC. The RTT test bed was configured as a 7-mile section of fiber optic cable paralleling the RTT and a section of the TTT for the test. Testing included typical railroad operational scenarios. These included:
• Single train constant speed 5–40 mph.
• Single train acceleration 0–40 mph.
• Single train stop and go
• Multiple trains on single track
• Multiple trains on double track
• Crossing from one track to another
• Switching cars out of train TTCI worked with FOAD vendor engineers to analyze and verify data results from testing. All data was collected by the FOAD vendor and then shared with TTCI. Part of this project included the vendor working to improve upon current train tracking algorithms. Once the vendor had made improvements to the tracking algorithm the data was reprocessed with the “optimized” algorithm. Data results included in this report are presented with “as tested” and “optimized” data.

2
1. Introduction
The Federal Railroad Administration (FRA) sponsored a test conducted by Transportation Technology Center, Inc. (TTCI) to evaluate the capability of fiber optic acoustic detection (FOAD) to track trains and determine track identification of track occupied in multiple track territories.
1.1 Background The North American railroad industry expressed an interest in determining the capability of FOAD systems to perform train tracking and identify the track occupied by the train. In a prior effort, TTCI and FRA conducted a series of tests to determine baseline capabilities of FOAD to perform these functions. FOAD essentially turns a fiber optic cable into a virtual array of distributed sensors that detect strain induced on any section of the fiber by proximate acoustic or seismic events. This is achieved by pulsing light from a laser in the FOAD interrogator through a fiber optic cable and detecting the light reflected back to the interrogator via Rayleigh scattering from the regions of the fiber that are being strained [1]. In railroad applications, the fiber is typically buried in the ground or installed in a cable trough near the track. As acoustic waves are emitted on the surface, they are transmitted through the ballast into the ground or trough, causing strain on the fiber that is detected by the system. Many events that the railroads are concerned with monitoring along the track produce acoustic signals that may be detected by a FOAD system. These events include, but are not limited to, train movement, broken rails, wheel impacts, dragging equipment, etc. The basic components of a FOAD system are the interrogator and the fiber optic cable. Figure 1 details the components of a FOAD system.

3
Figure 1: FOAD System
1.2 Objectives The objective of the project was to solicit participation from FOAD vendors to test the FOAD integrator capability to determine head of train (HOT) and end of train (EOT) in position, speed, direction of travel, as well as track occupancy in single and multiple track environments.
1.3 Overall Approach To accomplish the objectives of the project, TTCI solicited potential vendors to participate in a data collection and analysis effort to obtain relevant data for determining these capabilities. Of the solicited FOAD vendors, only one was able to participate in this test program. Testing was performed at TTC on the Railroad Test Track (RTT) and Transit Test Track (TTT) where a purpose-built FOAD test bed was installed to conduct FOAD research. TTCI developed a test implementation plan (TIP) detailing the type and number of test runs to be performed for each of the test scenarios. The TIP is included in Appendix A. The TIP then was reviewed by an advisory group (AG) consisting of members of the railroad community, and the on-site FRA Contracting Officer Representative.

4
Based on the test scenarios identified in the TIP, the RTT FOAD test bed was selected for testing. The RTT FOAD test bed is detailed in Section 2. Prior to testing, the RTT test bed was configured by connecting multiple fiber sections together to create a single 7-mile stretch of test bed that included both buried and above ground trough fiber optic installation methods. After the test bed was configured, a fiber optic verification test was performed to qualify the integrity of the fiber optic cable. Once the test bed was configured and verified, the participating FOAD vendor interrogator systems were installed along RTT fiber optic test bed. Testing consisted of two main tests, train tracking and track identification. Details and results of testing can be found in Section 4 and Section 5 of this report. After testing was completed, the results were analyzed by the FOAD vendor to determine the systems capabilities at the time of test. The FOAD vendor was then tasked with using the test data to improve on system detection algorithms and reprocess the data with the improved algorithms. The improved algorithms are reported as “optimized” in data results presented in this report. The data provided by the FOAD vendor was then analyzed and verified by TTCI’s engineers prior to reporting the results.
1.4 Scope The following describes the scope of work:
• Collaborated with North American railroads and FOAD suppliers to identify FOAD train tracking test scenarios and develop a TIP.
• Prepared and tested the RTT FOAD test bed for use for train tracking and track identification testing.
• Performed testing identified in the TIP at TTC on the RTT and TTT test tracks of which are part of the RTT FOAD test bed.
• TTCI’s engineers worked with the FOAD vendor to analyze the data collected during testing and compare it with data collected from onboard HOT and EOT, Real-Time Kinematic (RTK), and Global Positioning System (GPS) units.
• Documented the results of testing and corresponding FOAD train tracking data results
1.5 Organization of report This report is organized into six sections as follows:
Section 1 contains an overview of the project background, objectives, and general approach. Section 2 describes the FOAD test bed used for testing. Section 3 describes the testing conducted during the project. Section 4 details the results of the train tracking testing. Section 5 details the results of the track occupancy identification testing. Section 6 provides conclusions from the project.

5
2. RTT FOAD Test Bed
The RTT is a 13.5-mile loop of Class 6 track capable of handling speeds up to 165 mph. The RTT is equipped with a variable voltage up to 25 Kilovolt AC overhead catenary to allow for electrified locomotive testing. The RTT has two road crossings, and an approximately 1-mile long siding and it parallels the TTT for approximately 5 miles. In 2013, because of these track features, work began to install fiber optic cable near this track to be used for FOAD testing. During the time of the FOAD train tracking test, approximately half of the 13.5-mile track was fiber installed. The section of track highlighted in green in Figure 2 is the portion of the test bed utilized for this test. This test bed was 7.5 miles long. In 2018, FRA funded a project to finish the installation of fiber around the remaining portion of track. The portion of track highlighted red is a new 6-mile section of the test bed that was installed in 2018. With the completion of the fiber installation, the RTT FOAD test bed is now a total of 13.5 miles long, covering the entirety of the RTT. The test bed enhancements in 2018 improve the FOAD testing capabilities by allowing testing to be conducted on the entire RTT.
Figure 2: RTT Fiber Optic Test Bed
2.1 Test Bed Installation Details
The RTT FOAD test bed is constructed using a Superior Essex Series W7001KU101 Fiber to the Premises (FTTP) (Figure 3) 12 core single mode fiber optic cable. The cable is installed using direct burial and in above-ground trough, as commonly used along rail lines in North America. In the direct burial sections, the fiber is installed at a depth of 3 feet and average of 15 feet from

6
center line of track. The buried fiber was installed using backfill and compaction of the same type commonly used in installation of communications fiber.
Figure 3: Fiber Optic Cable A portion of the fiber in the RTT test bed is installed in an above-ground trough. The trough section is 1-mile long and installed between track markers R4.5 and R71 along the eastern portion of the RTT. The trough is manufactured from recycled plastic and designed for wayside application. The fiber optic cable was installed in the trough to mimic typical trough type installations of fiber currently used along some portions of railway in North America. Figure 4 shows the trough as installed along the RTT.

7
Figure 4: Fiber Optic Trough 2.2 Test Bed Test Configuration
For this test, the RTT FOAD test bed was configured to include both a single fiber 12,221-meter installation and a double fiber 24,442-meter installation. To accomplish this, the fiber needed to be spliced in three locations prior to testing. The splice locations were as follows:
• Milepost R5 at the 201 Bungalow
• Milepost R4 at the Post 85 Bungalow
• Milepost R70.5 at the Post 100 Bungalow
• Milepost R46 at the signal mast

8
3. FOAD Testing
3.1 Test Implementation Plan Prior to performing any tests, a detailed TIP was developed for review by the AG that was assembled from members of North American railroads as well as an FRA representative. A copy of the TIP is included as Appendix A in this document.
3.2 RTK GPS TTC has an RTK GPS reference station at the test facility. The reference station, when used in conjunction with survey grade GPS receivers, provides location information at centimeter accuracy. To determine the accuracy of the FOAD system to report HOT, EOT and train velocity, the test trains were instrumented with Trimble SPS852 Rovers which receive signals from the RTK GPS system. Figure 5 shows pictures of the GPS equipment installed on the locomotive and last car of the test train.
Figure 5: Locomotive (HOT) and GPS Car (EOT) Equipped with GPS
Two Trimble units were installed on each train; one at HOT and one at EOT. The Trimble units were set to sample GPS coordinates at 10 Hz. The data from the train GPS units were used as train location and velocity truth data for verification of the FOAD data results. The FOAD units were instrumented with GPS receivers as well, as a means of synchronizing the system clocks of the FOAD integrators to GPS Coordinated Universal Time (UTC). The GPS data collected

9
during testing was later used to compare to the FOAD data to determine the accuracy of train location and velocity as reported by the FOAD system.
3.3 Train Tracking Testing and Analysis Train tracking testing included train passes with a 10–11 car consist at speeds ranging between 0 and 40 mph, as described in the TIP. Testing included evaluating the systems’ capability to track the EOT and HOT when the train comes to a full stop. Train position data was collected by the FOAD vendor and compared against RTK GPS data to determine accuracy in the following:
• Train location
• Train speed
• HOT location
• EOT location
• Direction of travel An example of HOT data output by the GPS as it traversed the RTT FOAD test bed is included in Figure 6. An example of HOT data output by the FOAD system as it traversed the RTT test is included in Figure 7. An overlay of combined GPS and FOAD data shows a comparison between the two data outputs in Figure 8.
Figure 6: Example of GPS Data Output

10
Figure 7: Example of FOAD Data Output

11
Figure 8: Example of GPS and FOAD Data Combined When testing was completed, the FOAD vendor performed post processing to determine if there were areas of improvement that could be made to the current detection algorithms. The original test data from the FOAD system was compared with data that was “optimized” by the participating vendor. Optimized data is data that was reprocessed with enhancements to the original FOAD tracking algorithms. All data was then analyzed by TTCI engineers and the results included in Section 4.
3.4 Track Identification Testing and Analysis The objective of this testing was to evaluate the capability of a FOAD system to identify the track being occupied by a train and to determine the potential capability of a FOAD system to track a train from one track to another and identify which track is being occupied by the train

12
throughout this transition. This testing was performed using the RTT and TTT at the Post 85 crossover. Results of the track identification testing are included in Section 5.

13
4. Train Tracking Test Results
Multiple tests were performed to test the capabilities of FOAD to track train movement by simulating many types of rail traffic situations that are common in railroad operations. The data generated by this testing was shared by the participating FOAD vendor and will be used to continue to refine the FOAD system algorithms for working in a railroad environment. Much of the data is represented as box and whisker plots though out this report. An example of how to read box and whisker plots has been included in Appendix C.
4.1 Optimizing FOAD for Train Tracking Train tracking with empty and slow speed trains presented problems with the FOAD tracking algorithm. In these conditions, the FOAD system was not able to consistently track the train through the entire test zone. While tracking in these conditions the FOAD system periodically dropped the train tracking ID and then resumed tracking with a new ID later in the test zone. The train tracking ID is a distinct number assigned by the FOAD system to each identified train. To address this issue, the FOAD vendor reprocessed data sets with an algorithm they optimized for train tracking. Throughout this document there will be examples of data results as originally output by the FOAD system, as well as data results after being reprocessed with the optimized train tracking algorithm. The optimized train tracking algorithm was able to correct the problem of the train tracking stopping and starting throughout the test zone, but not without a loss of some spatial and speed accuracy. Spatial accuracy is defined as the ability of the FOAD system to precisely track train position and HOT and EOT throughout the test zone. Speed accuracy is how closely the speed output of the FOAD system matches that given by the GPS.
4.1.1 Single Train Constant Speed
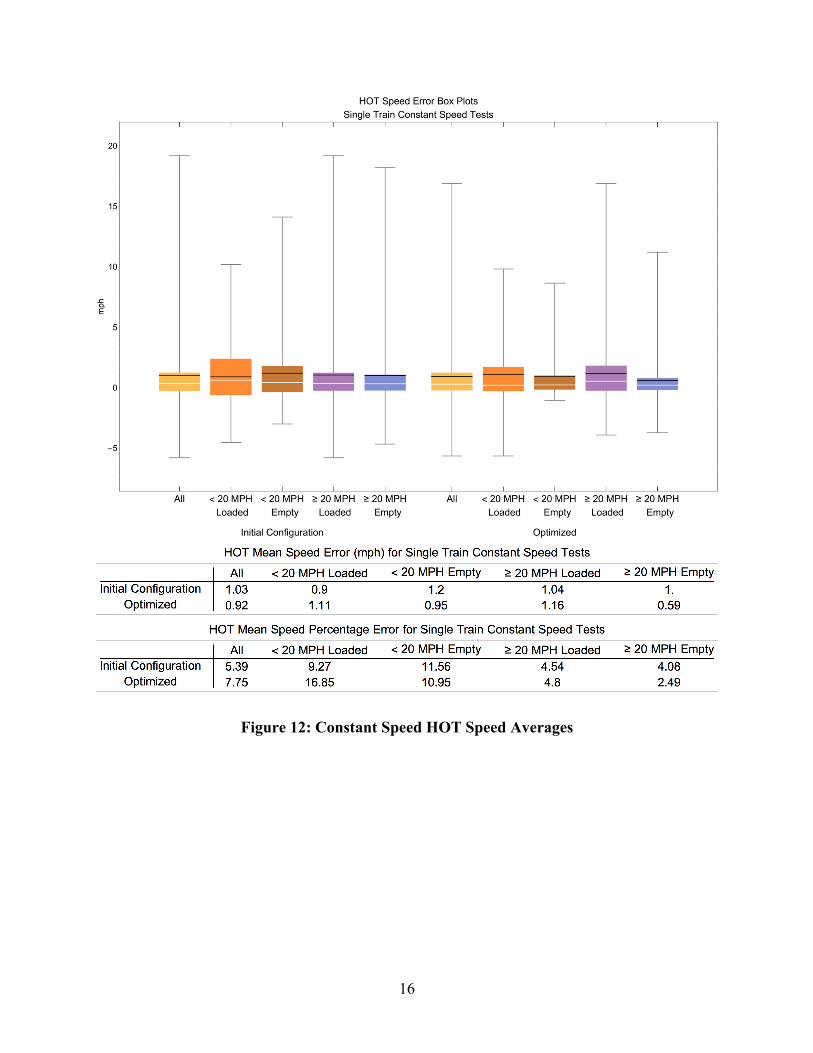
The single train constant speed testing was performed to determine the FOAD system capabilities to track a single train on a single track while maintaining a constant velocity. Testing in the section included multiple test runs at speeds between 5 and 40 mph. Each of the train passes was held at a predetermined constant velocity while testing. Each of the tests was repeated with both a loaded and an empty train. Detailed information on these tests can be found in the test matrix included in Appendix B. Train tracking at speeds greater than 20 mph tested with loaded cars yielded the best results while the lighter (empty) train at speeds under 20 mph proved problematic at times. This was due to the FOAD software dropping the train tracking and then redetecting the train and resuming tracking. When train tracking is dropped, the FOAD system tested reassigns a new train ID each time the tracking resumes. This resulted in test train passes being assigned multiple train IDs. Data plots of low-speed and high-speed testing, as well as an average of tracking statistics, for both the initial and optimized algorithms are in Figure 9 through Figure 14. The box and whisker plots show the data results of the single train constant speed tests categorized by speed and if the train was loaded or empty. The table below each box and whisker plot shows the mean values of all single train tests by speed. The data outlines the HOT and EOT speed and position error as well as train length error.

14
Figure 9: Constant Speed Train Tracking Averages
Figure 10: Constant Speed HOT Position and HOT Mean Position Error

15
Figure 11: Constant Speed EOT Position
16
Figure 12: Constant Speed HOT Speed Averages

17
Figure 13: Constant Speed EOT Speed Averages

18
Figure 14: Constant Speed Train Length Averages
4.1.2 Single Train Acceleration Testing Acceleration testing was conducted to evaluate the capabilities of the FOAD system to perform train tracking when the speed of the train is variable throughout the test zone. To accomplish this, a test with 10 train cars and a locomotive on a single track was performed at variable speeds between 0 and 40 mph. Each test was repeated with a fully loaded train and an empty train each configured with a single locomotive for power. However, due to a data calibration error, the heavy consist data is not usable. All data and results presented in this section are for the light (empty) consist only. Detailed information on these tests can be found in the test matrix included in Appendix B. As observed in the constant speed testing, low-speed train passes with light

19
(empty) cars was problematic, while testing at high speeds with heavy (loaded) train performance was better. Data plots of low-speed and high-speed testing, as well as an average of tracking statistics for empty consists at variable speeds are shown in Figure 15 through Figure 20. The box and whisker plots show the data results of the single train acceleration tests categorized by speed and if the train was loaded or empty. The table below each box and whisker plot shows the mean values of all single train acceleration tests by speed. The data outlines the HOT and EOT speed and position error as well as train length error.
Figure 15: Percentage of Time Tracked for Single Train Acceleration Tests

20
Figure 16: Average HOT Position for Single Train Acceleration Testing

21
Figure 17: Average EOT Position for Single Train Acceleration Testing

22
Figure 18: HOT Speed Error Average Single Train Testing

23
Figure 19: EOT Speed Averages for Single Train Testing

24
Figure 20: Single Train Average Train Length Error
4.1.3 Single Train Stop and Go Stop-and-go testing was performed to determine how well FOAD can track a train that comes to a complete stop and then resumes movement within the test zone. The same train configurations

25
used for this test were used in previously described train tracking tests. Testing speeds in the stop-and-go testing were between 0 and 40 mph. Detailed information on these tests can be found in the test matrix included in Appendix B. Stop-and-go testing proved problematic due to current train tracking algorithm logic. When the train stopped and then resumed movement, the FOAD software frequently reassigned the train a new train ID. Without a distinct train identifier, such as train length, it may be difficult to track a train under these conditions. Improvements to the train tracking algorithm of the FOAD system may be able to overcome this. See Figure 21 through Figure 26 for the data plots for this portion of the testing. The box and whisker plots show the data results of the single train stop and go tests categorized by speed and if the train was loaded or empty. The table below each box and whisker plot shows the mean values of all single train stop tests by speed. The data outlines the HOT and EOT speed and position error as well as train length error.
Figure 21: Tracking Percentages for Stop and Go Train Testing

26
Figure 22: HOT Average Position for Error Stop and Go Testing

27
Figure 23: EOT Average Position for Error Stop and Go Testing

28
Figure 24: HOT Speed Tracking Averages for Stop and Go Testing

29
Figure 25: EOT Speed Tracking Averages for Stop and Go Testing

30
Figure 26: Train Length Averages for Stop and Go Testing Average position and train length error for all single train tests are show in Figure 27 through Figure 29 to illustrate the strong influence speed has on the FOAD system’s capabilities.

31
Figure 27: Head of Train Position Average for all Single Train Tests

32
Figure 28: End of Train Position Error Averages for all Single Train Tests

33
Figure 29: Train Length Error Averages for all Single Train Tests
4.1.4 Single Track, Two Trains In this section of testing, two trains were run simultaneously on the same track. All testing was conducted on the RTT during this test. This test was performed to evaluate the capabilities of the FOAD system to track trains when there are multiple trains on the same track within the coverage of a single FOAD system. To accomplish this, a test with two trains, on a single track, was performed with test passes at speeds between 0 and 40 mph. Train 1 start-and-stop points were between R72 and R64 on the RTT. Train 2 start-and-stop points were between R14 and R72. Train 1 had 10 loaded cars, a GPS car and a single locomotive. Train 2 had 10 empty cars and a single locomotive. For this test, a single GPS unit was installed on each of the locomotives to acquire HOT speed and position comparison data. Detailed information on these tests can be found in the test matrix included in Appendix B. Results for this section of testing showed that, while some degradation in tracking accuracy does occur, the system was able to track the train with similar results as observed in other tracking tests. As previously stated, the system tracking capabilities are improved with increased speeds and train weight, while light, slow-moving trains can be problematic. Data results for this section of testing can be found in Figure 30 through Figure 35. The box and whisker plots in these figures show the data results of the single track two train tests categorized by speed and if the train was loaded or empty. The table below the box and whisker plot shows the mean values of all single track two train tests by speed. The data outlines the HOT and EOT speed and position

34
error as well as train length error. All of the data in these figures is shown as original as tested data as well as the data after the being optimized for tracking.
Figure 30: Train Tracking Statistics for Single Track Two Train Testing

35
Figure 31: HOT Position Error Averages for Two Trains on Same Track Testing

36
Figure 32: EOT Position Error Averages for Two Trains on Same Track Testing

37
Figure 33: HOT Speed Error Averages for Two Trains on Same Track Testing

38
Figure 34: EOT Speed Error Averages for Two Trains on Same Track Testing

39
Figure 35: Train Length Error Averages for Two Trains on Same Track Testing

40
5. Track Occupancy Identification Test Results
The purpose of the testing described in this section was to determine the FOAD system capabilities to identify which track the train is occupying in multiple track territories. All testing in this section was performed on parallel, adjacent tracks on the RTT and TTT, as shown in Figure 36. FOAD data supplied to TTCI from the vendor for verification does show track occupancy; however, it does not include any information about the track being occupied. The participating vendor acknowledged the limitations of FOAD to be able to determine track identification without using supplemental data from another source. For this reason, at the time of this test, the vendor was working to develop a hybrid FOAD and wheel sensor system capable of determining occupied track identification. The wheel sensors were installed at the crossover between the RTT and TTT as a means of supplemental data to the FOAD data. However, because the system was not fully integrated at the time of testing, the vendor was only able to provide data from the FOAD system and the wheel sensors separately. Only the FOAD data was able to be verified by TTCI engineers. Due to the FOAD system limitation to determine track occupancy as a standalone system, all testing described in this section used a single calibration file of the RTT when collecting data, regardless of which track either of the trains occupied. The result of this is that the FOAD system reports trains on both the RTT and TTT with GPS coordinates for the RTT. Therefore, the system reported trains on both the RTT and the TTT as occupying the same track. This section describes each of the test scenarios performed during track occupancy identification testing.
Figure 36: RTT – TTT Track ID Test Bed

41
5.1 Parallel Track Two Trains Testing The parallel track two trains testing consisted of running two trains on adjacent parallel tracks. Testing was performed with one loaded and one empty train at speeds between 10 and 40 mph. Train 1 was a 10-car loaded train on the RTT with the GPS car at EOT. Train 2 was a 10-car empty train on the TTT. The GPS data systems were installed only on the locomotives for this testing. There was no EOT GPS systems installed on either test train. Testing was conducted on the RTT and TTT in parallel sections between R14 and Post 100. Testing was performed with paralleling trains (as shown in Figure 37), meets and passes, and paralleling trains with a 1,000-foot space between consists. The FOAD data did not report track identification for either of the trains during this testing, as previously described. However, the data does display occupancy of trains within near proximity to the fiber optic cable. Although the standalone FOAD system was not able to report track identification, the test results did demonstrate the capability of the FOAD system to track the trains while running on parallel tracks. During testing on parallel tracks, the system only tracked train No. 3 (loaded) for tests 50 and 52 with the original FOAD test configuration. For test 51, the trains met and passed traveling in opposite directions on a parallel section of the RTT and TTT. During this test, the FOAD was able to track train No. 3 and train No. 2 only well before and well after the two trains crossed giving train No. 3 two different train IDs due to the large gap in time between being tracked by the FOAD. Detailed information on these tests can be found in the test matrix included in Appendix B. Figure 38 through Figure 48 shows data results showing train tracking by the FOAD system during this testing.

42
Figure 37: Parallel Train Test The data in Figure 38 shows the percentage of time the two trains were tracked during the parallel train test as well as the number of trains that the FOAD system reported tracking.
Figure 38: Train Tracking Statistics for Parallel Trains in Opposite Directions Figure 39 show a tracking plot for train 1 as compared to the onboard GPS during the parallel track opposite direction testing. The data is represented with the original tracking algorithm as well as the optimized tracking algorithm. Figure 40 shows the tracking plot for train 2 compared

43
to the onboard GPS during the parallel track opposite direction testing. The data is represented with the original tracking algorithm as well as the optimized tracking algorithm.

44
Figure 39: Two Trains on Paralleling Track Running Opposite Directions (Train 1)

45
Figure 40: Two Trains on Paralleling Track Running Opposite Directions (Train 2)

46
The data in Figure 41 highlights the percentage of time the train was tracked during the parallel track two train testing as well as the number of trains that tracked. The data is represented as both the original data as well as the data after being optimized for tracking.
Figure 41: Train Tracking Statistics for Parallel Trains Same Direction Figure 42 shows a tracking plot for the HOT of train 3 as compared to the onboard GPS during the parallel track same direction with 1,000 feet separation testing. The data is represented with the original tracking algorithm as well as the optimized tracking algorithm. Figure 43 shows the tracking plot for the EOT for train 2 compared to the onboard GPS during the parallel track same direction with 1,000 feet separation testing. Train 2 is reversing in this test which made the locomotive EOT. The data is represented with the original tracking algorithm as well as the optimized tracking algorithm.

47
Figure 42: Parallel Trains Running Same Direction 1,000 feet Separation (Train 3)

48
Figure 43: Parallel Trains Running Same Direction 1,000 feet Separation (Train 2)

49
Figure 44: Train Statistics for Overlapped Trains on Parallel Track Testing Figure 45 shows a tracking plot for the EOT of train 1 as compared to the onboard GPS during the parallel track trains overlapped testing. Figure 46 shows the same test run with the optimized tracking algorithm. Train 1 is reversing in this test which made the locomotive EOT. Figure 47 presents the tracking plot for the HOT for train 2 compared to the onboard GPS during the parallel track trains overlapped testing. Figure 48 shows the same test run with the optimized tracking algorithm.
Figure 45: EOT Position for Overlapped Trains on Parallel Track Testing (Train 1)

50
Figure 46: EOT Position for Overlapped Trains on Parallel Track Testing (Train 1 Optimized)
Figure 47: HOT Position for Overlapped Trains on Parallel Track Testing (Train 2)

51
Figure 48: HOT Position for Overlapped Trains on Parallel Track Testing (Train 2 Optimized)
5.2 Switching Track Single Train The purpose of this test was to determine the capability of FOAD to track a train while switching from one track to an adjacent track. To accomplish this, a test zone was established on the RTT and TTT where a crossover switch is located between the two tracks. Testing included test passes through the crossover at speeds between 5 and 35 mph. Two train configurations were used during this testing: one 10-car loaded train and one 10-car empty train. The fiber optic cable in the section of the test bed used for this testing is located in a surface trough. Previous FOAD testing determined that the FOAD system receives a degraded signal with this type of fiber installation. However, train tracking still is possible with proper tuning of the FOAD system. The train movement through this test zone ran in both directions. The train traveled for 1,000 feet in the test zone before transitioning to the adjacent track and 1,000 feet on the newly occupied track. This was done to ensure that the FOAD system could acquire ample data while the train moved on each of the tracks. Because the FOAD system was incapable of determining which track was occupied by the train at the time of testing, wheel sensors were installed at the location of this testing to supply an external data input to the FOAD system to determine track occupancy while tracking the trains’ movement. Test results from this portion of testing show that more research to improve FOAD algorithms is required. While the system could track the train with some level of accuracy, it was not able to determine which track the train was occupying throughout this testing. The FOAD system

52
reported all train movements as occupying the RTT. With the integration of the wheel sensor data, the hybrid FOAD/wheel sensor system may be able to identify which track is being occupied by the train. At the time of this test however, the integration of the two systems was not complete.
5.3 Switching Cars Out of Train The switching cars test was done to evaluate the capability of FOAD to locate and track train movement and length while switching operations occur. To achieve this, TTCI utilized the RTT and TTT 602 crossover switch points. Train approaches from the RTT transitioned to the TTT via the crossover switches and then removed one or two cars from the train. The removed cars were tied down on the TTT. The train then switched back to the RTT and resumed travel on the RTT. Since the FOAD system could not determine track occupancy at the time of testing, no verification was done of track occupancy identification for this portion of the test. Wheel sensors were used to collect data from this test, in addition to the FOAD system. The wheel sensors could accurately count wheels into and out of track sections. This data will be incorporated with FOAD data by the vendor to more precisely determine track occupancy during switching operations. Results of testing in this section showed a direct correlation with increased speeds improving the spatial accuracy of tracking train length. The approach of the train from the RTT to the TTT was low speed. After switching out cars on the TTT and resuming travel on the RTT, the train speed increased. Actual train length during testing was 197.3 meters for train 1 and 192.1 meters for train 2. Figure 39 compares train length and speed in original data and optimized data outputs for testing during two car drop off testing. The data plots in Figure 49 show mean train length as reported by the FOAD system as compared to the actual measured train length.

53

54

55

56

57
Figure 49: Train Length for Two Car Siding Drop Off Test
5.4 Wheel Sensor Integration Track occupancy identification using FOAD presents some particular challenges. Since the system is reliant on acoustic and seismic energy propagating through the ground to a fiber optic cable in near proximity to the track, it is difficult to determine which track is the epicenter of the energy. To overcome this challenge, the participating FOAD vendor is working to integrate external data inputs into their FOAD interrogator to determine which tracks were being occupied. The external data input come from wheel sensors installed at the crossover points between the RTT and the TTT tracks. The data input from the wheel sensors supplied a count of wheels in and out of each of the tracks. This information could then be used by the FOAD integrator to determine which track was occupied, as well as if any railcars were switched in or out of the train being tracked. The incorporation of the wheel sensors also provides useful information for a train that enters a section of track and then stops, but continues to occupy the section of track. In this situation, the wheel sensors are used to count each of the wheels of the train when entering a section of track. If the wheels are not counted leaving the section of track, it can be assumed that the section of track is still occupied, even when acoustic signal was lost due to a shutdown of the locomotives. Note that the testing in this project did not attempt to evaluate the capability of the wheel sensor system to reliably and accurately count the axles of a train, which would need to be done before applying in this way.

58
6. Conclusion
The results from this project demonstrated that the FOAD system is able to track train movements under a variety of operational scenarios. However, the level of accuracy in some conditions still require improvement to satisfy the practical needs for railroad applications. The FOAD system tracks trains best at sustained speeds greater than 20 mph. Slower and variable speeds both have negative effects on the ability of the FOAD system to track train movement. During track occupancy identification testing, it was determined, from data presented by the participating FOAD vendor, that the standalone FOAD system did not properly identify track occupancy in any of tests conducted. However, during this testing, the FOAD vendor collected data from wheel sensors placed at the switch points of each of the tracks. The vendor is working to incorporate the wheel sensor data into the FOAD system to be able to determine the track that is occupied by a train. Once the wheel sensor has supplied track occupancy data to the FOAD system it may then be able to continue to track the train’s movement. FOAD train tracking, while functional, may still require additional improvements to the algorithms to identify and track trains with the level of accuracy required in the railroad environment. Future work may include additional track testing to verify improvements made to system algorithms or evaluation of a fully integrated FOAD/wheel sensor system. Continued work will be required with the FOAD vendors to communicate the needs and requirements of the railroads for train tracking and track identification.

59
7. References
[1] Federal Railroad Administration, "Fiber Optic Availability and Opportunity Analysis for North American Railroads," Technical Report No. DOT/FRA/ORD-18/23, U.S Department of Transportation, Washington, DC, 2018.

Appendix A. FOAD Train Tracking Test Implementation Plan
Field Test Implementation Plan
September 2017
Presented By: Transportation Technology Center, Inc.
A Subsidiary of the Association of American Railroads 55500 DOT Road
P.O. Box 11130
Pueblo, CO 81001

2
1.0 Introduction
The railroad industry has expressed an interest in determining the reliability of fiber optic acoustic detection (FOAD) systems to perform train tracking and identify which track the train is occupying in the multiple track locations. To accomplish this, TTCI will solicit FOAD vendors to participate in a data collection and analysis effort to obtain relevant data for determining these capabilities. Data will be analyzed by individual FOAD vendors post-test. Each vendor will prepare a summary report of the analysis work performed including examples of system capabilities. TTCI will evaluate each of the FOAD vendors’ results by cross checking FOAD reference points to GPS data and prepare a summary report of project results.
1.1 Responsibilities
The project manager is responsible for ensuring that the test is completed on time, within budget, and will ensure all deliverables meet or exceed FRA requirements. The test engineers are responsible for ensuring that the test is executed according to the test plan, that all data is collected properly, and that the test is completed safely.
1.2 Documentation
The results of this test will be documented in detailed test logs while testing. A summary report of findings will be written following the completion of testing.
2.0 Preparation
Development of the test requirements, test cases, and test plan will be completed as part of the preparation phase for the testing and data collection effort. Test cases have been developed to describe the field testing necessary to validate the requirements identified. The test cases have been organized into two groups with on-track field tests to produce data required for this capabilities study.
3.0 Implementation
3.1 Constraints
The RTT and TTT tracks that will be utilized during testing will only have a 6.5 mile portion of the track equipped with fiber optic cable. This will pose some limitations on speed as well as test scenarios to be performed. Because of limited funding, testing will need to be performed within a 10 day test period.
3.2 Test Setup
All FOAD equipment will be housed in the R14 bungalow for this test. The R14 bungalow is equipped with sufficient power, cooling, and internet connect as agreed on with vendors

3
to perform this test. Prior to testing, a 7 day setup time will allow FOAD vendors to setup and calibrate systems to the test bed. A test schedule will be developed detailing activities to be performed during test setup. Part of this setup will include running one day of train passes to optimize FOAD system settings. An optical time domain reflectometer (OTDR) will be used to test each of the fibers used during this test to establish baseline health of the fiber optic cable prior to testing. Testing will require the use of two different test train configurations. The specific car number and weights will be established before on-track testing begins. All setup specifics and data will be provided to participating FOAD vendors as well as included in the final report of this project.
3.3 Operation Sequence The field testing will include on-track testing on the RTT and TTT tracks. A draft copy of the test matrix can be found in Appendix A. The test matrix outlines each of the primary test areas and indicates which track will be used for testing. Testing is scheduled to begin on September 11, 2017, with a weeklong setup and checkout for FOAD systems. Official Testing is scheduled to begin on September 18 and run through September 27, 2017. Details of the test train car and weights, file names etc. have not yet been determined and will be included in the test matrix before testing begins. A final version of the test matrix will be provided prior to the start of the on track testing.
4.0 Test Case Description
Train Tracking The objective of this testing is to investigate the capabilities of FOAD for dynamic train presence detection and location determination. Train tracking should be able to function with a single unique train and not be reliant on prior train data for comparisons etc. This testing will take place on the North and East side of the RTT. A map of the test section has been included in Figure A1. Testing will include train passes with two trains in either direction running at speeds of 0–40mph, as specified in the test cases listed in the test matrix in Appendix A. TTCI will work with FOAD vendors to collect test data. Multiple FOAD systems of different sensitivity and capability will be used during testing. FOAD vendors will be provided a copy of the test plan and determine which systems will be installed for testing. FOAD vendors are strongly encouraged to collect as much data as possible with multiple FOAD units of differing types during this test program. FOAD systems will be time synced to GPS time. RTK GPS systems will be installed in the lead locomotive and last car in each of the test consists to capture actual position and velocity of these vehicles. All FOAD units will be time Synced to a GPS time source. Data will be analyzed by FOAD vendors and compared against GPS data to determine resolution and capability of FOAD to determine head and end of train and velocity. FOAD vendors will then report findings to TTCI. Reports will be verified by cross checking FOAD data to GPS output by TTCI engineers and reported to FRA. TTCI engineers will not do any algorithm and/or software development beyond comparing results of the FOAD measurements with the baseline (GPS) measurements.

4
Track Identification The objective of testing is to investigate the capabilities of FOAD to identify and track train movements in multi-track zones, whereby, in a single train pass, the system can detect which track the train is occupying. Track identification should be able to function with a single unique train and not be reliant on prior train data for comparisons etc. This test will take place on the East side of the RTT and TTT tracks where they run in parallel. The 602 cross over located near post 85 on the RTT will be used as a transition point between the 2 tracks. A map of this location is located in Figure A1. Data will be collected by FOAD vendors during this testing. Tests will include train passes from trains of 6 to 10 cars in length running on a single track or transitioning from one track to the other. Testing will also be done with trains running in opposing directions on separate track as well as trains passing or running parallel on separate track. Data will be collected by multiple FOAD systems from each of the FOAD vendors. The data will be collected on separate fibers in the same cable. Vendors will then report to TTCI on the data collected from each of their systems and their capabilities to identify the track each train is occupying and to track train movement between multiple tracks without having any prior knowledge of the tests. Reports will be verified by TTCI engineers and reported to FRA. TTCI engineers will not do any algorithm and/or software development beyond comparing results of the FOAD measurements with the baseline measurements.
Figure A1. RTT FOAD Test bed

5
4.1 Recording Techniques
The raw FOAD data will be recorded on one or more hard drives from multiple FOAD systems. Each test run will be recorded as a separate file. The data will be made available to TTCI engineers for duplication while verifying vendor reported results. All hardware required for duplication will be provided by TTCI. All baseline GPS data will be recorded by GPS receivers located at the head and tail of the train. It is critical that the FOAD and GPS receivers are time synced with each other to ensure an accurate comparison.
Data Analysis
The data collected during field testing will be analyzed by each of the corresponding FOAD vendors to determine the capability of FOAD to be used as means of detection for each test scenario. Once the data is processed, each vendor will provide GPS data reference points as output by the FOAD system, of train location (head and tail) in the latitude longitude coordinate system, velocity and track identification reported at a rate of at least 2 per second. Data results will be verified by TTCI engineers by comparing the GPS data (location and velocity) with the same data provided by the FOAD vendors over time. FOAD vendor data analysis will be completed and sent to TTCI for validation within eight weeks after testing has completed.
4.2 Reports
FOAD vendors will be tasked with reporting test results of each of their FOAD systems to TTCI. TTCI will then verify results in the test reports. TTCI will write a summary report detailing the results of the test. This summary report will be submitted to the FRA at the conclusion of the project.
5.0 Safety
TTCI has a very successful safety record. Strict operating and safety rules will be followed during the work described in this proposal.
A pre-test meeting will be held before any physical work is started. Safety and quality issues will be addressed at this meeting. FRA and the FOAD vendors will be invited to participate in this meeting.
6.0 Work Schedule
The field testing will occur September 18–27, of 2017. Testing will include an estimated 40 hours of train tracking and 20 hours of track identification testing. Prior to starting official testing, there will be a seven-day setup and calibration of systems.
7.0 Quality Assurance
TTCI is committed to providing products and/or services that meet and/or exceed the customers’ specified contractual and project requirements. TTCI recognizes that in order to provide and maintain a consistently high quality in the work it undertakes, an effective Quality Management System is necessary so as to ensure that proper communication, work control and accountable records are generated for all work undertaken.

6
It is the policy, therefore, of TTCI to control and conduct its business of consultancy and test services in the railway transportation arena by means of a formalized system of modern quality management that conforms to the requirements of ISO 9001–2000. Through the QMS, TTCI is able to ensure that our products and services meet or exceed our customers’ expectations. In order to ensure our entire organization supports the quality process, TTCI sponsors an employee led Quality Resource Team (QRT). The mission of the QRT is “To promote customer satisfaction by providing effective training, education, and communication tools for Team TTCI.” The QRT works directly with TTCI’s marketing team to identify customer satisfaction issues and help resolve them. The QRT also provides period refresher training to TTCI employees in science of Continuous Quality Improvement, Customer Satisfaction, and the implementation of problem solving tools.

Appendix B. FOAD Train Tracking Test Matrix
Test Location:

67
Consist Configurations:

68

69
Train Tracking Tests:

70

71
Track ID tests:

Appendix C. Box and Whisker Plot Example

68
Abbreviations and Acronyms
Abbreviations and Acronyms
Definition
AG Advisory Group AC Alternating Current UTC Coordinated Universal Time EOT End of Train FRA Federal Rail Administration FOAD Fiber Optic Acoustic Detection FTTP Fiber to the Premises GPS Global Positioning System HOT Head of Train OTDR Optical Time Domain Reflectometer QRT Quality Resource Team RTT Railroad Test Track RTK Real-Time Kinematic TIP Test Implementation Plan TTT Transit Test Track TTC Transportation Technology Center TTCI Transportation Technology Center, Inc. UTC Coordinated Universal Time