%fí ÆøÁ§Åâ!? Ïò÷ç -...
TRANSCRIPT
UNITEDSTATESSECURITIESANDEXCHANGECOMMISSION
Washington,D.C.20549
FORM8-K/A
CURRENTREPORTPursuanttoSection13or15(d)ofTheSecuritiesExchangeActof1934
February15,2018Date of Report (Date of earliest event reported)
SHAKESHACKINC.(Exact name of registrant as specified in its charter)
Delaware 001-36823 47-1941186(State or other jurisdiction ofincorporation or organization)
(CommissionFile Number)
(IRS EmployerIdentification No.)
24UnionSquareEast,5thFloorNewYork,NewYork 10003
(Address of principal executive offices) (Zip Code)
(646)747-7200(Registrant's telephone number, including area code)
Notapplicable(Former name or former address, if changed since last report)
Check the appropriate box below if the Form 8-K filing is intended to simultaneously satisfy the filing obligation of the registrant under any of the following provisions:
o Written communications pursuant to Rule 425 under the Securities Act (17 CFR 230.425)
o Soliciting material pursuant to Rule 14a-12 under the Exchange Act (17 CFR 240.14a-12)
o Pre-commencement communications pursuant to Rule 14d-2(b) under the Exchange Act (17 CFR 240.14d-2(b))
o Pre-commencement communications pursuant to Rule 13e-4(c) under the Exchange Act (17 CFR 240.13e-4(c))
Indicate by check mark whether the registrant is an emerging growth company as defined in Rule 405 of the Securities Act of 1933 (17 CFR §230.405) or Rule 12b-2 of the SecuritiesExchange Act of 1934 (17 CFR §240.12b-2).
Emerging growth company o
If an emerging growth company, indicate by check mark if the registrant has elected not to use the extended transition period for complying with any new or revised financial accountingstandards provided pursuant to Section 13(a) of the Exchange Act. o

EXPLANATORYNOTE
On February 15, 2018, Shake Shack Inc. (the “Company”) issued a press release announcing its unaudited financial results for the fourth quarter and fiscal year ended December27, 2017 (the “Original Press Release”). Concurrently with the issuance of its press release, on February 15, 2018, the Company published supplemental financial information(the “Original Supplemental Financial Information”) to be used in its earnings presentation for the fiscal fourth quarter ended December 27, 2017. The Original Press Releaseand Original Supplemental Financial Information were furnished by the Company as exhibits to its current report on Form 8-K dated February 15, 2018 (the “Original 8-K”).
In the Original Press Release and Original Supplemental Financial Information, the Company inadvertently reflected a $1.9 million adjustment to its deferred tax assets as anequity transaction instead of a current period income tax benefit, resulting in an overstatement of income tax expense by $1.9 million for the fourth quarter and fiscal year endedDecember 27, 2017. After adjusting for this, income tax expense for the fourth quarter and fiscal year ended December 27, 2017 was $143.9 million (compared to $145.8 millionas previously reported) and $151.4 million (compared to $153.4 million as previously reported), respectively. The adjustment affected the calculations of net income (loss), netincome (loss) attributable to Shake Shack Inc. and earnings (loss) per share of Class A common stock as reported in the Original Press Release and Original SupplementalFinancial Information. No other reported amounts were affected, including any non-GAAP measures, such as Shack-level operating profit, adjusted EBITDA, adjusted proforma net income and adjusted pro forma earnings per fully exchanged and diluted share. The Company has revised the Original Press Release and Original SupplementalFinancial Information solely for the purpose of correcting the previously disclosed income tax expense amount, and the related effect on net income (loss), net income (loss)attributable to Shake Shack Inc. and earnings (loss) per share of Class A common stock (the “Corrected Press Release” and the “Corrected Supplemental Financial Information”)and is furnishing the Corrected Press Release and Corrected Supplemental Financial Information pursuant to this current report on Form 8-K/A.
Item2.02ResultsofOperationsandFinancialCondition.
A copy of the Corrected Press Release, reflecting the changes described in the Explanatory Note above, is attached as Exhibit 99.1 and incorporated by reference herein. TheCompany is publishing the Corrected Press Release on its website located at www.shakeshack.com.
Neither the information reported herein nor the Corrected Press Release shall be deemed “filed” for purposes of Section 18 of the Securities Exchange Act of 1934, as amended,or incorporated by reference in any filing under the Securities Act of 1933, as amended, except as shall be expressly set forth by specific reference in such a filing.
Item7.01RegulationFDDisclosure.
A copy of the Corrected Supplemental Financial Information, reflecting the changes described in the Explanatory Note above, is attached as Exhibit 99.2 and incorporated byreference herein. The Company is publishing the Corrected Supplemental Financial Information on its website located at www.shakeshack.com.
Neither the information reported herein nor the Corrected Supplemental Financial Information shall be deemed “filed” for purposes of Section 18 of the Securities Exchange Actof 1934, as amended, or incorporated by reference in any filing under the Securities Act of 1933, as amended, except as shall be expressly set forth by specific reference in sucha filing.
Item9.01FinancialStatementsandExhibits.
(d) Exhibits.
ExhibitNumber ExhibitDescription99.1
Shake Shack Inc. press release dated February 15, 2018 announcing its financial results for the fourth quarter and fiscal year ended December 27, 2017. (ascorrected)
99.2 Supplemental Financial Information dated February 15, 2018 provided by Shake Shack Inc. (as corrected)
SIGNATURES
Pursuant to the requirements of the Securities Exchange Act of 1934, the registrant has duly caused this report to be signed on its behalf by the undersigned hereunto dulyauthorized.
ShakeShackInc. (Registrant)
By: /s/ Tara Comonte Tara ComonteDate: February 26, 2018 Chief Financial Officer

EXHIBITINDEX
ExhibitNumber ExhibitDescription99.1
Shake Shack Inc. press release dated February 15, 2018 announcing its financial results for the fourth quarter and fiscal year ended December 27, 2017 (ascorrected)
99.2 Supplemental Financial Information dated February 15, 2018 provided by Shake Shack Inc. (as corrected)
Exhibit99.1
CORRECTEDCOPY
ShakeShackAnnouncesFourthQuarterandFiscalYearEnded2017FinancialResults-FourthQuarterTotalRevenueGrew31.2%-
-FourthQuarterSame-ShackSalesIncreased0.8%--Fiscal2017TotalRevenueGrew33.6%-
-System-wideYear-Over-YearUnitGrowthof39.5%-
NEW YORK, NY (Business Wire) — February 15, 2018 — ShakeShackInc.(“Shake Shack” or the “Company”) (NYSE: SHAK), today reported financial results for thefourth quarter and the fiscal year ended December 27, 2017 , periods that included 13 and 52 weeks, respectively.
FinancialHighlightsfortheFourthQuarter2017:
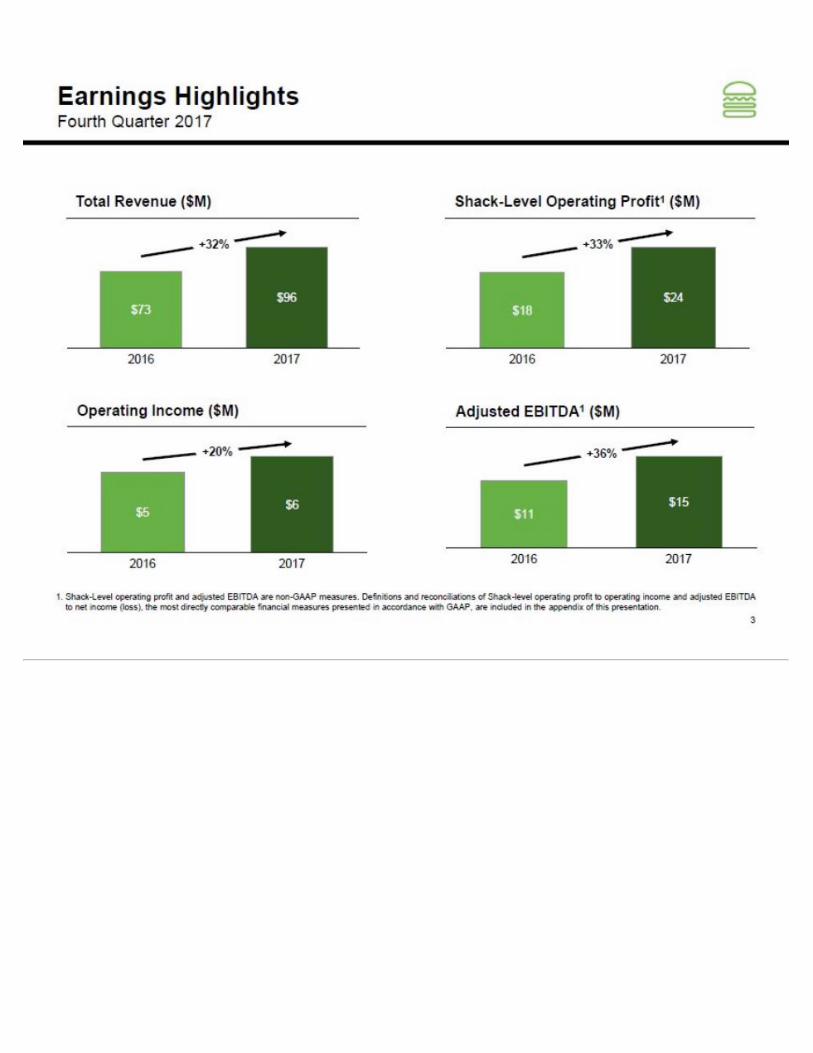
▪ Total revenue increase d 31.2% to $96.1 million .▪ Shack sales increase d 31.3% to $93.1 million .▪ Same-Shack sales increased 0.8% .▪ Operating income increase d 17.0% to $5.8 million , or 6.1% of total revenue.▪ Shack-level operating profit*, a non-GAAP measure, increase d 30.3% to $23.5 million , or 25.2% of Shack sales.▪ Net loss was $11.0 million and net loss attributable to Shake Shack Inc. was $12.5 million , or $(0.47) per diluted share, which included $12.7 million of net expense
relating to the enactment of the Tax Cuts and Jobs Act of 2017 (the "TCJA").▪ Adjusted EBITDA*, a non-GAAP measure, increase d 30.7% to $14.9 million .▪ Adjusted pro forma net income *, a non-GAAP measure, increase d 20.0% to $3.9 million , or $0.10 per fully exchanged and diluted share.▪ 16 system-wide Shack openings, including 11 domestic company-operated Shacks and 5 licensed Shacks.
FinancialHighlightsfortheFiscalYear2017:
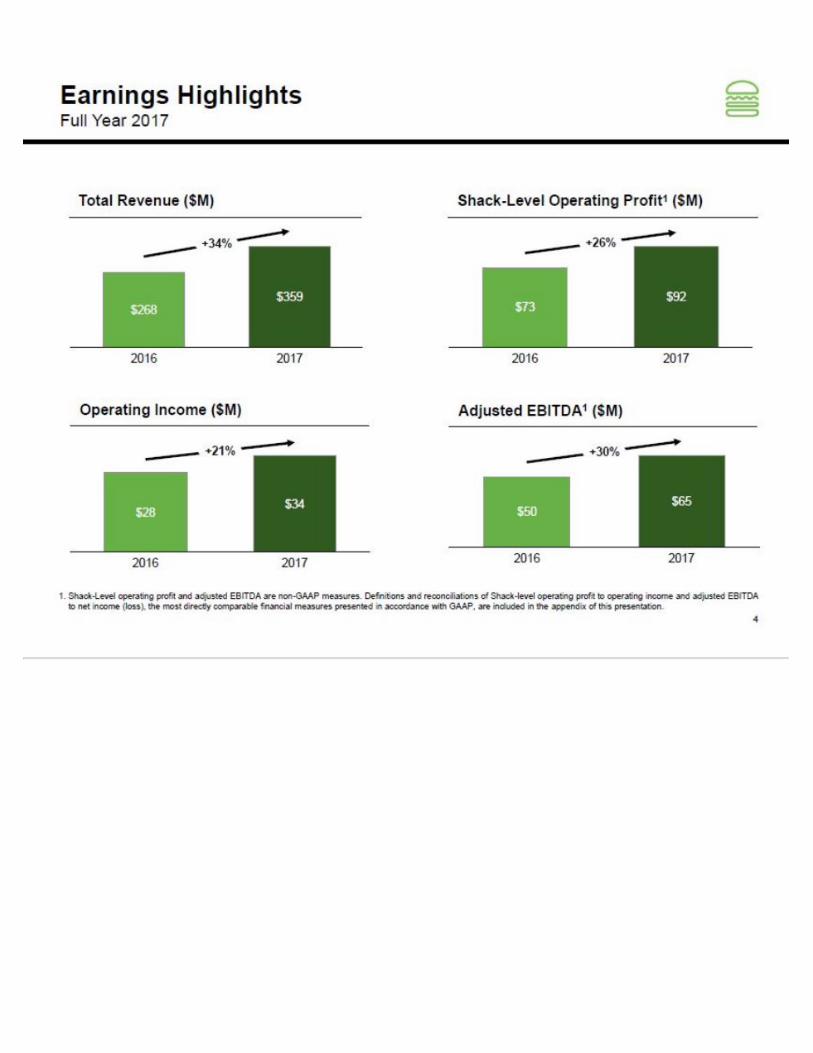
▪ Total revenue increase d 33.6% to $358.8 million .▪ Shack sales increase d 33.6% to $346.4 million .▪ Same-Shack sales decreased 1.2% .▪ Operating income increase d 21.6% to $33.8 million , or 9.4% of total revenue.▪ Shack-level operating profit*, a non-GAAP measure, increase d 25.9% to $92.3 million , or 26.6% of Shack sales.▪ Net income was $8.9 million and net loss attributable to Shake Shack Inc. was $0.3 million , or $(0.01) per diluted share, which included $12.7 million of net expense
relating to the enactment of the TCJA.▪ Adjusted EBITDA*, a non-GAAP measure, increase d 28.7% to $64.7 million .▪ Adjusted pro forma net income *, a non-GAAP measure, increase d 25.4% to $21.0 million , or $0.57 per fully exchanged and diluted share.▪ 45 net system-wide Shack openings, including 26 domestic company-operated Shacks and 19 net licensed Shacks, representing a net 39.5% increase in system-wide
Shack count.
* Shack-level operating profit, adjusted EBITDA and adjusted pro forma net income are non-GAAP measures. Reconciliations of Shack-level operating profit to operatingincome, adjusted EBITDA to net income (loss), and adjusted pro forma net income to net income (loss) attributable to Shake Shack Inc., the most directly comparable financialmeasures presented in accordance with GAAP, are set forth in the schedules accompanying this release. See “Non-GAAP Financial Measures.”
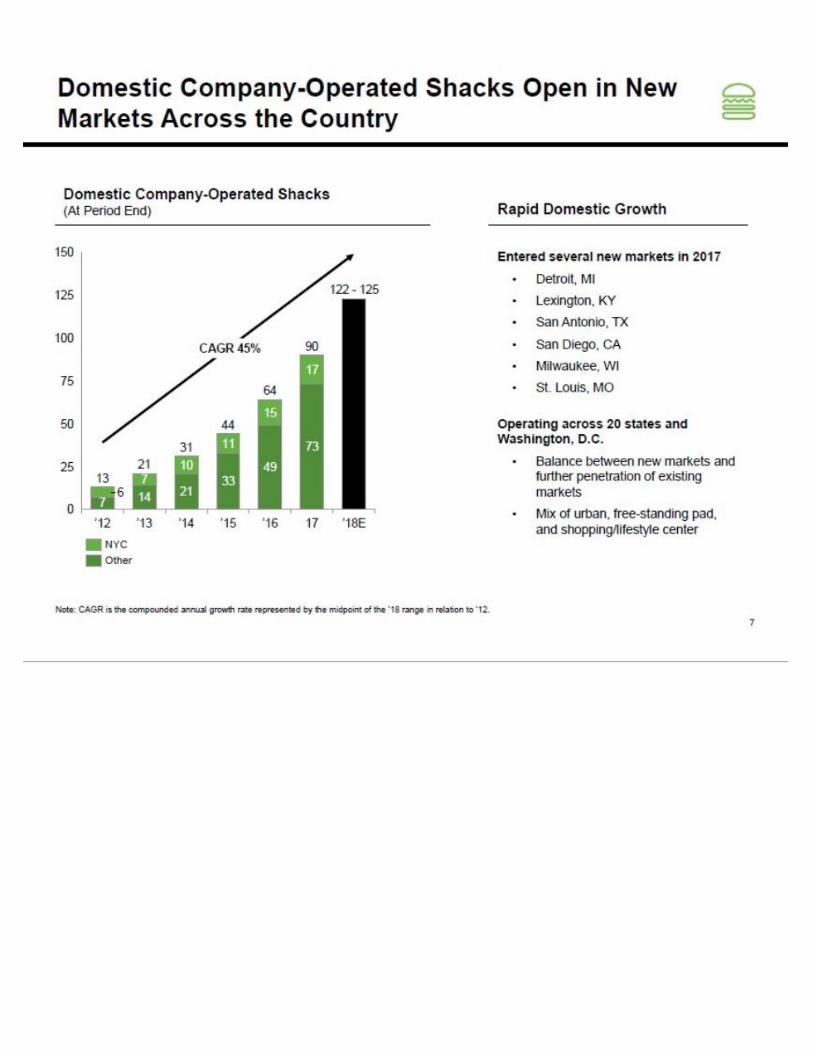
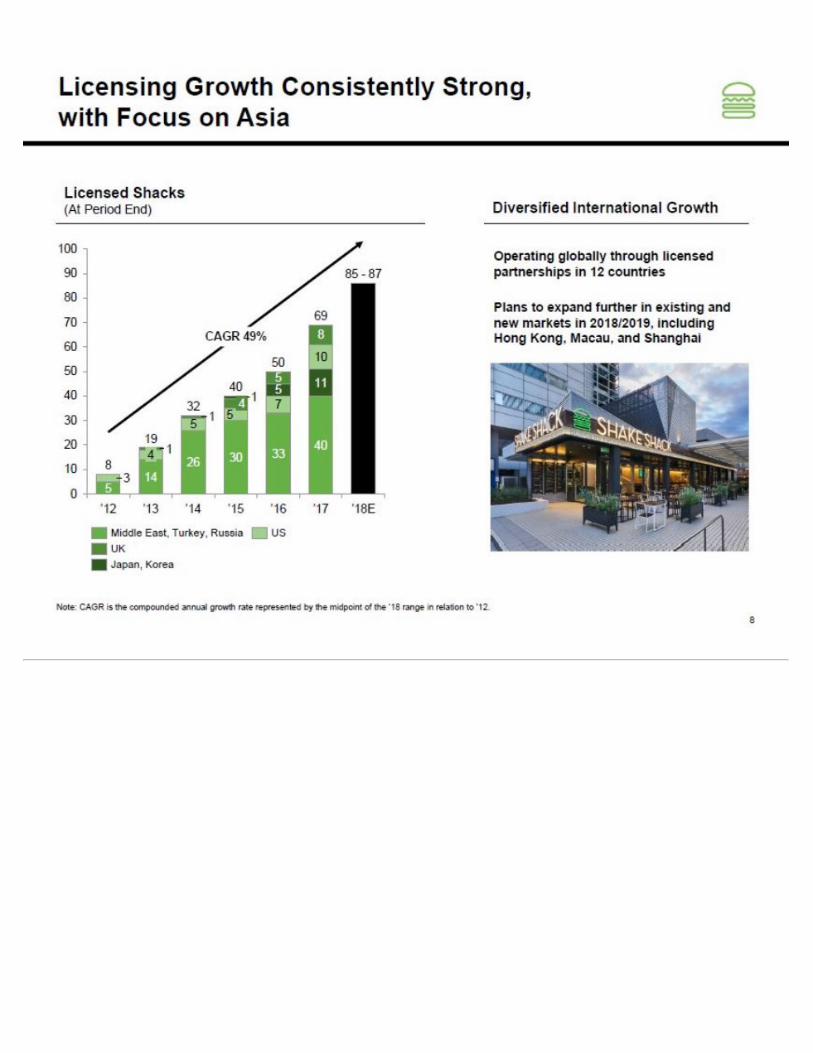
Randy Garutti, Chief Executive Officer of Shake Shack, stated, “I'm incredibly proud of our team's achievements throughout 2017. We delivered another year of robust globalgrowth, opening 26 new company-operated domestic Shacks and 19 net licensed Shacks, representing a nearly 40% increase on our base. 2017 marked a milestone year ofdigital innovation for Shake Shack, with the launch of the Shack app, self-serve kiosks at select locations and several integrated delivery pilots designed to further enhance theguest digital experience. We will continue to build on this momentum into 2018 and beyond.” Garutti concluded, “Looking ahead, 2018 is shaping up to be another exciting year of growth with 32 to 35 new domestic company-operated Shacks, our biggest year ofopenings to date. We expect 16 to 18 net new licensed Shacks for the year, with a significant portion of our international growth
Exhibit99.1
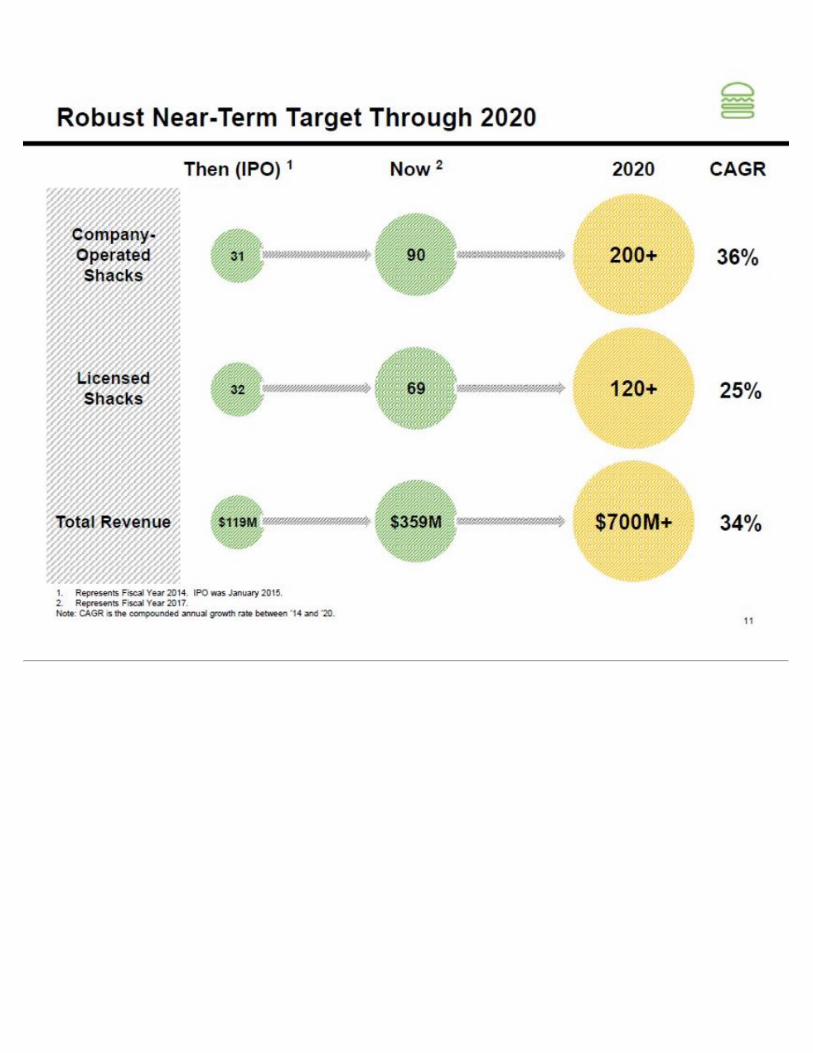
targeted in Asia including our first Shack in Hong Kong. We’re also focused on further strengthening our infrastructure to deliver against the significant long-term opportunitywe have in our sights. By the end of 2020, we plan to have more than doubled our 2017 system-wide Shack count and increase our revenue to over $700 million."
DevelopmentHighlights
During the quarter, the Company opened 11 domestic company-operated Shacks, which included Shack openings in three new markets, San Diego, St. Louis and Milwaukee, aswell as the debut of its first kiosk-only, cashless environment at Astor Place in New York City. Additionally, the Company opened five international licensed Shacks during thequarter, with two openings in Japan, which included its first Shack outside of Tokyo, as well as openings in the Middle East and the United Kingdom.
Location Type OpeningDate
Dallas, TX — Preston Royal Domestic Company-Operated September 29Yokohama, Japan — Minatomirai International Licensed September 29
New York, NY — Astor Place Domestic Company-Operated October 10
Washington D.C. — The Wharf Domestic Company-Operated October 12
San Diego, CA — UTC Domestic Company-Operated October 20
Troy, MI — Troy Domestic Company-Operated October 25
London, United Kingdom — Cambridge Circus International Licensed October 26
Manama, Bahrain — The Avenues Mall International Licensed October 29
Tokyo, Japan — Roppongi International Licensed November 2
El Segundo, CA — El Segundo Domestic Company-Operated November 5
Milwaukee, WI — Third Ward Domestic Company-Operated December 6
St. Louis, MO — Central West End Domestic Company-Operated December 11
Columbia, MD — Mall in Columbia Domestic Company-Operated December 20
Las Vegas, NV — Las Vegas N. Premium Outlets Domestic Company-Operated December 20
San Diego, CA — Mission Valley Domestic Company-Operated December 21
Jeddah, KSA — Red Sea Mall International Licensed December 21
Subsequent to the end of the quarter, the Company opened three international licensed Shacks, including the Company's eighth Shack in Saudi Arabia at the Gallery Mall, itsseventh Shack in Japan at Tokyo Dome and its sixth Shack in South Korea at the ICN airport.
FourthQuarter2017Review
Total revenue, which includes Shack sales and licensing revenue, increase d 31.2% to $96.1 million in the fourth quarter of 2017 , from $73.3 million for the fourth quarter of2016 . Shack sales for the fourth quarter of 2017 were $93.1 million , an increase of 31.3% from $70.9 million in the same quarter last year due primarily to the opening of 26new domestic company-operated Shacks. Licensing revenue for the fourth quarter was $3.0 million , an increase of 27.9% from $2.4 million in the same quarter last year,primarily due to the opening of 19 net new licensed Shacks and the initial strength of newer Shacks in South Korea.
Same-Shack sales increased 0.8% for the fourth quarter of 2017 versus 1.5% growth in the fourth quarter last year. The comparable Shack base includes those restaurants openfor 24 full fiscal months or longer. For the fourth quarter of 2017 , the comparable Shack base included 43 Shacks versus 29 Shacks for the fourth quarter of 2016 .
Average weekly sales for domestic company-operated Shacks was $85,000 for the fourth quarter of 2017 compared to $90,000 for the same quarter last year, a 5.6% decrease ,primarily due to the addition of newer Shacks at lower average unit volumes.
Operating income increase d 17.0% to $5.8 million for the fourth quarter of 2017 from $5.0 million in the same quarter last year. Operating income margins decrease d 70 basis points to 6.1% . Shack-level operating profit, a non-GAAP measure, increase d 30.3% to $23.5 million for the fourth quarter of 2017 from $18.0 million in the samequarter last year. As a percentage of Shack sales, Shack-level operating profit margins decrease d 20 basis points to 25.2% primarily due to (i) increased labor and relatedexpenses resulting from the company-wide increase to the starting hourly wage that was implemented at the beginning of the fiscal year and regulatory factors, such as the FairWorkweek legislation in New York; (ii) other operating expense deleverage driven mainly by certain fixed expenses and an increase in facility costs as our Shacks mature; and(iii) the introduction of a broader range of unit volume Shacks into the system. A reconciliation of operating income to Shack-level operating profit, the most directlycomparable GAAP financial measure, is set forth in the schedules accompanying this release. See “Non-GAAP Financial Measures.”
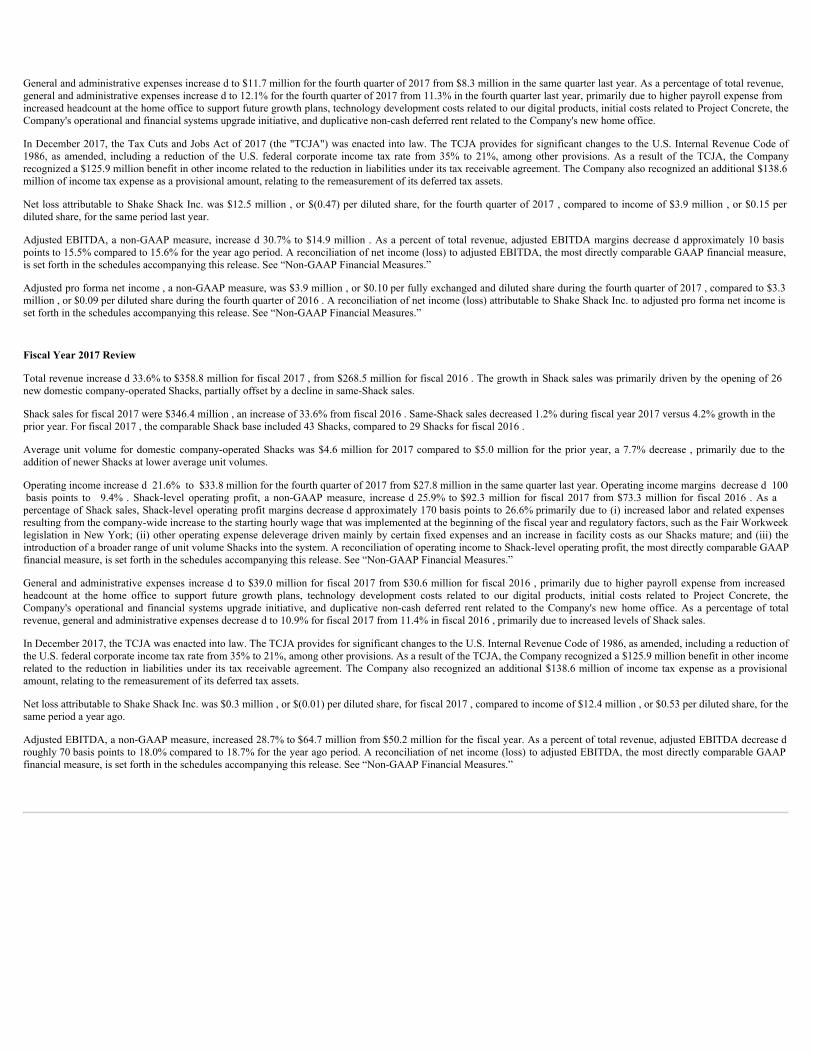
General and administrative expenses increase d to $11.7 million for the fourth quarter of 2017 from $8.3 million in the same quarter last year. As a percentage of total revenue,general and administrative expenses increase d to 12.1% for the fourth quarter of 2017 from 11.3% in the fourth quarter last year, primarily due to higher payroll expense fromincreased headcount at the home office to support future growth plans, technology development costs related to our digital products, initial costs related to Project Concrete, theCompany's operational and financial systems upgrade initiative, and duplicative non-cash deferred rent related to the Company's new home office.
In December 2017, the Tax Cuts and Jobs Act of 2017 (the "TCJA") was enacted into law. The TCJA provides for significant changes to the U.S. Internal Revenue Code of1986, as amended, including a reduction of the U.S. federal corporate income tax rate from 35% to 21%, among other provisions. As a result of the TCJA, the Companyrecognized a $125.9 million benefit in other income related to the reduction in liabilities under its tax receivable agreement. The Company also recognized an additional $138.6million of income tax expense as a provisional amount, relating to the remeasurement of its deferred tax assets.
Net loss attributable to Shake Shack Inc. was $12.5 million , or $(0.47) per diluted share, for the fourth quarter of 2017 , compared to income of $3.9 million , or $0.15 perdiluted share, for the same period last year.
Adjusted EBITDA, a non-GAAP measure, increase d 30.7% to $14.9 million . As a percent of total revenue, adjusted EBITDA margins decrease d approximately 10 basispoints to 15.5% compared to 15.6% for the year ago period. A reconciliation of net income (loss) to adjusted EBITDA, the most directly comparable GAAP financial measure,is set forth in the schedules accompanying this release. See “Non-GAAP Financial Measures.”
Adjusted pro forma net income , a non-GAAP measure, was $3.9 million , or $0.10 per fully exchanged and diluted share during the fourth quarter of 2017 , compared to $3.3million , or $0.09 per diluted share during the fourth quarter of 2016 . A reconciliation of net income (loss) attributable to Shake Shack Inc. to adjusted pro forma net income isset forth in the schedules accompanying this release. See “Non-GAAP Financial Measures.”
FiscalYear2017Review
Total revenue increase d 33.6% to $358.8 million for fiscal 2017 , from $268.5 million for fiscal 2016 . The growth in Shack sales was primarily driven by the opening of 26new domestic company-operated Shacks, partially offset by a decline in same-Shack sales.
Shack sales for fiscal 2017 were $346.4 million , an increase of 33.6% from fiscal 2016 . Same-Shack sales decreased 1.2% during fiscal year 2017 versus 4.2% growth in theprior year. For fiscal 2017 , the comparable Shack base included 43 Shacks, compared to 29 Shacks for fiscal 2016 .
Average unit volume for domestic company-operated Shacks was $4.6 million for 2017 compared to $5.0 million for the prior year, a 7.7% decrease , primarily due to theaddition of newer Shacks at lower average unit volumes.
Operating income increase d 21.6% to $33.8 million for the fourth quarter of 2017 from $27.8 million in the same quarter last year. Operating income margins decrease d 100 basis points to 9.4% . Shack-level operating profit, a non-GAAP measure, increase d 25.9% to $92.3 million for fiscal 2017 from $73.3 million for fiscal 2016 . As apercentage of Shack sales, Shack-level operating profit margins decrease d approximately 170 basis points to 26.6% primarily due to (i) increased labor and related expensesresulting from the company-wide increase to the starting hourly wage that was implemented at the beginning of the fiscal year and regulatory factors, such as the Fair Workweeklegislation in New York; (ii) other operating expense deleverage driven mainly by certain fixed expenses and an increase in facility costs as our Shacks mature; and (iii) theintroduction of a broader range of unit volume Shacks into the system. A reconciliation of operating income to Shack-level operating profit, the most directly comparable GAAPfinancial measure, is set forth in the schedules accompanying this release. See “Non-GAAP Financial Measures.”
General and administrative expenses increase d to $39.0 million for fiscal 2017 from $30.6 million for fiscal 2016 , primarily due to higher payroll expense from increasedheadcount at the home office to support future growth plans, technology development costs related to our digital products, initial costs related to Project Concrete, theCompany's operational and financial systems upgrade initiative, and duplicative non-cash deferred rent related to the Company's new home office. As a percentage of totalrevenue, general and administrative expenses decrease d to 10.9% for fiscal 2017 from 11.4% in fiscal 2016 , primarily due to increased levels of Shack sales.
In December 2017, the TCJA was enacted into law. The TCJA provides for significant changes to the U.S. Internal Revenue Code of 1986, as amended, including a reduction ofthe U.S. federal corporate income tax rate from 35% to 21%, among other provisions. As a result of the TCJA, the Company recognized a $125.9 million benefit in other incomerelated to the reduction in liabilities under its tax receivable agreement. The Company also recognized an additional $138.6 million of income tax expense as a provisionalamount, relating to the remeasurement of its deferred tax assets.
Net loss attributable to Shake Shack Inc. was $0.3 million , or $(0.01) per diluted share, for fiscal 2017 , compared to income of $12.4 million , or $0.53 per diluted share, for thesame period a year ago.
Adjusted EBITDA, a non-GAAP measure, increased 28.7% to $64.7 million from $50.2 million for the fiscal year. As a percent of total revenue, adjusted EBITDA decrease droughly 70 basis points to 18.0% compared to 18.7% for the year ago period. A reconciliation of net income (loss) to adjusted EBITDA, the most directly comparable GAAPfinancial measure, is set forth in the schedules accompanying this release. See “Non-GAAP Financial Measures.”
Adjusted pro forma net income , a non-GAAP measure, was $21.0 million , or $0.57 per fully exchanged and diluted share for fiscal 2017 , compared to $16.8 million , or $0.46per fully exchanged and diluted share for fiscal 2016 . A reconciliation of net income (loss) attributable to Shake Shack Inc. to adjusted pro forma net income is set forth in theschedules accompanying this release. See “Non-GAAP Financial Measures.”
2018Outlook
For the fiscal year ending December 26, 2018, the Company is providing the following financial outlook:
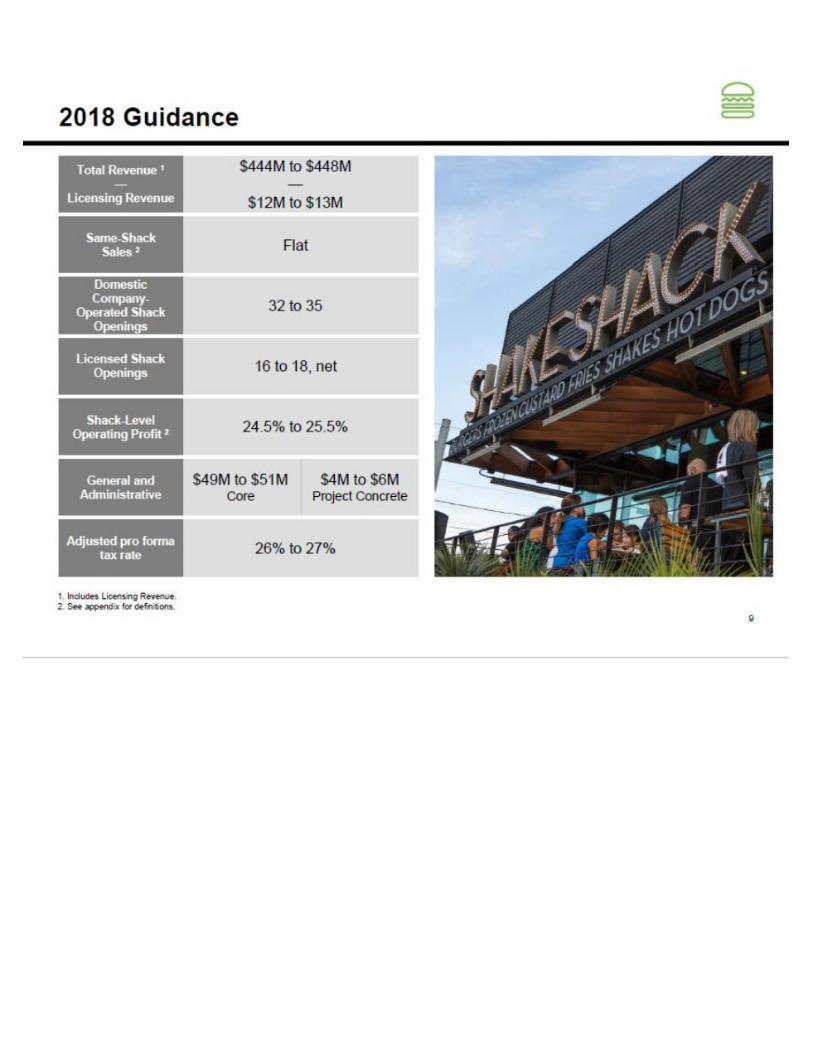
▪ Total revenue of between $ 444 million and $ 448 million inclusive of licensing revenue.▪ Licensing revenue to be between $12 and $13 million.▪ Same-Shack sales to be flat, which includes approximately 1.5% to 2% of menu price increases taken in December 2017.▪ Between 32 and 35 new domestic company-operated Shacks to be opened in fiscal 2018.▪ Between 16 and 18 net new licensed Shacks to be opened in fiscal 2018.▪ Average annual sales volume for total domestic company-operated Shacks is expected to be between $ 4.1 million and $ 4.2 million.▪ Shack-level operating profit margin between 24.5 % and 25.5 %.▪ General and administrative expenses to between $ 49 million and $ 51 million, excluding approximately $4 to $6 million of costs related to Project Concrete, the
Company's operational and financial systems upgrade initiative.▪ Depreciation expense of approximately $ 32 million.▪ Pre-opening costs of between $ 12 million and $ 13 million.▪ Interest expense between $ 2.0 million and $ 2.2 million.▪ Adjusted pro forma effective tax rate to between 26.0 % and 27.0 %.
2020Targets
By the end of fiscal year 2020, the Company is targeting:
▪ At least 200 domestic company-operated Shacks and at least 120 global licensed Shacks, and▪ Over $700 million in total revenue.
EarningsConferenceCall
As previously announced, the Company will host a conference call to discuss its fourth quarter and fiscal year 2017 financial results today at 5:00 p.m. ET.
The conference call can be accessed live over the phone by dialing (800) 289-0517 or for international callers by dialing (323) 994-2083. A replay will be available after the calland can be accessed by dialing (844) 512-2921 or for international callers by dialing (412) 317-6671; the passcode is 6373366. The replay will be available until February 22,2018.
The conference call will also be webcast live from the Company's Investor Relations website at http://investor.shakeshack.com. An archive of the webcast will be available atthe same location on the website shortly after the call has concluded.
Definitions
The following definitions apply to these terms as used in this release:
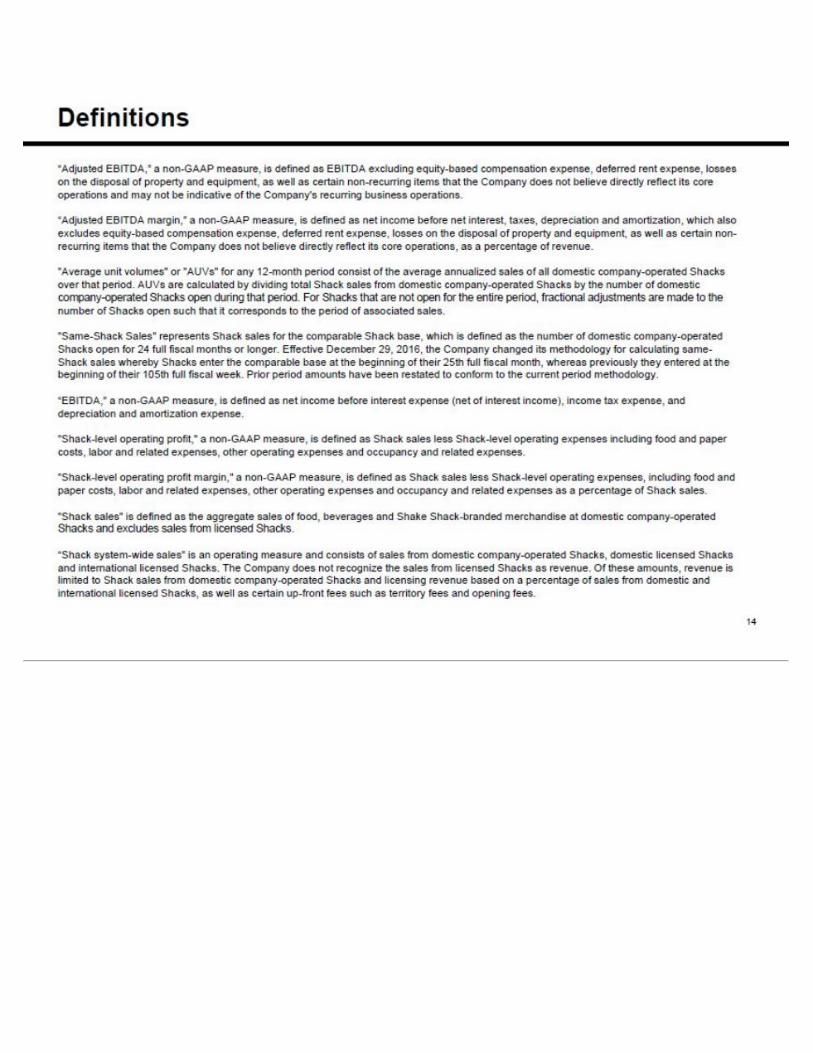
"Shack sales" is defined as the aggregate sales of food and beverages in domestic company-operated Shacks and excludes sales from licensed Shacks.
"Same-Shack sales" represents Shack sales for the comparable Shack base, which is defined as the number of domestic company-operated Shacks open for 24 full fiscal monthsor longer. Effective December 29, 2016, the Company changed its methodology for calculating same-Shack sales whereby Shacks enter the comparable base at the beginning oftheir 25th full fiscal month, whereas previously they entered at the beginning of their 105th full fiscal week. Prior period amounts have been restated to conform to the currentperiod methodology.
"Average unit volume" or "AUV" for any 12-month period consist of the average annualized sales of all domestic company-operated Shacks over that period. AUV is calculatedby dividing total Shack sales from domestic company-operated Shacks by the number of domestic company-operated Shacks open during that period. For Shacks that are notopen for the entire period, fractional adjustments are made to the number of Shacks open such that it corresponds to the period of associated sales. The measurement of AUVallows the Company to assess changes in guest traffic and per transaction patterns at domestic company-operated Shacks.
"Average weekly sales" is calculated by dividing total Shack sales by the number of operating weeks for all Shacks in operation during the period. For Shacks that are not openfor the entire period, fractional adjustments are made to the number of operating weeks open such that it corresponds to the period of associated sales.
"Shack-level operating profit," a non-GAAP measure, is defined as Shack sales less Shack-level operating expenses including food and paper costs, labor and related expenses,other operating expenses and occupancy and related expenses.
"Shack-level operating profit margin," a non-GAAP measure, is defined as Shack sales less Shack-level operating expenses including food and paper costs, labor and relatedexpenses, other operating expenses and occupancy and related expenses as a percentage of Shack sales.
“EBITDA,” a non-GAAP measure, is defined as net income before net interest, taxes, depreciation and amortization.
“Adjusted EBITDA,” a non-GAAP measure, is defined as net income before net interest, taxes, depreciation and amortization, which also excludes equity-based compensationexpense, deferred rent expense, losses on the disposal of property and equipment, as well as certain non-recurring items that the Company does not believe directly reflect itscore operations.
“Adjusted EBITDA margin,” a non-GAAP measure, is defined as net income before net interest, taxes, depreciation and amortization, which also excludes equity-basedcompensation expense, deferred rent expense, losses on the disposal of property and equipment, as well as certain non-recurring items that the Company does not believedirectly reflect its core operations, as a percentage of revenue.
"Adjusted pro forma net income," a non-GAAP measure, represents net income (loss) attributable to Shake Shack Inc. assuming the full exchange of all outstanding SSEHoldings, LLC membership interests ("LLC Interests") for shares of Class A common stock, adjusted for certain non-recurring items that the Company does not believe directlyreflect its core operations.
AboutShakeShack
Shake Shack is a modern day “roadside” burger stand known for its 100% all-natural Angus beef burgers and flat-top vienna beef dogs (no added hormones and no antibioticsever), 100% all-natural cage-free chicken (no antibiotics ever), spun-fresh frozen custard, crinkle cut fries, craft beer and wine (available at select locations) and more. With itsfresh, simple, high-quality food at a great value, Shake Shack is a fun and lively community gathering place with widespread appeal. From its premium ingredients and caringhiring practices to its inspiring designs and deep community investment, Shake Shack’s mission is to Stand For Something Good®. Since the original Shack opened in 2004 inNYC’s Madison Square Park, the company has opened multiple locations in 20 states and the District of Columbia, as well as international locations including London, Istanbul,Dubai, Tokyo, Moscow, Seoul and more.
InvestorContact:
Melissa Calandruccio, ICRMichelle Epstein, ICR(844) SHACK-04 (844-742-2504)[email protected]
MediaContact:
Edwin Bragg, Shake Shack(646) 747-6654 [email protected]
Forward-LookingStatements
This press release contains forward-looking statements, within the meaning of the Private Securities Litigation Reform Act of 1995 ("PSLRA"), which are subject to known andunknown risks, uncertainties and other important factors that may cause actual results to be materially different. All statements other than statements of historical fact includedin this press release are forward-looking statements, including, but not limited to, expected financial outlook for fiscal 2018, 2020 targets, expected Shack openings, expectedsame-Shack sales growth and trends in the Company’s operations. Forward-looking statements discuss the Company's current expectations and projections relating to theirfinancial position, results of operations, plans, objectives, future performance and business. You can identify forward-looking statements by the fact that they do not relatestrictly to historical or current facts. These statements may include words such as "aim," "anticipate," "believe," "estimate," "expect," "forecast," "outlook," "potential,""project," "projection," "plan," "intend," "seek," "may," "could," "would," "will," "should," "can," "can have," "likely," the negatives thereof and other similar expressions. Allforward-looking statements are expressly qualified in their entirety by these cautionary statements. You should evaluate all forward-looking statements made in this press releasein the context of the risks and uncertainties disclosed in the Company’s Annual Report on Form 10-K for the fiscal year

ended December 28, 2016, as amended, and subsequent Quarterly Reports on Form 10-Q filed with the Securities and Exchange Commission ("SEC"). All of the Company'sSEC filings are available online at www.sec.gov, www.shakeshake.com or upon request from Shake Shack Inc. The forward-looking statements included in this press release aremade only as of the date hereof. The Company undertakes no obligation to publicly update or revise any forward-looking statement as a result of new information, future eventsor otherwise, except as otherwise required by law.
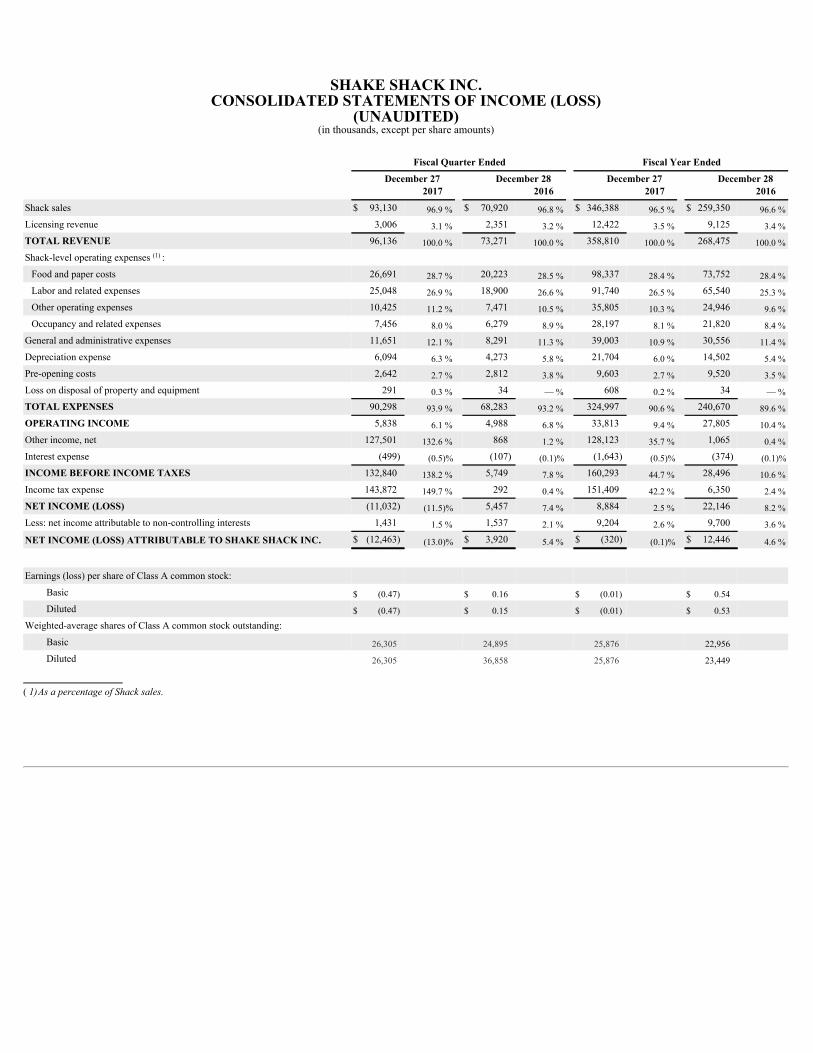
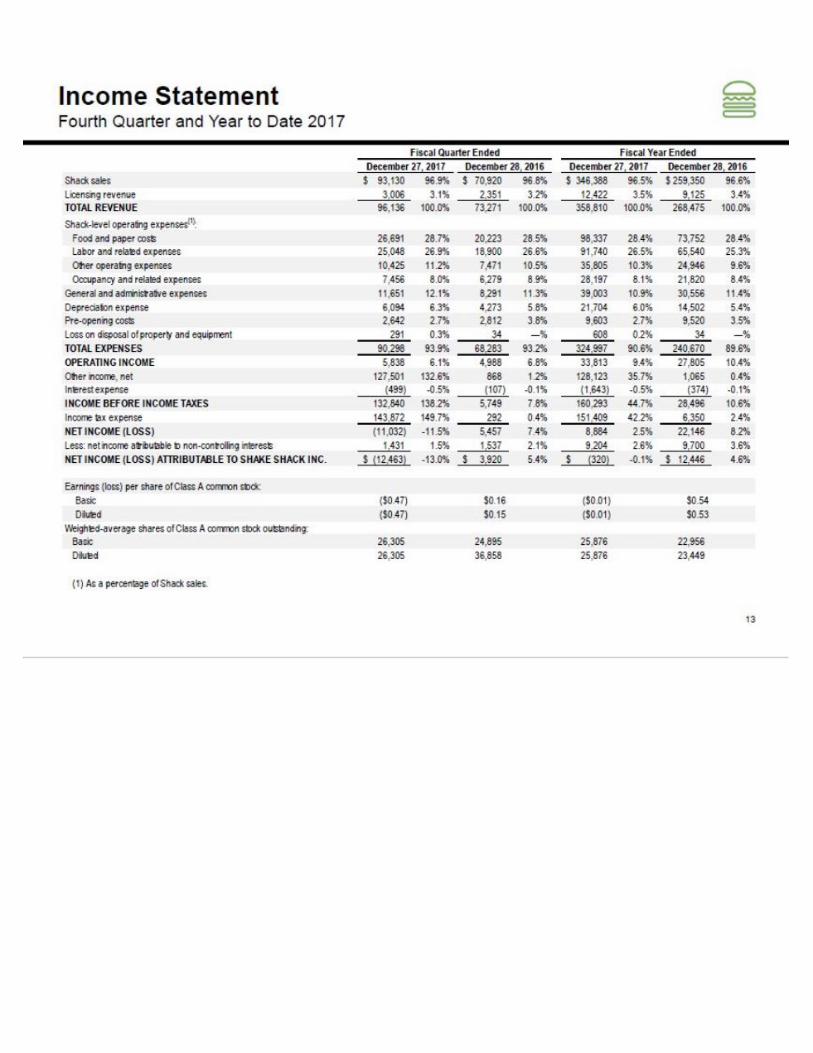
SHAKESHACKINC.CONSOLIDATEDSTATEMENTSOFINCOME(LOSS)
(UNAUDITED)(in thousands, except per share amounts)
FiscalQuarterEnded FiscalYearEnded
December27
2017 December28
2016 December27
2017 December28
2016 Shack sales $ 93,130 96.9 % $ 70,920 96.8 % $ 346,388 96.5 % $ 259,350 96.6 %Licensing revenue 3,006 3.1 % 2,351 3.2 % 12,422 3.5 % 9,125 3.4 %TOTALREVENUE 96,136 100.0 % 73,271 100.0 % 358,810 100.0 % 268,475 100.0 %Shack-level operating expenses (1) : Food and paper costs 26,691 28.7 % 20,223 28.5 % 98,337 28.4 % 73,752 28.4 % Labor and related expenses 25,048 26.9 % 18,900 26.6 % 91,740 26.5 % 65,540 25.3 % Other operating expenses 10,425 11.2 % 7,471 10.5 % 35,805 10.3 % 24,946 9.6 % Occupancy and related expenses 7,456 8.0 % 6,279 8.9 % 28,197 8.1 % 21,820 8.4 %General and administrative expenses 11,651 12.1 % 8,291 11.3 % 39,003 10.9 % 30,556 11.4 %Depreciation expense 6,094 6.3 % 4,273 5.8 % 21,704 6.0 % 14,502 5.4 %Pre-opening costs 2,642 2.7 % 2,812 3.8 % 9,603 2.7 % 9,520 3.5 %Loss on disposal of property and equipment 291 0.3 % 34 — % 608 0.2 % 34 — %TOTALEXPENSES 90,298 93.9 % 68,283 93.2 % 324,997 90.6 % 240,670 89.6 %OPERATINGINCOME 5,838 6.1 % 4,988 6.8 % 33,813 9.4 % 27,805 10.4 %Other income, net 127,501 132.6 % 868 1.2 % 128,123 35.7 % 1,065 0.4 %Interest expense (499) (0.5)% (107) (0.1)% (1,643) (0.5)% (374) (0.1)%INCOMEBEFOREINCOMETAXES 132,840 138.2 % 5,749 7.8 % 160,293 44.7 % 28,496 10.6 %Income tax expense 143,872 149.7 % 292 0.4 % 151,409 42.2 % 6,350 2.4 %NETINCOME(LOSS) (11,032) (11.5)% 5,457 7.4 % 8,884 2.5 % 22,146 8.2 %Less: net income attributable to non-controlling interests 1,431 1.5 % 1,537 2.1 % 9,204 2.6 % 9,700 3.6 %
NETINCOME(LOSS)ATTRIBUTABLETOSHAKESHACKINC. $ (12,463) (13.0)% $ 3,920 5.4 % $ (320) (0.1)% $ 12,446 4.6 %
Earnings (loss) per share of Class A common stock: Basic $ (0.47) $ 0.16 $ (0.01) $ 0.54 Diluted $ (0.47) $ 0.15 $ (0.01) $ 0.53 Weighted-average shares of Class A common stock outstanding: Basic 26,305 24,895 25,876 22,956 Diluted 26,305 36,858 25,876 23,449
( 1)As a percentage of Shack sales.
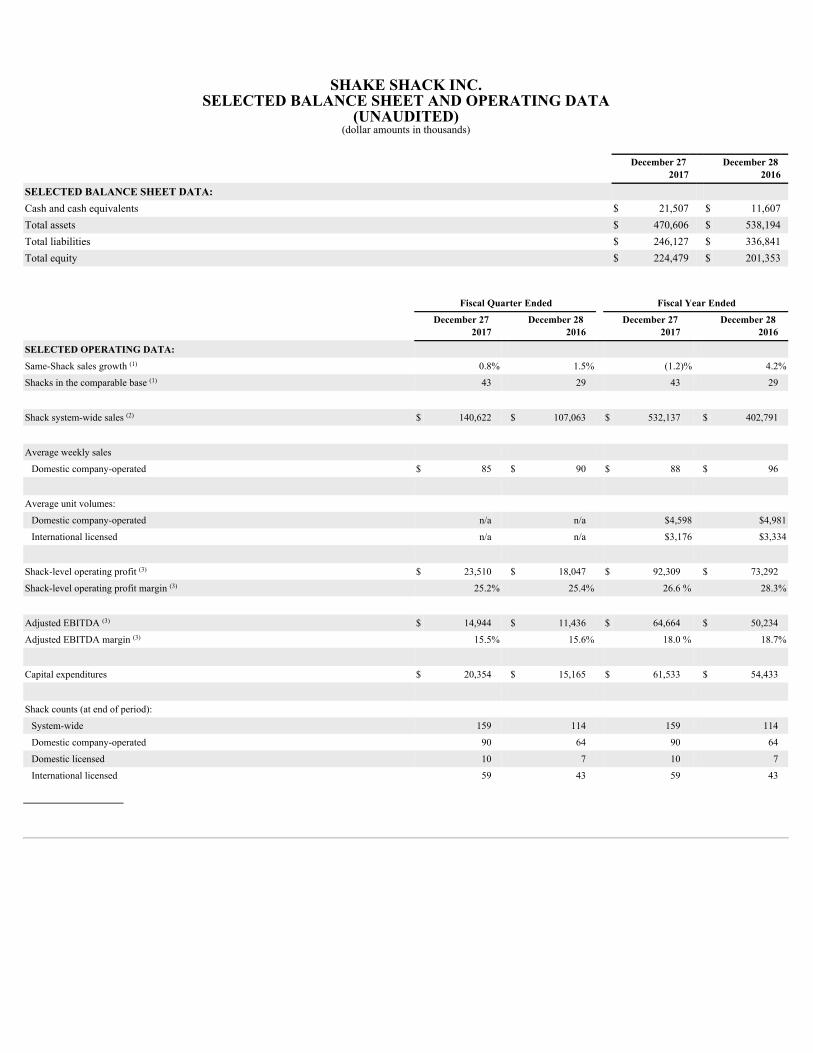
SHAKESHACKINC.SELECTEDBALANCESHEETANDOPERATINGDATA
(UNAUDITED)(dollar amounts in thousands)
December27
2017 December28
2016
SELECTEDBALANCESHEETDATA: Cash and cash equivalents $ 21,507 $ 11,607Total assets $ 470,606 $ 538,194Total liabilities $ 246,127 $ 336,841Total equity $ 224,479 $ 201,353
FiscalQuarterEnded FiscalYearEnded
December27
2017 December28
2016 December27
2017 December28
2016
SELECTEDOPERATINGDATA: Same-Shack sales growth (1) 0.8% 1.5% (1.2)% 4.2%
Shacks in the comparable base (1) 43 29 43 29
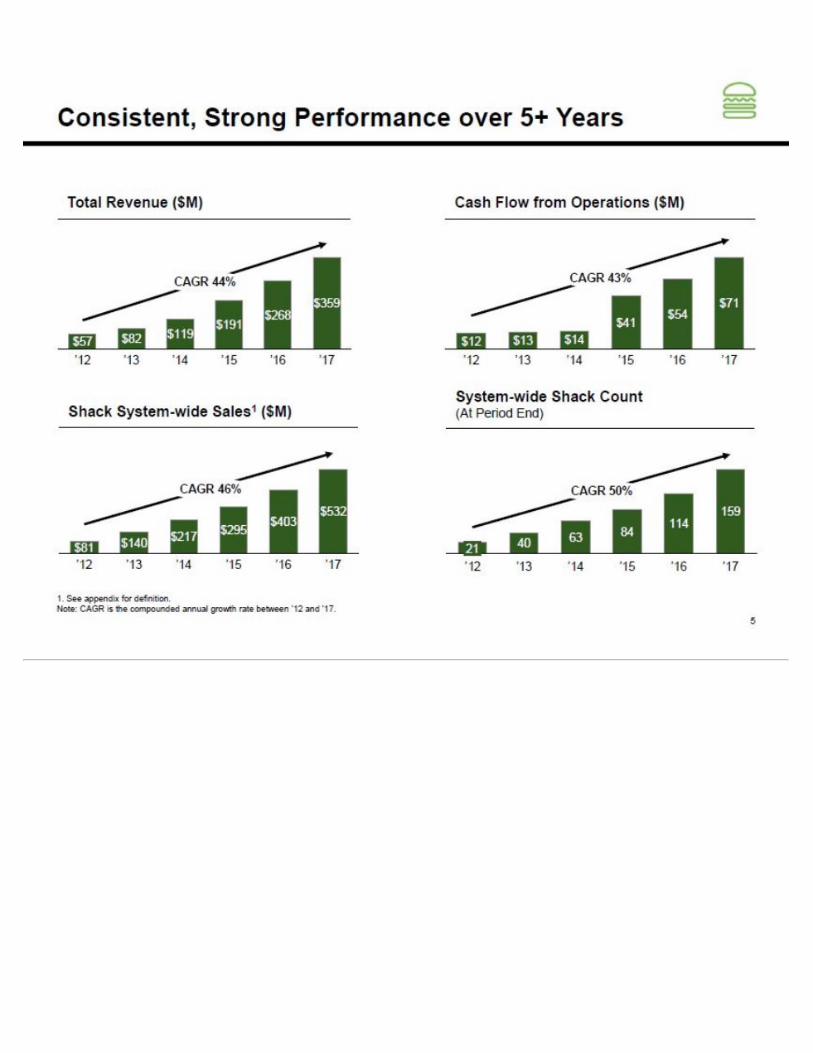
Shack system-wide sales (2) $ 140,622 $ 107,063 $ 532,137 $ 402,791
Average weekly sales Domestic company-operated $ 85 $ 90 $ 88 $ 96
Average unit volumes: Domestic company-operated n/a n/a $4,598 $4,981
International licensed n/a n/a $3,176 $3,334
Shack-level operating profit (3) $ 23,510 $ 18,047 $ 92,309 $ 73,292
Shack-level operating profit margin (3) 25.2% 25.4% 26.6 % 28.3%
Adjusted EBITDA (3) $ 14,944 $ 11,436 $ 64,664 $ 50,234
Adjusted EBITDA margin (3) 15.5% 15.6% 18.0 % 18.7%
Capital expenditures $ 20,354 $ 15,165 $ 61,533 $ 54,433
Shack counts (at end of period): System-wide 159 114 159 114
Domestic company-operated 90 64 90 64
Domestic licensed 10 7 10 7
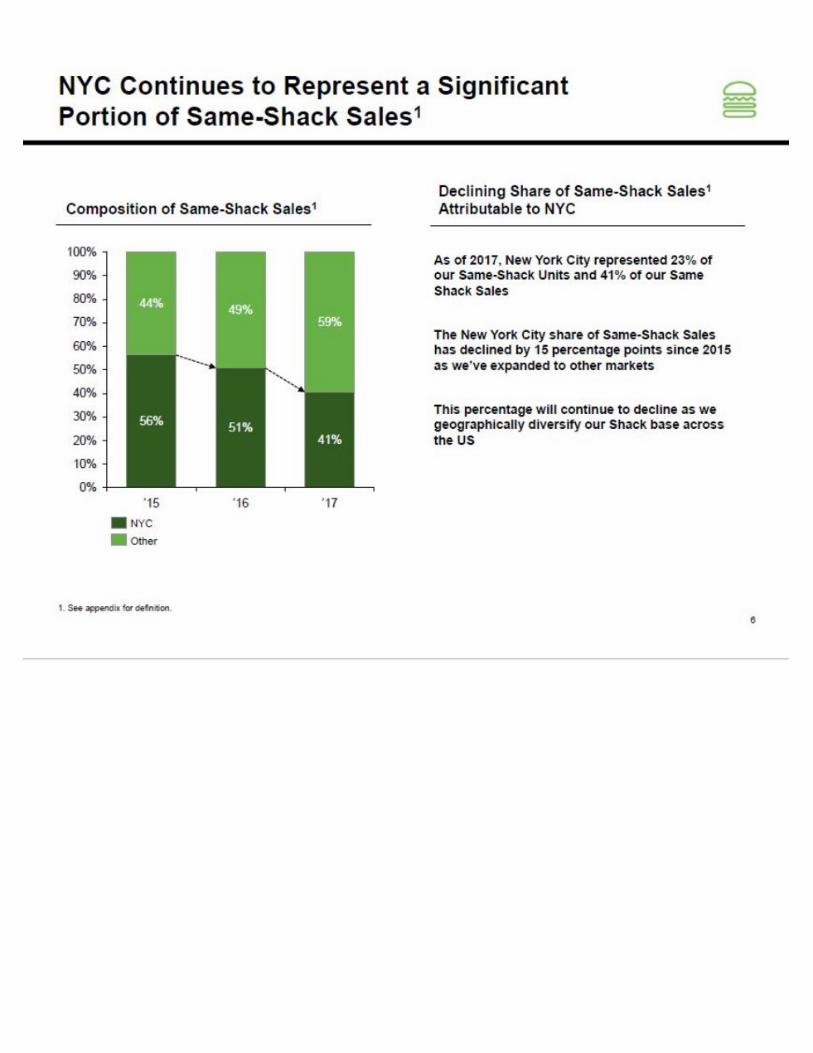
International licensed 59 43 59 43

(1) Effective December 29, 2016, the Company changed its methodology for calculating same-Shack sales whereby Shacks enter the comparable base at the beginning of their 25th full fiscalmonth, whereas previously they entered at the beginning of their 105th full fiscal week. Prior period amounts have been restated to conform to the current period methodology. The changein methodology had an immaterial impact to the same-Shack sales growth for the thirteen and fifty-two weeks ended December 28, 2016.
(2) Shack system-wide sales is an operating measure and consists of sales from the Company's domestic company-operated Shacks, domestic licensed Shacks and international licensedShacks. The Company does not recognize the sales from licensed Shacks as revenue. Of these amounts, revenue is limited to Shack sales from domestic company-operated Shacks andlicensing revenue based on a percentage of sales from domestic and international licensed Shacks .
(3) Shack-level operating profit and adjusted EBITDA are non-GAAP measures. Reconciliations of Shack-level operating profit to operating income and adjusted EBITDA to net income(loss), the most directly comparable financial measures presented in accordance with GAAP, are set forth in the schedules accompanying this release. See “Non-GAAP FinancialMeasures.”
SHAKESHACKINC.NON-GAAPFINANCIALMEASURES
(UNAUDITED)
To supplement the consolidated financial statements, which are prepared and presented in accordance with U.S. generally accepted accounting principles (“GAAP”), theCompany uses the following non-GAAP financial measures: Shack-level operating profit, Shack-level operating profit margin, EBITDA, adjusted EBITDA, adjusted pro formanet income and adjusted pro forma earnings per fully exchanged and diluted share (collectively the "non-GAAP financial measures").
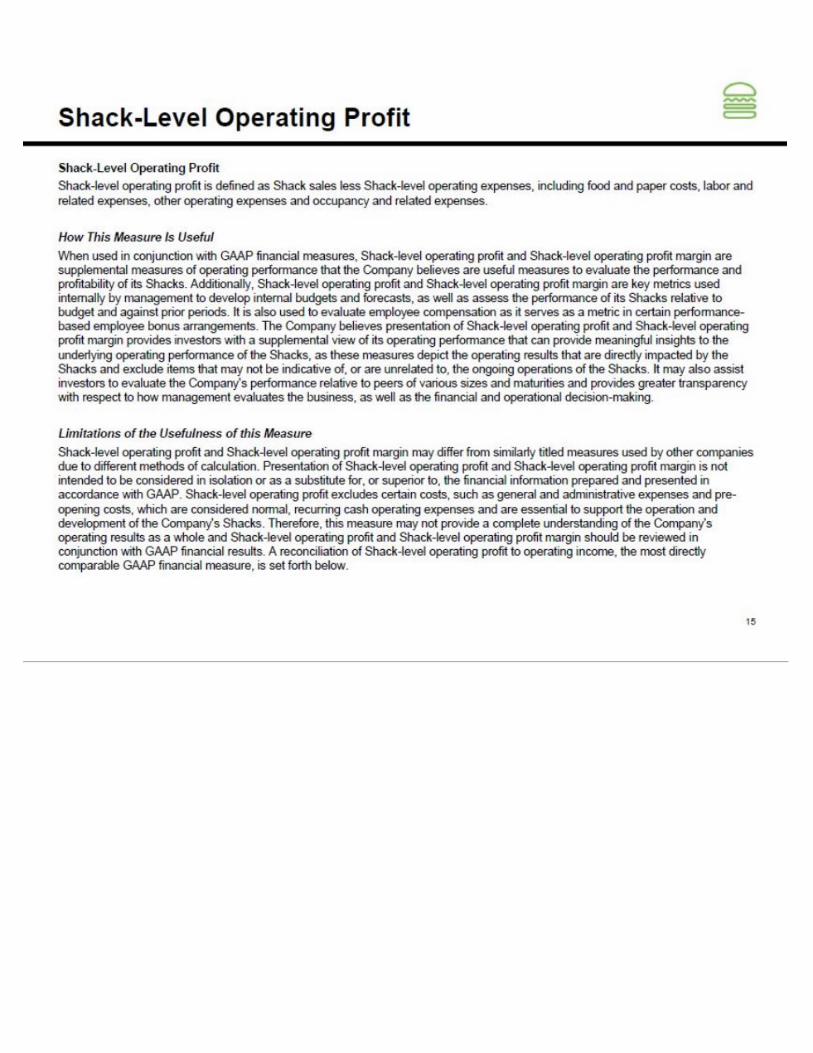
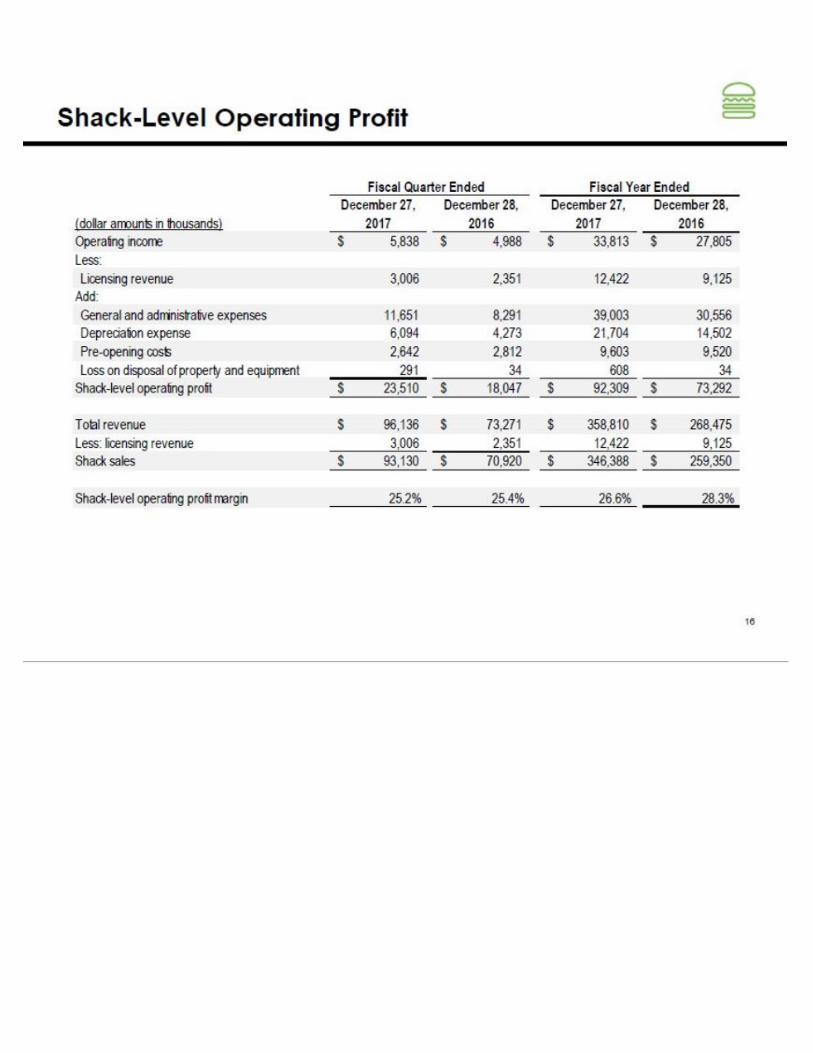
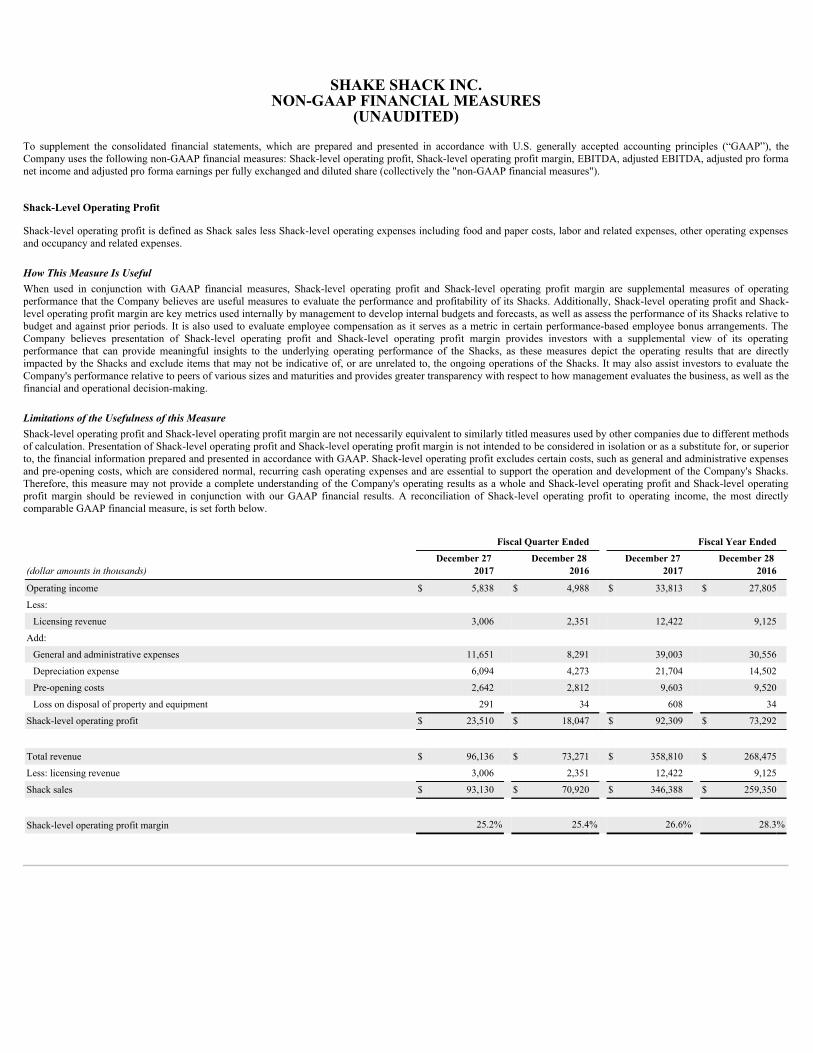
Shack-LevelOperatingProfit
Shack-level operating profit is defined as Shack sales less Shack-level operating expenses including food and paper costs, labor and related expenses, other operating expensesand occupancy and related expenses.
How This Measure Is UsefulWhen used in conjunction with GAAP financial measures, Shack-level operating profit and Shack-level operating profit margin are supplemental measures of operatingperformance that the Company believes are useful measures to evaluate the performance and profitability of its Shacks. Additionally, Shack-level operating profit and Shack-level operating profit margin are key metrics used internally by management to develop internal budgets and forecasts, as well as assess the performance of its Shacks relative tobudget and against prior periods. It is also used to evaluate employee compensation as it serves as a metric in certain performance-based employee bonus arrangements. TheCompany believes presentation of Shack-level operating profit and Shack-level operating profit margin provides investors with a supplemental view of its operatingperformance that can provide meaningful insights to the underlying operating performance of the Shacks, as these measures depict the operating results that are directlyimpacted by the Shacks and exclude items that may not be indicative of, or are unrelated to, the ongoing operations of the Shacks. It may also assist investors to evaluate theCompany's performance relative to peers of various sizes and maturities and provides greater transparency with respect to how management evaluates the business, as well as thefinancial and operational decision-making.
Limitations of the Usefulness of this MeasureShack-level operating profit and Shack-level operating profit margin are not necessarily equivalent to similarly titled measures used by other companies due to different methodsof calculation. Presentation of Shack-level operating profit and Shack-level operating profit margin is not intended to be considered in isolation or as a substitute for, or superiorto, the financial information prepared and presented in accordance with GAAP. Shack-level operating profit excludes certain costs, such as general and administrative expensesand pre-opening costs, which are considered normal, recurring cash operating expenses and are essential to support the operation and development of the Company's Shacks.Therefore, this measure may not provide a complete understanding of the Company's operating results as a whole and Shack-level operating profit and Shack-level operatingprofit margin should be reviewed in conjunction with our GAAP financial results. A reconciliation of Shack-level operating profit to operating income, the most directlycomparable GAAP financial measure, is set forth below.
FiscalQuarterEnded FiscalYearEnded
(dollar amounts in thousands)December27
2017 December28
2016 December27
2017 December28
2016
Operating income $ 5,838 $ 4,988 $ 33,813 $ 27,805
Less: Licensing revenue 3,006 2,351 12,422 9,125
Add: General and administrative expenses 11,651 8,291 39,003 30,556
Depreciation expense 6,094 4,273 21,704 14,502
Pre-opening costs 2,642 2,812 9,603 9,520
Loss on disposal of property and equipment 291 34 608 34
Shack-level operating profit $ 23,510 $ 18,047 $ 92,309 $ 73,292
Total revenue $ 96,136 $ 73,271 $ 358,810 $ 268,475
Less: licensing revenue 3,006 2,351 12,422 9,125
Shack sales $ 93,130 $ 70,920 $ 346,388 $ 259,350
Shack-level operating profit margin 25.2% 25.4% 26.6% 28.3%
SHAKESHACKINC.NON-GAAPFINANCIALMEASURES
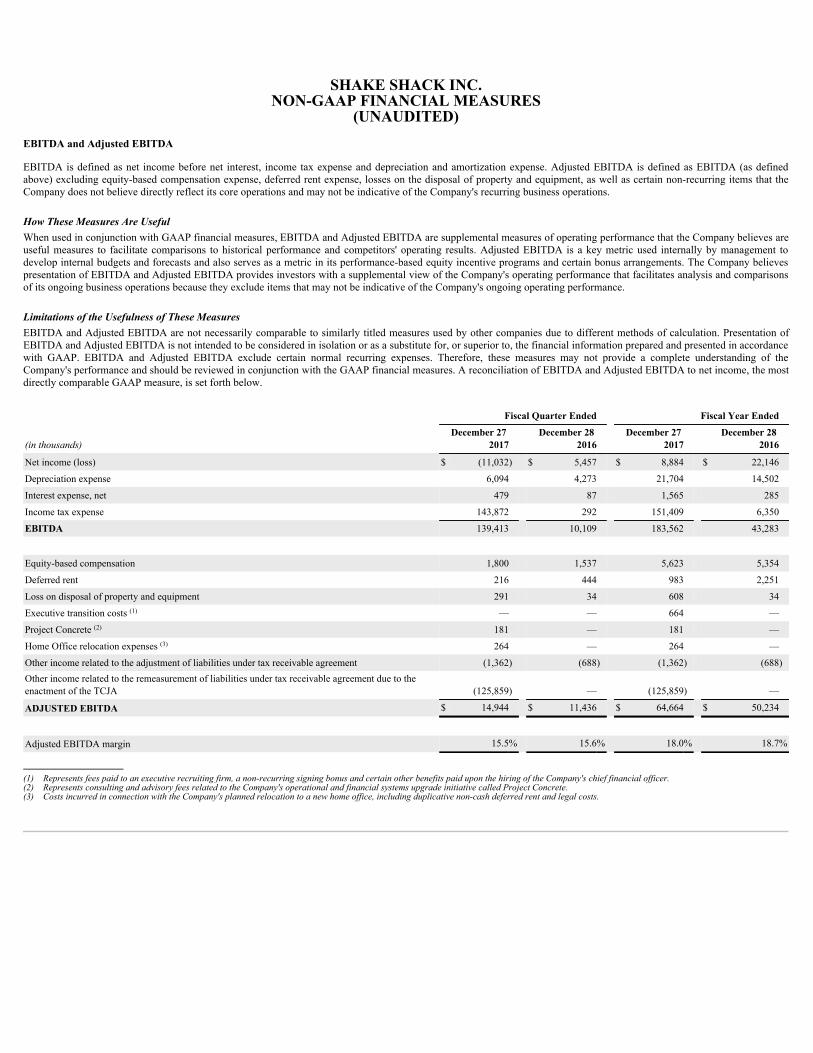
(UNAUDITED)EBITDAandAdjustedEBITDA
EBITDA is defined as net income before net interest, income tax expense and depreciation and amortization expense. Adjusted EBITDA is defined as EBITDA (as definedabove) excluding equity-based compensation expense, deferred rent expense, losses on the disposal of property and equipment, as well as certain non-recurring items that theCompany does not believe directly reflect its core operations and may not be indicative of the Company's recurring business operations.
How These Measures Are UsefulWhen used in conjunction with GAAP financial measures, EBITDA and Adjusted EBITDA are supplemental measures of operating performance that the Company believes areuseful measures to facilitate comparisons to historical performance and competitors' operating results. Adjusted EBITDA is a key metric used internally by management todevelop internal budgets and forecasts and also serves as a metric in its performance-based equity incentive programs and certain bonus arrangements. The Company believespresentation of EBITDA and Adjusted EBITDA provides investors with a supplemental view of the Company's operating performance that facilitates analysis and comparisonsof its ongoing business operations because they exclude items that may not be indicative of the Company's ongoing operating performance.
Limitations of the Usefulness of These MeasuresEBITDA and Adjusted EBITDA are not necessarily comparable to similarly titled measures used by other companies due to different methods of calculation. Presentation ofEBITDA and Adjusted EBITDA is not intended to be considered in isolation or as a substitute for, or superior to, the financial information prepared and presented in accordancewith GAAP. EBITDA and Adjusted EBITDA exclude certain normal recurring expenses. Therefore, these measures may not provide a complete understanding of theCompany's performance and should be reviewed in conjunction with the GAAP financial measures. A reconciliation of EBITDA and Adjusted EBITDA to net income, the mostdirectly comparable GAAP measure, is set forth below.
FiscalQuarterEnded FiscalYearEnded
(in thousands)December27
2017 December28
2016 December27
2017 December28
2016
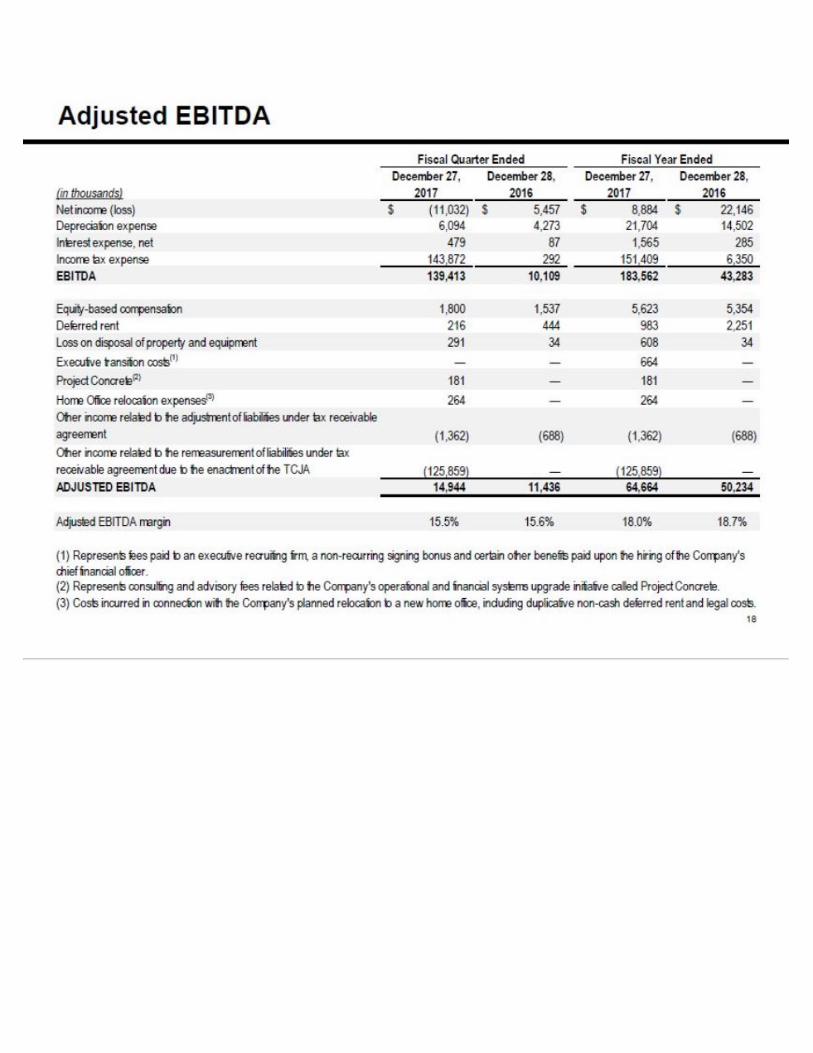
Net income (loss) $ (11,032) $ 5,457 $ 8,884 $ 22,146
Depreciation expense 6,094 4,273 21,704 14,502
Interest expense, net 479 87 1,565 285
Income tax expense 143,872 292 151,409 6,350
EBITDA 139,413 10,109 183,562 43,283
Equity-based compensation 1,800 1,537 5,623 5,354
Deferred rent 216 444 983 2,251
Loss on disposal of property and equipment 291 34 608 34
Executive transition costs (1) — — 664 —
Project Concrete (2) 181 — 181 —
Home Office relocation expenses (3) 264 — 264 —
Other income related to the adjustment of liabilities under tax receivable agreement (1,362) (688) (1,362) (688)Other income related to the remeasurement of liabilities under tax receivable agreement due to theenactment of the TCJA (125,859) — (125,859) —
ADJUSTEDEBITDA $ 14,944 $ 11,436 $ 64,664 $ 50,234
Adjusted EBITDA margin 15.5% 15.6% 18.0% 18.7%
(1) Represents fees paid to an executive recruiting firm, a non-recurring signing bonus and certain other benefits paid upon the hiring of the Company's chief financial officer.(2) Represents consulting and advisory fees related to the Company's operational and financial systems upgrade initiative called Project Concrete.(3) Costs incurred in connection with the Company's planned relocation to a new home office, including duplicative non-cash deferred rent and legal costs.
SHAKESHACKINC.NON-GAAPFINANCIALMEASURES
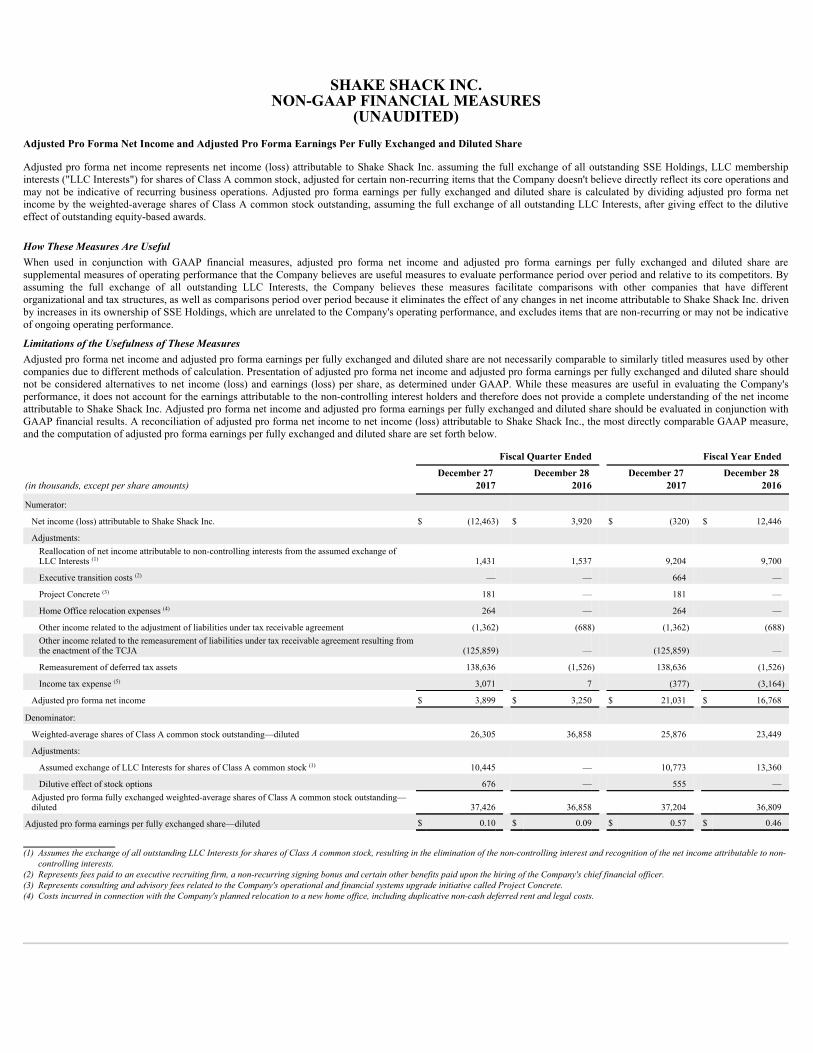
(UNAUDITED)AdjustedProFormaNetIncomeandAdjustedProFormaEarningsPerFullyExchangedandDilutedShare
Adjusted pro forma net income represents net income (loss) attributable to Shake Shack Inc. assuming the full exchange of all outstanding SSE Holdings, LLC membershipinterests ("LLC Interests") for shares of Class A common stock, adjusted for certain non-recurring items that the Company doesn't believe directly reflect its core operations andmay not be indicative of recurring business operations. Adjusted pro forma earnings per fully exchanged and diluted share is calculated by dividing adjusted pro forma netincome by the weighted-average shares of Class A common stock outstanding, assuming the full exchange of all outstanding LLC Interests, after giving effect to the dilutiveeffect of outstanding equity-based awards.
How These Measures Are UsefulWhen used in conjunction with GAAP financial measures, adjusted pro forma net income and adjusted pro forma earnings per fully exchanged and diluted share aresupplemental measures of operating performance that the Company believes are useful measures to evaluate performance period over period and relative to its competitors. Byassuming the full exchange of all outstanding LLC Interests, the Company believes these measures facilitate comparisons with other companies that have differentorganizational and tax structures, as well as comparisons period over period because it eliminates the effect of any changes in net income attributable to Shake Shack Inc. drivenby increases in its ownership of SSE Holdings, which are unrelated to the Company's operating performance, and excludes items that are non-recurring or may not be indicativeof ongoing operating performance.
Limitations of the Usefulness of These MeasuresAdjusted pro forma net income and adjusted pro forma earnings per fully exchanged and diluted share are not necessarily comparable to similarly titled measures used by othercompanies due to different methods of calculation. Presentation of adjusted pro forma net income and adjusted pro forma earnings per fully exchanged and diluted share shouldnot be considered alternatives to net income (loss) and earnings (loss) per share, as determined under GAAP. While these measures are useful in evaluating the Company'sperformance, it does not account for the earnings attributable to the non-controlling interest holders and therefore does not provide a complete understanding of the net incomeattributable to Shake Shack Inc. Adjusted pro forma net income and adjusted pro forma earnings per fully exchanged and diluted share should be evaluated in conjunction withGAAP financial results. A reconciliation of adjusted pro forma net income to net income (loss) attributable to Shake Shack Inc., the most directly comparable GAAP measure,and the computation of adjusted pro forma earnings per fully exchanged and diluted share are set forth below.
FiscalQuarterEnded FiscalYearEnded
(in thousands, except per share amounts)December27
2017 December28
2016 December27
2017 December28
2016
Numerator: Net income (loss) attributable to Shake Shack Inc. $ (12,463) $ 3,920 $ (320) $ 12,446 Adjustments:
Reallocation of net income attributable to non-controlling interests from the assumed exchange ofLLC Interests (1) 1,431 1,537 9,204 9,700
Executive transition costs (2) — — 664 — Project Concrete (3) 181 — 181 — Home Office relocation expenses (4) 264 — 264 — Other income related to the adjustment of liabilities under tax receivable agreement (1,362) (688) (1,362) (688)
Other income related to the remeasurement of liabilities under tax receivable agreement resulting fromthe enactment of the TCJA (125,859) — (125,859) —
Remeasurement of deferred tax assets 138,636 (1,526) 138,636 (1,526) Income tax expense (5) 3,071 7 (377) (3,164) Adjusted pro forma net income $ 3,899 $ 3,250 $ 21,031 $ 16,768
Denominator: Weighted-average shares of Class A common stock outstanding—diluted 26,305 36,858 25,876 23,449 Adjustments: Assumed exchange of LLC Interests for shares of Class A common stock (1) 10,445 — 10,773 13,360 Dilutive effect of stock options 676 — 555 —
Adjusted pro forma fully exchanged weighted-average shares of Class A common stock outstanding—diluted 37,426 36,858 37,204 36,809
Adjusted pro forma earnings per fully exchanged share—diluted $ 0.10 $ 0.09 $ 0.57 $ 0.46
(1) Assumes the exchange of all outstanding LLC Interests for shares of Class A common stock, resulting in the elimination of the non-controlling interest and recognition of the net income attributable to non-controlling interests.
(2) Represents fees paid to an executive recruiting firm, a non-recurring signing bonus and certain other benefits paid upon the hiring of the Company's chief financial officer.(3) Represents consulting and advisory fees related to the Company's operational and financial systems upgrade initiative called Project Concrete.(4) Costs incurred in connection with the Company's planned relocation to a new home office, including duplicative non-cash deferred rent and legal costs.

(5) Represents the tax effect of the aforementioned adjustments and pro forma adjustments to reflect corporate income taxes at assumed effective tax rates of 35.7% and 38.5% for the fiscal quarter and yearended December 27, 2017 , respectively, and 35.8% and 39.7% for the fiscal quarter and year ended December 28, 2016 , respectively. Amounts include provisions for U.S. federal income taxes, certainLLC entity-level taxes and foreign withholding taxes, assuming the highest statutory rates apportioned to each applicable state, local and foreign jurisdiction.