ff2021 ps geo major industrial regions
TRANSCRIPT


As IAS prelims 2021 is knocking at the door, jitters and anxiety is a common emotion that an aspirant feels. But if we analyze the whole journey, these last few days act most crucial in your preparation. This is the time when one should muster all their strength and give the fi nal punch required to clear this exam. But the main task here is to consolidate the various resources that an aspirant is referring to.GS SCORE brings to you, Prelims Sampoorna, a series of all value-added resources in your prelims preparation, which will be your one-stop solution and will help in reducing your anxiety and boost your confi dence. As the name suggests, Prelims Sampoorna is a holistic program, which has 360-degree coverage of high-relevance topics. It is an outcome-driven initiative that not only gives you downloads of all resources which you need to summarize your preparation but also provides you with All India open prelims mock tests series in order to assess your learning. Let us summarize this initiative, which will include:
GS Score UPSC Prelims 2021 Yearly Current Affairs Compilation of All 9 Subjects
Topic-wise Prelims Fact Files (Approx. 40)
Geography Through Maps (6 Themes)
Map Based Questions
ALL India Open Prelims Mock Tests Series including 10 Tests
Compilation of Previous Year Questions with Detailed Explanation We will be uploading all the resources on a regular basis till your prelims exam. To get the maximum benefi t of the initiative keep visiting the website.To receive all updates through notifi cation, subscribe:
PRELIMS SAMPOORNA
https://t.me/iasscore
https://www.youtube.com/c/IASSCOREoffi cial/
https://www.facebook.com/gsscoreoffi cial
https://www.instagram.com/gs.scoreoffi cial/
https://twitter.com/gsscoreoffi cial
https://www.linkedin.com/company/gsscoreoffi cial/


www.iasscore.in IAS 2021 | PRELIMS SAMPOORANA - FACT FILE | INDIAN SOIL
Industrial Regions in India
Mumbai-Pune Industrial Region
This region extends from Thane to Pune and in adjoining districts of Nashik and Solapur. This region owes its origin to the British rule in India.
The industrial centres of this region are: Ambarnath, Andheri, Bhandup, Ghatkopar, Hadapsar, Jogeshwari, Kalyan, Kirkee, Kolhapur, Kurla, Nashik, Sholapur, Thane, Trombay, Ulhasnagar, and Vikroli.
Kolkata-Hugli Industrial Region
Located in West Bengal, this region extends as a narrow belt running along the river Hugli for a distance of about 100 km from Bansbaria and Naihati in the north to Birlanagar in the south.
The major centres of this industrial region are Kolkata, Haora, Haldia, Serampur, Rishra, Shibpur, Naihati, Kakinara, Shamnagar, Titagarh, Sodepur, Budge Budge, Birlanagar, Bansbaria, Belgurriah, Triveni, Hugli, Belur, etc.
Bangalore-Tamil Nadu Industrial Region
Spread in two states of Karnataka and Tamil Nadu, this region experienced the fastest industrial growth in the post-independence era.
MAJOR INDUSTRIES, INDUSTRIAL
BELTS & REGIONS IN INDIA

www.iasscore.in2 IAS 2021 | PRELIMS SAMPOORNA | FACT FILE |
Till 1960, industries were confi ned to Bangalore district of Karnataka and Salem and Madurai districts of Tamil Nadu. But now they have spread over all the districts of Tamil Nadu except Viluppuram.
Madurai is known for its cotton textiles . Visvesvarayya Iron and Steel Works’ is located at Bhadravati. The other important centres of this region are Sivakasi, Tiruchirapalli, Madukottai, Mettur, Mysore and Mandya. Petroleum refi nery at Chennai and Narimanam and iron and steel plant at Salem are recent developments.

www.iasscore.in 3GEOGRAPHY | MAJOR INDUSTRIES, INDUSTRIAL BELTS & REGIONS IN INDIA
Gujarat Industrial Region
The nucleus of this region lies between Ahmedabad and Vadodara as a result of which it is also known as Ahmedabad-Vadodara industrial region. However, this region extends upto Valsad and Surat in the south and Jamnagar in the west.
The main industrial centres of this region are Ahmedabad, Vadodara, Bharuch, Koyali, Anand, Khera, Surendranagar, Surat, Jamnagar, Rajkot and Valsad.
Chotanagpur Industrial Region
As its name indicates, this region is located on the Chotanagpur plateau and extends over Jharkhand, Northern Orissa and Western part of West Bengal. The region is also known as ‘Ruhr of India’.
Important nodal centres of this region are Ranchi, Dhanbad, Chaibasa, Sindri, Hazaribagh, Jamshedpur, Daltonganj, Garwa and Japla.
Vishakhapatnam-Guntur Industrial Region
This industrial region extends from Vishakhapatnam district in the north-eastern part of Andhra Pradesh to Kurnool and Prakasham districts in the south-east and covers most of the coastal Andhra Pradesh.
The important industrial centres of this region are Vishakhapatnam, Vijaywada, Vijaynagar, Rajahmundry, Kurnool, Elum and Guntur.
Gurgaon-Delhi-Meerut Industrial Region
This region developed after independence, but is one of the fastest growing regions of India. It consists of two industrial belts adjoining Delhi. One belt extends over Agra-Mathura-Meerut and Saharanpur in U.P. and the other between Faridabad-Gurgaon- Ambala in Haryana.
Kollam-Thiruvananthapuram Industrial Region
This is comparatively small industrial region and spreads over Thiruvananthapuram, Kollam, Alwaye, Emakulam and Allapuzha districts of south Kerala.
Minor Industrial Regions in IndiaAmbala-Amritsar in Haryana-Punjab.
Saharanpur-Muzaffarnagar-Bijnaur in Uttar Pradesh.
Indore-Dewas-Ujjain in Madhya Pradesh.
Jaipur-Ajmer in Rajasthan.
Kolhapur-South Kannada in Maharashtra-Karnataka.
Northern Malabar in Kerala.
Middle Malabar in Kerala.
Adilabad-Nizamabad in Andhra Pradesh.

www.iasscore.in4 IAS 2021 | PRELIMS SAMPOORNA | FACT FILE |
Allahabad-Varanasi-Mirzapur in Uttar Pradesh.
Bhojpur-Munger in Bihar.
Durg-Raipur in Chhattisgarh.
Bilaspur-Korba in Chhattisgarh.
Brahmaputra Valley in Assam.
Industrial Corridors
Government of India has approved the development of following fi ve industrial corridor projects to be implemented through National Industrial Corridor Development and Implementation Trust (NICDIT):
S.No. Industrial Corridor States
1 Delhi Mumbai Industrial Corridor (DMIC) U ar Pradesh, Haryana, Rajasthan, Madhya Pradesh, Gujarat, Maharashtra
2 Amritsar Kolkata Industrial Corridor (AKIC) Punjab, Haryana, U ar Pradesh, U arakhand, Bihar, Jharkhand, West Bengal
3 Chennai Bengaluru Industrial Corridor (CBIC) Andhra Pradesh, Karnataka, Tamil Nadu, Kerala
4 East Coast Economic Corridor (ECEC) with Vizag Chennai Industrial Corridor (VCIC) as Phase-1
West Bengal, Odisha, Andhra Pradesh, Tamil Nadu
5 Bengaluru Mumbai Industrial Corridor (BMIC) Karnataka, Maharashtra
Dedicated Freight CorridorThe Eastern and Western Dedicated Freight Corridors (DFC) are a mega rail transport project being undertaken to increase transportation capacity, reduce unit costs of transportation, and improve service quality.
The Eastern DFC (1839 route kilometres (RKM) extends from Dankuni near Kolkata to Ludhiana in Punjab, while theWestern DFC (1499 RKM) extends from the Jawahar Lal Nehru Port (JNPT) in Mumbai to Dadri /Rewari near Delhi.
An SPV Dedicated Freight Corridor Corporation of India Limited was set up to implement the project.
The major part of Eastern Dedicated Freight Corridor is being funded by World Bank and the Western Dedicated Freight corridor is being funded by Japan International Cooperation Agency (JICA). Some parts are being built in PPP Mode.
Major Industries
Iron and Steel industry
Global crude steel production reached 1,869.9 million tonnes (Mt) for the year 2019, up by 3.4% compared to 2018. Crude steel production contracted in all regions in 2019 except in Asia and the Middle East.
Rapid rise in production has resulted in India becoming the 2nd largest producer of crude steel during 2018, from its 3rd largest status in 2017. The country is also the largest producer of Sponge

www.iasscore.in 5GEOGRAPHY | MAJOR INDUSTRIES, INDUSTRIAL BELTS & REGIONS IN INDIA
Iron or DRI in the world and the 3rd largest fi nished steel consumer in the world after China & USA.
In 2018-19, production of total fi nished steel (alloy + non alloy) was 131.572 mt, a growth of 3.7% over last year.
Production of Pig Iron in 2018-19 was 6.055 mt, a growth of 5.7% over last year.
India is the largest producer of Sponge Iron in the world. The coal based route accounted for 79% of total Sponge Iron production (33.040 mt) in the country in 2018-19.
Iron & steel are freely importable and exportable.

www.iasscore.in6 IAS 2021 | PRELIMS SAMPOORNA | FACT FILE |

www.iasscore.in 7GEOGRAPHY | MAJOR INDUSTRIES, INDUSTRIAL BELTS & REGIONS IN INDIA
Top 5 steel-producing countries
Rank Country 2019 (Mt) 2018 (Mt) % 2019/2018
1 China 996.3 920.0 8.3
2 India 111.2 109.3 1.8
3 Japan 99.3 104.3 -4.8
4 United States 87.9 86.6 1.5
5 Russia (e) 71.6 72.0 -0.7
36oN
28o
32o
20o
16o
12o
8o
72oE 76o 84o 88o 92oE
8oN
12o
20o
24o
32o
36oN
96oE92o88o84o80o76o72o68oE
CH CHHINAINA( T( TTIBEIBET)T)T
PAKPAKKISTISTISTAANA
NEPALBHUTAN
MYAM NMAR
BAY OFOF BE BEBENGANGAN LL
ARAARABIABIAIAN SN SEAEAA
SRIILLANLLANKAKAL
Andn aman and NicNi obao r (INDIA)
Lakkkkshahshah dweweweep kshadwe (INDIADIADIADIDD )DIA
OCEAN
Tropic of Cancer
Vishakhapatnam
Bhilai Raurkela
Jamshedpur
Bokaro Burnpur
Durgapur
Vijaynagar
Salem
Bhadravati
INDIAIRON AND STEEL PLANTS
N

www.iasscore.in8 IAS 2021 | PRELIMS SAMPOORNA | FACT FILE |
Automobile Industry
India became the fourth largest auto market in 2018 with sales increasing 8.3 per cent year-on-year to 3.99 million units. It was the seventh largest manufacturer of commercial vehicles in 2018.
Automobile exports grew 14.50 per cent during FY19. It is expected to grow at a CAGR of 3.05 per cent during 2016-2026.
India will be part of “Global Automotive Triumvirate” - the global BIG 3 in coming 20 years and will also exceed the Indian automotive sales from US market by mid 2030s.
Indian auto industry is expected to see 8-12 per cent increase in its hiring during FY19.
Overall domestic automobiles sales increased at 6.71 per cent CAGR between FY13-19 with 26.27 million vehicles getting sold in FY19.
Domestic automobile production increased at 6.96 per cent CAGR between FY13-19 with 30.92 million vehicles manufactured in the country in FY19.
In FY19, commercial vehicles recorded the fastest pace of growth in domestic sales at 17.55 per cent year-on-year, followed by three-wheelers at 10.27 per cent year-on-year.
Chemical Industry
Indian ranks 14 th in export and 8th in import of chemicals (Excluding Pharmaceuticals products) globally
Market size of the Chemicals industry in India stood at $178 bn in 2018-19.
Total production of major chemicals and petrochemicals stood at 27,858 MT during 2018-19, a growth of 4.18% over 2017-18.
Alkali chemicals had the largest share in the Chemical industry in India with approximately 69% share in the total production.
Production of polymers accounts for around 61% of the total production of basic major petrochemicals.

www.iasscore.in 9GEOGRAPHY | MAJOR INDUSTRIES, INDUSTRIAL BELTS & REGIONS IN INDIA
The petrochemical demand is expected to grow at 7.5% CAGR from FY 2019-23, with polymer demand growing at 8%
The agrochemicals market in India is expected to grow at 8% CAGR reaching $3.7 bn by FY22 and $4.7 bn by FY25.

www.iasscore.in10 IAS 2021 | PRELIMS SAMPOORNA | FACT FILE |
The specialty chemicals constitute 22% of total chemicals and petrochemicals market in India. As of FY18, the total market size is around $35 bn. The demand for specialty chemicals is expected to grow at 12% CAGR from FY19-22.
Six countries out of the top 10 biggest producers are Asian (China, Japan, South Korea, India, Taiwan, and Saudi Arabia), generating chemical sales of €1,886 billion – 51.5% of the world market. China’s sales levels are higher than the EU and US markets combined.
Fertilizer Industry
India is the 3 rd largest producer and consumer of fertilizers in the world.
Domestic production of urea has decreased marginally by 0.7%, and imports have increased by 9.0% during FY18. Import dependence of urea slightly increased from 18.5% in FY17 to 19.9% in FY18 while share of domestic production decreased marginally from 81.5% to 80.1% during this period. Presently India mainly imports Urea from Oman (42%), Iran (34%) and China (13%).
Diammonium Phosphate (DAP) production has risen on account of expansion of domestic capacity and easy availability of acid, which has partly substituted imports that decreased by 3.8% during FY18. India mainly imports DAP from China (45%), Saudi Arabia (31%), USA (13%) and Jordan (5%).
India meets its Potassium chloride also called as Potash or MOP requirements completely through imports from Canada (23%), Russia (22%), CIS+ Belarus (15%), Israel (15%), Jordan (11%) and Lithuania (10%). MOP imports have increased by 26.8%.
The Indian Fertilizer market is projected to reach INR 11,116 Billion by 2024, growing at a CAGR of 12.3% during 2019-2024. The demand of fertilizers in India has witnessed double digit growth rates over the past several years thanks to sustainable agriculture industry

www.iasscore.in 11GEOGRAPHY | MAJOR INDUSTRIES, INDUSTRIAL BELTS & REGIONS IN INDIA
Sugar Industry
Sugar industry is broadly distributed over two major areas of production- Uttar Pradesh, Bihar, Haryana and Punjab in the north and Maharashtra, Karnataka, Tamil Nadu and Andhra Pradesh in the south.
South India has tropical climate which is suitable for higher sucrose content giving higher yield per unit area as compared to north India.

www.iasscore.in12 IAS 2021 | PRELIMS SAMPOORNA | FACT FILE |
Rangarajan committee (2012) was set up to give recommendations on regulation of sugar industry.
India became the world’s largest sugar producer in 2018/2019, beating out Brazil for the fi rst time in 16 years. India produced 33 million metric tons of sugar. That is 19% of the world’s total sugar production of 179 million metric tons.
Indian sugar industry is the second largest agro-based industry in India after cotton textiles.
Top 5 countries: India, Brazil, European Union, Thailand and China.
Geographical Distributions
S.No State Centers
1 Uttar Pradesh
Uttar Pradesh is the leading producer of sugar. There are two distinct regions of sugar production in Uttar Pradesh.
One region consists of Gorakhpur, deoria, Basti and Gonda in eastern Uttar Pradesh.
The second region consists of Meerut, Sharanpur, Muzaffarnagar, Bijnor and Moradabad.
2 Bihar The districts of Darbhanga, Saran, Champaran and Muzaffarpur are the leading producers of sugar in Bihar.
3 Punjab Phagwara and dhuri in Punjab are the main centers of sugar production.
4 Haryana Ambala, Rohtak and Panipat.
5 Maharashtra
In peninsular India, Maharashtra is the most is the most important state where sugarcane cultivation and sugar mills are integrated in cooperative system.
Major centers of sugar production in Mahrashtra are Nasik, Pune, Sastra, Sangli, Kolhapur and Solapur.
6 Karnataka Munirabad, Shimoga and Mandya.
7 Tamil Nadu Nalikupuram, Pugulur, Coimbatore and Pandyarajpuram.
8 Andhra Pradesh
Nizamabad, Medak, west and East Godavari, Vishakapatnam and Chittoor.
9 Odisha Bargarh and Rayagada.
Sugarcane Crop
In India, Sugarcane is grown as a Kharif Crop.
It needs hot and humid climate with an average temperature of 21°C to 27°C.
75-150 cm rainfall is favorable for sugar cane cultivation.
Sugarcane can grow in any soil which can retain moisture. Ideal soil for sugarcane is deep rich loamy soil. The soil needs to be rich in nitrogen, calcium and phosphorus but neither it should be neither too acidic nor too alkaline.

www.iasscore.in 13GEOGRAPHY | MAJOR INDUSTRIES, INDUSTRIAL BELTS & REGIONS IN INDIA
Cotton Industry
Cotton Crop
Temperature: Between 21°C-30°C
Rainfall: Around 50-100 cm.
Soil Type: Well-drained black cotton soil of Deccan Plateau.
Top Cotton Producing States: Gujarat > Maharashtra >Telangana> Andhra Pradesh > Rajasthan.

www.iasscore.in14 IAS 2021 | PRELIMS SAMPOORNA | FACT FILE |
36oN
28o
32o
20o
16o
12o
8o
72oE 76o 84o 88o 92oE
8oN
12o
20o
24o
32o
36oN
96oE92o88o84o80o76o72o68oE
0 600 Km400200
PAKISTAN
NEPALBHUTAN
BANGLADESH
MYANMAR
BAY OF BENGALARABIAN SEA
SRILANKA
Andaman and Nicobar (INDIA)
OCEANINDIAN
Tropic of Cancer
Lakshadweep (INDIA)
CHINA(TIBET)
Saharanpur
MoradabadDELHI
AgraAligarh
Lucknow
KanpurGwalior
VaranasiMurshidabad
HaoraHugli
Kolkata
NagpurWardha
UjjainDewasIndore
AhmedabadRajkot
VadodaraSurat Burhanpur
JalgaonAurangabad
PuneMumbai
Porbandar
Solapur Warangal
Hyderabad
Guntur
Bellary
SangliKolhapur
HubaliDavangere
BengaluruMysore
Salem
Chennai
ThanjavurCoimbatoreMadurai
Tirunelveli Tuticorin
INDIACOTTON TEXTILE INDUSTRIES
N
India got 1 st place in the world in cotton acreage with around 126.07 lakh hectares under cotton cultivation i.e. around 37% of the World area of 336.3 lakh hectares.
Approximately 62% of India’s Cotton is produced on rain-fed areas and 38% on irrigated lands. In terms of productivity, India ranks poorly compared to USA (955 kgs/ha) & China (1764 Kgs/ha).
During 2018-19, India’s Productivity is estimated at 454.43 kg/ha.

www.iasscore.in 15GEOGRAPHY | MAJOR INDUSTRIES, INDUSTRIAL BELTS & REGIONS IN INDIA
Presently, Cotton is a freely exportable commodity from India.
India exports Cotton mainly to Bangladesh, China, Vietnam, Pakistan, Indonesia, Taiwan, Thailand etc. Even though China was the largest importer of Indian cotton fi bre till 2013-14, it became the third largest importer of Indian Cotton fi bre in 2015-16 after Pakistan and Bangladesh.
As per ICAC publication ‘Cotton This Month – August 2019”, details of major country-wise area & productivity, production, consumption, export and import are as under:
CONSUMPTION(Quantity in Million Metric Tonnes)
2015-2016 2016-2017 2017-2018 Estimate
2018-2019 Estimate
2019-2020 Estimate
World Total 24.13 24.78 26.35 26.66 26.89
China 7.60 8.28 8.50 8.45 8.25
India 5.30 5.15 5.42 5.40 5.54
USA 2.15 2.15 2.35 2.36 2.42
Pakistan 1.68 1.61 1.63 1.70 1.73
Brazil 1.32 1.41 1.66 1.69 1.74
AREA & PRODUCTIVITY (Area in Thousand Hectare & PRODUCTIVITY in Kgs/Hectare)
2017-2018 2018-2019 2019-2020 (Projected)
Area Yield Area Yield Area Yield
World Total 33,199 806 32,937 782 34,675 786
India 12,235 519 12,200 451 12,200 471
USA 4,492 1,014 4,130 968 5,059 947
China 3,350 1,758 3,367 1,794 3,300 1,794
Pakistan 2,665 674 2,682 623 2,900 679
Brazil 1,175 1,707 1,600 1,673 1,600 1,666
EXPORTS (Quantity in Million Metric Tonnes)
2015-2016 2016-2017
2017-2018 Estimate
2018-2019 Estimate
2019-2020 Estimate
World Total 7.54 8.19 9.04 9.40 9.56
USA 1.99 3.25 3.45 3.16 3.63
India 1.26 0.99 1.13 0.80 0.90
CFA Zone 0.98 0.99 1.06 1.17 1.24
www.iasscore.in16 IAS 2021 | PRELIMS SAMPOORNA | FACT FILE |
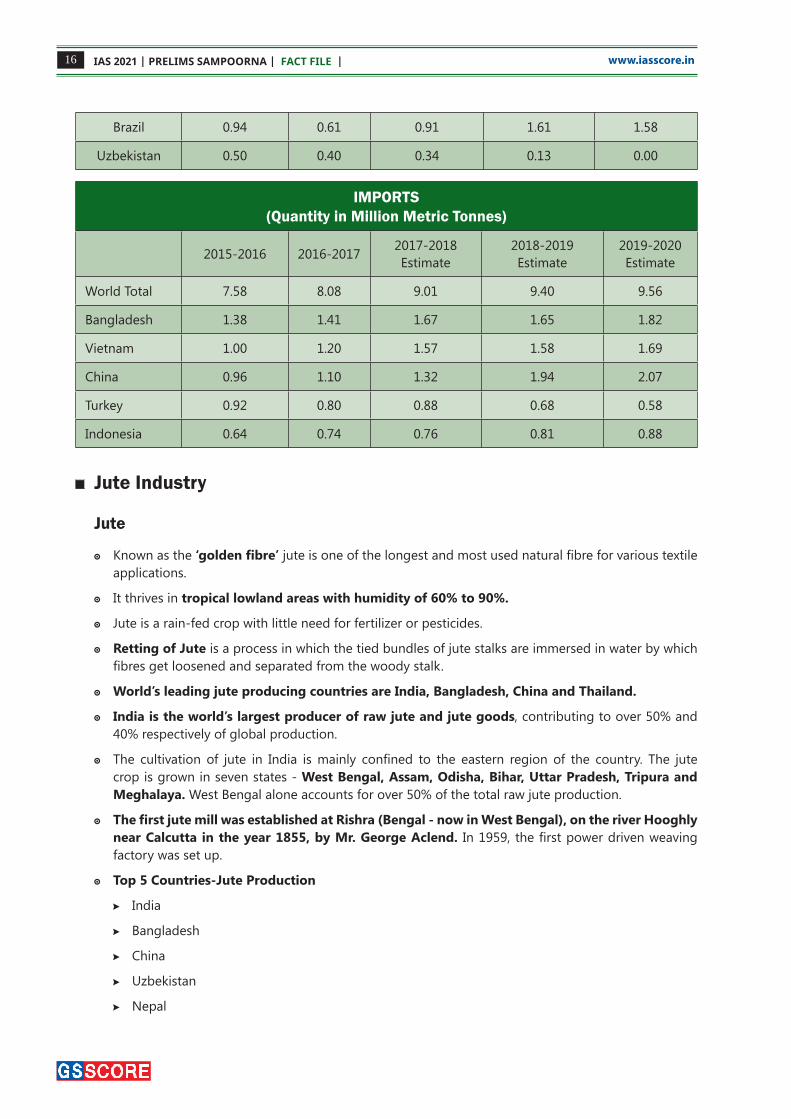
Brazil 0.94 0.61 0.91 1.61 1.58
Uzbekistan 0.50 0.40 0.34 0.13 0.00
IMPORTS(Quantity in Million Metric Tonnes)
2015-2016 2016-2017 2017-2018 Estimate
2018-2019 Estimate
2019-2020 Estimate
World Total 7.58 8.08 9.01 9.40 9.56
Bangladesh 1.38 1.41 1.67 1.65 1.82
Vietnam 1.00 1.20 1.57 1.58 1.69
China 0.96 1.10 1.32 1.94 2.07
Turkey 0.92 0.80 0.88 0.68 0.58
Indonesia 0.64 0.74 0.76 0.81 0.88
Jute Industry
Jute
Known as the ‘golden fi bre’ jute is one of the longest and most used natural fi bre for various textile applications.
It thrives in tropical lowland areas with humidity of 60% to 90%.
Jute is a rain-fed crop with little need for fertilizer or pesticides.
Retting of Jute is a process in which the tied bundles of jute stalks are immersed in water by which fi bres get loosened and separated from the woody stalk.
World’s leading jute producing countries are India, Bangladesh, China and Thailand.
India is the world’s largest producer of raw jute and jute goods , contributing to over 50% and 40% respectively of global production.
The cultivation of jute in India is mainly confi ned to the eastern region of the country. The jute crop is grown in seven states - West Bengal, Assam, Odisha, Bihar, Uttar Pradesh, Tripura and Meghalaya. West Bengal alone accounts for over 50% of the total raw jute production.
The fi rst jute mill was established at Rishra (Bengal - now in West Bengal), on the river Hooghly near Calcutta in the year 1855, by Mr. George Aclend. In 1959, the fi rst power driven weaving factory was set up.
Top 5 Countries-Jute Production
India
Bangladesh
China
Uzbekistan
Nepal

www.iasscore.in 17GEOGRAPHY | MAJOR INDUSTRIES, INDUSTRIAL BELTS & REGIONS IN INDIA
**********
