fertilizing with biosolids - osu extension catalog · potassium (k)c 0.1 0.6 anutrient...
TRANSCRIPT

PNW 508
R E VISED
F EBRUARY 2015
Fertilizing with Biosolids
A P A c i f i c N o r t h w e s t e x t e N s i o N P u b l i c At i o N
o r e g o N s tAt e u N i v e r s i t y w A s h i N g t o N s tAt e u N i v e r s i t y u N i v e r s i t y o f i d A h o
2
Dan M Sullivan Extension soil scientist Oregon State University Craig G Cogger Extension soil scientist Washington State University and Andy I Bary senior scientific assistant Washington State University
Fertilizing with BiosolidsDM Sullivan CG Cogger and AI Bary
What are biosolidsBiosolids are a product of municipal
wastewater treatment Raw sewage solids must be processed to meet US Environmental Protection Agency (USEPA) standards before they can be called biosolids Biosolids contain organic matter and nutrients that are beneficial for soil crop and livestock productivity This publication focuses on how biosolids can be used to supply nutrients for crop production
And
y I
Bary
Was
hing
ton
Stat
e U
nive
rsity
Biosolids as a nutrient sourceTable 1 shows the typical macronutrient
content of biosolids produced by Pacific Northwest wastewater treatment facilities These nutrients include both rapidly and slowly available forms Biosolids also provide plant-essential micronutrients including copper (Cu) boron (B) molybdenum (Mo) zinc (Zn) and iron (Fe)
Biosolids usually are applied at rates designed to supply crops with adequate nitrogen (N) The other nutrients they contain also reduce fertilizer requirements
For all nutrients except N soil testing can be used to monitor the change in soil fertility resulting from biosolids application A long-term monitoring plan to track soil nutrient levels over the years should use consistent sampling and analysis methods Extension publications listed in ldquoFor more informationrdquo (page 16) provide guidelines for designing a sampling and testing program
See the sidebar ldquoFertilizer replacement value of biosolidsrdquo (page 3) for more information
Table 1 Biosolids organic matter and macronutrients (dry weight basis)a
Usual range ()b
Nutrient Low HighOrganic matter 45 70Nitrogen (N) 3 8Phosphorus (P)c 15 35Sulfur (S) 06 13Calcium (Ca) 1 4Magnesium (Mg) 04 08Potassium (K)c 01 06aNutrient concentrations are expressed on a total elemental basis Not all elemental content is in a plant-available form bUsual range for freshly digested biosolids Lagooned biosolids composted biosolids and alkaline-stabilized biosolids typically have lower nutrient concentrationscPhosphorus and potassium are expressed on an elemental basis Use the following conversion factors to convert to units used for fertilizer marketing To get P2O5 (phosphate) multiply P x 229 To get K2O (potash) multiply K x 12
3
Biosolids nitrogen (N)Forms of N
Biosolids contain organic and ammonium-N nitrate-N is absent in most biosolids Ammonium-N is available to plants immediately after application Organic N provides slow-release N (Figure 1 page 4)
The proportions of ammonium and organic N in biosolids are related to the stabilization process (eg digestion composting) used at the wastewater treatment facility Liquid anaerobically digested biosolids often contain more ammonium-N than organic N In biosolids
produced by anaerobic digestion and dewatering (the most common product offered to farmers) about 80 percent of total N is in the organic form with the remainder present as ammonium-N Heat-dried biosolids contain more than 90 percent organic N and a trace of ammonium-N
Plant-available NCalculating biosolids application rates based on N
A companion publication PNW 511-E Worksheet for Calculating Biosolids Application Rates in Agriculture provides a step-by-step process for calculating application rates that supply crops with adequate available N The worksheet estimates ammonium-N retained and
Fertilizer replacement value of biosolidsTable 2 estimates the fertilizer replacement value of
anaerobically digested biosolids N P K and S for the first year after application This estimate is based on typical biosolids analyses and estimates of nutrient availability from university field trials
With the exception of N the fertilizer replacement value for nutrients depends on existing soil test values and the cropping system Typically a biosolids application to meet crop N requirements eliminates the need for annual P and S applications
The fertilizer replacement values shown in Table 2 do not include the potential benefits to soil quality from
biosolids Soil quality benefits are difficult to express in simple economic terms and are unique to every location (see page 10)
To convert percentages given for P and K in Table 2 to units used in fertilizer marketing use the following conversion factors
bull To get P205 multiply P by 229
bull To get K2O multiply K by 12
For example biosolids with 25 percent P and 03 percent K contain 57 percent P2O5 (phosphate) and 036 percent K2O (potash)
Table 2 Approximate first-year fertilizer replacement value of anaerobically digested biosolids Biosolids nutrient content and value
Nutrient Expressed asTotal nutrient
( dry wt)
Available nutrient
( of total nutrient)a
Nutrient value ($lb)b
Fertilizer replacement value of biosolids nutrient
($dry ton)Nitrogen N 50 35 057 1995 Phosphorus P 25 40 109 2180 Potassium K 03 100 069 414 Sulfur S 10 35 038 266 Total mdash mdash mdash mdash 4855 aEstimated plant-available nutrient released in the first year after biosolids application based on Pacific Northwest field research by Washington State University and Oregon State University bBased on 5-year average national inorganic fertilizer prices (2009ndash2013) compiled by USDA Economics Research Service urea ($521ton) diammonium phosphate ($643ton) potassium chloride ($641ton) and ammonium sulfate ($421ton) The actual cost of a pound of nutrient from inorganic fertilizer varies depending on nutrient form and analysis transportation charges market conditions and the quantity purchased Cost of fertilizer application is not included
4
organic N mineralized from different types of biosolids It uses the following general equation to forecast plant-available N release from biosolids
a (ammonium-N in biosolids) + b (organic N in biosolids) + c (organic N from previous biosolids applications)
wherea = fraction of ammonium-N retained after application
b = fraction of organic N mineralized during the first growing season
c = fraction of organic N mineralized from previous biosolids applications on the same field
Ammonium N retained after applicationWhen biosolids are surface applied (not tilled
or injected into soil at application) a portion of
the biosolids ammonium-N is lost as ammonia gas Ammonia loss is very rapid during the first hours after application
Tillage or sprinkler irrigation with clean water immediately following biosolids application increases ammonium-N retention in soil However tillage or immediate irrigation is not feasible or desirable in many cropping situations
When biosolids are not incorporated ammonium-N retention is greater for liquid biosolids than for dewatered cake biosolids With liquid biosolids some of the ammonium-N infiltrates below the soil surface thereby reducing ammonia loss
Figure 1 Nitrogen cycling Forms and pathways following biosolids application Biosolids contain both organic-N and ammonium-N If biosolids are not immediately incorporated by tillage some of the applied ammonium-N is lost as ammonia to the atmosphere In the soil ammonium-N is rapidly converted to nitrate-N by soil microbial activity (indicated by dashed arrows) Both ammonium-N and nitrate-N can be used by crops Nitrate-N can be lost to the atmosphere through denitrification or to groundwater via leaching Nitrogen loss can be minimized by matching the biosolids application rate to crop N need Organic N must be converted to ammonium-N by microbial activity before plants can use it Figure by Dan Sullivan
5
Organic N mineralized during the first growing season after application
Following field application organic N in biosolids is converted to plant-available forms (ammonium and nitrate) by soil microorganisms through a process known as mineralization The biosolids treatment process affects the organic N mineralization rate after land application Freshly digested biosolids usually contain more mineralizable N than do biosolids produced with more intensive stabilization processes (composting or long-term lagoon storage)
The organic N mineralization rate also is affected by soil temperature and moisture conditions Mineralization is most rapid when soil is moist and warm (above 60degF) When biosolids are applied to dry soil and not incorporated by tillage N mineralization is delayed until moisture is present
Mineralization proceeds most rapidly immediately after biosolids application provided soil temperature and moisture are favorable Usually more than half of first-year N
mineralization occurs within the first 3 to 6 weeks following biosolids applicationOrganic N mineralized from previous biosolids applications
The organic N not mineralized during the first year after application is mineralized slowly in succeeding years Thus when biosolids are applied repeatedly to the same site the annual application rate needed to meet crop needs is reduced (Figure 2)
Field trials have demonstrated that crop N fertilizer requirements are reduced for several years following biosolids application For example
bull In dryland cropping systems in the 10- to 14-inch precipitation zone in central Washington the amount of N fertilizer needed to attain maximum yield was reduced from approximately 60 lb Na to 20 lb Na for the second crop following an agronomic biosolids application (3 dry tona)
bull In western Washington N fertilizer needs for a cool-season grass forage (tall fescue) were reduced by about 60 lb Na during the second year following a one-time application of biosolids at 4 dry tona
The worksheet used for estimating agronomic application rates of biosolids (PNW 511-E) explains how to estimate credits for N mineralized from biosolids applied in previous years Building soil organic matter
Biosolids N is cycled through soil organisms and crops This process allows some of the applied biosolids N to remain in the field for 5 or more years (Figure 2) An increase of 01 percent in soil organic matter (eg from 30 to 31 percent) represents an increase in soil N of about 100 lb Na (0- to 6-inch depth)
Biosolids phosphorus (P)Biosolids supply large quantities of P when
applied to meet crop N needs The P supplied by biosolids can provide a long-term benefit to soil fertility when applied to P-deficient soils Where P is already high however increasing soil P can increase the potential for P loss from the field to surface water
Figure 2 Conceptual illustration of biosolids N cycling over the long term when biosolids are applied annually Repeated biosolids applications to the same field increase both plant-available N (purple bars) and residual soil N (yellow bars) The residual N is stored in the soil in organic matter Each year after application a small fraction of the residual N is mineralized to plant-available forms
The bars show relative year-to year effects and are not meant for quantitative interpretation See Extension publication PNW 511-E for guidance in calculating agronomic application rates
Figure by Dan Sullivan Adapted from D Beegle (unpublished) Penn State University
6
Controlling P loss to sensitive water bodies is an important environmental issue Algae blooms in surface waters can be triggered by P inputs Algae blooms can reduce water clarity create unpleasant swimming conditions and odors interfere with boating and fishing and harm fish or other aquatic life Phosphorus-induced algae blooms occasionally produce substances toxic to humans and livestock
Agronomic soil tests for P were created to determine the probability of increased crop yield in response to P fertilizer application These same test methods are now used to assess the risk of P movement from agricultural fields to nearby surface water bodies Generally speaking the risk of P loss to nearby water bodies is low to medium at soil test P levels considered near the optimum for crop production (Figure 3) High agronomic soil test P values correspond with higher risk of P loss to nearby surface water
Two soil test methods are routinely used to determine soil test P in the Pacific Northwest the Bray P1 test for acid soils west of the Cascades and the Olsen (bicarbonate) test for neutral or alkaline soils east of the Cascades Agronomic interpretations of these soil tests are given in Table 3
When P soil test values are low to medium (Bray P1 test below 40 ppm Olsen P test below 25 ppm) a biosolids application is likely to correct soil P deficiency and increase crop yield (Figure 3) When soil test values are in the high or excessive range biosolids P is unlikely to benefit crop production and may increase the risk of P loss to nearby water bodies at sensitive locations
It is important to keep in mind that soil test P is only one of many factors that affect
Table 3 Summary of P fertilizer recommendations from OSU fertilizer guides
Soil test category
West of Cascades Bray P1 test
(ppm)
East of Cascades Olsen P test
(ppm) Is P fertilizer recommendedLow below 20 below 10 Yes for most cropsMedium 20 to 40 10 to 25 Yes for some cropsHigh 40 to 100 25 to 50 Only starter P fertilizer for a few cropsExcessive above 100 above 50 NoAdapted from Horneck et al Soil Test Interpretation Guide (2011)
Figure 3 Agronomic and environmental interpretations of soil test P Agronomic soil test P is used as an indicator of the likely benefit to crop production from P application A soil P test can also assess the relative risk of P loss to nearby surface water bodies As soil test P rises above the level needed for optimal crop production the risk of P loss in runoff increases Keep in mind that soil test P is but one of many site factors used to forecast overall risk of P loss from a field to nearby water bodies Figure by Dan Sullivan Adapted from Agricultural Phosphorus and Eutrophication ARS-149 (2003)
a fieldrsquos overall risk of P loss to water The USDA Natural Resources Conservation Service (NRCS) Phosphorus Index uses P soil test values together with other site and management factors to evaluate this risk Field distance to a water body and soil erosion risk are usually the most important factors that determine field susceptibility to P loss
Biosolids P versus fertilizer PCompared to inorganic P fertilizers a smaller
fraction of the total P in biosolids is plant-available Research in the Pacific Northwest has demonstrated that plant-available P is typically 20 to 60 percent of total biosolids P
7
The example below shows how to estimate plant-available P per dry ton of biosolids to obtain a rough estimate of P fertilizer replacement value
Question How much P fertilizer (P2O5) can be replaced by a dry ton of biosolids when total biosolids P is 2 percent and plant-available P is estimated at 40 percent of total P
Equation ( total P in biosolids x 2000 lbton) x plant-available P x 229 conversion factor
Answer (002 x 2000) x 04 x 229 = 37 lb P2O5dry ton of biosolids
Chemical characterization of a particular biosolids product can provide a more accurate representation of P availability See the Appendix for details
Biosolids potassium (K)Biosolids contain only a small amount of
K relative to other macronutrients In most situations the contribution of biosolids to soil K fertility is insignificant The lack of K in biosolids can have crop management implications in a few situations
bull When soil K is deficient K must be supplied from fertilizer or another source Agronomic soil testing is used to forecast the need for K fertilizer application Consult university fertilizer or nutrient management guides for crop-specific interpretation of soil test K values
bull Fertilizers that are low in K such as biosolids can be beneficial for some ornamental crops that are very sensitive to soluble salts or excess K Examples include rhododendrons and azaleas
bull Potassium can accumulate in plant tissue when plants are grown on soils that are high in K High concentrations of K in grass or legume forages can exacerbate animal nutritional disorders (such as grass tetany disorder in cattle) Biosolids are a low-K fertilizer alternative for forage production on soils that contain excessive K (see the sidebar ldquoFertilizing grass for foragerdquo)
Biosolids sulfur (S)Biosolids application rates designed to supply
adequate N provide sufficient S even for crops that have a high S demand (eg canola) Biosolids supply both rapidly available S (from oxidation of sulfides) and slow-release S (from decomposition of biosolids organic matter) Approximately 15 to 40 percent of biosolids S is oxidized to the plant-available form (sulfate-S) during the first year after biosolids application
For more information about using biosolids to meet fertilizer needs see ldquoUsing university fertilizer guides with biosolids applicationrdquo page 8
SaltsBiosolids contain lower concentrations of
salts than most animal manures Most of the salts present in wastewater are discharged from treatment facilities in treated water Liquid biosolids contribute higher amounts of salt than biosolids that are processed to reduce moisture content After application to soil some salts are released from biosolids by decomposition of organic matter
Repeated biosolids applications have not resulted in detrimental salt accumulations in soil
Fertilizing grass for forageHigh-quality grass hay or grass silage can be
produced with biosolids Because biosolids supply both N and S (key nutrients in protein) biosolids application is particularly effective in increasing forage protein Livestock managers may need to adjust grazing management or animal diets (by adding appropriate salts or other supplements) to take advantage of the high-protein forage
When similar amounts of available N are supplied via biosolids or fertilizer N the biosolids-fertilized forage usually has higher P and S content Unlike most dairy and poultry manures biosolids are low in K and generally do not increase forage K Biosolids-fertilized forage is often higher in micronutrients such as Cu Zn and Mn Typical micronutrient concentrations in biosolids-fertilized grasses are far below levels considered detrimental to animal performance
8
even at sites with low annual precipitation and no irrigation
Example Dewatered cake biosolids (80 percent moisture) have been applied annually for more than 10 years to dryland pastures near Hermiston OR (6-inch annual precipitation) At this site electrical conductivity (a measure of soluble salts in soil) has not increased above 1 mmhocm a value considered low (see OSU Extension publication EC 1478 Soil Test Interpretation Guide)
Using university fertilizer guides with biosolids applicationNutrient management practices for biosolids can
differ from recommendations found in university fertilizernutrient management guides Because biosolids nutrient management is more complex than commercial fertilizer management it may be helpful to consult a certified soil scientist or other agricultural professional specializing in nutrient management planning and monitoring
This sidebar presents examples of special considerations for biosolids application
NitrogenAgronomic application rates for biosolids (calculated
using PNW 511-E) are designed to replace fertilizer N PNW 511-E estimates crop N need using university fertilizer or nutrient management guides However subtle differences in management between soluble N fertilizers and biosolids can be important
Example 1 The OSU fertilizer guide for western Oregon pastures recommends application of N in fall and early spring Research demonstrates that a single application of biosolids in late summer or fall can substitute for both fall and spring pasture fertilization with commercial N fertilizer
Example 2 Fertilizer guides are not available for all crops and some fertilizer guides do not reflect current management practices In such cases the regulatory agency typically consults with agronomists or university faculty regarding initial biosolids application rates and requires soil andor plant tissue testing to confirm that N supplied is not excessive This approach was used to determine biosolids application rates for dryland pastures in eastern Oregon near Hermiston a setting for which a fertilizer guide was not available
Phosphorus Biosolids P is less plant-available than is P from
commercial fertilizer Biosolids P has a typical fertilizer replacement value of 40 percent but this estimate
varies considerably among biosolids sources Keep in mind the lower availability of biosolids P when using university fertilizer guides See also pages 18ndash19
Note the following situations in which biosolids P application recommendations may differ from those found in fertilizer guides
Example 1 Sometimes biosolids application is justified where soil test P is high or excessive situations in which fertilizer guides would recommend no P application This situation can occur where other benefits (nutrient supply and improved soil quality) are expected from biosolids application the field is not close to a water body and the P is unlikely to damage water quality This scenario is common in dryland cropping systems east of the Cascades
Example 2 Fertilizernutrient management guide recommendations for P fertilizer application are based on the probability of obtaining a profitable crop response to P fertilizer application Recommendations are for a single growing season
Biosolids application is often practical only once per crop rotation (every 3 to 6 years) When biosolids are applied infrequently some of the P not used by the initial crop will remain in the soil and meet needs of other crops in the rotation Soil testing every 3 to 5 years is usually the best way to assess cumulative effects of biosolids P application
To get meaningful soil test P data sampling and testing protocols must be consistent Always sample to the same soil depth and avoid including crop residues present on the soil surface in the soil sample Additional soil sampling considerations are described in publications listed under ldquoFor more informationrdquo on page 16 Agricultural soil testing laboratories that meet professional standards are listed on the North American Proficiency Testing Proficiency Analysis Program (NAPT-PAP) website (httpwwwnaptprogram orgpap)
Figure 4 Dewatered biosolids contain less salt than do liquid biosolids
And
y I
Bary
Was
hing
ton
Stat
e U
nive
rsity
9
Soil pHMaintaining an appropriate soil pH is essential
for continued productivity of cropping systems Biosolids application can increase or decrease soil pH depending primarily on whether alkaline materials are used in biosolids processing (Table 4)
Alkaline-stabilized biosolidsSome biosolids are stabilized with alkaline
materials (calcium oxide or calcium hydroxide) to reduce odors and meet USEPA pathogen reduction requirements In a typical alkaline stabilization process the biosolidsalkaline material mixture reaches a pH of 12 or greater for at least 2 hours At this high pH ammonia loss is rapid
After land application the residual alkaline material rapidly neutralizes soil acidity thereby increasing soil pH (the first process in Table 4) Thus alkaline-stabilized biosolids act as a replacement for agricultural limestone Alkaline-stabilized biosolids sometimes contain 20 to 40 percent lime (equivalent to 02 to 04 ton of agricultural lime per dry ton of biosolids) The extent of the increase in soil pH and exchangeable soil Ca following biosolids application can be used to determine the liming value of a biosolidsalkaline materials application
It is important to consider current soil pH and the crops that might be grown in rotation before applying alkaline-stabilized biosolids Increasing soil pH may not be beneficial for acid-loving crops such as blueberries and some nursery crops (rhododendrons and maples)
East of the Cascades take care when applying alkaline-stabilized biosolids to high-pH soils (pH above 7) In high-pH soils the nutrients in
Table 4 Biosolids effects on soil pH Type of biosolids Biosolids input Effect on soil pH Soil process descriptionAlkaline-stabilized Ca oxides and hydroxides Increase Convert soil acidity to water and carbon dioxideAll Soluble salts Temporary decrease Cations displace acidity from soil clay and organic matter
bringing it into soil solutionAll Organic N and S Decrease Conversion in soil to nitrate and sulfate produces acidityAll Exchangeable Ca and Mg Increase Supply nonacidifying cations
alkaline-stabilized biosolids can be beneficial but the added lime is not
Biosolids stabilized without alkaline materialsFollowing application of biosolids that do not
contain added alkaline materials the change in soil pH is the net result of the last three factors listed in Table 4 Shortly after application a drop in soil pH (acidification) may be observed usually 02 to 05 pH unit This pH decrease is caused by the addition of soluble salts and by the oxidation of organic N and S compounds This pH drop usually is short lived and is balanced by the Ca and Mg added by biosolids
In most situations biosolids application does not have a major effect on the need for liming or S application to adjust soil pH Long-term field trials (over 10 years) in the Pacific Northwest have demonstrated that soil pH values were similar (within 02 to 04 pH unit) when crops were fertilized with dewatered anaerobically digested biosolids or with commercial N fertilizers In a 5-year trial on a silt loam soil in Oregon biosolids compost acidified soil by 05 pH unit (compared to a no-compost control) In contrast yard debris
Figure 5 The type of stabilization process used at a biosolids treatment plant is a factor in how biosolids application will affect soil pH
Dan
M S
ulliv
an copy
Ore
gon
Stat
e U
nive
rsity
10
compost increased soil pH by 03 unit versus the no-compost control
Because several factors are involved in determining how biosolids application will affect soil pH monitoring of soil pH is recommended Monitor the long-term effects of biosolids application on soil pH with soil testing every 3 to 5 years
Soil qualityBiosolids application also affects soil chemical
physical and biological properties Together these properties determine soil quality Biosolids supply both nutrients and organic matter for soil quality improvement The changes in soil quality accompanying biosolids application generally improve the capacity of crops to utilize nutrients Potential benefits of biosolids application on soil quality are listed in Table 5
The organic matter provided by a single biosolids application does not by itself increase soil organic matter a great deal However when combined with other soil management practices that favor accumulation of organic matter (eg reduced tillage and use of cover crops) biosolids application helps improve soil quality
When biosolids are applied at a site for many years they can directly increase soil organic matter For example
bull In a dryland wheat-fallow rotation in Douglas County WA experimental plots were treated with agronomic rates of biosolids (3 dry tona every 4 years from 1994 through 2010 for a total of 15 dry tons) Of total biosolids carbon applied 60 percent was stored in soil organic matter
Table 5 Ways in which biosolids can improve soil quality Physical bull Greater water-holding capacity
bull Improved tilthbull Reduced soil erosion
Chemical and biological
bull Increased cation exchange capacitybull Slow release of plant-available N and S from
organic forms bull Correction of micronutrient deficienciesbull Increased earthworm and microbial activity
Biosolids effects on soil quality
The most dramatic improvements in site productivity are observed when biosolids are applied to land that is severely eroded or affected by excess sodium For example
bull Agronomic applications of biosolids have been successful in stabilizing sandy ldquoblow-outrdquo areas (small sand dunes) in dryland pastures near Hermiston OR Before biosolids application revegetation of the blow-outs had not occurred for more than 45 years following range fires Vegetation establishment accompanying biosolids application was likely due to several positive effects of biosolids on soil quality increased aggregation of soil at the surface improved soil nutrient status and greater water-holding capacity
bull In a replicated field trial WSU scientists demonstrated that high rates (30 tona) of aged lagoon biosolids improved wheat establishment on a sodic (sodium-affected) soil The untreated soil had an exchangeable sodium percentage of 40 percent and pH above 95 No vegetation was present Soil that was amended with both biosolids and gypsum had better wheat growth than soil treated with gypsum alone Biosolids increased soil organic matter and improved soil aggregation in samples taken 18 months after application Plant response was dramatic even though changes in soil test values for pH exchangeable sodium compaction and water infiltration were small
bull In a 3-year trial on a field with exposed subsoil at WSU-Prosser (Yakima Valley) biosolids fertilization increased corn grain yield by 10 percent over that attained with commercial N fertilizer In this trial some of the yield increase with biosolids was associated with correction of Zn deficiency
Because most of the nutrients provided by biosolids remain near the soil surface biosolids application may increase growth of some weedy species For example east of the Cascades cheatgrass (Bromus tectorum) growth is stimulated by biosolids application On dryland pastures where cheatgrass can be grazed effectively in early spring the increase in cheatgrass growth is an asset to beef production In dryland wheat cropping systems where cheatgrass is present biosolids application may increase cheatgrass competition with the crop
11
The addition of biosolids increased soil organic matter (measured in 2012) from 16 to 29 percent in the 0- to 4-inch soil depth This result was seen in a conventionally tilled system that did not favor organic matter preservation
bull Biosolids were applied at an agronomic rate (6 dry tonayear) to the surface of a cool-season perennial grass crop at WSU-Puyallup for 10 consecutive years The result was a long-term increase in soil organic matter Nine years after the final biosolids application organic matter in the 0- to 6-inch depth was 48 percent in the plots that received biosolids compared to 39 percent in plots that received inorganic N fertilizer
A smaller but significant long-term increase in organic matter occurred in the 6- to 12-inch depth The increase in organic matter below the surface layer was likely due to the action of earthworms and increased root growth because the site was not tilled The amount of carbon stored in the soil following biosolids application was equivalent to 27 percent of the biosolids carbon applied
Biosolids that are composted or aged for many years in treatment lagoons can be applied at high rates supplying large quantities of organic matter These biosolids are suited for high-rate applications because they usually contain very low amounts of plant-available N (3 to 5 lbdry ton) relative to biosolids produced via short-term aerobic or anaerobic digestion (more than 30 lb available Ndry ton)
See the sidebar ldquoBiosolids effects on soil qualityrdquo (page 10) for more information
Biosolids quality Biosolids quality is based on the followingbull Trace element concentrations in biosolidsbull The completeness of the pathogen reduction
process used by the wastewater treatment facility
bull Organic matter stabilization achieved by digestion composting or other processes
at the wastewater treatment facility Stabilization called ldquovector attraction reductionrdquo in USEPA biosolids rules is important for reducing odors and making biosolids less attractive to pests such as insects and rodents
Together these quality factors determine whether site approvals by a regulatory agency are required for biosolids application
What about heavy metalsHeavy metals were a concern when land
application of biosolids began in the 1970s However since then source control activities have been very effective in decreasing metal inputs to wastewater treatment facilities
bull Wastewater treatment facilities limit metals in incoming wastewater by issuing permits to industrial wastewater sources To meet permit requirements industries adopt cleaner manufacturing processes or pretreat wastewater to remove metals Industrial sources are required to routinely monitor for specific metals in their wastewater
bull Adjustment of city water supplies to a higher pH has reduced pipe corrosion and the concentrations of Zn Cu and Fe in wastewater
bull The use of PVC pipe instead of metal pipe also has reduced metal concentrations
Metals in Portland biosolids have been reduced by a factor of 2 to 10 since 1981 (Table 6) Today biosolids metal concentrations are similar for cities with industrial inputs (Portland Table 6) and smaller cities with few industrial inputs (Oregon average Table 7 page 12)
Table 6 Metal concentrations in Portland biosolidsMetal concentration
(mgkg)a
Metal 1981 1996 2005 2013Cadmium 40 5 3 3Copper 1000 481 384 374Lead 900 181 108 85Nickel 190 39 49 50Zinc 2200 834 921 1165a1981 concentrations are approximate values Data for 1996ndash2013 were derived from City of Portland biosolids management reports to Oregon DEQ
12
Trace elementsThe federal rule administered by USEPA sets
thresholds for trace element concentration in biosolids Some of the regulated elements are plant nutrients (Cu Mo and Zn) so in some situations plants benefit from trace element application
There are two sets of trace element concentration thresholds ceiling concentration limits (the maximum allowed) and a more stringent set exceptional quality (EQ) limits Sewage solids that exceed the ceiling concentration limits cannot be called biosolids and cannot be land applied University research conducted for many years at many sites supports these limits The EQ limits are for biosolids products distributed directly to the public
Table 7 shows the USEPA ceiling concentration limit and EQ limit for various trace elements in biosolids as well as Oregon and national averages for these elements
See the sidebar ldquoWhat about heavy metalsrdquo page 11 for more information
Pathogen reductionPathogens are organisms such as bacteria that
can cause disease Before application to cropland biosolids must be processed to meet either USEPA Class A or Class B pathogen reduction standards for pathogens that can cause disease in humans
Table 7 Trace elements in biosolids USEPA concentration limits and average concentrations
Trace element
USEPA ceiling concentration limit
(mgkg)a
USEPA exceptional quality limit
(mgkg)a
USEPA National Survey (2010)
(mgkg)b
Oregon biosolids average (2011)
(mgkg)c
Arsenic 75 41 7 5Cadmium 85 39 3 2Copper 4300 1500 558 296Lead 840 300 77 36Mercury 57 17 12 10Molybdenum 75 75d 16 8Nickel 420 420 49 31Selenium 100 100 7 6Zinc 7500 2800 994 719aSource USEPA Guidelines for Pollutant Concentrations in Biosolids (40 CFR Part 503) The ceiling concentration limit is the maximum allowed for land application of biosolids The exceptional quality limit applies to biosolids suitable for distribution without site approvals To be called ldquoexceptional quality biosolidsrdquo by USEPA biosolids must also be Class A for pathogen reduction bSource Brobst USEPA Targeted National Sewage Sludge Survey summary for trace elements (2010)cAverage across the 17 largest Oregon municipal wastewater treatment facilities as reported to Oregon DEQ for 2011 Source R Doughten Oregon DEQdThe USEPA exceptional quality limit for Mo is currently under review
Class A biosolids are essentially pathogen-free and usually are sold or distributed in urban areas for landscaping or turf fertilization See the sidebar on page 13 ldquoUsing biosolids in gardens and landscapesrdquo for more information Because of the greater flexibility in management afforded by Class A treatment many facilities are moving toward Class A biosolids production
Class B biosolids have been processed to significantly reduce but not eliminate pathogens Biosolids of Class B quality usually are delivered to farmers for land application The most common processing methods for Class B biosolids are
Figure 6 Class A biosolids are essentially pathogen-free and may be used for landscape and turf fertilization
Crai
g G
Cog
ger
Was
hing
ton
Stat
e U
nive
rsity
13
aerobic or anaerobic digestion Some treatment facilities add alkaline materials such as calcium hydroxide to kill pathogens and meet Class B standards
After land application pathogens in Class B biosolids are killed by exposure to sunlight drying conditions unfavorable pH and other environmental factors Site management practices required at Class B biosolids application sites including setbacks and access restrictions protect public health
Organic matter stabilizationBoth Class A and Class B biosolids must meet
stabilization standards to reduce odors and to reduce attractiveness to insects and rodents
Site approvals for biosolids applicationIs site approval needed
Whether you need a permit or site approval for biosolids application to cropland depends on the following
bull Trace element concentrations in the biosolids relative to USEPA standards
bull Whether the biosolids meet USEPA Class A or Class B pathogen reduction requirements
Site approvals are required for all Class B biosolids application regardless of trace element concentrations in the biosolids
Site approvals may be required for Class A biosolids application if trace element concentra-tions exceed exceptional quality (EQ) limits or if the biosolids are not stabilized sufficiently via digestion or composting See ldquoBiosolids qualityrdquo for details on these regulatory requirements
Who obtains site approvalWhen needed site approvals for biosolids
application generally are obtained by wastewater treatment facility representatives Some private companies working under contract with a wastewater treatment facility may assist in obtaining site approval
Using biosolids in gardens and landscapes
Biosolids that meet Class A pathogen reduction and EQ trace element standards can be used in gardens and landscapes Three types of Class A biosolids are produced and marketed for garden and landscape use heat-dried products biosolids composts and Class A blends
Heat-dried biosolids have similar nutrient concentrations and availability as Class B cake used in agriculture except that the ammonium is lost during drying Heat-dried biosolids are applied at agronomic rates for lawn and garden fertilization
Biosolids composts are made from biosolids composted with yard debris or wood waste They have low N availability similar to other composts and are applied at high rates to quickly build soil organic matter
Class A blends contain Class A dewatered cake mixed with other organic and mineral materials such as sawdust aged bark or screened sand Class A blends have a variety of uses depending on the composition of the blend Different blends are used as top-dressing for lawns potting mixes soil builders and raised bed amendments or as manufactured topsoil
Figure 7 Research has shown the benefits of biosolids application for many landscape plants Top Soil amended with biosolids Bottom No biosolids application
Dan
M S
ulliv
an copy
Ore
gon
Stat
e U
nive
rsity
14
What agency supervises site approvals for biosolids application sites
Oregon Department of Environmental QualityWashington Washington State Department of
EcologyIdaho Department of Environmental QualityAll state agencies use a site approval process
that conforms with USEPA rules Detailed information on site approval processes can be found on state agency websites
Questions about biosolidsWhat limits the rate of biosolids that can be applied
Agronomic application rates are based on matching plant-available N supplied by biosolids to the plant-available N needs of the crop How are biosolids odors managed
The same processes that kill pathogens in biosolids (eg digestion) reduce odor after application The processing method used affects odor potential Biosolids that are dewatered with centrifuges are more likely to cause odor problems than biosolids from belt filter presses When lime is used for stabilization the organic matter in biosolids is usually not fully digested and is more likely to cause odor Biosolids dried to below 40 percent moisture are less odiferous
Tillage after biosolids application further reduces odor but tillage is not practical when biosolids are applied to established perennial crops such as grass pastures
Minimizing odor should be a primary consideration in choosing fields for biosolids
application the timing and method of application and the location of biosolids deliverystorage on the farm Most odor complaints arise on days with air inversions that trap the odiferous air near ground level How much time is required for biosolids application relative to conventional inorganic fertilizer application
Biosolids application is much slower than conventional fertilizer application because of the large quantities of material involved Several weeks may be required to complete application to large fields For this reason perennial grass pastures are one of the most common application sites Dryland wheat grown on a wheat-fallow rotation (crop planted every 2 years) offers a good opportunity for biosolids application during the fallow year Annual crops can be fertilized with biosolids but careful scheduling is required If biosolids are a valuable resource why are they provided at no charge to the landowner
Not all biosolids are free Some municipalities charge a transportation fee an application fee or a fee equal to the N value of the biosolids Municipalities that produce Class A biosolids for gardens and landscapes often sell their products to the public and can gain significant cost recovery
In some cases biosolids application to agricultural crops is free which compensates landowners for their time and effort Often field operations must be scheduled to accommodate biosolids application and management practices specified by the regulatory agency must be followed after application Can biosolids be used on farms that produce crops under organic certification
Under USDA National Organic Program (NOP) rules biosolids application is prohibited This prohibition is based on produce marketing considerations not on a scientific risk assessment
In terms of the risk of human pathogen infection Class A biosolids are likely to be safer than manure processed under NOP rules Treatment facilities producing Class A biosolids are required to demonstrate that their treatment process meets prescribed time and temperature standards They are also required to monitor biosolids products for human pathogen indicator Figure 8 Crop needs for plant-available N are used to
determine agronomic application rates of biosolids
And
y I
Bary
Was
hing
ton
Stat
e U
nive
rsity
15
organisms such as Salmonella In contrast under NOP rules requirements for documentation of temperatures achieved during composting are less stringent and composted manure does not have to be tested for the presence of human pathogen indicator organisms before use on organically certified cropsShould I be concerned about contaminants in biosolids that are not addressed under federal and state biosolids rules
Wastewater contains a variety of synthetic organic compounds and research on the effects of these compounds is ongoing Recent research has focused on personal care products (pharmaceuticals cosmetics etc) and fire retardants Research indicates that risks to human health and the environment from these compounds are negligible when biosolids are managed according to state and federal rules These compounds are unlikely to endanger human health or the environment for three reasons
bull Synthetic organic compounds that survive wastewater treatment are degraded or strongly bound to organic matter in soil
bull Plant roots do not take up significant amounts of these compounds
bull Site management practices for biosolids (such as buffer zones and restrictions on application timing) reduce the opportunity for these compounds to move to water bodies
How do biosolids utilization practices affect greenhouse gas emissions
Analyses of the energy impacts of biosolids utilization practices are now a part of engineering analyses performed when wastewater treatment facilities are upgraded These analyses consider overall greenhouse gas emissions resulting from biosolids processing and utilization
Land application of biosolids almost always results in lower greenhouse gas emissions than competing practices (burning biosolids or burying them in a landfill) Land application of biosolids puts carbon into the soil for an extended period
When biosolids replace commercial fertilizers derived from fossil fuels they reduce greenhouse gas emissions It takes the equivalent of about 3000 cubic feet of natural gas to manufacture a ton of commercial fertilizer N1
Stabilizing biosolids with lime uses a lot of energy Limestone (calcium carbonate) is mined transported and processed to make the ldquoquick limerdquo used to kill pathogens in biosolids products Heat-drying biosolids also uses considerable energy
Transportation of biosolids to field application sites consumes energy although transportation emissions are small compared with emissions savings from replacing inorganic fertilizer with biosolids Nonetheless finding ways to utilize biosolids close to urban centers will further increase emissions savings1Sawyer John E Mark Hanna and Dana Petersen 2010 Energy Conservation in Corn Nitrogen Fertilization Iowa State University Extension publication PM 2089i httpsstoreextensioniastateeduProductpm2089i-pdf
16
Biosolids benefits contaminant risk and regulationsAmerican Society for Microbiology 2011 Land
Application of Organic Residuals Public Health Threat or Environmental Benefit httpwwwasmorgindexphpcomponentcontentarticleid=7489biorep8-2011
Brobst RB 2010 USEPA Targeted National Sewage Sludge Survey summary for trace elements Presented at W2170 Multistate Workgroup Annual Meeting June 6ndash7 Chicago IL
Evanylo GK 2009 Agricultural Land Application of Biosolids in Virginia Risks and Concerns Publication 452-304 Virginia Cooperative Extension
Jacobs LW and DS McCreary 2001 Utilizing Biosolids on Agricultural Land Bulletin E-2781 Michigan State University Extension httpfieldcropmsueduuploadsdocumentsE2781pdf
Stehouwer R 1999 Land Application of Sewage Sludge in Pennsylvania Biosolids Quality Penn State University Cooperative Extension httpextensionpsueducmegfactsbiosolids-qualitypdf
Stehouwer R 2003 Land Application of Sewage Sludge in Pennsylvania Effects of Biosolids on Soil and Crop Quality Penn State University Cooperative Extension httpextensionpsueducmegfactsbiosolids-and-soil-qualitypdf
USEPA 1994 A Plain English Guide to the EPA Part 503 Biosolids Rule EPA832R-93003 httpwaterepagovscitechwastetechbiosolids503pe_indexcfm
For more informationAgronomic rate worksheetCogger CG and DM Sullivan 2007 Worksheet
for Calculating Biosolids Application Rates in Agriculture PNW 511 Washington State University Cooperative Extension httpcrucahewsueduCEPublicationspnw0511epnw0511epdf
Excel worksheet with calculations from PNW 511 is available via the WSU-Puyallup website httppuyallupwsuedusoilmgmtBiosolidshtml
Soil sampling and testingHorneck DA DM Sullivan JS Owen and
JM Hart Revised 2011 Soil Test Interpretation Guide EC 1478 Oregon State University Extension Service httpscatalogextensionoregonstateeduec1478
Staben ML JW Ellsworth DM Sullivan D Horneck BD Brown and RG Stevens 2003 Monitoring Soil Nutrients Using a Management Unit Approach PNW 570 Oregon State University Extension Service httpscatalogextensionoregonstateedupnw570
Biosolids in home landscapes and gardensCogger CG 2014 Using Biosolids in Gardens and
Landscapes FS156E Washington State University Cooperative Extension httpcrucahewsueduCEPublicationsFS156EFS156Epdf
Forage production with biosolidsSullivan DM 2008 Biosolids Increase Grass Yield
Grass Quality and Soil Fertility in Dryland Pasture Northwest Biosolids Management Association and City of Portland Environmental Services httpwwwnwbiosolidsorgpubsBiosolidsGrassSoilFertilitypdf
Sullivan DM 2013 Fertilizing grass with municipal biosolids In S Bittman and D Hunt (eds) Cool ForagesmdashAdvanced Management of Temperate Forages Pacific Field Corn Association Agassiz BC Canada httpwwwfarmwestcom
17
AcknowledgmentsThe authors thank the following reviewers
for their helpful suggestions for improving the technical merit and readability of this publicationGreg Charr City of PortlandMark Cullington KennedyJenksJoan Davenport Washington State University-ProsserDavid Granatstein Washington State University-
WenatcheeKate Kurtz King County WA Amber Moore University of Idaho-Twin FallsTressa Nichols Idaho Department of Environmental
QualityPeter Severtson Washington Department of EcologySteve Wilson Brown amp Caldwell
Field research references Biosolids nutrient management
in the Pacific Northwest
Listed in chronological order
Sullivan DM SC Fransen CG Cogger and AI Bary 1997 Biosolids and dairy manure as nitrogen sources for prairiegrass on poorly drained soil J Prod Agric 10589ndash596
Cogger CG DM Sullivan AI Bary and JA Kropf 1998 Matching plant-available nitrogen from biosolids with dryland wheat needs J Prod Agric 1141ndash47
Cogger CG DM Sullivan AI Bary and SC Fransen 1999 Nitrogen recovery from heat-dried and dewatered biosolids applied to forage grasses J Environ Qual 28754ndash759
Cogger CG AI Bary SC Fransen and DM Sullivan 2001 Seven years of biosolids vs inorganic nitrogen applications to tall fescue J Environ Qual 302188ndash2194
Gilmour JT CG Cogger LW Jacobs GK Evanylo and DM Sullivan 2003 Decomposition and plant available N in biosolids Laboratory studies field studies and computer simulation J Environ Qual 321498ndash1507
Cogger CG AI Bary DM Sullivan and EA Myhre 2004 Biosolids processing effects on first and second year available nitrogen Soil Sci Soc Am J 68162ndash167
Sullivan DM CG Cogger AI Bary and TE Shearin 2009 Predicting biosolids application rates for dryland wheat across a range of Northwest climate zones Comm in Soil Sci and Plant Analysis 401770ndash1789
Brown S K Kurtz AI Bary and CG Cogger 2011 Quantifying benefits associated with land application of residuals in Washington State Environ Sci Technol 457451ndash7458
Koenig RT CG Cogger and AI Bary 2011 Dryland winter wheat yield grain protein and soil nitrogen responses to fertilizer and biosolids applications Applied Environ Soil Sci doi1011552011925462
Cogger CG AI Bary AC Kennedy and A Fortuna 2013 Biosolids applications to tall fescue have long-term influence on soil nitrogen carbon and phosphorus J Environ Qual 42516ndash522
Cogger CG AI Bary EA Myhre and A Fortuna 2013 Long-term crop and soil response to biosolids applications in dryland wheat J Environ Qual 421872ndash1880
See the Appendix for phosphorus references
18
Biosolids processing methods affect the value of biosolids as a P fertilizer as well as the risk of P loss in runoff from fields after application Soluble P carried by runoff to water bodies can damage water quality
This section discusses two laboratory analyses that can help characterize the fertilizer value of biosolids and their risk to water quality Both tests have been validated by research in Oregon and across the United States
Water-extractable phosphorus (WEP) as a fraction of total P
Rationale The greatest hazard to water quality occurs when a highly soluble P source is surface applied to soil and application is followed by heavy precipitation The water-extractable P (WEP) test was created to rank organic fertilizers for water quality risk
Method overview Biosolids P is extracted by shaking with water The P concentration in the water is then measured The national protocol for use with organic fertilizers uses a 1100 dry biosolids to water ratio (Kleinman et al 2007)
The biosolids WEP value is expressed in relation to biosolids total P (WEPtotal P) to estimate relative P solubility This ratio is typically less than 02 for biosolids 03 to 05 for manures and 08 to 10 for commercial P fertilizers
Interpretation Research has shown that higher WEP values indicate higher risk of P loss in runoff For example in a rainfall simulator study the concentration of P in runoff was 5 to 10 times greater for animal manures (beef dairy poultry n=7) than for dewatered biosolids (n=5) Both biosolids and manures were applied at equivalent total P application rates but manures had higher WEP than biosolids (Kleinman et al 2007)
Application Simulation models can predict P loss in runoff for many field management scenarios Recent versions of nutrient management planning software developed by the
Natural Resources Conservation Service (NRCS) employ WEP values to predict short-term risk of P loss in runoff
Phosphorus Sorption Index (PSI)Rationale Some biosolids processing facilities
add Al (aluminum sulfate) or Fe (ferric chloride) Iron and Al bind P in insoluble forms
Method overview Biosolids samples are digested in strong acid to determine total P Al and Fe concentrations Lab data are then expressed as the molar ratio of P to Al plus Fe [P(Al + Fe)] This ratio is termed the Phosphorus Sorption Index (PSI)
Interpretation PSI is used to compare P solubility of different biosolids A low PSI indicates low P solubility because Al and Fe are present to bind P in insoluble forms
OSU research (Choate 2004) showed that digestion of biosolids for total metals analysis by strong acid digestion (nitric acid plus hydrogen peroxide similar to USEPA 3051 digestion method) yielded similar PSI values to those obtained by the most common research digestion method (acid-ammonium oxalate extraction) Digestion of biosolids for total metals analysis is routinely performed by commercial analytical laboratories that serve the biosolids industry while the acid-ammonium oxalate extraction method is a research method not commonly performed by commercial laboratories
Application At PSI values above 06 WEP values increased (Figure 9 page 19) indicating greater potential risk to water quality OSU research also found that PSI was a rough indicator of the relative P fertilizer value of different biosolids sources (Figure 10 page 19 and Choate 2004)
PSI analysis can be included as part of routine biosolids analysis done for regulatory compliance Ask the lab to determine total Fe and Al present after biosolids sample digestion in strong acid using an ICP spectrophotometer
Appendix Biosolids Phosphorus Characterization
Phosphorus referencesListed in chronological orderSharpley AN T Daniel T Sims J Lemunyon
R Stevens and R Parry 2003 Agricultural Phosphorus and Eutrophication 2nd edition United States Department of Agriculture Agricultural Research Service ARSndash149 httpwwwarsusdagovisnpphosampeutro2agphoseutro2edpdf
Brandt RC HA Elliott and GA OrsquoConnor 2004 Water extractable phosphorus in biosolids Implications for land-based recycling Water Environ Research 76 (2)121ndash129
Choate J 2004 Phosphorus availability in biosolids-amended soils MS thesis Oregon State University httphdlhandlenet195720969
Kleinman P DM Sullivan and A Wolf et al 2007 Selection of a water extractable phosphorus test for manures and biosolids as an indicator of runoff loss potential J Envir Qual 361357ndash1367
Wolf AM PA Moore P Kleinman and DM Sullivan 2009 Water extractable phosphorus in animal manure and biosolids (universal water extractable P test) In J Kovar and G Pierzynski eds 2009 Methods of Phosphorus Analysis for Soils Sediments Residuals and Waters 2nd edition Southern Cooperative Series Bulletin No 408 httpwwwsera17extvteduDocumentsP_Methods2ndEdition2009pdf
Water Environment Federation (WEF) 2014 Phosphorus in Biosolids How to Protect Water Quality While Advancing Biosolids Use httpwwwwrrfdataorgPhosphorusFS WEF-PhosphorusFactSheet2014html
copy 2015 Oregon State University
Published and distributed in furtherance of the Acts of Congress of May 8 and June 30 1914 by the Oregon State University Extension Service Washington State University Extension University of Idaho Extension and the US Department of Agriculture cooperating The three participating Extension services offer educational programs activities and materials without discrimination based on age color disability gender identity or expression genetic information marital status national origin race religion sex sexual orientation or veteranrsquos status The Oregon State University Extension Service Washington State University Extension and University of Idaho Extension are Equal Opportunity Employers
Pacific Northwest Extension publications are produced cooperatively by the three Pacific Northwest land-grant universities Washington State University Oregon State University and the University of Idaho Similar crops climate and topography create a natural geographic unit that crosses state lines Since 1949 the PNW program has published more than 650 titles preventing duplication of effort broadening the availability of faculty specialists and substantially reducing costs for the participating states
Revised June 2007 Revised February 2015
Figure 9 Water-extractable P (WEP) in biosolids increases with the Phosphorus Sorption Index (PSI)mdashthe molar ratio of P to Al + Fe in biosolids Each data point represents a city biosolids source Water-soluble P was extracted from biosolids using a 110 dry biosolidswater ratio Data from Choate (2004) Figure by Dan Sullivan
Figure 10 Plant-available P from biosolids increases with the Phosphorus Sorption Index (PSI)mdashthe molar ratio of P to Al + Fe in biosolids Each data point represents a city biosolids source Error bars represent the range in measured plant-available P across five different Oregon soils Plant-available P from biosolids was measured using anion exchange resin strips after 4 weeks of incubation of soil mixed with biosolids Plant-available P from biosolids is expressed relative to available P from triple super phosphate fertilizer Data from Choate and Sullivan (2004 unpublished) Figure by Dan Sullivan
Cover photos by Andy Bary (top left) Craig Cogger (top right) and Dan Sullivan (bottom)
- What are biosolids
- Biosolids as a nutrient source
- Biosolids nitrogen (N)
- Biosolids phosphorus (P)
- Biosolids potassium (K)
- Biosolids sulfur (S)
- Salts
- Soil pH
- Soil quality
- Biosolids quality
- Site approvals for biosolids application
- Questions about biosolids
- For more information
- Appendix Biosolids Phosphorus Characterization
-
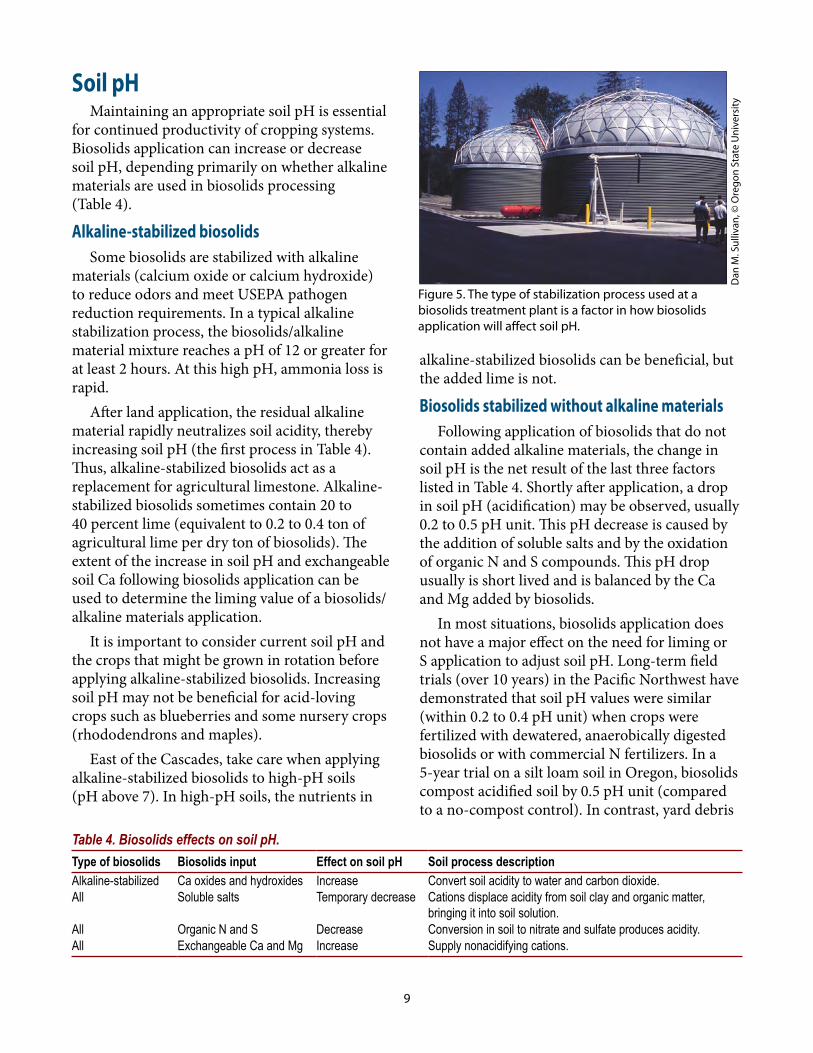
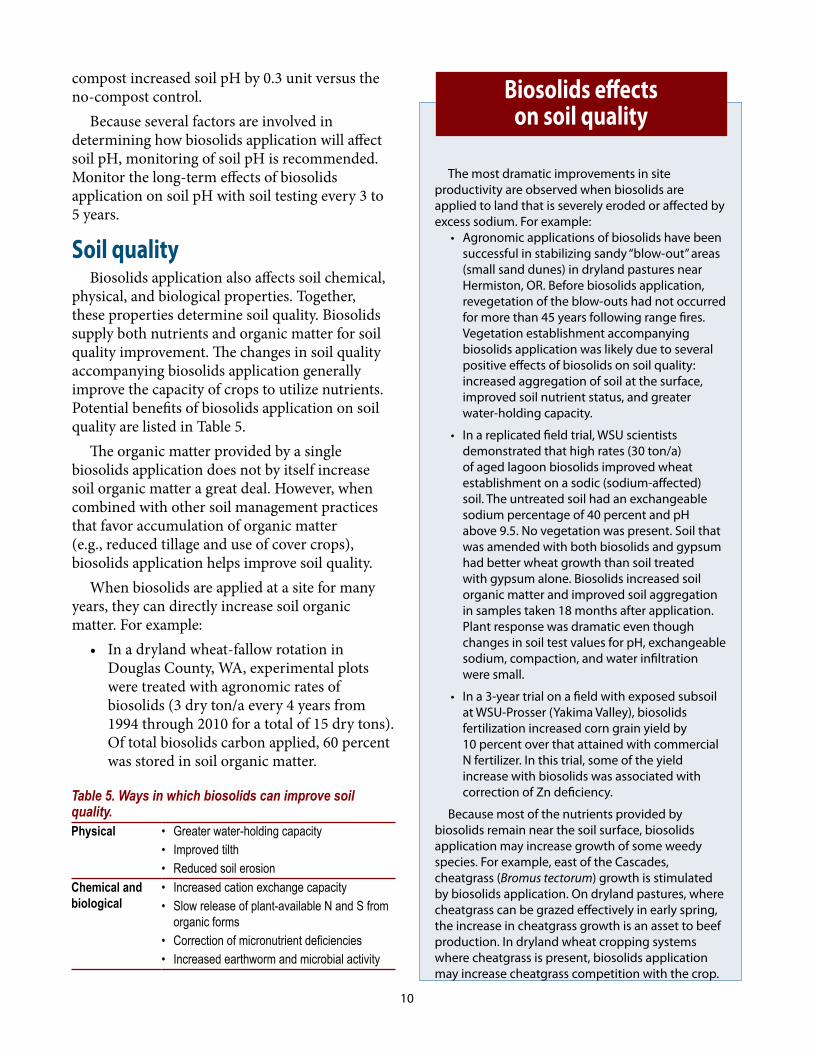