fertilizing douglas-fir forests - usda forest service
TRANSCRIPT
PACIFIC NORTHWEST FOREST AND RANGE EXPERIMENT STATIONU. S. DEPARTMENT OF AGRICULTURE FOREST SERVICE
About This File: This file was created by scanning the printed publication. Misscans identifiedby the software have been corrected; however, some mistakes may remain.
AbstractThis report supplements a slide-tape presentation of
the same title. Part I of the report describes the cur-rent practice of nitrogen fertilization of Douglas-firforests in western Washington and Oregon and the effectsof this fertilization on tree growth and water quality.Part II discusses factors that affect costs and revenuesfrom investments in forest fertilization. The appendedtables, figures, and work sheet enable the user to pre-pare a break-even economic analysis for fertilizationprojects. This information should be useful in selectingstands for fertilization and in preparing EnvironmentalAssessment Reports.
Metric Equivalents1 acre = 0.40469 hectare
1 cubic foot = 0.0283 cubic meter
1 pound = 0.4536 kilogram
ContentsPage
PART I. BIOLOGICAL BASES AND EFFECTS OF NITROGEN FERTILIZATION . . . . . . . . . . . . . . . . . . . . . 1
YIELDS FROM DOUGLAS-FIR FORESTS . . . . . . . . . . . . . . . . 1Unmanaged Forests . . . . . . . . . . . . . . . . . . . . . 1Managed Forests . . . . . . . . . . . . . . . . . . . . . . 2
FERTILIZATION TO INCREASE YIELD . . . . . . . . . . . . . . . . 3The Current Practice. . . . . . . . . . . . . . . . . . . . 3What We Know . . . . . . . . . . . . . . . . . . . . . . . 3Is Fertilization a Suitable Tool? . . . . . . . . . . . . . 5
HOW RELIABLE IS FOREST FERTILIZATION? . . . . . . . . . . . . . 5Probability of Response . . . . . . . . . . . . . . . . . . 5Effects of Nitrogen Fertilizer on Douglas-fir Growth . . . . . . . . . . . . . . . . . . . . 6
Improving Reliability . . . . . . . . . . . . . . . . . . . 6
HOW ENVIRONMENTALLY SAFE? . . . . . . . . . . . . . . . . . . . 7Results From Stream Monitoring . . . . . . . . . . . . . . . 7Avoiding a Potential Problem . . . . . . . . . . . . . . . . 9Energy Trade-Offs . . . . . . . . . . . . . . . . . . . . . 9
SUMMARY . . . . . . . . . . . . . . . . . . . . . . . . . . . 10
PART II. HOW ECONOMIC?. . . . . . . . . . . . . . . . . . . . . 10
TREATMENT COSTS . . . . . . . . . . . . . . . . . . . . . . . 10Initial Costs . . . . . . . . . . . . . . . . . . . . . . 10Interest Charges . . . . . . . . . . . . . . . . . . . . . 12
REVENUE . . . . . . . . . . . . . . . . . . . . . . . . . . . 13Volume Gained . . . . . . . . . . . . . . . . . . . . . . 13Stumpage Price . . . . . . . . . . . . . . . . . . . . . . 14
REVENUE REQUIRED TO BREAK EVEN . . . . . . . . . . . . . . . . 17What Break-Even Volume? . . . . . . . . . . . . . . . . . . 17What Break-Even Price? . . . . . . . . . . . . . . . . . . 19
OTHER FINANCIAL CONSIDERATIONS . . . . . . . . . . . . . . . . 21Effect of Income Taxes . . . . . . . . . . . . . . . . . . 21Cash Flow Management . . . . . . . . . . . . . . . . . . . 21Cash Flow Effects. . . . . . . . . . . . . . . . . . . . . 21
SUMMARY . . . . . . . . . . . . . . . . . . . . . . . . . . . . 22
LITERATURE CITED . . . . . . . . . . . . . . . . . . . . . . . . 22
APPENDIX A . . . . . . . . . . . . . . . . . . . . . . . . . . . 26
APPENDIX B . . . . . . . . . . . . . . . . . . . . . . . . . . . 27
APPENDIX C . . . . . . . . . . . . . . . . . . . . . . . . . . . 29
Preface
Fertilizing Douglas-fir Forests1/
This report is in two parts. In Part I, we will discuss someof the biological bases of forest fertilization and describe thecurrent practice of operational fertilization. We will then dis-cuss both the reliability of fertilization for increasing treegrowth and its environmental impacts. In Part II, we will showhow to evaluate the economics of forest fertilization.
After reading and referring to this report, you should be ableto:
1. Describe the current practice of fertilizing Douglas-firforests, i.e, fertilizer prescription and stand selection.
2. Describe the effect of N fertilizer on Douglas-fir growth.
3. Cite evidence about some environmental impacts of N fertil-ization and use this information to prepare Environmental Assess-ment Reports.
4. Enumerate and discuss factors that affect the costs andrevenues from investments in forest fertilization.
5. Use the accompanying worksheet to prepare a break-evenanalysis for your fertilization projects.
1/ This General Technical Report supplements a slide-tape presentation titled,Fertilizing Douglas-fir Forests. This slide tape (772.1-.2 S-T) is available forrent or purchase from The Forestry Media Center, School of Forestry, Oregon StateUniversity, Corvallis, Oregon 97331.
PART I. Biological Bases and Effects of Nitrogen Fertilization
Yields From Douglas-fir Forests
UNMANAGED FORESTS
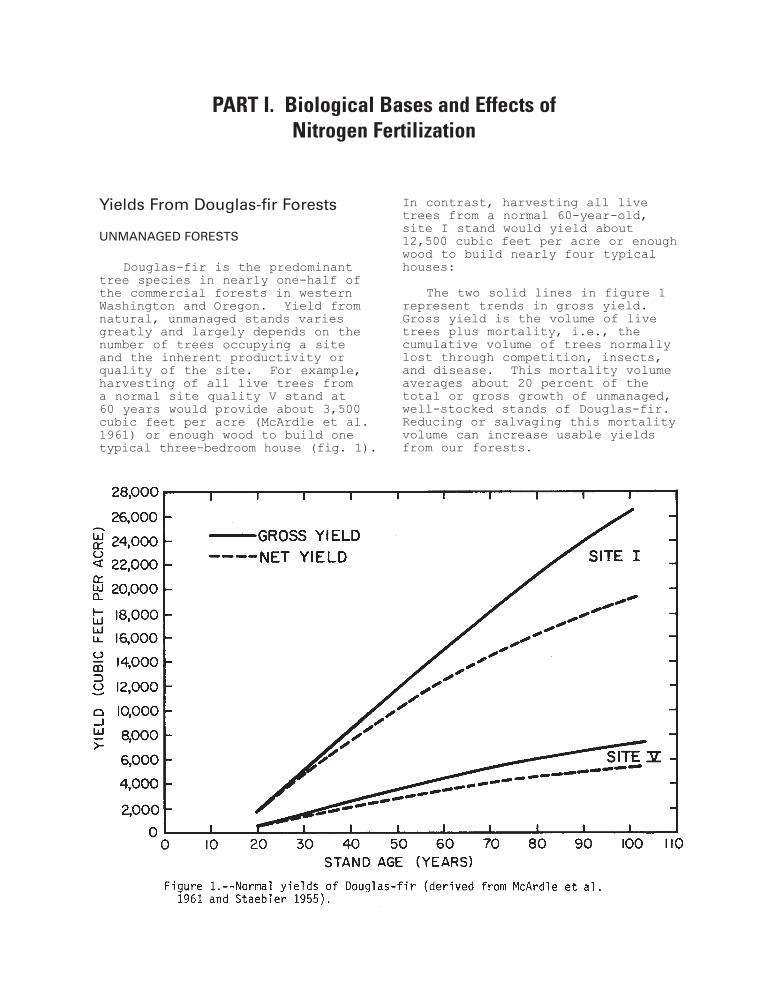
Douglas-fir is the predominanttree species in nearly one-half ofthe commercial forests in westernWashington and Oregon. Yield fromnatural, unmanaged stands variesgreatly and largely depends on thenumber of trees occupying a site and the inherent productivity orquality of the site. For example,harvesting of all live trees from a normal site quality V stand at 60 years would provide about 3,500cubic feet per acre (McArdle et al.1961) or enough wood to build onetypical three-bedroom house (fig. 1).
In contrast, harvesting all livetrees from a normal 60-year-old,site I stand would yield about12,500 cubic feet per acre or enoughwood to build nearly four typicalhouses:
The two solid lines in figure 1represent trends in gross yield.Gross yield is the volume of livetrees plus mortality, i.e., thecumulative volume of trees normallylost through competition, insects,and disease. This mortality volumeaverages about 20 percent of thetotal or gross growth of unmanaged,well-stocked stands of Douglas-fir.Reducing or salvaging this mortalityvolume can increase usable yieldsfrom our forests.
2
MANAGED FORESTS
Most volume normally lost inunmanaged forests can be recoveredin managed forests. By precommer-cially thinning young stands, for-esters eliminate excess trees thatwill not reach merchantable size and thereby concentrate growth ontofuture crop trees. By commerciallythinning older stands, dead trees of merchantable size are salvaged as part of the thinning operation.
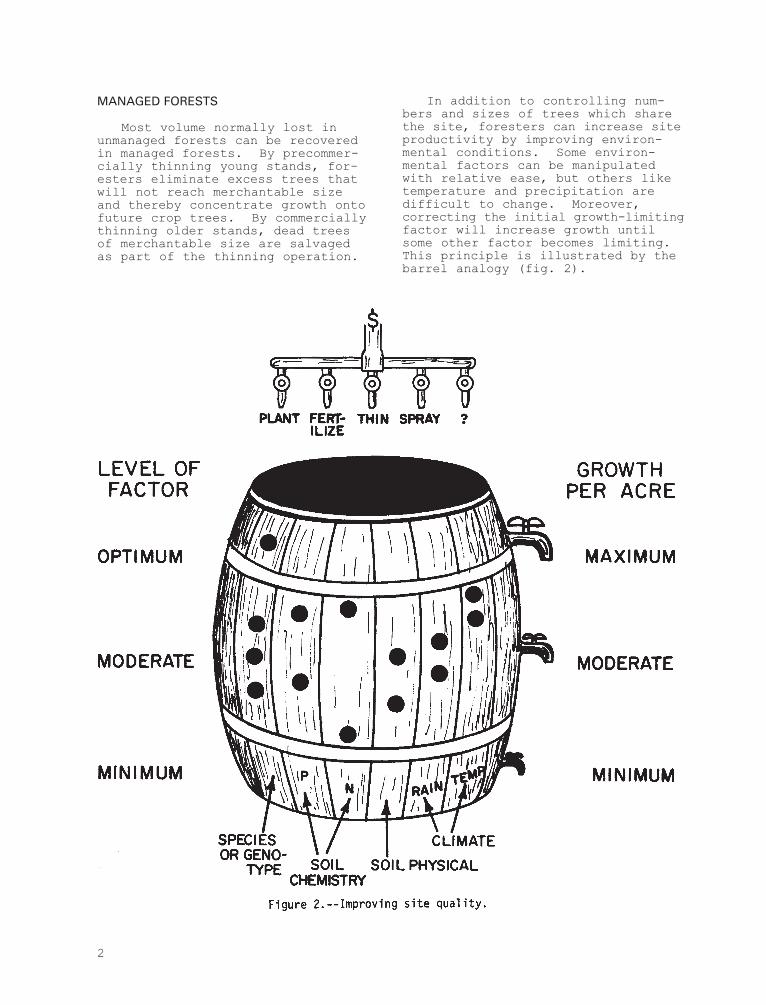
In addition to controlling num-bers and sizes of trees which sharethe site, foresters can increase siteproductivity by improving environ-mental conditions. Some environ-mental factors can be manipulated with relative ease, but others liketemperature and precipitation aredifficult to change. Moreover,correcting the initial growth-limitingfactor will increase growth until some other factor becomes limiting.This principle is illustrated by thebarrel analogy (fig. 2).
3
Consider this barrel a forestsite we want to improve. Eachstave of the barrel represents aproductivity factor. The level ofproduction obtainable at this siteis limited by the factor with thelowest opening in the barrel. Inthis example, the amount of avail-able nitrogen is the first growth-limiting factor. If we remedy thisby applying nitrogen fertilizer,we plug this weakness and increaseproduction to the next factor inshort supply. This next factormay be a physical property of thesoil like compaction or stoniness.We can readily improve compactionin the surface soil by mechanicalmeans, but correcting stoniness isusually too costly. Therefore, onthis theoretical site--as in apractical field situation--we wouldadd nitrogen until production waslimited by some factor beyond ourcontrol.
Fertilization to lncrease Yield
THE CURRENT PRACTlCE
Forest fertilization is develop-ing into a practical means for in-creasing yields of Douglas-firforests of western Washington andOregon. This commercial practicewas preceded by numerous fieldtrials where fertilizer was spreaduniformly over the soil and treeswere carefully measured for growthin diameter and height. Thesetrials have provided direct evidencethat nitrogen fertilizers can in-crease growth of established stands;direct evidence led to large-scaleapplications.
The first operational fertiliza-tion was in 1965 when 1,500 acresof Douglas-fir on Crown Zellerbach’sholdings near Molalla, Oregon weretreated with urea prills, small,white spheres of nitrogen fertilizer.For the l0-year period of 1965through 1974, nitrogen fertilizerwas applied to at least 825,000acres in western Washington and Oregon.2/ About 90 percent of this
2/Personal communication with RobertT. Bergland, former Fertilization Forester,Washington State Department of NaturalResources, Olympia, Washington, onOctober 22, 1975.
acreage was industry-owned forests.Helicopters were used almost exclu-sively to fertilize these forests.Generally, the prescribed treatmentwas 150 or 200 pounds of elementalnitrogen per acre, applied as ureaprill or larger forestry-grade gran-ules.
WHAT WE KNOW
Although fertilization has joinedtraditional management tools likeplanting and thinning to increasewood production, researchers andland managers are continuing toimprove gains from fertilization.We currently have general answersto questions concerning whichnutrient elements, dosages, andfertilizers should be used, and whenand how they should be applied. Re-fining these general answers willincrease the gains from currentpractices.
Which nutrients?--Current appli-cations of nitrogen are based onpast observations that nitrogenfertilizers frequently increasegrowth of Douglas-fir at a widerange of locations. Other elementssuch as phosphorous, potassium, andsulphur have also been tested in com-bination with nitrogen; but theseelements seldom improve the gainachieved from applying nitrogen alonein the Pacific Northwest (Gessel et al. 1965, Crossin et al. 1966,Steinbrenner 1968, Heilman 1971,Miller and Reukema 1974).
Douglas-fir, like other plants,requires relatively large quantitiesof nitrogen compared to most otherelements. For example, productivestands annually require 40 to 100pounds of nitrogen per acre. Mostof this annual requirement is metby the roots which extract inorganicnitrogen from the soil and forestfloor; however, some of this require-ment is provided by internally re-cycling N extracted in previousyears. Although soils of commercialDouglas-fir forests contain 2,000to more than 20,000 pounds of nitro-gen per acre (Gessel et al. 1972),most of this nitrogen is trapped in living organic matter or organicresidues. Each year, only a small
4
Which source of N?--Most nitrogenfertilizer currently applied toDouglas-fir forests is urea. Urea is used primarily because of Its rel-atively low initial cost per pound of nitrogen and because its higherconcentration of nitrogen (46 percent)provides a greater net payload thanother nitrogen fertilizers like ammonium nitrate (34 percent) (table 1).
fraction is mineralized into inorganicnitrogen and made available:to trees,other plants, and micro-organisms, all of which compete for this limitednutrient. Rates of N turnover inmany stands are frequently inadequateto,meet tree requirements, as shown by the response that usually followsfertilization with 150 or more poundsof nitrogen per acre.
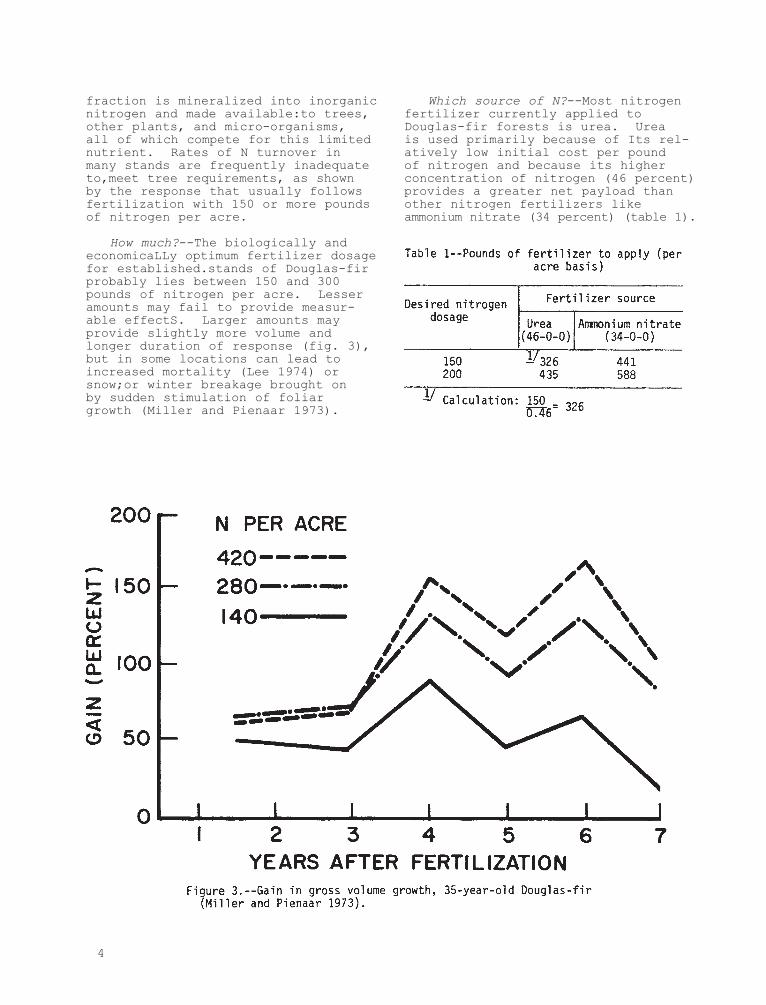
How much?--The biologically andeconomicaLLy optimum fertilizer dosagefor established.stands of Douglas-firprobably lies between 150 and 300pounds of nitrogen per acre. Lesseramounts may fail to provide measur-able effectS. Larger amounts may provide slightly more volume andlonger duration of response (fig. 3),but in some locations can lead toincreased mortality (Lee 1974) orsnow;or winter breakage brought on by sudden stimulation of foliar growth (Miller and Pienaar 1973).
5
Application of urea during periodsof dry, warm weather should beavoided because such climatic con-ditions could lead to gaseous lossesof nitrogen and reductions in theamount available for growth (Watkinset al. 1972). The performance ofurea and other sources of N is being compared under forest condi-tions; currently, however, we cannotspecify circumstances where specificfertilizers will provide the greatestresponse per pound of nitrogen ap-plied.
Stand age?--Biologic and economicconsiderations determine when tofertilize Douglas-fir stands. Fer-tilization at time of tree plantinghas seldom been beneficial (Austinand Strand 1960). Adding fertilizerpellets to the planting hole has not proved cost-effective,and broad-cast applications of nitrogen toseedlings usually increase competi-tion from other vegetation andreduce seedling survival.
Because nutrient demands are usually highest when annual rates of wood production and crown expan-sion are highest, it is biologicallydesirable to fertilize initiallywhen the Douglas-fir stand is be-tween 15 and 20 years old. Althoughthis timing is likely to providelarge gains in wood volume, it maynot provide greater economic gainsthan fertilizing at a later periodwhen the trees have reached a mer-chantable size. As we explain inPart II, the period of time betweenthe fertilizer investment and theharvest of volume gained from thisinvestment strongly influences economic benefits of fertilization.
IS FERTlLlZATlON A SUlTABLE TOOL?
Land managers can use severalcriteria to judge the merits of fertilization. Specifically theywant to know how reliable forestfertilization is, how environmentallysafe it is in the forested water-shed, and how much economic returnit will provide. In the remainderof Part I, we’ll see how well fer-tilization meets the criteria ofreliability and environmental impact.In Part II, we’ll examine the eco-nomics of forest fertilization.
How Reliable is
Forest Fertilization?
Foresters want a tool that willenhance growth over a wide range offorest conditions, and they want ahigh probability of getting improvedgrowth after using this tool.
PROBABlLlTY OF RESPONSE
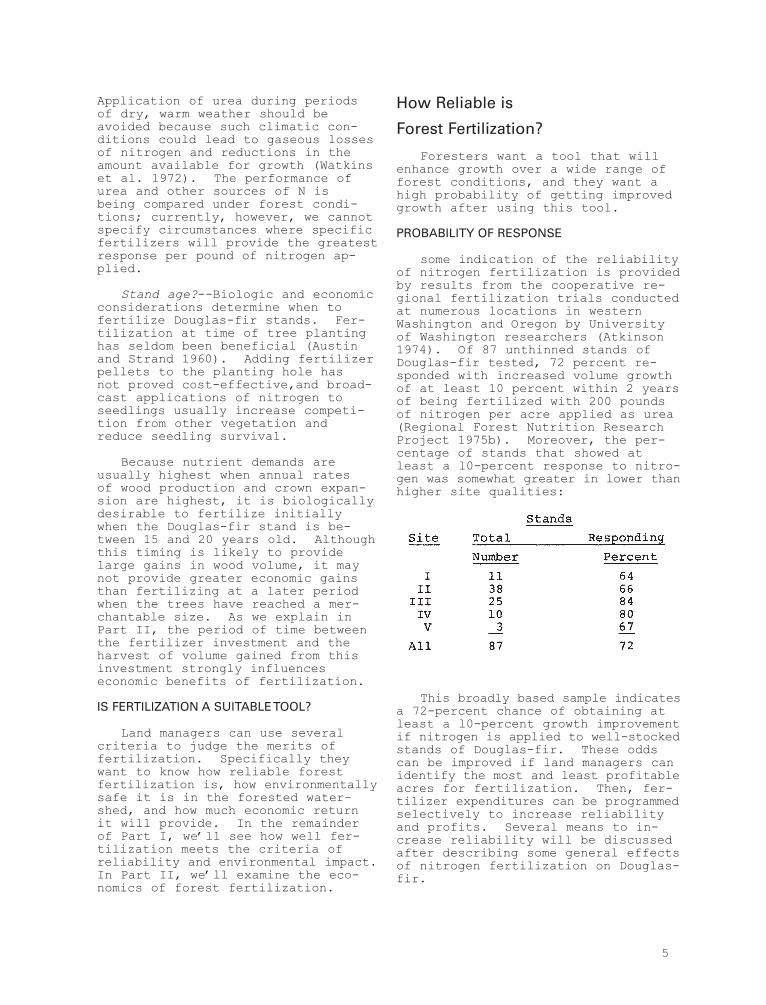
some indication of the reliabilityof nitrogen fertilization is providedby results from the cooperative re-gional fertilization trials conductedat numerous locations in westernWashington and Oregon by Universityof Washington researchers (Atkinson1974). Of 87 unthinned stands ofDouglas-fir tested, 72 percent re-sponded with increased volume growthof at least 10 percent within 2 yearsof being fertilized with 200 poundsof nitrogen per acre applied as urea(Regional Forest Nutrition ResearchProject 1975b). Moreover, the per-centage of stands that showed atleast a l0-percent response to nitro-gen was somewhat greater in lower thanhigher site qualities:
This broadly based sample indicatesa 72-percent chance of obtaining atleast a l0-percent growth improvementif nitrogen is applied to well-stockedstands of Douglas-fir. These oddscan be improved if land managers canidentify the most and least profitableacres for fertilization. Then, fer-tilizer expenditures can be programmedselectively to increase reliabilityand profits. Several means to in-crease reliability will be discussedafter describing some general effectsof nitrogen fertilization on Douglas-fir.
6
EFFECTS OF NlTROGEN FERTlLlZER
ON DOUGLAS-FIR GROWTH
Fertilized Douglas-firs usuallyincrease growth in diameter and volume during the first growingseason after treatment. Foliage oftrees with a severe nitrogen defi-ciency darkens, lengthens, and remainson the tree for 1 or more additionalyears. These changes in foliage andgreater branch growth indicate amore rapid build-up of tree crownand a greater potential for futuregrowth.
Response in volume growth gener-ally peaks between the 3d and 5thyear after fertilization. Althoughduration of response varies withlocation, stand, and nitrogen dosage,current data suggest that responsegradually approaches zero within 10to 15 years after treatment.
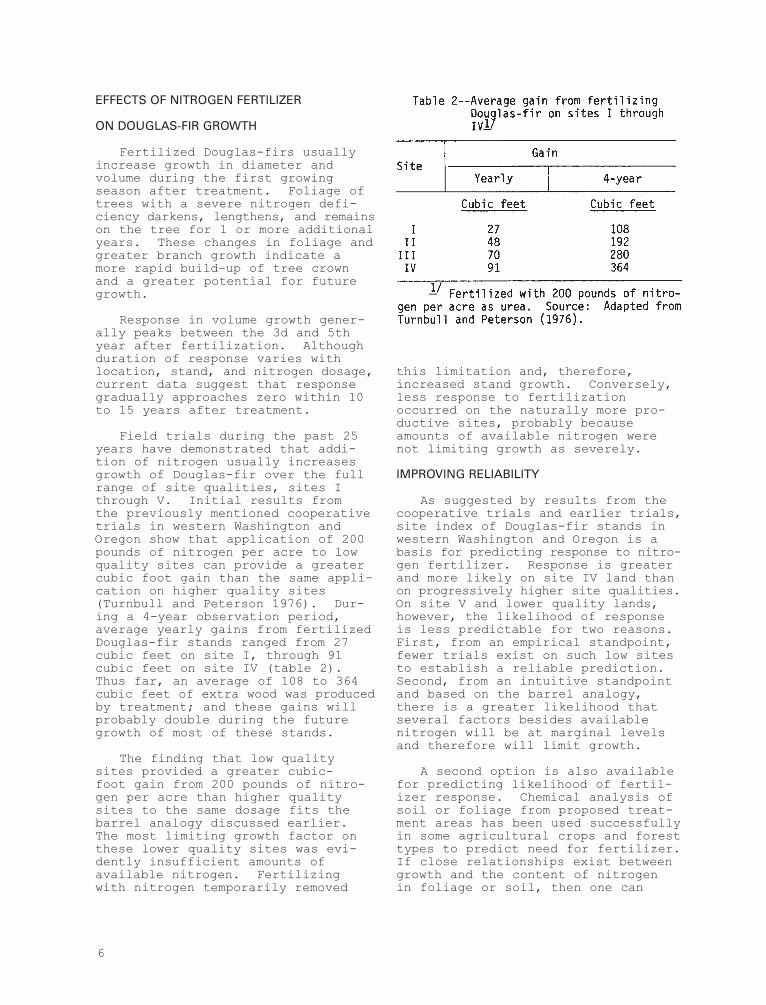
Field trials during the past 25years have demonstrated that addi-tion of nitrogen usually increasesgrowth of Douglas-fir over the fullrange of site qualities, sites Ithrough V. Initial results from the previously mentioned cooperativetrials in western Washington andOregon show that application of 200pounds of nitrogen per acre to lowquality sites can provide a greatercubic foot gain than the same appli-cation on higher quality sites(Turnbull and Peterson 1976). Dur-ing a 4-year observation period,average yearly gains from fertilizedDouglas-fir stands ranged from 27cubic feet on site I, through 91cubic feet on site IV (table 2).Thus far, an average of 108 to 364cubic feet of extra wood was producedby treatment; and these gains willprobably double during the futuregrowth of most of these stands.
The finding that low qualitysites provided a greater cubic-foot gain from 200 pounds of nitro-gen per acre than higher qualitysites to the same dosage fits thebarrel analogy discussed earlier.The most limiting growth factor onthese lower quality sites was evi-dently insufficient amounts ofavailable nitrogen. Fertilizingwith nitrogen temporarily removed
this limitation and, therefore,increased stand growth. Conversely,less response to fertilizationoccurred on the naturally more pro-ductive sites, probably becauseamounts of available nitrogen werenot limiting growth as severely.
lMPROVlNG RELlABlLlTY
As suggested by results from thecooperative trials and earlier trials,site index of Douglas-fir stands inwestern Washington and Oregon is abasis for predicting response to nitro-gen fertilizer. Response is greaterand more likely on site IV land thanon progressively higher site qualities.On site V and lower quality lands,however, the likelihood of responseis less predictable for two reasons.First, from an empirical standpoint,fewer trials exist on such low sitesto establish a reliable prediction.Second, from an intuitive standpointand based on the barrel analogy,there is a greater likelihood thatseveral factors besides availablenitrogen will be at marginal levelsand therefore will limit growth.
A second option is also availablefor predicting likelihood of fertil-izer response. Chemical analysis ofsoil or foliage from proposed treat-ment areas has been used successfullyin some agricultural crops and foresttypes to predict need for fertilizer.If close relationships exist betweengrowth and the content of nitrogen in foliage or soil, then one can
7
reasonably predict that increasingthe content of nitrogen by fertil-ization will enhance growth. Al-though such diagnostic techniquesare being developed by several scientists for use in Douglas-fir(Lavender and Carmichael 1966Shumway and Atkinson 1977),3/ theyare not yet sufficiently developedfor practical use.
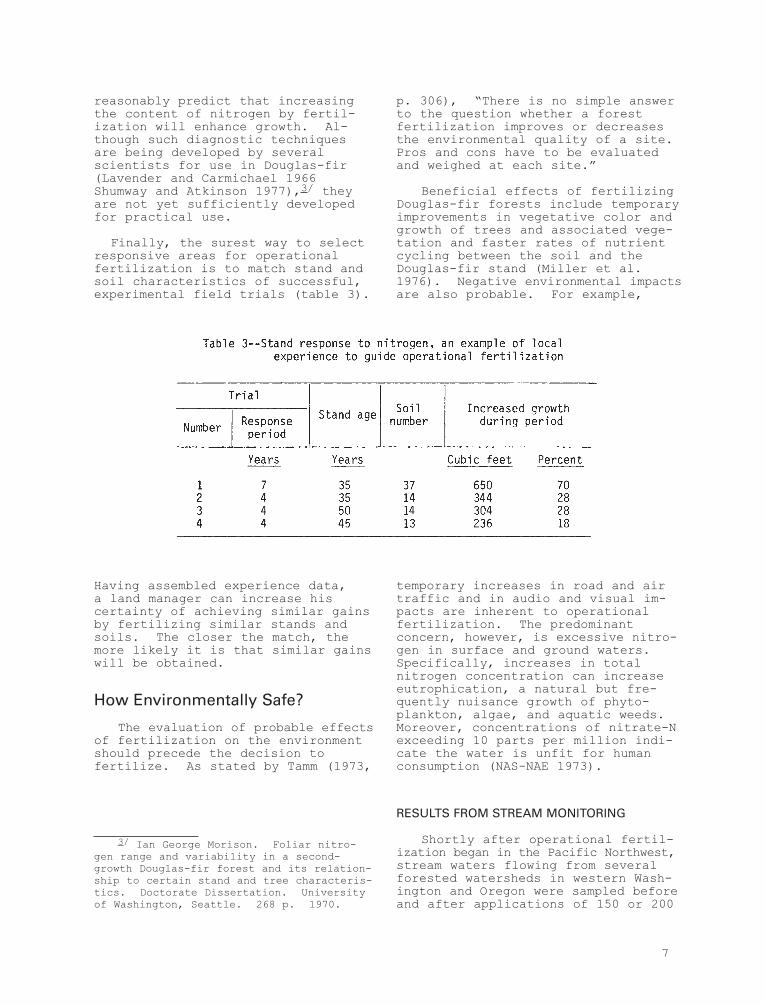
Finally, the surest way to selectresponsive areas for operationalfertilization is to match stand andsoil characteristics of successful,experimental field trials (table 3).
Having assembled experience data, a land manager can increase his certainty of achieving similar gainsby fertilizing similar stands andsoils. The closer the match, themore likely it is that similar gainswill be obtained.
How Environmentally Safe?
The evaluation of probable effectsof fertilization on the environmentshould precede the decision to fertilize. As stated by Tamm (1973,
3/ Ian George Morison. Foliar nitro-gen range and variability in a second-growth Douglas-fir forest and its relation-ship to certain stand and tree characteris-tics. Doctorate Dissertation. Universityof Washington, Seattle. 268 p. 1970.
temporary increases in road and airtraffic and in audio and visual im-pacts are inherent to operationalfertilization. The predominant concern, however, is excessive nitro-gen in surface and ground waters.Specifically, increases in totalnitrogen concentration can increaseeutrophication, a natural but fre-quently nuisance growth of phyto-plankton, algae, and aquatic weeds.Moreover, concentrations of nitrate-Nexceeding 10 parts per million indi-cate the water is unfit for humanconsumption (NAS-NAE 1973).
RESULTS FROM STREAM MONlTORlNG
Shortly after operational fertil-ization began in the Pacific Northwest,stream waters flowing from severalforested watersheds in western Wash-ington and Oregon were sampled beforeand after applications of 150 or 200
p. 306), “There is no simple answerto the question whether a forest fertilization improves or decreasesthe environmental quality of a site.Pros and cons have to be evaluatedand weighed at each site.”
Beneficial effects of fertilizingDouglas-fir forests include temporaryimprovements in vegetative color andgrowth of trees and associated vege-tation and faster rates of nutrientcycling between the soil and theDouglas-fir stand (Miller et al.1976). Negative environmental impactsare also probable. For example,
8
pounds of nitrogen per acre as ureafertilizer. Initial results fromthis monitoring were summarized in a 1972 report of the EnvironmentalProtection Agency (Groman 1972, p. 3):
“A continual process of col-lecting and evaluating forestfertilization-water quality studies is required to supple-ment and refine current knowl-edge. The few studies conductedto date indicate no substantialor long-term detrimental effectson the environment associatedwith the practice....”
Water quality continued to be checkedand results from 22 fertilized water-sheds in Douglas-fir forests werereported by Moore (1974). He con-cluded that the maximum concentra-tion of urea-, ammonia-, nitrite-,and nitrate-nitrogen in streams thatwere repeatedly sampled after forestfertilization easily met publishedstandards for public water supplies.
The effects of increased nitrogenon stream habitat and esthetics areless definite. Thut and Hayden (1971)concluded that these increases invarious forms of N found in stream-water after fertilization were wellbelow toxic levels for aquatic life;they predicted that forest fertili-zation could increase aquatic pro-ductivity in nutrient-poor streams.Since most streams in forest water-sheds of the Douglas-fir region are
nutrient poor, this increase innitrogen concentration and aquaticproduction could be considered en-vironmentally desirable. Yet, fertilization could contribute to an undesirable condition outside the watershed, because increases in nitrogen concentration couldincrease eutrophication after mountain streams enter warmer, slower-moving streams or lakes atlower elevations. Clearly, theextent of fertilization in a water-shed and the stream characteristicsand land use downstream are key factors controlling the ultimateeffect of forest fertilization on the aquatic environment.
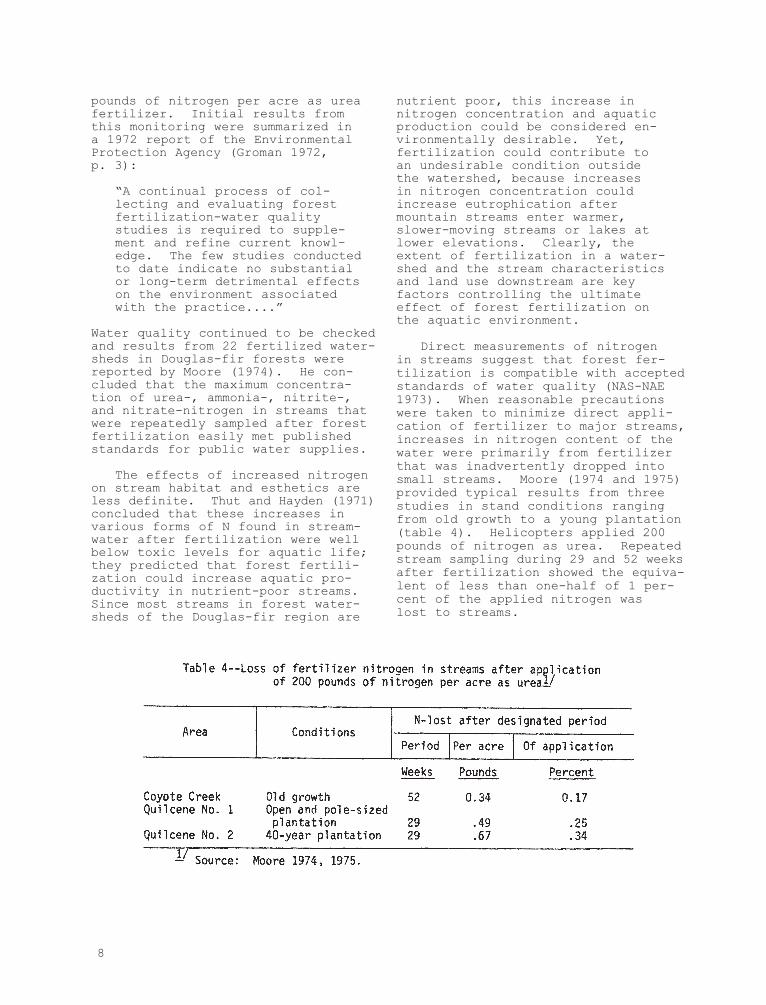
Direct measurements of nitrogen in streams suggest that forest fer-tilization is compatible with acceptedstandards of water quality (NAS-NAE1973). When reasonable precautionswere taken to minimize direct appli-cation of fertilizer to major streams,increases in nitrogen content of thewater were primarily from fertilizerthat was inadvertently dropped intosmall streams. Moore (1974 and 1975)provided typical results from threestudies in stand conditions rangingfrom old growth to a young plantation(table 4). Helicopters applied 200pounds of nitrogen as urea. Repeatedstream sampling during 29 and 52 weeksafter fertilization showed the equiva-lent of less than one-half of 1 per-cent of the applied nitrogen was lost to streams.
9
Nitrogen losses from fertilizerlanding on the soil or forest floorare of less concern. Leaching lossesthrough soil to streams or groundwater occur primarily when nitrogenis in the nitrate-ion form; therefore,leaching may occur where ammonium orurea fertilizers are converted tonitrate by soil bacteria or ifnitrate-containing fertilizers areapplied. Although a laboratorystudy showed that many forest soilsof the Pacific Northwest convertfertilizer nitrogen and organicnitrogen to nitrate ions (Heilman1974), field investigations havedetected only small quantities ofnitrate in stream water after fer-tilization with urea (McCall 1970,Burroughs and Froehlich 1972, Moore1974 and 1975). Correspondingly low nitrate concentrations weremeasured at the one location whereammonium nitrate fertilizer wasapplied (Moore 1974). Presumably,applied or biologically convertednitrate is readily taken up by soilorganisms and vegetation.
AVOlDlNG A POTENTlAL PROBLEM
Although additional informationis needed about the effects ofrepeated fertilization to the samearea and about using fertilizersolutions as foliar sprays (Norrisand Moore 1976, Miller and Young1976), available information sug-gests that little environmental damage is likely if nitrogen fertilizer is carefully broadcast at current dosages and intervals on forested land. When undertakingcurrent operational practices, however, desirable precautionsinclude: (1) maintaining untreatedbuffer areas along major streams;this buffer should be recognizableby the pilot and sufficiently wideto reduce accidental drift of smallfertilizer particles, (2) avoidingapplications when spring snow meltor heavy storms greatly expand smalltributary streams, and (3) suspendingoperations whenever wind or reducedvisibility could lead to significantlosses of fertilizer from the targetarea (Norris and Moore 1971)
ENERGY TRADE-OFFS
When fertilizing forests withnitrogen, we expend nonrenewableenergy (fossil fuels, especiallypetroleum and natural gas) to in-crease photosynthetic efficiency and thus wood production. For example, a conventional fertilizationrequires the equivalent of about 50gallons of oil to produce, transport,and spread 200 pounds N per acre asurea by helicopter. Conversely, wecan burn the additional wood gainedfrom fertilization to produce energyor substitute this wood for metal or plastic products derived from nonrenewable resources. Severalauthors discuss these energy trade-offs and the means and economics ofobtaining them (Grantham and Ellis1974, Grantham et al. 1974, Evans1974, Boyd et al. 1976)
Reifsnyder and Lull (1965) andSmith and Johnson (1977) maintainedthat growing wood, especially inconifer forests, is one of the mostefficient ways to use energy to capture more energy. Assuming areturn of 2 cubic feet of wood perpound of N applied as urea fertilizer,Smith and Johnson (1977) estimateda gross return of about 12 units ofenergy for each unit invested in fertilization of Douglas-fir forests.This gross return is converted to net return by subtracting the energynecessary to harvest (Dykstra 1976)and supply the final product (NationalAcademy of Sciences 1976)
For example, assuming (1) 200pounds of N/acre produces an addi-tional 400 cubic feet/acre of Douglas-fir roundwood and (2) each 100 cubic feet of green roundwood isequivalent to 3.3 barrels or 139 gallons of fuel oil (Hartman et al.,n.d.), then the gross energy returnfrom fertilization is 556 gallons of oil. Further, assuming 5.16 gallons of oil to harvest 1 cord ofroundwood (American Pulpwood Assoc-iation 1975) at 85 cubic feet ofsolid roundwood per cord, then har-vesting this extra 400 cubic feetwould require 24 gallons of oil andthus reduce the net energy return to 532 gallons of oil-equivalent for expenditures of 50 gallons toproduce, transport, and spread 200
10
pounds of N per acre by helicopter.Therefore, the net ratio of energygain in this example is 10.6.
Summary
The four major points of Part Ifollow:
1. Fertilization with nitrogenis a reliable means for increasingwood production in most Douglas-firforests.
2. Current operational fertil-ization is based on past researchfindings. From 1965 through 1974,at least 825,000 acres of establishedstands of Douglas-fir in westernWashington and Oregon were fertilized.The usual treatment consisted of 150 to 200 pounds of elemental nitro-gen per acre applied as urea by helicopter during late fall throughearly spring.
3. Experimental trials indicatethat land managers can reasonablyexpect from 200 to 800 additionalcubic feet of stem wood per acrefrom fertilizing commercial forests.Results from cooperative trials show that gains in cubic volume from fertilizing Douglas-fir standsare inversely related to site quality.Thus, application of 200 pounds of N per acre to site IV and III standscan provide a greater cubic-footgain than the same application onhigher quality sites. Continuingefforts by researchers and land managers can improve volume andfinancial gains from forest fertil-ization.
4. Environmental damage is un-likely if fertilizer is carefullybroadcast to minimize direct appli-cation into major streams.
PART II. How Economic?Forest managers want a financial
gain or profit from their invest-ments in fertilization. This goalis reached when revenue gained fromfertilizing exceeds the total costsof fertilizing. In this section,we shall first show how various factors influence economic returns.
We will then present a break-evenanalysis to show how many cubic feetof extra growth are required and whatstumpage prices are necessary to payfor assumed costs of fertilization.Finally, we’ll discuss other finan-cial considerations affecting fertili-zation decisions.
Treatment Costs
Costs of fertilizing clearly affectthe profit from this silviculturalpractice. The total cost has twocomponents--the initial cost of fer-tilizing and the interest charges for carrying this investment.
lNlTlAL COSTS
The initial costs of fertilizinginclude the contract costs (supplyingthe fertilizer, transporting it intothe forest, and applying it to speci-fied areas by helicopter), and thecosts of administering the contract,providing access roads and heliports,and in some instances, assessingwater quality and tree response.Since the cost of fertilizer is usually 60-70 percent of the totaltreatment costs, the price of fertil-izer strongly influences the initialcost of treatment.
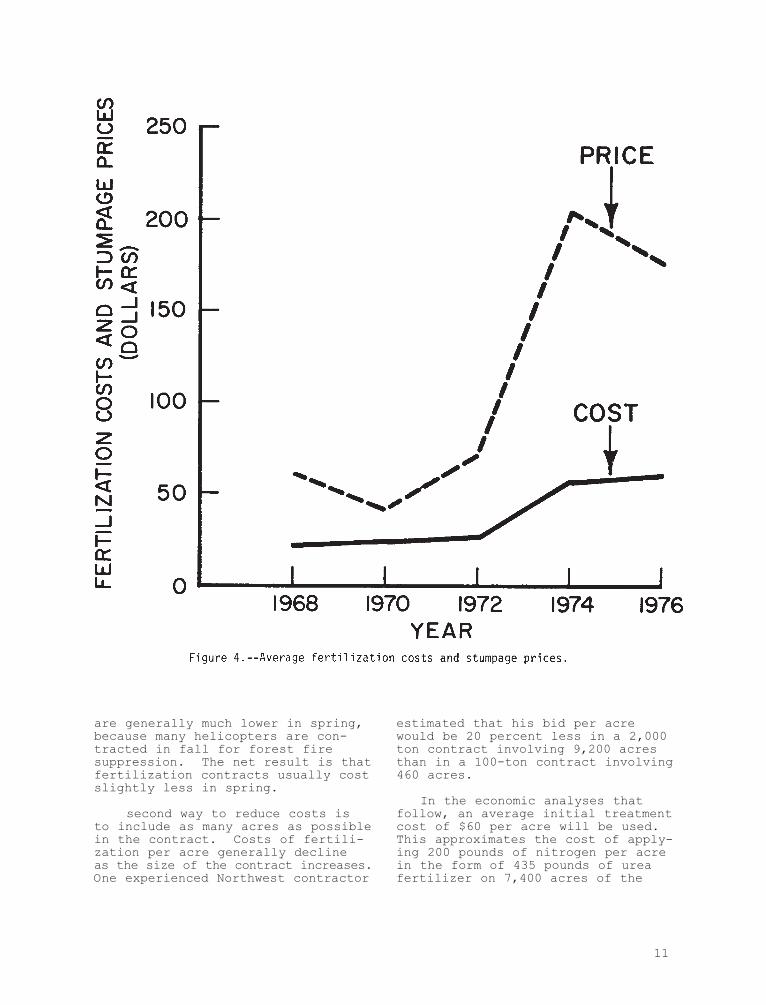
Past costs of fertilization variedwidely from year-to-year and fromjob-to-job. In 1970, the total costof applying 200 pounds of nitrogenper acre averaged about $23. By 1974,when worldwide fertilizer and petro-leum shortages developed, averagecosts more than doubled to about $57 per acre. On the income side ofthe financial ledger, however, stumpageprices increased by an even greateramount during the same period, sofertilization appeared to be a moreattractive investment in 1974 than in 1970 (fig. 4)
One can minimize costs of a fertil-ization contract in at least two ways.As with most goods and services, theseasonal price for both fertilizerand application reflect supply anddemand. Due to seasonal demands inagriculture, fertilizer prices areusually 3 to 5 percent lower in falland winter. Application costs, however,
11
are generally much lower in spring,because many helicopters are con-tracted in fall for forest fire suppression. The net result is thatfertilization contracts usually costslightly less in spring.
second way to reduce costs is to include as many acres as possiblein the contract. Costs of fertili-zation per acre generally declineas the size of the contract increases.One experienced Northwest contractor
estimated that his bid per acrewould be 20 percent less in a 2,000ton contract involving 9,200 acresthan in a 100-ton contract involving460 acres.
In the economic analyses thatfollow, an average initial treatmentcost of $60 per acre will be used.This approximates the cost of apply-ing 200 pounds of nitrogen per acrein the form of 435 pounds of ureafertilizer on 7,400 acres of the
12
Willamette National Forest in 1976.To illustrate the effects of a lowerinitial cost, a $40 per acre treat-ment cost will also be used.
INTEREST CHARGES
The compound interest costs ofcarrying the initial investmentstrongly affect profits gained fromfertilization and other intensivemanagement practices. As consumers,we know that such carrying chargesare based on interest rate andduration of the loan. Although themarket rate of interest may be 12percent, the real rate of interestis less because the rate of inflationmust be subtracted from it. Forexample, if one borrows money at the market rate of 12 percent andthe annual rate of inflation is 5
percent, then the real rate of in-terest is only 7 percent.
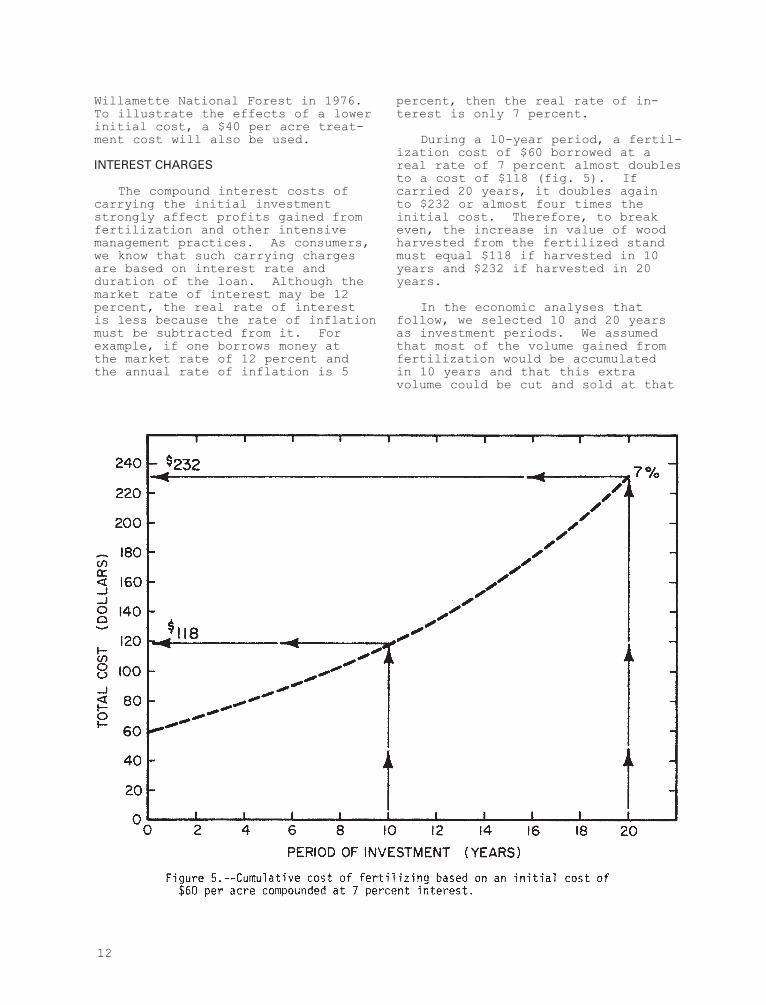
During a l0-year period, a fertil-ization cost of $60 borrowed at a real rate of 7 percent almost doublesto a cost of $118 (fig. 5). If carried 20 years, it doubles again to $232 or almost four times the initial cost. Therefore, to breakeven, the increase in value of woodharvested from the fertilized standmust equal $118 if harvested in 10years and $232 if harvested in 20years.
In the economic analyses that follow, we selected 10 and 20 yearsas investment periods. We assumedthat most of the volume gained fromfertilization would be accumulated in 10 years and that this extra volume could be cut and sold at that
13
time. But harvesting trees 10 yearsafter treatment is only reasonableif fertilizer is applied to a standthat is merchantable or nearly mer-chantable. If smaller trees arefertilized, then a longer invest-ment period is necessary until croptrees reach merchantable size.
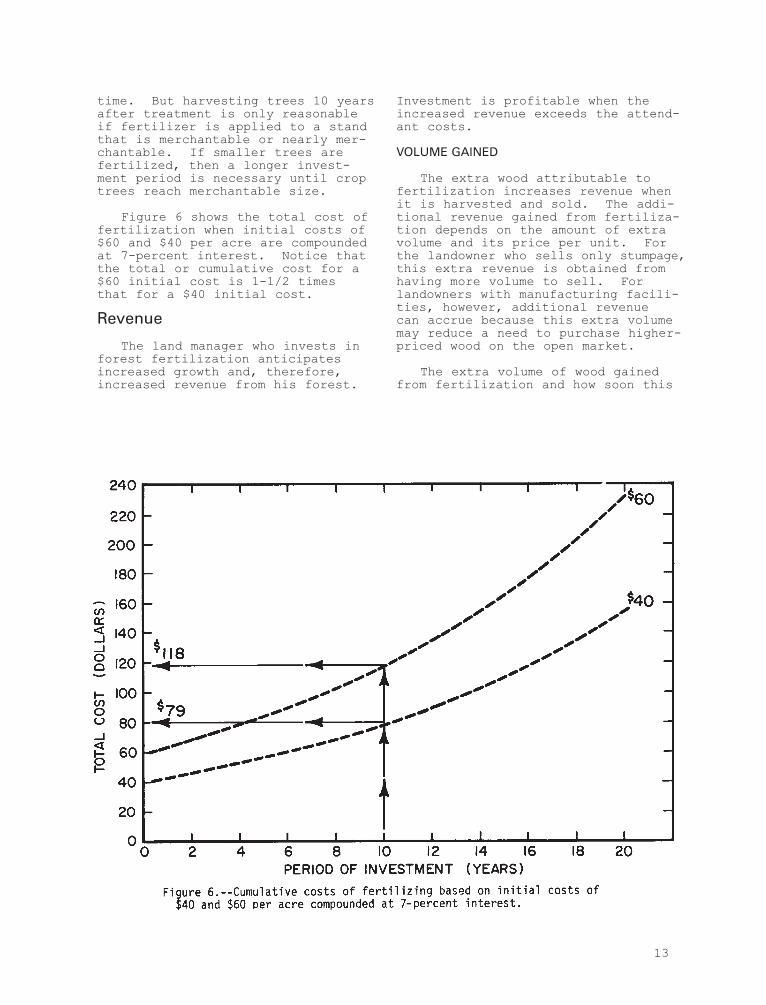
Figure 6 shows the total cost offertilization when initial costs of$60 and $40 per acre are compoundedat 7-percent interest. Notice thatthe total or cumulative cost for a$60 initial cost is 1-1/2 times that for a $40 initial cost.
Revenue
The land manager who invests inforest fertilization anticipatesincreased growth and, therefore,increased revenue from his forest.
Investment is profitable when theincreased revenue exceeds the attend-ant costs.
VOLUME GAlNED
The extra wood attributable tofertilization increases revenue whenit is harvested and sold. The addi-tional revenue gained from fertiliza-tion depends on the amount of extravolume and its price per unit. Forthe landowner who sells only stumpage,this extra revenue is obtained fromhaving more volume to sell. Forlandowners with manufacturing facili-ties, however, additional revenue can accrue because this extra volumemay reduce a need to purchase higher-priced wood on the open market.
The extra volume of wood gainedfrom fertilization and how soon this
14
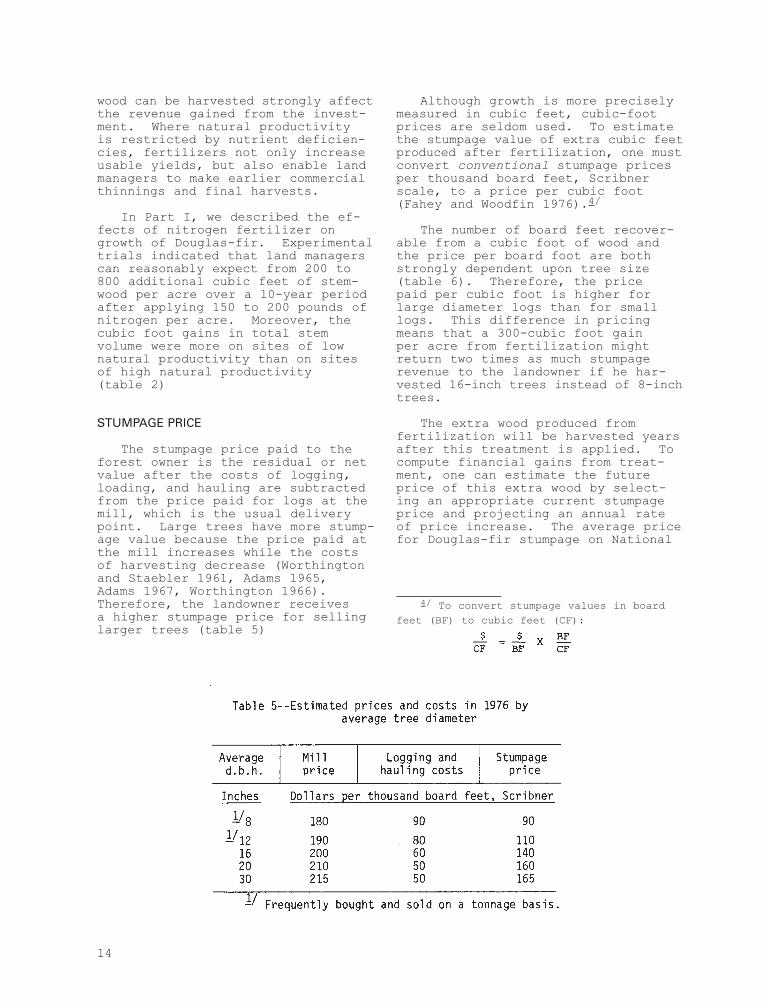
Although growth is more preciselymeasured in cubic feet, cubic-footprices are seldom used. To estimatethe stumpage value of extra cubic feetproduced after fertilization, one mustconvert conventional stumpage pricesper thousand board feet, Scribnerscale, to a price per cubic foot(Fahey and Woodfin 1976).4/
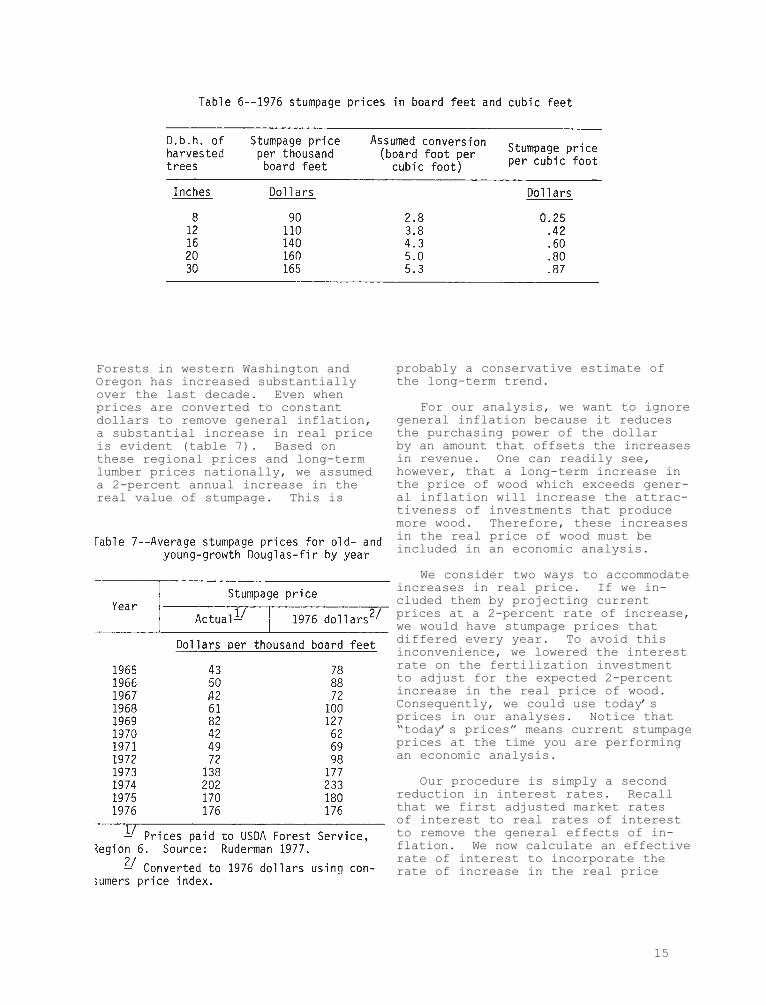
The number of board feet recover-able from a cubic foot of wood andthe price per board foot are bothstrongly dependent upon tree size(table 6). Therefore, the price paid per cubic foot is higher forlarge diameter logs than for smalllogs. This difference in pricingmeans that a 300-cubic foot gain per acre from fertilization mightreturn two times as much stumpagerevenue to the landowner if he har-vested 16-inch trees instead of 8-inchtrees.
The extra wood produced from fertilization will be harvested yearsafter this treatment is applied. Tocompute financial gains from treat-ment, one can estimate the futureprice of this extra wood by select-ing an appropriate current stumpageprice and projecting an annual rateof price increase. The average pricefor Douglas-fir stumpage on National
4/ To convert stumpage values in board
feet (BF) to cubic feet (CF):
wood can be harvested strongly affectthe revenue gained from the invest-ment. Where natural productivity is restricted by nutrient deficien-cies, fertilizers not only increaseusable yields, but also enable landmanagers to make earlier commercialthinnings and final harvests.
In Part I, we described the ef-fects of nitrogen fertilizer ongrowth of Douglas-fir. Experimentaltrials indicated that land managerscan reasonably expect from 200 to800 additional cubic feet of stem-wood per acre over a l0-year periodafter applying 150 to 200 pounds ofnitrogen per acre. Moreover, thecubic foot gains in total stem volume were more on sites of lownatural productivity than on sitesof high natural productivity (table 2)
STUMPAGE PRlCE
The stumpage price paid to theforest owner is the residual or netvalue after the costs of logging,loading, and hauling are subtractedfrom the price paid for logs at themill, which is the usual deliverypoint. Large trees have more stump-age value because the price paid atthe mill increases while the costsof harvesting decrease (Worthingtonand Staebler 1961, Adams 1965, Adams 1967, Worthington 1966).Therefore, the landowner receives a higher stumpage price for sellinglarger trees (table 5)
15
Forests in western Washington andOregon has increased substantiallyover the last decade. Even whenprices are converted to constantdollars to remove general inflation,a substantial increase in real priceis evident (table 7). Based onthese regional prices and long-termlumber prices nationally, we assumeda 2-percent annual increase in thereal value of stumpage. This is
probably a conservative estimate ofthe long-term trend.
For our analysis, we want to ignoregeneral inflation because it reducesthe purchasing power of the dollar by an amount that offsets the increasesin revenue. One can readily see, however, that a long-term increase inthe price of wood which exceeds gener-al inflation will increase the attrac-tiveness of investments that producemore wood. Therefore, these increasesin the real price of wood must beincluded in an economic analysis.
We consider two ways to accommodateincreases in real price. If we in-cluded them by projecting currentprices at a 2-percent rate of increase,we would have stumpage prices thatdiffered every year. To avoid thisinconvenience, we lowered the interestrate on the fertilization investmentto adjust for the expected 2-percentincrease in the real price of wood.Consequently, we could use today’sprices in our analyses. Notice that“today’s prices” means current stumpageprices at the time you are performingan economic analysis.
Our procedure is simply a secondreduction in interest rates. Recallthat we first adjusted market rates of interest to real rates of interestto remove the general effects of in-flation. We now calculate an effectiverate of interest to incorporate therate of increase in the real price
16
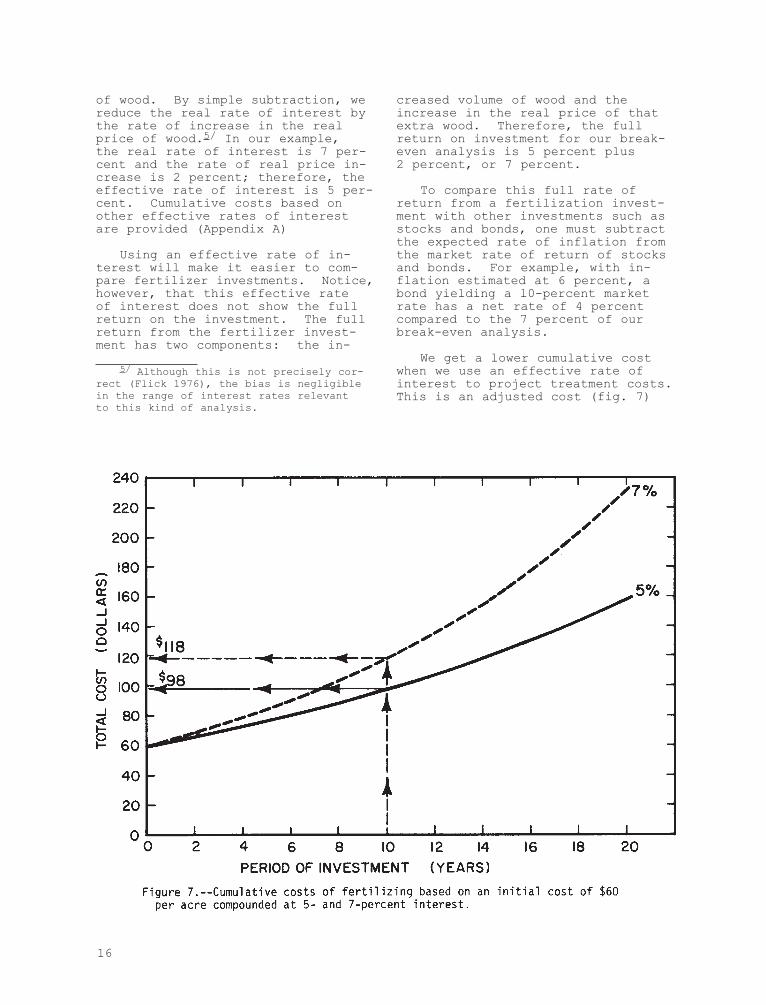
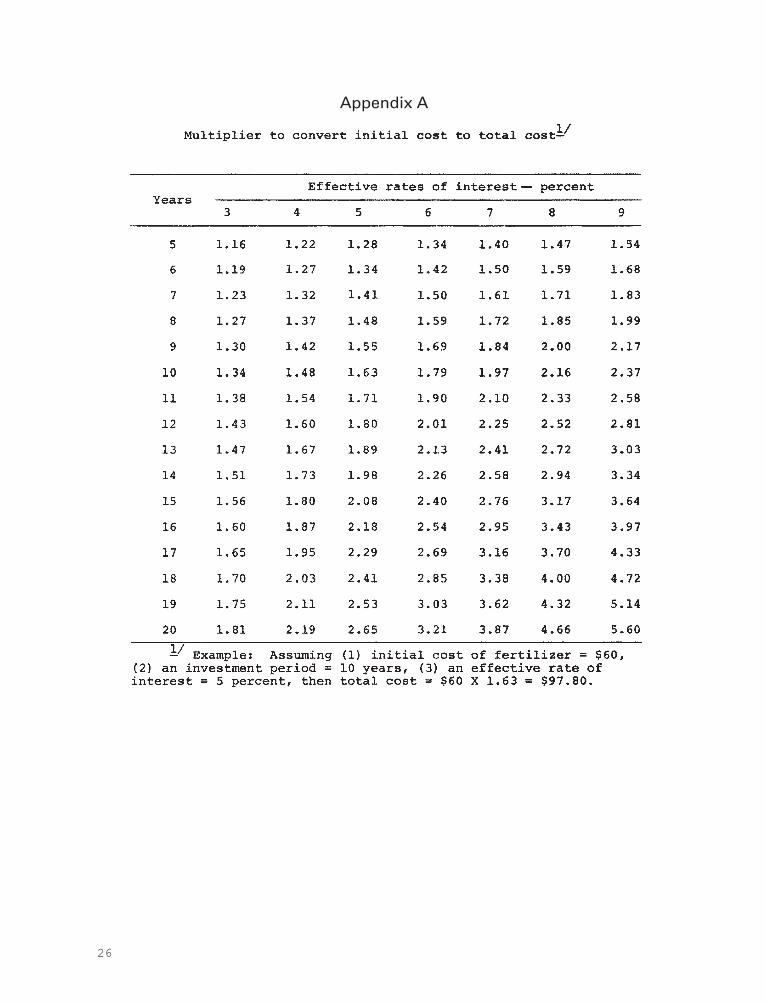
of wood. By simple subtraction, wereduce the real rate of interest bythe rate of increase in the realprice of wood.5/ In our example, the real rate of interest is 7 per-cent and the rate of real price in-crease is 2 percent; therefore, theeffective rate of interest is 5 per-cent. Cumulative costs based onother effective rates of interestare provided (Appendix A)
Using an effective rate of in-terest will make it easier to com-pare fertilizer investments. Notice,however, that this effective rate of interest does not show the fullreturn on the investment. The fullreturn from the fertilizer invest-ment has two components: the in-
5/ Although this is not precisely cor-rect (Flick 1976), the bias is negligiblein the range of interest rates relevant to this kind of analysis.
creased volume of wood and theincrease in the real price of thatextra wood. Therefore, the fullreturn on investment for our break-even analysis is 5 percent plus 2 percent, or 7 percent.
To compare this full rate of return from a fertilization invest-ment with other investments such asstocks and bonds, one must subtractthe expected rate of inflation fromthe market rate of return of stocksand bonds. For example, with in-flation estimated at 6 percent, a bond yielding a l0-percent marketrate has a net rate of 4 percent compared to the 7 percent of ourbreak-even analysis.
We get a lower cumulative cost when we use an effective rate ofinterest to project treatment costs.This is an adjusted cost (fig. 7)
17
The broken line shows a $60 treat-ment cost that became a cost of818 after 10 years. The solidline shows that a $60 treatment cost expands to an adjusted cost of$98. When we use the effective rateof interest, we have automaticallyincorporated our assumed 2-percentannual increase in the real price of wood. In effect, we have offsetpart of the cumulative cost of fer-tilization by the anticipated in-crease in the real price of wood.
Revenue Required to Break Even
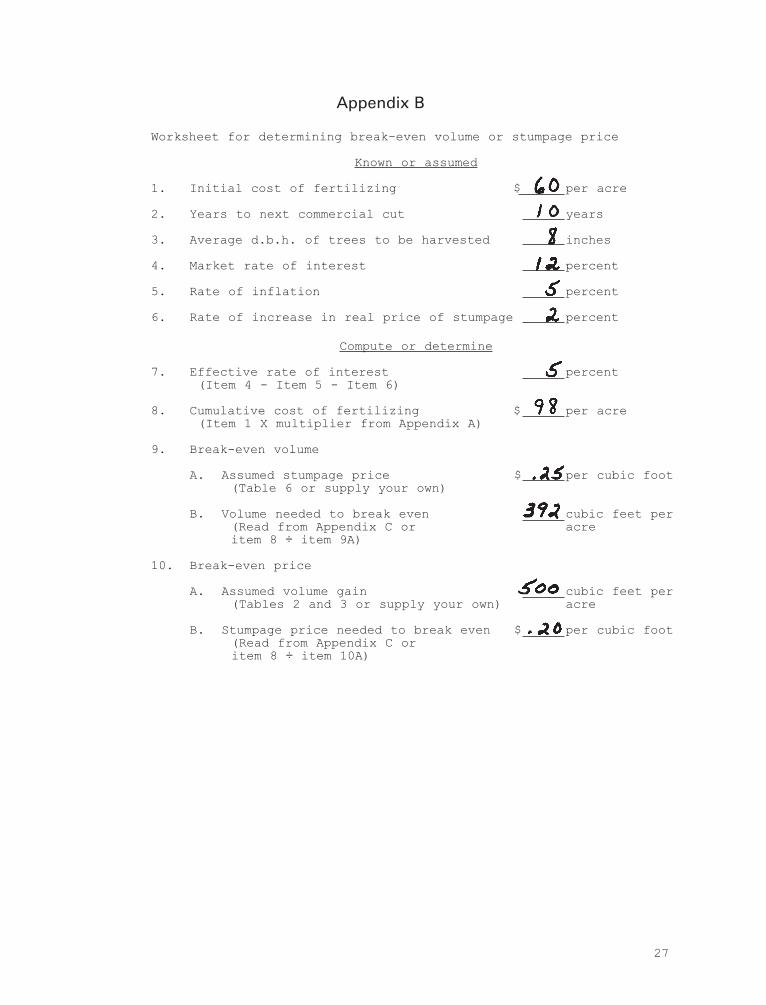
Now we will put these economicdefinitions and principles intopractice by answering some practicalquestions about the economics offorest fertilization. Appendix Bincludes a sample worksheet sup-porting some of these examples and a blank form that can be used forother analyses. You will see what
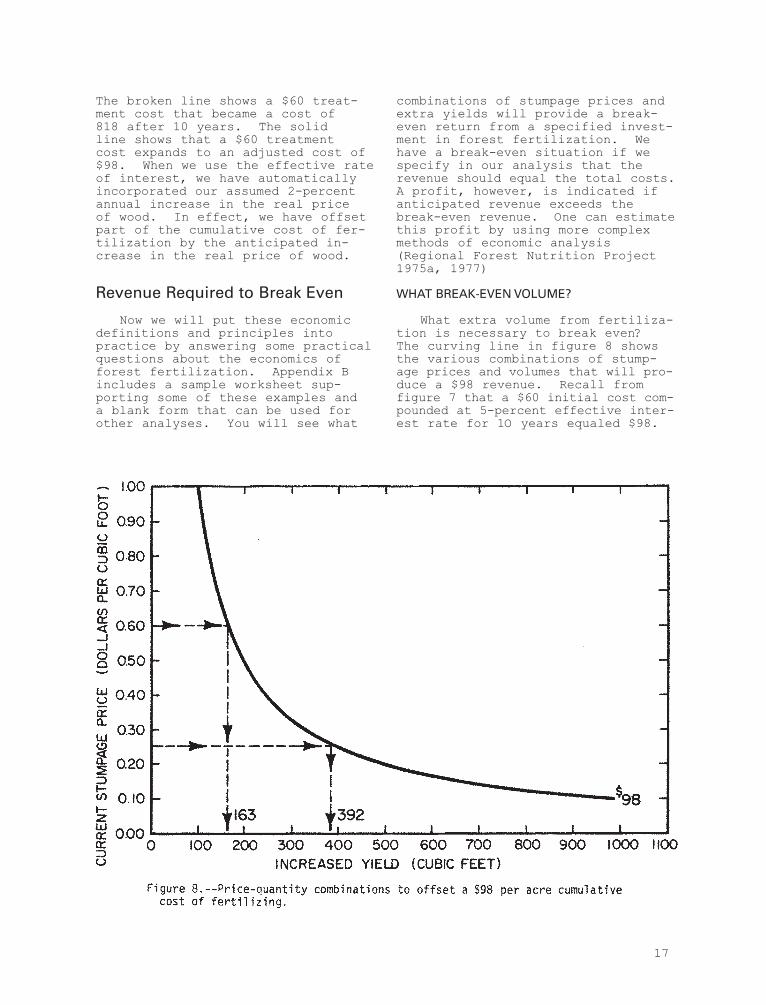
combinations of stumpage prices andextra yields will provide a break-even return from a specified invest-ment in forest fertilization. Wehave a break-even situation if wespecify in our analysis that therevenue should equal the total costs.A profit, however, is indicated ifanticipated revenue exceeds thebreak-even revenue. One can estimatethis profit by using more complexmethods of economic analysis(Regional Forest Nutrition Project1975a, 1977)
WHAT BREAK-EVEN VOLUME?
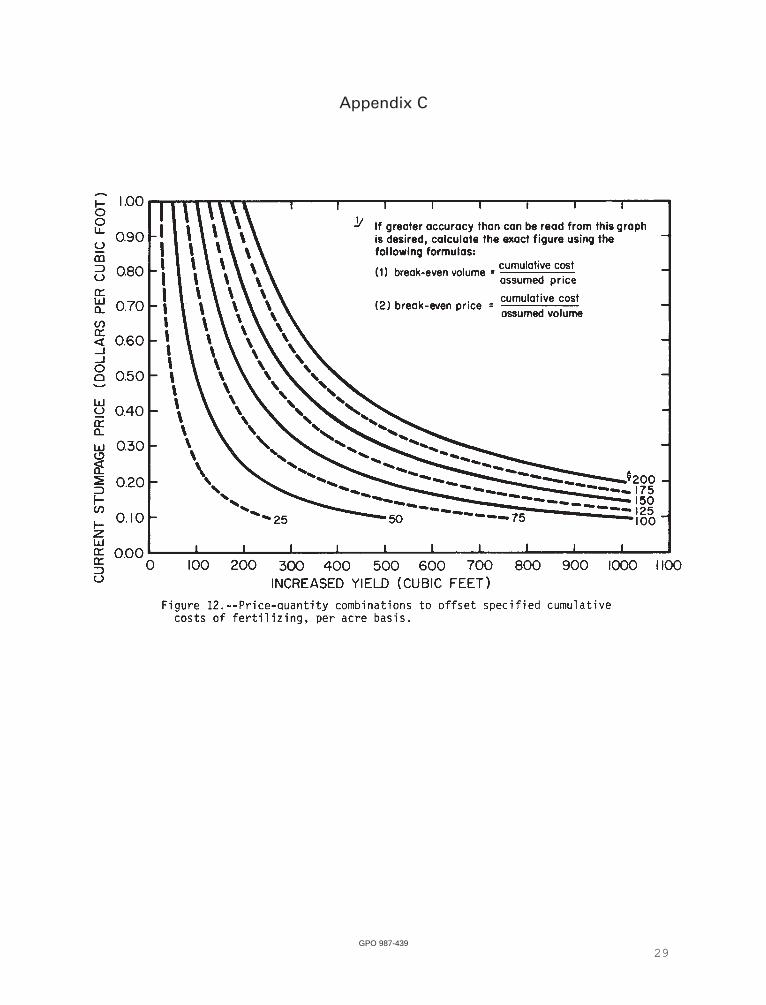
What extra volume from fertiliza-tion is necessary to break even? The curving line in figure 8 showsthe various combinations of stump-age prices and volumes that will pro-duce a $98 revenue. Recall fromfigure 7 that a $60 initial cost com-pounded at 5-percent effective inter-est rate for 1O years equaled $98.
18
Notice that the amount of extravolume needed to break even dependson the stumpage price; lesser vol-umes are needed when stumpage pricesare high.
For example, stumpage price fortrees averaging 8-inch d.b.h. atharvest was estimated at 25 centsper cubic foot and for trees averag-ing 16-inch d.b.h. was 60 cents(table 6). Using these stumpageprices, we see that the break-evenvolume from 8-inch trees is 392cubic feet and 163 cubic feet ifharvested from 16-inch trees(fig. 8). This clearly illustratesthe economic advantage of increas-ing growth of larger trees and har-vesting gains from larger trees.
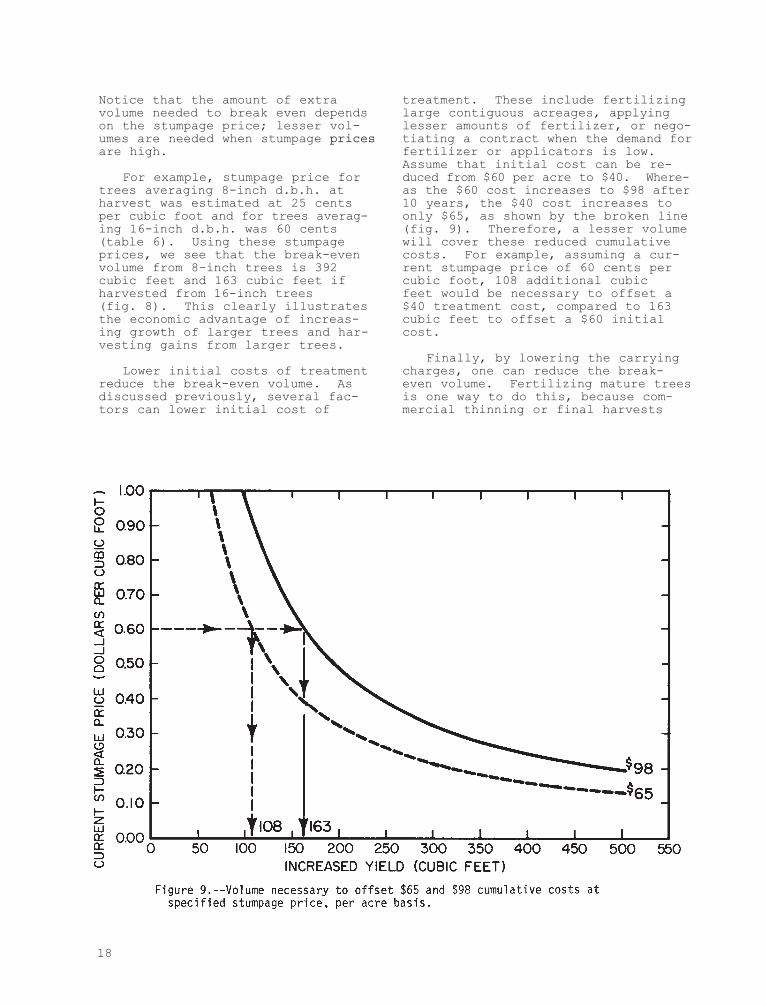
Lower initial costs of treatmentreduce the break-even volume. Asdiscussed previously, several fac-tors can lower initial cost of
treatment. These include fertilizinglarge contiguous acreages, applyinglesser amounts of fertilizer, or nego-tiating a contract when the demand forfertilizer or applicators is low.Assume that initial cost can be re-duced from $60 per acre to $40. Where-as the $60 cost increases to $98 after10 years, the $40 cost increases toonly $65, as shown by the broken line(fig. 9). Therefore, a lesser volumewill cover these reduced cumulativecosts. For example, assuming a cur-rent stumpage price of 60 cents percubic foot, 108 additional cubic feet would be necessary to offset a$40 treatment cost, compared to 163cubic feet to offset a $60 initialcost.
Finally, by lowering the carryingcharges, one can reduce the break-even volume. Fertilizing mature treesis one way to do this, because com-mercial thinning or final harvests
19
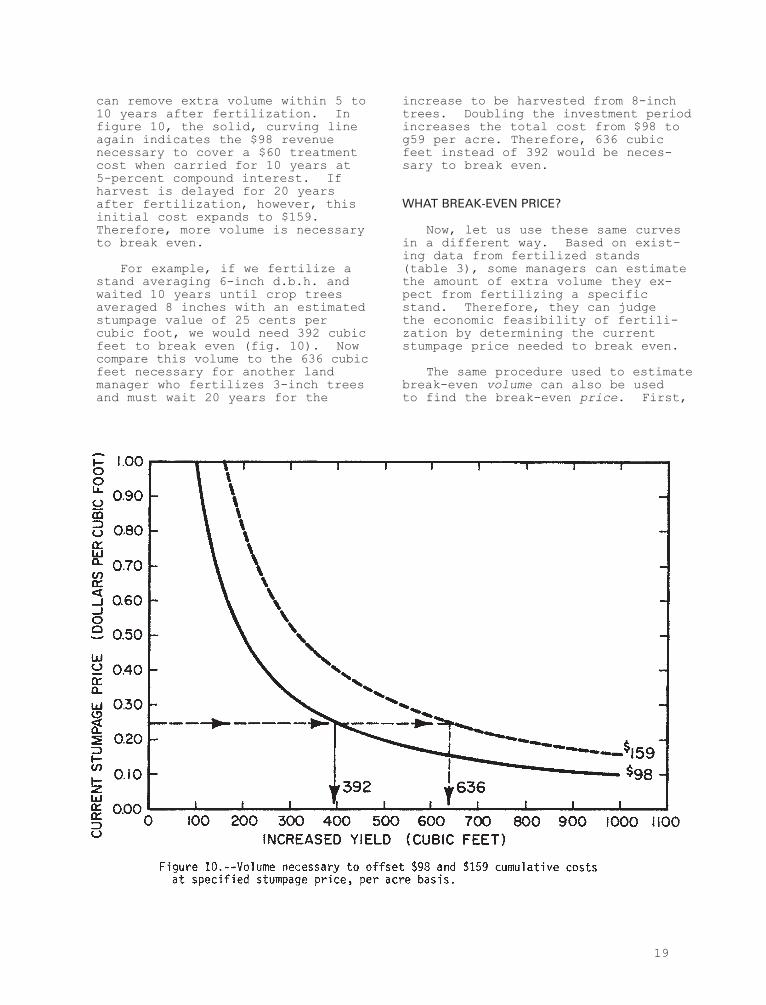
can remove extra volume within 5 to10 years after fertilization. Infigure 10, the solid, curving lineagain indicates the $98 revenuenecessary to cover a $60 treatmentcost when carried for 10 years at5-percent compound interest. Ifharvest is delayed for 20 yearsafter fertilization, however, thisinitial cost expands to $159.Therefore, more volume is necessaryto break even.
For example, if we fertilize astand averaging 6-inch d.b.h. andwaited 10 years until crop treesaveraged 8 inches with an estimatedstumpage value of 25 cents percubic foot, we would need 392 cubicfeet to break even (fig. 10). Nowcompare this volume to the 636 cubicfeet necessary for another landmanager who fertilizes 3-inch treesand must wait 20 years for the
increase to be harvested from 8-inchtrees. Doubling the investment periodincreases the total cost from $98 tog59 per acre. Therefore, 636 cubicfeet instead of 392 would be neces-sary to break even.
WHAT BREAK-EVEN PRICE?
Now, let us use these same curvesin a different way. Based on exist-ing data from fertilized stands(table 3), some managers can estimatethe amount of extra volume they ex-pect from fertilizing a specificstand. Therefore, they can judgethe economic feasibility of fertili-zation by determining the currentstumpage price needed to break even.
The same procedure used to estimatebreak-even volume can also be used to find the break-even price. First,
20
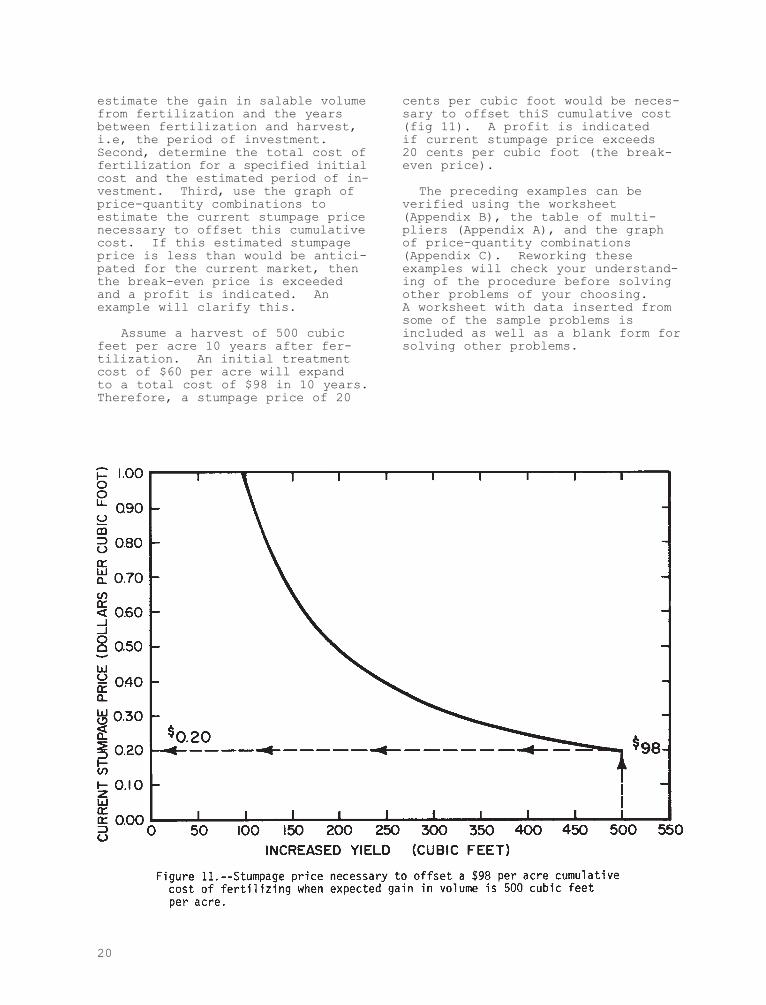
estimate the gain in salable volumefrom fertilization and the yearsbetween fertilization and harvest,i.e, the period of investment.Second, determine the total cost offertilization for a specified initialcost and the estimated period of in-vestment. Third, use the graph ofprice-quantity combinations toestimate the current stumpage pricenecessary to offset this cumulativecost. If this estimated stumpageprice is less than would be antici-pated for the current market, thenthe break-even price is exceededand a profit is indicated. Anexample will clarify this.
Assume a harvest of 500 cubicfeet per acre 10 years after fer-tilization. An initial treatmentcost of $60 per acre will expand to a total cost of $98 in 10 years.Therefore, a stumpage price of 20
cents per cubic foot would be neces-sary to offset thiS cumulative cost(fig 11). A profit is indicatedif current stumpage price exceeds 20 cents per cubic foot (the break-even price).
The preceding examples can be verified using the worksheet(Appendix B), the table of multi-pliers (Appendix A), and the graph of price-quantity combinations(Appendix C). Reworking these examples will check your understand-ing of the procedure before solvingother problems of your choosing. A worksheet with data inserted fromsome of the sample problems isincluded as well as a blank form forsolving other problems.
21
Other Financial Considerations
The effect of income taxes, thetiming of cash flow, and other fac-tors to be included in investmentdecisions are discussed below.
EFFECT OF lNCOME TAXES
Our previous discussion and examples were directed toward ob-taining a break-even analysis on abefore-tax basis. Forestry and nonforestry investments should, however, be compared on a before-and after-tax basis. Net incomefrom the timber sale will ordinarilybe taxed as a capital gain ratherthan as ordinary income. Thisreduces the tax effect, becausepart of the income is tax exempt.Thus, the effect of taxation onforestry investments is often lessthan it is on most other investments.
Costs and revenues could beentered on the accompanying work-sheet on an after-tax basis byadjusting them for tax effects. The result would be a break-evenanalysis on an after-tax basis that could be compared to otherinvestments on an after-tax basis.More detailed procedures for doingthat, however, are beyond the scopeof this report.
CASH FLOW MANAGEMENT
As anyone with a checking accountand financial obligations knows, cashflow management requires some atten-tion. Negative balances are nottolerated for long and penalty costsare associated with them. Cash flowmanagement by forest landowners posessimilar problems. Some landownershave ready access to outside sourcesof investment capital while othersdo not. Those without ready accessto capital must pay particular atten-tion to cash flow management. Eventhose with ready access to capitalmust manage cash flows carefully,because the cost of borrowing capital is usually higher when itcomes from outside sources. Formost landowners, financing newinvestments out of accumulated
savings or current income is probablythe least costly method of financing.Therefore, forest landowners shouldconsider timing receipts from timberharvest to provide cash needed forinvestments like fertilization. Insome circumstances, altering the timing of commercial thinning orfinal harvest to coincide with needsfor cash may be the most attractivemethod of financing.
CASH FLOW EFFECTS
Our economic analysis relates tofertilizing a specific stand of trees.Costs are incurred when a stand isfertilized. Subsequently, interestcharges accrue on this investment.Revenue is received when the fertil-ized stand is thinned or harvested.This sequence of activities closelyapproximates the cash flow thatresults from fertilization invest-ments for many private and some public forest managers. The effectof fertilization on the cash flowfrom some forests, however, may bevery different.
On most public lands, the policyis to provide a non-declining flowof wood from the forest. This policymakes current harvests sensitive tocurrent and future growth rates.
Mature or overmature stands inthe forest inventory provide flexi-bility to harvest immediately extragrowth gained from treating immaturestands. For example, when growth is increased by fertilizing youngstands, the harvest and resultingcash flow from mature stands mayincrease immediately. The increasein current harvest that occurs beforeany treated stands are actually har-vested is called the “allowable cuteffect” (Schweitzer et al. 1972).
It is widely recognized that theallowable cut effect occurs. It isalso widely recognized that the immediate increase in current har-vest and cash flow is the result ofincreasing the growth on futurestands. Clearly, this immediateincrease in cash flow does not come directly from the sale of woodthat is produced by the fertilizer.Yet, through the allowable cut effect,
22
fertilization can increase harvestlevel and cash flow.
Understandably, there is disagree-ment and controversy over the con-sideration that should be given tothis immediate cash flow increase in ranking alternative investments in forest management (Lundgren 1973,Teeguarden 1973). Furthermore, themagnitude of the allowable cut effect does not have a predictablerelationship to the increases infuture growth (Bell 1976). Theallowable cut effect can be reliablyestimated only by making a series of allowable harvest calculationsand then comparing them. Becauseof these limitations, it is probablyunsafe to consider the allowable cuteffect in investment decisions with-out t~e counsel of someone knowledge-able in the economic theory thatsupports benefit-cost analysis. The immediate increase in cash flow,however, that would accompany a fertilization program is a conse-quence that decisionmakers shouldrecognize.
Summary
The seven major points of Part IIfollow:
1. The total costs of fertiliza-tion include the initial costs offertilizing and the interest chargeson this investment.
2. Because of the nature of com-pound interest charges, fertilizingstands that will be harvested in 10years will generally be more profit-able than fertilizing stands thatwill be harvested after a longerinvestment period.
3. Because larger trees bring a higher price than smaller trees,fertilizing larger trees will gen-erally be more profitable than treating smaller trees on sites ofequal productivity.
4. Because of the greater growthincreases reported for low-qualitysites after fertilization, fertiliz-ing trees on these poorer sites willgenerally be more profitable thantreating trees of the same size onsites of higher natural productivity.
More precise statements about settingpriorities among stands for fertiliza-tion require more detailed informationand analysis.
5. A projected long-term increasein the price of wood which exceedsgeneral inflation will increase theattractiveness of fertilization andother investments that produce morewood.
6. Timing of receipts from timberharvests to coincide with cash needsfor fertilization will often be theleast costly method of financing.
7. Fertilization can be an eco-nomically attractive way to increasewood production of Douglas-fir forests.
Literature Cited
American Pulpwood Association. 1975. Fuel requirements for har
vesting pulpwood. 15 p. Wash.,D.C.
Adams, Thomas C.1965. High-lead logging costs as
related to log size and othervariables. USDA For. Serv. Res.Pap. PNW-23, 38 p. Pac. NorthwestFor. and Range Exp. Stn., Portland,Oreg.
Adams, Thomas C.1967. Production rates in commer-
cial thinning of young-growthDouglas-fir. USDA For. Serv.Res. Pap. PNW-41, 35 p. Pac.Northwest For. and Range Exp.Stn., Portland, Oreg.
Atkinson, William A.1974. Forest fertilization research
and land use planning implications--the western United States. InForesters in land-use planning.Natl. Conv. Soc. Am. For. Proc.1973:199-220, illus.
Austin, R. C., and R. F. Strand. 1960. The use of slowing soluble
fertilizers in forest plantingin the Pacific Northwest. J. For.58(8):619-627.
Bell, Enoch F.1976. Yes, increased yields can
reduce harvests! USDA For. Serv.Res. Note PNW-282, 5 p. Pac.Northwest For. and Range Exp. Stn.Portland, Oreg.
23
Boyd, Conor W., Peter Kock, HerbertB. McKean, Charles R. Morschauser,Stephen B. Preston, and Frederick F.Wangaard.
1976. Wood for structural and architectural purposes. J. Soc.of Wood Sci. and Tech. 8(1):3-72.
Burroughs, Edward R., Jr., and HenryA. Froehlich.
1972. Effects of forest fertiliza-tion on water quality in twoOregon watersheds. U.S. Depart-ment of the Interior, Bur. LandManage. Tech. Note, 8 p. Port-land, Oreg.
Crossin, E. C., J. A. Marlow, andG. L. Ainscough.
1966. A progress report on forestnutrition studies on VancouverIsland. For. Chron. 42(3):265-284.
Dykstra, Dennis P.1976. Production rates and costs
for yarding by cable, balloon,and helicopter compared forclearcuttings and partialcuttings. For. Res. Lab. Res.Bull. 22, 44 p. Sch. For.Oreg. State Univ., Corvallis.
Evans, R. S.1974. Energy plantations--should
we grow trees for power plantfuel? Info. Rep. VP-X-129, 15 p. Dep. Environ., Can. For.Serv., Vancouver, B.C.
Fahey, Thomas D., and Richard O.Woodfin, Jr.
1976. The cubics are coming: Predicting product recoveryfrom cubic volume. J. For.74(11):739-743, illus.
Flick, Warren A.1976. A note on inflation and
forest investments. For. Sci.22(1):30-32.
Gessel, S. P., D. W. Cole, and E. C. Steinbrenner.
1972. Nitrogen balances in forestecosystems of the Pacific North-west. Soil Biol. Biochem. 5:19-34.
Gessel, S. P., T. N. Stoate, and K. J. Turnbull.
1965. The growth behavior of Douglas-fir with nitrogenousfertilizer in western Washington.Coll. For. Resour. Res. Bull. 1,203 p. Univ. Wash., Seattle.
Grantham, John B., and Thomas H.Ellis.
1974. Potentials of wood for pro-ducing energy. J. For. 72(9):552-556.
Grantham, John B., Eldon M. Estep,John M. Pierovich, Harold Tarkow, andThomas C. Adams.
1974. Energy and raw material potentials of wood residue inthe Pacific Coast states--a summary of a preliminary feasi-bility investigation. US~A For.Serv. Gen. Tech. Rep. PNW-18, 37 p. Pac. Northwest For. andRange Exp. Stn., Portland, Oreg.
Groman, W. A.1972. Forest fertilization: A
state-of-the-art review anddescription of environmentaleffects. Environ. Prot. Tech.Ser. EPA-R2-016, 57 p. Pac.Northwest Water Lab., NERC, EPA,Corvallis, Oreg.
Hartman, David A., William A. Atkinson,Ben S. Bryant, and Richard O. Woodfin.
[n.d.] Conversion factors for the Pacific Northwest industry. 122 p.Inst. For. Prod., Coll. For.Resour., Univ. Wash., Seattle.
Heilman, Paul.1971. Effects of fertilization on
Douglas-fir in southwestern Wash-ington. Wash. Agric. Exp. Stn.,Circ. 535, 23 p. Puyallup, Wash.
Heilman, Paul.1974. Effect of urea fertilization
on nitrification in forest soilsof the Pacific Northwest. SoilSci. Soc. Am. Proc. 38(4):664-667.
Lavender, D. P., and R. L. Carmichael.1966. Effect of three variables on
mineral concentration in Douglas-fir needles. For. Sci. 12(4):441-446.
24
Lee, Y. Jim.1974. Four-year basal area growth
response of a 25-year-old Douglas-fir stand to thinning and ureafertilization. Can. J. For.Res. 4:568-571.
Lundgren, Allen L.1973. The allowable cut effect.
Some further extensions. J. For.71(6):357, 360.
McArdle, Richard E., Walter H. Meyer,and Donald Bruce.
1961. The yield of Douglas-fir inthe Pacific Northwest. U.S. Dep.Agric. Tech. Bull. 201, 74 p.,illus. Wash., D.C.
McCall, Merley.1970. The effects of aerial forest
fertilization on water qualityfor two streams in the CapitolForest. 20 p. Wash. State Dep.Ecol., Olympia, Wash.
Miller, R. E., and L. V. Pienaar. 1973. Seven-year response of 35
year-old Douglas-fir to nitrogenfertilizer. USDA For. Serv.Res. Pap. PNW-165, 24 p., illus.Pac. Northwest For. and RangeExp. Stn., Portland, Oreg.
Miller, Richard E., Denis P. Lavender,and Charles C. Grier.
1976. Nutrient cycling in the Douglas-fir type - silviculturalimplications. Proc., 1975 Annu.Conv., Soc. Am. For., p. 359-390.
Miller, Richard E., and Donald L.Reukema.
1974. Seventy-five-year-old Douglas-fir on high-qualitysite respond to nitrogen fertil-izer. USDA For. Serv. Res. NotePNW-237, 8 p. Pac. NorthwestFor. and Range Exp. Stn.,Portland, Oreg.
Miller, Richard E., and Donald C.Young.
1976. Forest fertilization: Foliar application of nitrogensolutions proves efficient.Fert. Solutions 20(2):36, 40,42, 44, 46, 48, 59-60.
Moore, Duane G.1974. Impact of forest fertiliza-
tion on water quality in theDouglas-fir region--a summary of monitoring studies. Natl.Conv. Soc. Am. For. Proc. 1974:209-219, illus.
Moore, Duane G.1975. Effects of forest fertil-
ization with urea on stream water quality--Quilcene RangerDistrict, Washington. USDA For.Serv. Res. Note PNW-241, 9 p.Pac. Northwest For. and RangeExp. Stn., Portland, Oreg.
National Academy of Sciences. 1976. Renewable resources for
industrial materials. Rep. ofComm. on Renewable Resour. forIndus. Mater. (CORRIM). 267 p.Print. and Publ. Office, Natl.Acad. Sci., Wash., D.C.
National Academy of Sciences-NationalAcademy of Engineering.
1973. Water quality criteria, 1972.Ecol. Res. Ser. EPA-R3-73-033,594 p., illus. U.S. Govt. Print.Off., Wash., D.C.
Norris, Logan A., and Duane G. Moore.1971. The entry and fate of forest
chemicals in streams. In J. T.Krygier and J. D. Hall (eds.),Forest land uses and stream environment symposium proceedings.p. 138-158. Oreg. State Univ.,Corvallis.
Norris, Logan A., and Duane G. Moore. 1976. Forests and rangelands as
sources of chemical pollutants.In Non-point sources of waterpollution. p. 17-35. WaterResour. Res. Inst., Oreg. StateUniv., Corvallis.
Regional Forest Nutrition ResearchProject.
1975a. How much can you affordto spend on forest fertilization?An economic model. In RegionalForest Nutrition Research ProjectBiennial Report 1972-1974. p. 28-31. Coll. For. Resour.,Univ. Wash,, Seattle.
25
Regional Forest Nutrition ResearchProject.
1975b. Preliminary responsesummaries. In Regional ForestNutrition Research ProjectBiennial Report 1972-1974. p. 3-1A Coll. For. Resour.,Univ. Wash., Seattle.
Regional Forest Nutrition ResearchProject.
1977. VI. An economic analysisof Douglas-fir response tonitrogen fertilizer. In RegionalForest Nutrition Research ProjectBiennial Report 1974-1975. p. 27-35. Coll. For. Resour.,Univ. Wash., Seattle.
Reifsnyder, William E., and HowardW. Lull.
1965. Radiant energy in relationto forests. U.S. Dep. Agric.Tech. Bull. 1344, 111 p. Wash., D.C.
Ruderman, Florence K.1977. Production, prices, employ-ment, and trade in Northwestforest industries, 4th quarter1976. 54 p. Pac. NorthwestFor. and Range Exp, Stn., Port-land, Oreg.
Schweitzer, Dennis L., Robert W.Sassaman, and Con H. Schallau.
1972. Allowable cut effect: some physical and economic im-plications. J. For. 70(7):415-418.
Shumway, J. S., and W. A. Atkinson. 1977. Measuring and predictinggrowth response in unthinnedstands of Douglas-fir by pairedtree analysis and soil testing.State of Wash. Dep. Natur.Resour. DNR Note No. 15, 10 p.Olympia, Wash.
Smith, David M., and Evert W.Johnson.
1977. Silviculture: Highlyenergy efficient. J. For.75(4):208-210.
Staebler, George R.1955. Gross yield and mortality tables for fully stocked standsof Douglas-fir. USDA For. Serv.Pac. Northwest For. and RangeExp. Stn. Res. Pap. No. 14, 20 p., illus. Portland, Oreg.
Steinbrenner, E. C.1968. Research in forest fertil-ization at Weyerhaeuser Companyin the Pacific Northwest. InForest fertilization...theoryand practice. p. 209-215.Tenn. Valley Authority, MuscleShoals, Ala.
Tamm, C. O.1973. Effects of fertilizers on the environment. In Internationalsymposium on forest fertilization.p. 299-317. Ministre de L’Agri-culture, Paris.
Teeguarden, Dennis E.1973. The allowable cut effect: A comment. J. For. 71(4): 224-226.
Thut, Rudolph N., and Eugene P. Hayden.1971. Effects of forest chemicalson aquatic life. In Forest land uses and stream environ-ment. p. 159-171. Oreg. StateUniv., Corvallis.
Turnbull, K. J., and C. E. Peterson.1976. Analysis of Douglas-fir growth response to nitrogenousfertilizer. Part 1: Regionaltrends. For. Resour. Tech.Note, Inst. For. Prod. Contrib.No. 13, 15 p. Coll. For. Resour.,Univ. Wash., Seattle.
Watkins, S. H., R. F. Strand, D. S.DeBell, and J. Esch, Jr.
1972. Factors influencing ammonialosses from urea applied tonorthwestern forest soils. SoilSci. Soc. Am. Proc. 36(2): 354-357, illus.
Worthington, Norman P.1966. Labor requirements in thin-ning Douglas-fir and westernhemlock on two experimentalforests in western Washington.USDA For. Serv. Res. Note PNW-43,12 p. Pac. Northwest For. andRange Exp. Stn., Portland, Oreg.
Worthington, Norman P., and GeorgeR. Staebler.
1961. Commercial thinning of Douglas-fir in the PacificNorthwest. USDA For. Serv.Tech. Bull. No. 1230, 124 p.Wash., D.C.
26
Appendix A
27
Appendix B
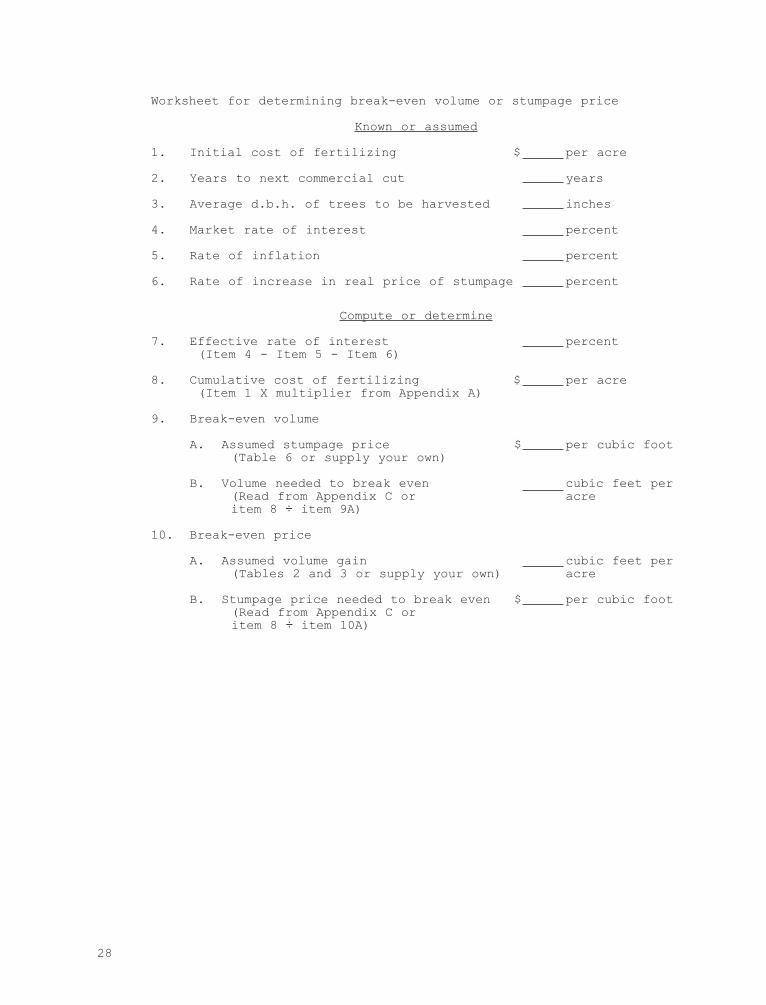
Worksheet for determining break-even volume or stumpage price
Known or assumed
1. Initial cost of fertilizing $ per acre
2. Years to next commercial cut years
3. Average d.b.h. of trees to be harvested inches
4. Market rate of interest percent
5. Rate of inflation percent
6. Rate of increase in real price of stumpage percent
Compute or determine
7. Effective rate of interest percent(Item 4 - Item 5 - Item 6)
8. Cumulative cost of fertilizing $ per acre(Item 1 X multiplier from Appendix A)
9. Break-even volume
A. Assumed stumpage price $ per cubic foot(Table 6 or supply your own)
B. Volume needed to break even cubic feet per(Read from Appendix C or acreitem 8 ÷ item 9A)
10. Break-even price
A. Assumed volume gain cubic feet per(Tables 2 and 3 or supply your own) acre
B. Stumpage price needed to break even $ per cubic foot(Read from Appendix C or item 8 ÷ item 10A)
28
Worksheet for determining break-even volume or stumpage price
Known or assumed
1. Initial cost of fertilizing $ per acre
2. Years to next commercial cut years
3. Average d.b.h. of trees to be harvested inches
4. Market rate of interest percent
5. Rate of inflation percent
6. Rate of increase in real price of stumpage percent
Compute or determine
7. Effective rate of interest percent(Item 4 - Item 5 - Item 6)
8. Cumulative cost of fertilizing $ per acre(Item 1 X multiplier from Appendix A)
9. Break-even volume
A. Assumed stumpage price $ per cubic foot(Table 6 or supply your own)
B. Volume needed to break even cubic feet per(Read from Appendix C or acreitem 8 ÷ item 9A)
10. Break-even price
A. Assumed volume gain cubic feet per(Tables 2 and 3 or supply your own) acre
B. Stumpage price needed to break even $ per cubic foot(Read from Appendix C or item 8 ÷ item 10A)
29
Appendix C
GPO 987-439
The mission of the PACIFIC NORTHWEST FOREST ANDRANGE EXPERlMENT STATlON is to provide the knowl-edge, technology, and alternatives for present and futureprotection, management, and use of forest, range. and relatedenvironments.
Within this overall mission the Station conducts and stimulates research to facilitate and to accelerate progresstoward the following goals:
1. Providing safe and efficient technology for inventory, protection, and use of resources.
2. Developing and evaluating alternative methods and levels of resource management.
3. Achieving optimum sustained resource productivity consistent with maintaining a high quality forest environment.
The area of research encompasses Oregon, Washington.Alaska, and, in some cases, California, Hawaii. the WesternStates, and the Nation. Results of the research are made available promptly. Project headquarters are at:
Anchorage, Alaska Fairbanks, Alaska Juneau, Alaska Bend, Oregon Corvallis, Oregon
Mailing address: Pacific Northwest Forest and Range Experiment Station
809 N.E. 6th Ave.Portland, Oregon 97208
La Grande, Oregon Portland, Oregon Olympia, Washington Seattle, Washington Wenatchee, Washington