feed the plant for high corn and soybean yields€¦ · feed the plant for high corn and soybean...
TRANSCRIPT

Feed the Plant for
High Corn and
Soybean Yields Fred Below
Crop Physiology Laboratory Department of Crop Sciences, University of
Illinois at Urbana-Champaign
Mosaic AgCollege
Orlando, FL January 12 & 13, 2016

Test Your Knowledge of High
Yield Corn and Soybean
•What factor has the biggest
impact on Corn and
Soybean yield each year?
Weather

Above Average Precipitation during June, 2015
Source: NOAA Midwestern Regional Climate Center

2015 Weather Challenges

2015 Weather Challenges

2015 Experimental Weather Challenges
Tryston Beyrer PhD Student
Test Your Knowledge of High
Yield Corn
•What is the record corn
yield and what is the corn
yield gap?

The Corn Yield Gap
• US average corn yield of about
170 bushels per acre
•All 18 National Corn Growers
Contest winners in 2015
exceeded 300 bushels, 5
exceeded 400 bushels
•New World Record of 532.0271
bushels per acre

Strategy for Winning the
Corn Yield Contest
•Feed (better plant nutrition)
and protect a much higher
density of plants of the best
‘racehorse’ hybrids
•Make sure the crop is never
stressed

Quest for High Yield Corn
•Intelligent Intensification
with the Seven Wonders of
the Corn Yield World
•What management factors
have the biggest impact on
corn yield each year?

Seven Wonders of the Corn
Yield World
•Given key prerequisites of
drainage, weed & pest control,
and adequate soil fertility
•Ranks those factors that each
year can have a positive (and
sometimes negative) impact on
corn yield

10 Growth Regulators
15 Tillage
20 Plant Population
25 Previous Crop
50 Hybrid
70 Nitrogen
70+ Weather
7
6
5
4
3
2
1
bu/acre
Value Factor Rank
Seven Wonders of the Corn Yield World
Given key prerequisites of drainage, weed & pest
control and adequate soil fertility

10 Growth Regulators
15 Tillage
20 Plant Population
25 Previous Crop
50 Hybrid
70 Nitrogen
70+ Weather
7
6
5
4
3
2
1
bu/acre
Value Factor Rank
Seven Wonders of the Corn Yield World
Given key prerequisites

Source USDA
Year
1960 1970 1980 1990 2000 2010
Gra
in Y
ield
(b
u a
cre
-1)
40
60
80
100
120
140
160
180
Pla
nt
De
nsit
y (
acre
-1)
-
16000
18000
20000
22000
24000
26000
28000
30000
32000 U.S. plant density
U.S. average grain yield
How Have Corn Yields Increased?
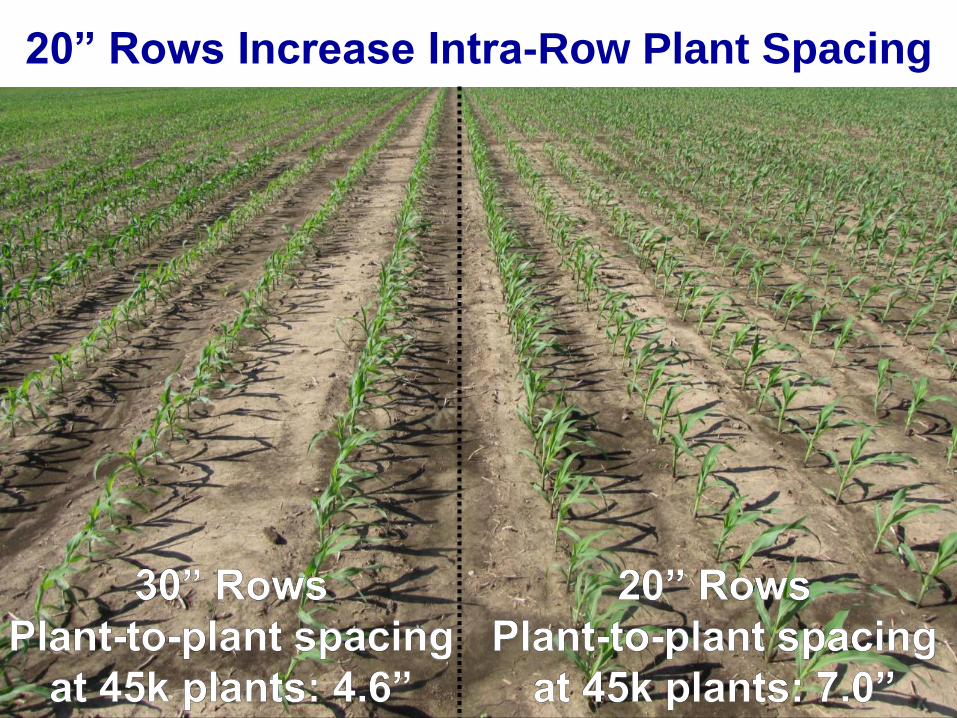
20” Rows Increase Intra-Row Plant Spacing

10 Growth Regulators
15 Tillage
20 Plant Population
25 Previous Crop
50 Hybrid
70 Nitrogen
70+ Weather
7
6
5
4
3
2
1
bu/acre
Value Factor Rank
Seven Wonders of the Corn Yield World
Given key prerequisites

Leaf Greening from Strobilurin Fungicides
Greener leaves 50 days after VT application

10 Growth Regulators
15 Tillage
20 Plant Population
25 Previous Crop
50 Hybrid
70 Nitrogen
70+ Weather
7
6
5
4
3
2
1
bu/acre
Value Factor Rank
Seven Wonders of the Corn Yield World
Given key prerequisites

Plant Response to Growth Regulators
PGR level/sensitivity
Rela
tive g
row
th
Optimum
level
Too little
PGR Too much
PGR

Name that Ear Abnormality
A new ear abnormality
from an improper
PGR application
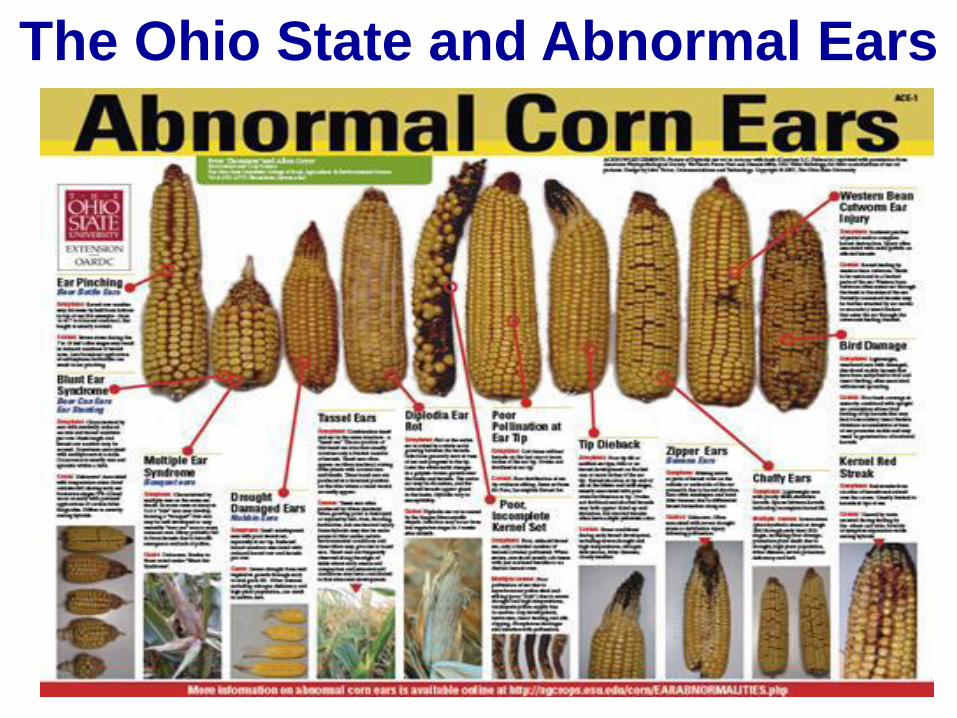
The Ohio State and Abnormal Ears

Name that Ear Abnormality
“Circum-Ovulated Ear”

10 Growth Regulators
15 Tillage
20 Plant Population
25 Previous Crop
50 Hybrid
70 Nitrogen
70+ Weather
7
6
5
4
3
2
1
bu/acre
Value Factor Rank
Seven Wonders of the Corn Yield World
Given key prerequisites

Is the Future of Corn Higher Populations in
Narrow Rows?
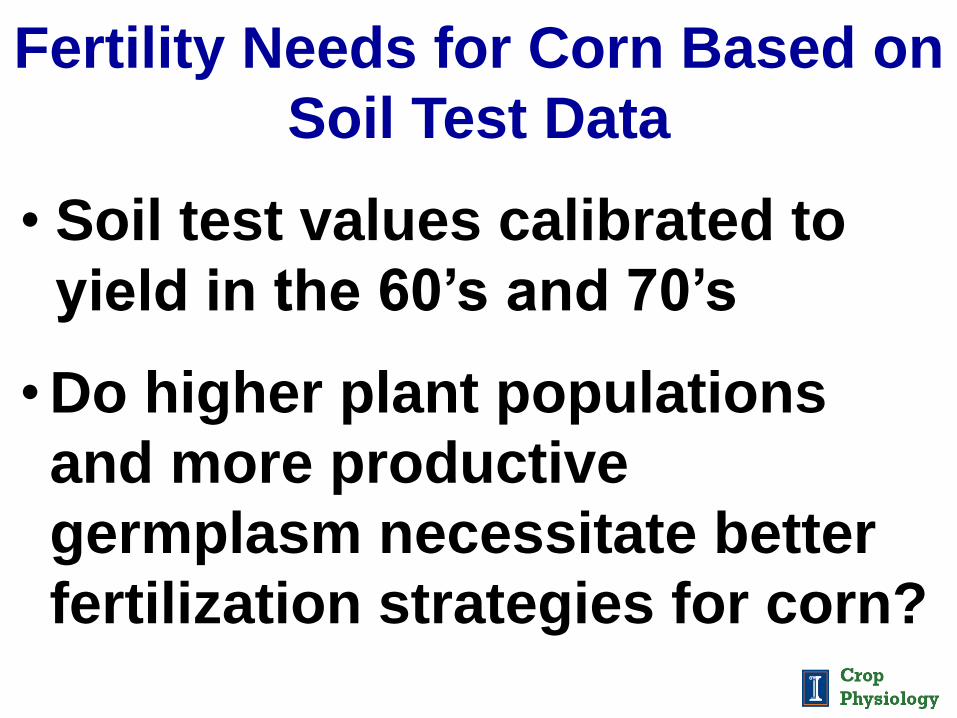
Fertility Needs for Corn Based on
Soil Test Data
• Soil test values calibrated to
yield in the 60’s and 70’s
•Do higher plant populations
and more productive
germplasm necessitate better
fertilization strategies for corn?

High Plant Density = Smaller Roots
Champaign, IL 2012
Normal Population
32,000 plants/acre High Population
45,000 plants/acre

Corn Fertility Recommendations
•Current = N based mostly
on expected yield and P and
K based on soil tests
• Future = Use application
and fertilizer technologies
to supply required crop
nutrition
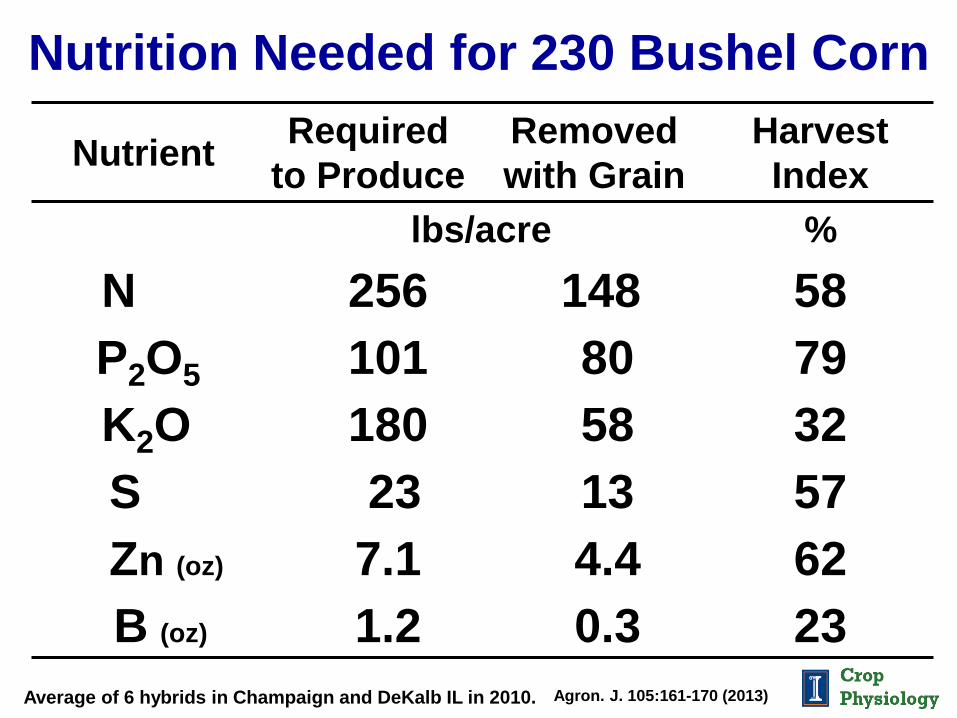
Nutrition Needed for 230 Bushel Corn
Nutrient Required
to Produce
Removed
with Grain
Harvest
Index
lbs/acre %
N 256 148 58
P2O5 101 80 79
K2O 180 58 32
S 23 13 57
Zn (oz) 7.1 4.4 62
B (oz) 1.2 0.3 23
Average of 6 hybrids in Champaign and DeKalb IL in 2010. Agron. J. 105:161-170 (2013)

Nutrition Needed for 230 Bushel Corn
Nutrient Required
to Produce
Removed
with Grain
Harvest
Index
lbs/acre %
N 256 148 58
P2O5 101 80 79
K2O 180 58 32
S 23 13 57
Zn (oz) 7.1 4.4 62
B (oz) 1.2 0.3 23 Average of 6 hybrids in Champaign and DeKalb IL in 2010. Agron. J. 105:161-170 (2013)

Nutrition Needed for 230 Bushel Corn
Nutrient Required
to Produce
Removed
with Grain
Harvest
Index
lbs/acre %
N 256 148 58
P2O5 101 80 79
K2O 180 58 32
S 23 13 57
Zn (oz) 7.1 4.4 62
B (oz) 1.2 0.3 23 Average of 6 hybrids in Champaign and DeKalb IL in 2010. Agron. J. 105:161-170 (2013)

Nutrition Needed for 230 Bushel Corn
Nutrient Required
to Produce
Removed
with Grain
Harvest
Index
lbs/acre %
N 256 148 58
P2O5 101 80 79
K2O 180 58 32
S 23 13 57
Zn (oz) 7.1 4.4 62
B (oz) 1.2 0.3 23
Average of 6 hybrids in Champaign and DeKalb IL in 2010. Agron. J. 105:161-170 (2013)

Feed the Plant Not the Soil
Better Fertilizer (Right Source) • Supply N, P, S, Zn in single granule
250 lbs/acre MicroEssentials-SZ
35 lbs N, 100 lbs P2O5, 25 lbs S, 2.5 lbs Zn
Better Application (Right Place) • Banded 4 to 6 inches deep directly
under the crop row
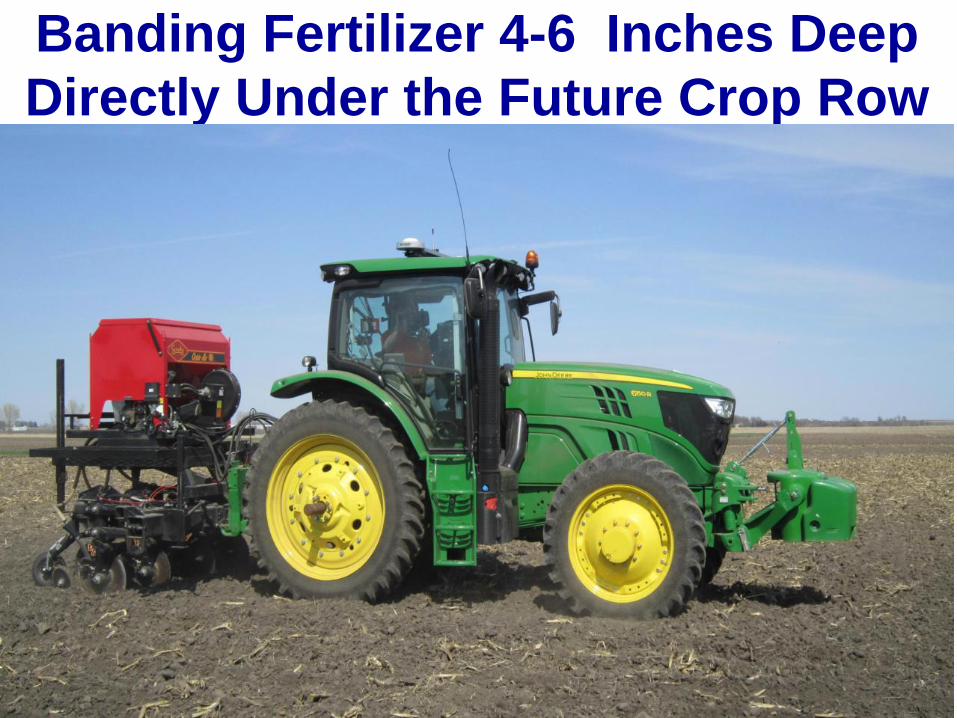
Banding Fertilizer 4-6 Inches Deep
Directly Under the Future Crop Row

Seeding Corn Crop 2 Inches Deep
Directly Over the Fertilizer Band

Improved Growth with Banded Fertility
250 lbs/acre MicroEssentials = 35 N, 100 P2O5, 25 S, and 2.5 Zn
Champaign, IL 2011

UTC 6” 0”
Growth Response to Banded Fertility
250 lbs/acre MicroEssentials = 35 N, 100 P2O5, 25 S, and 2.5 Zn
Champaign, IL 2014
V6
growth
stage

0 3 Brdcst 6 9 12 UTC 15
180
185
190
195
200
205
210Y
ield
(b
u a
c-1
)
Fertilizer Distance from Row (In.)
Corn Yield Response to Fertilizer Placement
LSD (0.10)
5.5 bushels
Champaign, IL 2014

Most Roots Expand Only 6 Inches
Horizontally
Root System at R5, 32,000 plants/acre

Improved Growth with Banded Fertility
250 lbs/acre MicroEssentials = 35 N, 100 P2O5, 25 S, and 2.5 Zn
Champaign, IL 2011

No Corn Plant Left Behind
Champaign, IL 2011

Enhanced Production Factors Tested
Fertility Balanced Crop Nutrition with
MicroEssentials-SZ banding directly
under row and/or broadcast Aspire
Nitrogen Extra sidedress N (60-80 lbs) with
weather protection
Hybrid With biotech insect protection and/or
a ‘Racehorse’ hybrid
Population Up to 45,000 plants/acre
Fungicide Strobilurin fungicide @ R1
Row Space 30 vs 20 inch row spacing
Irrigation With subsurface drip

Standard Management vs High Tech System
High Technology System Standard Management
Ears from
1/1000 of an
acre

Year Standard High Tech ∆
bu acre-1
2009 198 260 +62*
2010 188 230 +42*
2011 169 195 +26*
2012 135 210 +75*
2013 196 231 +35*
2014 193 238 +45*
Average 180 227 +47*
Corn Yield Response to Management
Average of 2 trials in 2009 and 2010, 11 trials in 2011, 2 trials in 2013,
and 3 trials in 2013 & 2014. *Significantly different at P ≤ 0.05.

Year Factor Standard High Tech
∆ bushels acre-1
09 Rootworm Hybrid +9 -25
10 Fungicide +11 -35
11 Fertility +14 -17
12 Irrigation +55 -93
13 Pop. + 20” rows +5 -27
14 Fertility + 20” rows +24 -29
Management Factor with Greatest Response

Standard vs High Tech Package: 2015
Phosphorus None, or fall P based on soil test
100 lbs P2O5 banded as MicroEssentials-SZ
Potassium None, or fall K based on soil test
75 lbs K2O broadcast as Aspire (K & B)
P and K None, or fall P and K based on soil test
MicroEssentials and Aspire as above
Nitrogen 160 lbs pre-plant as UAN
Extra N (+80 lbs) as sidedress and protected
Population 32,000 plants/ac vs 44,000 plants/acre
Fungicide No Fungicide vs Fungicide @ Vt/R1
Row Spacing 30 inch vs 20 inch row spacing

FACTORS
TREATMENT Phosphorus Potassium Nitrogen Population Fungicide
HIGH INPUT MESZ Aspire Base +
sidedress 44,000 Strobilurin
Re
mo
ve T
ec
hn
olo
gy
Fertility Soil test Aspire Base + sidedress 44,000 Strobilurin
Nitrogen MESZ Soil test Base + sidedress 44,000 Strobilurin
Hybrid MESZ Aspire Base 44,000 Strobilurin
Population MESZ Aspire Base + sidedress 32,000 Strobilurin
Fungicide MESZ Aspire Base + sidedress 44,000 none
STANDARD Soil test Soil Test Base 32,000 none
Ad
d T
ec
hn
olo
gy Fertility MESZ Soil test Base 32,000 none
Nitrogen Soil test Aspire Base 32,000 none
Hybrid Soil test Soil test Base + Sidedress 32,000 none
Population Soil test Soil test Base 44,000 none
Fungicide Soil test Soil test Base 32,000 Strobilurin
Omission Plot Experimental Design
In 20 and 30 inch rows

Add One Enhanced Factor Yield ∆
bu acre-1
Standard Management 189
+Phosphorus (100 lbs P2O5 MESZ) 202 +13
+Potassium (75 lbs K2O as Aspire) 184 -5
+Phosphorus & Potassium 207 +18*
+Nitrogen (80 lbs N sidedress) 211 +22*
+Population (44,000 plants/acre) 186 -3
+Fungicide (strobilurin at flowering) 207 +18*
+Row Spacing (20 inch rows) 205 +16*
Add One Enhanced Factor to Standard – 2015
Significantly different from standard at P ≤ 0.10. Average of 2 trials

Omit One Enhanced Factor Yield ∆
bu acre-1
High Tech all Seven Factors 251
-Phosphorus (P based on soil test) 219 -32*
-Potassium (K based on soil test) 252 +1
-Phosphorus & Potassium 219 -32*
-Nitrogen (no sidedress) 233 -18*
-Population (only 32,000 plants/acre) 232 -19*
-Fungicide (no fungicide) 241 -10
-Row Spacing (30 inch rows) 221 -30*
Omit One Enhanced Factor from High Tech – 2015
Significantly different from standard at P ≤ 0.10. Average of 2 trials

Standard High Tech
Factor Yield ∆ Yield ∆
bu acre-1
None or All 189 251
Phosphorus 202 +13 219 -32*
Potassium 184 -5 252 +1
P and K 207 +18* 219 -32*
Nitrogen 211 +22* 233 -18*
Population 186 -3 232 -19*
Fungicide 207 +18* 241 -10
Row Spacing 205 +16* 221 -30*
Standard vs High-Tech Management 2015
Significantly different from standard at P ≤ 0.10. Average of 2 trials

Do Growers Adequately Fertilize Soybean?
Champaign, IL 2012

The Soybean Yield Gap
•US average soybean yield of
about 45 bushels per acre
•World record soybean yield
of 161 bushels
• Illinois record of 108.3
bushels in 2015

Fertility
Weather
6
5
4
3
2
1
Factor Rank
The Six Secrets of Soybean Success
Given key prerequisites
Genetics/Variety
Foliar Protection
Seed Treatment
Row Arrangement

Fertility
Weather
6
5
4
3
2
1
Factor Rank
The Six Secrets of Soybean Success
Given key prerequisites
Genetics/Variety
Foliar Protection
Seed Treatment
Row Arrangement

Typical Fertilization for Corn
and Soybean in Illinois
• 180 lbs N, 90 lbs P2O5 and 100
lbs K2O per acre applied to
corn. No S or micronutrients
•No fertilizer applied to soybean

Nutrient Uptake and Removal by
60 Bushel Soybean
Nutrient
Required
to Produce
Removed
with Grain
Harvest
Index
lbs per acre %
N 245 179 73
P2O5 43 35 81
K2O 170 70 41
S 17 10 61
Zn (oz) 4.8 2.0 44
B (oz) 4.6 1.6 34 Data averaged across two varieties, two fertility regimes,
and three site-years during 2012 and 2013. Agron. J. 107:563-573 (2015)

Nutrient Uptake and Removal by
60 Bushel Soybean
Nutrient
Required
to Produce
Removed
with Grain
Harvest
Index
lb acre-1 %
N 245 179 73
P2O5 43 35 81
K2O 170 70 41
S 17 10 61
Zn (oz) 4.8 2.0 44
B (oz) 4.6 1.6 34 Data averaged across two varieties, two fertility regimes,
and three site-years during 2012 and 2013. Agron. J. 107:563-573 (2015)

Typical Fertilization for Corn
and Soybean in Illinois
• 180 lbs N, 90 lbs P2O5 and 100
lbs K2O per acre applied to
corn. No S or micronutrients
•No fertilizer applied to soybean

P and K Uptake and Removal by
60 bu Soybean vs 230 bu Corn
Nutrient Required
to Produce Removed with Grain
Remain in Stover
Corn Soy Corn Soy Corn Soy lbs per acre
P2O5 101 43 80 35 21 8
K2O 180 170 56 70 124 100
Corn data from Agron J. 105:161-170 (2013); Soybean data from Agron. J.
107:563-573 (2015)

Days After Planting
0 20 40 60 80 100 120
K U
pta
ke (
lb K
2O
ac
-1)
0
28
56
84
112
140
168
Perc
en
t o
f T
ota
l (%
)
0
20
40
60
80
100
Grain
Flowers, Pods
Stem, Petioles
Leaves
Planting V3 V7 R2 R4 R5 R6 R8
Growth Stage
K Uptake & Partitioning for 60 Bushel Soybean
Data averaged across two varieties, two fertility regimes, and
three site-years during 2012 and 2013. Agron. J. 107:563-573 (2015)
Most (50%) K
accumulation is
in the stem and
leaf petioles

Days After Planting
0 20 40 60 80 100 120
P U
pta
ke (
lb P
2O
5 a
c-1
)
0
8
16
24
32
40
Perc
en
t o
f T
ota
l (%
)
0
20
40
60
80
100
Grain
Flowers, Pods
Stem, Petioles
Leaves
Planting V3 V7 R2 R4 R5 R6 R8
Growth Stage
P Uptake & Partitioning for 60 Bushel Soybean
Data averaged across two varieties, two fertility regimes,
and three site-years during 2012 and 2013. Agron. J. 107:563-573 (2015)
Season long
uptake and no
reservoir of P in
the stem and
leaf petioles

Standard vs High Tech System 2014-15 Phosphorus P applied year before to corn
75 lbs P2O5 as MESZ (N, P, S, & Zn)
Banded 4-6” under row at planting
Potassium K applied year before to corn
75 lbs K2O as Aspire (K & B)
Broadcast and incorporated at planting
P and K P & K applied year before to corn
MESZ and Aspire applied as above
Foliar Protection No foliar protection
Fungicide and Insecticide at R3
Seed Treatment Untreated or Fungicide only
Fungicide, Insecticide, Nematicide
Row Arrangement 30 inch row spacing
20 inch row spacing

With banded
fertility to provide 25 lb N, 75 lb P2O5, 18 lb
S, 1.8 lb Zn per acre
Without
banded fertility but with adequate
soil test values

Standard vs High Tech System 2014-15 Phosphorus P applied year before to corn
75 lbs P2O5 as MESZ (N, P, S, & Zn)
Banded 4-6” under row at planting
Potassium K applied year before to corn
75 lbs K2O as Aspire (K & B)
Broadcast and incorporated at planting
P and K P & K applied year before to corn
MESZ and Aspire applied as above
Foliar Protection No foliar protection
Fungicide and Insecticide at R3
Seed Treatment Untreated or Fungicide only
Fungicide, Insecticide, Nematicide
Row Arrangement 30 inch row spacing
20 inch row spacing

Champaign
Harrisburg
Soybean Management Trials
2015
3 sites in Illinois with:
• 7 trials at 3 locations
• Banded phosphate or broadcast
potassium, or both at planting
• Different company seed
(Asgrow, Syngenta, Croplan)
and foliar protection products:
BASF or Syngenta
• Normal and full maturity variety
• All in 30 inch vs 20 inch rows, at a
seeding rate of 160,000 plants/acre
DeKalb

Location Standard High Tech Δ
———— bushels acre–1 ————
DeKalb 56.5 73.6 +17.1*
Champaign 80.1 98.9 +18.8*
Harrisburg 75.1 83.2 +8.1*
Average 70.7 85.4 +14.7*
Yield Response to Management 2015
*Significant at P ≤ 0.05. Seven trials with two varieties in each
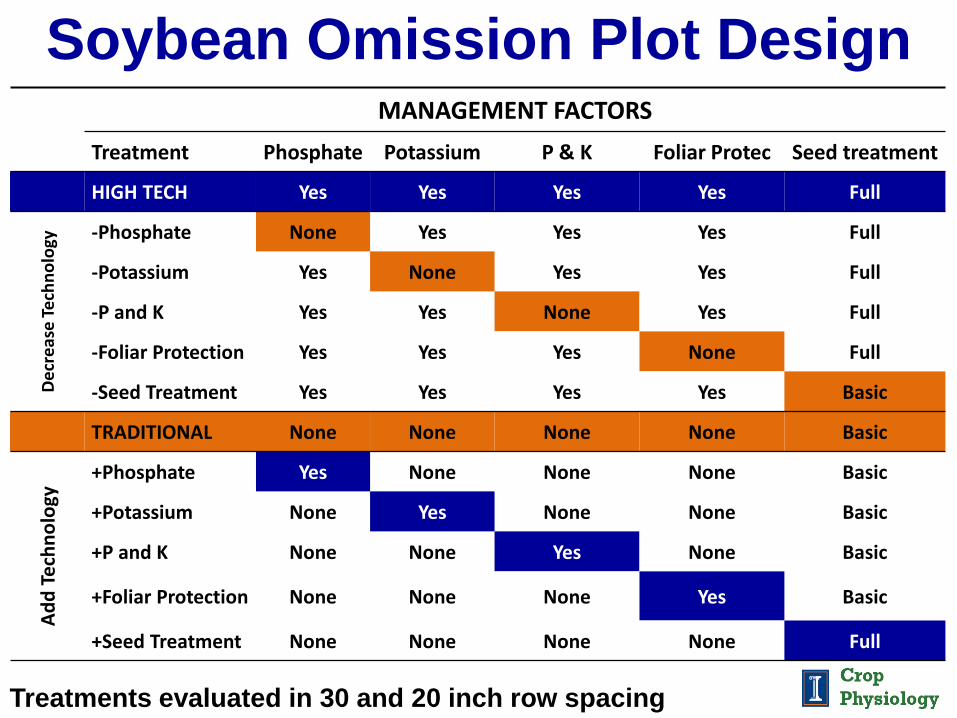
Soybean Omission Plot Design
Treatments evaluated in 30 and 20 inch row spacing
MANAGEMENT FACTORS
Treatment Phosphate Potassium P & K Foliar Protec Seed treatment
HIGH TECH Yes Yes Yes Yes Full
De
cre
ase
Tech
no
logy
-Phosphate None Yes Yes Yes Full
-Potassium Yes None Yes Yes Full
-P and K Yes Yes None Yes Full
-Foliar Protection Yes Yes Yes None Full
-Seed Treatment Yes Yes Yes Yes Basic
TRADITIONAL None None None None Basic
Ad
d T
ech
no
logy
+Phosphate Yes None None None Basic
+Potassium None Yes None None Basic
+P and K None None Yes None Basic
+Foliar Protection None None None Yes Basic
+Seed Treatment None None None None Full

Standard System
Add One Enhanced Factor Yield ∆
bu acre-1
Standard Management 70.7
+Phosphorus (as MESZ also N,S, Zn) 76.5 +5.8*
+Potassium (as Aspire also B) 70.1 -0.6
+Phosphorus & Potassium 74.2 +3.5*
+Fungicide & Insecticide (R3) 73.8 +3.1*
+Seed Treatment (at planting) 72.3 +1.6
+Row Spacing (20 inch rows) 74.3 +3.6*
Add One Enhanced Factor to Standard - 2015
*Significantly different from standard at P ≤ 0.05.
Average of 7 trials each with two varieties at three locations

High Tech System
Omit One Enhanced Factor Yield ∆
bu acre-1
High Tech all Six Factors 85.4
-Phosphorus (fertility previous corn) 80.5 -4.9*
-Potassium (fertility previous corn) 87.0 +1.6
-Phosphorus & Potassium 80.6 -4.8*
-Fungicide & Insecticide 82.9 -2.5
-Seed Treatment (none or base) 82.6 -2.8*
-Row Arrangement (30 inch rows) 77.1 -8.3*
Omit One Enhanced Factor from High Tech - 2015
*Significantly different from standard at P ≤ 0.05.
Average of 7 trials each with two varieties at three locations

Standard High Tech
Factor Yield ∆ Yield ∆
bu acre-1
None or All 70.7 85.4
Phosphate 76.5 +5.8* 80.5 -4.9*
Potassium 70.1 -0.6 87.0 +1.6
P & K 74.2 +3.5* 80.6 -4.8*
Fung. + Insect. 73.8 +3.1* 82.9 -2.5
Seed Treatment 72.3 +1.6 82.6 -2.8*
Row Arrangement 74.3 +3.6* 77.1 -8.3*
2015 Soybean Omission Plots – Average of 7 Trials
*Significantly different at P ≤ 0.05. Average of two varieties in each trial

Conclusions • For maximum corn and soybean
yield a systems approach is needed that combines individual practices known to impact productivity
• High yield starts with plant nutrition with sets the growth trajectory and the potential for high yields

Conclusions
• Soil test values may not be calibrated for the higher plant populations being used for corn, and the greater yield potential of modern corn hybrids and soybean varieties

Conclusions •Many growers in a corn
soybean rotation are removing more P and K than they are replacing
• There are large yield opportunities in corn and soybean from fertilizing with the right source in the right place

Acknowledgements
•Brad Bandy
•Tryston Beyrer
•Tom Boas
•Ryan Becker
•Ross Bender
•Brad Bernhard
•Fernando Cantao
•Narjara Cantelmo
•Renato Carmargos
•Laura Gentry
•Claire Geiger
•Jason Haegele
•Andrew Harmon
•Cole Hendrix
•Adam Henninger
•Brandon Litherland
•Shelby Mann
•Jack Marshall
•Adriano Mastrodomenico
•Katie Parker
•Ellie Raup
•Alvero Santos
•Ana Scavone
•Juliann Seebauer
•Jiying Sun
•Martín Uribelarrea
•Mike Vincent
•Alison Vogel
•Kyle Vogelzang
•Wendy White
Personnel
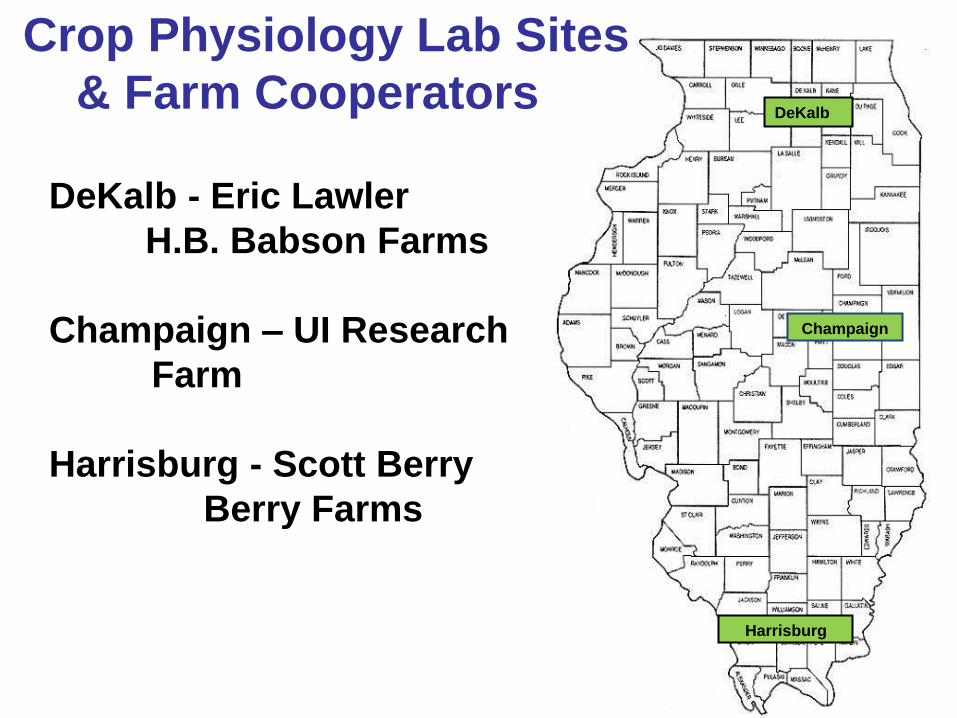
Champaign
Harrisburg
Crop Physiology Lab Sites
& Farm Cooperators
DeKalb - Eric Lawler
H.B. Babson Farms
Champaign – UI Research
Farm
Harrisburg - Scott Berry
Berry Farms
DeKalb

Acknowledgements
•AGCO
•Agricen
•Agrium
•AgroFresh
•Albion
•BASF
•Calmer Corn Heads
•Crop Production Services
•Dawn Equipment
•Dow AgroSciences
•DuPont Pioneer
•Fluid Fertilizer Foundation
•Goemar
•GrowMark
•Honeywell
•Helena Chemical Company
•Illinois Soybean Association
•IPNI
•John Deere
•Koch Agronomic Service
•Midwestern BioAg
•Monsanto
•Mosaic
•Nachurs
•Netafim
•Orthman
•Rentech
•Syngenta
•Stoller Enterprises
•Valent BioSciences
•West Central
•WinField Solutions
•Wolf Trax
•Wyffels Hybrids
Financial Support

Very Special Thanks
• The Mosaic Company
For more information:
Crop Physiology Laboratory at the
University of Illinois
http://cropphysiology.cropsci.illinois.edu