federal initiatives impacting the aging network sandy markwood, n4a wraaa annual luncheon may 10,...
TRANSCRIPT
Federal Initiatives Impacting the Aging
Network
Sandy Markwood, n4aWRAAA Annual Luncheon
May 10, 2012

1. Long-Term Services and Supports Systems Transformation
2. Implementation of the Affordable Care Act3. Older Americans Act Reauthorization Update 4. The Federal Budget Process FY13 Appropriations
Outlook5. Advocacy Strategies- Letting Your Voice be
Heard!
Today’s Agenda

LTSS Systems Transformation
Medicaid Managed Care, Dual Eligibles, HCBS

State Agency Restructuring
State Agencies that have restructured since 2009
FL
Source: NASUAD Economic Survey, FY11: State Aging and Disability Agencies in Times of Change.

Population Growth Shifting Demographics Also Contribute to Increased Demand
Source: This table was compiled by the U.S. Administration on Aging using 2000 Census data

Population Growth
Page 6
2002 2003 2004 2005 2006 2007 2008 2009 20108,000,000
9,000,000
10,000,000
11,000,000
12,000,000
13,000,000
14,000,000
15,000,000
Below 200% FPL with Work Disability
Below 250% FPL with Work Disability
Year
Num
ber
of
Pers
ons
While the number of persons with disabilities is also increasing
Source: NASUAD Economic Survey, FY11: State Aging and Disability Agencies in Times of Change.

What is Medicaid Managed Long-Term
Care? Capitated MMLTC State Medicaid Agency and contractors enter into agreement
under which contractor accepts risk of providing defined Medicaid LTC services
Alternative types of MMLTC capitation packages: Medicaid-covered LTC services only All Medicaid-covered acute and LTC services All Medicare and Medicaid-covered services
(additional plan contract with CMS required for Medicare portion)
ManagedCareContractor
ManagedCareContractorCapitated
Payment
StateMedicaidAgency
StateMedicaidAgency
ProvidersProviders
NegotiatedPayments(FFS, Per Diem, etc.)
Source: AARP Public Policy Institute Issue Brief, Medicaid Managed Long-Term Care, 2005.
MMLTC is Delivery Model States Use in Lieu of Fee-for-Service

Three Basic MMLTC Models
Source: AARP Public Policy Institute Issue Brief, Medicaid Managed Long-Term Care, 2005.
MODEL 1: Medicaid LTC Only
MODEL 2: Medicaid-Only
MODEL 3: Medicaid-Medicare Integration
Medicaid Services for Which Managed Care Contractor is at Risk
Home and Community Based Services (HCBS)Nursing Home Care
HCBSNursing Home CareMedicaid-Covered Primary Care ServicesMedicaid-Covered Acute Care ServicesMedicaid-Covered Pharmacy
HCBSNursing Home CareMedicaid-Covered Primary Care ServicesMedicaid-Covered Acute Care ServicesMedicaid-Covered Pharmacy
Medicare Services for Which Managed Care Contractor is at Risk
None None Medicare Acute Care benefitsMedicare Prescription Drug Benefit
Dual eligibles may also be enrolled in Medicare managed care and receive Medicaid LTC services in either FFS Medicaid, or in MMLTC Models 1 or 2
Medicaid Managed Care
MI
AK
HI
CA
WI
WA
OR
ID
WY
UT
AZ
NM
NV
TX
MN
IA
MO
OK
NE
KS
SD
NDMT
AL
LA
FL
TN
IN OHIL
PA
WVVA
KY
NC
SC
GA
AR
MS
ME
NY
VTNH
MA
RI
CT
NJ
DE
MDCO
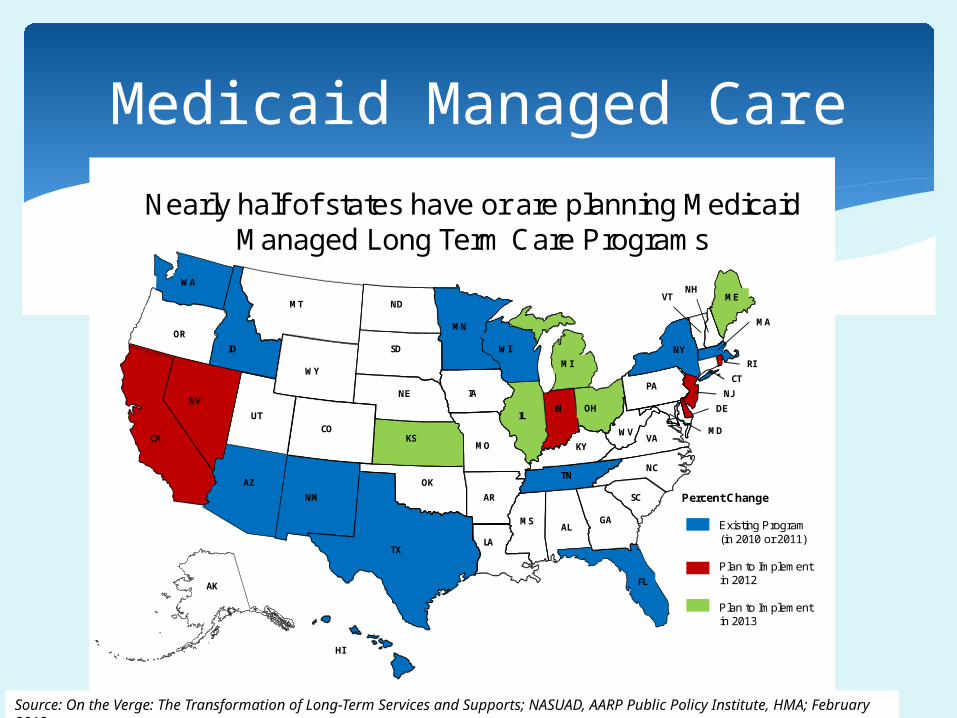
Nearly half of states have or are planning Medicaid Managed Long Term Care Programs
Percent Change
Existing Program(in 2010 or 2011)
Plan to Implement in 2012
Plan to Implement in 2013
On the Verge: The Transformation of Long-Term Services and Supports; NASUAD, AARP Public Policy Institute, HMA; February 2012.Source: On the Verge: The Transformation of Long-Term Services and Supports; NASUAD, AARP Public Policy Institute, HMA; February 2012.
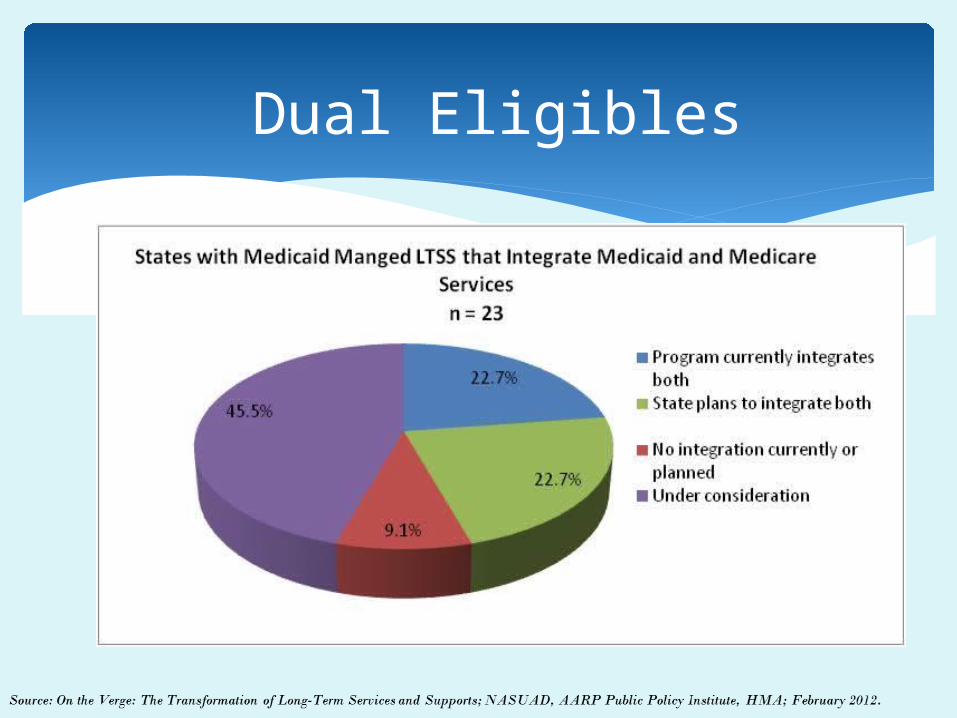
Dual Eligibles

Dual Eligibles
Green States: Through the State Demonstrations to Integrate Care for Dual Eligible Individuals program , CMS provided design contracts of up to $1 million to 15 states to develop new approaches to better coordinate care for dual eligible individuals.
Maroon States: Thirty-eight states (including the 15 that received grants) submitted letters expressing interest in pursuing the demonstration program.
Source: National Senior Citizens Law Center Duals Advocacy Website
State Demonstrations to Integrate Care

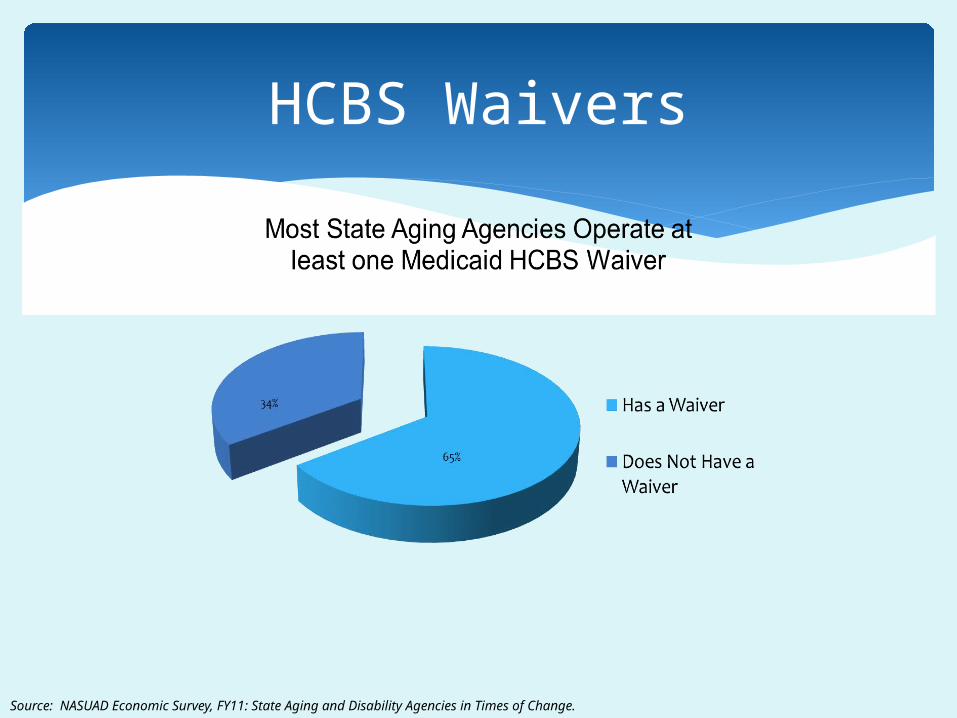
HCBS Waivers
Source: NASUAD Economic Survey, FY11: State Aging and Disability Agencies in Times of Change.

HCBS Waiver Expenditures
10
6
9
2
0
2
4
6
8
10
12
Less than 5% 5%-8% 8-15% More than 15%
Nu
mb
er
of
Stat
es
Percentage Range of Increases in HCBS Expenditures2010 to 2011
HCBS Waivers
Source: NASUAD Economic Survey, FY11: State Aging and Disability Agencies in Times of Change.

HCBS Waiver Caseload
6
7
0
3
31
27
0 10 20 30 40
2012
2011
Number of States
Changes in HCBS Caseload From Previous Year
Increased
Decreased
Stayed the same
Source: On the Verge: The Transformation of Long-Term Services and Supports; NASUAD, AARP Public Policy Institute, HMA; February 2012.
Affordable Care Act1915(i), Community First Choice, BIPP, MFP,
Health Homes

Section 1915(i) State Plan Option was established in 2005 and amended by the Affordable Care Act.
Similar to §1915(c) HCBS waivers in flexible service and benefit design, but— No requirement that people meet institutional level of care to
qualify. While states may target HCBS to one or more specific
populations, they may not cap enrollment for the targeted population(s).
Few states have exercised this authority so far. However, in recent NASUAD survey: 22 states reported consideration of §1915(i). 3 states said they will implement—CA, IN, TX.
§1915(i) State Plan Option

Community First Choice Option gives states option to add new participant-directed state plan HCBS attendant services and supports benefit.
Participating states will receive enhanced FMAP of 6% for
enrollees.
There are two levels of eligibility: People eligible for Medicaid under State Plan with incomes up
to 150% of poverty who don’t need institutional level of care. People with incomes above 150% of poverty and up to 300%
of SSI who meet institutional level of care requirements.
NASUAD’s recent survey found: 18 states are considering participation. 5 states definitely plan to participate—AK, AZ, CA, NY, RI.
Community First Choice

State Balancing Incentive Payments Program (BIPP) is temporary, noncompetitive grant program to encourage states to balance Medicaid spending toward HCBS.
To be eligible, states must have spent <50% of total Medicaid LTSS dollars on non-institutional services in FY 2009. Through 10/1/2015: States that spent <25% on HCBS will receive 5% FMAP increase
for HCBS. States that spent <50% but >25% on HCBS will receive 2%
FMAP increase for HCBS.
NASUAD’s recent survey found: 21 states considering participation. 3 states definitely plan to participate—GA, NJ, NH. *
Balancing Incentive Payments Program

Health Homes are providers or a health team that coordinates care across settings for people: with 2 or more chronic conditions, or with one chronic condition and at risk for another, or with one serious and persistent MH condition
States may offer these services by amending their state plans, and participating states receive 90% enhanced FMAP for health home services for up to 8 quarters per enrollee.
NASUAD’s recent survey found: 14 states plan to implement (As of January 2012, 7 states had
submitted Health Home State Plan amendments to CMS —IA, MO, NC, NY, OR, RI, WA. Some approved; others pending)
10 are considering implementation
.
Health Homes
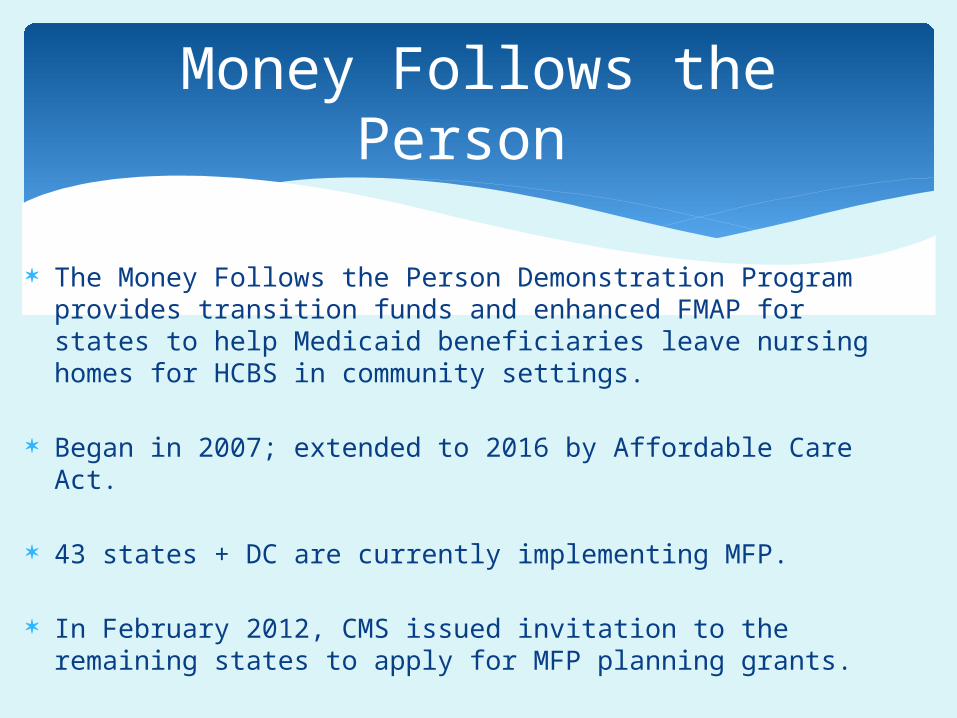
The Money Follows the Person Demonstration Program provides transition funds and enhanced FMAP for states to help Medicaid beneficiaries leave nursing homes for HCBS in community settings.
Began in 2007; extended to 2016 by Affordable Care Act.
43 states + DC are currently implementing MFP.
In February 2012, CMS issued invitation to the remaining states to apply for MFP planning grants.
Money Follows the Person

State Intention to Pursue ACA Options

Federal Budget and FY13 Appropriations Outlook

What’s In The Federal Budget?
(Source: Center on Budget and Policy Priorities)Interest on the National Debt
9%
Non-defense Appropriations
18%
Other Entitlement Programs
9%
Defense Appropriations
20%
Social Security,
Medicare, and Medicaid
44%Funding for these two parts of the budget must be renewed each year.

Winter: President’s Budget, blueprint for Congress to follow…or ignore
Early Spring: Congressional budget resolution sets broad parameters
Late Spring/Early Summer: Appropriations committees begin work
October 1: New fiscal year begins
Federal Budget Process
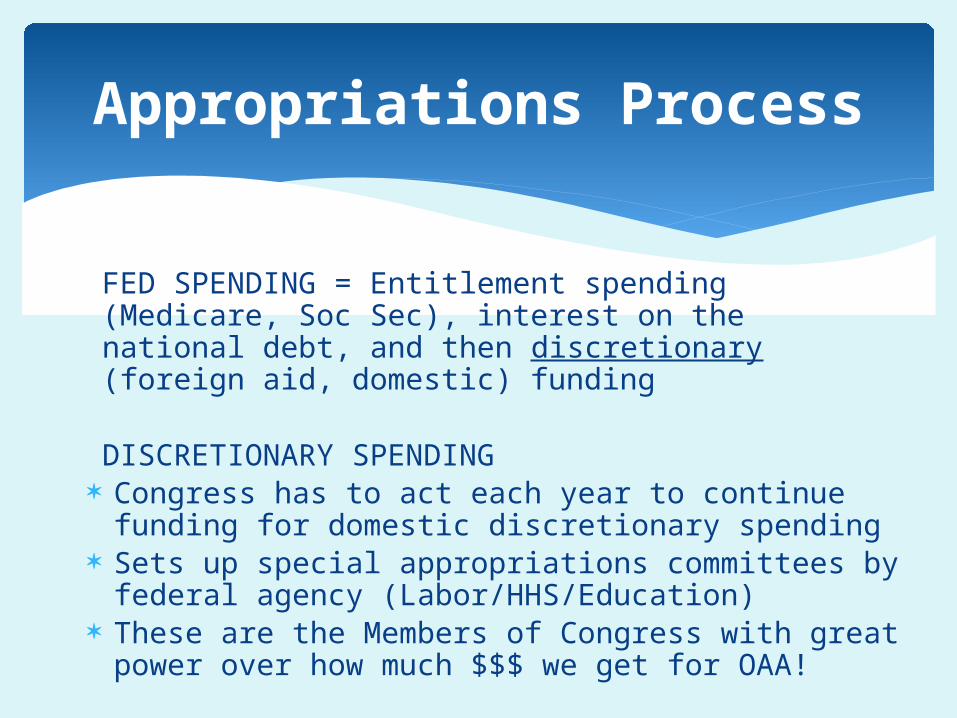
FED SPENDING = Entitlement spending (Medicare, Soc Sec), interest on the national debt, and then discretionary (foreign aid, domestic) funding
DISCRETIONARY SPENDING Congress has to act each year to continue
funding for domestic discretionary spending Sets up special appropriations committees by
federal agency (Labor/HHS/Education) These are the Members of Congress with great
power over how much $$$ we get for OAA!
Appropriations Process
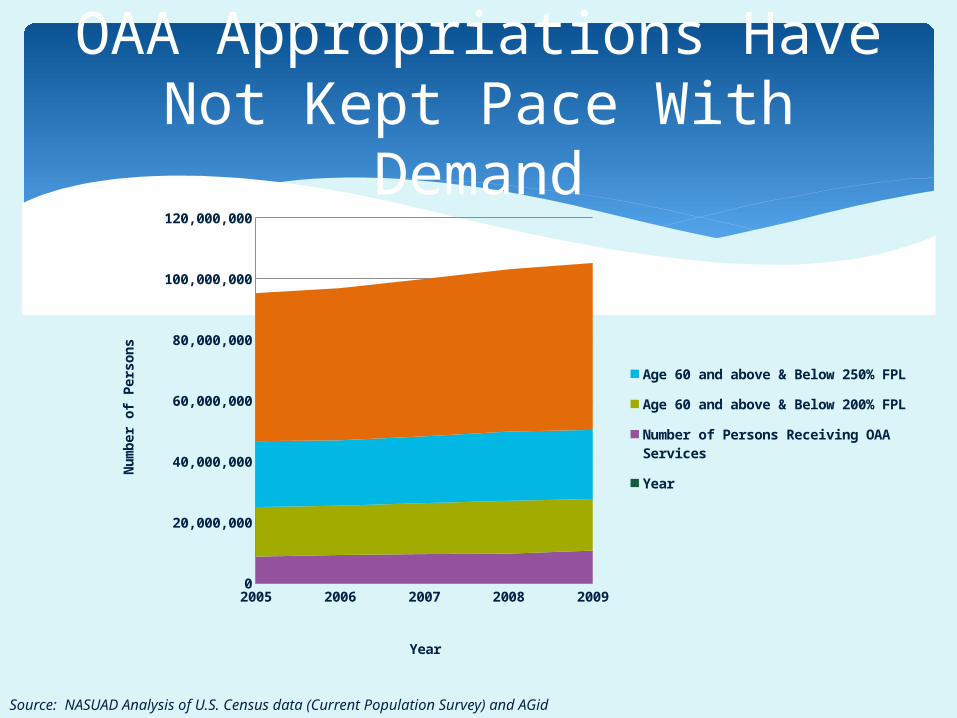
OAA Appropriations Have Not Kept Pace With Demand
2005 2006 2007 2008 20090
20,000,000
40,000,000
60,000,000
80,000,000
100,000,000
120,000,000
Age 60 and above & Below 250% FPL
Age 60 and above & Below 200% FPL
Number of Persons Receiving OAA Services
Year
Year
Nu
mb
er
of
Pe
rso
ns
Source: NASUAD Analysis of U.S. Census data (Current Population Survey) and AGid
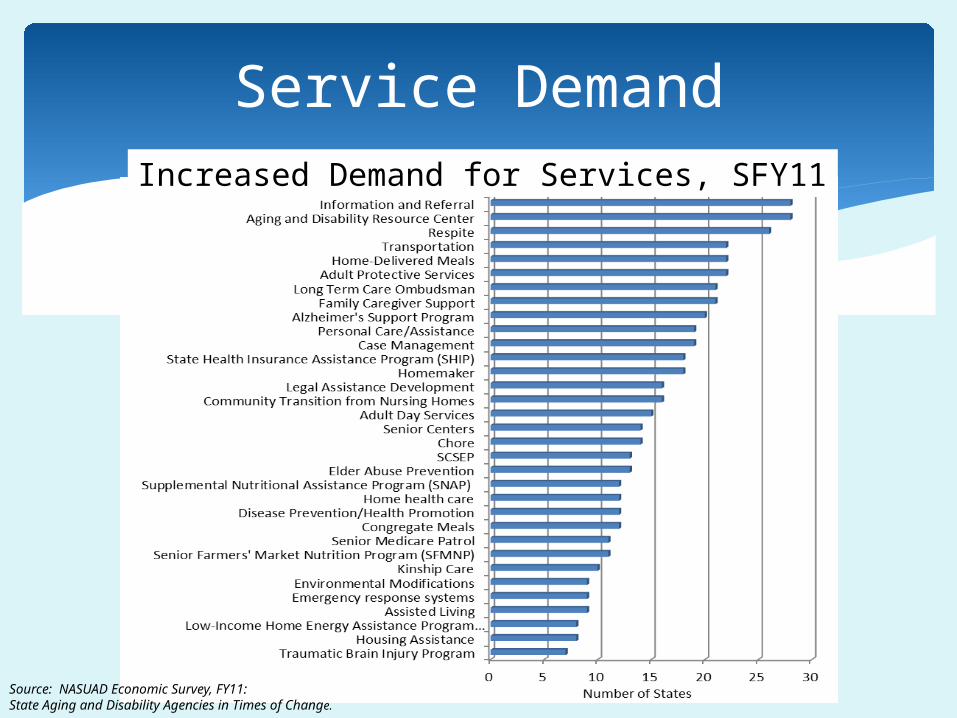
Service DemandIncreased Demand for Services, SFY11
Source: NASUAD Economic Survey, FY11: State Aging and Disability Agencies in Times of Change.

OAA needs at least a 12 percent increase to keep pace with projected population growth and inflation in 2013 and begin to make up for years of stagnant funding;
Give special attention to three OAA programs, Title III B Supportive Services, III E NFSCP and Title VI Grants for Native Americans, which are particularly overdue for increases; and
See n4a 2013 Policy Priorities for other appropriations recommendations….
n4a Appropriations Advocacy

Advocacy Groups send letters to Appropriations Committees
As do Members of Congress, both individually and in groups Sanders OAA 12% Letter, 18 Signers
Requests from the field are important too!
Appropriations Advocacy

Aging Program Funding (FY 2013)
President’s Budget: hold the line + addition of SHIPs, Title V, APS
OAA program funding for the most part maintained Exception is Program Innovations
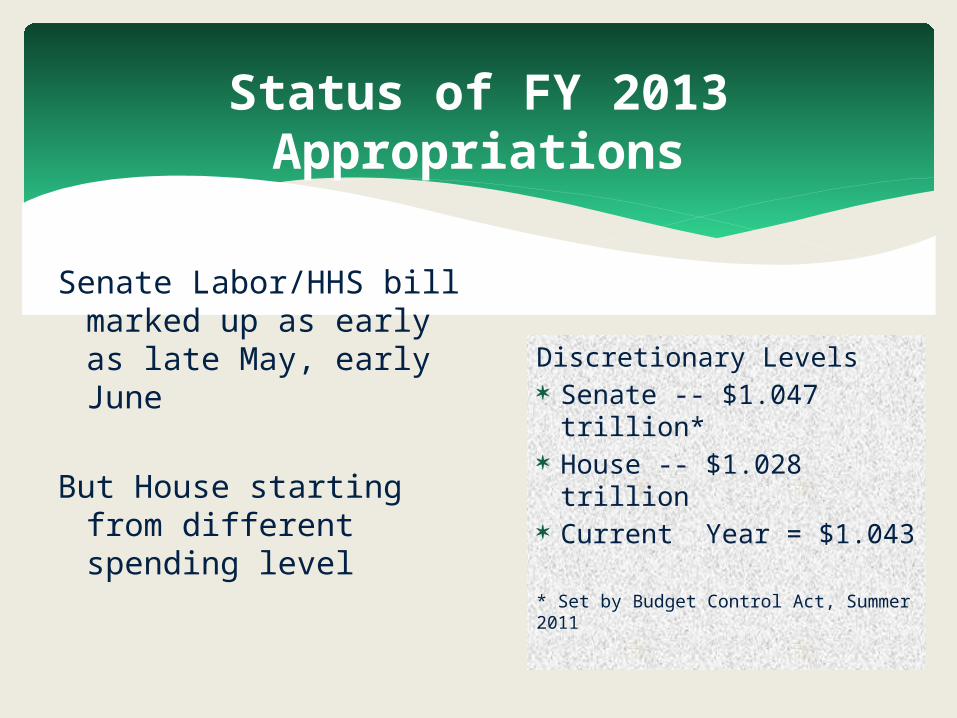
Status of FY 2013 Appropriations
Senate Labor/HHS bill marked up as early as late May, early June
But House starting from different spending level
Discretionary Levels Senate -- $1.047
trillion* House -- $1.028 trillion Current Year = $1.043
* Set by Budget Control Act, Summer 2011

Forecast:End-of-Year Storms
No floor votes for approps bills, no public conference committee
Continuing resolutions (CRs) until after the election at least
Lame Duck Session: approps, Medicare “doc fix,” Bush tax cuts and Jan. 2013 sequester!
OAA Appropriations


Budget Control Act: If Congress fails to act by the end of the calendar year, $1.2 trillion in automatic, across-the-board cuts would take effect through a sequestration process
Cuts expected to be 8-9% for programs like OAA Exempted programs: Social Security, Medicaid and
several low-income entitlement programs. (Medicare benefits could not be cut either, but provider payments could be reduced by up to 2 percent.)
Takes effect on January 2, 2013
Sequester!

Potential Impact of Sequester
IMPACT OF SEQUESTER ON FY13 OLDER AMERICANS ACT PROGRAMS
FY12 Estimated
FY13 funding after
automatic cuts
(CBO estimate
of 7.8%)
FY13 cuts based on CBO estimate
(Difference between FY13 funding after CBO 7.8% cuts and
FY12 estimated funding level)
FY13 funding after
automatic cuts
(CBPP estimate
of 9%)
FY13 cuts based on CBPP estimate
(Difference between FY13 funding after CBPP 9% cuts and
FY12 estimated funding level)
Adult Protective Services 0 0 0 0 0
Aging and Disability Resource Centers 16 14.752 -1.248 14.560 -1.440
Aging Network Support Services 8 7.376 -0.624 7.280 -0.720
Alzheimer’s Disease Demonstration Grant 4 3.688 -0.312 3.640 -0.360
Chronic Disease Self-Management Program 10 9.220 -0.780 9.100 -0.900
Congregate Nutrition 439 404.758 -34.242 399.490 -39.510
Elder Rights Support Activities 4 3.688 -0.312 3.640 -0.360
HCBS Supportive Services 367 338.374 -28.626 333.970 -33.030
Home-Delivered Nutrition 217 200.074 -16.926 197.470 -19.530
Lifespan Respite Care Program 2 1.844 -0.156 1.820 -0.180
Long-Term Care Ombudsman Program 17 15.674 -1.326 15.470 -1.530
National Clearinghouse LTC Information 3 2.766 -0.234 2.730 -0.270
National Family Caregiver Support Programs 154 141.988 -12.012 140.140 -13.860
Native American Caregiver Support Program 6 5.532 -0.468 5.460 -0.540
Native American Nutrition and Supportive Services 28 25.816 -2.184 25.480 -2.520
Nutrition Services Incentive Program 160 147.520 -12.480 145.600 -14.400
Prevention of Elder Abuse and Neglect 5 4.610 -0.390 4.550 -0.450
Preventive Health Services 21 19.362 -1.638 19.110 -1.890
Program Administration 23 21.206 -1.794 20.930 -2.070
Program Innovation 0 0 0 0 0
Senior Medicare Patrol Program 9 8.298 -0.702 8.190 -0.810
Total, Program Level 2,005 1848.610 -156.390 1824.550 -180.450
Source: NASUAD analysis of projected cuts. www.nasuad.org
(In millions of dollars)
Older Americans Act in the 112th Congress
OAA Reauthorization

TIMELINE AoA Listening Sessions, Winter 2010 Groups survey members, write
recommendations, release by spring 2011 Senate HELP Subcomm holds listening
sessions, summer 2011 Act “expires” Sept. 30, 2011 Fall 2011: AoA shares tech asst for Hill
Reauthorization of OAA

Add parent caregiver of adult children with disabilities to NFCSP
Consolidate nutrition programs Expand the # of programs allowed to cost-share (would
still need waiver from AoA to test cost-sharing for nutrition and case management)
Incentive payments to enhance Aging Network capacity LTCOP updates Establish minimum Title III funds for State Legal Asst Devel
Program; states pick which if any AAAs to fund Transform Title IV
AoA Suggestions

Increase min amt of state admin from $500k to $750k, affects low-population states
Transfers Title V Senior Community Service Employment Program to AoA from Dept. of Labor
Establish Senior Medicare Patrol within Title VII; from competitive grants to formulas to states
III D: Allow states to fund disease prevention and health promotion services directly by grant/contract (aka not all AAAs will be funded); all programs must be evidence-based
AoA Suggestions
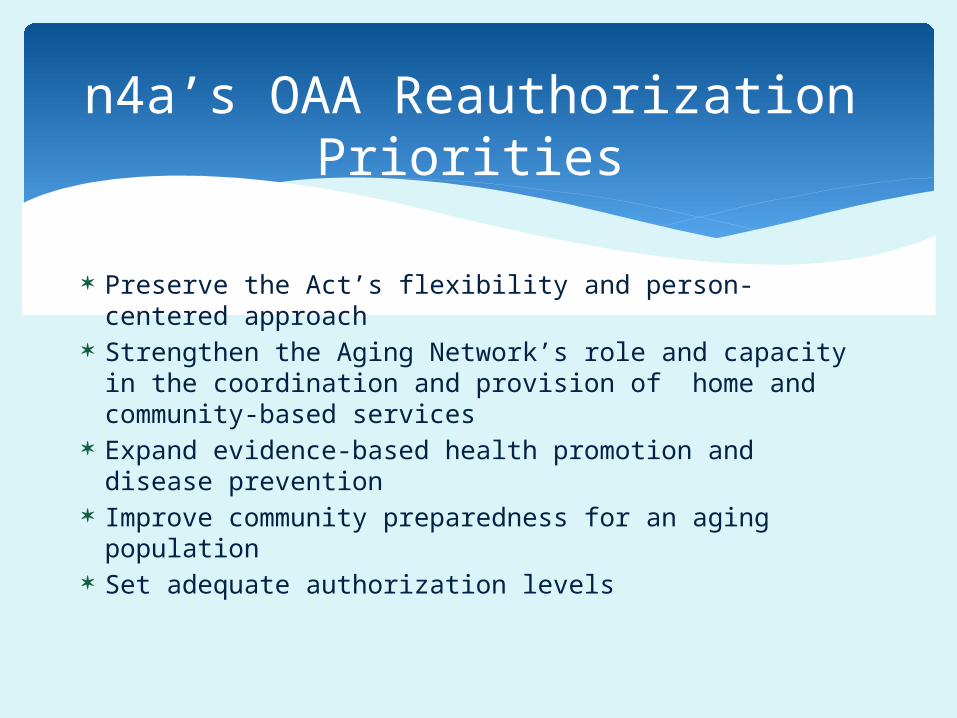
Preserve the Act’s flexibility and person-centered approach
Strengthen the Aging Network’s role and capacity in the coordination and provision of home and community-based services
Expand evidence-based health promotion and disease prevention
Improve community preparedness for an aging population
Set adequate authorization levels
n4a’s OAA Reauthorization Priorities

Cost-sharing Coordination (e.g., ADRCs, community health centers)
Smaller programs shifting to be state-run (e.g., legal services, III D)
Elder justice: APS, LTCOP
What are the issues under discussion?

Investment in workforce, specifically home care, direct care workers
Caregiver assessments Financial exploitation Home care ombudsmen programs and home
care consumer bill of rights
What are the issues under discussion?

Consolidates $ for C1 and C2 but sets floors: 40/35/25 Recommends increases of 50% in funding for nutrtion, supportive
services, SCSEP and HPDP Encourages collaboration with Federally Qualified Health Centers Add “economic security” to objectives, redefine “greatest
economic need” to 200% FPL Redefines “greatest social need” to include LGBT individuals and
older adults with HIV/AIDs or Alzheimer’s Senior Center Modernization encouraged Legal services: establishes new definition “integrated legal
assistance delivery system”; boosts state’s role over current local role for AAAs
And more…
S. 2037
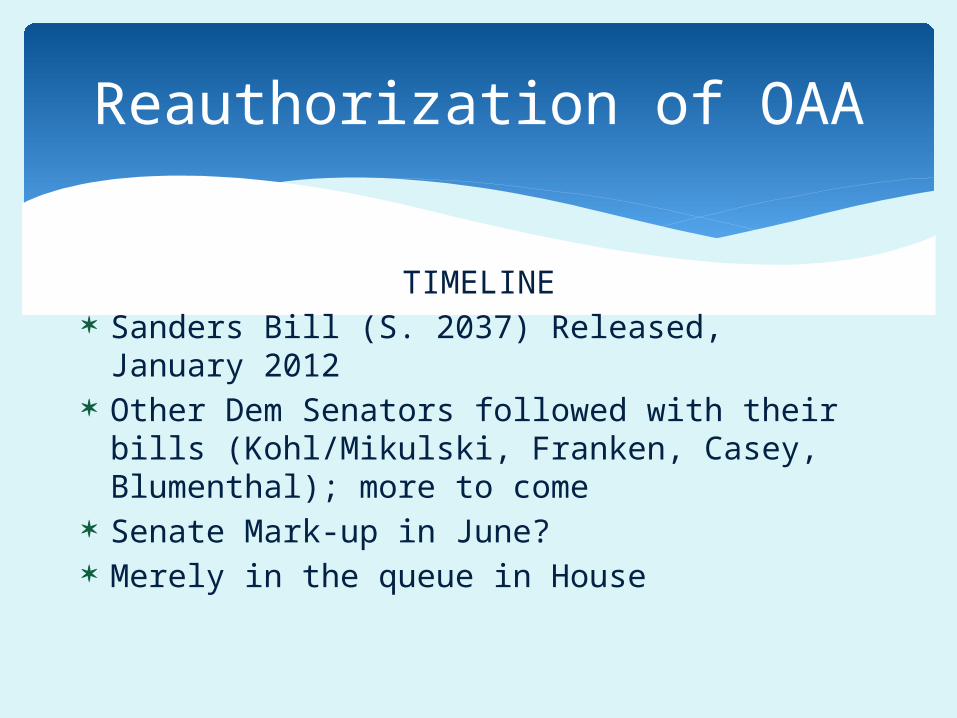
TIMELINE Sanders Bill (S. 2037) Released, January 2012 Other Dem Senators followed with their bills
(Kohl/Mikulski, Franken, Casey, Blumenthal); more to come
Senate Mark-up in June? Merely in the queue in House
Reauthorization of OAA

S. 2037 Chairman Sanders (I-VT) S. 1750 Franken (D-MN) S. 1819 Kohl (D-WI) and Mikulski (D-MD) S. 1982 Casey (D-PA) S. 2077 Blumenthal (D-CT)Up next? Manchin, Bennet, others
OAA Bills

Advocacy Strategies
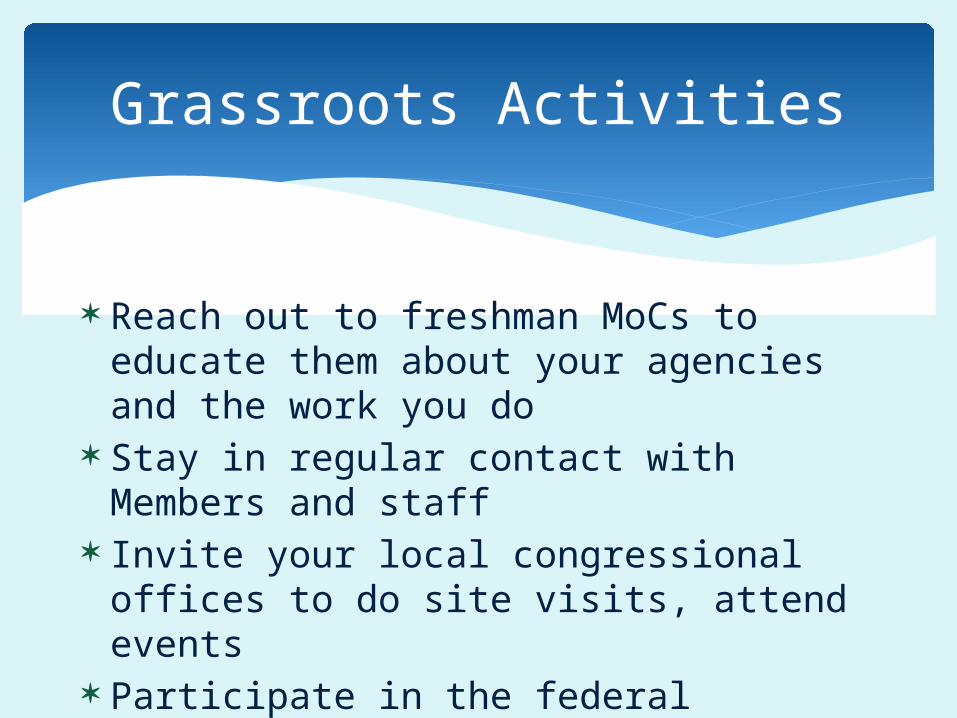
Reach out to freshman MoCs to educate them about your agencies and the work you do
Stay in regular contact with Members and staff
Invite your local congressional offices to do site visits, attend events
Participate in the federal regulatory process to make your voice heard
Grassroots Activities
Sandy [email protected]
www.n4a.orgwww.facebook.com/n4aACTION
www.twitter.com/n4aACTION or www.twitter.com/AmyGotwals
Questions?