federal highway administration design manual: deep mixing for
TRANSCRIPT
FOREWORD
The deep mixing method (DMM) is an in situ soil treatment in which native soils or fills are blended with cementitious and/or other materials, typically referred to as binders. Compared to native soils or fills, the soil-binder composite material that is created has enhanced engineering properties such as increased strength, lower permeability, and reduced compressibility. The treated soil properties obtained by DMM reflect the characteristics of the native soil, binder characteristics, construction variables, operational parameters, curing time, and loading conditions.
The purpose of this report is to provide user-oriented DMM design and construction guidelines for the support of embankments and typical transportation-oriented foundations. The use of DMM for liquefaction mitigation and excavation support is also discussed in general terms, since these applications are often associated with DMM projects for embankments and foundations. The embankment and foundation applications addressed in this manual include embankment support (both new embankments and embankment widening), culvert support through an embankment founded on DMM, bridge abutment support, retaining wall foundations, and bridge pier support.
This manual includes guidelines required for U.S. transportation engineers to plan, design, construct, and monitor deep mixing projects for embankment and foundation support. Information includes background on the use of DMM for transportation projects in the United States; a glossary of commonly used terminology and nomenclature; a description of applications, feasibility, and flow of design and construction for DMM projects; site investigation and characterization considerations; ranges of treated soil properties and a procedure for determining treated soil strengths for design; recommended design procedures for embankment and foundation applications and a design example; a description of contract procurement vehicles and recommendations; guidance for developing plans and specifications for contract documents; guidance for developing bench-scale testing and full-scale field testing programs; a description of means, methods, and materials for DMM; an overview of available and recommended quality control/quality assurance procedures and monitoring techniques; and typical costs and methods for estimating costs of DMM projects for comparison with alternative technologies.
Jorge E. Pagán-Ortiz Director, Office of Infrastructure Research and Development
Notice This document is distributed under the sponsorship of the U.S. Department of Transportation in the interest of information exchange. The U.S. Government assumes no liability for its contents or use thereof. This report does not constitute a standard, specification, or regulation.
The U.S. Government does not endorse products or manufacturers. Trade and manufacturers’ names appear in this report only because they are considered essential to the object of the document.
Quality Assurance Statement The Federal Highway Administration (FHWA) provides high-quality information to serve Government, industry, and the public in a manner that promotes public understanding. Standards and policies are used to ensure and maximize the quality, objectivity, utility, and integrity of the information. FHWA periodically reviews quality issues and adjusts its programs and processes to ensure continuous quality improvements.

TECHNICAL REPORT DOCUMENTATION PAGE 1. Report No. FHWA-HRT-13-046
2. Government Accession No.
3. Recipient’s Catalog No.
4. Title and Subtitle Federal Highway Administration Design Manual: Deep Mixing for Embankment and Foundation Support
5. Report Date October 2013 6. Performing Organization Code
7. Author(s) Mary Ellen C. Bruce, Ryan R. Berg, James G. Collin, George M. Filz, Masaaki Terashi, and David S. Yang
8. Performing Organization Report No.
9. Performing Organization Name and Address Geotechnica, Sa., Inc. P.O. Box 178 Venetia, PA 15367
10. Work Unit No. (TRAIS) 11. Contract or Grant No. DTFH61-06-C-00039
12. Sponsoring Agency Name and Address Office of Transportation Management Federal Highway Administration 400 7th Street SW Washington, DC 20590
13. Type of Report and Period Covered 14. Sponsoring Agency Code
15. Supplementary Notes The Contracting Officer’s Technical Representative (COTR) was Michael Adams, HRDI-40. 16. Abstract This report provides background on deep mixing for U.S. transportation projects and provides further information on design and construction aspects. This report also includes guidelines required for U.S. transportation engineers to plan, design, construct, and monitor deep mixing projects for embankment and foundation support applications. Considerations for secondary associated applications such as excavation support and liquefaction mitigation are also discussed. 17. Key Words Deep mixing, Design manual, Case histories, Quality control, Quality assurance, Specifications, Construction, Feasibility, Foundations, Embankments
18. Distribution Statement No restrictions. This document is available to the public through the National Technical Information Service, Springfield, VA 22161
19. Security Classif. (of this report) Unclassified
20. Security Classif. (of this page) Unclassified
21. No. of Pages 244
22. Price
Form DOT F 1700.7 (8-72) Reproduction of completed page authorized

ii
SI* (MODERN METRIC) CONVERSION FACTORS APPROXIMATE CONVERSIONS TO SI UNITS
Symbol When You Know Multiply By To Find Symbol LENGTH
in inches 25.4 millimeters mm ft feet 0.305 meters m yd yards 0.914 meters m mi miles 1.61 kilometers km
AREA in2 square inches 645.2 square millimeters mm2
ft2 square feet 0.093 square meters m2
yd2 square yard 0.836 square meters m2
ac acres 0.405 hectares ha mi2 square miles 2.59 square kilometers km2
VOLUME fl oz fluid ounces 29.57 milliliters mL gal gallons 3.785 liters L ft3 cubic feet 0.028 cubic meters m3
yd3 cubic yards 0.765 cubic meters m3
NOTE: volumes greater than 1000 L shall be shown in m3
MASS oz ounces 28.35 grams glb pounds 0.454 kilograms kgT short tons (2000 lb) 0.907 megagrams (or "metric ton") Mg (or "t")
TEMPERATURE (exact degrees) oF Fahrenheit 5 (F-32)/9 Celsius oC
or (F-32)/1.8 ILLUMINATION
fc foot-candles 10.76 lux lx fl foot-Lamberts 3.426 candela/m2 cd/m2
FORCE and PRESSURE or STRESS lbf poundforce 4.45 newtons N lbf/in2 poundforce per square inch 6.89 kilopascals kPa
APPROXIMATE CONVERSIONS FROM SI UNITS Symbol When You Know Multiply By To Find Symbol
LENGTHmm millimeters 0.039 inches in m meters 3.28 feet ft m meters 1.09 yards yd km kilometers 0.621 miles mi
AREA mm2 square millimeters 0.0016 square inches in2
m2 square meters 10.764 square feet ft2
m2 square meters 1.195 square yards yd2
ha hectares 2.47 acres ac km2 square kilometers 0.386 square miles mi2
VOLUME mL milliliters 0.034 fluid ounces fl oz L liters 0.264 gallons gal m3 cubic meters 35.314 cubic feet ft3
m3 cubic meters 1.307 cubic yards yd3
MASS g grams 0.035 ounces ozkg kilograms 2.202 pounds lbMg (or "t") megagrams (or "metric ton") 1.103 short tons (2000 lb) T
TEMPERATURE (exact degrees) oC Celsius 1.8C+32 Fahrenheit oF
ILLUMINATION lx lux 0.0929 foot-candles fc cd/m2 candela/m2 0.2919 foot-Lamberts fl
FORCE and PRESSURE or STRESS N newtons 0.225 poundforce lbf kPa kilopascals 0.145 poundforce per square inch lbf/in2
*SI is the symbol for th International System of Units. Appropriate rounding should be made to comply with Section 4 of ASTM E380. e(Revised March 2003)
iii
TABLE OF CONTENTS
CHAPTER 1. INTRODUCTION TO THE DEEP MIXING METHOD IN THE UNITED STATES ..........................................................................................................................1
1.1 INTRODUCTION..............................................................................................................1 1.2 SCOPE OF MANUAL .......................................................................................................1 1.3 STUDY AND USE OF DMM BY U.S. TRANSPORTATION AGENCIES ................4
CHAPTER 2. TERMINOLOGY ..................................................................................................7
CHAPTER 3. APPLICATIONS, FEASIBILITY, AND FLOW OF DESIGN AND CONSTRUCTION FOR DMM PROJECTS ............................................................................11
3.1 TYPICAL DMM TRANSPORTATION APPLICATIONS ........................................11 3.2 FEASIBILITY OF USING DMM ..................................................................................15
3.2.1 Advantages and Potential Limitations of DMM .......................................................15 3.2.2 Feasibility Evaluation for Using Deep Mixing for Transportation Projects .............19
3.3 DESIGN AND CONSTRUCTION FLOW FOR DMM PROJECTS .........................21 3.3.1 Data Collection .........................................................................................................21 3.3.2 Analysis and Design .................................................................................................22 3.3.3 Contractor Procurement ............................................................................................24 3.3.4 Construction and QC/QA ..........................................................................................25
CHAPTER 4. SITE EXPLORATION PROGRAM .................................................................27 4.1 INTRODUCTION............................................................................................................27 4.2 PHASED APPROACH TO SITE EXPLORATION ....................................................27
4.2.1 Phase 1—Office Studies and Site Reconnaissance ...................................................27 4.2.2 Phase 2—Preliminary Field Investigations and Laboratory Testing ........................28 4.2.3 Phase 3—Detailed Field Investigations and Laboratory Testing .............................28
4.3 GENERAL SITE EXPLORATION PLANNING FOR DMM PROJECTS ..............28 4.4 IMPORTANT SITE EXPLORATION DETAILS FOR DMM PROJECTS ............32
CHAPTER 5. TREATED SOIL PROPERTY VALUES FOR DESIGN ...............................35 5.1 INTRODUCTION............................................................................................................35 5.2 PHASE RELATIONSHIPS ............................................................................................35 5.3 ENGINEERING PROPERTY VALUES FOR DMM DESIGNS ...............................40 5.4 STRENGTH .....................................................................................................................41
5.4.1 Factors that Influence the Strength of Deep Mixed Soil ...........................................41 5.4.2 Effect of Total Water-to-Binder Ratio ......................................................................42 5.4.3 Effect of Curing Time ...............................................................................................43 5.4.4 Peak Unconfined Strength Versus Residual Confined Strength ...............................43 5.4.5 Unconfined Compressive Strength from Laboratory-Prepared Specimens ..............44 5.4.6 Differences Between the Strength of Laboratory-Prepared Specimens and Field-Mixed Specimens ...............................................................................................................44 5.4.7 Unconfined Compressive Strength Specified on Previous Projects .........................45 5.4.8 Strength Variability ...................................................................................................45 5.4.9 Characteristics of the Strength Envelope for Design ................................................46 5.4.10 Establishing a Project-Specific Range of Unconfined Compressive Strengths ......46
5.5 MODULUS .......................................................................................................................47

iv
5.6 POISSON’S RATIO ........................................................................................................48 5.7 PERMEABILITY (HYDRAULIC CONDUCTIVITY) ...............................................48 5.8 UNIT WEIGHT ...............................................................................................................48
CHAPTER 6. DESIGN RECOMMENDATIONS ....................................................................51 6.1 DESIGN OF DEEP MIXING TO SUPPORT EMBANKMENTS..............................51
6.1.1 Step 1—Establish Project Requirements ..................................................................51 6.1.2 Step 2—Establish Representative Subsurface Conditions ........................................52 6.1.3 Step 3—Establish Trial Deep Mixed Ground Property Values ................................53 6.1.4 Step 4—Establish Trial Deep Mixed Geometry .......................................................55 6.1.5 Step 5—Evaluate Settlement ....................................................................................61 6.1.6 Step 6—Evaluate Stability ........................................................................................62 6.1.7 Step 7—Prepare Plans and Specifications ................................................................73 6.1.8 Basis for Design Procedure .......................................................................................73
6.2 DESIGN CONSIDERATIONS FOR DMM SUPPORTED STRUCTURES .............73 6.3 LIQUEFACTION MITIGATION .................................................................................73 6.4 EXCAVATION SUPPORT.............................................................................................76
CHAPTER 7. DESIGN EXAMPLE ...........................................................................................77 7.1 INTRODUCTION............................................................................................................77
7.1.1 Step 1—Establish Project Requirements ..................................................................77 7.1.2 Step 2—Establish Representative Subsurface Conditions ........................................78 7.1.3 Step 3—Establish Trial Deep Mixed Ground Property Values ................................78 7.1.4 Step 4—Establish Trial Deep Mixed Geometry .......................................................79 7.1.5 Step 5—Evaluate Settlement ....................................................................................80 7.1.6 Step 6—Evaluate Stability ........................................................................................81 7.1.7 Step 7—Prepare Plans and Specifications ................................................................90
CHAPTER 8. CONTRACTOR PROCUREMENT .................................................................91 8.1 RECOMMENDED CONTRACTING APPROACH ...................................................92 8.2 MEASUREMENT AND PAYMENT .............................................................................95 8.3 OTHER PROCUREMENT METHODS .......................................................................95 8.4 CONTRACTOR QUALIFICATIONS ..........................................................................96
CHAPTER 9. SPECIFICATIONS, PLANS, AND CONTRACTOR SUBMITTALS ..........99 9.1 SPECIFICATIONS..........................................................................................................99 9.2 PLANS ............................................................................................................................100 9.3 CONTRACTOR SUBMITTALS .................................................................................101
9.3.1 Contractor Experience Profile.................................................................................101 9.3.2 Bench-Scale Testing Results...................................................................................101 9.3.3 Field Validation Program Plan................................................................................101 9.3.4 Deep Mixing Work Plan .........................................................................................102 9.3.5 Material Certifications ............................................................................................103 9.3.6 Production Records .................................................................................................103 9.3.7 QC/QA Records ......................................................................................................104 9.3.8 As-Built Field Measurement Data ..........................................................................105

v
CHAPTER 10. BENCH-SCALE TESTING AND FIELD VALIDATION PROGRAM ...107 10.1 TIMING OF PRECONSTRUCTION TESTING ACTIVITIES ............................107 10.2 BENCH-SCALE TESTING ........................................................................................108
10.2.1 Goals of Bench-Scale Testing Program ................................................................108 10.2.2 Bench-Scale Testing Program ...............................................................................108
10.3 FIELD VALIDATION PROGRAM (FULL-SCALE FIELD TESTING) .............109 10.3.1 Goals of Full-Scale Field Testing .........................................................................110 10.3.2 Full-Scale Field Testing Program .........................................................................110
CHAPTER 11. CONSTRUCTION ..........................................................................................113 11.1 CLASSIFICATION OF METHODS .........................................................................113 11.2 WET MIXING METHODS ........................................................................................115
11.2.1 Slurry Batch Plant .................................................................................................115 11.2.2 Wet Mixing Equipment and Processes .................................................................116 11.2.3 WRS Methods .......................................................................................................117 11.2.4 WRE Methods .......................................................................................................119 11.2.5 WJE Methods ........................................................................................................122 11.2.6 WVP Methods .......................................................................................................123
11.3 DRY MIXING METHODS .........................................................................................125 11.3.1 Binder Injection Equipment ..................................................................................125 11.3.2 Dry Mixing Equipment and Process .....................................................................125
11.4 OPERATIONAL CONSIDERATIONS ....................................................................128 11.4.1 Injection Method ...................................................................................................128 11.4.2 Rotation and Penetration Speeds ..........................................................................129 11.4.3 Tooling Geometry .................................................................................................129
CHAPTER 12. QC/QA ..............................................................................................................131 12.1 INTRODUCTION........................................................................................................131 12.2 QC..................................................................................................................................131
12.2.1 Role of QC Personnel ...........................................................................................132 12.2.2 Bench-Scale and Field Validation (Full-Scale Field Testing) Programs ..............132 12.2.3 Deep Mixing Work Plan .......................................................................................132 12.2.4 Materials and Production Monitoring ...................................................................132 12.2.5 QC Documentation ...............................................................................................136
12.3 QA..................................................................................................................................137 12.3.1 Role of QA Personnel ...........................................................................................137 12.3.2 Engineering Properties to be Verified for QA Purposes .......................................137 12.3.3 Coring ...................................................................................................................137 12.3.4 Wet Grab Sampling...............................................................................................141 12.3.5 Other Verification Methods ..................................................................................143 12.3.6 Acceptance Criteria ...............................................................................................145 12.3.7 Remedial Measures for Noncompliance ...............................................................148
CHAPTER 13. COST ESTIMATING .....................................................................................149 13.1 FACTORS THAT AFFECT DMM COSTS..............................................................149 13.2 UNIT COSTS FOR DMM...........................................................................................149 13.3 MOBILIZATION/DEMOBILIZATION ...................................................................149 13.4 QC/QA COSTS ............................................................................................................149

vi
13.5 ENGINEERING COSTS ............................................................................................150 13.6 MEASUREMENT AND PAYMENT .........................................................................151
APPENDIX A. LABORATORY PROCEDURE FOR MIXING, CURING, AND STRENGTH TESTING OF TREATED SOIL SPECIMENS APPLICABLE TO WET MIXING .....................................................................................................................153
EQUIPMENT AND MATERIALS ....................................................................................153 MATERIAL PREPARATION AND STORAGE PRIOR TO USE ...............................154 SOIL MIXING .....................................................................................................................154 BINDER SLURRY MIXING ..............................................................................................155 SOIL-BINDER MIXING ....................................................................................................155 PLACING THE MIXTURE IN THE MOLDS .................................................................155 CURING ...............................................................................................................................156 SPECIMEN PREPARATION AND TESTING ................................................................156 DATA REDUCTION ...........................................................................................................158
APPENDIX B. CALCULATIONS FOR LABORATORY PREPARATION OF SOIL-CEMENT MIXTURES FOR APPLICATION TO WET MIXING ..........................159
APPENDIX C. GUIDE CONSTRUCTION SPECIFICATION FOR DEEP MIXING .....163 DEEP MIXING GUIDE CONSTRUCTION SPECIFICATION....................................163 PART 1—GENERAL ..........................................................................................................163
1.1 Scope ..........................................................................................................................163 1.2 References ..................................................................................................................163 1.3 Definitions..................................................................................................................164 1.4 Project Description and Performance Requirements .................................................167 1.5 Qualifications of Contractor ......................................................................................168 1.6 Available Information ................................................................................................169 1.7 Construction Site Survey ...........................................................................................170 1.8 Submittals ..................................................................................................................170 1.9 Preconstruction Meeting ............................................................................................174
PART 2—MATERIALS AND EQUIPMENT ..................................................................174 2.1 Materials ....................................................................................................................174 2.2 Equipment ..................................................................................................................174 2.3 Products......................................................................................................................176
PART 3—EXECUTION .....................................................................................................176 3.1 General .......................................................................................................................176 3.2 Field Validation Program ...........................................................................................177 3.3 Binder Preparation (Wet Method) .............................................................................177 3.4 Locating Elements .....................................................................................................178 3.5 Mixing ........................................................................................................................178 3.6 QC ..............................................................................................................................181
PART 4—MEASUREMENT AND PAYMENT ...............................................................189
APPENDIX D. TABULATED DATA FOR DMM METHODS AND EQUIPMENT USED INTERNATIONALLY ..................................................................................................191
ACKNOWLEDGMENTS .........................................................................................................209
REFERENCES ...........................................................................................................................213

vii
LIST OF FIGURES
Figure 1. Illustration. Embankment supported on DMM ............................................................... 2 Figure 2. Illustration. Cut and cover culvert supported on DMM through embankment ............... 2 Figure 3. Illustration. Abutment supported on deep foundations and adjacent embankment supported on DMM ......................................................................................................................... 3 Figure 4. Illustration. Abutment and embankment supported on DMM ........................................ 3 Figure 5. Illustration. Retaining wall supported on DMM without retained soil supported on DMM............................................................................................................................................... 3 Figure 6. Illustration. Bridge pier supported on DMM ................................................................... 3 Figure 7. Flowchart. Design and construction for DMM projects ................................................ 21 Figure 8. Illustration. Typical configuration of DMM columns for transportation applications .. 22 Figure 9. Illustration. External stability mode of failure for overturning and sliding .................. 23 Figure 10. Illustration. External stability mode of failure for bearing capacity ........................... 23 Figure 11. Illustration. Internal stability mode of failure for circular sliding surface .................. 24 Figure 12. Illustration. Internal stability mode of failure for vertical shearing ............................ 24 Figure 13. Illustration. Phase diagrams for dry mixing ................................................................ 36 Figure 14. Illustration. Phase diagrams for wet mixing ................................................................ 36 Figure 15. Equation. Specific gravity of soil solids ...................................................................... 37 Figure 16. Equation. Specific gravity of the binder ...................................................................... 37 Figure 17. Equation. Binder factor in-place.................................................................................. 38 Figure 18. Equation. Binder content ............................................................................................. 38 Figure 19. Equation. Total water-to-binder ratio .......................................................................... 38 Figure 20. Equation. Volume ratio expressed in terms of binder factor for any degree of saturation ....................................................................................................................................... 39 Figure 21. Equation. Volume ratio expressed in terms of binder factor in-place for S = 1 .......... 39 Figure 22. Equation. Volume ratio expressed in terms of binder factor in-place for any S ......... 39 Figure 23. Equation. Volume ratio expressed in terms of binder content for any S ..................... 39 Figure 24. Equation. Volume ratio expressed in terms of total-water-to-binder ratio for any S ........................................................................................................................................ 39 Figure 25. Equation. Binder factor expressed in terms of binder factor in-place for S = 1 .......... 40 Figure 26. Equation. Binder factor expressed in terms of binder factor in-place for any S ......... 40 Figure 27. Equation. Binder factor expressed in terms of binder content for any S ..................... 40 Figure 28. Equation. Binder factor expressed in terms of total-water-to-binder ratio for any S ........................................................................................................................................ 40 Figure 29. Graph. Unconfined compressive strength versus total water-to-cement ratio for laboratory-mixed and tested specimens ........................................................................................ 42 Figure 30. Equation. Curing factor ............................................................................................... 43 Figure 31. Equation. Total unit weight of a saturated mixture using dry mixing ......................... 48 Figure 32. Equation. Total unit weight of a saturated mixture using wet mixing ........................ 49 Figure 33. Equation. Shear strength of the deep mixed ground.................................................... 53 Figure 34. Equation. Young’s modulus of deep mixed ground for wet mixing ........................... 55 Figure 35. Equation. Young’s modulus of deep mixed ground for dry mixing ............................ 55 Figure 36. Illustration. Typical arrangement for deep-mixed zone beneath an embankment ...... 56 Figure 37. Equation. Area replacement ratio beneath the central portion of an embankment ..... 57 Figure 38. Illustration. Definition sketch for column overlap calculations .................................. 58

viii
Figure 39. Equation. Area replacement ratio under the side slopes of the embankment .............. 58 Figure 40. Equation. Chord angle expressed in radians................................................................ 59 Figure 41. Equation. Chord length ................................................................................................ 59 Figure 42. Equation. Overlap area ratio ........................................................................................ 59 Figure 43. Equation. Area replacement ratio of the shear walls ................................................... 59 Figure 44. Equation. Area replacement ratio beneath central portion of embankment ................ 60 Figure 45. Equation. Ratio of chord length to shear wall spacing ................................................ 61 Figure 46. Equation. Composite modulus..................................................................................... 61 Figure 47. Equation. Compression of the treated zone ................................................................. 62 Figure 48. Illustration. Potential sliding surfaces and assignment of composite shear strength, sdm,center and sdm,wall .......................................................................................................... 63 Figure 49. Equation. Composite shear strength of the deep mixed zone beneath the shear walls ..................................................................................................................................... 63 Figure 50. Equation. Composite shear strength of the deep mixed zone beneath the central portion of the embankment ............................................................................................... 63 Figure 51. Illustration. Definition sketch for combined overturning and bearing calculations .... 65 Figure 52. Equation. Mobilized total stress cohesion intercept .................................................... 66 Figure 53. Equation. Mobilized total stress friction angle ............................................................ 66 Figure 54. Equation. Mobilized effective stress cohesion intercept ............................................. 66 Figure 55. Equation. Mobilized effective stress friction angle ..................................................... 66 Figure 56. Equation. Vertical force............................................................................................... 67 Figure 57. Equation. Effective vertical force ................................................................................ 67 Figure 58. Equation. Location of total resultant force .................................................................. 67 Figure 59. Equation. Location of the resultant force acting on the base of the deep mixed zone .................................................................................................................................... 67 Figure 60. Equation. Bearing pressure at the toe of the deep mixed shear walls using total normal stresses ...................................................................................................................... 68 Figure 61. Equation. Bearing pressure at the toe of the deep mixed shear walls using effective normal stresses ............................................................................................................... 68 Figure 62. Equation. Allowable bearing pressure at the toe of the deep mixed shear walls using total normal stresses ............................................................................................................ 68 Figure 63. Equation. Allowable bearing pressure at the toe of the deep mixed shear walls using a total stress friction angle equal to zero ............................................................................. 69 Figure 64. Equation. Allowable bearing pressure at the toe of the deep mixed shear walls using effective normal stresses ..................................................................................................... 69 Figure 65. Equation. Allowable bearing capacity of the deep mixed ground against crushing of the deep mixed shear walls at the outside toe of the embankment ........................................... 70 Figure 66. Equation. Total lateral earth pressure .......................................................................... 70 Figure 67. Equation. Effective lateral earth pressure .................................................................... 70 Figure 68. Illustration. Racking failure mode ............................................................................... 71 Figure 69. Equation. Average vertical shear stress ....................................................................... 71 Figure 70. Equation. Allowable vertical shear stress .................................................................... 72 Figure 71. Equation. Maximum clear spacing between shear walls ............................................. 72 Figure 72. Equation. Allowable axial structural capacity of a deep mixed column ..................... 73 Figure 73. Illustration. Plan view of soil-cement columns on BART project .............................. 74 Figure 74. Illustration. DMM treatment plan................................................................................ 75

ix
Figure 75. Illustration. Typical configuration of DMM for liquefaction mitigation .................... 75 Figure 76. Illustration. Example problem—embankment cross section ....................................... 77 Figure 77. Equation. Example problem—curing factor ................................................................ 78 Figure 78. Equation. Example problem—shear strength of the deep mixed ground .................... 78 Figure 79. Equation. Example problem—determine Edm according to figure 34 ......................... 79 Figure 80. Equation. Example problem—area replacement ratio beneath the central portion of the embankment ........................................................................................................................ 79 Figure 81. Equation. Example problem—chord angle in radians ................................................. 80 Figure 82. Equation. Example problem—ratio of chord length to shear wall spacing ................. 80 Figure 83. Equation. Example problem—composite modulus ..................................................... 80 Figure 84. Equation. Example problem—compression of the treated zone ................................. 81 Figure 85. Equation. Example problem—composite shear strength of the deep mixed zone beneath the shear walls ................................................................................................................. 81 Figure 86. Equation. Example problem—composite shear strength of the deep mixed zone beneath the central portion of the embankment ............................................................................ 82 Figure 87. Illustration. Slope stability results ............................................................................... 82 Figure 88. Equation. Example problem—shear strength of the soft clay using total normal stresses .......................................................................................................................................... 83 Figure 89. Equation. Example problem—mobilized total stress friction angle of the soft clay ... 83 Figure 90. Equation. Example problem—composite shear strength of the center deep mixed zone using total normal stresses .................................................................................................... 83 Figure 91. Equation. Example problem—composite shear strength of the embankment material using effective normal stresses ....................................................................................... 83 Figure 92. Equation. Example problem—mobilized effective stress friction angle of the embankment material .................................................................................................................... 83 Figure 93. Equation. Example problem—mobilized effective stress friction angle of the dense sand layer ............................................................................................................................ 83 Figure 94. Equation. Example problem—effective stress active lateral earth pressure coefficient ..................................................................................................................................... 84 Figure 95. Equation. Example problem—active force component from embankment ................ 84 Figure 96. Equation. Example problem—vertical distance from overturning point to line of action of active force component from embankment ................................................................... 84 Figure 97. Equation. Example problem—active force component from surcharge ..................... 84 Figure 98. Equation. Example problem—vertical distance from overturning point to line of action of active force component from surcharge ......................................................................... 84 Figure 99. Equation. Example problem—active force component from clay rectangle .............. 84 Figure 100. Equation. Example problem—vertical distance from overturning point to line of action of active force component from clay rectangle .................................................................. 84 Figure 101. Equation. Example problem—active force component from clay triangle ............... 84 Figure 102. Equation. Example problem—vertical distance from overturning point to line of action of active force component from clay triangle .................................................................... 85 Figure 103. Equation. Example problem—total active force ....................................................... 85 Figure 104. Equation. Example problem—vertical distance between overturning point and total active force ............................................................................................................................ 85 Figure 105. Equation. Example problem—active side shear force from the soft clay ................. 85 Figure 106. Equation. Example problem—passive side shear force from the soft clay ............... 85

x
Figure 107. Equation. Example problem—passive lateral force component from the clay rectangle ........................................................................................................................................ 85 Figure 108. Equation. Example problem—vertical distance from overturning point to line of action of passive force component from the clay rectangle ..................................................... 85 Figure 109. Equation. Example problem—passive lateral earth force component from the clay triangle ................................................................................................................................... 86 Figure 110. Equation. Example problem—vertical distance from the overturning point to the line of action of passive force component from clay triangle ................................................. 86 Figure 111. Equation. Example problem—total passive lateral earth force ................................. 86 Figure 112. Equation. Example problem—vertical distance between the overturning point and the total passive force ............................................................................................................. 86 Figure 113. Equation. Example problem—weight of the embankment ....................................... 86 Figure 114. Equation. Example problem—location of the resultant of the embankment weight ............................................................................................................................................ 86 Figure 115. Equation. Example problem—weight of the deep mixed zone ................................. 86 Figure 116. Equation. Example problem—location of the resultant of the deep mixed zone ...... 86 Figure 117. Equation. Example problem—total weight ............................................................... 87 Figure 118. Equation. Example problem—location of the resultant of the total weight .............. 87 Figure 119. Equation. Example problem—resultant total vertical force ...................................... 87 Figure 120. Equation. Example problem—water force acting on the base of the deep mixed zone .................................................................................................................................... 87 Figure 121. Equation. Example problem—location of water force acting on the base of the deep mixed zone...................................................................................................................... 87 Figure 122. Equation. Example problem—resultant effective vertical force ............................... 87 Figure 123. Equation. Example problem—location of total resultant force acting on the base of the deep mixed zone ......................................................................................................... 87 Figure 124. Equation. Example problem—location of the effective resultant force acting on the base of the deep mixed zone .............................................................................................. 88 Figure 125. Equation. Example problem—Position of resultant within the base ......................... 88 Figure 126. Equation. Example problem—bearing pressure at the toe of the deep mixed shear walls ..................................................................................................................................... 88 Figure 127. Equation. Example problem—allowable bearing pressure at the toe of the deep mixed shear walls .......................................................................................................................... 88 Figure 128. Equation. Example problem—at-rest lateral earth pressure coefficient .................... 89 Figure 129. Equation. Example problem—effective vertical stress ............................................. 89 Figure 130. Equation. Example problem—at-rest effective lateral earth pressure ....................... 89 Figure 131. Equation. Example problem—allowable bearing capacity of deep mixed ground ... 89 Figure 132. Equation. Example problem—location of the force resultant along the base of the deep mixed zone ................................................................................................................. 89 Figure 133. Equation. Example problem—average vertical shear stress on the critical vertical plane ................................................................................................................................. 90 Figure 134. Equation. Example problem—allowable vertical shear stress in the deep mixed zone ............................................................................................................................................... 90 Figure 135. Equation. Example problem—maximum clear spacing between shear columns ...... 90 Figure 136. Graph. General allocation of responsibility between owner and GC or DMM contractor based on contracting approach..................................................................................... 91

xi
Figure 137. Flowchart. Classification of vertical axis DMMs based on agent (W/D), penetration/mixing principle (R/J/V), and location of mixing action (S/E/P) ............................ 114 Figure 138. Photo. Slurry batching plant for larger mixing project............................................ 115 Figure 139. Photo. Typical WRS mixing machine ..................................................................... 117 Figure 140. Photo. Typical blade-based tooling for WRS mixing ............................................. 118 Figure 141. Photo. Second view of typical blade-based tooling for WRS mixing ..................... 118 Figure 142. Photo. Typical auger-based tools for WRS methods............................................... 119 Figure 143. Photo. WRE mixing equipment ............................................................................... 120 Figure 144. Photo. Typical tools used for WRE mixing............................................................. 120 Figure 145. Photo. Second view of typical tools used for WRE mixing .................................... 121 Figure 146. Photo. CSM method cutter wheels .......................................................................... 122 Figure 147. Photo. Example of a WJE tool ................................................................................ 123 Figure 148. Photo. TRD tooling ................................................................................................. 124 Figure 149. Photo. Second view of TRD tooling........................................................................ 124 Figure 150. Photo. Typical binder delivery unit for dry mixing ................................................. 125 Figure 151. Photo. Typical mixing tool for DRE methods ......................................................... 126 Figure 152. Photo. Typical mixing tool for DRE methods for peat mixing ............................... 126 Figure 153. Photo. Horizontal mixing tool for mass soil stabilization ....................................... 128 Figure 154. Equation. BRN ........................................................................................................ 129 Figure 155. Equation. Dry unit weight expressed in terms of the total unit weight of the soil and the water content ........................................................................................................... 159 Figure 156. Equation. Dry unit weight expressed in terms of the specific gravity, water content, and degree of saturation ................................................................................................ 159 Figure 157. Equation. Dry unit weight expressed in terms of the specific gravity and water content for saturation equal to 1 ........................................................................................ 159 Figure 158. Equation. Degree of saturation ................................................................................ 159 Figure 159. Equation. Dry unit weight of slurry ......................................................................... 160 Figure 160. Equation. Volume of soil-cement mixture .............................................................. 160 Figure 161. Equation. Weight of soil .......................................................................................... 160 Figure 162. Equation. Weight of binder used in the slurry ......................................................... 160 Figure 163. Equation. Weight of water used in the slurry .......................................................... 160 Figure 164. Equation. Water-to-binder ratio of slurry ................................................................ 160 Figure 165. Equation. Volume ratio of mixed soil ..................................................................... 161 Figure 166. Equation. As-mixed binder factor in-place for any degree of saturation ................ 161 Figure 167. Equation. As-mixed binder factor in-place for saturation equal to 1 ...................... 161 Figure 168. Equation. As-mixed binder factor expressed in terms of VR and dry unit weight of slurry ........................................................................................................................... 161 Figure 169. Equation. Binder content of mixed soil ................................................................... 161 Figure 170. Equation. Total water-to-binder ratio of mixed soil ................................................ 161 Figure 171. Equation. Adjusted weight of slurry water .............................................................. 162

xii
LIST OF TABLES
Table 1. Use of DMM for embankment and foundation applications ............................................ 2 Table 2. Summary of DMM usage for U.S. transportation projects ............................................. 12 Table 3. Relative advantages and disadvantages of DMM for general transportation project applications (adapted from FHWA) ................................................................................ 17 Table 4. Alternative technologies to DMM .................................................................................. 19 Table 5. Factors to consider in feasibility assessment for using DMM ........................................ 19 Table 6. Summary of evaluations, information, and testing considerations for highway applications of DMM .................................................................................................................... 29 Table 7. Guidelines for minimum numbers and depths of investigation points for highway applications of DMM .................................................................................................................... 31 Table 8. Definitions of deep mixing parameters ........................................................................... 38 Table 9. Factors affecting strength of deep mixed soil ................................................................. 41 Table 10. Specified strengths for selected DMM projects ............................................................ 45 Table 11. Typical design values of safety factors for design of deep mixing to support embankments ................................................................................................................................ 52 Table 12. Values of fv .................................................................................................................... 54 Table 13. Values of β, c/d, and ae for selected values of e/d ........................................................ 59 Table 14. Values of as,shear for selected values of e/d and d/s ....................................................... 60 Table 15. Values of c/sshear for selected values of e/d and d/s ...................................................... 60 Table 16. Geometric parameters necessary for design ................................................................. 61 Table 17. Example problem—geometric parameters ................................................................... 80 Table 18. Typical allocation of responsibilities of owner and contractor for DMM work ........... 93 Table 19. Suggested pay items and units of measure for DMM contract items ........................... 95 Table 20. Typical equipment and common applications for the four general classifications of wet mixing methods................................................................................................................ 116 Table 21. Generalized factors affecting costs of DMM projects for embankment and foundation support ...................................................................................................................... 150 Table 22. Unit costs and associated general project conditions .................................................. 151 Table 23. Strength correction factors .......................................................................................... 157 Table 24. Batch mix proportions and trend-line strengths .......................................................... 158 Table 25. Allowable geometric parameters for DMM construction ........................................... 168 Table 26. Measurement and payment items for DMM contracts ............................................... 189 Table 27. Equipment, tooling, and treated soil properties for DSM and SMW techniques ....... 192 Table 28. Equipment, tooling, and treated soil properties for TREVIMIX Wet and Colmix techniques ................................................................................................................................... 193 Table 29. Equipment, tooling, and treated soil properties for Soil Removal Technique and CDM ..................................................................................................................................... 194 Table 30. Equipment, tooling, and treated soil properties for SSM and in situ stabilization (ISS) auger method techniques ................................................................................................... 195 Table 31. Equipment, tooling, and treated soil properties for RAS column method and rectangular 1 (cutting wheels) techniques ................................................................................... 196 Table 32. Equipment, tooling, and treated soil properties for rectangular 2 (box columns) and single auger mixing (SAM) techniques................................................................................ 197

xiii
Table 33. Equipment, tooling, and treated soil properties for cementation and single axis tooling techniques ................................................................................................................ 198 Table 34. Equipment, tooling, and treated soil properties for Rotomix and CSM method techniques ................................................................................................................................... 199 Table 35. Equipment, tooling, and treated soil properties for spread wing (SWING) technique ..................................................................................................................................... 200 Table 36. Equipment, tooling, and treated soil properties for JACSMAN and LDis techniques ................................................................................................................................... 201 Table 37. Equipment, tooling, and treated soil properties for GeoJetTM and Hydramech techniques ................................................................................................................................... 202 Table 38. Equipment, tooling, and treated soil properties for RAS Jet and TURBOMIX techniques ................................................................................................................................... 203 Table 39. Equipment, tooling, and treated soil properties for TRD and dry jet mixing techniques ................................................................................................................................... 204 Table 40. Equipment, tooling, and treated soil properties for Nordic Method and TREVIMIX DRY techniques ..................................................................................................... 205 Table 41. Equipment, tooling, and treated soil properties for MDM and dry soil mixing mass techniques .......................................................................................................................... 206 Table 42. Equipment, tooling, and treated soil properties for Schnabel DMW technique ......... 207
xiv
LIST OF ACRONYMS
BART Bay Area Rapid Transit
BRN Blade rotation number
Caltrans California Department of Transportation
CDIT Coastal Development Institute of Technology
CDM Cement deep mixing
CDSM Cement deep soil mixing
CPT Cone penetration test
CSM Cutter soil mixing
DJM Dry jet mixing
DMM Deep mixing method
DRE Dry rotary end
DSM Deep soil mixing
ECI Early contractor involvement
FDOT Florida Department of Transportation
FHWA Federal Highway Administration
GC General contractor
GPS Global Positioning System
GWT Ground water table
ISS In situ stabilization
LPV Lake Pontchartrain and Vicinity
MassDOT Massachusetts Department of Transportation
MDM Modified deep mixing
MnDOT Minnesota Department of Transportation
PCC Portland cement concrete
PennDOT Pennsylvania Department of Transportation
PWPR Porewater pressure response ratio
QA Quality assurance
QC Quality control
RQD Rock quality designation
SPT Standard penetration test
TPF Transportation Pooled Fund

xv
TRD Trench cutting and remixing deep wall method
USACE U.S. Army Corps of Engineers
VDOT Virginia Department of Transportation
WisDOT Wisconsin Department of Transportation
WJE Wet jet end
WRE Wet rotary end
WRS Wet rotary shaft
WSDOT Washington State Department of Transportation
WVP Wet vertical panel


1
CHAPTER 1. INTRODUCTION TO THE DEEP MIXING METHOD IN THE UNITED STATES
1.1 INTRODUCTION
The deep mixing method (DMM) is an in situ soil treatment in which native soils or fills are blended with cementitious and/or other materials, typically referred to as binders. Compared to native soils or fills, the soil-binder composite material that is created has enhanced engineering properties such as increased strength, lower permeability, and reduced compressibility. Soils best suited to DMM include cohesive soils with high moisture contents and loose, saturated, fine granular soils. DMM has also been used successfully in a wide range of less cohesive soils and fills, but it is typically not feasible in very dense or stiff materials or in ground with obstructions such as cobbles or boulders. The treated soil properties obtained by DMM reflect the characteristics of the native soil, binder characteristics, construction variables, operational parameters, curing time, and loading conditions.
Two types of DMMs are used in the United States: wet mixing and dry mixing. Wet mixing involves injecting binders in slurry (wet) form to blend with the soil. Primarily single-auger, multi-auger, or cutter-based mixing processes are used with cement-based slurries to create isolated elements, continuous walls or blocks for large-scale foundation improvement, earth retaining systems, hydraulic barriers, and contaminant/fixation systems. Dry mixing uses binders in powder (dry) form that react with the water already present in the soil. Primarily single-auger dry mixing processes are used with lime and lime-cement mixtures to create isolated columns, panels, or blocks for soil stabilization as well as reinforcement of cohesive soils.
The generic term DMM is recommended and used within this manual. This term is inclusive of other terms such as deep soil mixing (DSM) and cement deep soil mixing (CDSM).
1.2 SCOPE OF MANUAL
In 2000 and 2001, the Federal Highway Administration (FHWA) produced a three-volume research report outlining the use of DMM for geotechnical applications.(1–3) The study focused on the applications, equipment, market conditions, and properties of treated soils produced using DMM. This study was followed by the research contributions of the National Deep Mixing Program, a Transportation Pooled Fund (TPF) Program study, TPF-5(001). TPF is a funding mechanism for State transportation departments and FHWA to pool financial and personnel resources to plan and conduct research projects of mutual interest. To increase the benefit of these efforts, FHWA commissioned the development of an unpublished literature review report as well as this design manual. The purpose of the literature review was to compile the information relevant to this report that was available from FHWA research efforts and national and international technical literature, provide background information on U.S. deep mixing for transportation projects, and identify additional sources information on design and construction methods.
The purpose of this report is to provide user-oriented DMM design and construction guidelines for the support of embankments and typical transportation-oriented foundations. The use of DMM for liquefaction mitigation and excavation support is also discussed in general terms since

2
these applications are often associated with DMM projects for embankments and foundations. Detailed liquefaction mitigation guidance is presented by Siddharthan and Suthahar.(4) Design guidance for excavation support is presented by Rutherford et al.(5) DMM is also frequently and successfully used to create hydraulic (seepage) cutoff walls or to remediate and/or contain environmentally hazardous materials. Seepage cutoffs and environmental applications are not addressed within the scope of this manual.
The embankment and foundation applications addressed in this manual are described in table 1 and depicted schematically in figure 1 through figure 6.
Table 1. Use of DMM for embankment and foundation applications. Application Description
Embankment support (both new embankments and embankment widening)
Embankment supported on isolated DMM elements (single columns, multi-auger overlapping columns, or barrettes), continuous shear walls formed by overlapping elements, or fully treated blocks formed by overlapping elements
Culvert through an embankment on DMM
Cut and cover culvert supported on DMM through an embankment supported on DMM
Bridge abutment support Abutment supported on deep foundations and embankment on DMM Abutment and embankment supported on DMM
Retaining wall foundations
Retaining wall supported on DMM without retained soil supported on DMM
Bridge pier support Bridge pier supported on DMM; generally, DMM would be used for this application if DMM is also being used to support the bridge approaches
Figure 1. Illustration. Embankment supported on DMM.
Figure 2. Illustration. Cut and cover culvert supported on DMM through embankment.

3
Figure 3. Illustration. Abutment supported on deep foundations and adjacent embankment
supported on DMM.
Figure 4. Illustration. Abutment and embankment supported on DMM.
Figure 5. Illustration. Retaining wall supported on DMM without retained soil
supported on DMM.
Figure 6. Illustration. Bridge pier supported on DMM.
The design portion of this manual focuses on deep mixing support of embankments. In most circumstances, for DMM to be considered for structure support, DMM would also have to be used for support of the embankment. Equipment mobilization costs and other start-up costs are often too high to justify the use of DMM at structure locations alone. Design recommendations for DMM support of structures are provided in this manual, but because embankment support is generally the deciding factor, this report mainly describes embankment support.
The chapters and associated content of this report are organized as follows:
• Chapter 1: Provides the scope of the manual and background information on the use of DMM for transportation projects in the United States.
• Chapter 2: Introduces a glossary of commonly used terminology.
• Chapter 3: Describes applications, feasibility, and flow of design and construction for DMM projects.
• Chapter 4: Includes site investigation and characterization considerations.

4
• Chapter 5: Provides ranges of treated soil properties and a procedure for determining treated soil strengths for design.
• Chapter 6: Details recommended design procedures for embankment and foundation applications.
• Chapter 7: Provides an example illustrating the design methods.
• Chapter 8: Describes contract procurement vehicles and recommendations.
• Chapter 9: Provides guidance for developing plans and specifications for contract documents.
• Chapter 10: Includes guidance for developing bench-scale testing and full-scale field testing programs.
• Chapter 11: Provides a construction overview (i.e., means, methods, and materials for DMM).
• Chapter 12: Describes an overview of available and recommended quality control/quality assurance (QC/QA) procedures and monitoring techniques.
• Chapter 13: Explains typical costs and methods for estimating costs of DMM projects for comparison with alternative technologies.
• Appendix A: Includes guidelines for preparing laboratory specimens for wet mixing methods.
• Appendix B: Includes guidelines for testing laboratory specimens for wet mixing methods.
• Appendix C: Provides guide specifications.
• Appendix D: Showcases tabulated data for DMM methods and equipment used internationally.
1.3 STUDY AND USE OF DMM BY U.S. TRANSPORTATION AGENCIES
Although DMM was invented in the United States in 1954, current methods mainly reflect developments made in Japan and Nordic countries over the past 40 years.(1) Until 1996, the international technical literature included many papers on the development and use of DMM. However, most of the papers were published in Japanese and Swedish. In 1996, an international conference on grouting and deep mixing was held in Tokyo, Japan, and the official conference language was English. This conference represented the first major exposure of U.S. engineers to the extent and potential use of the various techniques included in DMM. Some types of modern DMM had been in use in the United States since 1986.(6)

5
In 1997, FHWA began a concerted effort to research and study DMM and its applications. The first studies focused on gathering and summarizing information on DMM applications, equipment, and operations.(1,2) A later study focused on compiling and defining engineering characteristics of ground treated using DMM.(3)
In 1999, FHWA developed a ground improvement course and an accompanying reference manual.(7) This course covered traditional ground improvement techniques, included a module on DMM, and was offered and taught nationwide to State transportation departments. This was the first FHWA teaching vehicle that systematically introduced DMM to U.S. transportation engineers. The DMM module included applications, advantages, and potential limitations and introduced contemporary design techniques. Sufficient information was provided to allow engineers to assess the feasibility of using DMM as compared to alternative technologies. Comprehensive design and construction details were not included. In 2003, this demonstration course was developed into a 3-day National Highway Institute course, “Ground Improvement Methods,” which is offered nationwide and internationally. The accompanying reference manuals, Ground Improvement Methods Volume I and Ground Improvement Methods Volume II, represent an update to the 2001 reference manual.(8,9)
Recognizing the need for more detailed engineering tools for practicing engineers, FHWA developed the National Deep Mixing Research Program in 2001. The program was created as a TPF Program study and was established to facilitate the advancement and implementation of DMM technology through partnered research and dissemination of international experience.(10) Researchers from the National Deep Mixing Research Program administered and developed a series of practice-oriented reports on a range of DMM topics that address various design and laboratory issues.
In addition to these efforts, numerous researchers and practitioners have contributed to the published technical literature on DMM in the United States. Many papers on U.S. DMM advances have been presented at national and international conferences. These presentations have addressed case histories, analysis of project data, equipment advancements, laboratory testing results, characterization of engineering behavior of treated soils, and development of methods for analysis and design of foundation systems incorporating DMM. Short courses and seminars have been developed and offered by U.S. professional societies and universities to promote DMM as a viable alternative to other ground improvement technologies.
Since 1991, DMM has been used successfully on over 20 large transportation projects in the United States. Project details are summarized briefly in chapter 3. However, DMM usage in the United States has been limited for a number of reasons, most notably the absence of readily accessible and user friendly design guidelines and the lack of widely accepted and effective QC/QA practices. This situation contrasts with that in the huge, active and largely transportation-driven markets in Japan and Nordic countries.


7
CHAPTER 2. TERMINOLOGY
Terms specific to laboratory testing, treated soil properties, design, construction, and contracting/procurement are defined in this section. These terms are currently used and accepted by the U.S. construction industry.
Various definitions of the same terms are often used in U.S. practice. Using a variety of terms can be misleading, and this practice has caused contractual difficulties and confusion. A single preferred term is provided for each item. Duplicate terms are shown in parenthesis following the preferred term to promote understanding, but use of the preferred term is recommended.
• Admixtures: Ingredients in the grout other than binder, bentonite, and water. Admixtures can be fluidifiers, dispersants, or retarding, plugging, or bridging agents that permit efficient use of materials and proper workability of the grout.
• Bentonite: Ultra-fine natural clay, principally comprising sodium cation montmorillonite.
• Binder: Chemically reactive material (i.e., lime, cement, gypsum, blast furnace slag, flyash, or other hardening reagents) that can be used for mixing with in situ soils to strengthen the soils and form DMM columns. Also referred to as stabilizer or reagent. In U.S. practice, binder slurry is frequently referred to as grout or slurry.
• Binder content: Ratio of weight of dry binder to dry weight of soil to be treated.
• Binder factor: Ratio of weight of dry binder to volume of soil to be treated.
• Binder factor in-place: Ratio of weight of dry binder to volume of mixture, which is the volume of the soil to be treated plus the volume of the slurry for the wet method or the volume of the dry binder for the dry method.
• Binder slurry: Stable colloidal mixture of water, binder, and admixtures that assists in loosening the soils for effective mixing and strengthening the in situ soil upon setting.
• Blade rotation number (BRN): Total number of mixing blade rotations per meter of shaft movement. BRN has been developed to ensure uniformity of products produced by wet rotary end (WRE)/dry rotary end (DRE) systems. Refer to chapter 11 for indepth descriptions of WRE and DRE classifications. For horizontal cutter systems (e.g., cutter soil mixing (CSM)), revolutions per minute are typically reported as an indicator of mixing energy. Note that BRN is not applicable for chainsaw-type mixers (e.g., trench cutting and remixing deep wall method (TRD).
• Column: Pillar of treated soil produced in situ by a single installation process using a mixing tool, typically a rotating auger, to make a round column. A rectangular barrette produced by twin horizontal mixing shafts is also a column. See “element” and “wall,” which are related geometric terms.

8
• Deep mixing equipment: Deep mixing equipment with various mixing tools including single vertical shaft mixing tools, multiple vertical shaft mixing tools, horizontal rotating circular cutters, chainsaw-type cutters, etc.
• DMM: In situ ground treatment in which soil is blended with cementitious and/or other binder materials to improve strength, permeability, and/or compressibility characteristics (synonymous terms (some proprietary) include DSM, deep mixing, CDSM, and soil cement mixing).
• Dry mixing: Process of mechanical disaggregation of the soil in situ and its mixing with binders with or without fillers and admixtures in dry powder form. Binders are delivered primarily on tool retrieval.
• Element: This is an inclusive term that refers to a DMM element produced by a single stroke of the mixing tools at a single equipment location. A column produced by a single-axis machine, a set of overlapping columns produced by a single stroke of a multiple-shaft mixing tool, and a rectangular barrette produced by a mixing tool with horizontal axis rotating cutter blades are each considered an element. An element consisting of overlapping columns produced by a single stroke of a multiple-shaft mixing tool is sometimes referred to as a panel. A chainsaw-type mixing tool that travels as it mixes produces a continuous wall, which is not an element.
• Engineer: The representative of the design engineer or of the project owner (owner). This person may either be a subconsultant to the owner or a member of the owner’s staff.
• Filler: Non-reacting materials (i.e., sand, limestone powder, etc.).
• Mix design: Ratios of soil, binder, water, and additive quantities required to meet the design requirements of the project.
• Mixing process: Mechanical disaggregation of the soil structure and dispersion of binders and fillers in the soil.
• Mixing tool: Equipment used to disaggregate the soil and distribute and mix the binder with the soil. Consists of one or several rotating units equipped with several blades, arms, and paddles with or without continuous or discontinuous flight augers, horizontal rotating cutter blades, or chainsaw-type cutters.
• Penetration (downstroke): Stage or phase of mixing process cycle in which the mixing tool is delivered to the appropriate depth (disaggregation phase) for withdrawal injection and disaggregation and mixing for penetration injection. (Not applicable for chainsaw-type mixers (TRD).)
• Penetration/retrieval speed: Vertical movement per unit time of the mixing tool during penetration or withdrawal. (Not applicable for chainsaw-type mixers (TRD).)
• Restroke: Additional penetration and withdrawal cycle of the mixing tool to increase the binder content and/or mixing energy. (Not applicable for chainsaw-type mixers (TRD).)

9
• Retrieval: Withdrawal of mixing tool from bottom depth to the ground surface. Binder may be injected during retrieval, which also imparts additional mixing energy.
• Rotation speed: Number of revolutions of the mixing tool per unit time.
• Soil-cement: Product of DMM consisting of a mixture of the in situ soil and binder. Also referred to as treated soil or deep mixed material.
• Strength: Dependent on application, various strengths may be used to assess the quality of deep mixed material. For design, strength usually means shear strength, but during QC/QA, strength usually means unconfined compressive strength. For clarity, the intended type of strength should always be identified when using this term.
• Stroke: One complete cycle (penetration and withdrawal) of the mixing process.
• Volume ratio: Ratio of the volume of slurry injected (in wet mixing) to the volume of soil to be treated.
• Wall: Group of overlapping elements arranged to form a continuous wall. Continuous walls can also be constructed using a chainsaw-type mixing device. Walls can be referred to as shear walls, cutoff walls, or excavation support walls, depending on the application. A shear wall can also be referred to as a buttress.
• Water: Fresh water that is free of deleterious substances that adversely affect the strength and mixing properties of the grout and is used to manufacture grout.
• Water-to-binder ratio: Weight of water added to the dry binder divided by the weight of the dry binder. In wet mixing, the water-to-binder ratio of the slurry is determined from the weights of water and dry binder used to manufacture the slurry in a plant at the ground surface. In either wet or dry mixing, the total water-to-binder ratio is the weight of water in the mixture divided by the weight of dry binder. For wet mixing, the total water-to-binder ratio is the weight of slurry water plus the weight of soil water divided by the weight of dry binder. For dry mixing, the total water-to-slurry ratio is the weight of soil water divided by the weight of dry binder.
• Wet mixing: Process of mechanical disaggregation of the soil in situ and mixing with slurry consisting of water and binders with or without fillers and admixtures. In most cases, binder is delivered on mixing tool penetration for vertical and horizontal axis mixing tools.
• Withdrawal (upstroke): Stage or phase of retrieval of the mixing tool in which the final mixing occurs for penetration injection and initial mixing for withdrawal injection. Disaggregation occurs during the penetration for both penetration injection and withdrawal injection. (Not applicable for chainsaw-type mixers (TRD).)
• Withdrawal rate: The average up-hole retrieval rate of the mixing tool.

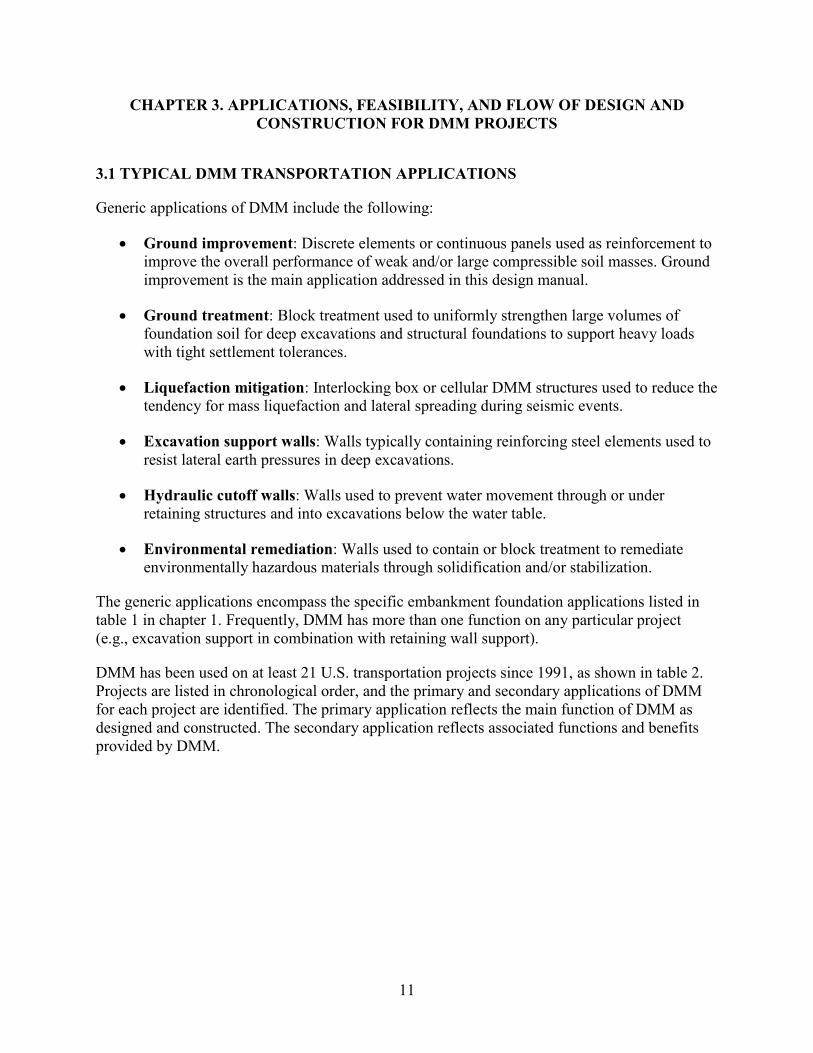
11
CHAPTER 3. APPLICATIONS, FEASIBILITY, AND FLOW OF DESIGN AND CONSTRUCTION FOR DMM PROJECTS
3.1 TYPICAL DMM TRANSPORTATION APPLICATIONS
Generic applications of DMM include the following:
• Ground improvement: Discrete elements or continuous panels used as reinforcement to improve the overall performance of weak and/or large compressible soil masses. Ground improvement is the main application addressed in this design manual.
• Ground treatment: Block treatment used to uniformly strengthen large volumes of foundation soil for deep excavations and structural foundations to support heavy loads with tight settlement tolerances.
• Liquefaction mitigation: Interlocking box or cellular DMM structures used to reduce the tendency for mass liquefaction and lateral spreading during seismic events.
• Excavation support walls: Walls typically containing reinforcing steel elements used to resist lateral earth pressures in deep excavations.
• Hydraulic cutoff walls: Walls used to prevent water movement through or under retaining structures and into excavations below the water table.
• Environmental remediation: Walls used to contain or block treatment to remediate environmentally hazardous materials through solidification and/or stabilization.
The generic applications encompass the specific embankment foundation applications listed in table 1 in chapter 1. Frequently, DMM has more than one function on any particular project (e.g., excavation support in combination with retaining wall support).
DMM has been used on at least 21 U.S. transportation projects since 1991, as shown in table 2. Projects are listed in chronological order, and the primary and secondary applications of DMM for each project are identified. The primary application reflects the main function of DMM as designed and constructed. The secondary application reflects associated functions and benefits provided by DMM.

12
Table 2. Summary of DMM usage for U.S. transportation projects. Application of DMMa
Year Project and
Location Owner
Quantity of
DMM Cost of DMMb G
roun
d Im
prov
emen
t G
roun
d T
reat
men
t
Liq
uefa
ctio
n M
itiga
tion
Exc
avat
ion
Supp
ort W
alls
Hyd
raul
ic
Cut
off W
alls
E
nvir
onm
enta
l R
emed
iatio
n
P 1991 Allegheny County Jail, Pittsburgh, PA(11)
Pennsylvania Department of Transportation (PennDOT)
1,800 m3 $147,600
P S S 1992–1995
Bird Island Flats, Central Artery Tunnel, Boston, MA (12–14)
Massachusetts Turnpike Authority and Massachusetts Department of Transportation (MassDOT)
37,180 m2 $35.8 million
S P 1996–1997
7th Street seal slab, San Francisco, CA
California Department of Transportation (Caltrans)
N/A N/A
P 1997 Lake Parkway, Milwaukee, WI(15,16)
Wisconsin Department of Transportation (WisDOT)
20,900 m2 $4 million
P 1997 I-15, Salt Lake City, UT(17,18)
Utah Department of Transportation
33,500 m3 $2.2 million
P 1997–2002
Fort Point Channel, Boston, MA(14)
Massachusetts Turnpike Authority and MassDOT
420,000 m3 $72 million

13
P S 1998 San Francisco Bay Area Rapid Transit (BART) Culvert, San Francisco, CA(19)
Caltrans 170,500 m3 $2.6 million
P 1999 Danville, PA(20) PennDOT 4,000 m2 $700,000 P 2000 Woodrow Wilson
Bridge, Alexandria, VA(18,21,22)
Virginia Department of Transportation (VDOT)
124,300 m3 $11.4 million
P 2000 Doolittle Drive and Airport Drive Interchange, Oakland Airport, Oakland, CA(23)
Caltrans N/A N/A
P S 2000 Hackensack Meadows, Hoboken, NJ(24)
New Jersey Department of Transportation
9,500 m3 $364,000
P 2001–2002
Airport Drive overcrossing Air Cargo Road, Oakland Airport, Oakland, CA(23)
Caltrans 15,000 m3 $1.2 million
S P 2001–2002
Taxiway B and Air Cargo Road Grade Separation, Oakland Airport, Oakland, CA(23,25)
Caltrans 30,500 m3 $1.83 million
P 2001–2003
Glen Road interchange, Newport, MN(26,27)
Minnesota Department of Transportation (MnDOT)
22,770 m3 $2 million
P S 2002–2003
I-5 expansion, San Diego, CA
Caltrans 21,300 m3 $1.7 million

14
P S S 2003 Tukwila, WA(23) Washington State Department of Transportation (WSDOT)
44,000 m3 $5 million
P 2004–2005
4th Street exit of I-80, San Francisco, CA(28,29)
Caltrans N/A $16 million
P 2005–2006
Route 1 over Jewfish Creek(30)
Florida Department of Transportation (FDOT)
275,400 m3 $11.9 million
P 2007 North Shore connector, Pittsburgh, PA(31)
Port Authority of Allegheny County
10,200 m2 $4 million
P S 2010 Warm Springs BART extension, Fremont, CA(32)
Bay Area Rapid Transit Authority
24,600 m3 $5.5 millionc
P P 2011 1-5 high-occupancy vehicle extension, Tacoma, WA(33)
WSDOT 11,095 m3 $1.35 million
N/A = Not available. a P indicates primary application, S indicates secondary application, and blank cells indicate that DMM application was not used. b Cost does not include mobilization. c Cost includes jet grouting at utility crossings and setting of soldier beams. 1 ft3 = 0.028 m3 1 ft2 = 0.093 m2

15
3.2 FEASIBILITY OF USING DMM
The feasibility of using DMM for any given project is dependent on a number of diverse factors, including practical project considerations (i.e., cost, schedule, performance, geotechnical, logistical, accessibility, and environmental) and conventional considerations (i.e., regional and historical practices and preferences and the degree of influence of local contractors, consultants, and owners).
3.2.1 Advantages and Potential Limitations of DMM
The relative advantages and potential limitations of using DMM for embankment and foundation support are listed in table 3. DMM, similar to any geotechnical construction technique, is not a solution for all soft ground treatment, improvement, retention, and containment problems. However, for certain applications, it can be more practical, more economic, faster, or otherwise preferable to competing technologies. Typical alternative technologies are listed in table 4.
In the most general terms, DMM may be attractive for the following project conditions:
• The ground is neither very stiff nor very dense and does not contain large cobbles, boulders, or other obstructions.
• Treatment depths of less than about 130 ft (40 m) are required.
• There is relatively unrestricted overhead clearance.
• A constant and adequate supply of binder can be ensured.
• A significant amount of spoil can be tolerated for the wet methods, but negligible spoil is generated for the dry method.
• Relatively vibration-free technology is required.
• Treated or improved ground volumes are large.
• Performance specifications are applicable.
DMM is especially useful for embankment support under the following conditions:
• The project schedule requires more rapid construction than would be possible using staged construction and prefabricated vertical drains.
• Borrow material is expensive, environmentally destructive to obtain, or not readily available for some other reason. DMM support generally permits steeper embankment side slopes and use of spoils in the embankment fill, both of which reduce the need for imported borrow materials.

16
• Ground movements induced by embankment construction would impact adjacent structures. For example, when widening an existing embankment on soft ground, DMM can prevent settlement of the existing embankment and pavement due to the load from the new embankment.
• Adjacent land use, property ownership, or environmental impacts dictate a narrow footprint for the embankment.
• Construction involves contaminated materials whereby DMM can reduce excavation spoils requiring offsite disposal and/or provide fixation of contaminates to reduce leachability.

17
Table 3. Relative advantages and disadvantages of DMM for general transportation project applications (adapted from FHWA).(1)
Item Application
Ground Treatment and Improvement Liquefaction Mitigation Excavation Support Walls Relative advantages/benefits of DMM
• Low relative cost per unit volume to depths of 130 ft (40 m). • Strength of treated soil ranges from 75 to 600 psi (0.5 to
4 MPa). • Layout may be varied based on diameter and spacing of
columns or thickness and spacing of panels. • Dry mixing methods provide very low spoil volumes. • The spoil from wet mixing methods may serve as excellent
site fill material. • Little vibration and medium-low noise (equipment can be
muffled). • High production capacity in certain conditions. • Quickly verifiable in situ performance. • Can be used for marine projects. • Generally good lateral and vertical levels of treatment. • Can be used in most types of soils and fills (without
obstructions). • Execution is relatively constant and straightforward. • Excellent theoretical, laboratory, and field experimental data
to supplement advanced design theory. • Economical for large projects in very soft, compressible soils. • Spacing and composition of individual columns infinitely
variable. • Some types (e.g., lime cement columns) have low
mobilization costs. • Typical design strengths are about 145 psi (1 MPa) for ground
improvement projects.
• Excellent proven performance record in Japan.
• Economical on large projects. • Engineering properties of treated
soil can be designed up to about 600 psi (4 MPa).
• Construction quality highly verifiable (wet and dry).
• There are minimal lateral or vertical stresses that could potentially damage adjacent structures.
• No recurrent post-construction expenses.
• Lower relative cost per unit area, especially in the range of 50 to 130 ft (15 to 40 m) in depth relative to slurry walls and secant pile walls.
• No need for other types of lagging.
• Relatively low permeability; therefore, no need for additional sealing.
• Spoil from the wet method can be used as excellent site fill material.
• Little vibration and medium-low noise (equipment can be muffled).
• In fluid state, allows structural elements to be introduced.
• Can provide good lateral continuity.
• High production in certain conditions (up to 2,150 ft2 (200 m2) per shift).
• Can uniformly treat layered heterogeneous soils.

18
Potential disadvantages of DMM
• Depth limitations (130 ft (40 m) practical). • Need large working space for large powerful equipment and
no overhead restrictions. • Not applicable in soils that are very dense, very stiff, or that
may have boulders.* • Can only be installed vertically. • The wet method produces a significant volume of spoils. • Underground utilities may pose problems. • Limited ability to treat isolated strata at depth. • High mobilization cost. • Weight of equipment may be problematic for very weak soils. • Significant variability in treated soil strength may occur, and
this may be important in certain applications. • Cannot be installed in close proximity to existing structures. • Limited geometric flexibility of drilling and treatment.
• Depth limitations (130 ft (40 m) practical).
• Need large working space for large powerful equipment and no overhead restrictions.
• Not applicable in soils that are very dense, very stiff or that may have boulders.*
• Can only be installed vertically. • Underground utilities may pose
problems. • Limited ability to treat isolated
strata at depth. • High mobilization cost. • Not applicable for remediations
directly through or under existing concrete structures.
• Freeze/thaw degradation may occur.
• Depth limitations (130 ft (40 m) practical).
• Need large working space for large powerful equipment and no overhead restrictions.
• Not applicable in soils that are very dense, very stiff, or which may have boulders.*
• Can only be installed vertically. • Other methods may provide no
spoils (e.g., sheet piles). • Significant variability in treated
soil strength may occur, and this may be important in certain applications.
• Underground utilities may pose problems.
• Limited ability to treat isolated strata at depth.
• High mobilization costs. *DMM techniques designed to produce walls may be capable of penetrating denser or stiffer materials or strata with cobbles. (See technical data in appendix D.)

19
Table 4. Alternative technologies to DMM. Application Alternative Technology to DMM
Ground treatment • Permeation grouting • Jet grouting
Ground improvement
• Various pile types (e.g., auger cast, bored, driven, and micropiles)
• Stone columns • Lightweight fills • Compacted stone columns • Vibro-concrete columns
Liquefaction mitigation
• Vibro-densification • Vibro-replacement • Deep dynamic compaction • Compaction grouting • Dewatering and drainage
Excavation support walls/cutoff walls
• Secant piles • Sheet piles • Soldier beams and lagging • Soil nailing • Structural diaphragm walls
3.2.2 Feasibility Evaluation for Using Deep Mixing for Transportation Projects
The factors listed in table 5 should be considered when assessing the feasibility of using DMM for a project.
Table 5. Factors to consider in feasibility assessment for using DMM. Factor Question Commentary
Geologic applicability
Are soils suitable for mixing?
• DMM is suitable in locations with soils that can be stabilized with cement, lime, slag, or other binders (typically cohesive soils with high moisture contents and loose saturated sandy soils without cobbles or boulders).
• DMM is not suitable in soils that are very stiff or very dense or in geologic conditions with large cobbles or boulders.

20
Geometric applicability
Are site conditions conducive to using DMM?
• Treatment depths should be less than about 130 ft (40 m).
• Relatively unrestricted overhead clearance should be available.
• The project area should be large enough to accommodate large and heavy mixing rigs and binder plants for wet mixing.
• Treated or improved ground volumes are large enough to warrant mobilization/demobilization costs.
• Adjacent land use, property ownership, or environmental impacts dictate a narrow footprint for the embankment.
• Adjacent facilities (e.g., an existing embankment and pavement in an embankment widening application) could be damaged unless the loads from the new embankment are transferred to a competent bearing layer.
Project constraints
Are construction materials readily available?
• Constant and adequate supply of binder can be ensured. • Borrow material for staged loading is expensive,
environmentally destructive to obtain, or not readily available.
Are there environmental constraints?
• A significant amount of spoil from wet mixing can be tolerated or used productively on the project.
• Relatively vibration- or noise-free technology is required.
Contractual vehicles
Are performance specifications applicable?
• Being a contractor-driven and method-dependent process, DMM is well suited for the use of performance specifications.
Cost considerations
Is project cost a driving factor?
• DMM can be less expensive than excavation and replacement since the in situ soil is used.
• DMM is generally more expensive than staged construction.
• DMM columns can be used in column-supported embankment foundations and can be used in conjunction with lightweight fills for embankment construction.
Schedule considerations
Is the project schedule a driving factor?
• Construction can proceed more rapidly when using DMM than when using preloading with or without prefabricated vertical drains or staged construction on soft compressible soil.

21
Design constraints
Must treated ground strengths be closely engineered?
• DMM treated ground strengths range typically from 75 to 600 psi (0.5 to 4 MPa). Most design strengths for ground improvement are in the range of 96 to 145 psi (0.66 to 1 MPa).
• Ground movements induced by embankment construction would impact adjacent structures or embankments.
3.3 DESIGN AND CONSTRUCTION FLOW FOR DMM PROJECTS
A flow chart depicting the overall process of design and construction for DMM projects is shown in figure 7. The flowchart includes four main project phases: (1) data collection (yellow), (2) design (green), (3) procurement (blue), and (4) construction with continuous QC/QA (red).(34)
Figure 7. Flowchart. Design and construction for DMM projects.(34)
3.3.1 Data Collection
The information collection process includes defining structure performance expectations, gathering site-specific soil and groundwater information, and reviewing available information related to local DMM experience. Specific considerations for site investigations for DMM projects are discussed in chapter 4. Prior experience for other DMM projects may be obtained from published literature and from discussions with experienced engineers and contractors.

22
Laboratory bench-scale testing and possible field trials are also part of the data collection phase. If prior experience is not available, laboratory mix design studies (i.e., bench-scale testing) should generally be conducted prior to or at the same time as analysis and design to establish a range of strengths that can reasonably be achieved in the field. A preliminary field trial including installation of full-scale DMM elements may also be performed during the design phase to ensure treated soil properties may be achieved as required. Although expensive, full-scale field trials can provide valuable data for large or complex projects. Bench-scale testing and field trial programs are discussed in chapter 10.
3.3.2 Analysis and Design
The analysis and design phase includes engineering evaluations of the DMM configuration being proposed for the project, laboratory bench-scale testing, possible field trials of DMM techniques to be used, and preparation of specifications for construction. Design procedures are discussed in chapter 6, field trial and validation programs are outlined chapter 10, and a guide to writing effective specifications is provided in chapter 9.
Isolated columns and continuous shear walls, as illustrated in figure 8, are the most common DMM configurations for transportation embankments. Typically, isolated columns are constructed beneath the central portion of the embankment to control settlement, and continuous shear walls are constructed beneath the side slopes (and oriented perpendicularly to the embankment centerline) to prevent embankment stability failure.
Figure 8. Illustration. Typical configuration of DMM columns for transportation
applications.
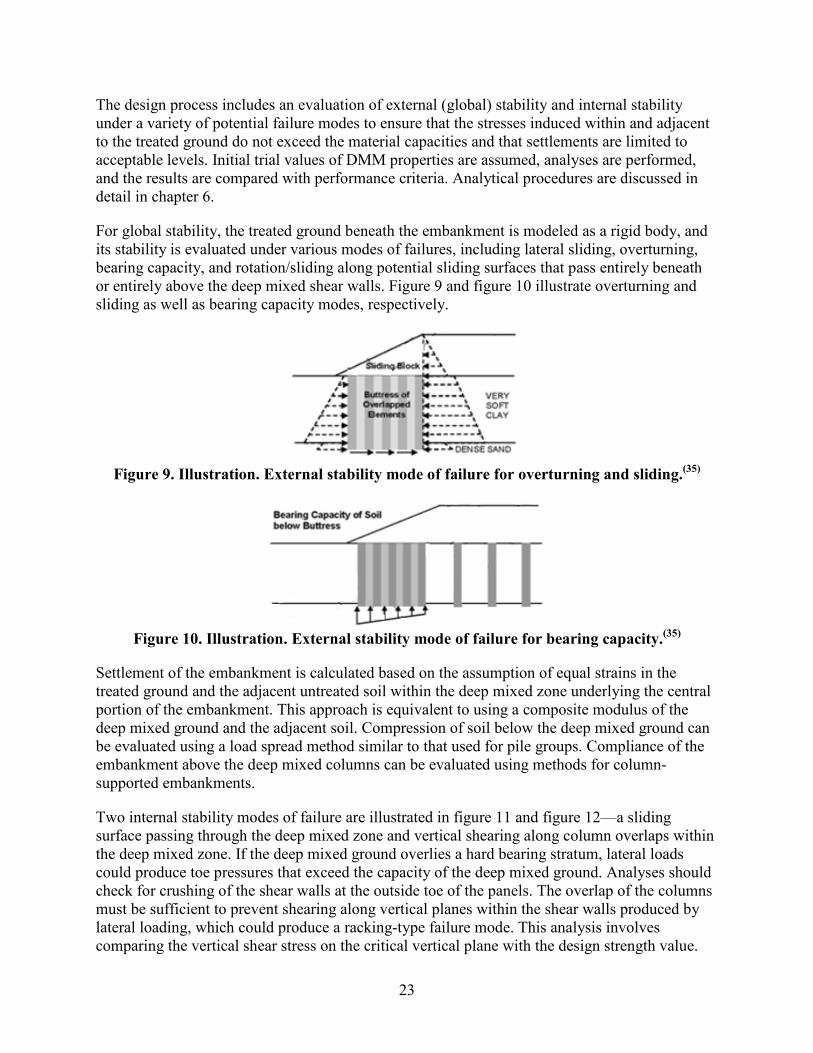
23
The design process includes an evaluation of external (global) stability and internal stability under a variety of potential failure modes to ensure that the stresses induced within and adjacent to the treated ground do not exceed the material capacities and that settlements are limited to acceptable levels. Initial trial values of DMM properties are assumed, analyses are performed, and the results are compared with performance criteria. Analytical procedures are discussed in detail in chapter 6.
For global stability, the treated ground beneath the embankment is modeled as a rigid body, and its stability is evaluated under various modes of failures, including lateral sliding, overturning, bearing capacity, and rotation/sliding along potential sliding surfaces that pass entirely beneath or entirely above the deep mixed shear walls. Figure 9 and figure 10 illustrate overturning and sliding as well as bearing capacity modes, respectively.
Figure 9. Illustration. External stability mode of failure for overturning and sliding.(35)
Figure 10. Illustration. External stability mode of failure for bearing capacity.(35)
Settlement of the embankment is calculated based on the assumption of equal strains in the treated ground and the adjacent untreated soil within the deep mixed zone underlying the central portion of the embankment. This approach is equivalent to using a composite modulus of the deep mixed ground and the adjacent soil. Compression of soil below the deep mixed ground can be evaluated using a load spread method similar to that used for pile groups. Compliance of the embankment above the deep mixed columns can be evaluated using methods for column-supported embankments.
Two internal stability modes of failure are illustrated in figure 11 and figure 12—a sliding surface passing through the deep mixed zone and vertical shearing along column overlaps within the deep mixed zone. If the deep mixed ground overlies a hard bearing stratum, lateral loads could produce toe pressures that exceed the capacity of the deep mixed ground. Analyses should check for crushing of the shear walls at the outside toe of the panels. The overlap of the columns must be sufficient to prevent shearing along vertical planes within the shear walls produced by lateral loading, which could produce a racking-type failure mode. This analysis involves comparing the vertical shear stress on the critical vertical plane with the design strength value.

24
Internal stability analyses also address potential sliding surfaces that pass through the deep mixed shear walls and adjacent soil. The geometry of the shear walls must be checked to ensure that soil does not extrude between the panels due to unbalanced forces caused by active and passive earth pressures acting on the deep mixed zone.(36)
Figure 11. Illustration. Internal stability mode of failure for circular sliding surface.(35)
Figure 12. Illustration. Internal stability mode of failure for vertical shearing.(35)
For internal stability analyses, composite shear strength and unit weight values are used to model the deep mixed zone beneath the embankment based on the configuration of the columns (i.e., area replacement ratio and spacing of the shear walls). Separate composite shear strengths for vertical and non-vertical planes are estimated for the deep mixed shear walls beneath the side slope.
Construction specifications should clearly communicate the required geometry, continuity, and strength of the deep mixed ground. The specifications should also detail the acceptance criteria to assure performance. Guide specifications are discussed in chapter 9.
3.3.3 Contractor Procurement
Traditional design-bid-build procurement practices involve bidding on the project after the contract documents (including plans and technical specifications) are prepared. Innovative procurement vehicles involving design-build methods and early contractor involvement (ECI)

25
have merit on DMM projects due to quality of DMM being influenced by various contractor-controlled variables. Procurement vehicles for DMM projects are discussed in chapter 8.
3.3.4 Construction and QC/QA
The contractor is responsible for controlling the geometry of the deep mixed elements by using certain tooling dimensions and installation procedures. The contractor documents the quality of the operations and provides reports of the QC data on a daily basis. The owner conducts QA activities, including sampling and testing to assure the quality of the deep mixed ground. Means and methods for construction and QC/QA are discussed in chapters 11 and 12, respectively.
A field validation program involves installing full-scale DMM elements to demonstrate that the contractor’s materials and methods can satisfy the project specifications, including the strength and continuity of the deep mixed ground. Validation tests are conducted after the contract is awarded but before production mixing. Such field validation programs are much more common than trial columns installed during the design phase.


27
CHAPTER 4. SITE EXPLORATION PROGRAM
4.1 INTRODUCTION
The information in this chapter does not include an introduction to geotechnical site explorations in general. Instead, it provides additional guidance for DMM projects. For those not familiar with geotechnical site explorations, helpful resources include Evaluation of Soil and Rock Properties, Subsurface Investigations, Soils and Foundations Reference Manual Volume I, and Soils and Foundations Reference Manual Volume II. (See references 37–40.) This chapter focuses on specific special needs of site explorations for DMM projects. Where feasible, recommendations are given in a format compatible with the materials in Evaluation of Soil and Rock Properties.(37)
The following key points are made in the exploration guidance documents: (See references 37–40.)
• A phased approach to site investigation can be effective.
• Professional judgment should be applied instead of following prescriptive rules.
• In situ testing can be beneficial.
• Appropriate use of correlations can help establish soil property values.
This chapter addresses a phased approach to site exploration, general site exploration planning, and important site exploration details.
4.2 PHASED APPROACH TO SITE EXPLORATION
For highway projects in which DMM is being considered, a phased site exploration procedure is useful. Either a two- or three-phase approach may be appropriate depending on the size and complexity of the project. A three-phase approach is outlined in the following subsections. If the project is not large or complex, it may be possible to combine phases 2 and 3.
4.2.1 Phase 1—Office Studies and Site Reconnaissance
Phase 1 includes the following steps:
1. Collect project information such as alignment, grade, performance requirements, special features, etc.
2. Review geologic reports and maps, topographic maps, aerial photographs, previous subsurface investigation reports, soil survey reports, etc. (See section 3.2.3 in Evaluation of Soil and Rock Properties for more information.(37))
3. Visit the site to observe access, current land use, and surface features such as topography, outcrops, stability, drainage features, etc. (See section 3.2.4 in Evaluation of Soil and Rock Properties for more information.(37))

28
4. Plan the next phase(s) of the site exploration. (See section 3.2 in Evaluation of Soil and Rock Properties for more information.(37))
4.2.2 Phase 2—Preliminary Field Investigations and Laboratory Testing
In phase 2, the need for DMM may not yet be established, and other geotechnical approaches may be under consideration. Consequently, the site exploration may support more than one type of geotechnical construction. In phase 2 of a three-phase investigation, borings and soundings are made at a wide spacing, and limited laboratory testing is performed. The intent is to develop the general stratigraphy and relevant soil property values such as strength and compressibility for use in preliminary calculations to determine which technology should be considered for a more detailed field investigation, laboratory testing, and final design. Phase 2 also includes planning the phase 3 investigation.
4.2.3 Phase 3—Detailed Field Investigations and Laboratory Testing
In phase 3, it is known that a DMM design will be developed. A detailed program of field investigations and laboratory testing is conducted to provide information needed for design, construction, and preparation of bid documents.
4.3 GENERAL SITE EXPLORATION PLANNING FOR DMM PROJECTS
The planning process for geotechnical site explorations includes the following steps: (1) identify data needs, (2) gather and analyze existing site information, (3) develop a preliminary site model, (4) develop and conduct a site exploration program, and (5) develop and conduct a laboratory testing program.(37) In the phased approach, steps 1 through 3 are part of phase 1, and steps 4 and 5 are performed in phases 2 and 3.
To facilitate step 1, table 6 summarizes information needed and field and laboratory testing to be considered for support of transportation-related embankments and structures. Specifically, the table lists the engineering evaluations that should be performed, the information required for the evaluations, and the suitable field exploration procedures and laboratory tests.
Engineering evaluations that may need to be performed for DMM projects include stability, settlement, load transfer, and lateral movement of adjacent structures. The details of these stability and settlement evaluations are discussed in chapter 6. Procedures for column-supported embankments can be applied to assess load transfer from the embankment to basal geosynthetic reinforcing, if used, and to deep mixed columns. The potential for lateral movement of adjacent structures can be assessed as necessary on a case-by-case basis. Engineering evaluation of soil compatibility with binders and suitability of site soils for DMM are discussed in chapter 5.
Material parameter values and numerical performance criteria are used in the engineering evaluations. Practical construction information, such as the existence of buried utilities that might interfere with construction and suitable locations for onsite use and/or offsite disposal of spoil materials, is also required.
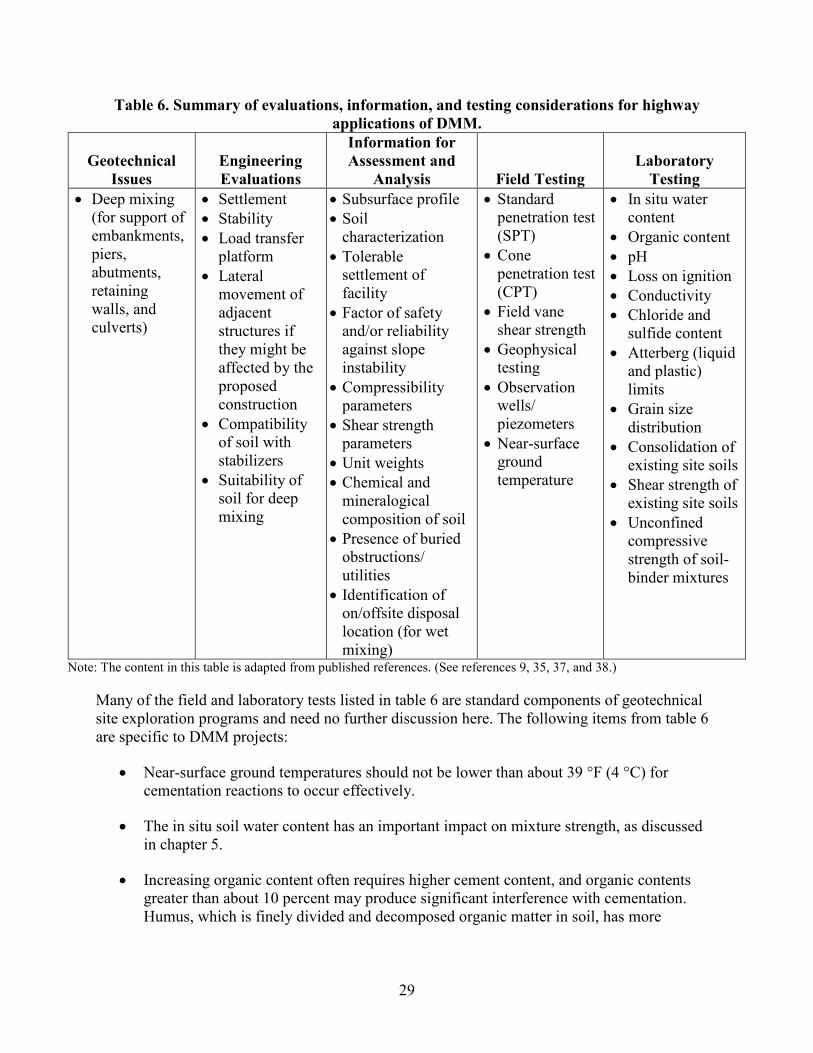
29
Table 6. Summary of evaluations, information, and testing considerations for highway applications of DMM.
Geotechnical Issues
Engineering Evaluations
Information for Assessment and
Analysis Field Testing Laboratory
Testing • Deep mixing
(for support of embankments, piers, abutments, retaining walls, and culverts)
• Settlement • Stability • Load transfer
platform • Lateral
movement of adjacent structures if they might be affected by the proposed construction
• Compatibility of soil with stabilizers
• Suitability of soil for deep mixing
• Subsurface profile • Soil
characterization • Tolerable
settlement of facility
• Factor of safety and/or reliability against slope instability
• Compressibility parameters
• Shear strength parameters
• Unit weights • Chemical and
mineralogical composition of soil
• Presence of buried obstructions/utilities
• Identification of on/offsite disposal location (for wet mixing)
• Standard penetration test (SPT)
• Cone penetration test (CPT)
• Field vane shear strength
• Geophysical testing
• Observation wells/piezometers
• Near-surface ground temperature
• In situ water content
• Organic content • pH • Loss on ignition • Conductivity • Chloride and
sulfide content • Atterberg (liquid
and plastic) limits
• Grain size distribution
• Consolidation of existing site soils
• Shear strength of existing site soils
• Unconfined compressive strength of soil-binder mixtures
Note: The content in this table is adapted from published references. (See references 9, 35, 37, and 38.)
Many of the field and laboratory tests listed in table 6 are standard components of geotechnical site exploration programs and need no further discussion here. The following items from table 6 are specific to DMM projects:
• Near-surface ground temperatures should not be lower than about 39 °F (4 °C) for cementation reactions to occur effectively.
• The in situ soil water content has an important impact on mixture strength, as discussed in chapter 5.
• Increasing organic content often requires higher cement content, and organic contents greater than about 10 percent may produce significant interference with cementation. Humus, which is finely divided and decomposed organic matter in soil, has more

30
potential to interfere with cementation than fibrous organic material that is not as decomposed.
• Soil pH values should be greater than 5 for cement stabilization.
• For lime stabilization, conductivity can provide an indication of the potential for the pozzolanic reactions that are necessary to form cementitious bonds. Conductivity less than 1.02 × 10⁻⁶ S/inch (0.4 mS/cm) indicates a non-pozzolanic soil, and conductivity greater than 3.05 × 10⁻⁶ S/inch (1.2 mS/cm) indicates a soil that would experience pozzolanic reactions with lime. However, dissolved salts in porewater can increase conductivity without the presence of clay minerals necessary for pozzolanic reactions with lime.
• Increasing sulfate concentration indicates increasing risk that expansive minerals may form. Sulfate concentrations less than 3,000 ppm indicate low risk, and sulfate concentrations greater than 10,000 ppm indicate unacceptably high risk. Expansive material formation has the potential to damage the deep mixed ground and reduce its strength.
Table 3 of Evaluation of Soil and Rock Properties presents recommended minimum numbers and depths of investigation points for a range of different highway applications, but the table does not include entries for DMM applications.(37) Table 7 of this report has been prepared to provide that information for DMM applications.
For all geotechnical site explorations, the field crews should have a thorough understanding of the objectives of the investigation, or they should be in close contact with the design office. Field adjustments of the location and depth of borings and probes as well as sampling type and frequency should be made with consideration of the project objectives in mind.
Table 6 and table 7 provide general background information and guidance that can be used to help prepare site exploration plans for DMM projects. Important additional details are discussed in the next section.

31
Table 7. Guidelines for minimum numbers and depths of investigation points for highway applications of DMM.(37)
Application Minimum Number of Investigation Points and
Location of Investigation Points Minimum Depth of Investigation Deep mixing for support of embankments
A minimum of one investigation point every 100 ft (30 m) (erratic conditions) to 200 ft (60 m) (uniform conditions) of embankment length along the centerline of the embankment. At critical locations (e.g., maximum embankment heights and maximum depths of soft strata), a minimum of three investigation points are necessary in the transverse direction to define the existing subsurface conditions for stability analyses. For bridge approach embankments, there is at least one investigation point at abutment locations.
Investigation depth should be at a minimum equal to 3 times the embankment height unless a hard stratum is encountered above this depth.
Deep mixing for support of abutments
For support of bridge abutments with substructure widths less than or equal to 100 ft (30 m), there is a minimum of two investigation points per substructure. For substructure widths greater than 100 ft (30 m), there is a minimum of three investigation points per substructure. Additional investigation points should be provided if erratic subsurface conditions are encountered.
The depth of investigation should extend below the anticipated column tip elevation a minimum of 20 ft (6 m) or a minimum of 2 times the width of the column group used to support the abutment, whichever is deeper. All borings should extend through unsuitable strata such as unconsolidated fill, peat, highly organic materials, soft fine-grained soils, and loose coarse-grained soils to reach hard or dense materials.
Deep mixing for support of retaining walls
A minimum of two investigation points for each retaining wall. For retaining walls more than 100 ft (30 m) in length, investigation points are spaced every 50 to 100 ft (15 to 30 m) along the wall alignment, with locations alternating from in front of the wall to behind the wall.
Investigation depth below the bottom of the wall should be, at a minimum, equal to 3 times the wall height unless a hard stratum is encountered above this depth.
Deep mixing for culverts
A minimum of two investigation points for each culvert. For culverts more than 100 ft (30 m) in length, investigation points are spaced every 50 to 100 ft (15 to 30 m) along the culvert alignment.
Depth of investigation should follow the guidelines given for the embankment surrounding the culvert.

32
4.4 IMPORTANT SITE EXPLORATION DETAILS FOR DMM PROJECTS
There are several details that need special attention when conducting site explorations for DMM projects. For soft ground to be improved by DMM, two parameters have an especially large impact on the ability of DMM to increase strength and decrease compressibility: the in situ water content and the organic content of the soil. For soft soils that are easy to mix, as the water content of the mixture increases, more binder is needed to achieve the same strength. Because the amount of water in the mixture has a big impact on the mixture strength, the water content of the soil is an important parameter to be characterized during site explorations for DMM projects.
Similarly, soils with high organic content may require large amounts of binder to achieve suitable strength. Organics may interfere with cementation because organic colloids can attract the calcium in cement or lime and prevent it from participating in the chemical reactions that stabilize the mixture. Humus is more detrimental to cementation than fibrous organics because organic colloids from humus can become more widely dispersed in the mixture than intact fibers from fibrous organic material. Consequently, the amount and type of organic material are key parameters that should be well characterized for a deposit.
The mineralogy of the soils to be treated is also important. For example, silty and sandy soils without a significant amount of clay minerals respond better to cement treatment than to lime treatment, whereas clay soils are treatable with lime/cement mixtures. Atterberg limits tests provide a useful indication of the presence and amount of clay minerals in a soil.
The site exploration should also identify conditions that can interfere with the mixing process such as the presence of boulders, cobbles, layers of dense sands/gravels, construction debris, abandoned foundations, or underground utilities.
Bench-scale treatability studies should be performed to assess the effect of different binders and binder factors and to investigate the range of strengths that can be achieved (see chapter 10). The strengths of laboratory-prepared specimens and field-mixed material are not the same due to differences in mixing, curing, and loading conditions. Nevertheless, the strength of laboratory-prepared specimens provides a useful indication of the potential of DMM to improve the strength of soft ground. Laboratory testing is discussed in more detail in chapter 5.
A significant quantity of soil sample must be obtained to perform laboratory tests. It was found that 6.5 lb (3 kg) of soil is enough to make a batch of eight 2- by 4-inch (50- by 100-mm) specimens for curing and strength testing for most mix designs. Two specimens can be tested at each of four curing times, which permits a smooth curve to be drawn through the data to determine the 28-day strength. Multiple batches are ordinarily prepared to investigate different mix designs. For investigating lime-cement-soil mixtures by the dry method or binder-water-soil mixtures by the wet method, a minimum of five batches are necessary, but the use of twice that many is common. Such testing would require 35 to 70 lb (15 to 30 kg) of soil.
The critical soil layer (i.e., the wettest and softest soil layer) may drive the mix design, but there are many circumstances for which more than one layer should be tested. For example, consider a soil profile including a layer of highly organic soil about 6 ft (2 m) thick and an underlying layer of soft clay that is 33 ft (10 m) thick. In this case, it may be necessary to perform laboratory mix

33
design studies for both layers, which would require about 35 to 70 lb (15 to 30 kg) of each soil for each treatment method to be investigated.
Although relatively undisturbed samples are necessary for many performance-related tests such as consolidation, shear strength, and permeability of fine-grained soils, disturbed soil samples are suitable for mix design studies for DMM projects.
The soil for mix design testing can be obtained using a variety of sampling techniques as follows:
• Thin-wall tube samples: A 24-inch (600-mm) push of a 3-inch (75-mm) thin-wall sampler with 100 percent recovery produces about 9 lb (4 kg) of soil. Thus, 4 full samples of this size are needed for 5 batches, and 8 are needed for 10 batches. Larger samplers can obtain enough material with fewer samples.
• Thick-walled split-spoon samples: The sampler used for SPT has a 1.4-inch (35-mm) inside diameter, which is generally too small to obtain sufficient sample for mix design studies. Larger split-spoon samplers may be suitable.
• Backhoe test pits: It is easy to obtain large samples using a backhoe, but the exploration depth is limited.
• Bucket augers: A bucket auger consists of a short barrel with a hinged drop bottom that has cutting teeth and slots for soil entry. The bucket auger is attached to the drill string and is used to obtain samples from the bottom of a borehole. It may be necessary to clean the bottom of the borehole before obtaining a sample.
• Auger cuttings: Samples for laboratory mix design studies can be obtained from auger cuttings, but the depth of sampling by this method is not certain.
Samples should be carefully sealed to prevent drying during transportation and storage prior to testing. Thin-walled samples can be sealed in the field immediately after sampling. Disturbed samples should be placed in sealable plastic bags with as much air removed as possible to prevent oxidation reactions prior to laboratory testing. Household vacuums have even been used to help remove air. The sealed bag should be placed inside another sealed container such as a second bag or a plastic pail with a sealable lid to help protect the first plastic bag against damage. A wet sponge can be placed outside the first plastic bag and inside the second container to help create a humid atmosphere that reduces diffusion of moisture through the first plastic bag. The samples should be protected from warm temperatures. If the samples are not tested within 1 to 2 days after sampling, they should be stored in a humid room.


35
CHAPTER 5. TREATED SOIL PROPERTY VALUES FOR DESIGN
5.1 INTRODUCTION
The purpose of this section is to provide an approach to determine realistic ranges of material property values that can be used in designing DMM projects. At this stage in the design and construction process, it is important to understand the relationship between treatment regimes (e.g., wet versus dry method, mixing energy, binder type and amount, etc.) and the range of engineering property values that can realistically be achieved for the specific soils at a project site. After realistic ranges of property values are established, an engineer determines the particular property values, replacement ratios, and column arrangements that are necessary to achieve the desired performance for a specific project using the methods outlined in chapter 6. The final required property values then form the basis for the construction specifications, as described in chapter 9.
Laboratory testing is performed by the engineer as part of the design process to verify the feasibility of using DMM and to assess a reasonable range of property values for design. Laboratory testing may be performed again by the contractor as part of the construction process. Laboratory testing is discussed in this chapter and again in chapter 10.
On large or innovative projects, it may be advantageous to perform field trials in which one or more DMM contractor would construct DMM columns at the project site, and the columns would be cored and tested in the field or laboratory. This was performed on the I-95/US Route 1 interchange project in Alexandria, VA.(22) More commonly, the construction contract will require that the contractor perform a field demonstration of capability to achieve the design strength. Field trials for design and field demonstrations during construction are both discussed in chapter 10.
This chapter describes phase relationships for the dry and wet methods of deep mixing as well as engineering property values of strength, modulus, Poisson’s ratio, permeability (hydraulic conductivity), and unit weight.
Detailed descriptions of soil stabilization using portland cement concrete (PCC) and lime are provided by Rafalko et al.(41) Stabilization reactions using slag-cement are provided by Vanzler and Filz.(42)
5.2 PHASE RELATIONSHIPS
When binders like cement, lime, and slag cement are mixed with soil, the result is a multiphase material, as shown in figure 13 for dry mixing and figure 14 for wet mixing. Dry mixing is generally used in soft, saturated, or nearly saturated soil, so the phase diagram in figure 13 shows a saturated soil to which dry binder is added. Wet mixing can be applied to soils with any degree of saturation. The phase diagram in figure 14 shows an unsaturated soil to which the binder-water slurry is added, and this can represent a saturated soil by setting the volume of air equal to zero. For wet mixing, whether the base soil is saturated or unsaturated, the resulting mixture is generally saturated or nearly saturated, which is the outcome in figure 14.
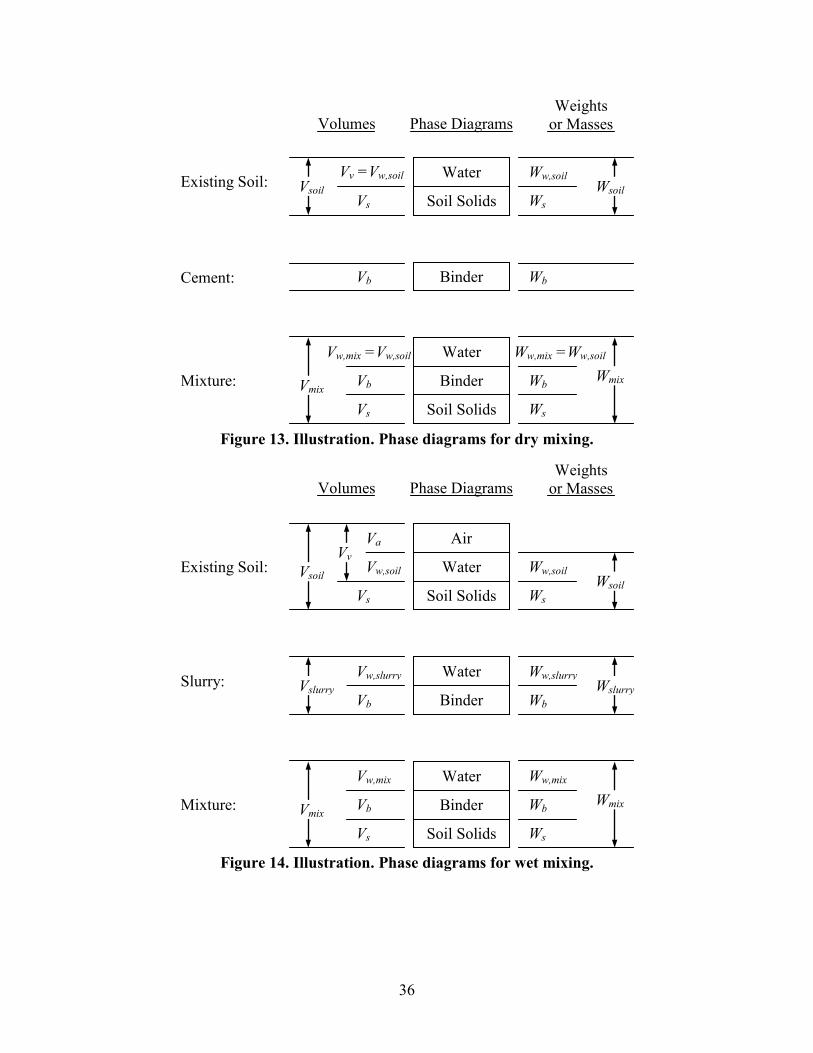
36
Water
Soil Solids
Vv =Vw,soil
Vs Vsoil
Ww,soil
Ws Wsoil
Volumes Weights
or Masses
Existing Soil:
Binder Vb Wb Cement:
Water
Binder
Soil Solids
Vw,mix =Vw,soil
Vb
Vs Vmix
Ww,mix =Ww,soil
Ws
Wmix Mixture: Wb
Phase Diagrams
Figure 13. Illustration. Phase diagrams for dry mixing.
Air
Water
Soil Solids
Va
Vw,soil
Vs Vsoil Ww,soil
Ws Wsoil
Volumes Weights
or Masses
Existing Soil:
Water
Binder
Vw,slurry
Vb Vslurry
Ww,slurry
Wb Wslurry Slurry:
Water
Binder
Soil Solids
Vw,mix
Vb
Vs Vmix
Ww,mix
Ws
Wmix Mixture: Wb
Phase Diagrams
Vv
Figure 14. Illustration. Phase diagrams for wet mixing.

37
Figure 13 and figure 14 illustrate the following definitions of component volumes and weights:
Va = Volume of air. Vw,soil = Volume of water in the soil before mixing. Ww,soil = Weight of water in the soil before mixing. Vs = Volume of the soil solids. Ws = Weight of the soil solids. Vb = Volume of the binder. Wb = Weight of the binder. Vw,slurry = Volume of water in the slurry for wet mixing. Ww,slurry = Weight of water in the slurry for wet mixing. Vw,mix = Volume of water in the mixture. Ww,mix = Weight of water in the mixture.
Aggregates of these quantities include the following:
Vv = Volume of voids in the soil before mixing (Va + Vw,soil). Vsoil = Volume of soil before mixing (Vs + Vw,soil + Va). Wsoil = Weight of soil before mixing (Ws + Ww,soil). Vslurry = Volume of slurry before mixing (Vb + Vw,slurry). Wslurry = Weight of slurry before mixing (Wb + Ww,slurry). Vmix = Volume of the mixture (Vs + Vb + Vw,mix). Wmix = Weight of the mixture (Ws + Wb + Ww,mix).
These quantities are useful in the equations in figure 15 and figure 16.
ws
ss V
WGγ
=
Figure 15. Equation. Specific gravity of soil solids.
wb
bb V
WGγ
=
Figure 16. Equation. Specific gravity of the binder.
Where:
Gs = Specific gravity of the soil solids. Gb = Specific gravity of the binder. γw = Unit weight of water (Ww/Vw).
Ratios that are useful for controlling deep mixing operations and reporting results from tests on laboratory or field-mixed materials are listed in table 8.
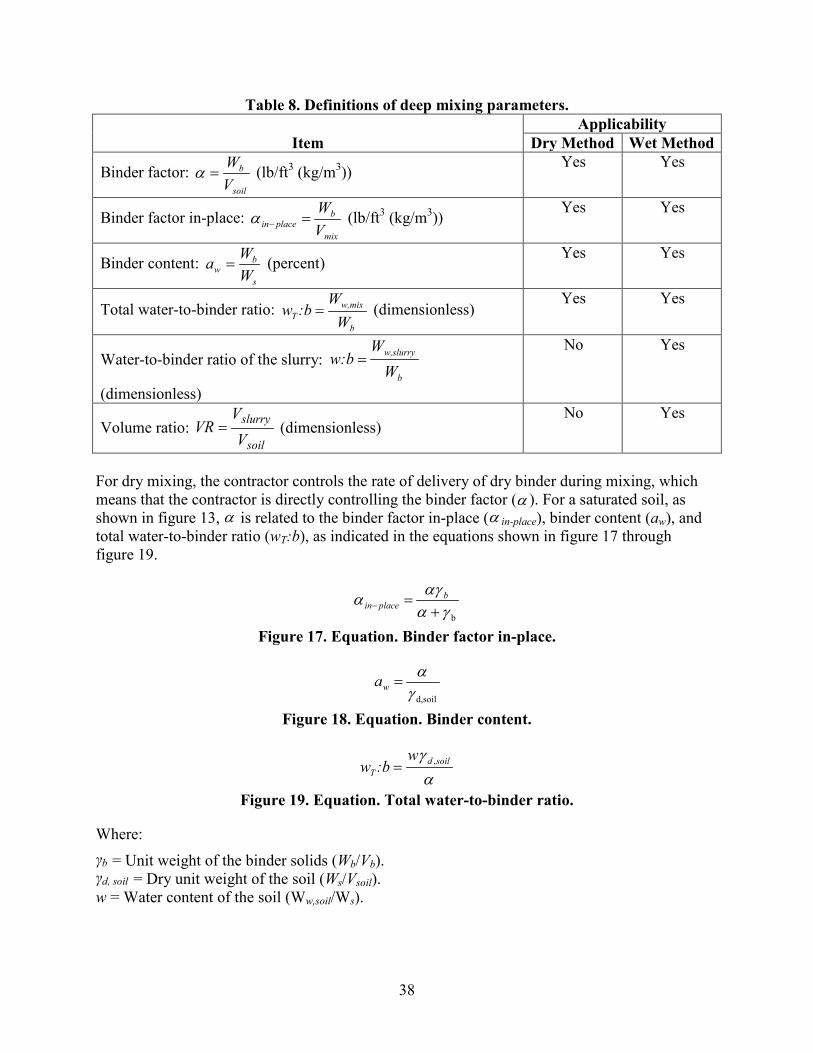
38
Table 8. Definitions of deep mixing parameters.
Item Applicability
Dry Method Wet Method
Binder factor: soil
b
VW
=α (lb/ft3 (kg/m3)) Yes Yes
Binder factor in-place: mix
bplacein V
W=−α (lb/ft3 (kg/m3))
Yes Yes
Binder content: s
bw W
Wa = (percent) Yes Yes
Total water-to-binder ratio: b
w,mixT W
W:bw = (dimensionless)
Yes Yes
Water-to-binder ratio of the slurry: b
w,slurry
WW
w:b =
(dimensionless)
No Yes
Volume ratio: soil
slurry
VV
VR = (dimensionless) No Yes
For dry mixing, the contractor controls the rate of delivery of dry binder during mixing, which means that the contractor is directly controlling the binder factor (α ). For a saturated soil, as shown in figure 13, α is related to the binder factor in-place (α in-place), binder content (aw), and total water-to-binder ratio (wT:b), as indicated in the equations shown in figure 17 through figure 19.
bγααγα+
=−b
placein
Figure 17. Equation. Binder factor in-place.
d,soilγα
=wa
Figure 18. Equation. Binder content.
αγ soild
T
w:bw ,=
Figure 19. Equation. Total water-to-binder ratio.
Where: γb = Unit weight of the binder solids (Wb/Vb). γd, soil = Dry unit weight of the soil (Ws/Vsoil). w = Water content of the soil (Ww,soil/Ws).
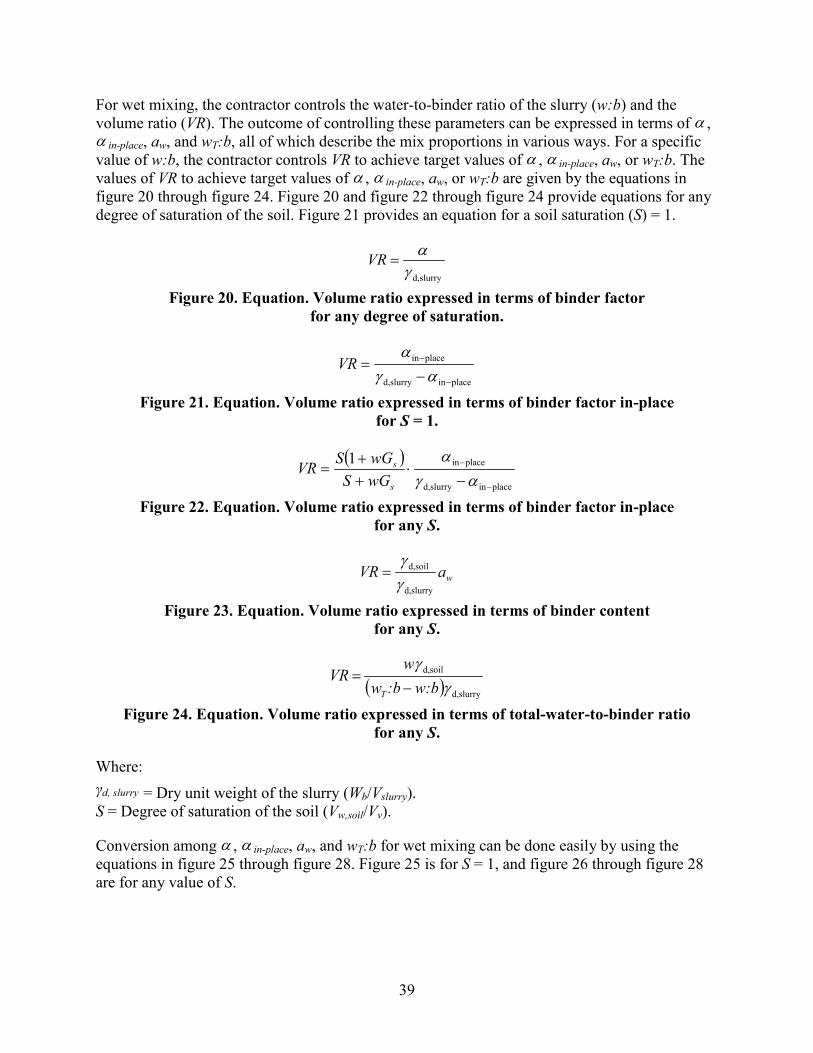
39
For wet mixing, the contractor controls the water-to-binder ratio of the slurry (w:b) and the volume ratio (VR). The outcome of controlling these parameters can be expressed in terms of α , α in-place, aw, and wT:b, all of which describe the mix proportions in various ways. For a specific value of w:b, the contractor controls VR to achieve target values of α , α in-place, aw, or wT:b. The values of VR to achieve target values of α , α in-place, aw, or wT:b are given by the equations in figure 20 through figure 24. Figure 20 and figure 22 through figure 24 provide equations for any degree of saturation of the soil. Figure 21 provides an equation for a soil saturation (S) = 1.
d,slurryγα
=VR
Figure 20. Equation. Volume ratio expressed in terms of binder factor for any degree of saturation.
placeinslurryd,
placein
−
−
−=
αγα
VR
Figure 21. Equation. Volume ratio expressed in terms of binder factor in-place for S = 1.
( )placeinslurryd,
placein1
−
−
−⋅
++
=αγ
α
s
s
wGSwGSVR
Figure 22. Equation. Volume ratio expressed in terms of binder factor in-place
for any S.
waVRslurryd,
soild,
γγ
=
Figure 23. Equation. Volume ratio expressed in terms of binder content for any S.
( ) d,slurry
d,soil
γγw:b:bw
wVR
T −=
Figure 24. Equation. Volume ratio expressed in terms of total-water-to-binder ratio
for any S.
Where: γd, slurry = Dry unit weight of the slurry (Wb/Vslurry). S = Degree of saturation of the soil (Vw,soil/Vv).
Conversion among α , α in-place, aw, and wT:b for wet mixing can be done easily by using the equations in figure 25 through figure 28. Figure 25 is for S = 1, and figure 26 through figure 28 are for any value of S.

40
placeinslurryd,
placeinslurryd,
−
−
−=
αγαγ
α
Figure 25. Equation. Binder factor expressed in terms of binder factor in-place for S = 1.
( ) 1
placeinslurryd,
placeinslurryd,
−
−
−⋅
++
=αγ
αγα
s
s
wGSwGS
Figure 26. Equation. Binder factor expressed in terms of binder factor in-place for any S.
soild,γα wa=
Figure 27. Equation. Binder factor expressed in terms of binder content for any S.
w:b:bww
T −= soild,γ
α
Figure 28. Equation. Binder factor expressed in terms of total-water-to-binder ratio for any S.
Figure 20 through figure 28 for wet mixing are based on the assumption that neither water nor binder from the mixture moves out into the soil beyond the deep mixed element. It is recognized that in sand and gravel soils, water probably moves into the soil beyond the element in response to excess pore water pressure in the freshly mixed element from slurry pumping pressure and mixing action. If the soil is coarse enough to allow water to flow out of the element prior to the binder setting up and if the soil is also fine enough that the binder particles are restrained from moving with the water flow, then the flow of water into the soil beyond the element would decrease wT:b in the element and increase the strength of the element. Thus, this assumption is either realistic or conservative for mixture strength, provided that binder particles do not move into the ground beyond the limits of the deep mixed element. If the soil is so coarse that the binder particles are not retained in the deep mixed element, then the process becomes a combination of deep mixing within the element limits and grouting outside the element limits, and the relationships given for the mixture would not apply.
The relationships provided are based on a uniform mixture (i.e., the spoil from the wet method has the same mix proportions as the material left in the ground). This can be a conservative assumption, depending on the details of the mixing process, because some of the upper portion of the existing soil with less than average binder content can be pushed up out of the ground as a result of slurry injected at greater depths.
5.3 ENGINEERING PROPERTY VALUES FOR DMM DESIGNS
Engineering properties of the deep mixed soil include strength, modulus, Poisson’s ratio, permeability, and unit weight. Stability analyses require material property values for strength and unit weight. Settlement analyses require material property values of modulus and unit weight.
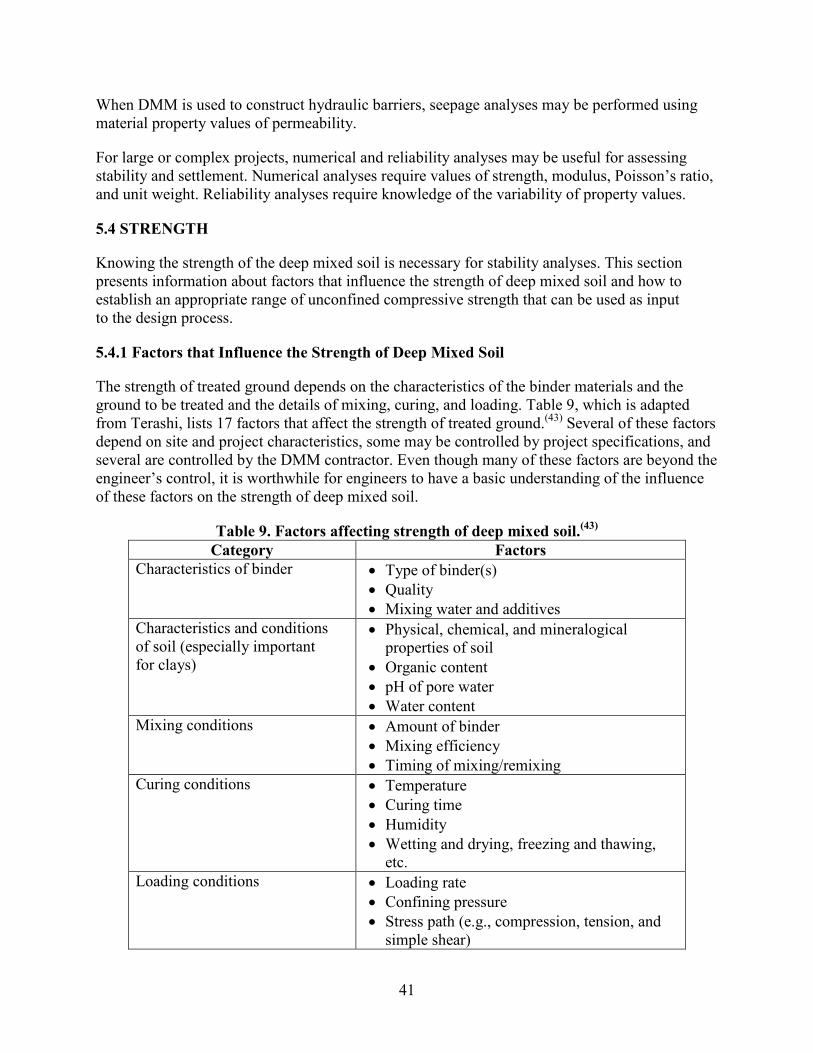
41
When DMM is used to construct hydraulic barriers, seepage analyses may be performed using material property values of permeability.
For large or complex projects, numerical and reliability analyses may be useful for assessing stability and settlement. Numerical analyses require values of strength, modulus, Poisson’s ratio, and unit weight. Reliability analyses require knowledge of the variability of property values.
5.4 STRENGTH
Knowing the strength of the deep mixed soil is necessary for stability analyses. This section presents information about factors that influence the strength of deep mixed soil and how to establish an appropriate range of unconfined compressive strength that can be used as input to the design process.
5.4.1 Factors that Influence the Strength of Deep Mixed Soil
The strength of treated ground depends on the characteristics of the binder materials and the ground to be treated and the details of mixing, curing, and loading. Table 9, which is adapted from Terashi, lists 17 factors that affect the strength of treated ground.(43) Several of these factors depend on site and project characteristics, some may be controlled by project specifications, and several are controlled by the DMM contractor. Even though many of these factors are beyond the engineer’s control, it is worthwhile for engineers to have a basic understanding of the influence of these factors on the strength of deep mixed soil.
Table 9. Factors affecting strength of deep mixed soil.(43) Category Factors
Characteristics of binder • Type of binder(s) • Quality • Mixing water and additives
Characteristics and conditions of soil (especially important for clays)
• Physical, chemical, and mineralogical properties of soil
• Organic content • pH of pore water • Water content
Mixing conditions • Amount of binder • Mixing efficiency • Timing of mixing/remixing
Curing conditions • Temperature • Curing time • Humidity • Wetting and drying, freezing and thawing,
etc. Loading conditions • Loading rate
• Confining pressure • Stress path (e.g., compression, tension, and
simple shear)

42
Numerous studies show that the strength of deep mixed materials increases with increasing aw, increasing mixing efficiency, increasing curing time, increasing curing temperature, decreasing water content of the mixture, and decreasing organic content of the base soil. (See references 1, 22, and 44–52.) One interesting interaction of these factors is that increasing the water content of the mixture can increase mixing efficiency; thus, in the case of low water content clays, adding water to the mixture can increase the mixture strength.(53) Nevertheless, it remains true that for thoroughly mixed materials, a decrease in the w:b of the mixture produces an increase in the unconfined compressive strength.
5.4.2 Effect of Total Water-to-Binder Ratio
The trend of increasing unconfined compressive strength with decreasing wT:b is shown from a variety of sources in figure 29 for cement binder mixed with inorganic soils in laboratories, including samples prepared to represent both dry and wet mixing. Although there is scatter in the data, the general trend is for the 28-day unconfined compressive strength of the mixtures to decrease as the total water-to-cement ratio (w:c) of the mixture increases. This is similar to the trend of decreasing strength for increasing w:c of concrete, but typical total w:c values for deep mixing are much larger than typical w:c values for concrete.
0
100
200
300
400
0 1 2 3 4 5 6 7 8 9 10 11 12
Total-Water-to-Cement Ratio
28-d
ay U
ncon
fined
Com
pres
sive
Stre
ngth
(psi
)
Jacobson, et al. (2003)Miura, et al. (2002)Horpibulsuk, et al. (2003)Lorenzo and Begado (2006)Hodges, et al. (2008)Trend
1psi = 6.88 kPa
Figure 29. Graph. Unconfined compressive strength versus total water-to-cement ratio for laboratory-mixed and tested specimens. (See references 48 and 54–57.)
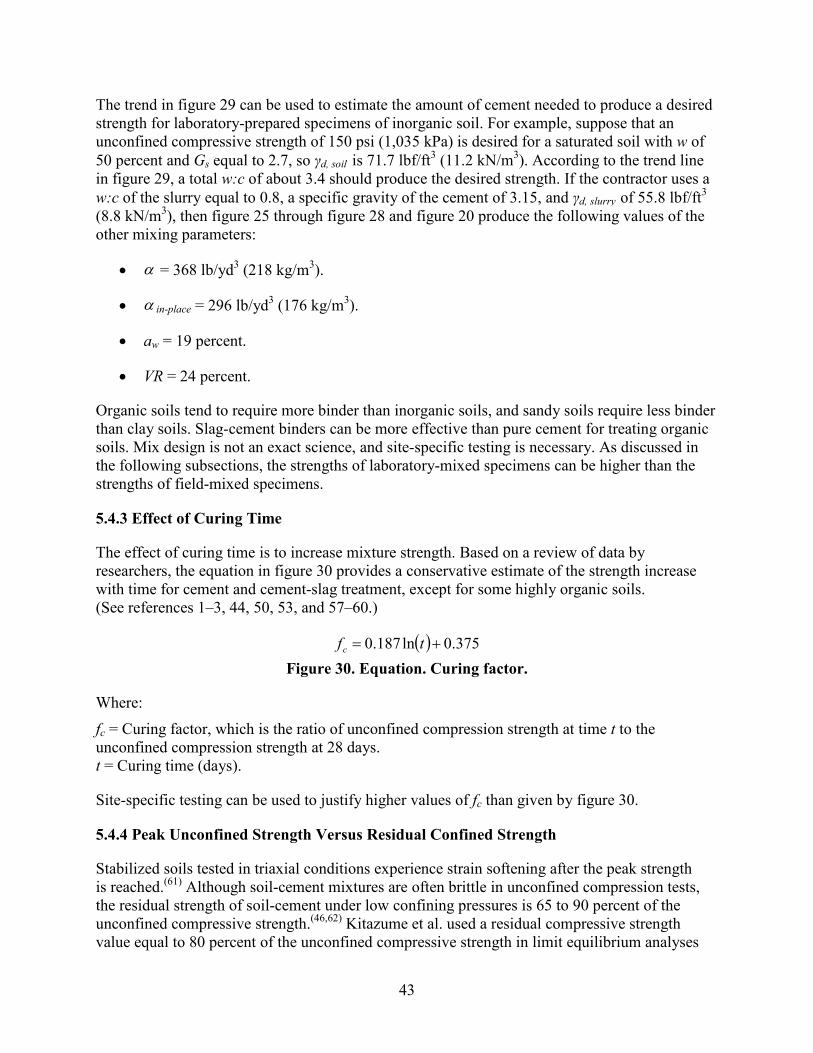
43
The trend in figure 29 can be used to estimate the amount of cement needed to produce a desired strength for laboratory-prepared specimens of inorganic soil. For example, suppose that an unconfined compressive strength of 150 psi (1,035 kPa) is desired for a saturated soil with w of 50 percent and Gs equal to 2.7, so γd, soil is 71.7 lbf/ft3 (11.2 kN/m3). According to the trend line in figure 29, a total w:c of about 3.4 should produce the desired strength. If the contractor uses a w:c of the slurry equal to 0.8, a specific gravity of the cement of 3.15, and γd, slurry of 55.8 lbf/ft3 (8.8 kN/m3), then figure 25 through figure 28 and figure 20 produce the following values of the other mixing parameters:
• α = 368 lb/yd3 (218 kg/m3).
• α in-place = 296 lb/yd3 (176 kg/m3).
• aw = 19 percent.
• VR = 24 percent.
Organic soils tend to require more binder than inorganic soils, and sandy soils require less binder than clay soils. Slag-cement binders can be more effective than pure cement for treating organic soils. Mix design is not an exact science, and site-specific testing is necessary. As discussed in the following subsections, the strengths of laboratory-mixed specimens can be higher than the strengths of field-mixed specimens.
5.4.3 Effect of Curing Time
The effect of curing time is to increase mixture strength. Based on a review of data by researchers, the equation in figure 30 provides a conservative estimate of the strength increase with time for cement and cement-slag treatment, except for some highly organic soils. (See references 1–3, 44, 50, 53, and 57–60.)
( ) 375.0ln187.0 += tfc
Figure 30. Equation. Curing factor.
Where:
fc = Curing factor, which is the ratio of unconfined compression strength at time t to the unconfined compression strength at 28 days. t = Curing time (days).
Site-specific testing can be used to justify higher values of fc than given by figure 30.
5.4.4 Peak Unconfined Strength Versus Residual Confined Strength
Stabilized soils tested in triaxial conditions experience strain softening after the peak strength is reached.(61) Although soil-cement mixtures are often brittle in unconfined compression tests, the residual strength of soil-cement under low confining pressures is 65 to 90 percent of the unconfined compressive strength.(46,62) Kitazume et al. used a residual compressive strength value equal to 80 percent of the unconfined compressive strength in limit equilibrium analyses

44
of their centrifuge test results.(63) The confined residual strength of deep mixed ground can be used in slope stability analyses to provide safety against progressive failure effects.
5.4.5 Unconfined Compressive Strength from Laboratory-Prepared Specimens
Values of unconfined compression strength of laboratory-mixed specimens have been reported in the range from about 2 to 400 psi (0.01 to 2.8 MPa) for dry mixing and from about 20 to 4,000 psi (0.1 to 28 MPa) for wet mixing, depending on the base soil type and the binder type and amount, with the highest values for wet mixing occurring when sand soils are mixed using high α and low w:b values.(54,64,65)
Given all of the factors that affect the strength of treated soils, the Japanese Coastal Development Institute of Technology (CDIT) indicates that it is not possible to predict within a reasonable level of accuracy the strength that will result from adding a particular amount of binder to a given soil based on the in situ characteristics of the soil.(46) Consequently, laboratory mix design studies must be performed using soils obtained from a project site.
Laboratory preparation and testing of specimens are discussed by Jacobson et al. for dry mixing and by Filz et al. for wet mixing.(52,51) These procedures are included in appendices A and B, respectively, and only key aspects are discussed in the main text. The procedure for dry mixing is based primarily on the procedure in Swedish Geotechnical Society Report 4:95E, and the procedure for wet mixing is based primarily on the procedure published by the Japanese Geotechnical Society.(66,64)
In both cases, the procedures cover recommended methods for handling and storing the soil sample, preparing the soil sample, preparing the binder, mixing the soil and binder, forming specimens, curing specimens, performing compression test, and reducing and presenting data.
5.4.6 Differences Between the Strength of Laboratory-Prepared Specimens and Field-Mixed Specimens
Laboratory mixing is often more thorough than field mixing. Consequently, the strength of laboratory-mixed specimens can be greater than the strength of field-mixed materials at the same mixture proportions. Conversely, the effects of confinement and potentially higher curing temperatures during field curing tend to increase the strength of field-mixed and cured materials compared to laboratory-prepared and cured specimens. Further complicating the matter is the difficulty of obtaining representative and undamaged specimens of field-mixed material.
According to EuroSoilStab, the strength of field-mixed materials may be 20 to 50 percent of the strength of laboratory-mixed specimens.(49) According to CDIT, the strength of field-mixed materials may be 20 to 100 percent of the strength of laboratory-mixed specimens.(46) The actual percentage depends on the type and operation of the mixing equipment, soil type, field curing conditions, and procedures used to prepare the laboratory specimens. In the United States, a common expectation is that the strength of field-mixed materials can consistently achieve at least 50 percent of the strength of laboratory-mixed specimens. However, engineers should consider prior experience on similar projects in similar soils when estimating the practically achievable relationship between the strength of field-mixed and laboratory-mixed materials.
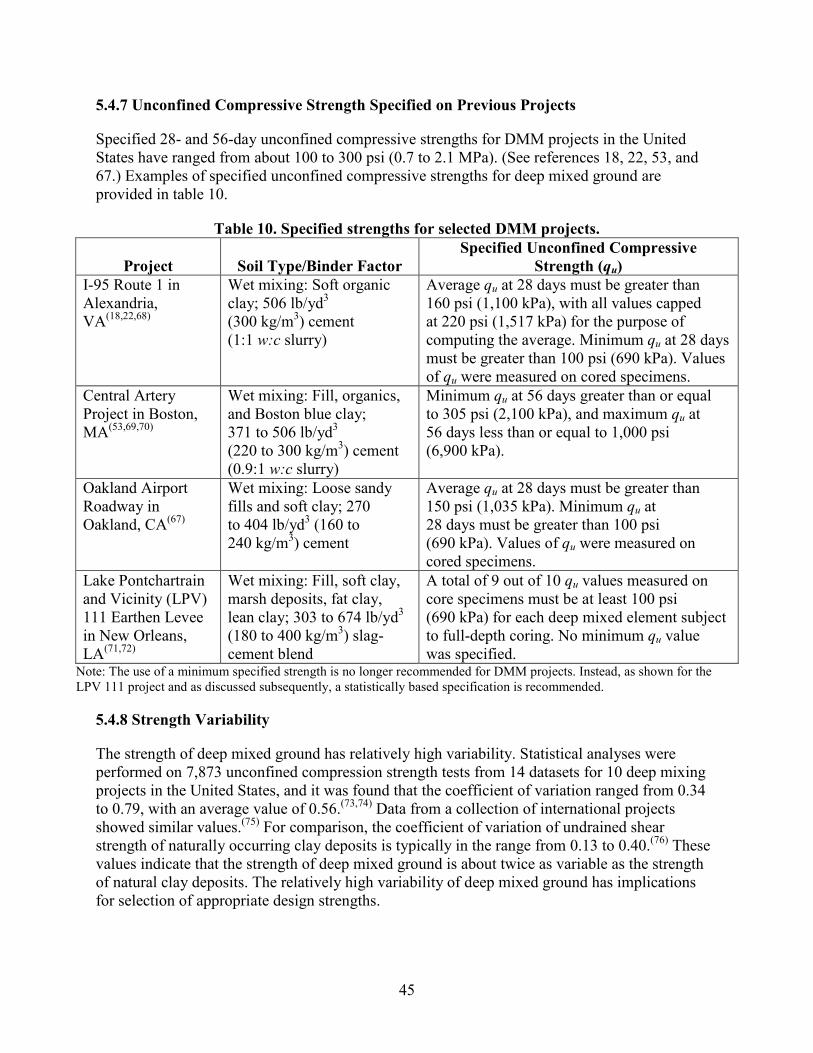
45
5.4.7 Unconfined Compressive Strength Specified on Previous Projects
Specified 28- and 56-day unconfined compressive strengths for DMM projects in the United States have ranged from about 100 to 300 psi (0.7 to 2.1 MPa). (See references 18, 22, 53, and 67.) Examples of specified unconfined compressive strengths for deep mixed ground are provided in table 10.
Table 10. Specified strengths for selected DMM projects.
Project Soil Type/Binder Factor Specified Unconfined Compressive
Strength (qu) I-95 Route 1 in Alexandria, VA(18,22,68)
Wet mixing: Soft organic clay; 506 lb/yd3 (300 kg/m3) cement (1:1 w:c slurry)
Average qu at 28 days must be greater than 160 psi (1,100 kPa), with all values capped at 220 psi (1,517 kPa) for the purpose of computing the average. Minimum qu at 28 days must be greater than 100 psi (690 kPa). Values of qu were measured on cored specimens.
Central Artery Project in Boston, MA(53,69,70)
Wet mixing: Fill, organics, and Boston blue clay; 371 to 506 lb/yd3 (220 to 300 kg/m3) cement (0.9:1 w:c slurry)
Minimum qu at 56 days greater than or equal to 305 psi (2,100 kPa), and maximum qu at 56 days less than or equal to 1,000 psi (6,900 kPa).
Oakland Airport Roadway in Oakland, CA(67)
Wet mixing: Loose sandy fills and soft clay; 270 to 404 lb/yd3 (160 to 240 kg/m3) cement
Average qu at 28 days must be greater than 150 psi (1,035 kPa). Minimum qu at 28 days must be greater than 100 psi (690 kPa). Values of qu were measured on cored specimens.
Lake Pontchartrain and Vicinity (LPV) 111 Earthen Levee in New Orleans, LA(71,72)
Wet mixing: Fill, soft clay, marsh deposits, fat clay, lean clay; 303 to 674 lb/yd3 (180 to 400 kg/m3) slag-cement blend
A total of 9 out of 10 qu values measured on core specimens must be at least 100 psi (690 kPa) for each deep mixed element subject to full-depth coring. No minimum qu value was specified.
Note: The use of a minimum specified strength is no longer recommended for DMM projects. Instead, as shown for the LPV 111 project and as discussed subsequently, a statistically based specification is recommended.
5.4.8 Strength Variability
The strength of deep mixed ground has relatively high variability. Statistical analyses were performed on 7,873 unconfined compression strength tests from 14 datasets for 10 deep mixing projects in the United States, and it was found that the coefficient of variation ranged from 0.34 to 0.79, with an average value of 0.56.(73,74) Data from a collection of international projects showed similar values.(75) For comparison, the coefficient of variation of undrained shear strength of naturally occurring clay deposits is typically in the range from 0.13 to 0.40.(76) These values indicate that the strength of deep mixed ground is about twice as variable as the strength of natural clay deposits. The relatively high variability of deep mixed ground has implications for selection of appropriate design strengths.

46
Variability can be taken into account by performing reliability analyses, as discussed by Navin and Filz and Navin.(77,73) Alternatively, if design is based on deterministic calculations, the specified strength of deep mixed ground should be adjusted to obtain a design value that accounts for the variability. Values of a factor to account for variability (fv) can be obtained by using the procedure described by Filz and Navin, which was applied to produce the values of fv given in chapter 6.(74)
5.4.9 Characteristics of the Strength Envelope for Design
There are differences of opinion regarding the most appropriate strength envelope for deep mixed soils for use in stability analyses. The state of practice in Japan is to use a total stress friction angle of φ = 0 and cohesion intercept of c = 1/2 qu for deep mixed soil.(46) Broms mentions the use of total stress friction angles in the range of 25 to 30 degrees for deep mixed soils.(78) EuroSoilStab and Carlsten and Ekstrom utilize a drained effective stress friction angle of 30 degrees with a range of values for the cohesion intercept depending on the location of the failure surface.(49,66)
EuroSoilStab indicates that for dry methods of deep mixing, columns should not be used to resist tensile stresses.(49) Takenaka Civil Engineering, Kivelo, and CDIT report that the tensile strength of soil improved by the wet method is 10 to 20 percent of the unconfined compressive strength.(44,61,46) Kitazume et al. reports that a value of 15 percent is used in Japan with wet mix methods.(79) In customary U.S. practice, tensile strength of the deep mixed ground is not relied on in design.
Because there is not yet widespread agreement on a comprehensive method for strength characterization of deep mixed materials, it is recommended that a reasonable but conservative strength envelope be used for stability analyses. Short-term end-of-construction conditions govern for the applications considered in this report. Accordingly, it is recommended that a total stress characterization of deep mixed soil strength should be used for design, with a total stress friction angle of φ = 0 and no tensile strength considered.
5.4.10 Establishing a Project-Specific Range of Unconfined Compressive Strengths
Design is ordinarily an iterative process in which geometry (e.g., column diameter, column arrangement, area replacement ratio, and depth) and engineering property values (e.g., strength and modulus of the treated ground) are assumed, analyses are performed (e.g., stability and settlement), and the results are compared with design criteria (e.g., factor of safety against instability and settlement magnitude). If the criteria are not satisfied, geometry or engineering property values are revised, and the analyses and comparisons with criteria are repeated. Consequently, it is often desirable to establish a range of realistically achievable strengths for use in the design process.
The following procedure is recommended to establish a range of strength values:
1. Determine representative values of water content and organic content for each stratum to be treated.

47
2. Estimate realistic ranges of binder factors based on the information provided in other chapters of this manual. Confirm these ranges by contacting engineers or contractors with deep mixing experience.
3. Use the plot of total water-to-cement ratio versus unconfined compressive strength to estimate the range of unconfined compressive strength that can be achieved for each stratum. Recall that this plot is for 100 percent cement binder and that slag-cement mixtures may be more appropriate for organic soils.
4. Conduct a bench-scale laboratory test program by applying the range of binder amounts determined in step 2 to soil samples from each stratum to be treated.
5. Compare the ranges of unconfined compressive strength obtained from steps 3 and 4. The values from step 4 are expected to be more reliable for a particular project because they incorporate the site-specific soils; however, it is reasonable to compare the results with the values obtained in step 3 from correlation. For dry mixing, establish values of unconfined compressive strength as a function of binder type and binder factor. For wet mixing, the values of unconfined compressive strength also depend on the amount of water added to the mixture in the water-cement slurry. So, the water-to-binder ratio of the slurry and the volume ratio are recorded for laboratory tests performed for wet mixing.
6. Estimate the ratio of the strength of field-mixed and cured material to the strength of laboratory-mixed and cured material at the same mix proportions. A reasonable estimate of this ratio is 0.5, but it may vary depending on the soil to be treated and the mixing procedures to be employed. It is recommended that the engineer consult engineers and contractors who have DMM experience regarding appropriate values of this ratio.
7. Apply the ratio from step 6 to the results of step 5 to obtain the values of unconfined compressive strength for field-mixed material as a function of the binder type, binder factor, and, for wet mixing, water-to-binder ratio of the slurry. The resulting range of unconfined confined compressive strength can serve as the basis for establishing the design shear strength of the deep mixed ground using the procedure outlined in chapter 6.
5.5 MODULUS
Young’s modulus values of the treated ground are used to calculate the compression of the deep mixed zone, as discussed in chapter 6. Secant values of Young’s modulus of elasticity at 50 percent, E50, of the unconfined compressive strength have been related to the unconfined compressive strength, qu, of deep mixed ground. For dry mixing, values of the ratio of E50 to qu have been reported in the range of 50 to 250.(52,65,78) For wet mixing, values of the ratio of E50 to qu have been reported in the range of 75 to 1,000.(80) In a study of 2,672 unconfined compression tests on core specimens from wet-mixed columns, Navin and Filz found a ratio of E50 to qu equal to approximately 300.(81)
Deep mixed ground exhibits a non-linear stress-strain response, with higher stiffness at low strains.(53,82) Tatsuoka et al. indicate that local displacement measurements taken directly on specimens can produce higher values of modulus than when displacements are based on relative movement of end platens.(82) E50 values obtained from short-duration laboratory tests do not

48
account for the effects of long-term creep, which can decrease the effective E50 value for long-term loading. The effects of higher modulus values at low strains and higher modulus from local strain measurements tend to counteract the effects of long-term creep.
For design, reasonable estimates of the compression of the deep mixed zone can be made by estimating E50 as 150 times qu for dry mixing and by estimating E50 as 300 times qu for wet mixing.
5.6 POISSON’S RATIO
Poisson’s ratio is not needed for the routine design procedures presented in chapter 6. However, Poisson’s ratio may be needed if numerical analyses are performed, and sources in the literature can provide some guidance. According to CDIT and Terashi, the Poisson’s ratio of deep mixed soil ranges from 0.25 to 0.50 irrespective of the unconfined compressive strength.(46,83) For peats stabilized with dry cement, Hebib and Farrell measured the Poisson’s ratio of 0.1 for strains less than 1 percent. McGinn and O’Rourke used a Poisson’s ratio of 0.25 in their numerical analysis.(84,53) Porbaha et al. used seismic methods to determine a Poisson’ ratio value of 0.3 to 0.4 for small strain behavior of deep mixed material created using the wet method.(10)
5.7 PERMEABILITY (HYDRAULIC CONDUCTIVITY)
For dry mixing, EuroSoilStab indicates that the permeability of clay soil treated with dry lime and cement can be assumed to be 200 to 600 times the permeability of unstabilized soil.(49) Field tests performed by Baker indicated that the permeability of dry mixed columns was 10 to 100 times the permeability of untreated clay soil.(65) Consequently, dry mixed columns can serve as vertical drains to some extent.
For wet mixing applied to sandy soils, permeability values as low as 4.72 × 10⁻⁴ to 4.72 × 10⁻⁵ ft/day (10-5 to 10-6 cm/s) are routinely achievable. Increasing the binder factor and adding bentonite will serve to decrease the permeability for mixtures created by the wet method. Deep mixed columns installed by the wet method are not considered to function as vertical drains.(85)
5.8 UNIT WEIGHT
For dry mixing, Broms reports that the unit weight of stabilized organic soil with high initial water content exceeds the unit weight of untreated soil, and it becomes greater with increasing cement and lime content.(78) However, he also notes that the unit weight of inorganic soils are often reduced by dry mix stabilization. CDIT reports that for soils treated by dry mixing, the total unit weight of the treated soil increases by about 3 to 15 percent above that of the untreated soil.(46) For an initially saturated soil treated by dry mixing, the total unit weight of a saturated mixture, γmix , is given by the equation in figure 31.
( )αγ
αγγγ+
+=
b
soilbmix
Figure 31. Equation. Total unit weight of a saturated mixture using dry mixing.
Where γsoil is the total unit weight of the soil.

49
For wet mixing, the Cement Deep Mixing (CDM) manual generalizes by indicating that for soils treated by wet mixing, the density change is negligible.(86) However, at the Boston Central Artery/Tunnel Project, a substantial decrease in unit weight occurred, as reported by McGinn and O’Rourke.(53) The decrease in this case was primarily a result of the initial unit weight of the clay having a relatively high value of 120 to 125 lbf/ft3 (19 to 20 kN/m3) and the need to add water to precondition the clay before wet mixing with cement grout. For an initially saturated soil treated by wet mixing, γmix is given by the equation in figure 32.
VRVR slurrysoil
mix +
+=
1γγ
γ
Figure 32. Equation. Total unit weight of a saturated mixture using wet mixing.
Where γslurry is the total unit weight of the slurry.
Continuing the example from section 5.4, γsoil and γslurry are 107.5 and 100.5 lbf/ft3 (16.89 and 15.79 kN/m3), respectively, and VR is 24.4 percent. According to figure 32, γmix is 106.2 lbf/ft3 (16.68 kN/m3).
In practical applications for DMM support of embankments and considering that area replacement ratios in the range of 0.2 to 0.4 are often used, the change in unit weight of the deep mixed zone is often negligible. Exceptions can occur for high values of replacement ratio when high α values are used in dry mixing or when high VR or low w:b of the slurry are used in wet mixing.


51
CHAPTER 6. DESIGN RECOMMENDATIONS
This chapter provides recommendations for designing deep mixing to support embankments and structures in transportation applications. These recommendations do not address all the factors that should be considered when designing deep mixing for other applications, such as stabilizing dam foundations. For support of transportation embankments, the recommendations in section 6.1 include detailed, step-by-step analysis and design procedures. Additional considerations that apply when DMM is used to support structures are described in section 6.2. Section 6.3 discusses the use of DMM to mitigate liquefaction potential, and section 6.4 provides comments about the use of DMM for excavation support. The procedures described in this chapter are for use by experienced geotechnical engineers. Consequently, being familiar with common geotechnical terminology and possessing the ability to perform earth pressure calculations, bearing capacity analyses, and slope stability calculations are prerequisites.
6.1 DESIGN OF DEEP MIXING TO SUPPORT EMBANKMENTS
Deep mixing for support of embankments is designed using allowable stress design methodology. Recommended steps in the design process are as follows:
1. Establish project requirements.
2. Establish representative subsurface conditions.
3. Establish trial deep mixed ground property values.
4. Establish trial deep mixed geometry including (1) general layout and definitions, (2) the center replacement ratio, and (3) the shear wall zone replacement ratio.
5. Evaluate settlement.
6. Evaluate stability, including slope stability, combined overturning and bearing capacity, crushing of the deep mixed shear walls at the outside toe, shearing on vertical plans in the deep mixed shear walls, and extrusion of soil between the deep mixed shear walls.
7. Prepare plans and specifications.
For unusually complex or critical projects, consideration should be given to supplementing the procedures with numerical analyses (e.g., Filz et al).(34)
The following subsections describe the seven steps and provide the references that form the basis for the design procedure.
6.1.1 Step 1—Establish Project Requirements
In step 1, the project requirements are established, including the following:
• Embankment geometry (alignment, height, crest width, and side slopes).

52
• Traffic surcharge loading.
• Performance criteria (factor of safety values and allowable settlement).
Several factors of safety values are required in steps 4.2 and 6. Table 11 lists typical design values of safety factors for transportation embankments supported on DMM columns. By iterative analyses, values of the shear strength and geometry of the deep mixed material should be selected such that the calculated factor of safety values equal or exceed the design values.
Table 11. Typical design values of safety factors for design of deep mixing to support embankments.
Symbol Description Typical Minimum Value for Design
Fcc Factor of safety against crushing of the center isolated deep mix columns
1.3
Fs Factor of safety against slope stability failure, including global stability and shearing through the deep mixed zone
1.5
Fo Factor of safety against combined overturning and bearing capacity failure of the deep mixed shear walls
1.3
Fc Factor of safety against crushing of the deep mixed ground at the toe of the deep mixed zone
1.3
Fv Factor of safety against shearing on vertical planes through the deep mixed zone
1.3
Fe Factor of safety against soil extrusion through deep mixed shear walls
1.3
It is recommended that Spencer’s method be used to calculate Fs values because it satisfies all conditions of equilibrium and results in more realistic factor of safety values than some of the more simplified methods of slope stability analysis.(87) The design value of Fs in table 11 is based on using Spencer’s method for the slope stability calculations. The analysis methods for the other failure modes listed in the table incorporate conservative assumptions. Consequently, lower design values of factor of safety are recommended for these failure modes.
An engineer may deviate from the recommended design values of factor of safety in table 11. For example, if subsurface conditions are well known, soil parameter values are selected conservatively, and the facility performance is not critical, then lower design values than those listed in table 11 can be considered. Conversely, if subsurface conditions are not well known, soil parameter values are not selected conservatively, or the facility performance is especially critical, then higher design values than those listed in table 11 can be considered. An experienced geotechnical engineer should make the selection of the design factor of safety for each of the failure modes and should justify the selection based on project-specific considerations.
6.1.2 Step 2—Establish Representative Subsurface Conditions
In step 2, the engineer establishes the soil material property values to be used in geotechnical analysis and design, including stratigraphy, groundwater conditions, and foundation material

53
property values, as discussed in chapter 4. For the settlement calculations described in step 5, values of the compression ratio, recompression ratio, and preconsolidation pressure are necessary for the soils underlying the deep mixed zone. For the stability analyses described in step 6, end-of-construction conditions are typically critical, so undrained shear strength parameters would be used for saturated clays, and drained strength parameters would be used for permeable sands and gravels.
6.1.3 Step 3—Establish Trial Deep Mixed Ground Property Values
In step 3, the engineer establishes trial property values for the deep mixed ground and for the composite deep mixed zone for use in the analyses described in steps 4.2 and 6. Background information about property values for deep mixed ground is provided in chapter 5, and the necessary property values for design are established in this section. The design value for the shear strength of the deep mixed ground (sdm) is estimated from the unconfined compressive strength to be specified (qdm,spec), considering fc and differences between unconfined peak and confined large-strain strengths (fr). Factor fv is also discussed and subsequently applied as appropriate to the analysis of each failure mode that involves the strength of the deep mixed ground.
A trial value of the 28-day qdm,spec is assumed based on the background information provided in chapter 5. Typical values of qdm,spec range from about 75 to 150 psi (0.52 to 1.03 MPa) for soft ground conditions. The necessary property values for design are established as follows:
1. Determine fc in figure 30 using the estimated time (t) between mixing and application of 75 percent of the proposed embankment height. The values in figure 30 are based on a conservative interpretation of a wide range of data including cement and cement-slag blends with fine- and coarse-grained soil.(34) Site-specific testing could be used to justify larger values of fc. One exception to the conservative trend provided by figure 30 is for highly organic soils or peat treated with 100 percent PCC, for which the value of fc should be limited to 1.0 unless site-specific testing permits a higher value. However, cement-slag blends with a high proportion of slag are often used for organic soils and peat; in which case, figure 30 provides a conservative estimate of strength gain with time.
Figure 30 can be used from 28 to 365 days between mixing and application of 75 percent of the proposed embankment height. The fc value ranges from 1.00 for 28 days to 1.48 for 365 days.
2. Determine sdm according to figure 33.
sdm = 12
fr fc qdm,spec
Figure 33. Equation. Shear strength of the deep mixed ground.
Values of fr typically range from 0.65 to 0.9, and a value of fr equal to 0.8 is recommended for application to transportation embankments.
3. Determine fv from table 12. Factor fv accounts for the greater variability that typically exists in the strength of deep mixed ground compared to the variability that typically exists in the
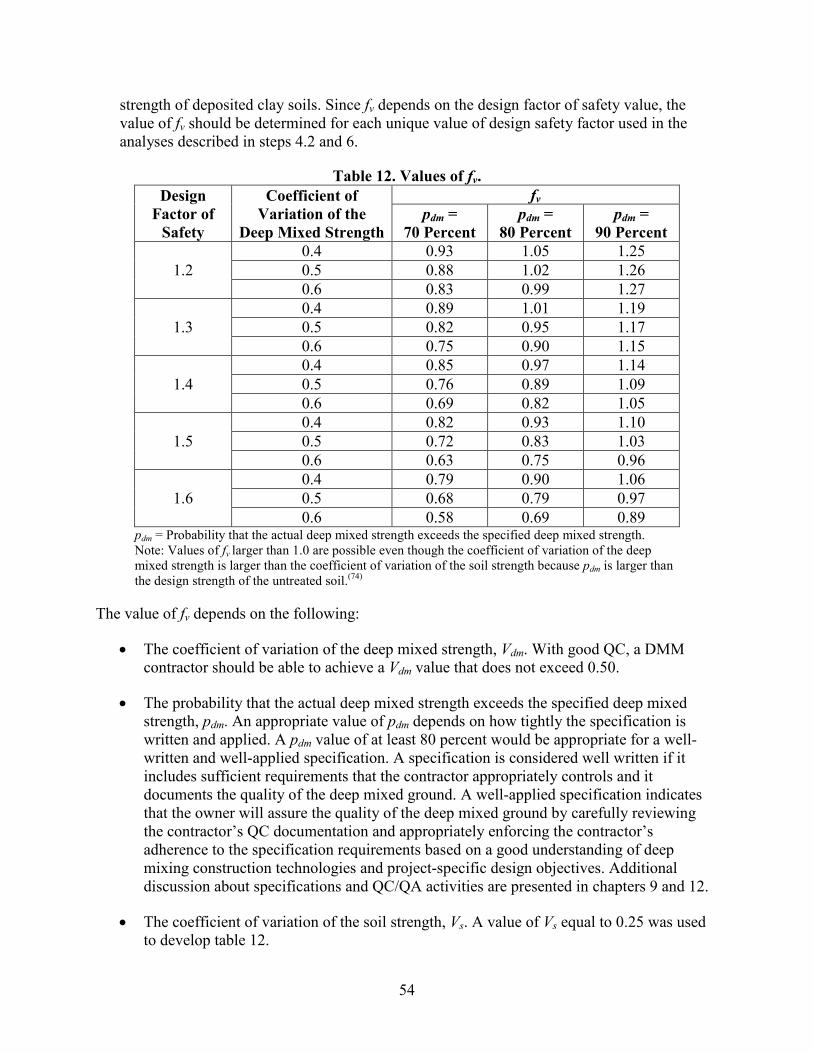
54
strength of deposited clay soils. Since fv depends on the design factor of safety value, the value of fv should be determined for each unique value of design safety factor used in the analyses described in steps 4.2 and 6.
Table 12. Values of fv. Design
Factor of Safety
Coefficient of Variation of the
Deep Mixed Strength
fv pdm =
70 Percent pdm =
80 Percent pdm =
90 Percent
1.2 0.4 0.93 1.05 1.25 0.5 0.88 1.02 1.26 0.6 0.83 0.99 1.27
1.3 0.4 0.89 1.01 1.19 0.5 0.82 0.95 1.17 0.6 0.75 0.90 1.15
1.4 0.4 0.85 0.97 1.14 0.5 0.76 0.89 1.09 0.6 0.69 0.82 1.05
1.5 0.4 0.82 0.93 1.10 0.5 0.72 0.83 1.03 0.6 0.63 0.75 0.96
1.6 0.4 0.79 0.90 1.06 0.5 0.68 0.79 0.97 0.6 0.58 0.69 0.89
pdm = Probability that the actual deep mixed strength exceeds the specified deep mixed strength. Note: Values of fv larger than 1.0 are possible even though the coefficient of variation of the deep mixed strength is larger than the coefficient of variation of the soil strength because pdm is larger than the design strength of the untreated soil.(74)
The value of fv depends on the following:
• The coefficient of variation of the deep mixed strength, Vdm. With good QC, a DMM contractor should be able to achieve a Vdm value that does not exceed 0.50.
• The probability that the actual deep mixed strength exceeds the specified deep mixed strength, pdm. An appropriate value of pdm depends on how tightly the specification is written and applied. A pdm value of at least 80 percent would be appropriate for a well-written and well-applied specification. A specification is considered well written if it includes sufficient requirements that the contractor appropriately controls and it documents the quality of the deep mixed ground. A well-applied specification indicates that the owner will assure the quality of the deep mixed ground by carefully reviewing the contractor’s QC documentation and appropriately enforcing the contractor’s adherence to the specification requirements based on a good understanding of deep mixing construction technologies and project-specific design objectives. Additional discussion about specifications and QC/QA activities are presented in chapters 9 and 12.
• The coefficient of variation of the soil strength, Vs. A value of Vs equal to 0.25 was used to develop table 12.
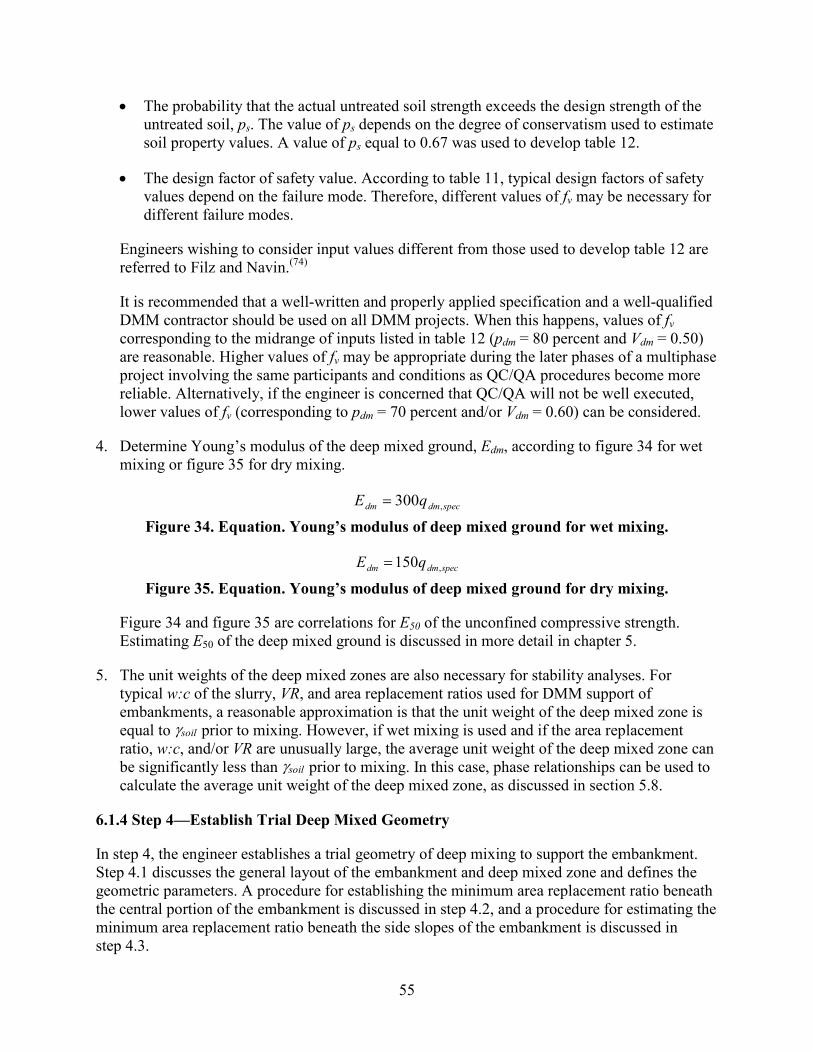
55
• The probability that the actual untreated soil strength exceeds the design strength of the untreated soil, ps. The value of ps depends on the degree of conservatism used to estimate soil property values. A value of ps equal to 0.67 was used to develop table 12.
• The design factor of safety value. According to table 11, typical design factors of safety values depend on the failure mode. Therefore, different values of fv may be necessary for different failure modes.
Engineers wishing to consider input values different from those used to develop table 12 are referred to Filz and Navin.(74)
It is recommended that a well-written and properly applied specification and a well-qualified DMM contractor should be used on all DMM projects. When this happens, values of fv corresponding to the midrange of inputs listed in table 12 (pdm = 80 percent and Vdm = 0.50) are reasonable. Higher values of fv may be appropriate during the later phases of a multiphase project involving the same participants and conditions as QC/QA procedures become more reliable. Alternatively, if the engineer is concerned that QC/QA will not be well executed, lower values of fv (corresponding to pdm = 70 percent and/or Vdm = 0.60) can be considered.
4. Determine Young’s modulus of the deep mixed ground, Edm, according to figure 34 for wet mixing or figure 35 for dry mixing.
specdmdm qE ,300=
Figure 34. Equation. Young’s modulus of deep mixed ground for wet mixing.
specdmdm qE ,150=
Figure 35. Equation. Young’s modulus of deep mixed ground for dry mixing.
Figure 34 and figure 35 are correlations for E50 of the unconfined compressive strength. Estimating E50 of the deep mixed ground is discussed in more detail in chapter 5.
5. The unit weights of the deep mixed zones are also necessary for stability analyses. For typical w:c of the slurry, VR, and area replacement ratios used for DMM support of embankments, a reasonable approximation is that the unit weight of the deep mixed zone is equal to γsoil prior to mixing. However, if wet mixing is used and if the area replacement ratio, w:c, and/or VR are unusually large, the average unit weight of the deep mixed zone can be significantly less than γsoil prior to mixing. In this case, phase relationships can be used to calculate the average unit weight of the deep mixed zone, as discussed in section 5.8.
6.1.4 Step 4—Establish Trial Deep Mixed Geometry
In step 4, the engineer establishes a trial geometry of deep mixing to support the embankment. Step 4.1 discusses the general layout of the embankment and deep mixed zone and defines the geometric parameters. A procedure for establishing the minimum area replacement ratio beneath the central portion of the embankment is discussed in step 4.2, and a procedure for estimating the minimum area replacement ratio beneath the side slopes of the embankment is discussed in step 4.3.

56
It is not necessary for the engineer to specify all of the geometric parameters defined in step 4.1. In fact, by determining and specifying only the minimum and/or maximum allowed values for certain geometric parameters, the engineer permits the DMM contractor flexibility in construction while still assuring that the final design will satisfy the requirements for settlement and stability.
Step 4.1—General Layout and Definitions
The overall dimensions and location of the deep mixed zone are generally selected to satisfy settlement and stability requirements, which are analyzed in steps 4.2, 5, and 6. Isolated columns and continuous shear walls are the most common configurations for transportation embankments. A cost effective combination uses isolated columns under the central portion of the embankment to control settlement and continuous shear walls oriented perpendicularly to the embankment centerline under the embankment side slopes to improve stability, as shown in figure 36.
Embankment
Hdm
B
Deep mixed shear walls within the
deep mixed zone
-- Cross Section --
-- Plan View --
sshear
d
Deep Mixed Zone
Isolated columns within the deep mixed zone
scenter
Hemb
Wcrest
Figure 36. Illustration. Typical arrangement for deep-mixed zone beneath an embankment.

57
Where:
Wcrest = Width of embankment crest. Hemb = Height of embankment. Hdm = Height of the deep mixed zone. B = Length of the shear wall. d = Column diameter. scenter = Center-to-center spacing of isolated columns. sshear = Center-to-center spacing of shear walls.
The continuous shear walls can be constructed from overlapping columns or by using overlapping barrettes. Longitudinal walls can also be constructed to prevent ground extrusion between parallel shear walls, although this is not necessary unless the untreated soil between the shear walls is very soft and the spacing between shear walls is large. A method to calculate the factor of safety against extrusion is provided later in this chapter. The spacing between shear walls under the side slopes of the embankment does not need to be the same as the spacing between isolated columns under the central portion of the embankment.
The analysis and design procedures in this report are for the combination of isolated columns and shear walls shown in figure 36. Other configurations are also possible, but they may require other analysis and design procedures.
The area replacement ratio beneath the central portion of an embankment, as,center, is defined as the ratio of the column area to the tributary soil area surrounding the column. Where isolated columns are placed in a square array, as in figure 36, as,center can be calculated using the equation in figure 37. Typical values of as,center for deep mixing support of embankments range from about 0.2 to 0.4. The minimum value of as,center is established in step 4.2.
( )2
2
,4 center
centerss
da π=
Figure 37. Equation. Area replacement ratio beneath the central portion of an embankment.
The geometry of overlapping columns used for shear walls under the side slopes of an embankment is shown in figure 38.

58
d
s
B
cb
DEEP-MIXED COLUMNSFORMING A SHEAR WALL
UNMIXED SOIL
Area of Overlap(shaded gray)
Subtended Angle, α
e
sshear
Chord Angle, β
Figure 38. Illustration. Definition sketch for column overlap calculations.
Where: e = Overlap distance. β = Chord angle in radians. c = Chord length. b = Average shear wall width.
The area replacement ratio under the side slopes of the embankment, as,shear, is defined as the ratio of the area of the shear wall to the tributary soil area surrounding the shear wall. Where overlapping columns are arranged to create shear walls that are oriented perpendicularly to the embankment centerline, as in figure 36 and figure 38, as,shear is defined according to figure 39. Typical values of as,shear for deep mixing support of embankments are greater than or equal to as,center and range from about 0.2 to 0.4. The minimum value of as,shear is estimated in step 4.3.
shearshears s
ba =,
Figure 39. Equation. Area replacement ratio under the side slopes of the embankment.
When the shear walls are constructed of overlapping columns, the extent of the overlap influences the minimum and average widths of the shear walls. The values of d, e, and sshear can be used to calculate β , c, the overlap area ratio (ae), and as,shear, as shown in figure 40 through figure 43.

59
−=
de1arccos2β
Figure 40. Equation. Chord angle expressed in radians.
=
2sin αdc
Figure 41. Equation. Chord length.
πsin α−α
=ea
Figure 42. Equation. Overlap area ratio.
( )
−
−π=
des
adashear
eshears,
14
1
Figure 43. Equation. Area replacement ratio of the shear walls.
To illustrate the relationships in figure 40 through figure 43, values of β , c/d, and ae are listed in table 13 for selected values of e/d. Typical values of e/d for shear walls beneath embankment side slopes range from about 0.2 to 0.35. Two important design parameters for embankment slope stability are the area replacement ratio for the shear walls, as,shear, which is provided by figure 43, and the ratio of the chord length to wall spacing, c/sshear, which is obtained by dividing figure 41 by sshear. Values of as,shear and c/sshear are listed in table 14 and table 15, respectively, for selected values of e/d and d/sshear. The value of as,shear is important for resistance to shearing through the deep mixed shear wall zone. The value of c is important for shearing on vertical planes in the deep mixed shear walls. Table 14 shows that as,shear is sensitive to d/sshear, but it is not strongly dependent on e/d. Table 15 shows that c/sshear is sensitive to both d/sshear and e/d, especially for low values of e/d. Small column overlaps should be avoided in circumstances where shearing on vertical planes is an important design consideration.
Table 13. Values of β, c/d, and ae for selected values of e/d. e/d β (radians) c/d ae 0 0.000 0.000 0.000
0.1 0.902 0.436 0.037 0.2 1.287 0.600 0.104 0.3 1.591 0.714 0.188 0.4 1.855 0.800 0.285 0.5 2.094 0.866 0.391

60
Table 14. Values of as,shear for selected values of e/d and d/s.
e/d as,shear
d/sshear = 0.1 d/sshear = 0.2 d/sshear = 0.3 d/sshear = 0.4 d/sshear = 0.5 0 0.079 0.157 0.236 0.314 0.393
0.1 0.084 0.168 0.252 0.336 0.420 0.2 0.088 0.176 0.264 0.352 0.440 0.3 0.091 0.182 0.273 0.364 0.455 0.4 0.094 0.187 0.281 0.375 0.468 0.5 0.096 0.191 0.287 0.383 0.478
Table 15. Values of c/sshear for selected values of e/d and d/s.
e/d c/sshear
d/sshear = 0.1 d/sshear = 0.2 d/sshear = 0.3 d/sshear = 0.4 d/sshear = 0.5 0 0.000 0.000 0.000 0.000 0.000
0.1 0.044 0.087 0.131 0.174 0.218 0.2 0.060 0.120 0.180 0.240 0.300 0.3 0.071 0.143 0.214 0.286 0.357 0.4 0.080 0.160 0.240 0.320 0.400 0.5 0.087 0.173 0.260 0.346 0.433
Step 4.2—Center Replacement Ratio
A trial value of as,center should be established based on the capacity of the isolated deep mixed columns beneath the central portion of the embankment using figure 44, with the value of fv from table 12 corresponding to the design value of Fcc from table 11. Typical values of as,center for deep mixing support of embankments range from about 0.2 to 0.4.
vdmcccenters fs
qFa2, ≥
Figure 44. Equation. Area replacement ratio beneath central portion of embankment.
Where q is the vertical stress from the embankment and surcharge.
Figure 44 is conservative because it assumes that the columns support the entire load from the embankment and surcharge without consideration of any support provided by the soil matrix.
Step 4.3—Shear Wall Zone Replacement Ratio
A minimum value of as,shear should be estimated. Typical values of as,shear for deep mixing support of embankments are greater than or equal to as,center and range from about 0.2 to 0.4.
The value of c/sshear should be calculated using figure 40 and figure 45 based on the selected value of e/d, which is typically in the range from 0.2 to 0.35, and the estimated value of as,shear.

61
( )( )ββπβ
sinsin2 ,
+−= shears
shear
as
c
Figure 45. Equation. Ratio of chord length to shear wall spacing.
Table 16 summarizes the geometric parameters that an engineer should specify. Again, by specifying only the minimum and/or maximum allowed values for certain geometric parameters, the engineer is affording the contractor flexibility in construction while still assuring that the final design will satisfy the requirements for performance.
Table 16. Geometric parameters necessary for design.
Parameter Minimum and/or
Maximum Top elevation of DMM element Minimum Bottom elevation of DMM element Maximum B Minimum d Minimum and maximum e/d Minimum scenter − d Maximum sshear − d Maximum as,center Minimum as,shear Minimum c/sshear Minimum
6.1.5 Step 5—Evaluate Settlement
In this step, the post-construction settlement of the embankment is calculated as the sum of the compression of the deep mixed zone and the compression of the underlying ground. Differential compliance settlement between the base of the embankment and the top of the deep mixed zone is often assumed to occur during embankment construction prior to placing the pavement wearing surface. If the engineer judges that differential compliance settlement at the base of the embankment will be delayed, the procedures described by Filz and Smith can be applied to conservatively estimate this contribution to the total embankment settlement.(88) Compression of the deep mixed zone is calculated based on equal strains in the deep mixed ground and the adjacent untreated soil within the deep mixed zone underlying the central portion of the embankment. This approach is equivalent to using a composite modulus of the deep mixed ground and the adjacent soil. The composite modulus, Mcomp, can be evaluated using figure 46.
( ) soilcentersdmcenterscomp MaEaM ,, 1−+=
Figure 46. Equation. Composite modulus.
Where Msoil is the constrained modulus of the untreated soil.
The implicit assumptions behind using Edm and Msoil are that a stiff column is not significantly restrained from lateral expansion by the soft soil and that the overall system geometry provides lateral restraint for the soft soil in a unit cell. Msoil is the inverse of the compressibility, mv, which is obtained from an oedometer test on the untreated soil over the stress range of interest.

62
Compression of the treated zone, Δ Hdm, can be calculated using figure 47.
compdmdm M
qHH =∆
Figure 47. Equation. Compression of the treated zone.
Compression of strata beneath columns installed by DMM can be computed using a load-spread method such as that employed for groups of driven piles.
If the calculated settlement exceeds the allowable settlement for a proposed embankment, then as,center, the column modulus, and/or the column length can be increased, depending on the primary source of the excess settlement.
When Hemb is at least two times the clear spacing between adjacent columns under the central portion of the embankment (i.e., Hemb ≥ 2(scenter – d)) and the embankment is constructed with typical good quality materials and procedures for placement and compaction, there is little risk of surface expression of differential settlements that occur at the base of the embankment, and special provisions for a load transfer platform at the base of the embankment are not necessary. When Hemb < 2(scenter – d), a load transfer platform can be designed using the procedures described by Sloan et al.(89) The load transfer platform should extend at least a distance scenter beyond the embankment crest beneath the embankment side slopes. If wet mixing is used, substantial spoils are produced at the ground surface, and the spoils can be used to construct all or part of the load transfer platform. The spoils should be placed and compacted as soon as they set up enough to support construction equipment, and the spoils will form a very strong embankment material.
On the embankment side slopes, there may be a potential for differential settlement of the embankment surface when Hemb becomes less than 2(sshear – d). This could result in maintenance problems such as difficulty mowing. The concern for differential settlement above embankment side slopes is reduced if there is a firm layer of existing ground at the surface through which the deep mixed shear walls are installed. If differential settlement of the embankment surface at the slide slopes remains a concern, then additional settlement-control columns can be installed between the deep mixed shear walls or a load transfer platform can be designed using the procedures described by Sloan et al.(89) Spoils from wet mixing can be used in a load transfer platform under the embankment side slopes.
6.1.6 Step 6—Evaluate Stability
In this step, the trial geometry established in step 4 is analyzed for stability as follows:
• Procedures for analyzing slope stability are discussed in step 6.1.
• Procedures for analyzing combined overturning and bearing capacity are presented in step 6.2.
• Procedures for analyzing crushing of the shear walls at the outside toe of the walls are presented in step 6.3.

63
• Procedures for analyzing shearing on vertical planes in the deep mixed shear walls are presented in step 6.4.
• Procedures for analyzing extrusion of soft soil between the deep mixed shear walls are presented in step 6.5.
Step 6.1—Slope Stability
Slope stability analyses should be performed to determine the critical failure surface and corresponding factor of safety. Potential sliding surfaces may pass entirely beneath or entirely above the deep mixed shear walls, through the deep mixed shear walls, or partially through and partially below the deep mixed shear walls, as shown in figure 48. The composite shear strength of the deep mixed zones beneath the embankment, sdm,wall and sdm,center, should be assigned as indicated in the figure based on figure 49 and figure 50, with the value of fv from table 12 corresponding to the design value of Fs from table 11. The resulting minimum factor of safety value from a comprehensive search for the critical failure surface is represented as Fs.
Embankment
Deep mixed shear walls, use sdm,wall
Deep mixed shear walls, use sdm,wall
Isolated deep mixed columns, use sdm,center
Figure 48. Illustration. Potential sliding surfaces and assignment of composite
shear strength, sdm,center and sdm,wall.
dmshearsvwalldm safs ,, =
Figure 49. Equation. Composite shear strength of the deep mixed zone beneath the shear walls.
sdm,center = max �as,center �1,500 lb/ft2� + �1 – as,center� ssoil, ssoil� 1 lbf/ft2 = 0.04788 kPa
Figure 50. Equation. Composite shear strength of the deep mixed zone beneath the central portion of the embankment.
Where ssoil is the shear strength of the soil through which the deep mixed columns are installed beneath the central portion of the embankment.

64
Figure 50 represents the isolated deep mixed elements as having a low shear strength value of 1,500 lbf/ft2 (71.8 kPa). This is done to account for failure modes like column bending that can occur in isolated columns.
The calculated value of Fs should be compared to the design value from table 11. Careful slope stability analyses can be used to optimize the design as follows:
• If the value of Fs is too small and the critical failure surface passes beneath the deep mixed shear wall, then the geometry of the deep mixed shear wall zone should be changed to increase the value of Fs. Generally, this is accomplished by increasing the depth or width of the deep mixed shear wall zone. If the value of Fs is excessively large for this case, then a smaller deep mixed shear wall zone could be considered.
• If the value of Fs is too small and the critical failure surface passes through the deep mixed shear wall zone, then increases could be made to the strength of the deep mixed ground, the area replacement ratio, and/or the width of the deep mixed shear wall zone. When considering increasing the design strength of the deep mixed ground, limitations on practically achievable strengths should be carefully considered. If the value of Fs is excessively large for this case, then decreases could be made to the strength of the deep mixed ground, the area replacement ratio, and/or the width of the deep mixed zone.
• If the value of Fs is too small and the critical failure surface passes above the deep mixed shear wall zone, then the embankment slope could be flattened, a stronger embankment material could be used, and/or the embankment could be reinforced with geosynthetics. If geosynthetic reinforcement is used to address a critical failure surface above the deep mixed zone, then the stability analyses through or below the deep mixed shear wall zone should be repeated, and the resulting values of Fs should be compared to the required values.
Spencer’s method is recommended for slope stability analyses because it satisfies all conditions of equilibrium and results in more realistic factor of safety values compared with some of the more simplified methods.(87) The minimum design value of Fs in table 11 is based on this recommendation. For typical project conditions, it is likely that a non-circular failure surface will be the critical surface. A careful search for the critical surface should be made using computer search and optimization routines by an experienced engineer. Critical slip surfaces should be checked for kinematic admissibility. Additional guidance for performing stability analyses is presented by Duncan and Wright.(90)
Step 6.2—Combined Overturning and Bearing Capacity
Figure 51 provides a definition sketch that includes many of the symbols used in the step-by-step procedure for combined overturning and bearing capacity.

65
Embankment
Hdm
Deep Mixed Shear Wall
B
Point "O"
hp
Pp D
ha
Pa
W
N
N' U
xN'
xN
xU
T
xW
Va
Vp
Figure 51. Illustration. Definition sketch for combined overturning and bearing
calculations.
Where:
W = Total weight of the deep mixed zone and the overlying untreated soil and embankment material. xW = Horizontal distance from point “O” at the toe of the deep mixed zone to the line of action of W. B = Width of the deep mixed zone. D = Depth to the base of the deep mixed zone at the toe of the slope. Pa = Total active force, including the load from water pressures. ha = Vertical distance from point “O” to the line of action of Pa. Va = Vertical shear force on active side. Pp = Total passive force, including the load from water pressures. hp = Vertical distance from point “O” to the line of action of Pp. Vp = Vertical shear force on passive side. N = Total vertical force acting upwards on the base of the deep mixed zone. U = Vertical water force acting upwards on the base of the deep mixed zone. N’ = Effective vertical force acting upwards on the base of the deep mixed zone. xN = Horizontal distance from point “O” to N. xU = Horizontal distance from point “O” to U.

66
xN’ = Horizontal distance from point “O” to N’. T = Horizontal shear force acting on the base of the deep mixed zone.
The following step-by-step procedure ensures that the design is sufficient to prevent combined overturning and bearing capacity failure of the deep mixed shear walls:
1. Select the design value of Fo based on table 11 and the accompanying discussion. The value of Fo will be used to factor down the strength of the soils that surround the deep mixed shear walls.
2. Determine mobilized shear strength parameter values for each layer of soil beside and beneath the deep mixed shear wall zone. If the shear strength of the soil layer under consideration is characterized by total normal stresses, use figure 52 and figure 53.
om F
cc =
Figure 52. Equation. Mobilized total stress cohesion intercept.
om F
φφ tanarctan=
Figure 53. Equation. Mobilized total stress friction angle.
Where:
cm = Mobilized total stress cohesion intercept. c = Total stress cohesion intercept. φ m = Mobilized total stress friction angle. φ = Total stress friction angle.
If the shear strength of the soil layer under consideration is characterized by effective normal stresses, use figure 54 and figure 55.
om F
'c'c =
Figure 54. Equation. Mobilized effective stress cohesion intercept.
om F
'tanarctan' φ=φ
Figure 55. Equation. Mobilized effective stress friction angle.
Where:
c'm = Mobilized effective stress cohesion intercept. c' = Effective stress cohesion intercept. φ'm = Mobilized effective stress friction angle. φ' = Effective stress friction angle.
3. Calculate values of Pa, ha, Va, Pp, hp, and Vp using the mobilized strength parameter values from step 2. The lateral forces Pa and Pp are total lateral forces, including the effects of
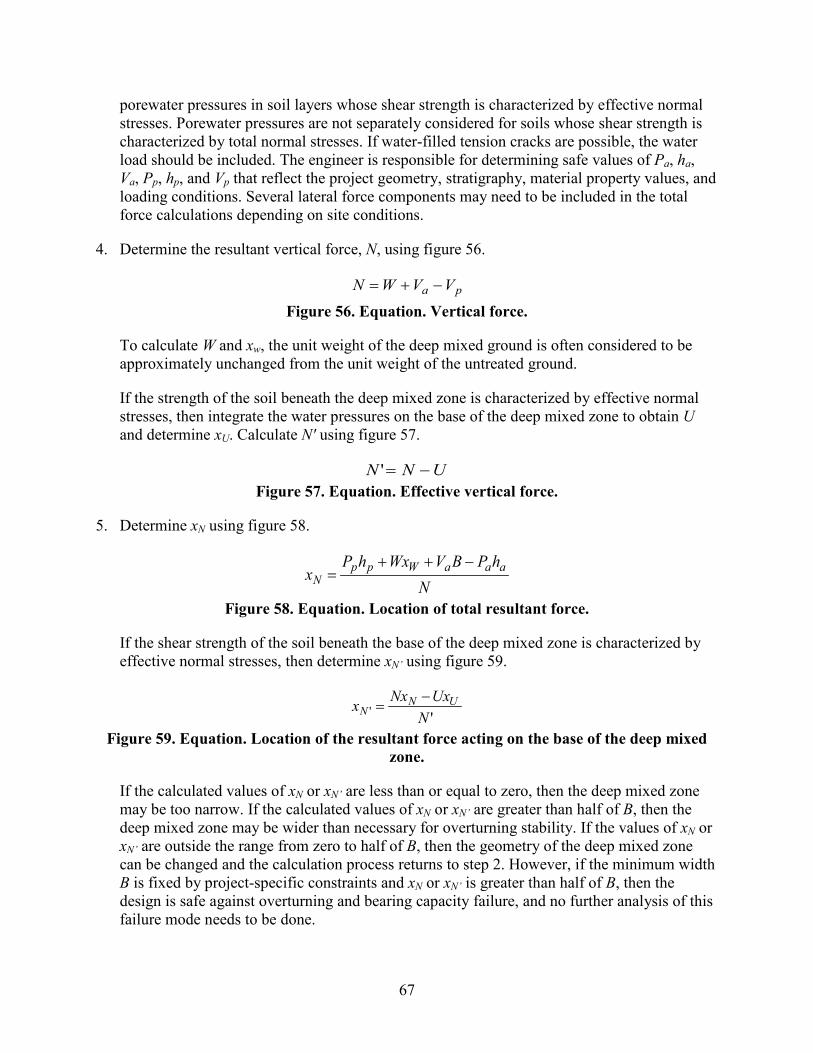
67
porewater pressures in soil layers whose shear strength is characterized by effective normal stresses. Porewater pressures are not separately considered for soils whose shear strength is characterized by total normal stresses. If water-filled tension cracks are possible, the water load should be included. The engineer is responsible for determining safe values of Pa, ha, Va, Pp, hp, and Vp that reflect the project geometry, stratigraphy, material property values, and loading conditions. Several lateral force components may need to be included in the total force calculations depending on site conditions.
4. Determine the resultant vertical force, N, using figure 56.
pa VVWN −+=
Figure 56. Equation. Vertical force.
To calculate W and xw, the unit weight of the deep mixed ground is often considered to be approximately unchanged from the unit weight of the untreated ground.
If the strength of the soil beneath the deep mixed zone is characterized by effective normal stresses, then integrate the water pressures on the base of the deep mixed zone to obtain U and determine xU. Calculate N' using figure 57.
UNN −=' Figure 57. Equation. Effective vertical force.
5. Determine xN using figure 58.
NhPBVWxhP
x aaaWppN
−++=
Figure 58. Equation. Location of total resultant force.
If the shear strength of the soil beneath the base of the deep mixed zone is characterized by effective normal stresses, then determine xN’ using figure 59.
'' NUxNxx UN
N−
=
Figure 59. Equation. Location of the resultant force acting on the base of the deep mixed zone.
If the calculated values of xN or xN’ are less than or equal to zero, then the deep mixed zone may be too narrow. If the calculated values of xN or xN’ are greater than half of B, then the deep mixed zone may be wider than necessary for overturning stability. If the values of xN or xN’ are outside the range from zero to half of B, then the geometry of the deep mixed zone can be changed and the calculation process returns to step 2. However, if the minimum width B is fixed by project-specific constraints and xN or xN’ is greater than half of B, then the design is safe against overturning and bearing capacity failure, and no further analysis of this failure mode needs to be done.

68
6. Calculate the bearing pressure at the toe of the deep mixed shear walls, qtoe. If the shear strength of the soil beneath the deep mixed shear walls is characterized by total normal stresses, use figure 60.
≤≤
+−
≤
+−
=
23Bfor 1
63
3for 11
32
,,
,,
BxBa
xaB
N
Bxaax
BBN
q
Nshears
N
shears
NshearsshearsN
toe
Figure 60. Equation. Bearing pressure at the toe of the deep mixed shear walls using total normal stresses.
If the shear strength of the soil beneath the deep mixed shear walls is characterized by effective normal stresses, use figure 61.
≤≤
+−
≤
+−
=
23Bfor 1
63'
3for 11
32'
',
'
,
',,'
BxBa
xaB
N
Bxaax
BBN
q
Nshears
N
shears
NshearsshearsN
toe
Figure 61. Equation. Bearing pressure at the toe of the deep mixed shear walls using effective normal stresses.
The expressions for qtoe in figure 60 and figure 61 are based on a linear pressure distribution, with stress concentration on the base of the shear walls having average width B, as shown in figure 38. The weight of the soil between the shear walls is assumed to be carried by the underlying soil.
7. Determine the allowable bearing pressure at the toe of the deep mixed shear walls, qall. If the shear strength of the soil beneath the deep mixed shear walls is characterized by total normal stresses, use figure 62.
qabovebelowcmall DNNbNcq γγ γ ++= min21
Figure 62. Equation. Allowable bearing pressure at the toe of the deep mixed shear walls using total normal stresses.
Where:
Nc, Nγ , Nq = Bearing capacity factors obtained from φ m for the soil below the deep mixed shear walls using generally accepted sources for bearing capacity factors. γ below = Total unit weight of the soil below the shear walls. γ above = Average total unit weight of the soils above the base of the shear walls. bmin = Minimum allowable effective shear wall width, which can be estimated as 90 percent of the minimum allowable column diameter for typical values of e/d.

69
If φ m equals zero, then Nγ = 0, Nq = 1, and Nc can be approximated as 7.5(1 + 0.1bmin/xN) for bmin ≤ 2xN. In this case, figure 62 reduces to figure 63.
qall = cm (7.5) �1 + 0.1 bmin
xN�+ γaboveD
Figure 63. Equation. Allowable bearing pressure at the toe of the deep mixed shear walls using a total stress friction angle equal to zero.
If the shear strength of the soil beneath the deep mixed shear walls is characterized by effective normal stresses, use figure 64.
qabovebbelowbcmall DNNbNcq '''' ,min,21 γγ γ ++=
Figure 64. Equation. Allowable bearing pressure at the toe of the deep mixed shear walls using effective normal stresses.
Where:
N’c, N’γ , N’q = Bearing capacity factors obtained from φ’ m for the soil below the deep mixed shear walls using generally accepted sources for bearing capacity factors. γ b,below = Buoyant unit weight of the soil below the shear walls. γ b,above = Average buoyant unit weight of the soil above the base of the shear walls.
The bearing capacity calculations can be performed using correction factors for shape, depth, and compressibility as appropriate.
If qtoe is less than or equal to qall, then the design is sufficient to prevent combined overturning and bearing capacity failure of the deep mixed shear walls. If qtoe is greater than qall, then the geometry of the deep mixed zone can be changed to decrease qtoe and increase qall. This would typically be accomplished by increasing the width or depth of the deep mixed zone.
This procedure represents a potential failure condition for which the stabilized block overturns. This failure mode, which is not captured by ordinary limit equilibrium slope stability calculations, can control for tall and narrow deep mixed zones. By combining the overturning and bearing capacity calculations into a single calculation with the same factor of safety applied to the soils beside and below the deep mixed zone, ambiguities in the evaluation are avoided.
Step 6.3—Crushing of the Deep Mixed Shear Walls at the Outside Toe
In situations where the deep mixed ground overlies a hard bearing stratum, lateral loads could produce toe pressures that exceed the capacity of the deep mixed ground. The design factor Fc should be selected based on table 11.
If Fo is equal to Fc, then the intermediate values from step 6.2 can be used in the current step. If Fo is not equal to Fc, then steps 2–6 in step 6.2 should be repeated using Fc instead of Fo in figure 52 through figure 55. If the calculated values of xN and xN’ are greater than half of B, then the design is safe against crushing at the toe of the shear walls, and no further evaluation of crushing is necessary. Otherwise, the values of qtoe (see figure 60 or figure 61) and φ m or φ’m

70
(see figure 53 or figure 55) for the soil adjacent to the deep mixed ground at the toe of the deep mixed zone should be used in the following calculations.
The allowable capacity of the deep mixed ground can be determined based on the equation in figure 65, with the value of fv from table 12 corresponding to the design value of Fc from table 11.
hc
vdmall F
fsq σ+=
2
Figure 65. Equation. Allowable bearing capacity of the deep mixed ground against crushing of the deep mixed shear walls at the outside toe of the embankment.
Where σ h is the lateral earth pressure at the toe.
A conservative value of σ h is the at-rest lateral earth pressure. If the shear strength of the soil beneath the deep mixed ground is characterized by total normal stresses, then qtoe is determined from figure 60, and qtoe is the total vertical stress. In this case, the value σ h to be used in figure 65 is given by the equation in figure 66.
uK vh += '0σσ
Figure 66. Equation. Total lateral earth pressure.
Where:
K0 = Effective stress at-rest lateral earth pressure coefficient determined based on φ’m for the soil adjacent to the deep mixed ground at the toe of the deep mixed zone. σ ’v = Effective vertical stress in the soil adjacent to the deep mixed ground at the toe of the deep mixed zone. u = Porewater pressure in the soil adjacent to the deep mixed ground at the toe of the deep mixed zone.
If the shear strength of the soil beneath the deep mixed ground is characterized by effective normal stresses, then qtoe is determined from figure 61 and qtoe is an effective vertical stress. In this case, the effective lateral earth pressure, σ 'h, should be used in place of σ h in figure 65, and σ 'h is given by the equation in figure 67.
vh K '' 0σσ =
Figure 67. Equation. Effective lateral earth pressure.
If qtoe is less than or equal to qall, then the design is sufficient to prevent crushing of the deep mixed ground at the toe of the shear walls. If qtoe is greater than qall, then the area replacement ratio, the width of the deep mixed zone, or the strength of the deep mixed ground should be increased.
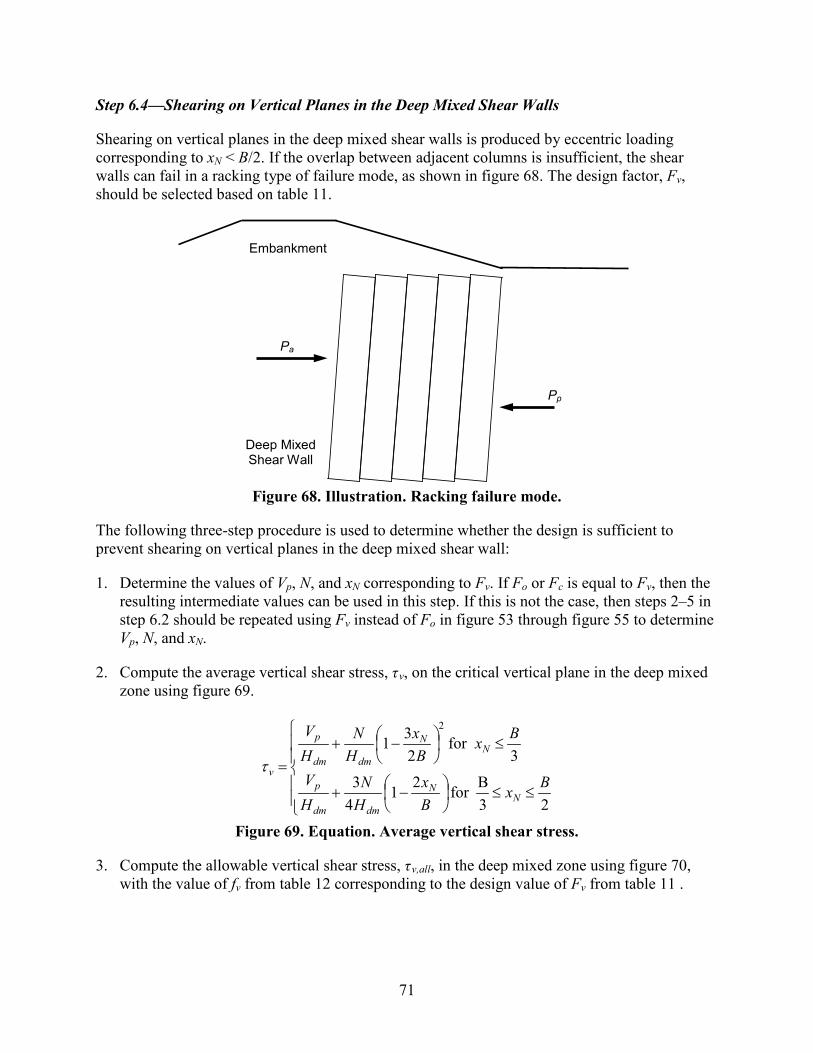
71
Step 6.4—Shearing on Vertical Planes in the Deep Mixed Shear Walls
Shearing on vertical planes in the deep mixed shear walls is produced by eccentric loading corresponding to xN < B/2. If the overlap between adjacent columns is insufficient, the shear walls can fail in a racking type of failure mode, as shown in figure 68. The design factor, Fv, should be selected based on table 11.
Embankment
Deep Mixed Shear Wall
Pp
Pa
Figure 68. Illustration. Racking failure mode.
The following three-step procedure is used to determine whether the design is sufficient to prevent shearing on vertical planes in the deep mixed shear wall:
1. Determine the values of Vp, N, and xN corresponding to Fv. If Fo or Fc is equal to Fv, then the resulting intermediate values can be used in this step. If this is not the case, then steps 2–5 in step 6.2 should be repeated using Fv instead of Fo in figure 53 through figure 55 to determine Vp, N, and xN.
2. Compute the average vertical shear stress, τ v, on the critical vertical plane in the deep mixed zone using figure 69.
≤≤
−+
≤
−+
=
23Bfor 21
43
3for
231
2
BxBx
HN
HV
BxBx
HN
HV
NN
dmdm
p
NN
dmdm
p
vτ
Figure 69. Equation. Average vertical shear stress.
3. Compute the allowable vertical shear stress, τ v,all, in the deep mixed zone using figure 70, with the value of fv from table 12 corresponding to the design value of Fv from table 11 .

72
( )v
dmshearvallv F
sscf=,τ
Figure 70. Equation. Allowable vertical shear stress.
If τ v is less than or equal to τ v,all, then the design is sufficient to prevent shearing on vertical planes in the deep mixed shear wall. If τv is greater than τ v,all, then measures can be taken to increase τv,all, such as increasing the strength of the deep mixed ground or the chord length at column overlaps or decreasing the shear wall spacing. Alternatively, measures can be taken to decrease τ v, such as by increasing B. When considering increasing the design strength of the deep mixed ground, limitations on practically achievable strengths should be carefully considered.
Step 6.5—Extrusion of Soil Between the Deep Mixed Shear Walls
Extrusion of soft ground between shear walls could occur if the shear walls are widely spaced or short in the direction perpendicular to the embankment alignment. Extrusion between shear walls is not possible for sands or stiff clays under normal conditions, so only layers of soft clay need to be checked for this failure mode. The design factor, Fe, should be selected based on table 11 and the accompanying discussion.
The maximum clear spacing between shear walls, sshear – d, should be limited based on the equation in figure 71 to prevent extrusion of soft clay.
( )ee
vpvaeshear
H1
B12
c2F
1ds−
−
σ−σ≤−
Figure 71. Equation. Maximum clear spacing between shear walls.
Where:
He = Thickness of a layer of soft clay to be analyzed for extrusion. σ va = Average value of the total vertical stress in the soft clay layer to be analyzed for extrusion immediately adjacent to the active earth pressure side of the deep mixed shear walls. σ vp = Average value of the total vertical stress in the soft clay layer to be analyzed for extrusion immediately adjacent to the passive earth pressure side of the deep mixed shear walls. ce = Average value of the total stress cohesion intercept in the soft clay layer to be analyzed for extrusion.
This calculation should be repeated for different layers of soft clay soil to determine the critical value of sshear – d.
If there is a project-specific reason to consider a larger value of clear spacing between shear walls than indicated by figure 71, then the shear wall length could be increased. Alternatively, a continuous wall of overlapping columns parallel to the embankment alignment and located within the zone of the deep mixed shear walls could be considered to prevent extrusion.

73
6.1.7 Step 7—Prepare Plans and Specifications
The final design resulting from steps 1–6 is incorporated in the project plans and specifications, as described in chapter 9.
6.1.8 Basis for Design Procedure
The analysis and design procedures in this section are based primarily on information provided by CDIT and with consideration of the findings of many other engineers and researchers. (See references 7, 9, 34–36, 46, 49, 56, 59, 61, 65, 68, 69, 78, 83, and 91–118.)
6.2 DESIGN CONSIDERATIONS FOR DMM SUPPORTED STRUCTURES
Deep mixing can be used to support structures such as retaining walls, bridge abutments, and bridge piers. For support of structures, deep mixed columns should always be used in groups, and they should be designed to carry the entire load from the structure without consideration of any direct support to the structure provided by the soil between columns. Down drag from settlement of adjacent soil should be considered, if applicable.
The axial capacity of the deep mixed columns is the minimum of the structural capacity and the geotechnical capacity of the columns. The allowable axial structural capacity of a deep mixed column, Qall, can be determined according to figure 72, which incorporates a safety factor of 2.5 on sdm, as determined from figure 33.
5
2dm
allsd
Qπ
=
Figure 72. Equation. Allowable axial structural capacity of a deep mixed column.
The geotechnical capacity of a deep mixed column can be analyzed using procedures for drilled shafts because drilled shafts and deep mixed columns are similar in their effects on the soil between shafts or columns and in the degree of interlocking between the shaft or column and the adjacent soil.(119) A safety factor of 3 is recommended to obtain an allowable geotechnical capacity from the ultimate geotechnical capacity.
Deep mixed columns are not normally used to resist lateral loads from structures. Settlement of structures on deep mixed foundations can be estimated using the same procedures described in section 6.1.5 for embankments, with the applied structure load converted to a pressure distributed over the area of the column group.
6.3 LIQUEFACTION MITIGATION
Deep mixing can be used to improve mass shear strength and contain liquefaction propagation.(9) Walls of deep mixed columns are installed in grid arrangements to contain liquefiable soils, thus preventing a shear failure during a seismic event. An example plan view of soil-cement columns used on a BART system project is presented in figure 73.
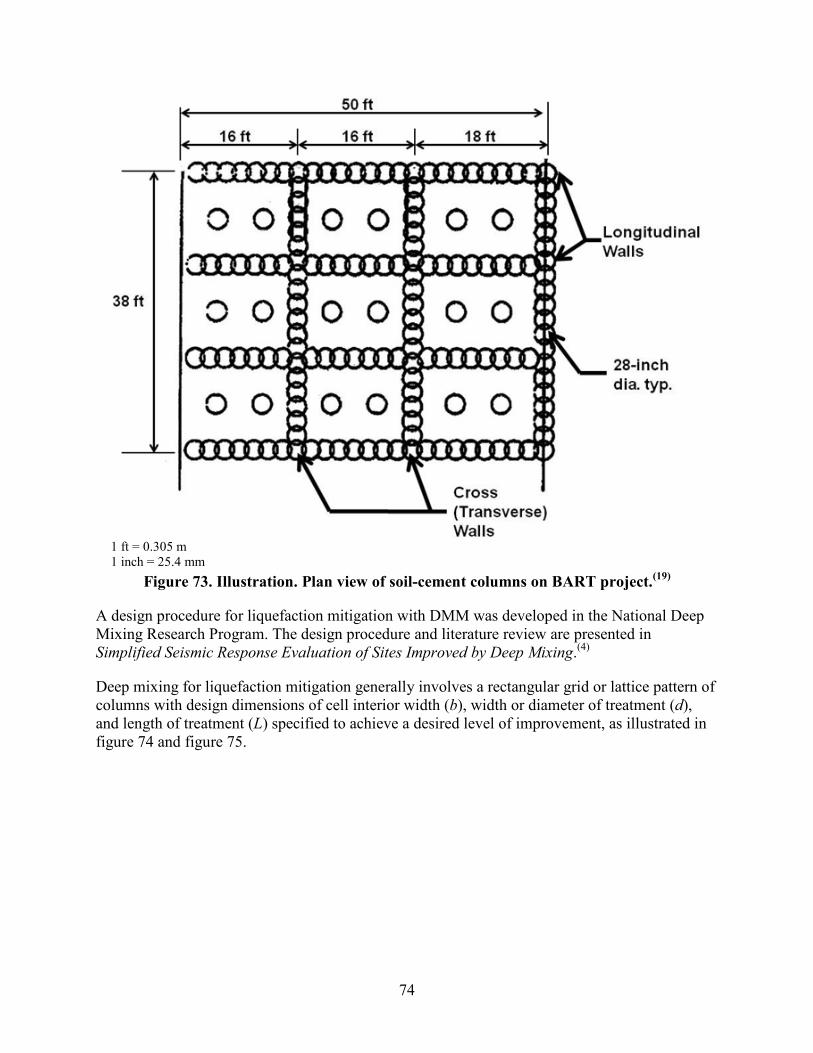
74
1 ft = 0.305 m 1 inch = 25.4 mm
Figure 73. Illustration. Plan view of soil-cement columns on BART project.(19)
A design procedure for liquefaction mitigation with DMM was developed in the National Deep Mixing Research Program. The design procedure and literature review are presented in Simplified Seismic Response Evaluation of Sites Improved by Deep Mixing.(4)
Deep mixing for liquefaction mitigation generally involves a rectangular grid or lattice pattern of columns with design dimensions of cell interior width (b), width or diameter of treatment (d), and length of treatment (L) specified to achieve a desired level of improvement, as illustrated in figure 74 and figure 75.

75
Figure 74. Illustration. DMM treatment plan.(4)
Figure 75. Illustration. Typical configuration of DMM for liquefaction mitigation.(4)
Where:
s = Center-to-center spacing of element walls. D = Depth to first soil or bedrock. Hb = Thickness of base layer. Hf = Thickness of fill.
The seismic response characteristics of the DMM sites have been assessed based on the residual porewater pressure response (or liquefaction), which is a widely used engineering response indicator.

76
The steps proposed by Siddarthan and Suthahar to evaluate the residual porewater pressure response of DMM sites are summarized as follows:(4)
1. Evaluate soil response of DMM sites at various locations within and adjacent to DMM treated soil and in the free field for a variety of preselected test cases with different DMM treatments (configurations and properties), untreated soil conditions, and excitations. The result of this investigation is the establishment of a database of porewater pressure response ratios (PWPRs) normalized with respect to the free-field response. These PWPRs are computed at various depths along many vertical sections (within and adjacent to DMM columns).
2. Evaluate level ground seismic soil response in the free field in terms of porewater pressure at various depths using simplified liquefaction procedures outlined by Youd et al.(120) Unlike step 1, this is a site-specific analysis performed for a given untreated soil mass that is provided with DMM treatment. This step requires many input parameters such as soil layering and properties (e.g., thicknesses, SPT values, density, etc.) and excitation characteristics (e.g., acceleration strength and earthquake magnitude).
3. Establish PWPRs that are appropriate for the problem under consideration based on the case-specific untreated soil conditions, DMM treatment, and excitation characteristics from the database established in step 1. Multiply the free-field responses computed in step 2 by these equivalent factors to obtain the porewater response at various locations within and adjacent to the DMM columns.
The objective of this work was to produce simple design guidelines that practicing engineers can readily use to evaluate the effectiveness of various configurations of DMM treatments. The aforementioned seismic response evaluation model is simple and appropriately accounts for many important factors that affect the DMM treated soil response. More details on these steps are provided by Siddarthan and Suthahar.(4)
Other important seismic design issues, such as residual strength, permanent lateral deformation (e.g., lateral spread), and ground failure (e.g., sand boils), can be investigated based on the liquefaction analysis. The design issues can be assessed based on empirical relations that have been developed to specifically address each of these failure modes. Well-documented guidelines for these analyses are available and have been incorporated into design aids such as Special Publication No. 117 developed by the Division of Mines and Geology and the Southern California Earthquake Center.(121,122)
6.4 EXCAVATION SUPPORT
For permanent excavation support, a bulkhead consisting of deep mixed shear walls can be designed using the procedures described in section 6.1 for embankments. In addition, one or more rows of overlapping columns should be provided along the bulkhead face perpendicular to the shear walls to prevent sloughing and raveling at the exposed face. The exposed face should be protected with shotcrete, precast concrete panels, or other protection to provide for long-term durability. Design of temporary excavation support is outside the scope of this report.

77
CHAPTER 7. DESIGN EXAMPLE
7.1 INTRODUCTION
This chapter provides an example of DMM to support an embankment for a transportation application. The problem background is described and step-by-step analysis and design calculations are presented.
A new approach embankment is to be constructed over a 25-ft (7.6-m)-thick deposit of soft clay underlain by a dense sand layer. The ground water table (GWT) is located 3 ft (0.9 m) below the native ground surface. Preliminary analyses determined that without some type of ground improvement, both the factor of safety against slope stability failure (Fs = 0.77) and the predicted settlement (about 2.3 ft (0.7 m)) are unacceptable. DMM has been proposed to stabilize the soft clay layer. The DMM design is performed using steps 1–7 in the following sections, based on the design guidance presented in chapter 6.
7.1.1 Step 1—Establish Project Requirements
The geometry and soil properties for the proposed embankment are shown in figure 76. The slope of the embankment is 1.5 horizontal to 1 vertical (1.5H:1V). A uniform traffic surcharge load, qs, of 200 lbf/ft2 (10 kPa) is included across the entire width of the embankment crest.
40 ft 25.5 ft 25.5 ft
1.5 ft 1 ft
Hemb = 17 ft
D = 25 ft
φ‘ = 35 degrees γt = 125 lb/ft3
Soft Clay c = 350 lb/ft2 γt = 90 lb/ft3
Msoil = 25,000 lb/ft2
Dense Sand φ‘ = 37 degrees γt = 130 lb/ft3
GWT
qs = 200 lb/ft2
1 ft = 0.305 m 1 lbf/ft2 = 0.0479 kPa 1 lbf/ft3 = 0.157 kN/m3
Figure 76. Illustration. Example problem—embankment cross section.

78
For this project, a thorough site investigation was conducted, and a customary degree of conservatism was used when the soil strength parameters were selected. Therefore, based on the recommendations in section 6.1.1, the following factors of safety (defined in table 11) were selected for design:
• Fcc = 1.3.
• Fs = 1.5.
• Fo = 1.3.
• Fc = 1.3.
• Fv = 1.3.
• Fe = 1.3.
The maximum allowable settlement of the embankment was 2 inches (51 mm).
7.1.2 Step 2—Establish Representative Subsurface Conditions
The soil material property values to be used in the geotechnical analysis and design of the deep mixed ground are shown in figure 76.
7.1.3 Step 3—Establish Trial Deep Mixed Ground Property Values
The procedure for step 3 is as follows:
1. Assume a value of the 28-day qdm,spec. Typical values range from about 75 to 150 psi (517 to 1,034 kPa) for soft ground conditions. For this example, qdm,spec of 125 psi (862 kPa) is assumed.
2. Determine fc, as shown in figure 77, using estimated t in days between mixing and application of 75 percent of the proposed embankment height. For this example, t equals 60 days, which means that the embankment height will not be above about 13 ft (4 m) until about 60 days after mixing, which is about 1 month after the 28-day strength has been verified. Generally, a significant height of embankment fill will not be placed until after the 28-day strength has been verified.
( ) ( ) 14.1375.060ln187.0375.0ln187.0 =+=+= tfc
Figure 77. Equation. Example problem—curing factor.
3. Determine sdm according to figure 33. An fr equal to 0.8 is used for this example, as shown in figure 78.
221
21 lb/ft8,210psi57.01251.140.8 ==×××== specdm,crdm qffs
1 lbf/ft2 = 0.0479 kPa Figure 78. Equation. Example problem—shear strength of the deep mixed ground.

79
4. Determine fv from table 12. For this example, the estimated Vdm is 0.5, and the estimated pdm is 80 percent. Based on these values, fv is equal to 0.83 for slope stability analyses (factor of safety equals 1.5) and fv is equal to 0.95 when considering the other failure modes (factor of safety equals 1.3) that involve the strength of the deep mixed ground.
5. Determine the Young’s modulus of the deep mixed ground, Edm, according to figure 34 for wet mixing or figure 35 for dry mixing. For this example, it is assumed that wet mixing will be used (see figure 79).
2lb/ft000,400,5psi500,37125300300 ==×== specdm,dm qE 1 lbf/ft2 = 0.0479 kPa
Figure 79. Equation. Example problem—determine Edm according to figure 34.
The unit weights of the deep mixed zones are also necessary for stability analyses. For this example, it is assumed that the unit weights of the deep mixed zones are approximately equal to the unit weight of the soil prior to mixing, as discussed in section 6.1.3.
7.1.4 Step 4—Establish Trial Deep Mixed Geometry
In step 4, a trial geometry of deep mixing to support the embankment is established.
Step 4.1—General Layout and Definitions
For this example, the deep mixed columns were arranged as shown in figure 36. Isolated columns were used under the central portion of the embankment to control settlement, and continuous shear walls composed of overlapping columns oriented perpendicular to the embankment centerline were used under the embankment side slopes to improve stability. Typical values of e/d for shear panels beneath embankment side slopes range from about 0.2 to 0.35, and a minimum value of 0.3 was selected for this example.
Step 4.2—Establish Center Replacement Ratio
Establish a trial value of as,center using figure 44, as shown in figure 80.
194.095.082102
200125173.12, =
××+×
=≥vdm
cccenters fsqFa
Figure 80. Equation. Example problem—area replacement ratio beneath the central portion of the embankment.
Where fv is the variability factor determined in step 3 corresponding to the design value of Fcc = 1.3.
Typical values of as,center for deep mixing support of embankments range from about 0.2 to 0.4. To satisfy figure 44 and stay within the typical range of values, an as,center of 0.2 was selected.

80
Step 4.3—Estimate the Shear Wall Zone Replacement Ratio
Estimate a minimum value of as,shear. Typical values of as,shear for deep mixing support of embankments are greater than or equal to as,center and range from about 0.2 to 0.4. For this example, as,shear equal to 0.25 was selected as a trial value. Calculate β using figure 40 as shown in figure 81.
β = 2 arccos �1 − ed� = 2 arccos(1 − 0.3) = 1.59 radians
Figure 81. Equation. Example problem—chord angle in radians.
Calculate the value of c/sshear using figure 45 based on the selected values of e/d and as,shear, as shown in figure 82.
( )( )
( )( ) 196.0
59.1sin59.159.1sin25.02
sinsin2
=+−π
×=
+−π=
βαβa
sc shears,
shear
Figure 82. Equation. Example problem—ratio of chord length to shear wall spacing.
The minimum and/or maximum trial values of the geometric parameters required for design are summarized in table 17.
Table 17. Example problem—geometric parameters. Parameter Minimum Value Maximum Value
Hdm 25 ft (7.6 m) B 25.5 ft (7.8 m) d 3 ft (0.9 m) 6 ft (1.8 m) e/d 0.3 scenter − d 8 ft (2.4 m) sshear − d 12 ft (3.7 m) as,center 0.2 as,shear 0.25 c/sshear 0.196
Note: These parameters are defined in section 6.1.4. Blank cells indicate that this parameter is not specified.
7.1.5 Step 5—Evaluate Settlement
Evaluate Mcomp using figure 46, as shown figure 83.
( ) 2comp lb/ft000,100,1000,252.01000,400,52.0M =−+×=
1 lbf/ft2 = 0.0479 kPa Figure 83. Equation. Example problem—composite modulus.
Where Msoil is assumed to equal 25,000 lbf/ft2 (1,196 kPa) for this example and can be determined from oedometer tests in practice. Edm was determined in step 3.

81
Calculate Δ Hdm, based on figure 47, as shown in figure 84.
inch63.0ft053.0000,100,1
2001251725 ==+×
==∆comp
dmdm MqHH
1 inch = 25.4 mm
Figure 84. Equation. Example problem—compression of the treated zone.
For this example, it is assumed that the compression of the dense sand is small and takes place as the embankment is constructed. Therefore, the predicted settlement is equal to the 0.63-inch (16-mm) compression of the deep mixed zone, which is less than the allowable settlement of 2 inches (51 mm).
Hemb is greater than 2 times the maximum allowed clear spacing between adjacent columns under the central portion of the embankment (i.e., Hemb > 2(scenter – d) = 2(8) = 16 ft (4.9 m)). Therefore, there is little risk of surface expression of differential settlements occurring at the base of a well-constructed embankment, and special provisions for a load transfer platform at the base of the embankment are not necessary. Nevertheless, if spoils from the DMM operation are available, they could be used to construct the lower portion of the embankment to further reduce any risk of differential surface settlements.
On the embankment side slopes, there is a potential for differential settlement of the embankment surface because Hemb is less than 2 times the maximum allowed clear spacing between shear walls (i.e., Hemb < 2(sshear – d) = 2(12) = 24 ft (7.3 m)). Therefore, it may be necessary to consider settlement control measures such as use of the DMM spoils to create a strong load transfer platform at the base of the embankment beneath the side slopes.
7.1.6 Step 6—Evaluate Stability
In this step, the trial geometry established in step 4 is analyzed for stability.
Step 6.1—Slope Stability
Perform slope stability analyses to determine the critical failure surface and corresponding factor of safety. Determine the composite shear strengths of the deep mixed zones beneath the embankment as calculated in figure 85 and figure 86 and assigned in figure 87.
2lb/ft704,1210,825.083.0 =××== dmshears,vwalldm, safs
1 lbf/ft2 = 0.0479 kPa Figure 85. Equation. Example problem—composite shear strength of the deep mixed zone
beneath the shear walls.
Where fv is the variability factor determined in step 3 corresponding to the design value of Fs = 1.5.

82
sdm,center = max �as,center�1,500 lb ft2⁄ � + �1 − as,center� ssoil, ssoil� = max �0.2 �1,500 lb/ft2� + (1 - 0.2) 350, 350� = 580 lb/ft2
1 lbf/ft2 = 0.0479 kPa
Figure 86. Equation. Example problem—composite shear strength of the deep mixed zone beneath the central portion of the embankment.
Figure 87. Illustration. Slope stability results.
As recommended in section 6.1, Spencer’s method should be used for the slope stability analyses.(87) For this example, only failure surfaces that passed through or below the deep mixed shear wall zone were analyzed. Stability of the 1.5H:1V embankment slopes would have to be improved with geosynthetic reinforcement or some other stabilizing method given the embankment strength parameter values of φ = 35 degrees and c = 0. Relatively steep embankment slopes were selected for this example to illustrate the capability of deep mixing to stabilize a steep embankment on soft clay.
The resulting minimum value of Fs from a comprehensive search for the critical failure surface through and below the deep mixed shear wall was 1.51, which exceeds the design value of 1.5. The critical failure surface for this example, which is shown in figure 87, passes partly through and partly below the deep mixed shear wall zone. For the same embankment configuration on the native soft clay prior to deep mixing, the resulting minimum factor of safety value was 0.77. Thus, a relatively modest amount of deep mixing can create a large improvement in stability for the conditions considered in this example.
Step 6.2—Combined Overturning and Bearing Capacity
1. Select a design value of Fo. For this example, Fo equals 1.3.
2. Determine mobilized shear strength parameter values for each layer of soil beside and beneath the deep mixed shear wall zone using figure 52 and figure 53 for total strength parameters and figure 54 and figure 55 for effective strength parameters.
The shear strength of the soft clay layer is characterized by total stresses, as shown in figure 88 and figure 89.
GWT
Sdm,wall Sdm,wall
Sdm,center
Critical Failure Surface, Fs = 1.51

83
2lb/ft2693.1
350===
om F
cc
1 lbf/ft2 = 0.0479 kPa Figure 88. Equation. Example problem—shear strength of the soft clay using
total normal stresses.
°=°
== 03.10tanarctantanarctan
om F
φφ
Figure 89. Equation. Example problem—mobilized total stress friction angle of the soft clay.
The composite shear strength of the center deep mixed zone is characterized by total stresses, as shown in figure 90.
2lb/ft4463.1
580====
o
centerdm,
om F
sFcc
1 lbf/ft2 = 0.0479 kPa
Figure 90. Equation. Example problem—composite shear strength of the center deep mixed zone using total normal stresses.
The shear strength of the embankment material is characterized by effective stresses, as shown in figure 91 and figure 92.
2lb/ft03.1
0===
om F
c'c'
1 lbf/ft2 = 0.0479 kPa Figure 91. Equation. Example problem—composite shear strength of the embankment
material using effective normal stresses.
°=°
== 3.283.135tanarctan'tanarctan'
om F
φφ
Figure 92. Equation. Example problem—mobilized effective stress friction angle of the embankment material.
The shear strength of the dense sand layer is characterized by effective stresses, as shown in figure 93.
°=°
== 1.303.137tanarctan'tanarctan'
om F
φφ
Figure 93. Equation. Example problem—mobilized effective stress friction angle of the dense sand layer.
3. Calculate values of Pa, ha, Va, Pp, hp, and Vp using the mobilized strength parameter values from step 2.

84
Calculate the active forces based on the mobilized strength parameters of the embankment material and center deep mixed zone, as shown in figure 94 through figure 104.
357.023.2845tan
2'
45tan 22, =
°
−°=
−°= m
embaKφ
Figure 94. Equation. Example problem—effective stress active lateral earth pressure
coefficient.
lb/ft440,617125357.05.05.0 22,, =×××== embembaemba HKP γ
1 lbf/ft = 0.01459 kN/m Figure 95. Equation. Example problem—active force component from embankment.
ft7.303
17253, =+=+= emb
dmembaHHh
1 ft = 0.305 m
Figure 96. Equation. Example problem—vertical distance from overturning point to line of action of active force component from embankment.
lb/ft210,117200357.0,, =××== embsembaqsa HqKP 1 lbf/ft = 0.01459 kN/m
Figure 97. Equation. Example problem—active force component from surcharge.
ft5.332
17252, =+=+= emb
dmqsaHHh
1 ft = 0.305 m
Figure 98. Equation. Example problem—vertical distance from overturning point to line of action of active force component from surcharge.
( ) ( ) lb/ft820,35446217125200252,, =×−×+=−+= membsdmrectclaya cHqHP γ 1 lbf/ft = 0.01459 kN/m
Figure 99. Equation. Example problem—active force component from clay rectangle.
ft5.12225
2,, === dmrectclaya
Hh
1 ft = 0.305 m Figure 100. Equation. Example problem—vertical distance from overturning point to line
of action of active force component from clay rectangle.
lb/ft130,2825905.05.0 22,, =××== dmtriclaya HP γ
1 lbf/ft = 0.01459 kN/m Figure 101. Equation. Example problem—active force component from clay triangle.

85
ft33.8325
3,, === dmtriclaya
Hh
1 ft = 0.305 m Figure 102. Equation. Example problem—vertical distance from overturning point to line
of action of active force component from clay triangle.
lb/ft600,71130,28820,35210,1440,6,,,,,, =+++=+++= triclayarectclayaqsaembaa PPPPP 1 lbf/ft = 0.01459 kN/m
Figure 103. Equation. Example problem—total active force.
a
triclayatriclayarectclayarectclayaqsaqsaembaembaa P
PhPhPhPhh ,,,,,,,,,,,, +++
=
ft85.12600,71
130,2833.8820,355.12210,15.33440,67.30=
×+×+×+×=
1 ft = 0.305 m
Figure 104. Equation. Example problem—vertical distance between overturning point and total active force.
Calculate the side shear forces based on the mobilized strength parameters of the soft clay layer, as shown in figure 105 and figure 106.
lb/ft730,625269 =×== dmma HcV 1 lbf/ft = 0.01459 kN/m
Figure 105. Equation. Example problem—active side shear force from the soft clay.
lb/ft730,625269 =×== dmmp HcV 1 lbf/ft = 0.01459 kN/m
Figure 106. Equation. Example problem—passive side shear force from the soft clay.
Calculate the passive forces based on the mobilized strength parameters of the soft clay layer, as shown in figure 107 through figure 112.
( ) ( ) lb/ft450,132692252,, =×== mdmrectclayp cHP 1 lbf/ft = 0.01459 kN/m
Figure 107. Equation. Example problem—passive lateral force component from the clay rectangle.
ft5.12225
2,, === dmrectclayp
HH
1 ft = 0.305 m
Figure 108. Equation. Example problem—vertical distance from overturning point to line of action of passive force component from the clay rectangle.

86
lb/ft130,2825905.05.0 22,, =××== dmtriclayp HP γ
1 lbf/ft = 0.01459 kN/m Figure 109. Equation. Example problem—passive lateral earth force component from the
clay triangle.
ft33.8325
3,, === dmtriclayp
HH
1 ft = 0.305 m
Figure 110. Equation. Example problem—vertical distance from the overturning point to the line of action of passive force component from clay triangle.
lb/ft580,41130,28450,13,,,, =+=+= triclayprectclaypp PPP 1 lbf/ft = 0.01459 kN/m
Figure 111. Equation. Example problem—total passive lateral earth force.
p
triclayptriclayprectclayprectclaypp P
PHPHH ,,,,,,,, +
= ft68.9580,41
130,2833.8450,135.12=
×+×=
1 ft = 0.305 m
Figure 112. Equation. Example problem—vertical distance between the overturning point and the total passive force.
4. Determine the resultant force N using figure 56. Determine W and the location of xW, as shown in figure 113 through figure 119.
lb/ft090,27171255.255.05.0 =×××== embemb HBW γ 1 lbf/ft = 0.01459 kN/m
Figure 113. Equation. Example problem—weight of the embankment.
ft173
5.2523
2=
×==
Bxemb
1 ft = 0.305 m Figure 114. Equation. Example problem—location of the resultant of the embankment
weight.
lb/ft380,5725905.25 =××== dmdm HBW γ 1 lbf/ft = 0.01459 kN/m
Figure 115. Equation. Example problem—weight of the deep mixed zone.
ft75.122
5.252
===Bxdm
1 ft = 0.305 m
Figure 116. Equation. Example problem—location of the resultant of the deep mixed zone.

87
lb/ft470,84380,57090,27 =+=+= dmemb WWW 1 lbf/ft = 0.01459 kN/m
Figure 117. Equation. Example problem—total weight.
ft11.14470,84
380,5775.12090,2717=
×+×=
+×=
WWxWx
x dmdmembembW
1 ft = 0.305 m
Figure 118. Equation. Example problem—location of the resultant of the total weight.
lb/ft470,84730,6730,6470,84 =−+=−+= pa VVWN 1 lbf/ft = 0.01459 kN/m
Figure 119. Equation. Example problem—resultant total vertical force.
The shear strength of the soil beneath the base of the deep mixed zone is characterized by effective normal stresses. Calculate N' using figure 57. Determine U and xU, as shown in figure 120 through figure 122.
lb/ft000,355.254.622222 =××== BU wγ 1 lbf/ft = 0.01459 kN/m
Figure 120. Equation. Example problem—water force acting on the base of the deep mixed zone.
ft75.122
5.252
===BxU
1 ft = 0.305 m
Figure 121. Equation. Example problem—location of water force acting on the base of the deep mixed zone.
b/ft470,49000,35470,84' l=−=−= UNN 1 lbf/ft = 0.01459 kN/m
Figure 122. Equation. Example problem—resultant effective vertical force.
5. Determine xN using figure 58, as shown in figure 123.
NhPBVWxhP
x aaaWppN
−++= ft01.10
470,8485.12600,715.25730,611.14470,8468.9580,41
=×−×+×+×
=
1 ft = 0.305 m Figure 123. Equation. Example problem—location of total resultant force acting on
the base of the deep mixed zone.
The shear strength of the soil beneath the base of the deep mixed zone is characterized by effective normal stresses. Calculate xN’ using figure 59, as shown in figure 124.

88
ft07.8470,49
75.12000,3501.10470,84'' =
×−×=
−=
NUxNxx UN
N
1 ft = 0.305 m Figure 124. Equation. Example problem—location of the effective resultant force acting on
the base of the deep mixed zone.
6. The shear stress of the soil beneath the deep mixed shear walls is characterized by effective normal stresses. Calculate qtoe using figure 61, as shown in figure 125 and figure 126.
3'BxN ≤
, ft 5.8
35.25ft 07.8 =<
1 ft = 0.305 m
Figure 125. Equation. Example problem—Position of resultant within the base.
3for 11
32'
',,'
Bxaax
BBNq N
shearsshearsNtoe ≤
+−= 2lb/ft500,10 1
25.01
25.007.835.252
5.25470,49
=
+−
×××
=
1 lbf/ft2 = 0.0479 kPa Figure 126. Equation. Example problem—bearing pressure at the toe of the deep mixed
shear walls.
7. The shear strength of the soil beneath the deep mixed shear walls is characterized by effective normal stresses. Determine qall using figure 64, as shown in figure 127.
221
all lb/ft400,186.188777.227.26.674.300q =×+×××+×= 1 lbf/ft2 = 0.0479 kPa
Figure 127. Equation. Example problem—allowable bearing pressure at the toe of the deep mixed shear walls.
The value of qtoe = 10,500 lbf/ft2 (502 kPa) is less than the value of qall = 18,400 lb/ft2 (880 kPa). Therefore, the design is sufficient to prevent combined overturning and bearing capacity failure of the deep mixed shear walls.
Step 6.3—Crushing of the Deep Mixed Shear Walls at the Outside Toe
The deep mixed ground overlies a hard bearing stratum. Therefore, the design is checked against crushing of the deep mixed ground at the toe of the shear walls.
Because the factor of safety Fo is equal to Fc, use the intermediate values from step 6.2 in the current step, where qtoe = 10,500 lbf/ft2 (503 kPa) and φ ‘m = 30.1 degrees.
The shear strength of the soil beneath the deep mixed ground is characterized by effective normal stresses. Use figure 67 to calculate the at-rest σ’h, as shown in figure 128 through figure 130.

89
K0 = 1 – sinφ ‘m = 1 – sin(30.1°) = 0.499 Figure 128. Equation. Example problem—at-rest lateral earth pressure coefficient.
σ’v = (90)3 + (90 – 62.4)22 = 877 lb/ft2 1 lbf/ft2 = 0.0479 kPa
Figure 129. Equation. Example problem—effective vertical stress.
2v0h lb/ft437877499.0'K' =×=σ=σ
1 lbf/ft2 = 0.0479 kPa Figure 130. Equation. Example problem—at-rest effective lateral earth pressure.
Determine qall based on figure 65, as shown in figure 131.
2lb/ft400,124373.1
95.0210,82'2=+
××=+= h
c
vdmall F
fsq σ
1 lbf/ft2 = 0.0479 kPa Figure 131. Equation. Example problem—allowable bearing capacity of deep mixed
ground.
Where fv is the variability factor determined in step 3 corresponding to the design value of Fc = 1.3.
The value of qtoe = 10,500 lb/ft2 (502 kPa) is less than qall = 12,400 lb/ft2 (593 kPa). Therefore, the design is sufficient to prevent crushing of the deep mixed ground at the toe of the shear walls.
Step 6.4—Shearing on Vertical Planes in the Deep Mixed Shear Walls
1. Determine the values of Vp, N, and xN corresponding to Fv. Because the factor of safety Fo is equal to Fc, the following intermediate values from step 6.2 were used in the current step:
• Vp = 6,730 lb/ft (98 kN/m).
• N = 84,470 lb/ft (1231.9 kN/m).
• xN = 10.01 ft (3.0 m).
2. Compute τ v on the critical vertical plane in the deep mixed zone using figure 69, as shown in figure 132 through figure 133.
23B BxN ≤≤ , 75.12
25.2501.105.8
325.5
=<<=
Figure 132. Equation. Example problem—location of the force resultant along the base of the deep mixed zone.

90
−+=
Bx
HN
HV N
dmdm
pv
21
43τ 2lb/ft814
5.2501.1021
254470,843
25730,6
=
×
−×
×+=
1 lbf/ft2 = 0.0479 kPa
Figure 133. Equation. Example problem—average vertical shear stress on the critical vertical plane.
3. Compute τ v,all in the deep mixed zone using figure 70, as shown in figure 134.
( ) ( ) 2, lb/ft180,1
3.1210,8196.095.0
===v
dmshearvallv F
sscfτ
1 lbf/ft2 = 0.0479 kPa
Figure 134. Equation. Example problem—allowable vertical shear stress in the deep mixed zone.
Where fv is the variability factor determined in step 3 corresponding to the design value of Fv = 1.3.
The value of τ v = 814 lb/ft2 (39 kPa) is less than τ v,all = 1,180 lb/ft2 (56 kPa). Therefore, the design is sufficient to prevent shearing on vertical planes in the deep mixed shear wall.
Step 6.5—Extrusion of Soil between the Deep Mixed Shear Walls
Check sshear – d using figure 71 to assure that extrusion of the soft clay could not occur between shear walls, as shown in figure 135. For this example, the procedure is illustrated using the extrusion of the entire thickness of the soft clay.
( ) ft6.19
251
5.2512
3502125,1450,33.1
1=
−
−
×−
≤− dsshear
1 ft = 0.305 m
Figure 135. Equation. Example problem—maximum clear spacing between shear columns.
Therefore, the allowable maximum clear spacing of 12 ft (3.7 m) between shear wall columns established in step 4 is adequate to prevent extrusion of the soft clay because it is less than the value of 19.6 ft (6.0 m) calculated using figure 135.
7.1.7 Step 7—Prepare Plans and Specifications
Incorporate the final design parameters, including qdm,spec = 125 psi (862 kPa) and the geometric parameters listed in table 17, in the project plans and specifications.
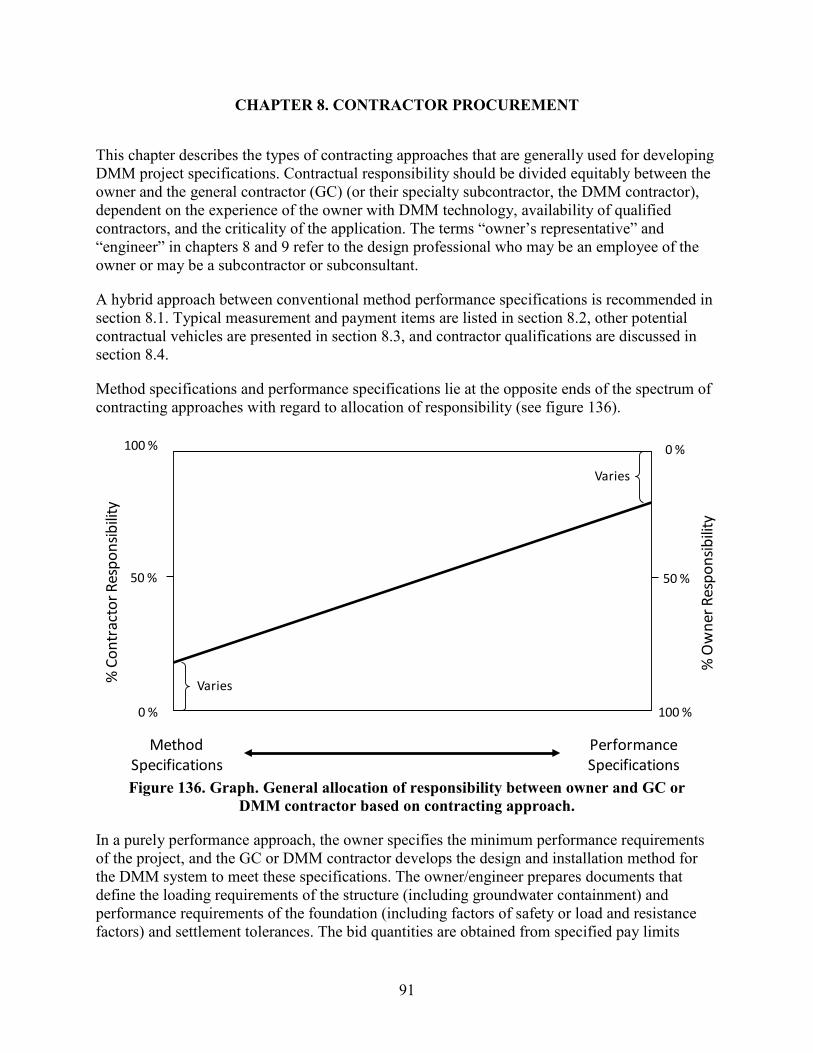
91
CHAPTER 8. CONTRACTOR PROCUREMENT
This chapter describes the types of contracting approaches that are generally used for developing DMM project specifications. Contractual responsibility should be divided equitably between the owner and the general contractor (GC) (or their specialty subcontractor, the DMM contractor), dependent on the experience of the owner with DMM technology, availability of qualified contractors, and the criticality of the application. The terms “owner’s representative” and “engineer” in chapters 8 and 9 refer to the design professional who may be an employee of the owner or may be a subcontractor or subconsultant.
A hybrid approach between conventional method performance specifications is recommended in section 8.1. Typical measurement and payment items are listed in section 8.2, other potential contractual vehicles are presented in section 8.3, and contractor qualifications are discussed in section 8.4.
Method specifications and performance specifications lie at the opposite ends of the spectrum of contracting approaches with regard to allocation of responsibility (see figure 136).
0 %
100 % 0 %
100 %
% C
ontr
acto
r Res
pons
ibilit
y
MethodSpecifications
50 %
% O
wne
r Res
pons
ibilit
y
50 %
Varies
Varies
PerformanceSpecifications
Figure 136. Graph. General allocation of responsibility between owner and GC or DMM contractor based on contracting approach.
In a purely performance approach, the owner specifies the minimum performance requirements of the project, and the GC or DMM contractor develops the design and installation method for the DMM system to meet these specifications. The owner/engineer prepares documents that define the loading requirements of the structure (including groundwater containment) and performance requirements of the foundation (including factors of safety or load and resistance factors) and settlement tolerances. The bid quantities are obtained from specified pay limits

92
noted on the plans, although the contractor determines the amount, arrangement, and properties of the deep mixed ground necessary to satisfy the performance requirements. The owner/ engineer identifies the basis for detailed designs through calculations and working drawings in a special provision. The special provision must clearly identify the required submittals and schedule to be prepared by the GC including construction control and monitoring. These submittals must be reviewed and approved by the owner/engineer
In a purely method approach, the owner/engineer performs the design and specifies the scope of work, installation, and QC/QA requirements of the DMM system. The owner/engineer develops a detailed set of plans and specifications, which are incorporated into the project bidding documents. The equipment, materials, and installation techniques for the DMM are prescribed to meet the embankment or structure foundation support requirements. In this approach, the contractor is not responsible for performance of the DMM system or any of its components. For example, in a purely method approach, the DMM contractor is not responsible for the strength of the deep mixed ground. During the bidding process, GCs develop a firm price proposal based on the owner’s detailed plans and specifications.
Regardless of the approach used, the owner must have in-house engineers or consultants experienced in DMM design and construction to review these bids and submittals.
8.1 RECOMMENDED CONTRACTING APPROACH
The most appropriate approach is one that equitably distributes the responsibilities and risks between the owner and contractor. For deep mixing projects, the recommended approach is a hybrid or combination method in which the owner performs the overall design but relies on the contractor to define the means for achieving the required deep mixed material strength. As in a method approach, the owner conducts the design of the deep mixed embankment or foundation support in accordance with the procedure outlined in chapter 6 and specifies the strength of the deep mixed ground and the layout and geometry of the deep mixed elements, as outlined in table 16. Similar to a performance approach, the contractor proposes the means, materials, and methods to construct a DMM foundation that meets the requirements of the design. This approach is used with a design-bid-build contract. Typical allocation of responsibilities of the owner and contractor for DMM work is outlined in table 18.

93
Table 18. Typical allocation of responsibilities of owner and contractor for DMM work. Item Responsibility
Scope of work Owner/engineer Structure loads Owner/engineer Performance criteria Owner/engineer DMM foundation design (DMM column/element diameter, depth, layout, and engineering properties)
Owner/engineer
Connection details, if any, between structure and DMM foundation
Owner/engineer
Special design considerations (scour, liquefaction potential, etc.)
Owner/engineer
DMM mix design (binder materials, additives, and proportions)
Contractor
Minimum QC/QA requirements, including process monitoring, sampling, testing, and documenting
Owner/engineer
QC/QA implementation planning details for review by owner
Contractor
QC/QA execution Contractor and owner/engineer
Instrumentation and monitoring requirements (if any)
Owner/engineer and/or contractor
Implementation details for instrumentation and monitoring (if any)
Owner/engineer and/or contractor
Typically, the owner provides the following project-specific information in the bidding documents:
• Geotechnical reports and data, including results from all precontract testing.
• DMM design parameters, including geometry, strength, modulus, and permeability, as appropriate.
• Existing utility plans.
• Site limitations, including information about access limitations, right-of-way, scour potential, liquefaction potential, noise requirements, vibration requirements, and potential for hazardous or contaminated materials.
• Requirements for DMM contractor qualifications.
• Minimum and maximum values of geometry and layout of DMM elements.
• Requirements for DMM contractor working drawings and submittals, including schedule and information on penalties.

94
• Material specifications.
• Testing requirements.
• Instrumentation requirements (if any).
• DMM acceptance criteria.
• Method of measurement and payment.
After the contract is awarded, the DMM contractor prepares and provides the following submittals to the owner via the GC (construction begins after the owner reviews and approves these submittals):
• Evidence of DMM contractor qualifications.
• Plan and results of preproduction laboratory and/or field tests conducted by the GC or DMM contractor.
• DMM program plan demonstrating compliance with the project specifications, including working drawings and descriptions of binder storage and mixing equipment, DMM equipment, materials, methods to be used, and supporting calculations. The plan should include proposed mix design details and drawings showing the center coordinates, size, bottom elevation, and top elevation of every DMM element, which should each be uniquely numbered.
• QC/QA plan demonstrating compliance with the project specifications, including binder and mixing parameters to be controlled and monitored, sampling methods, sampling depths, sampling frequency, testing frequency, testing methods, and documentation.
Provided effective specifications are developed and qualified contractors are used, there are advantages to both the owner and the contractor in this hybrid approach. The owner obtains detailed knowledge of the project and its requirements by reviewing technical alternatives, completing the detailed design, and developing the specifications. The owner is therefore able to evaluate the bids effectively because all of the contractors propose solutions based on the same overall design. Being more familiar with the production and capabilities of their mixing systems, the DMM contractors have the flexibility to use their expertise to propose a system of equipment, mix design, and operation procedure capable of constructing a DMM foundation that complies with the owner’s design. As a result, the owner likely receives a more cost effective solution.
In the hybrid approach, more of the risk is transferred to the contractor, who is more familiar with his/her own methods and techniques than the owner. This contrasts with a method approach in which the owner accepts responsibility for the design and performance of the DMM product, provided the elements are constructed in accordance with the plans and specifications. Additionally, any changes to the design that are required after encountering actual field conditions during construction are also the owner’s responsibility.

95
8.2 MEASUREMENT AND PAYMENT
Suggested pay items are outlined in table 19. In general, measurement and payment may be made on a lump sum basis if the number and depth of DMM elements are fully detailed by the owner. Including add/deduct unit costs (per foot (meter)) is suggested to accommodate increases or decreases to the specified quantities (numbers of elements and/or depths) without requiring contract revisions. The same approach may be used for QC/QA testing, where a fully defined testing program may be bid as a lump sum item with additional/omitted individual tests being added/deducted on a per-test basis. Measurement and payment of DMM work using the hybrid approach is typically made on a lump sum basis.
Table 19. Suggested pay items and units of measure for DMM contract items.
Item Unit of
Measurement Mobilization/demobilization Lump sum Bench-scale testing and field validation program Lump sum
DMM production works (DMM columns/elements including working platform)
Production DMM works (defined by owner, see table 16)
Lump sum
Add/deduct individual elements yd3 (m3) Add/deduct overlapping column/elements for buttresses, cells or walls
yd3 (m3)
Add/deduct mass stabilization yd3 (m3)
QC/QA monitoring, testing, and documenting (including those tests required for the preproduction test program)
QC/QA program (minimum requirements defined by owner)
Lump sum
Add/deduct coring ft (m) Add/deduct unconfined compression testing of cores
Per each
Add/deduct unconfined compression testing of wet samples (includes collection of sample and forming cylinder)
Per each
Add/deduct permeability testing Per each Instrumentation and monitoring Lump sum
8.3 OTHER PROCUREMENT METHODS
Performance specifications may be used dependent on the level of experience of the owner with DMM technology, the availability of qualified contractors, and the criticality of the application. Purely method specifications are virtually never used for DMM projects. Other types of procurement methods may also be used as appropriate. The procurement approach should be selected based on consideration of both price and technical proposal. Design-build contracts are used with purely performance specifications.
A best value approach to contractor procurement may have advantages on projects that are technically challenging or involve relatively greater risk, where success may be more dependent on the technical approach than on price. A best value approach involves the contractors submitting separate price and technical proposals, which are reviewed independently and scored

96
proportionately (price proposal = a portion of x points, where x is a positive number less than 100, and technical proposal = a portion of 100 − x points). The scoring allocation (x) is defined based on the relative importance of price and technical approach. The contract is awarded to the bidder with the highest combined score.
Financial incentives may be used on projects with tight schedules. Typically, the owner is responsible for establishing the overall project schedule, and the GC is responsible for establishing and achieving interim milestones that lead to achieving the overall project schedule. An incentive for the GC to accelerate production may involve a monetary bonus for certain quantities of the production work completed by milestone dates. Conversely, disincentives such as liquidated damages may be levied if the GC misses clearly defined interim and final schedule milestones. Other disincentives may be included that discourage poor quality such as payment at a reduced rate for QC/QA results that do not meet specified requirements.
ECI methods are attractive due to the contractor-driven nature of DMM work. ECI methods involve the owner’s solicitation of technical input from qualified contractors for use in developing the project solution. All contractors involved in the ECI process for a project should be able to submit a bid of the project; that is, contractors involved in the ECI process should not be precluded from bidding. ECI provides the owner with a contractor’s perspective on constructability, sequencing, and other project construction challenges. ECI has been used successfully on the U.S. Army Corps of Engineers (USACE) Tuttle Creek Dam project and the LPV 111 earthen levee project.(123,124)
Value engineering proposals are submitted by the GC after contract award and contain price proposals for alternative foundation designs that meet the specified requirements at a significant cost savings. After contract award, with concurrence from the owner, the contractor redesigns the project and submits revised working drawings and design calculations that demonstrate that the proposed solution meets the intent of the design as outlined in the original specifications at a lower price. The engineering costs for the GC’s redesign work are included in the revised price proposal for the foundation work. Often, the owner and GC divide the cost savings in mutually agreed proportions.
8.4 CONTRACTOR QUALIFICATIONS
Selecting an experienced and qualified DMM contactor is critical to the success of a project because the quality of the DMM material depends on an understanding of the ground conditions and the use of specialized equipment, techniques, and workmanship. Contractor prequalification, although prohibited in some States, is acceptable and reasonable for DMM projects because it assists GCs in identifying subcontractors who have the expertise required for the project. On projects located in areas where prequalification is prohibited, the use of the best value approach, which includes both price and technical proposals, may be advantageous to ensure that the technical approach selected is sound and reliable.

97
Regardless of whether pre-qualification of contractors is used on a project, requirements of the technical qualification of the DMM contractor and his/her staff must be established. The following personnel are typically involved in a DMM project:
• The project manager is the contractor representative responsible for the overall direction of the DMM project including site operations, technical acceptability, project billing, and reporting. The project engineer and the project superintendent ordinarily report to the project manager.
• The project engineer is responsible for supervising the QC technicians’ work, providing technical support to the QC technicians, and reviewing production records and QC/QA data to ensure the quality of the DMM work.
• The project superintendent oversees construction operations, equipment, and material supply; collects and compiles daily production reports; and ensures QC activities are conducted in accordance with project requirements. The project superintendent and the project engineer may work together on QC activities and documentation.
• The DMM equipment operator is responsible for operating the equipment during construction.
• On large, complex, or critical deep mixing projects, the contractor or the owner (sometimes both) employs a deep mixing specialist or a review board to provide advice, review, and assistance with dispute resolution.
Contract documents for DMM work should clearly define contractor qualification requirements, submittal procedures for the qualification documentation, and means by which the owner will enforce the requirements. The following minimum requirements (and associated documentation) for the DMM contractor are recommended:
• The DMM contractor must have previous successful experience with DMM projects for soil conditions and project scope similar to that of the project being bid (contractor provides project description(s) and reference list).
• The DMM contractor must assign a project manager who has had significant experience on at least five DMM projects (contractor provides the number of years/projects, project description(s), and reference list).
• The DMM contractor must assign a project engineer to supervise the technical engineering and quality aspects of the DMM work. The project engineer must have had significant experience on at least five DMM projects (contractor provides the number of years/projects, project description(s), and reference list). For a design-build project, the DMM contractor must assign a professional engineer who is registered in the jurisdiction in which the project is located to supervise the design and preparation of the drawings and to review QC/QA records and as-built drawings to confirm that the DMM work meets the design intent.

98
• The DMM contractor must assign a full-time project superintendent with at least five projects and at least 130,000 yd3 (100,000 m3) of total treatment volume in DMM construction (contractor provides the number of years/projects, project description(s), and reference list).
• The DMM contractor must provide at least one DMM equipment operator with at least 1 year of experience with the equipment and DMM construction (contractor provides the number of years/projects, project description(s), and reference list).
The GC must provide a written request and supporting documentation for substitutes of these key personnel prior to making any personnel changes. Documentation must include evidence that the substitute meets the qualification requirements listed in the specifications. Substitutions may not be made without written approval from the owner.

99
CHAPTER 9. SPECIFICATIONS, PLANS, AND CONTRACTOR SUBMITTALS
Regardless of the contracting approach selected, the quality of the project documents, including specifications, plans, and contractor submittals, is critical to promoting understanding and aligned expectations among the contracted parties. The contract specifications and plans must include sufficient detail in order for the contractor to understand the design intent to allow for fair and complete bidding. Contractor submittals must thoroughly and clearly explain the procedures to be used to produce deep mixed foundations that meet the design intent.
9.1 SPECIFICATIONS
Use of a combination of performance and method specifications is recommended for DMM projects, as outlined in chapter 8. Guide specifications are provided appendix C of this report. Clear guidance is provided on the parameters that should be specified by the engineer and those that should be selected by the contractor such that responsibility is appropriately allocated at the start of the project and contractual exposure and potential for miscommunication for all parties as the project progresses are reduced. A qualified contractor must be selected for DMM projects (contractor qualifications are discussed in chapter 8).
The guide specifications outline the intended content of the specifications for a DMM project. However, it is essential that specific project requirements be considered to convert these guide specifications to contract documents that are appropriate for a particular project.
Part 1 of the specifications outlines the scope, references, definitions of terms, project description and requirements, contractor qualifications, available information, site survey, submittals, and preconstruction meeting. Terminology in chapter 2 of this manual is used throughout the specification to avoid confusion and encourage consistency of understanding between all contracting parties.
The quality of the information provided is critical to the success of any foundation project. All subsurface data, utility plans, and structure requirements must be outlined clearly to promote understanding. Deep mixing design criteria are typically outlined in a separate design report that is included with the contract documents. The subsurface conditions expected can significantly impact the contractor’s choice of equipment, methods, materials, bidding process, and contract administration. The owner must include with the contract documents all subsurface information available and results of all preconstruction testing conducted by the owner to support the design. Bench-scale and field validation testing are discussed in chapter 10.
Table 16 summarizes the geometric parameters that the owner/engineer should specify. By specifying only the minimum and/or maximum allowed values for certain geometric parameters, the owner/engineer is affording the contractor flexibility in construction while still assuring that the final design will satisfy the requirements for performance.
Layouts and sizes of deep mixing elements that adhere to the minimum and maximum values listed in table 16 will be deemed acceptable to meet the requirements of the owner’s design, and additional design calculations will not be required. If layouts and element sizes do not adhere to
100
these requirements, design calculations must be prepared and stamped by a registered professional engineer retained by the contractor and submitted to the owner/engineer for approval after the contract is awarded. However, the owner/engineer is under no obligation to accept alternate designs in a design-bid-build contract.
Part 2 of the specifications includes provisions for materials and equipment, including requirements for binder material handling and storage and mixing equipment. These provisions generally allow the contractor flexibility in selecting appropriate techniques and materials. However, the owner/engineer may specify the minimum capacity of the binder handling and deep mixing equipment and the minimum requirements of the monitoring equipment and materials handling and mixing procedures. By specifying such minimums, the contractor is not relieved from satisfying the specified requirements for the project schedule or the end product in a hybrid specification. In addition, the owner/engineer may outline methods and materials that are not permitted, if any.
Part 3 of the specifications outlines provisions for testing, preparing binders, locating DMM elements, mixing, and QC/QA sampling, testing, acceptance, and documentation. A suggested level of detail of execution provisions is provided, although the engineer is reminded to consider project-specific requirements when developing the specifications. Detailed QC/QA requirements are discussed in chapter 12.
Procedures to be used if obstructions are encountered and standby time is incurred must be clearly detailed. It is not always practical for the contractor to maintain production by moving to a different section of the site and continuing mixing while an obstruction is being investigated.
Specifications for accepting DMM materials are often based on unconfined compressive strength. On several past projects, the minimum required strength has driven a very conservative mix design such that the average strength of the treated ground is many times greater than the design strength. This situation can produce higher than necessary construction costs, which may lead to collateral problems and contract disputes. Acceptance criteria that do not include a minimum strength requirement are preferred, as outlined in chapter 12. It is recommended that criteria allow a specified percentage of test results to be below specified strength values. Strength values that properly reflect material variability can provide the owner/engineer with sufficient assurance that the design intent is being met, provided that such variability is incorporated in the design process, as described in chapter 6.
Specifications must accurately detail consequences of failure to meet the requirements.
9.2 PLANS
Project plans must be detailed to illustrate the layout of the proposed embankment or structure and the limits of the DMM foundation to be constructed. The engineer is encouraged to specify only the minimum and/or maximum allowed values for certain geometric parameters, as outlined in chapter 6, to permit the DMM contractor flexibility in construction while still assuring that the final design will satisfy the requirements for settlement and stability.

101
Plans should be drawn to scale and depict the following items, at a minimum:
• Utilities (above and below grade).
• Adjacent structures (i.e., buildings, culverts, abutments, etc.).
• Right-of-way.
• Roadway elevations and stationing.
• Embankment dimensions and positioning.
• Limits of DMM foundation.
• Boring locations.
If a specific arrangement of the deep mixed elements (i.e., diameter and spacing of isolated columns and similar details of shear walls) has been specified, then typical plans and elevations of the deep mixing improvement should be provided. However, if minimums and maximums like those in table 16 are provided instead, then example plans and elevations should be provided. They should be clearly labeled as examples, and reference should be made to the controlling minimum and maximum values. In either case, any required details and special arrangements at transitions, terminations, and connections should also be shown in the plans.
9.3 CONTRACTOR SUBMITTALS
9.3.1 Contractor Experience Profile
Experience of the contractor and specific project personnel must meet the requirements outlined in chapter 8. Any changes in approved site personnel must be approved in writing by the owner/engineer prior to substitution.
9.3.2 Bench-Scale Testing Results
The contractor must submit results from all bench-scale tests conducted. The report should provide all data collected, including (at a minimum) descriptions of sampling techniques used, boring logs, classifications of all major soil strata to be mixed, site groundwater conditions, binder materials used, mixed design proportions, laboratory mixing techniques used, and curing curves for unconfined compressive strength versus time for each major soil type. Discussion of the test results should be provided, including proposed mix designs for use in the field.
9.3.3 Field Validation Program Plan
This plan contains descriptions of the construction procedures, equipment, and ancillary equipment to be used for mixing and binder proportioning and injection, mix design parameters and associated soil strata to be evaluated, operational and material parameters to be monitored during field validation, layout of the DMM elements to be constructed, and summary of QC/QA

102
samples to be collected and tested. Examples of the forms that will be used to document the work are also provided.
9.3.4 Deep Mixing Work Plan
Based on the results of the bench-scale and field validation programs, at least 30 days prior to the start of deep mixing work, the contractor must submit a deep mixing work plan for review and approval. The deep mixing work plan must include the following items:
• Detailed descriptions of sequence of construction and all construction procedures, equipment (catalog cut sheets), and ancillary equipment to be used to penetrate the ground, proportion and mix binders, and inject and mix the site soils.
• Proposed mix design(s), including binder types, additives, fillers, reagents, and their relative proportions, and the required mixing time, water-to-binder ratio of the slurry (for wet mixing), binder factor (for dry mixing and wet mixing), and volume ratio (for wet mixing) for a deep mixed element.
• Proposed injection and mixing parameters, including mixing slurry rates, slurry pumping rates, air injection pressure, volume flow rates, mixing tool rotational speeds, and penetration and withdrawal rates.
• Methods for controlling and recording the verticality and the top and bottom elevation of each element.
• Necessary procedure and measurements to confirm the end-bearing when DMM elements are required to penetrate into a bearing layer.
• Working drawings and calculations that show the site location of the DMM project as well as the dimensions, layout, and locations of all DMM elements. Drawings should indicate the identification number of every element if a multishaft mixing tool is used and every column if a single-auger mixing tool is used. Calculations and drawings should demonstrate that the element layout, depth, and quantity meet the specification requirements. For a design-build project, the design calculations should be performed by a professional engineer registered in the jurisdiction in which the project is located. He/she should also prepare, stamp, and sign the drawings.
• DMM schedule information (e.g., preloading or phasing schedule).
• Sample daily production report, including the items described in section 9.3.6.
• Details of all means and methods proposed for QC/QA activities, including surveying, process monitoring, sampling, testing, documenting, and meeting schedule milestones.
• Names of any subcontractors used for QC/QA activities. An independent laboratory must be used for QC/QA testing and must be approved by the owner/engineer.

103
9.3.5 Material Certifications
Certificates of compliance must be submitted as proof of conformance to materials standards and requirements for each truck load of binder, admixtures, and steel, as needed.
9.3.6 Production Records
By the end of the next business day following each deep mixing shift, the contractor should submit a daily production report in the approved format. The report should be completed and signed by the contractor’s project superintendent and include the following information:
• Project name.
• Day, month, year, and time of work shift (beginning and end).
• Name of field superintendent in charge of work for the contractor.
• Deep mixing equipment (rig number) in operation during the shift and specific activities conducted by said equipment.
• Type of mixing tool.
• Treatment zone and reference drawing number.
• Elevation of top and bottom of treatment zone.
• Element number, diameter, and location coordinates.
• Date and time (start and finish) of element.
• A record of the location of each completed column/element installed during the work shift and all zones completed to date on a plan of suitable scale to clearly show the location of the elements. Frequently, the owner/engineer will specify this scale at about 1 inch = 10 ft or about 1 inch = 20 ft, depending on the size of the elements and the amount of detail necessary.
• Mix design (not applicable for dry mixing).
• Slurry specific gravity measurements (not applicable for dry mixing).
• Binder injection rate (gal/min (L/min)) plotted at each 3-ft (1-m) depth interval for the full depth of the treated zone. Variations in volumes should be noted (not applicable for TRD).
• Mixing tool rotation speed in revolutions per minute versus depth.
• Penetration/withdrawal rates of mixing tool in ft/min (m/min) plotted at each 3-ft (1-m) depth interval (not applicable for TRD).

104
• Element verticality measurements.
• Plots of BRN and binder factor versus depth for each element plotted at least every 3 ft (1 m) of depth. Total number of rotations should be reported for CSM (not applicable for TRD).
• For TRD, the vertical and horizontal rates of cutter chain travel should be reported along with the slurry injection rate. From these data, the average binder factor as a function of position can be calculated and reported.
• A description of obstructions, interruptions of binder injections, or other difficulties during installation and their resolution.
• Other pertinent observations, including but not limited to binder escapes, ground settlement or heave, collapses of the treatment zone, and any unusual behavior of any equipment during the deep mixing process.
• Collection date, time, plan location, elevation, and identification numbers of all deep mixed samples including unsuccessful attempts to retrieve samples for both wet-grab samples and coring.
• Coring method, equipment, and personnel; recovery percentage and percent of run length that is treated for each core run; sample collection, handling, and storage details; and name of person responsible for logging and collecting cores and samples to be tested.
• Quantities of all binder materials delivered to site, plus a reconciliation showing amount actually injected.
• Summary of any downtime or other unproductive time, including time, duration, and reason.
• Detailed results of all testing.
Binder factor (weight of dry binder per cubic meter of untreated soil) of each column (single axial mixing tool) or element (multiple axial mixing tool) may be calculated from the measured and recorded values. These reduced data could be required in the daily production report as additional construction parameters.
The comprehensiveness of information submitted by the contractor on a daily basis is critical to ensuring accurate tracking of production and quality. Prior to production, the owner should review the list of information to be provided daily by the contractor to ensure adequate information will be required to assure the quality of the foundation construction. Generating past data may be impossible or can lead to errors or omissions.
9.3.7 QC/QA Records
Data from calibrated instruments must be submitted for all measurement devices used for binder production, deep mixing operational monitoring, and laboratory testing. Within 3 business days

105
of completing any QC/QA monitoring and testing, the contractor should submit the results, including original data sheets from the laboratory and an evaluation of the compliance of the test results with project acceptance criteria. Instruments used for monitoring and testing should be calibrated at the beginning of the project and repeated every 3 months. Access to monitoring equipment should be made available to the owner/engineer.
9.3.8 As-Built Field Measurement Data
After completing the project (or a phase of the project, depending on project size and layout, but not less than every 2 weeks), the contractor must submit as-built field measurement data indicating surveyed as-built plan locations of each DMM element, including element center (per site-specific coordinates), column dimensions and verticality, and top and bottom elevation of each element to the accuracy required by the project specifications.


107
CHAPTER 10. BENCH-SCALE TESTING AND FIELD VALIDATION PROGRAM
Preconstruction testing programs, including both bench-scale and field validation (full-scale testing), are critical to the successful design and construction of DMM projects. The engineering properties of soils treated with DMM are dependent on a variety of factors, such as the original soil characteristics (type, water content, organic content, etc.), non-uniformity of the soil deposit, mix design, curing conditions, loading conditions, and mixing energy. Bench-scale testing involves laboratory preparation and testing of treated soil (soil-binder mixtures) to study the influence of these various factors on measured engineering properties. The results of bench-scale tests are used to define a range of mix designs and installation procedures that are likely to produce treated soils in production that meet the specified design parameters for the project.
Full-scale field work involves installing test elements of the size, arrangement, and depth required in production. The contractor uses production mixing equipment to install the elements and assess the suitability and workability of the materials and the installation parameters to produce the treated soil that meets the specified performance requirements.
10.1 TIMING OF PRECONSTRUCTION TESTING ACTIVITIES
Bench-scale and field validation programs can be implemented in different phases of projects for different purposes. The owner is often responsible for specifying the target strength, uniformity, and permeability requirements for the deep mixed material. Bench-scale tests should typically be conducted by the owner/engineer during the design phase to establish the reasonably attainable treated soil properties for use in design. However, if the owner/engineer has prior experience in similar soils in the same nearby geology, bench-scale testing may not be necessary. All results from bench-scale tests conducted by the owner should be provided to all bidders.
For bench-scale testing results to be understood and used with confidence by the owner/engineer and the bidders, standard procedures for sample preparation, handling, and testing must be used. Recommended procedures are outlined in appendix A. If standard procedures are used, DMM contractors with adequate experience may be able to use the owner’s bench-scale testing results to select the mixing procedures and binder slurry injection process required to meet the project requirements. However, the DMM contractor may want to conduct additional bench-scale tests to confirm results or optimize binder quantities and mix designs, especially if standard procedures were not used by the owner or cannot be confirmed. The DMM contractor may also want to perform bench-scale testing using modified procedures that simulate the specific mixing conditions for a proprietary DMM system or that may be correlated to the field operation of his/her DMM method.
A field trial program may also be conducted during design to help establish that DMM can be accomplished successfully at a given site and to determine a reasonable range of strengths that can be considered for use in the design process. Field trials during design are completed under a separate contract that is executed prior to completing the design. Field trials conducted during design are expensive for a design-bid-build project. However, for design-build or ECI in design projects, field trials during construction are more likely to be cost effective. Field trial programs have been conducted during the design stage on several large and complicated projects, including the Woodrow Wilson Bridge project for VDOT, the New Orleans Levee Stabilization test project

108
for USACE, and the San Pablo Dam seismic upgrades for the East Bay Municipal Utility District.(22,59,125)
Although field trials during design are uncommon and only used on large or complex projects, field validation programs during construction but prior to production mixing are very common and are used on virtually all projects. Field validation programs conducted by the contractor are used to determine and demonstrate the means and methods for producing the DMM elements that satisfy the requirements of the project specifications and for performing the specified QC/QA activities.
10.2 BENCH-SCALE TESTING
10.2.1 Goals of Bench-Scale Testing Program
A bench-scale testing program conducted by the owner during the design stage should be developed to achieve the following goals:
• Study the influence of type and quantity of binder on the engineering properties of treated soil.
• Study the influence of water-to-binder ratio for the wet method.
• Study the influence of different soil layers at a particular site and at different areas within a project site on the engineering properties of treated soil.
• Define various engineering properties of treated soil needed for design that can be practically achieved using reasonable amounts of binder.
• Correlate various engineering properties with unconfined compressive strengths of treated soils for comparison with QC/QA values measured during construction.
• Define the basis for the selection of the design strength.
• Establish baseline treated soil properties for laboratory-mixed specimens for use by DMM contractors to prepare bids.
10.2.2 Bench-Scale Testing Program
Conventional soil testing methods are typically used for testing treated soil samples. Sample size and collection considerations for preparing, curing, and testing treated samples in unconfined compression are included in appendix A. The method of calculation used in the laboratory procedure is included in appendix B. Standard laboratory procedures should be used for testing to provide reliable and understandable data.
It is important to recognize that measured test values from laboratory-prepared specimens will differ from those of field-produced samples. Laboratory mixing equipment imparts greater mixing energy, which promotes greater treated soil uniformity than can be achieved in production by full-scale equipment. Published results indicate that the strength obtained from

109
bench-scale testing is 1 to 5 times the strength obtained in the field using the same mix design.(46) Laboratory curing conditions and loading conditions also often differ from in situ conditions. Laboratory testing allows treated soil strength gain with time to be studied.
Bench-scale testing should consider parameters that are practical to use for full-scale production, considering that some DMM techniques can impart more mixing energy than others. The binder factors that can be introduced by DMM equipment generally range from 170 to 840 lb/yd3 (100 to 500 kg/m3) of in situ soil. Certain mix designs that can be used to produce treated soil samples in the laboratory may not be applicable for full-scale production due to workability restraints. High mixing energies and low water-to-cement ratio binder slurries may be used successfully to mix relatively small laboratory soil samples, but they may be unsuccessful for use in full-scale production.
Bench-scale testing may include a wide range of tests that provide various strength and compressibility data. However, it is necessary to correlate these data with a field value that will be measured during production QC/QA activities. The unconfined compressive strength of the treated soil is the parameter most often measured for QC/QA purposes. Published correlations are discussed in chapter 5. For example, specifications would generally be based on unconfined compression tests. Additionally, specifications would not require that certain modulus values or tensile strengths be achieved. Instead, the engineer would correlate other properties used in design with unconfined compressive strength, which would be the value that the specifications are based on.
Binder costs often account for 20 to more than 30 percent of DMM construction costs. To optimize the construction cost, binders that are available in the local area should be considered for bench-scale testing. Water from local sources must also be used to prepare the binder slurry for the bench-scale study. The mix design should include a matrix of at least three binder factors and three water-to-binder ratios for each main soil type that will be encountered at the site. If multiple binder types are considered, a matrix of mix designs for each binder is developed.
Bench-scale testing results should be clearly reported regardless of whether the testing is conducted by an owner or a contractor. Bench-scale testing reports should include, at a minimum, descriptions of sampling techniques used, boring logs, classifications of all major soil strata to be mixed, site groundwater conditions, binder materials used, mixed design proportions, laboratory mixing techniques used, curing conditions, and plots of unconfined compression versus time for each soil type and mix design.
10.3 FIELD VALIDATION PROGRAM (FULL-SCALE FIELD TESTING)
After the contract is awarded, the contractor should conduct a full-scale field validation program to demonstrate that the contractor’s DMM equipment, mix design, and installation procedures can produce treated soil with material and geometric parameters that meet the specification requirements.

110
10.3.1 Goals of Full-Scale Field Testing
The goals of full-scale field testing include the following:
• Identify construction sequencing and operational issues.
• Identify mix design and installation procedures.
• Confirm that the contractor can achieve the specified mixture geometry and engineering property value(s), which is typically a specified unconfined compressive strength.
• Confirm QC/QA parameters and procedures.
• Develop a common understanding about construction and QC/QA procedures and documentation between the owner, engineer, and contractor.
This testing provides evidence that the expected design parameters will be achieved with the means, methods, and materials proposed by the contractor. Results of full-scale field testing are also used to assess the influence of DMM operations on the overall construction sequence of the project. The DMM contractor may experiment with mixing parameters during field testing to identify suitable mix designs and installation procedures that can provide the necessary quality while also achieving schedule and cost objectives. The DMM contractor may also conduct test sections to develop and support an alternative cost effective design that may be part of a value engineering proposal.
10.3.2 Full-Scale Field Testing Program
The full-scale field testing program involves the installation of trial production elements using the means, methods, and materials proposed by the DMM contractor and defined based on information from bench-scale testing.
At least 30 days before the start of the field validation program, the contractor must submit a field validation program plan that describes the construction procedures; equipment and ancillary equipment used for mixing, binder proportioning, and injection; mix design parameters and associated soil strata to be evaluated; operational and material parameters to be monitored during field validation; layout of the DMM elements to be constructed; and a summary of QC/QA samples to be collected and tested. Examples of the forms that will be used to document the work as outlined in section 9.3.6 should also be provided.
During the full-scale field validation program, the contractor evaluates the installation processes to optimize mixing, binder slurry or binder injection quantities, and operational procedures. The trial elements must be installed in ground conditions representative of the project conditions. Ideally, the test elements are installed near borings so that results can be correlated with known ground conditions. Various geometric configurations or column layouts may be evaluated during the field testing program (e.g., column type, wall type, cell type, and block type). Geometric overlap and verticality should also be evaluated. Uniformity may be evaluated by coring or by exposing DMM elements through extracting or excavating around the elements. Exposure and

111
extraction are time-consuming and costly processes, and extraction may not be possible for particularly deep elements.
The same QC/QA methods proposed for the production columns should be used to assess the quality of the field test program elements. Generally, the testing frequency for test columns is very high compared to the testing frequency for production columns. The test panels or columns may be used as production elements if properties and configurations meet specified requirements. Elements not meeting project requirements may be abandoned in place if they are not acceptable to the owner. If elements cannot be abandoned in place, test sections should be installed outside the production area in a part of the site with similar soil conditions. The contractor takes on a risk by installing test elements at production element locations, and it is often preferable to install test elements at locations different from production element locations unless the test elements in question are installed using conservative mix parameters. Sampling and testing requirements for test sections are outlined in chapter 12.
The contractor uses the field validation program results to develop the deep mixing work plan, as outlined in section 9.3.4. This plan must be submitted to the owner for approval at least 30 days prior to the start of deep mixing.
The results of testing from field test columns can be used to estimate the ratio between the laboratory strength values and the field strength values. By modifying the mixing tool, increasing the mixing energy, and adjusting the installation procedures during full-scale testing, the difference in strength between samples produced by the full-scale DMM equipment and the laboratory mixing may be reduced. Lower laboratory-to-field strength ratios generally indicate improved uniformity of the treated soil.


113
CHAPTER 11. CONSTRUCTION
The primary construction goal of any DMM technique is to ensure an even distribution of binder throughout the treated soil volume with uniform moisture content and without significant unmixed portions of native soil or binder. A variety of methods have been developed to meet this goal. Methods may be broadly categorized as either wet or dry mixing processes and used to construct either deep foundation elements (columns, walls, or panels) or shallow masses of stabilized soil. When comparing methods, note that all methods are not equivalent. Various systems have been developed to meet the demands and constraints of regional markets and the prevailing subsurface conditions, and their use should reflect the requirements and design intent of different applications.(118)
General mixing processes and machine and tooling characteristics for methods commonly used in the United States are described in the following section. It does not contain an indepth explanation of the different systems. Instead, it is intended to improve the understanding of the general sizes and capacities of DMM equipment (e.g., conventional depths and production rates), tooling geometries, and installation processes for the different major classifications of methods.
A detailed description of the methods and equipment used internationally are provided by Bruce and Topolnicki and are summarized in appendix D.(2,118)
11.1 CLASSIFICATION OF METHODS
FHWA researchers developed a classification system based on construction parameters including binder type, mixing mechanics, and location of the mixing tool.(1) The classification has been expanded to include additional variants of DMM that have been developed since the original publication, as follows:
• Method used to introduce the binder into the soil: Wet (i.e., pumped in slurry form) or dry (delivered pneumatically in dry form). Classification is W or D.
• Method used to penetrate the soil or mix the binder: Rotary (purely by rotary methods with the binder at relatively low pressure), jet (by a rotary method aided by jets of slurry at high pressure), or vertical (by a chainsaw type of vertical rotation that creates walls or panels). (Jet grouting, which does not rely on any mechanical mixing to create the treated mass, is outside the scope of this report. “J” as used in this classification refers to jet-assisted mechanical mixing.) Classification is R, J, or V.
• The location or vertical distance over which mixing occurs in the soil: End (mixing is conducted only at the distal end of the shaft (or within one column diameter from that end)), shaft (mixing occurs along all or a significant portion of the drill shaft), or panel (mixing occurs along the entire length of the tooling constructing a panel or wall. Classification is E, S, or P.
Methods currently being used are classified according to this system and shown in figure 137. The methods that have been used in the United States are shown in black boxes. The methods shown in white boxes have been used internationally or experimentally or are still being

114
developed. Method variations are constantly being developed and used. Readers are encouraged to investigate available mixing capabilities beyond the techniques listed in figure 137 to consider new methods and companies not included at the time this report was published.
Figure 137. Flowchart. Classification of vertical axis DMMs based on agent (W/D),
penetration/mixing principle (R/J/V), and location of mixing action (S/E/P).(1)
Trevimix DRY (40)
Modified Deep Mixing (MDM) (41)
Dry Soil Mixing Mass (41)
Note: The number in parentheses indicates the table where details of the method can be found (see appendix D).
DEEP MIXING METHODS
Wet Methods (W)
Rotary (R)
Shaft
DSM (27)
SMW (27)
TREVIMIX WET (28)
Colmix (28)
Soil Removal Technique (29)
Schnabel DMW (42) Deep Mix Wall
End (E)
CDM and FGC-CDM (29)
SSM (30)
ISS (30)
RAS (31)
Rectangular 1 (31) (Cutting Wheels)
Rectangular 2 (32) (Box Columns)
SAM (32)
Cementation Systems (33)
Single Axis Tooling (33)
Rotomix (34)
Cutter Soil Mixing (CSM) (34)
Rotary + Jet (J)
End (E)
SWING (Spread Wing)
(35)
JACSMAN (36)
LDiS (36)
GeoJet (37)
Hydramech (37)
RAS-JET (38)
TurboJet (38)
Vertical (V)
Panel (P)
TRD (39)
Dry Methods (D)
Rotary (R)
End (E)
DJM (39)
Nordic Method (40)

115
Several other classification systems have been proposed to organize the various and numerous DMM methods according to application and according to deep or shallow mixing. (See references 8, 86, 118, and 126.)
11.2 WET MIXING METHODS
In general, wet mixing methods are single- or multi-shaft wet mixing processes that use primarily cement-based slurries to create isolated elements, continuous walls, or blocks. Shallower mixing may also be conducted to stabilize masses of soil. Wet mixing equipment comprises a batch plant to supply slurry and a mixing machine to inject and mix the slurry into the ground.
Wet mixing methods are used for both offshore and on-land projects. A large portion of offshore projects are conducted in Japan, and these applications are generally outside of the scope of typical U.S. transportation projects. Information on these offshore applications is provided by CDIT.(46)
11.2.1 Slurry Batch Plant
The slurry batch plant typically includes silos, a water tank, a batching system, temporary storage tanks, slurry pumps with flowmeters, and power supply units. A typical batch plant layout for a larger project is shown in figure 138. Plant components may be simple or complex depending on the requirements of the project and may vary from manually or computer-controlled colloidal shear mixers to a sophisticated in-line jet mixing system.(118) Storage tanks contain paddle agitators to maintain binder disbursement throughout the slurry. Pumps are typically duplex or triplex reciprocating piston pumps or variable speed progressive cavity pumps with rates of ranging from 0.1 to 0.3 yd3/min (0.08 to 0.25 m3/min) and up to 1.3 yd3/min (1 m3/min) for high-capacity mixing tools.
Source: Hayward Baker Inc.
Figure 138. Photo. Slurry batching plant for larger mixing project.
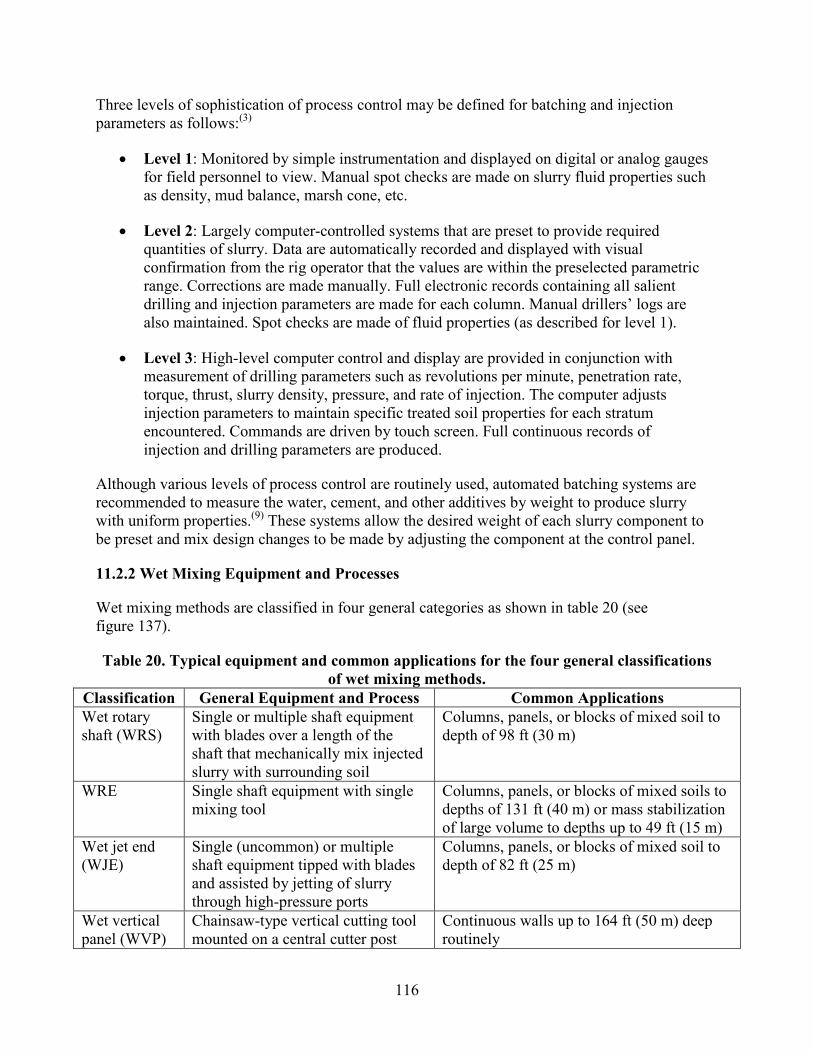
116
Three levels of sophistication of process control may be defined for batching and injection parameters as follows:(3)
• Level 1: Monitored by simple instrumentation and displayed on digital or analog gauges for field personnel to view. Manual spot checks are made on slurry fluid properties such as density, mud balance, marsh cone, etc.
• Level 2: Largely computer-controlled systems that are preset to provide required quantities of slurry. Data are automatically recorded and displayed with visual confirmation from the rig operator that the values are within the preselected parametric range. Corrections are made manually. Full electronic records containing all salient drilling and injection parameters are made for each column. Manual drillers’ logs are also maintained. Spot checks are made of fluid properties (as described for level 1).
• Level 3: High-level computer control and display are provided in conjunction with measurement of drilling parameters such as revolutions per minute, penetration rate, torque, thrust, slurry density, pressure, and rate of injection. The computer adjusts injection parameters to maintain specific treated soil properties for each stratum encountered. Commands are driven by touch screen. Full continuous records of injection and drilling parameters are produced.
Although various levels of process control are routinely used, automated batching systems are recommended to measure the water, cement, and other additives by weight to produce slurry with uniform properties.(9) These systems allow the desired weight of each slurry component to be preset and mix design changes to be made by adjusting the component at the control panel.
11.2.2 Wet Mixing Equipment and Processes
Wet mixing methods are classified in four general categories as shown in table 20 (see figure 137).
Table 20. Typical equipment and common applications for the four general classifications of wet mixing methods.
Classification General Equipment and Process Common Applications Wet rotary shaft (WRS)
Single or multiple shaft equipment with blades over a length of the shaft that mechanically mix injected slurry with surrounding soil
Columns, panels, or blocks of mixed soil to depth of 98 ft (30 m)
WRE Single shaft equipment with single mixing tool
Columns, panels, or blocks of mixed soils to depths of 131 ft (40 m) or mass stabilization of large volume to depths up to 49 ft (15 m)
Wet jet end (WJE)
Single (uncommon) or multiple shaft equipment tipped with blades and assisted by jetting of slurry through high-pressure ports
Columns, panels, or blocks of mixed soil to depth of 82 ft (25 m)
Wet vertical panel (WVP)
Chainsaw-type vertical cutting tool mounted on a central cutter post
Continuous walls up to 164 ft (50 m) deep routinely

117
11.2.3 WRS Methods
In the most commonly used WRS methods for on-land applications, mixing is conducted using vertical hollow rotated mixing shafts supported on a track-mounted crane. One to eight mixing shafts may be used, although two to four are typically used per carrier, depending on the nature of the project, the particular variant of the method, and the contractor. Typical WRS machines are shown in figure 139. The shafts are mounted on fixed or hanging leads and are driven by a top-drive gearbox that distributes the torque from a rotary drive unit to each shaft. Shafts are supported at vertical intervals to keep the mixing tools parallel and maintain accurate vertical control. For multishaft equipment, blades and auger flights on adjacent shafts are staggered. On some machines, the spacing between the shafts may be adjusted to vary the amount of overlap between columns. The drill shafts are often rotated in opposite directions during drilling to enhance mixing efficiency and increase stability of the machine. The direction of rotation of each shaft is often reversed during withdrawal to further improve mixing efficiency. Position and verticality of the shaft may be monitored using optical survey devices or a Global Positioning System (GPS) device. Since fluid is being introduced into the ground, surface spoils can be considerable.
Source: Geo-Con Inc.
Figure 139. Photo. Typical WRS mixing machine.
Each mixing shaft is tipped with a cutting tool below the blades to help control verticality during penetration. Different cutting tools may be used to accommodate drilling through varying soil conditions. The shaft above the cutting tool contains mixing blades, which blend the slurry

118
continuously with the soil during penetration. The distribution and number of mixing blades employed per shaft are dependent on the capacity of the base machine.
Mixing tools are broadly categorized as blade-based and auger-based.(126) Blade-based tools comprise a series of mixing blades oriented in different directions along the drill shaft. The blades are equipped with cutting teeth that aid penetration. Slurry injection nozzles are located at various intervals along the mixing tool, usually near the tip of the shaft, but can also be positioned along and above the blades.(118) Examples of typical blade-based mixing tools are shown in figure 140 and figure 141.
Figure 140. Photo. Typical blade-based tooling for WRS mixing.(127)
Figure 141. Photo. Second view of typical blade-based tooling for WRS mixing.(127)
Auger-based mixing tools comprise continuous or discontinuous flight augers or several levels of inclined paddles located along the length of the drill shaft. Slurry injection nozzles are located at the bottom of each shaft. An example of auger-based mixing tools is shown in figure 142.

119
Source: Geo-Con Inc.
Figure 142. Photo. Typical auger-based tools for WRS methods.
Mixing machine details and typical operational parameters for WRS methods used internationally are summarized in appendix D.
11.2.4 WRE Methods
WRE methods are either used for installing deep columns or stabilizing masses of soil to shallower depths. WRE mixing equipment for deep construction on land includes one or two shafts typically 2.3 to 3.3 ft (0.7 to 1.0 m) in diameter (see figure 143). Each shaft has four to six mixing blades. The maximum depth of construction is up to 131 ft (40 m).

120
Source: Raito, Inc.
Figure 143. Photo. WRE mixing equipment.
WRE mixing equipment for shallow soil stabilization typically includes one shaft tipped with a generally large-diameter single cutting tool (see figure 144 and figure 145). The cutting tool serves as both the drilling bit and mixing tool and is supported by a hollow stem kelly bar on a large track-mounted crane. With some methods, the shaft may be attached rigidly to the base unit, allowing down pressure to be applied during mixing. Because of torque limitations, the drilling depth of the single-auger system is typically limited to 50 ft (15 m).(9) When used in conjunction with an onsite batching and delivery plant, the expected production can be up to 785 yd3 (600 m3) per rig per 8-h shift.
Source: Hayward Baker Inc.
Figure 144. Photo. Typical tools used for WRE mixing.

121
Source: TREVIICOS Corporation
Figure 145. Photo. Second view of typical tools used for WRE mixing.
The CSM method is a WRE method that is differentiated from other rotary end methods because the cutting blades move vertically by rotating about horizontal axes (see figure 146). This method was developed from diaphragm wall technology and uses two sets of counter-rotating vertically mounted cutter wheels. The wheels cut the surrounding soil and concurrently blend the injected slurry with the soil to form panels 1.7 to 4 ft (0.55 to 1.2 m) wide. Panels are installed in a primary-secondary sequence to create continuous walls. The speed and direction of rotation for each cutting wheel are controlled and monitored separately, allowing for assurance of overlap between panels. Wheels may be equipped with rock teeth to help cut through difficult soils, including cobbles up to 8 inches (200 mm) in diameter or bedrock with up to 7,250 psi (50 MPa) unconfined compressive strength. DMM elements installed into bedrock may be needed to key in cutoff walls for seepage control applications or provide additional shear resistance.
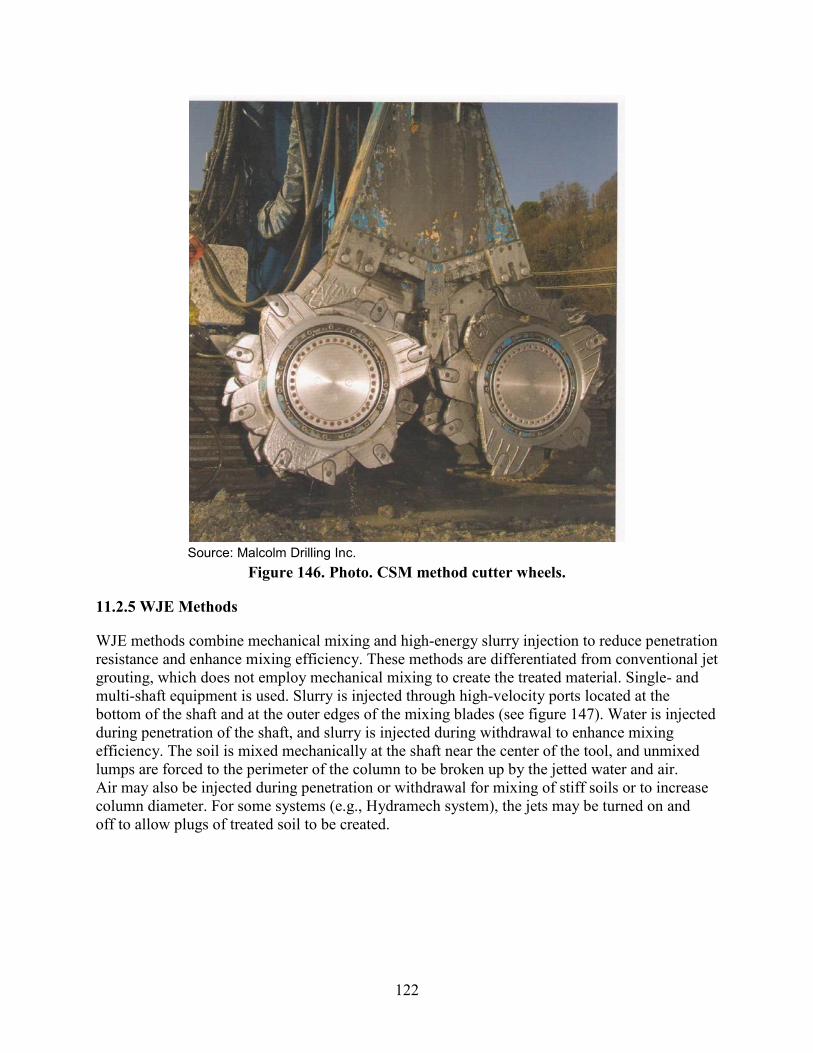
122
Source: Malcolm Drilling Inc.
Figure 146. Photo. CSM method cutter wheels.
11.2.5 WJE Methods
WJE methods combine mechanical mixing and high-energy slurry injection to reduce penetration resistance and enhance mixing efficiency. These methods are differentiated from conventional jet grouting, which does not employ mechanical mixing to create the treated material. Single- and multi-shaft equipment is used. Slurry is injected through high-velocity ports located at the bottom of the shaft and at the outer edges of the mixing blades (see figure 147). Water is injected during penetration of the shaft, and slurry is injected during withdrawal to enhance mixing efficiency. The soil is mixed mechanically at the shaft near the center of the tool, and unmixed lumps are forced to the perimeter of the column to be broken up by the jetted water and air. Air may also be injected during penetration or withdrawal for mixing of stiff soils or to increase column diameter. For some systems (e.g., Hydramech system), the jets may be turned on and off to allow plugs of treated soil to be created.

123
Figure 147. Photo. Example of a WJE tool.(127)
For the GeoJetTM system, jetting and mechanical mixing are both used during penetration to increase the speed of tool advancement; however, only mixing is used during withdrawal. The process is controlled by computer, and adjustments to operational parameters may be made automatically in response to changing subsurface conditions. Production rates are typically very high for this system.
11.2.6 WVP Methods
The original wet mixing classification has been expanded to include a recently developed system classified as WVP.(1) The system is a Japanese development known as TRD. The TRD mixing process employs a vertically mounted chainsaw-type cutting tool with simultaneous slurry injection. The chain with cutting teeth rotates about a central vertical cutter post, and slurry is simultaneously injected to mix with the disturbed soil (see figure 148 and figure 149). The cutter post is inserted into the ground with injection and mixing to the target depth, and the injection and mixing continue as the post is moved horizontally to create a continuous wall of mixed soil. This method has been used to install walls up to 98 ft (30 m) deep in the United States. Walls 197 ft (60 m) deep have been reported in Japan.

124
Source: Geosystems, L.P.
Figure 148. Photo. TRD tooling.
Source: Geosystems, L.P.
Figure 149. Photo. Second view of TRD tooling.
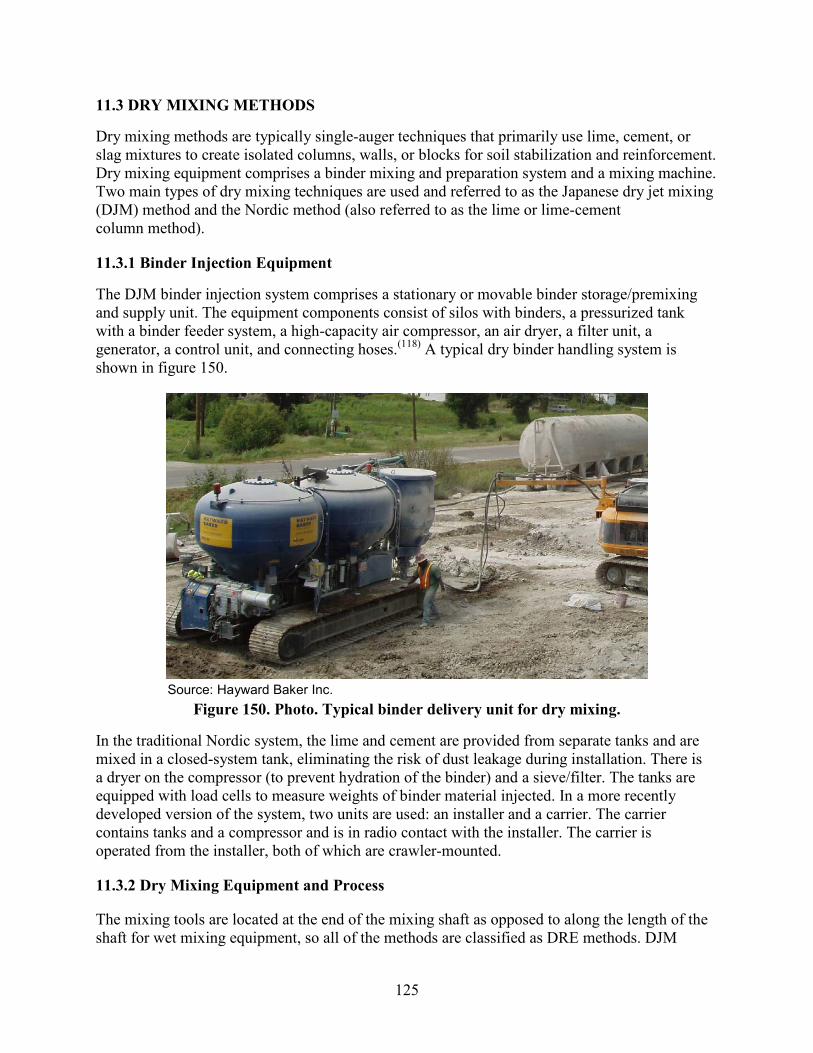
125
11.3 DRY MIXING METHODS
Dry mixing methods are typically single-auger techniques that primarily use lime, cement, or slag mixtures to create isolated columns, walls, or blocks for soil stabilization and reinforcement. Dry mixing equipment comprises a binder mixing and preparation system and a mixing machine. Two main types of dry mixing techniques are used and referred to as the Japanese dry jet mixing (DJM) method and the Nordic method (also referred to as the lime or lime-cement column method).
11.3.1 Binder Injection Equipment
The DJM binder injection system comprises a stationary or movable binder storage/premixing and supply unit. The equipment components consist of silos with binders, a pressurized tank with a binder feeder system, a high-capacity air compressor, an air dryer, a filter unit, a generator, a control unit, and connecting hoses.(118) A typical dry binder handling system is shown in figure 150.
Source: Hayward Baker Inc.
Figure 150. Photo. Typical binder delivery unit for dry mixing.
In the traditional Nordic system, the lime and cement are provided from separate tanks and are mixed in a closed-system tank, eliminating the risk of dust leakage during installation. There is a dryer on the compressor (to prevent hydration of the binder) and a sieve/filter. The tanks are equipped with load cells to measure weights of binder material injected. In a more recently developed version of the system, two units are used: an installer and a carrier. The carrier contains tanks and a compressor and is in radio contact with the installer. The carrier is operated from the installer, both of which are crawler-mounted.
11.3.2 Dry Mixing Equipment and Process
The mixing tools are located at the end of the mixing shaft as opposed to along the length of the shaft for wet mixing equipment, so all of the methods are classified as DRE methods. DJM

126
mixing machines are usually equipped with two mixing shafts but may use only one shaft to accommodate narrow or low headroom working areas. The base equipment comprises custom-built, crawler-mounted, or (rarely) skid-mounted cranes. The mixing system consists of the drive unit, the drive shaft, the cutting and mixing blade, and grout nozzles. The rotation motors and gear boxes are permanently located near the base of the rig, effectively lowering the center of gravity and improving stability when tracking on uneven ground.
The mixing unit comprises two or three pairs of blades mounted on each of the shafts offset 90 degrees to each other (see figure 151 and figure 152). The standard blade is 3 ft (1 m) in diameter, and the maximum depth is 108 ft (33 m). The heavy rotation motors and gear boxes are positioned at the bottom of the mast promoting mechanical stability. Construction parameters (depth, revolutions per minute, penetration and withdrawal rates, and volume of binder) are monitored continuously and automatically.
Figure 151. Photo. Typical mixing tool for DRE methods.(118)
Figure 152. Photo. Typical mixing tool for DRE methods for peat mixing.(118)
Binder is injected using compressed air to prevent choking of the nozzles. Upon reaching the bottom depth of the element, the unit is counter-rotated and withdrawn while dry materials are injected under compressed air from nozzles located in the upper mixing blade. Some binder may also be injected during penetration, but more commonly, injection occurs only during withdrawal. The shape of the mixing blades causes a cavity to be created beneath the blade during rotation. As the cavity is created, air pressure within drops and dry reagent is deposited. The compressed air used to deposit the dry materials passes upward along the shaft and vents through a valve in the particle collection shroud located at the ground surface. Because injected materials are dry, surface spoils are minimal.
In the Nordic method, the base equipment is a crawler-mounted self-contained rig that rotates a tool to target depth (typically less than or equal to 82 ft (25 m)). Rods may be square in section and rotated from the bottom or round in section and rotated with a top drive. Square rods permit

127
air to escape from the ground more easily during drilling. Columns between 1.6 and 4 ft (0.5 and 1.2 m) may be installed. A column diameter of 2 ft (0.6 m) remains the most common, although 2.6 ft (0.80 m) is also popular, especially in the United States.
In the Nordic method, compressed air is introduced during penetration to break up the soil structure and keep the injection ports clear. Dry materials are then pneumatically delivered as the tool is rotated in the opposite direction and withdrawn. The pressure of the compressed air is reduced as the tool nears the surface, while the air typically discharges to the surface around the drill rod from all depths. The computer system provides real-time control of the processes (especially rate of materials injected), as well as records of quantities of materials, rate of injection, revolutions per minute, withdrawal rate, air pressure, binder material composition, and depth. The verticality of the drill is automatically controlled to within ±0.25 degree.
Instantaneous penetration rates are about 6 inches (150 mm)/rotation during penetration (varies with the soil) and 0.6 inches (15 mm)/rotation on withdrawal. A 49-ft (15-m)-long column can be installed in 5 min. Industrial production of 1,300 to 3,300 ft (400 to 1,000 m) per 8-h shift for 2-ft (0.6-m)-diameter columns (146 to 366 yd3/shift (112 to 280 m3/shift)) is common and is dictated by the type of soil, amount of binder, and column diameter.
Combination methods are also available, such as the modified deep mixing (MDM) method, which has the capability of switching between dry binder and water injection at specific depths. This versatility allows efficient mixing of layered strata or in response to site-specific project needs or localized changes in subsurface moisture conditions.
Another variant to the conventional DRE method is the mass stabilization method called Dry Soil Mixing. The process is different from other DRE methods because the mixing blades rotate vertically about a horizontal axis to churn the upper several feet of ground, creating a block of stabilized soil (see figure 153).
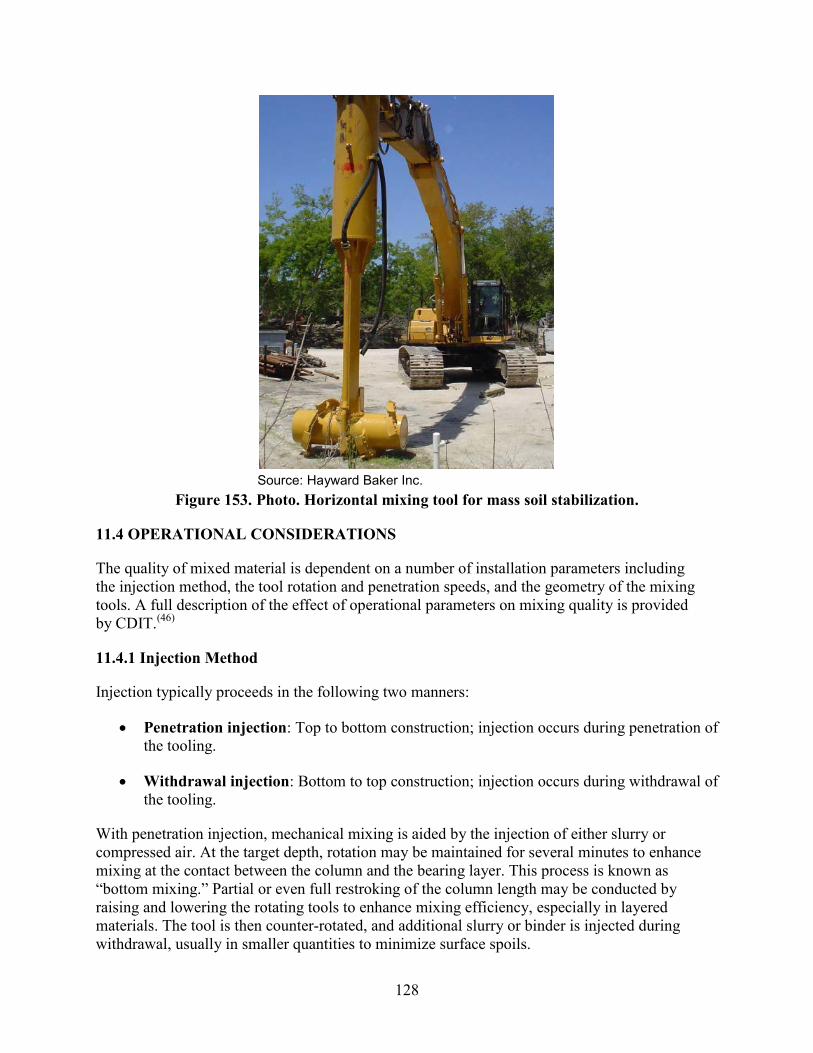
128
Source: Hayward Baker Inc.
Figure 153. Photo. Horizontal mixing tool for mass soil stabilization.
11.4 OPERATIONAL CONSIDERATIONS
The quality of mixed material is dependent on a number of installation parameters including the injection method, the tool rotation and penetration speeds, and the geometry of the mixing tools. A full description of the effect of operational parameters on mixing quality is provided by CDIT.(46)
11.4.1 Injection Method
Injection typically proceeds in the following two manners:
• Penetration injection: Top to bottom construction; injection occurs during penetration of the tooling.
• Withdrawal injection: Bottom to top construction; injection occurs during withdrawal of the tooling.
With penetration injection, mechanical mixing is aided by the injection of either slurry or compressed air. At the target depth, rotation may be maintained for several minutes to enhance mixing at the contact between the column and the bearing layer. This process is known as “bottom mixing.” Partial or even full restroking of the column length may be conducted by raising and lowering the rotating tools to enhance mixing efficiency, especially in layered materials. The tool is then counter-rotated, and additional slurry or binder is injected during withdrawal, usually in smaller quantities to minimize surface spoils.

129
Withdrawal injection is commonly used with dry methods, but penetration injection may also be used if the binder quantity required to meet the design strength exceeds that which may be injected during withdrawal alone.
11.4.2 Rotation and Penetration Speeds
The tool rotation and penetration speeds affect the strength of the treated soil. Studies indicate that higher treated soil strengths are measured from samples produced with higher rotation speeds and lower penetration rates.(46) Comparing the effectiveness of different mixing methods can be subjective because the various mixing techniques and soil conditions produce different mixing results. A simplified index, BRN, has been suggested to quantify the effect of the number of rotations of the mixing blades on the quality of treated soil.(46) BRN is defined as the total number of rotations during 1 m of penetration (downstroke) or withdrawal (upstroke) after the binder has been fed into the ground. BRN is expressed as shown in figure 154.(128)
∑
+=
w
w
p
p
VN
VN
MBRN
Figure 154. Equation. BRN.
Where: Σ M = Total number of mixing blades. Np, Nw = Rotational speed during penetration and withdrawal, respectively, in revolutions/min Vp, Vw = Velocity of mixing blade during penetration and withdrawal, respectively, in m/min.
Study results indicate that a smaller coefficient of variation may be expected when BRN is higher than 360 for the wet method of mixing. This analysis was developed for and is effective only for traditional DMM (not CSM, TRD, or mass stabilization methods).
11.4.3 Tooling Geometry
The number of shafts, the shape and orientation of the mixing blades, and the position of the injection nozzles all influence the quality of the mixed material. Models and field observations indicate that multiple-shaft arrangements generally provide better uniformity of DMM columns than single-shaft systems with fixed cutting/mixing blades rotating in one direction.(46) Adjacent shafts are typically rotated in opposite directions to enhance mixing and increase stability of the machine.
Various orientations and shapes of mixing tools have been developed to meet the requirements of the soils in different regions. Generally, the tools are shaped to disaggregate soil during penetration and increase the degree of mixing with binder upon additional rotation. Soils with peats and plastic clays, for example, require mixing with equipment shaped to deliver a strong shearing action during rotation.
Injection nozzles are positioned to facilitate the type of injection method. For penetration injection, the nozzles are positioned at the base of the tool to lubricate the mixing tool and assist penetration. For jet methods, nozzles are located at the edges of the mixing blades to enlarge column diameters. Nozzles oriented vertically downward are used to increase the penetration

130
rate, and nozzles directed outward from the outer edges of the blades are used to increase the mixing action or diameter of the column

131
CHAPTER 12. QC/QA
12.1 INTRODUCTION
A well planned and executed QC/QA program is critical to the success of a DMM project. The program’s two parts may be generally defined as follows:
• QC program: The materials handling and construction procedures established to produce the treated materials that meet the design requirements of the structure (see section 12.2).
• QA program: The monitoring, sampling, and testing procedures established to verify that the treated materials produced meet the design criteria (see section 12.3).
The contractor provides all the personnel and equipment necessary to implement the QC program. The owner’s representative is mainly responsible for the QA program, although many of the QA activities are frequently assigned to the contractor, such as coring, sampling, and testing. The owner’s representative observes construction on a full-time basis and reviews the submittals from the contractor to verify that the QC and QA programs are being properly implemented.
12.2 QC
The QC program is the responsibility of the contractor and generally includes the following components:
• Conducting bench-scale testing and reporting results to the engineer for review and approval.
• Developing and submitting a field validation testing program plan for review and approval.
• Constructing field validation test sections prior to the full production of DMM columns (as well as additional test sections as required by the owner/engineer).
• Developing a deep mixing work plan including descriptions of all materials and procedures to be used to construct and control the quality of the DMM elements.
• Controlling and monitoring the storage, blending, handling, delivery, quality, and quantity of the binder materials in dry or slurry form as appropriate to the DMM technology employed.
• Controlling and monitoring operational parameters and production of treated soil.
• Controlling and monitoring the geometric layout, verticality, and depth of DMM elements during production.
• Conducting full-depth continuous core sampling and wet sampling and associated testing. (The owner/engineer generally logs the core, evaluates uniformity of the treated
132
materials, and selects specimens for laboratory testing, with consideration of input from the contractor.)
• Documenting, reporting, and submitting the results of field monitoring, sampling, and strength testing to the engineer.
12.2.1 Role of QC Personnel
The DMM contractor provides the QC personnel (a QC technician and a project engineer). The QC technician monitors the operational parameters in real time to ensure the DMM operation follows the predetermined procedures. If an installation parameter deviates from the allowable range of the predetermined value, the QC technician informs the rig operator and the batch plant operator to adjust the installation parameters to address the conditions. The project engineer supervises the work of and provides technical support to the QC technician as well as reviews the installation records of the real-time monitoring system.
12.2.2 Bench-Scale and Field Validation (Full-Scale Field Testing) Programs
Preproduction bench-scale testing and full-scale field testing programs should be planned and executed prior to production, as outlined in chapter 10.
12.2.3 Deep Mixing Work Plan
At least 30 days prior to the start of deep mixing work, the DMM contractor submits a deep mixing work plan to the owner for review and approval, as detailed in section 9.3.4.
12.2.4 Materials and Production Monitoring
The QC program includes monitoring and documenting materials handling and construction procedures, including the following:
• Layout.
• Binder handling and binder slurry preparation.
• Binder injection rate.
• Mixing tool rotation speed and penetration/withdrawal rates.
• Element verticality.
• Element top and bottom elevations.
• Bottom mixing.
• Control of spoils.
133
For a successful DMM operation, real-time monitoring must be used to control and document the current operational data, summarize the preceding operational data at intervals of 3 ft (1 m) or closer, and detect any non-complying operational parameters or records. A real-time monitoring system is a computer-based QC device that indicates the instantaneous installation parameters of a DMM element while the mixing is in progress. Using a real-time monitoring system, deficiencies can often be corrected before the DMM element is completed.
Monitoring additional items is necessary for TRD, including tool rotational speed, horizontal movement speed, and viscosity of soil-binder mixture during production. These procedures and parameters are controlled through the coordination of the contractor’s rig operator, batch plant operator, and QC technician/engineer.
Layout
The contractor should accurately stake the locations of the proposed DMM elements shown on the construction drawings prior to installation. GPS technology attached to the mixing equipment has been successfully used to control and document DMM element locations. The engineer is responsible for reviewing the locations of DMM elements. The contractor should provide an adequate method of allowing the engineer to verify the as-built location of the elements during construction. Misplaced elements will be reviewed by the engineer to determine if they will interfere with the proposed construction. The contractor is responsible for correcting the location or alignment of misplaced elements that will adversely affect the project quality. The contractor should correct misaligned elements that interfere with the project in a manner acceptable to the owner.
After production is complete, the DMM contractor should submit as-built drawings indicating the locations of the DMM elements in terms of project coordinates for review and approval by the owner.
Binder Handling and Slurry Preparation
Mix designs verified during the field validation program should be used in production. Revalidation through laboratory or field testing is necessary for changes that exceed 10 percent of previously approved mix designs.
For the dry method of deep mixing, the binder is stored onsite or is delivered just in time to a container that feeds the mixing machine. The binder must be kept dry throughout the storage and delivery operations.
For the wet method of deep mixing, the binder production equipment must be capable of providing slurry with consistent and verifiable quality. Dry binder, mainly cement or slag-cement, is stored in silos and fed to mixers for shearing and agitation. To accurately control the proportions of the slurry components, the amount of water and binder must be determined by weight using automatic batch scales in the mixing plant. Admixtures, if used, can be delivered to the mixing plant by calibrated auger. However, the DMM contractor must prove that the calibrated auger can deliver the quantity of dry admixture with accuracy equivalent to that measured and delivered by weight. Equipment for proportioning used during binder production should be calibrated prior to initial use and repeated every 3 months or every time the batch plant

134
is relocated. Simple checks of material quantities should be made routinely, such as counting the number of bags or truckloads of binder materials that have been used. These quantities should be reported in the daily production report.
Dry binder and water must be mixed in the slurry plant for uniform suspension of binder in the water. The uniformity of binder slurry should be verified by specific gravity tests of the slurry in the agitation tank. A maximum holding time of 4 h in the agitation tank is recommended. Holding time is calculated from the beginning of the initial mixing.
The contractor should measure the specific gravity of the binder slurry at least twice per shift per slurry plant using the methods outlined in ASTM D4380.(129) This simple and quick test provides an indicator that the binder slurry meets the mix design criteria established in the bench-scale testing. Early indication of slurry density allows the contractor the opportunity to adjust mix proportions prior to injection. Other verification methods, such as coring and wet grab sampling, are completed after mixing when changes can no longer be made. The specific gravity of the binder slurry measured during production may not deviate by more than 3 percent from the established specific gravity. If the specific gravity is lower than that required by the mix design, the contractor should add additional cement and remix and retest the slurry. Alternatively, the engineer may request that the DMM contractor recalibrate the batch scales and perform additional testing. The specific gravity measurements should be indicated in the daily production report (see section 9.3.6).
Binder Injection Rate
The binder injection rate per vertical foot (meter) of column is determined in accordance with the design mix, which is based on the bench-scale testing program and the contractor’s experience (not applicable for TRD). The mix design and required binder injection rate are verified during the field validation program by assessing the uniformity of the core and the strength of core samples. During production, the binder rate must be monitored constantly and controlled on a real-time basis. The contractor must record in the daily production report the weight of dry binder or the volume of binder slurry injected for each 3 ft (1 m) (measured vertically) during penetration and withdrawal for each element. These records can and should be used to calculate the binder factor as a function of depth much more reliably than chemical testing methods such as performing cement content tests of hardened soil-cement mixtures.
If the weight of dry binder or the volume of binder slurry injected per vertical foot (meter) is less than the amount required to meet the binder factor or volume ratio established during the field validation program, the element must be remixed, and additional binder must be injected at the design binder injection rate to a depth at least 3 ft (1 m) below the deficient zone.
The contractor may request that the established binder factor or water-to-binder ratio of the slurry be modified during the production installation. To verify acceptable results for the proposed modification, the engineer may require additional testing or a new test section at no additional cost to the owner.

135
Mixing Tool Rotation Speed and Penetration/Withdrawal Rates
Each DMM column must be installed without interruption. If installation is interrupted for more than 1 h, the element must be remixed while injecting binder at the design rate for the entire length of the element. The DMM equipment should be able to remix the element with additional binder within 24 h. Setting of the binder mixture generally will not prevent remixing by properly sized equipment.
The mixing tool rotational speed and penetration/withdrawal rates are adjusted so that resultant mixing of the soil and binder slurry will produce the required uniformity and strength. The required rotational speed and penetration and withdrawal rates for the various soil layers encountered are selected by the contractor and verified during the field validation program.
The rotational speeds and penetration/withdrawal rates must be monitored on a real-time basis during production. If BRN is more than 15 percent below the value determined to be reliably acceptable from the field validation program, the column/element section must be remixed while injecting grout at the design binder injection rate. The rotational speeds and penetration/withdrawal rates must be recorded in the daily production report.
The contractor may request that the established mixing parameters be modified during the production column installation. To verify acceptable results for the modified parameters, the engineer may require additional testing or a new test section at no additional cost to the owner. Alternatively, if sufficient data are available from production columns in support of modified mixing parameters, the owner may accept such data in lieu of an additional test section.
Element Verticality
The equipment operator should monitor and control the vertical alignment of the mixing tool stroke in two directions (longitudinal and transverse to the element alignment). Vertical alignment should be maintained within 1 percent of plumb during the element installation. Manual or automated verticality readings should be recorded in the daily production report at the frequencies outlined in the specification.
Element Top and Bottom Elevations
The termination depth of DMM elements is designed to meet the foundation requirements of the structure, as discussed in chapter 6. For designs that specify the top and bottom elevations of the DMM elements, the constructed elements must extend from the specified bottom elevation or lower to the specified top elevation or higher. The specified top and bottom elevations may vary across the site depending on in situ ground conditions and facility requirements.
For sites that have a well-defined competent bearing stratum, the necessary bottom elevation can be based on refusal criteria determined from penetration speed, vertical load from the mixing tool, mixing energy, and power consumption needed for mixing tool penetration. The refusal criteria can be developed during the field validation program by installing test elements within 5 ft (1.5 m) of an existing boring and recording the operational parameters encountered when the intended competent stratum is reached as indicated in the adjacent boring. If mix designs or operational procedures are modified during production, refusal criteria must be reestablished.

136
The total depth of penetration can be measured either by observing the length of the mixing shaft inserted below a reference point on the mast or by subtracting the exposed length of shaft above the reference point from the total shaft length. The contractor is responsible for achieving the specified top and bottom elevation requirements and for recording the actual elevations. However, remedial measures for elements of insufficient depth could significantly and adversely impact project costs and schedule, and it is helpful for the engineer to observe and confirm the element termination depth during construction. The mixing equipment must be adequately marked to allow QA personnel to confirm the penetration depth. The depth may also be determined by instruments and displayed in real-time. The contractor should measure and record top and bottom elevations in the daily production report.
If the depth to the competent soil layer at the bottom of the DMM element is found to be different from that indicated on the plans, the engineer may direct the contractor to shorten or deepen the element. The contractor should be compensated based on the decreased or increased amount of deep mixing as the engineer varies the termination depths. However, the contractor should not be compensated for any portions of the elements that are above the top elevations or below the bottom elevations shown on the plans that are not approved by the engineer.
Bottom Mixing
When the mixing tool reaches the design depth, bottom mixing is generally required to provide an adequate level of mixing in the lower portion of the DMM column. Bottom mixing is conducted by lifting the mixing tool approximately 5 to 10 ft (1.5 to 3 m) above the design depth while maintaining mixing action and repenetrating to the design depth. The zone and procedure of bottom mixing should be established during the field validation program. (Note that bottom mixing is not applicable for CSM or TRD.)
Control of Spoils
The contractor is responsible for controlling and disposing all waste materials produced as a result of the mixing operation in accordance with the project requirements. Areas for containing and processing the spoils should be designated on the project plans.
The contractor’s selection of means and methods can be heavily influenced by requirements and procedures for handling spoils. Spoils may be handled in several different ways. Often, the spoils are contained at the ground surface until they are sufficiently cured to be stockpiled and used for engineered fill. If unacceptably high pH levels preclude the use of spoils as fill, removal and offsite disposal may be necessary.
12.2.5 QC Documentation
The contractor should report the QC activities and results in the daily production report and submit the report to the engineer by the end of the next business day. The engineer should review daily production reports in a timely manner. The data submitted in these reports are indicators that the contractor is adhering to the procedures established during the field validation program and properly implementing the QC program. Strength and uniformity of the treated soil are used for acceptance, as described in section 12.3.6.

137
12.3 QA
QA is generally performed by the engineer (or owner’s representative) and includes the following tasks:
• Observing the soil mixing operation and QC tasks performed by the contractor.
• Observing sampling of treated soil, selecting samples to be tested, logging core samples for uniformity assessment, and reviewing the testing data to ensure that the treated soil meets the design requirements.
• Conducting independent sampling and testing to verify the results submitted by the contractor, if necessary.
12.3.1 Role of QA Personnel
QA personnel observe the DMM installation and QC operation performed by the contractor, communicate with the contractor’s QC personnel, and review the QC submittals. QA personnel may also perform independent sampling and testing. The QA personnel should inform the QC personnel and the owner/engineer immediately if deficiencies are identified. Early correction of a deficiency often reduces costs and schedule delays.
12.3.2 Engineering Properties to be Verified for QA Purposes
For ground improvement applications, the most commonly used engineering property for QC/QA is unconfined compressive strength. Permeability and strength are used for earth retention or groundwater control applications. Other engineering properties required for the design of most DMM projects (shear strength, tensile strength, and modulus) can be obtained by correlation with unconfined compressive strength.
12.3.3 Coring
Core samples provide the best representation of the hardened in situ DMM column. Assessing full-depth continuous cores of DMM elements is most frequently used as the basis for approval of the uniformity and strength of treated soil. Core testing data reflect the inherent variation of subsurface soil conditions and consequently exhibit greater variation in engineering properties in comparison with data obtained from testing wet samples.
Coring Methods
Full-depth continuous core samples may be obtained using coring methods available in the United States. Triple tube sampling techniques or equivalent provide the highest core recovery and lowest core disturbance. Double tube sampling techniques can also be used to retrieve the core samples.
Core recovery is calculated as the total length of recovered core divided by the total core run length (expressed as a percentage). Total length of recovered core includes the lengths of both treated and untreated soils. Percent treatment is calculated as the total length of recovered core

138
minus the sum of the lengths of unmixed or poorly mixed soil regions or lumps that extend across the entire diameter of the core divided by the total core run length (expressed as a percentage). Unrecovered core is considered untreated soil for the purpose of determining percent treatment unless convincing documentation can be provided by optical logging of the core hole walls that the lack of recovery was due to the coring process.
Cores should be taken continuously from the top to the bottom of the column. Each core run should be approximately 3 to 5 ft (1 to 1.5 m) in length, and core diameter should be at least 2.5 inches (64 mm). To calculate the core recovery for each run, the elevation of the bottom of the core holes should be measured after each core run. Cores should be retrieved at a distance of one-fourth the column diameter from the column center. This location has been shown to yield the most representative samples of the treated material. Material at the center of the column may tend to be higher in binder slurry content, especially if a binder slurry with relatively high water-to-binder ratio is used. Obtaining cores located at the periphery of the column can be difficult because the core barrel tends to exit the column and penetrate into the native soil. Inclined cores are occasionally obtained to locate the interface between adjacent columns. If drilling tends to exit the column at this coring location, the contractor may drill one-fourth of a column diameter along the centerline of an element or shear wall so the core enters the adjacent column in the same element.
The contractor should determine the time interval between column installation and coring that will allow the treated soil to gain adequate strength and avoid low core recovery and sample disturbance. For 28-day strength testing, the core samples can be retrieved at 20 to 26 days after installation. Core samples retrieved at earlier curing ages tend to have lower recovery and higher sample disturbance.
Core samples with diameters smaller than 2.5 inches (64 mm) tend to exhibit increased sample disturbance and reduced core recovery. Core samples with diameters greater than 3 inches (76 mm) have improved recoveries and less disturbance but can be more costly to retrieve and difficult to handle and transport. Reducing the coring rate (core distance drilled per hour) will usually improve core recovery and reduce sample disturbance.
Core operators with experience in coring soft rocks can retrieve core samples from treated soil with satisfactory recovery and quality. Core samples generally reflect some sample disturbance due to the core process even with a good coring tool and a skilled core operator. The presence of gravel in the mixed soil can cause cracks and other damage during coring and thereby reduce core recovery. During the coring process, gravels inside the soil-binder mixture tend to break or grind the core samples. In cases of poor core recovery, an optical televiewer may be used to supplement assessment of uniformity. Worn or inadequately maintained cutting heads, core rods, and other coring devices tend to reduce the recovery and quality.
All core holes must be filled with slurry with 28-day strength equal to or greater than the specified strength of the treated soil.

139
Coring Locations and Frequency
For each field validation test section, at least one element for each mix design should be cored for the full depth from the top to the bottom of the element.
For production elements on typical DMM projects, one full-depth continuous core should be made for every 3 percent of elements. An element is defined as the treated soil produced by one setup of either a single- or multiple-axis machine. For smaller, more critical, or more complex projects or for projects at more critical locations within otherwise typical projects (i.e., structure foundations), the engineer could specify that more elements must be cored, up to 4 percent of the total production elements. For a larger, less critical, and less complex project (i.e., a large DMM embankment foundation project in similar subsurface soils along the entire alignment), the engineer could specify that 2 percent of the production elements should be cored. At a minimum, five production elements should be cored at full depth so that a reasonable amount of data are collected, even for small projects.
Some deep mixing equipment produces a relatively large treated area in each element, whereas other equipment produces a relatively small treated area in each element. For example, if the same project were done using two mixing machines that both produce 3-ft (1-m)-diameter columns, and the same column overlap is used, but one machine is single-axis and the other is a six-axis machine, then up to six times as many cores would be necessary for the single-axis machine as for the six-axis machine when the number of cored elements is specified on a percentage basis. A justification for requiring a smaller number of cores for equipment that produces larger treatment areas per element is that the same binder factor, mixing parameters, and blending action apply to the entire area treated. Nevertheless, an engineer may want to consider adding a treatment area criterion to the percentage criterion for determining the number of elements to be cored so that a sufficient amount of data can be collected even if the contractor uses equipment that produces a large treated area per element. For example, an engineer may want to specify that full-depth coring be done on 3 percent of elements or for every 860 ft2 (80 m2) of treated ground, whichever produces the greater number of cores. In this example, the 3 percent criterion would control for all types of elements that produce a treated area smaller than 25 ft2 (2 m2) after accounting for overlaps between elements, and the 860 ft2 (80 m2) criterion would control for all types of elements that produce a treated area larger than 25 ft2 (2 m2) after accounting for overlaps between elements.
The coring frequency should be selected by the engineer during the design stage based on consideration of project size, criticality, and complexity. The selected coring frequency can be stated in the specifications either as a percentage of elements or as a combination of the percentage of elements and the treatment area, depending on the project needs.
For TRD or cutoff walls, every 1,000 yd3 (750 m3) of treated soil or every 300 ft (90 m) of wall in the horizontal direction should be cored. For small-sized projects, at least five elements should be cored to provide a reasonable amount of information for evaluation of deep mixing work.
140
Core Sample Handling and Testing
Upon retrieval, the full-depth samples should be provided to the engineer for logging, selecting test specimens, and assessing whether uniformity and recovery criteria have been satisfied. Following logging, the engineer selects specimens for strength testing. At least five test specimens should be collected from each full-depth continuous core for unconfined compressive strength testing. Test specimens should have a length-to-diameter ratio of 2 or greater.
Engineering judgment must be used to select test specimens to minimize the potential for biasing the data. Samples should be selected carefully to represent the deep mixed element rather than focusing on samples that appear to be unusually weak or that contain inclusions of unmixed soil that are not proportionately representative of the entire column. For example, testing a core sample containing a gravel-sized piece of unmixed soil would simulate testing a column containing a boulder-sized piece of unmixed soil. This situation is unrealistic unless there is highly unlikely evidence that boulder-sized pieces of unmixed soil exist in the column.
Immediately following logging and test specimen selection by the engineer, the entire full-depth core sample, including the designated test specimens, must be sealed in plastic wrap to prevent drying and transported to the laboratory by the contractor. The samples must be stored in a moist room in accordance with ASTM C192 until the test date.(130) Treated soil samples must not be submerged in water during curing unless they are sealed in a water-tight, zip-sealed plastic bag. It is important to remove as much air as possible prior to sealing to avoid sample swelling.
The portions of the samples that are not tested must be retained by the DMM contractor for possible future inspection and confirmation testing by the engineer until completion and acceptance of all DMM work. If a large volume of samples cannot be reasonably stored on the job site, cores from elements deemed satisfactory may be disposed of prior to project completion if approved by the engineer.
The unconfined compressive strength testing should be conducted by an independent laboratory retained by the DMM contractor and approved by the engineer. Testing for 28-day unconfined compressive strength should be conducted in accordance with ASTM D2166, except that loading should continue on all specimens until the cylinders break sufficiently to examine the interior of the specimen.(131) The broken specimen should be photographed so that the engineer may document any apparent segregation, lenses, and pockets in the specimen.
In addition to tests performed by the contractor, additional confirmation tests may be performed by the engineer on samples collected by the DMM contractor. Both the DMM contractor’s testing and the engineer’s testing, if performed, must demonstrate that the required strength criteria are met prior to acceptance of the work.
Coring Considerations and Potential Drawbacks
Generally, 2 to 3 weeks of in situ curing time must elapse to allow sufficient strength gain before cores can be retrieved with an acceptable level recovery and without excessive disturbance. If early strength is needed for modification of mix designs, wet samples (see section 12.3.4) can be collected and tested in combination with coring. Costs for core sampling are generally higher than for wet sampling.

141
Obtaining good core recovery in treated ground with gravel or cobbles can be difficult or impossible. When coarse-grained soils prevent core recovery even with high-quality triple-tube coring methods, acceptance should be permitted based on the strengths from wet grab samples combined with optical logging to verify thoroughness of mixing.
Core samples are not generally suitable for permeability testing. Erratic testing results may result because of fissure cracks induced during the coring process. When permeability testing is critical to the design intent of the structures (e.g., a DMM wall for excavation support and seepage control), wet sampling must be used to produce test specimens for permeability testing.
12.3.4 Wet Grab Sampling
Wet grab samples are produced from bulk samples obtained from discrete locations within DMM elements. Test specimens from the bulk samples are cast and cured under consistent conditions. A single bulk sample can produce nearly identical duplicate test specimens for parameter studies on the effects of binder type, quantity, age, and curing conditions.
During a field validation program, wet sampling can provide information on the reaction of the binder slurry with the in situ soil that can be used to modify mix designs. Wet grab samples tested at 3, 7, 28, and 56 days or more can be used to develop the relationship between the strength and curing age to provide the DMM contractor with information on the rate of strength gain for predicting production strengths.
In production, wet sampling and testing can be used to identify potential weak zones in the treated soil, thereby providing an early indicator before coring operations are performed at 28 days. If wet samples produce results that are consistently acceptable, the frequency of wet sampling can be reduced as the project progresses.
Testing data from wet sampling should be used as an indicator rather than as acceptance criteria. The sampling device tends to retrieve a greater proportion of binder slurry volume than mixed soil because clumps of relatively unmixed soil do not tend to flow as easily into the wet sampling device, possibly making the sample less representative of the overall treated material. In addition, the curing conditions (i.e., temperature, drainage, and pressure) differ from in situ conditions. Since wet samples are obtained from discrete locations within elements, the samples may not represent natural variation in subsurface conditions.
For earth retention or groundwater control applications, permeability tests are generally performed using wet samples for more consistent and reliable testing results. Core samples are generally not suitable for providing samples for permeability testing due the potential for side wall leakage due to the roughness of the core surface and the potential for fissure cracks induced during coring.
Wet Grab Sampling Methods
Wet grab samples should be retrieved from DMM columns immediately after installation and before hardening of treated soil. Various bailer-type sampling tools, including tubes or boxes of different configurations, are used to collect samples. Recommended procedures for sample handling and specimen preparation are described in appendix A. It is important to use standard
142
procedures for preparing and testing specimens to allow test results to be used and compared consistently.
Wet Grab Sampling Locations and Frequency
The contractor should perform all wet grab sampling in the presence of the engineer. The contractor should notify the engineer at least 1 business day in advance of beginning sampling operations. For each test section, a minimum of three wet samples should be retrieved for each mix design used.
In production, for embankment and foundation support applications, one wet sample (i.e., one selected depth at one location) should be retrieved every two production days or for every 2,000 yd3 (1,500 m3) of treated soil, whichever produces the higher sampling frequency.
The contractor proposes locations for wet sampling as outlined in the QC program, considering input from the owner/engineer based on subsurface conditions, DMM layout, review of the QC results, and observation of the soil mixing operation. The sample locations should be distributed uniformly both laterally and vertically within the deep mixed zone. Sampling depths should be selected to ensure that wet samples are retrieved from every main soil stratum underlying the site.
The contractor should report all attempts, successful and unsuccessful, to obtain wet samples. Some deep mixed material may not be able to be sampled readily because either the mixture is too stiff or the material may not flow back into the void left after the sampler is extracted, possibly leaving a damaged element.
Wet Grab Sample Handling and Testing
The sampling tool is inserted into the DMM column to a designated depth, filled with treated soil, and lifted to the ground surface. The treated soil material is then poured into a container, screened for oversized lumps (gravel versus unmixed soil), and placed in 3-inch (76-mm)-diameter, 6-inch (152 mm)-long molds for use as test specimens using procedures similar to those described in appendix A. Normally, eight test specimens are prepared from each wet sample. The engineer may request additional test specimens for QA testing. The volume and composition of oversized lumps should be measured and described. Care should be taken to avoid additional mixing or kneading action on the sample during screening so that the sample is as representative as possible of in-place mixing conditions. The wet treated material should be placed into the mold in three to five layers. After the placement of each layer, the specimens must be tapped or vibrated to remove trapped air bubbles. The specimens should be sealed to prevent moisture from entering or leaving the specimens, and the sealed specimens should be stored in a humid environment.
Immediately after test specimens are prepared, they should be stored until testing in an environment with 100 percent relative humidity and temperature between 68 and 77 °F (20 and 25 °C). If approved by the engineer, the specimens may also be cured at a higher temperature to simulate the in situ curing temperature. It has been reported that temperature in treated soil columns with a high binder factor can exceed 100 °F (38 °C) for more than 3 months in the

143
ground.(132) Once prepared, the specimens should not be moved until they have cured sufficiently to prevent disturbance during transportation.
Laboratory unconfined compressive strength tests on cured wet specimens should be conducted in accordance with ASTM D2166, except that loading should continue on all specimens until the cylinders break sufficiently to examine the interior of the specimen.(131) The broken specimen should be photographed, and any apparent segregation, lenses, and pockets in the specimen should be documented. For field validation testing, unconfined compressive strength testing may be performed on specimens at 3, 7, 28, and 56 or more days. For full production work, unconfined compressive strength testing may be performed at 7 and 28 days.
Laboratory permeability testing should be performed on cylinders at 7 and 28 days for the test section and usually only at 28 days for the production elements. Laboratory permeability testing should be conducted in accordance with ASTM D5084.(133)
Wet Grab Sampling Considerations and Potential Drawbacks
Wet sampling has the following drawbacks when it is used as a tool for QC/QA:
• A wet sample is not representative of the in situ mixing and curing conditions of the DMM column. Wet samples may be unrepresentative and biased when the soil and binder slurry are not mixed uniformly. Slurry tends to enter the sampling tool more easily than the non-uniform soil-binder mixture and the unmixed soil lumps. During the lifting of the sampling tool, soil-binder or slurry at higher depth might enter the sampling tool and make the bulk sample less representative, depending on the design of the sampler.
• Results of testing of wet samples cannot be used as the basis for final acceptance of DMM work for ground improvement. Wet samples can be used for permeability testing, and the results can be used for final acceptance in conjunction with core sampling testing results for shoring or groundwater control applications.
• Wet sampling can only be used to retrieve soil-binder mixture at a single depth per sample attempt and requires multiple insertions or multiple samples on a single probe to obtain samples at different depths. Wet sampling does not provide continuous samples for evaluating the condition of the soil mixing along the full depth of the DMM column.
• Some thick and plastic mixes are not amenable to wet grab sampling. In such cases, attempting to perform wet grab sampling can damage an otherwise suitable DMM element.
12.3.5 Other Verification Methods
Exposure and Inspection
DMM columns can be excavated and exposed for observation, sampling, and testing. For zones of mass stabilization, a large diameter inspection shaft can be constructed within the DMM block. An alternative to personnel entry is a down-the-hole camera, which can be used to inspect

144
the inside surface of the borehole, especially in zones where core samples cannot be retrieved, such as in a gravelly soil stratum.
Penetration and Pull-Out Tests
Common penetration and pull-out tests include the following:(134)
• Column penetration test: The column penetration test device consists of a probe equipped with two opposite vanes approximately 4 inches (100 mm) smaller than the DMM column diameter. The test is performed by inserting the probe into the center of DMM column at a constant speed of about 0.8 inches/s (20 mm/s) and continuously recording the resistance. This method is commonly used for columns produced by the Nordic dry mixing method with unconfined compressive strengths less than 50 psi (345 kPa) to depths of about 25 ft (8 m). Predrilling is needed through treated materials with unconfined compressive strength up to100 psi (690 kPa) and depths of 80 ft (24 m).
• Pull-out resistance test: This test is also referred to as the reverse column penetration test. A probe similar to that for the column penetration test is attached to a wire and placed at the bottom of the DMM column during production, remaining in place until testing. At a specified curing time, the probe is withdrawn from the column, and resistance is recorded continuously. This test is applicable for treated soil with unconfined compressive strength less than 175 psi (1.2 MPa) and depths up to 65 ft (20 m).
Other In Situ Direct Testing
Numerous in situ direct testing methods have been investigated or applied for the evaluation of the in situ strength of DMM material. However, these methods have not been adopted for routine use like the coring and wet sampling methods. The following are in situ direct test methods:(134)
• SPT: The conventional SPT for soil investigation involves driving a split-spoon sampler into the DMM column. SPT blow count values (N) are correlated with unconfined compressive strength.
• CPT: The cone of the conventional CPT is used to penetrate the DMM column and record the tip resistance, which is correlated with undrained shear strength. Dynamic cones are also driven with hammers to measure the blow counts for a certain depth of penetration. The blow counts are then correlated with strength or used to determine variations of strength with depth.
• Pressuremeter test: A pressuremeter test is a borehole lateral load test in which a cylindrical probe is expanded radially onto the borehole wall. Elastic modulus and the strength of the DMM column are evaluated from the measured pressure and radial displacement.
• Column vane test: The column vane test was developed and is used in Finland to measure the shear strength of lime-treated soil. The diameter of the vane is 5 to 6 inches

145
(130 to 160 mm), and the height is half the diameter. This method is applicable for DMM columns with unconfined compressive strength less than about 60 psi (400 kPa).
• Rotary penetration sounding test: A sensing rod equipped with a special drilling bit is attached at the bottom end of a drilling shaft. While drilling into the DMM column, drilling speed, rotation, thrust, torque, and water pressure at the drilling bit are measured and recorded by the data logger in the sensing rod. Unconfined compressive strength is correlated to measured data.
Geophysical Testing
The use of the following geophysical testing methods has been investigated or applied for the evaluation of the in situ strength of DMM column, but the methods have not been adopted for routine use like coring and wet sampling:(134)
• PS logging: By measuring the travel times of compression waves (P-waves) and/or shear waves (S-waves) at several depths, soil layering is identified and the P- and S-wave velocities are calculated. Measurements can be made either by down hole tests or by the suspension method. P- and S-wave velocity distributions with depth reflect the uniformity of DMM columns. Elastic modulus of the DMM column at small strains can also be calculated from these velocities.
• Electromagnetic methods: Electromagnetic methods measure electrical and magnetic properties of the ground to identify soil layering, cavities, and underground utilities. These methods include ground penetrating radar, electrical resistivity survey, and magnetic survey. Applications of these techniques to the DMM ground are still in the research stage.
12.3.6 Acceptance Criteria
The engineer should determine the acceptability of the test results. The treated material must meet acceptance criteria relative to geometric layout, strength, and uniformity. The following subsections include examples of generalized acceptance criteria. However, the engineer should develop project-specific acceptance criteria based on the requirements of each project.
Acceptance Criteria for Geometric Layout
The DMM element should be installed within the following general geometric tolerances:
• The horizontal alignment of the DMM element should be within 4 inches (100 mm) of the planned location at the top of the DMM layout.
• The overlap between any two adjacent elements should be as specified by the design engineer based on analyses of vertical shearing, as described in chapter 6, and considering common tooling in the deep mixing industry. Overlap up to 20 percent of the cross sectional area of a single column has typically been specified for shear walls.

146
• The vertical alignment should be maintained to within 1 percent of plumb during the DMM column installation.
• The top of the column should extend upward to the designated elevation or higher.
• The bottom of the DMM column should extend at least to the depth indicated on the plans or as modified by the engineer in the field.
Acceptance Criteria for Treated Soils
The strength acceptance criteria have a major influence on the distribution of strength data obtained during full production. An acceptance criterion requiring that all test data exceed a specified value could require that the contractor produce treated soils with strength significantly higher than the design value, which already incorporates a factor of safety, as discussed in chapter 6. Specifications that allow a certain percentage of test results to be lower than the specified value reduce over-conservatism, but such specifications can still be written to fully satisfy the design intent. The recommended strength criteria include the following:
• A total of 80 percent of test results from each tested deep mixed element should equal or exceed the specified strength. When combined with the requirement that at least five specimens be tested from each full-depth continuous core, this provision allows one test result per full-depth core to fall below the specified strength.
• To prevent a weak layer at one elevation in the DMM foundation system, strengths below the specified strength are not permitted within 10 ft (3 m) of the same elevation in more than two nearby cored elements. Nearby cored elements refer to cored elements without an intervening cored element that has a passing test result in the suspect elevation zone.
• A total of 90 percent of all of the test results across the site should equal or exceed the specified strength.
• If a strength specimen falls below the specified strength due to an obviously unrepresentative lump of unmixed soil in the specimen, the engineer has the option to select and test another specimen from the same core run. Only one such retest will be allowed per core run. The objective of this provision is to avoid incorporation of test results from specimens that contain lumps of unmixed soil that, if scaled to the full element size, would be unrepresentative of the actual size of unmixed soil that observations of core and spoils indicate could exist in the element.
• A minimum strength requirement should not be specified.
Uniformity acceptance criteria encourage the contractor to provide a level of soil-binder mixing energy sufficient to reduce the occurrence of untreated lumps and variation of treated soils. The recommended uniformity criteria for transportation projects include the following:
• Full-depth continuous core samples retrieved by the contractor from the DMM column should be used to evaluate uniformity.

147
• Core recovery (expressed as a percentage) should be reported and is equal to the total length of recovered core divided by the total core run length. Length of recovered core includes lengths of treated and untreated soil.
• Percent treatment is calculated as the total length of recovered core minus the sum of the lengths of unmixed or poorly mixed soil regions or lumps that extend across the entire diameter of the core divided by the total core run length expressed as a percentage. Percent treatment must be at least 80 percent for every 5-ft (1.5-m) core run. If 80 percent treatment cannot be confirmed by coring in coarse sandy or gravelly soil, optical televiewer logs can be used to confirm uniformity.
• If the contractor uses core runs shorter than 5 ft (1.5 m) (e.g., 3 ft (1 m)), then the recovery and percent treatment can be calculated taking in equal amounts of core run length on either side of the short core run length to make up a total 5-ft (1.5-m) run length for calculation purposes.
Although the uniformity criteria are recommended for typical transportation projects, other uniformity criteria can be considered. Core recovery, maximum size of untreated soil, sum of the length of unmixed or poorly mixed soils greater than the core diameter, and rock quality designation (RQD) have also been used as indices for uniformity. The ranges frequently used for core recovery are at least 80 to 85 percent for every 3- to 10-ft (1- to 3-m) core run and an average of at least 85 to 90 percent core recovery for the full-depth core from top to bottom of the element. If the percent of core recovery cannot be obtained in gravelly soil, optical televiewer logs can be used to confirm uniformity. In some projects, a minimum RQD varying from 50 to 70 percent has been required in conjunction with core recovery. The higher bounds of these ranges are specified for projects that demand high strength or lower variation of the treated soils. A maximum size of untreated soil varying from 6 to 12 inches (150 to 300 mm) has been specified. The sum of the lengths of unmixed or poorly mixed soil regions or lumps that extend across the entire diameter of the core are required to be less than 10 to 20 percent of the core run length. The lower bounds of these ranges of requirements on the maximum individual lump size and sum of the lengths of untreated soil are specified for projects that demand high strength or lower variation of the treated soils.
In some special cases, such as the use of a deep mixed block for uplift resistance, the unit weight of treated soils may be specified. For wet deep mixing in soft ground, the change in unit weight after soil mixing is negligible for typical binder factors and area replacement ratios used for embankment and structure support applications in transportation infrastructure projects. However, in cases that require uplift resistance and when DMM is used at sites underlain by soils with a unit weight greater than the unit weight of the binder slurry, the unit weight of the treated soils will be lower than the untreated soils. The unit weight of binder slurry generally ranges from 91 to 101 lbf/ft3 (14 to 16 kN/m3) for a water-to-binder ratio of 0.8 to 1.2. Slurries with water-to-binder ratios greater than 2.0 have been used for cutoff wall installation or treatment of clay soils with high plasticity. The unit weight of treated soil can be calculated as outlined in chapter 5. Caution should be given when specifying unit weight because the DMM contractor has limited control over the unit weight of the treated soils and the use of a water-to-binder ratio less than 1.0 might be difficult in stiff soils or sandy soils. If needed, the unit weight criteria could include provisions such as the following:

148
• The average unit weight of treated soil should be 100 lbf/ft3 (15 kN/m3) or higher.
• The final unit weight requirement will be determined by the engineer using the data obtained from the field validation program.
12.3.7 Remedial Measures for Noncompliance
Geometric Layout
Although the rejection of completed DMM work based on geometry noncompliance is unusual, control and monitoring of alignment, verticality, top elevation, and bottom elevation are very important. The QC and QA personnel are responsible for observing geometric layout of the production work on a daily basis. If the element does not fall within specified tolerances, the contractor must correct the construction procedure before production work is allowed to continue. Minor repairs could be made by redrilling before the hardening of treated soil or by installing additional elements to replace the misaligned elements, as approved by the engineer.
Treated Soil
If DMM elements fail either strength or uniformity criteria, the contractor and the engineer should work together to evaluate the operational data, and the contractor may collect an additional core sample in the same element for the engineer to assess the extent of the deficient zone. If the additional core meets the criteria, then the element should be accepted. Alternatively, the contractor should be allowed to core the elements on both sides of the failed element. If those two cores meet the criteria, then the element should be accepted. If the additional cores fail, then the contractor can propose remedial measures, which the engineer will review and accept or reject, depending on whether the proposed remedial measures meet the design intent. Examples of such remedial measures include the following:
• In the case that treated soil meets uniformity criteria but fails to meet the strength criteria, elements or zone could be assigned a lower strength level. The contractor could propose installing additional elements to compensate the strength required by the design intent. If treated soil fails to meet the uniformity criteria, elements must be remixed or replaced.
• If treated soil that fails to meet uniformity criteria is concentrated in a narrow elevation range forming weak planes or zones, the contractor could propose to redrill and remix to 3 ft (1 m) below the deficient zone. If redrilling and remixing cannot be done efficiently, the contractor must replace the elements to the full depth. If treated soil in the narrow elevation meets the uniformity criteria but fails to meet strength criteria, the contractor could propose to redrill and remix the deficient zone or assign a lower strength level to deficient zone and install additional elements to compensate for strength deficiency.
• If the treated soil that fails to pass cannot be isolated in a specific zone, the contractor will be required to provide remedial measures for all elements constructed during all rig shifts that occurred between passing elements.
• Remedial measures are subject to coring and application of specification acceptance criteria.

149
CHAPTER 13. COST ESTIMATING
The purpose of this chapter is to present the factors that must be considered when developing a cost estimate for a DMM project for embankment or foundation support and to provide the user with a method of estimating the cost of DMM at the feasibility stage of the decision process. Cost estimating for DMM projects differs from that of conventional specialty geotechnical engineering processes because the project costs are heavily dependent on site conditions, construction methods, materials used, project performance requirements, and market conditions, all of which can vary significantly. A range of unit costs for DMM production works are provided that transportation department engineers may use to calculate reliable preliminary cost estimates for comparison with alternative technologies. These unit costs are provided for use in the preliminary stages of engineering design when limited site information is available. It is critical that engineers refine estimates based on project requirements and site-specific data. Engineers are encouraged to solicit cost estimates from qualified DMM contractors to develop more precise project budgets.
13.1 FACTORS THAT AFFECT DMM COSTS
The factors that affect the costs of a DMM project are listed in table 21. Comments on how variations in these factors affect unit costs are also provided.
13.2 UNIT COSTS FOR DMM
Considering the factors listed in table 21, a range of unit costs may be assumed for estimating purposes. The lower and upper limits of the range reflect the general conditions outlined in table 22. These costs include production (labor and equipment) and binder material costs only. Mobilization/demobilization, QC/QA, and engineering must be estimated separately.
13.3 MOBILIZATION/DEMOBILIZATION
Mobilization/demobilization costs depend on the location of the site relative to locations of qualified contractors. Also, the size of the project dictates the number of rigs to be mobilized to a site. A reasonable suggestion for mobilization/demobilization is approximately $80,000 to $150,000 per rig for a site located up to 200 mi (320 km) from qualified contractors.
13.4 QC/QA COSTS
QC/QA costs may be estimated as 3 to 5 percent of the production DMM costs. This estimate includes costs associated with the owner’s tasks for assuring the quality of the work. The upper end of the range is applicable for projects with higher strength QC/QA criteria or permeability requirements less than 4.72 × 10⁻⁵ ft/day (10-6 cm/s) and the lower end may be applied for projects with lower strength acceptance requirements or a higher permeability criterion (greater than 4.72 × 10⁻⁵ ft/day (10-6 cm/s)). Pre-construction bench-scale testing may be estimated on a lump sum basis as $10,000 to $20,000.

150
13.5 ENGINEERING COSTS
The owner’s engineering costs for conducting the site investigation, considering alternatives, designing the DMM system, developing the specifications, performing a limited bench-scale mixing program during design, and providing QA services are estimated to be about 10 percent of the DMM construction costs. The contractor’s engineering costs for preparing as-built drawings, other submittals, and QC services are included in the unit costs listed in table 22.
For a design-build project, the owner’s engineering costs should be added to the DMM construction costs.
Table 21. Generalized factors affecting costs of DMM projects for embankment and foundation support.
Factors Affecting DMM Costs Comments
Type of mixing Wet or dry. Presence and type of environmental contamination
For the purposes of this report, the site soils for DMM work for embankment and foundation support are assumed to be uncontaminated and therefore do not require extraordinary spoils handling methods or personnel protective equipment and procedures in excess of those required for clean site requirements.
Binder materials • Using locally available conventional binders such as Portland cement, granulated blast furnace slag, and flyash result in lower costs.
• Transporting large quantities of binder materials to remote sites increases costs.
• Using higher binder/soil ratios to mix organic soils or meet higher strength QC/QA criteria increases costs.
Site access • Mixing at sites with relatively free access is less costly. • Mixing at congested sites or sites with unstable platforms for equipment is
more costly. Site soils • Soils that are relatively easily mixed and free of obstructions (i.e., cobbles,
boulders, or large debris) and are granular in nature cost less to mix. • Stiffer/denser cohesive soils and soils containing organics/peat are more
costly to mix. • Predrilling increases costs.
Project size/quantity of mixing work
Unit costs ($/yd3 ($/m3)) are lower for larger projects (greater than approximately 26,000 yd3 (20,000 m3)).
Depth Mixing to depths in excess of 25 m (80 ft) increases costs. Application • Higher-strength requirements and higher binder injection quantities increase
costs. • Ground treatment applications (mass stabilization) typically have lower
costs than higher strength ground improvement (load bearing columns/element) applications on the basis of cost per unit volume treated.
QC/QA Excessively rigid QC/QA criteria or more consequences for non-conformance with specifications increase costs.

151
Table 22. Unit costs and associated general project conditions. Unit Production Cost ($/m3) (includes labor,
equipment, and materials) Factors That Influence Unit Cost Approximate low estimate (best case conditions)
$100/m3 • Wet mixing is assumed. • Environmental contamination is not present or is present at
levels that will not affect mixing performance. • Binder materials are readily and locally available. • Typically cement, granulated blast furnace slag, and flyash
are used. • Site access is relatively free, no overhead restrictions are
present, and a stable platform is available for equipment. • Project is relatively large (e.g., greater than 26,000 yd3
(20,000 m3) of production mixing work). • Soils may be relatively easily mixed without obstructions,
cobbles, or significant peat or organic content. Typical soils would include loose to medium dense cohesionless soils, soft and wet clays and silts, and soft marine clays near the liquid limit).
• Depth of mixing is less than approximately 80 ft (25 m). Approximate higher estimate (significantly more difficult site/project conditions)
$140/m3 • Wet mixing is assumed. • Environmental contamination is not present or is present at
levels that will not affect mixing performance. • Binder materials are not readily or not locally available. • Materials are typically cement, granulated blast furnace
slag, and flyash. • Site access is congested, overhead restrictions may be
present, and mats may be required to create a stable platform for equipment.
• Project is relatively small (e.g., less than 26,000 yd3 (20,000 m3) of production mixing work.)
• Soils are stiff or more difficult to mix and may contain organics or peat but are still free of cobbles and boulders.
• Soils may require predrilling. • Depth of mixing is greater than approximately 80 ft (25 m).
13.6 MEASUREMENT AND PAYMENT
DMM items are typically measured and paid as indicated in table 19.


153
APPENDIX A. LABORATORY PROCEDURE FOR MIXING, CURING, AND STRENGTH TESTING OF TREATED SOIL SPECIMENS APPLICABLE
TO WET MIXING
This procedure was originally developed for use with relatively easily mixed soils such as sands, silty sands, clayey sands, soft or low plasticity silts, and soft clays. For stiff and high plasticity clays, it is recommended to cut the soil into 0.975-inch (25-mm) cubes prior to mixing.(135)
EQUIPMENT AND MATERIALS
Equipment and materials include the following:
• Plastic bags, airtight containers, and plastic wrap.
• Scale.
• Stand mixer (mixer should have a planetary mixing action and multiple beater attachments including a dough hook and a flat beater).
• Kitchen blender.
• Mixing bowls.
• Moisture tins.
• Spatula.
• Ladle.
• PCC and/or other binder materials (with known specific gravity, Gb).
• 2- by 4-inch (50- by 100-mm) plastic molds with lids.
• Tamping rod.
• Straight edge.
• Calipers.
• Tile saw, rock saw, masonry saw, or similar.
• Unconfined compression testing apparatus.
• Utility knife or grinding tool with rotating cutting blade.
• Small level with level indicators in two directions.

154
MATERIAL PREPARATION AND STORAGE PRIOR TO USE
The procedure for material preparation and storage is as follows:
1. For soils that are sensitive to open air exposure due to drying or oxidation reactions, place the samples in airtight containers as soon as possible after obtaining the soil. If samples are obtained in blocks suitable for storage in 5-gal (20-L) buckets, place the bulk sample inside a thick-gauge plastic bag inside of the bucket and pour a small amount of water between the bag and the bucket to create a humid atmosphere inside the bucket. Using a household vacuum, remove the excess air from the bag, seal the bag tightly, and place the lid on the bucket. If samples are retrieved in Shelby tubes, extrude the samples as soon as possible. Cut the samples into pieces, wrap each in a thin plastic film, and place the pieces into plastic storage bags. All samples should be kept sealed and stored in a moist room at or near 100 percent relative humidity and at 68 °F (20 °C) unless alternate curing conditions are stipulated for a specific project. For soils that are not sensitive to exposure to air, such careful handling and storage procedures may not be necessary.
2. Estimate the amount of dry binder that will be required for the entire mixing program. Sift the binder to remove any lumps. Store in an airtight container until needed for mixing.
SOIL MIXING
The procedure for soil mixing is as follows:
1. Determine the weight of moist soil necessary for creating a particular batch of soil-cement mixture (see appendix B). At least eight specimens should be prepared for each batch— two specimens to be tested at each of four curing periods. Thoroughly wet the inside of the mixing bowl used with the stand mixer and lightly pat dry with a paper towel. The inside of the mixing bowl should be lightly moistened but should show no visible water beads.
2. Choose an attachment for the mixer (dough hook or beater style) that will produce the most thorough mixing considering the plasticity of the soil being mixed and the total amount of water in the mixture from the soil water and slurry water. Generally, a dough hook works well for mixing cohesive soils and a flat beater may work well for some non-plastic soils.
3. Measure the required weight of moist soil to the nearest 0.0035 oz (0.1 g) and place it in the moistened mixing bowl. Reseal the soil samples. Record the actual weight of moist soil if different from the target weight.
4. Place the mixing bowl onto the mixer and begin mixing at the lowest setting (approximate rotation of the mixing tool of 100 to 175 cycles/min and revolution of the mixing tool around the bowl of less than 100 cycles/min in the planetary mixing action). Mix for approximately 3 min. When necessary, use a spatula to remove soil from the beater and the sides of bowl and push the soil back towards the center of the bowl. Record the total mixing time. If the laboratory testing program requires that the soil water content be increased above its natural water content, the required additional water can be mixed into the soil at this time. Record the weight of water added.

155
BINDER SLURRY MIXING
The binder slurry mixing procedure is as follows:
1. Determine the dry weight of binder and weight of slurry water slurry necessary for creating the batch of soil-cement mixture (see appendix B).
2. While the soil is being mixed, measure the required weight of slurry mixing water and add it to the mixing container of the kitchen blender. Record the actual weight of slurry water if different from the target weight.
3. Measure the required weight of dry binder and place it in the mixing container of the kitchen blender. Blend it for approximately 3 min, and record the total mixing time. The binder slurry should be mixed while the soil is being mixed. Record the actual weight of the binder if it is different from the target weight.
SOIL-BINDER MIXING
The soil-binder mixing procedure is as follows:
1. After the binder slurry is mixed, turn off the blender and remove the pitcher from the base. Without stopping the soil mixing (do not turn the stand mixer off), slowly add the binder slurry to the mixing bowl. Use a rubber spatula to aid in transferring as much of the binder slurry as possible into the soil mixing bowl. Weigh the blender pitcher before and after transferring the slurry into the mixing bowl to determine the actual weight of binder slurry used in the soil-cement mixture and record this value. If the blades of the blender are such that they prevent complete, or near complete, transfer of the slurry binder into the mixture, it may be necessary to make excess binder slurry (above what is required to meet the design criteria) to ensure an adequate amount of binder slurry in the soil-cement mixture. This should be done so as to maintain the design water-to-binder ratio. The exact amount of slurry required for the mix design should then be added by weighing the pitcher before and after adding the slurry to the soil and continuing to add binder slurry only until the target weight of slurry is achieved.
2. Mix the soil-binder mixture for approximately 10 min from the time the total amount of binder slurry is added to the mixture. Use a spatula to remove the mixture from the beater and sides of the bowl and push the mixture back towards the center, stopping mixing only when necessary. Record the total mixing time and mixing equipment used.
PLACING THE MIXTURE IN THE MOLDS
The procedure for placing the mixture in the molds is as follows:
1. Appropriately label clean, dry molds (this can be done prior to beginning the mixing process or while the soil and binder are being mixed).
2. Begin placing the mixture in the molds as soon as possible following soil-binder mixing. If the mixture is fluid, use a ladle or large spoon to stir the mixture by hand to keep the mixture

156
from segregating, and immediately fill the ladle or spoon with a representative scoop of the mixture. Place the mixture from the ladle or spoon into a plastic mold. Exercise care to ensure that each lift placed in the mold is representative of the entire mixture. Allowing soil particles to settle toward the bottom of the mixing bowl during placement of the mixture in the plastic molds will result in samples with varied mixture properties (i.e., binder content, dosage rate, volume ratio, etc.), thus decreasing the usefulness of the test results.
3. Fill each mold in approximately three lifts, rodding or tapping the sample after each lift as necessary to remove air bubbles and air pockets. For thicker lower water content mixtures, rodding may be necessary, while fluid mixtures with higher water contents may respond best to light tapping. Cease tapping if water begins to separate from the mixture. The objective is to completely fill the plastic molds without air voids while simultaneously minimizing segregation.
4. Finish by screeding the top of the specimen flush with the top of the mold, using a straight edge to produce a flat surface. Cap the specimen immediately to prevent moisture loss.
5. After all molds have been filled and capped, clean and dry the molds. Weigh each specimen individually in its mold. For fluid mixtures prone to segregation, specimens should not vary by more than 3 percent from the average weight of all samples. For thick mixtures that tend to trap air pockets, no specimen should weigh less than 95 percent of the weight of the heaviest specimen. Specimens that do not satisfy these tolerances should be discarded.
6. Discard any mix that is not satisfactorily placed in a mold within 30 min of completing initial mixing. No remixing or other disturbance of the mixture should be allowed more than 30 min after completion of initial mixing.
CURING
Store the completely sealed specimens under controlled conditions at 95 to 100 percent relative humidity and at room temperature (68 to 77 °F (20 to 25 °C)) unless a different curing temperature is specified. If a humid room is not available, the sealed specimens can be stored under water. Specimens should be stored in the sealed cylinder molds under these controlled conditions for their specified curing periods. Often, samples are cured for 7, 14, 28, and 56 days.
SPECIMEN PREPARATION AND TESTING
The procedure for specimen preparation and testing is as follows:
1. After a specimen has reached its designated curing age, carefully remove the cap from the specimen to be tested. If bleed water has formed at the top the specimen, record the weight of bleed water as the difference in the weight of the specimen before and after pouring off the bleed water.
2. With the cap removed, place the specimen in its mold on the sliding tray of the rock saw such that the lip of the mold rests inside the blade opening (not against the bottom of the tray). This should allow for the remaining portion of the specimen to lay flat against the sliding tray. If no bleeding has occurred, remove the upper end of the mold at a location just below

157
the lip of the mold. If bleeding has occurred, saw the upper end of the mold at a location that will just penetrate the upper surface of the specimen and create an end that is perfectly planar and perpendicular to the height of the sample.
3. Turn the sample around on the tray and use the saw to remove the bottom end of the mold from the specimen. The amount of sample removed during this process should be minimized as much as possible. Being careful not to penetrate the sample, use a utility knife to make a single lengthwise cut in the mold using an alignment guide and limited blade penetration. If the mold is too thick or tough for this, a grinding tool with a rotating cutting blade at a low setting may be used to make the cut. With care, the mold can be cut without making a significant penetration into the specimen. Peel the mold off of the sample. Soil-cement specimens are softer than standard concrete cylinders, and they may be damaged if extreme care is not used during extraction.
4. Place the sample upright on a level surface and use a bidirectional level to ensure that adequately parallel ends have been achieved.
5. Measure and record the specimen weight to the nearest 0.0035 oz (0.1 g). Use calipers or a Pi Tape® to measure and record the specimen height and diameter. Height and diameter measurements should be taken at a minimum of two locations on the specimen for each dimension.
6. Conduct unconfined compressive strength tests as per ASTM D2166 at a strain rate of approximately 1 percent per min. Record the time and date of testing.(131)
7. When reducing the data, apply the area correction based on axial strain, as described in ASTM D2166.(131) In addition, because the specimen heights will be less than twice the diameters as a result of trimming the specimen ends, a height correction should be applied. The height correction is described in ASTM C918, and the correction factors are provided in table 23.(136)
Table 23. Strength correction factors. Length/Diameter Factor
2.00 1.00 1.75 0.98 1.50 0.96 1.25 0.93 1.00 0.87
Values not specified in the table should be determined by interpolation.
8. Record the mode of failure and the stress and strain at failure. Retain the complete stress-strain diagram for determining modulus values, if necessary.

158
DATA REDUCTION
The procedure for data reduction is as follows:
1. After testing a minimum of two specimens at each prescribed curing time (typical curing periods are 7, 14, 28 and 56 days), plot all values of unconfined compressive strength versus curing time.
2. Fit the logarithmic trend line qt = q0 + a ln(t) through the data, where qt = unconfined compressive strength at curing time t, and q0 and a = coefficients obtained by least squares regression.
3. Determine the 28-day strength and the strengths at any other desired times from the trend line.
4. Determine the binder factor, binder factor in-place, binder content, total water-to-binder ratio, and volume ratio of the batch based on the actual weights of materials used during mixing (as mixed) and consider the amount of water lost due to bleeding effects (as cured). If no bleed water occurs during curing, the as-mixed and as-cured values are the same. See appendix B for calculations.
5. Report relevant values in a table with the trend line strengths. Table 24 shows an example.
Table 24. Batch mix proportions and trend-line strengths.
Batch Number
Mix Proportion Parameters Trend Line Strengths
w:b VR (%)
α (kg/m3)
α in-place (kg/m3)
aw (percent) wT:b
7-Day (kPa)
28-Day (kPa)
LCS 1 1.00 24.5 186 150 11.3 3.04 604 1,280 1 kg/m3 = 0.062 lb/ft3 1 kPa = 0.145 psi
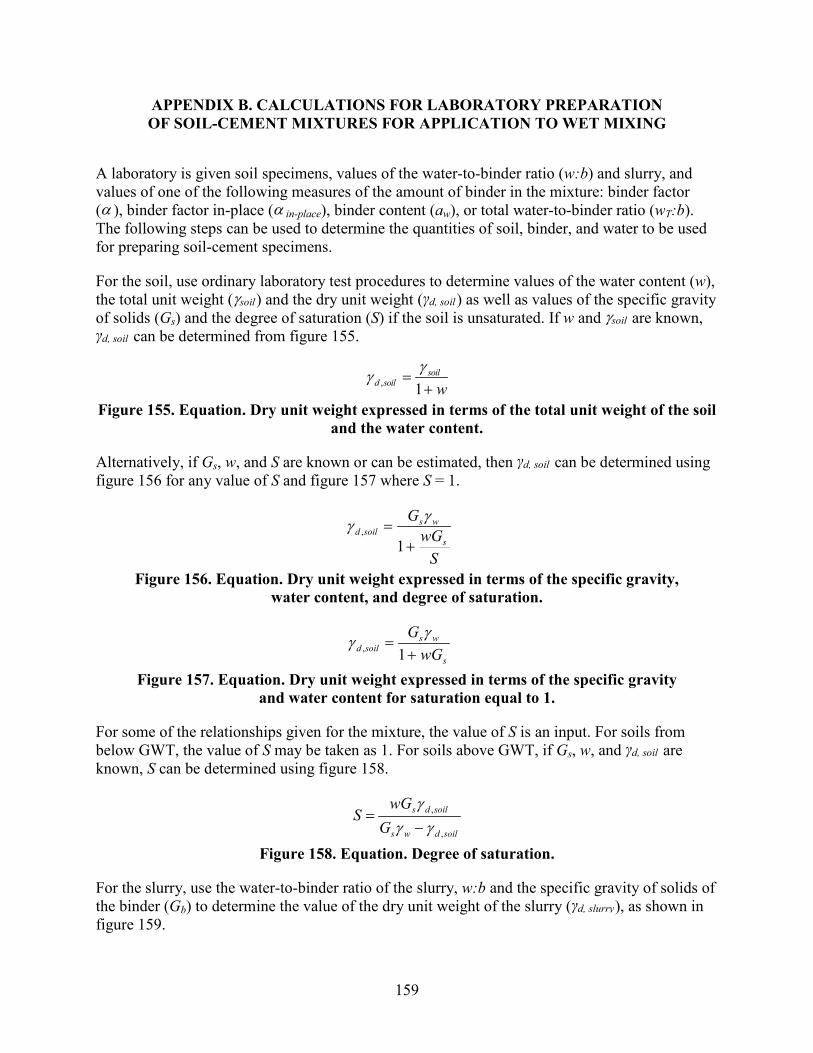
159
APPENDIX B. CALCULATIONS FOR LABORATORY PREPARATION OF SOIL-CEMENT MIXTURES FOR APPLICATION TO WET MIXING
A laboratory is given soil specimens, values of the water-to-binder ratio (w:b) and slurry, and values of one of the following measures of the amount of binder in the mixture: binder factor (α ), binder factor in-place (α in-place), binder content (aw), or total water-to-binder ratio (wT:b). The following steps can be used to determine the quantities of soil, binder, and water to be used for preparing soil-cement specimens.
For the soil, use ordinary laboratory test procedures to determine values of the water content (w), the total unit weight (γsoil ) and the dry unit weight (γd, soil ) as well as values of the specific gravity of solids (Gs) and the degree of saturation (S) if the soil is unsaturated. If w and γsoil are known, γd, soil can be determined from figure 155.
wsoil
soild +=
1,γγ
Figure 155. Equation. Dry unit weight expressed in terms of the total unit weight of the soil and the water content.
Alternatively, if Gs, w, and S are known or can be estimated, then γd, soil can be determined using figure 156 for any value of S and figure 157 where S = 1.
1
,
SwG
Gs
wssoild
+=
γγ
Figure 156. Equation. Dry unit weight expressed in terms of the specific gravity, water content, and degree of saturation.
1,
s
wssoild wG
G+
=γγ
Figure 157. Equation. Dry unit weight expressed in terms of the specific gravity and water content for saturation equal to 1.
For some of the relationships given for the mixture, the value of S is an input. For soils from below GWT, the value of S may be taken as 1. For soils above GWT, if Gs, w, and γd, soil are known, S can be determined using figure 158.
soildws
soilds
GwG
S,
,
γγγ−
=
Figure 158. Equation. Degree of saturation.
For the slurry, use the water-to-binder ratio of the slurry, w:b and the specific gravity of solids of the binder (Gb) to determine the value of the dry unit weight of the slurry (γd, slurry ), as shown in figure 159.

160
( ) b
wbslurryd Gw:b
G+
=1,
γγ
Figure 159. Equation. Dry unit weight of slurry.
Determine the value of the volume ratio (VR) for the mixture using figure 21 and figure 22 if α in-place is specified. If α is specified, use figure 20. If aw is specified, use figure 23. If wT:b is specified, use figure 24.
Determine the necessary volume of soil-cement mixture (Vmix) using figure 160.
( )( )( )2.1mold of volumespecimens ofnumber =mixV
Figure 160. Equation. Volume of soil-cement mixture.
Where the factor of 1.2 is used to account for spillage during specimen preparation.
Determine the weight of soil (Wsoil) to be used using figure 161.
soilmixsoil VVR
W γ+
=1
1
Figure 161. Equation. Weight of soil.
Determine the weight of binder (Wb) to be used in the slurry using figure 162.
slurrydmixb VVR
VRW ,1γ
+=
Figure 162. Equation. Weight of binder used in the slurry.
Determine the weight of water to be used in the slurry (Ww,slurry) using figure 163.
( ) bslurryw Ww:bW =,
Figure 163. Equation. Weight of water used in the slurry.
The water-binder slurry is prepared by blending binder of weight (Wb) with slurry of weight (Ww,slurry). The soil-cement mixture is then prepared by mixing the slurry with soil of weight (Wsoil).
The actual mixture created and cured in the laboratory may deviate from the intended actual weights of soil, binder, and slurry water that are weighed and used to create the mixture, which may also be slightly different from the target amounts calculated. The procedure to determine actual values of α in-place, α , aw, and wT:b from actual values of Wb, Ww,slurry, and Wsoil involves first determining w:b from figure 164 and γd,slurry from figure 159.
b
slurryw
WW
w:b ,=
Figure 164. Equation. Water-to-binder ratio of slurry.

161
The value of VR is then determined from figure 165.
soil
b
slurryd
soil
WWVR
,γγ
=
Figure 165. Equation. Volume ratio of mixed soil.
Finally, as-mixed values of α in-place, α , aw, and wT:b can be determined using figure 166 through figure 170.
( )( ) ( )VRwGSwGS
VRwGS
ss
slurrydsplacein +++
+=− 1
,γα
Figure 166. Equation. As-mixed binder factor in-place for any degree of saturation.
VRVR slurryd
placein +=− 1
,γα
Figure 167. Equation. As-mixed binder factor in-place for saturation equal to 1.
slurrydVR ,γα =
Figure 168. Equation. As-mixed binder factor expressed in terms of VR and dry unit weight of slurry.
VRasoild
slurrydw
,
,
γγ
=
Figure 169. Equation. Binder content of mixed soil.
w:bVR
w:bw
slurryd
soildT +=
,
,
γγ
Figure 170. Equation. Total water-to-binder ratio of mixed soil.
For some mixtures using some soils, bleed water may rise to the top of the specimen during curing. One approach is to report the measured strengths for the values of α in-place, α , aw, and wT:b without correcting for the bleed water not incorporated in the cured specimens. The reasoning behind this approach is that if the same w:b and VR are used in the field mixing as are used in the laboratory mixing, bleed water will also occur in the field, so the laboratory strengths will be relevant to the field conditions. In fact, it is likely that more bleed water will occur in the field than in the laboratory due to the higher stresses involved in the field. Other factors being equal, mixtures containing less water will exhibit higher strength. Of course, differences in mixing efficiency and curing conditions will also produce differences between laboratory and field strengths. In this approach, the values of α in-place, α , aw, and wT:b may be labeled “as mixed.”
An alternate approach when bleeding occurs is to subtract the bleed water from the slurry water prior to calculating the actual values of α in-place, α , aw, and wT:b applicable to the laboratory

162
specimens. This approach is useful when investigating relationships between mixture strength and actual ratios of binder, water, and soil in the mixture. The weight of bleed water from all the specimens in the batch (Ww,bleed,specimens) can be determined by weighing the cured specimens before and after pouring off the bleed water. The adjusted weight of slurry water (Ww,slurry,adjusted) is then determined using figure 171.
specimens
mixspecimensbleedwmixedslurrywadjustedslurryw W
WWWW ,,,,,, −=
Figure 171. Equation. Adjusted weight of slurry water.
Where:
Ww,slurry,mixed = Total weight of slurry water used in the mixture prior to placing the mixture in the molds. Wmix = Total weight of the mixture prior to placing the mixture in the molds. Wspecimens = Sum of the weights of all the specimens made from the batch.
The value of Ww,slurry,adjusted can be used in place of Ww,slurry in figure 164, and the resulting adjusted value of w:b can be used in figure 159 to determine an adjusted value of γd, slurry . The adjusted value of γd, slurry can be used together with the actual values of Wb and Wsoil in the mixture to determine an adjusted value of VR from figure 165. Then, the adjusted values of α in-
place, α , aw, and wT:b may be labeled “as cured” in this approach.

163
APPENDIX C. GUIDE CONSTRUCTION SPECIFICATION FOR DEEP MIXING
DEEP MIXING GUIDE CONSTRUCTION SPECIFICATION
Commentary: This guide provides information that must be considered to responsibly develop specifications for a successful deep mixing project. Each specification developed must be written carefully to reflect the site- and project-specific conditions and requirements. Suggested specification language is shown in normal text, and commentary is noted in italics. The commentary is intended to highlight project-specific items the engineer should consider when writing a specification. The commentary is listed at the beginning of each section and relates to the group of provisions that follow the commentary. The commentary must be removed before the specification can be used for a project.
Suggested tolerances and requirements are provided in the commentary; however, these generic requirements must be tailored to the project needs and be sufficiently flexible to accommodate differences in equipment and methods without limiting competition or imparting unnecessary or unachievable restrictions while still achieving the design intent.
Because a wide variety of DMMs are available and the quality of deep mixed soils are heavily dependent on the contractor’s equipment and methods, a pure method specification is virtually never used for deep mixing projects. Instead, a hybrid specification is recommended, as discussed in chapter 9.
For simplicity, the term “contractor” in this specification refers to the company responsible for the construction of the deep mixing work. In practice, this company may be either a GC or a DMM subcontractor. If a DMM subcontractor is used, the terms GC or DMM contractor must be used to clearly identify the relative responsibilities.
The term “engineer” in this specification refers to the owner’s representative. This individual may be an employee of the owner or may be a subcontractor/subconsultant.
PART 1—GENERAL
1.1 Scope
The contractor should furnish all labor, equipment, and materials necessary to plan, design, and construct the deep mixing and associated testing, monitoring, sampling, and recording to meet the performance requirements outlined in these plans and specifications.
1.2 References
The following publications form a part of this specification to the extent indicated by the references. The latest publication as of the issue date of this specification should govern, unless indicated otherwise.
1. Federal Highway Administration. (2012). Deep Mixing Manual for Embankment and Foundation Support, U.S. Department of Transportation, Washington, DC.

164
2. ASTM C150. (2012). “Standard Specification for Portland Cement,” Book of Standards Volume 04.01, ASTM International, West Conshohocken, PA.
3. ASTM C192. (2012). “Standard Practice for Making and Curing Concrete Test Specimens in the Laboratory,” Book of Standards Volume 04.02, ASTM International, West Conshohocken, PA.
4. ASTM C618-08a. (2012). “Standard Specification for Coal Fly Ash and Raw or Calcined Natural Pozzolan for Use in Concrete,” Book of Standards Volume 04.02, ASTM International, West Conshohocken, PA.
5. ASTM C821-09. (2009). “Standard Specification for Lime for Use with Pozzolans,” Book of Standards Volume 04.01, ASTM International, West Conshohocken, PA.
6. ASTM C989-09. (2012). “Standard Specification for Slag Cement for Use in Concrete and Mortars,” Book of Standards Volume 04.02, ASTM International, West Conshohocken, PA.
7. ASTM D2166. (2006). “Standard Specification for Unconfined Compressive Strength of Cohesive Soil,” Book of Standards Volume 04.08, ASTM International, West Conshohocken, PA.
8. ASTM D4380. (2012). “Standard Test Method for Density of Bentonitic Slurries,” Book of Standards Volume 04.08, ASTM International, West Conshohocken, PA.
9. ASTM D5084. (2010). “Standard Test Method for Measurement of Hydraulic Conductivity of Saturated Porous Materials Using a Flexible Wall Permeameter,” Book of Standards Volume 04.08, ASTM International, West Conshohoken, PA.
1.3 Definitions
The technical and construction terms used in this specification are outlined in this section.
Admixtures: Ingredients in the grout other than binder, bentonite, and water. Admixtures can be fluidifiers, dispersants, or retarding, plugging, or bridging agents that permit efficient use of materials and proper workability of the grout.
Bentonite: Ultra-fine natural clay principally comprising sodium cation montmorillonite.
Binder: Chemically reactive material (i.e., lime, cement, gypsum, blast furnace slag, flyash, or other hardening reagents) that can be used for mixing with in situ soils to strengthen the soils and form DMM columns. Also referred to as stabilizer or reagent. In U.S. practice, binder slurry is frequently referred to as grout or slurry.
Binder content: Ratio of weight of dry binder to dry weight of soil to be treated.
Binder factor: Ratio of weight of dry binder to volume of soil to be treated.

165
Binder factor in-place: Ratio of weight of dry binder to volume of mixture, which is the volume of the soil to be treated plus the volume of the slurry for the wet method or the volume of the dry binder for the dry method.
Binder slurry: Stable colloidal mixture of water, binder, and admixtures that assists in loosening the soils for effective mixing and strengthening the in situ soil upon setting.
BRN: Total number of mixing blade rotations per meter of shaft movement. BRN has been developed for ensuring uniformity of products produced only by WRE/ DRE systems. For horizontal cutter systems (e.g., CSM), revolutions per minute are typically reported as an indicator of mixing energy (not applicable for chainsaw-type mixers (e.g., TRD)).
Column: Pillar of treated soil produced in situ by a single installation process using a mixing tool, typically a rotating auger, to make a round column. A rectangular barrette produced by twin horizontal mixing shafts is also a column. See “element” and “wall,” which are related geometric terms.
Deep mixing equipment: Deep mixing equipment with various mixing tools including single vertical shaft mixing tools, multiple vertical shaft mixing tools, horizontal rotating circular cutters, chainsaw-type cutters, etc.
DMM: In situ ground treatment in which soil is blended with cementitious and/or other binder materials to improve strength, permeability, and/or compressibility characteristics (synonymous terms (some proprietary) include DSM, deep mixing, CDSM, and soil cement mixing).
Dry mixing: Process of mechanical disaggregation of the soil in situ and its mixing with binders with or without fillers and admixtures in dry powder form. Binders are delivered primarily on tool retrieval.
Element: This is an inclusive term that refers to a DMM element produced by a single stroke of the mixing tools at a single equipment location. A column produced by a single-axis machine, a set of overlapping columns produced by a single stroke of a multiple-shaft mixing tool, and a rectangular barrette produced by a mixing tool with horizontal axis rotating cutter blades are each considered an element. An element consisting of overlapping columns produced by a single stroke of a multiple-shaft mixing tool is sometimes referred to as a “panel.” A chainsaw-type mixing tool that travels as it mixes produces a continuous wall, which is not an element.
Engineer: The representative of the design engineer or of the project owner (owner). This person may either be a subconsultant to the owner or a member of the owner’s staff.
Filler: Non-reacting materials (i.e., sand, limestone powder, etc.).
Mix design: Ratios of soil, binder, water, and additive quantities required to meet the design requirements of the project.
Mixing process: Mechanical disaggregation of the soil structure and dispersion of binders and fillers in the soil.

166
Mixing tool: Equipment used to disaggregate the soil and distribute and mix the binder with the soil. Consists of one or several rotating units equipped with several blades, arms, and paddles with or without continuous or discontinuous flight augers, horizontal rotating cutter blades, or chainsaw-type cutters.
Penetration (downstroke): Stage/phase of mixing process cycle in which the mixing tool is delivered to the appropriate depth (disaggregation phase) for withdrawal injection and disaggregation and mixing for penetration injection. (Not applicable for chainsaw-type mixers (TRD).)
Penetration/retrieval speed: Vertical movement per unit time of the mixing tool during penetration or withdrawal. (Not applicable for chainsaw-type mixers (TRD).)
Restroke: Additional penetration and withdrawal cycle of the mixing tool to increase the binder content and/or the mixing energy. (Not applicable for chainsaw-type mixers (TRD).)
Retrieval: Withdrawal of mixing tool from bottom depth to the ground surface. Binder may be injected during retrieval, which also imparts additional mixing energy.
Rotation speed: Number of revolutions of the mixing tool per unit time.
Soil-cement: Product of DMM consisting of a mixture of the in situ soil and binder. Also referred to as treated soil or deep mixed material.
Strength: Dependent on application, various strengths may be used to assess the quality of deep mixed material. For design, “strength” usually means shear strength, but during QC/QA, “strength” usually means unconfined compressive strength. For clarity, the intended type of strength should always be identified when using this term.
Stroke: One complete cycle (penetration and withdrawal) of the mixing process.
Volume ratio: Ratio of the volume of slurry injected (in wet mixing) to the volume of soil to be treated.
Wall: Group of overlapping elements arranged to form a continuous wall. Continuous walls can also be constructed using a chainsaw-type of mixing device. Walls can be referred to as shear walls, cutoff walls, or excavation support walls depending on the application. A shear wall can also be referred to as a buttress.
Water: Fresh water that is free of deleterious substances that adversely affect the strength and mixing properties of the grout and is used to manufacture grout.
Water-to-binder ratio: Weight of water added to the dry binder divided by the weight of the dry binder. In wet mixing, the water-to-binder ratio of the slurry is determined from the weights of water and dry binder used to manufacture the slurry in a plant at the ground surface. In either wet or dry mixing, the total water-to-binder ratio is the weight of water in the mixture divided by the weight of dry binder. For wet mixing, the total water-to-binder ratio is the weight of slurry water

167
plus the weight of soil water divided by the weight of dry binder. For dry mixing, the total water-to-slurry ratio is the weight of soil water divided by the weight of dry binder.
Wet mixing: Process of mechanical disaggregation of the soil in situ and its mixing with slurry consisting of water and binders with or without fillers and admixtures. Binder is delivered on mixing tool penetration for vertical and horizontal axis mixing tools.
Withdrawal (upstroke): Stage or phase of retrieval of the mixing tool in which the final mixing occurs for penetration injection and initial mixing for withdrawal injection. Disaggregation occurs during the penetration for both penetration injection and withdrawal injection. (Not applicable for chainsaw-type mixers (TRD).)
Withdrawal rate: The average up-hole retrieval rate of the mixing tool.
1.4 Project Description and Performance Requirements
Commentary: In this section, the project purpose should be outlined, including the identifiers for the embankment, abutment, culvert, retaining wall to be supported using a deep mixed foundation, project location, roadway section number, county, State, etc. The overall structure dimensions and layout may be highlighted by reference to the plans.
The information provided in this section is critical to the contractor’s understanding of the project, upon which the contractor will determine the preferred DMMs and materials to be used. The specification requires the DMM contractor to construct the deep mixed material (mix design and mixing process) to meet the strength and permeability requirements outlined in the engineer’s design. Except for a design-build project or an alternative design submission, the geotechnical design should be carried out by the engineer before the DMM project is allowed for bid and construction. The specification should outline the minimum and/or maximum allowed values for certain geometric parameters to afford the contractor flexibility in construction while still assuring that the final DMM product will satisfy the requirements for performance.
The following items must be outlined based on the requirements for a particular project:
1. Particular DMM schedule information (e.g., preloading or phasing schedule). If particular schedule requirements are associated with the DMM, care must be taken to check the overall specification package for consistency with scheduling requirements presented in other sections.
2. Requirements of structural reinforcement, if any (material grade and installation procedure for installation, including pile caps).
3. Spoil handling requirements.
4. Environmental restrictions (i.e., noise, vibrations, emissions, etc.).
5. Maximum allowable displacement of adjacent structures.
A. The purpose of the project is to provide support for __________.

168
B. Allowable geometric parameters for DMM construction are outlined in table 25.
Table 25. Allowable geometric parameters for DMM construction.
Parameter Minimum and/or
Maximum Value Top elevation of DMM element Minimum Provide on drawings Bottom elevation of DMM element Maximum Provide on drawings Shear wall length, B Minimum Provide on drawings Column diameter, d Minimum and
maximum Min = insert value Max = insert value
Column overlap ratio, e/d Minimum Insert value Clear spacing in center of embankment, scenter − d
Maximum Insert value
Clear spacing between shear walls, sshear − d Maximum Insert value Area replacement ratio in center of embankment, as,center
Minimum Insert value
Area replacement ratio under side slopes of embankment, as,shear
Minimum Insert value
Ratio of chord length at overlap to center-to-center spacing of shear walls, c/sshear
Minimum Insert value
C. Layouts and sizes of deep mixing elements that adhere to the minimum and maximum values
of the parameters listed in table 25 and included in the plans and/or specifications will be deemed acceptable to meet the requirements of the engineer’s design, and additional design calculations will not be required. If layouts and element sizes do not adhere to these requirements, design calculations must be prepared and stamped by a professional engineer registered in the jurisdiction where the project is located and retained by the contractor. The calculations must be submitted to the engineer for review and possible approval after the contract is awarded. The owner/engineer is not obligated to accept designs that fall outside the geometric limits in the plans and specifications.
1.5 Qualifications of Contractor
Commentary: The following personnel are typically involved in a DMM project:
• The project manager is the contractor representative responsible for the overall direction of the DMM project, including site operations, technical acceptability, project billing, and reporting. The project engineer and the project superintendent ordinarily report to the project manager.
• The project engineer is responsible for supervising the QC technicians’ work, providing technical support to the QC technician, and reviewing production records and QC/QA data to ensure the quality of the DMM work.
• The project superintendent oversees construction operations, equipment, and material supply; collects and compiles daily production reports; and ensures QC activities are

169
conducted in accordance with project requirements. The project superintendent and the project engineer may work together on QC activities and documentation.
• The DMM equipment operator is responsible for operating the equipment during construction.
• On large, complex, or critical deep mixing projects, the contractor or the owner, and sometimes both, employs a deep mixing specialist or a review board to provide advice, review, and assistance with dispute resolution.
A. The DMM contractor must have previous successful experience with DMM projects for the soil conditions and project scope similar to that of the project being bid (contractor provides project description(s) and reference list).
B. The DMM contractor must assign a project manager who has had significant experience on at least five DMM projects (contractor provides the number of years/projects, project description(s), and reference list).
C. The DMM contractor must assign a project engineer to supervise the construction of the DMM work. The project engineer must have had significant experience on at least five DMM projects (contractor provides the number of years/projects, project description(s), and reference list). For a design-build project, the DMM contractor must assign a professional engineer who is registered in the jurisdiction in which the project is located to supervise the design and preparation of the drawings and to review QC/QA records and as-built drawings to confirm that the DMM work meets the design intent.
D. The DMM contractor must assign a full-time project superintendent with at least five projects and at least 130,000 yd3 (100,000 m3) of total treatment volume in DMM construction (contractor provides the number of years/projects, project description(s), and reference list).
E. The DMM contractor must provide at least one DMM equipment operator with at least 1 year of experience with the equipment and DMM construction (contractor provides the number of years/projects, project description(s), and reference list).
F. Written requests for substitution of these key personnel must be submitted prior to personnel changes. Documentation must be submitted to the owner that demonstrates that the substitute meets the requirements listed. Substitution may not be made until written approval is provided by the owner.
1.6 Available Information
Commentary: The subsurface conditions expected can significantly impact the contractor’s choice of equipment, methods, materials, bidding process, and contract administration. Experience has proven the advantages of using a geotechnical baseline report in successful projects. It is the owner’s responsibility to divulge knowledge of potentially difficult ground conditions that could result in avoidable differing site conditions claims. However, the information should not be written in an exculpatory manner that expressly intends to transfer the risk or responsibility unfairly from the owner to the contractor. It is the contractor’s
170
responsibility to anticipate and allow for typical variability in subsurface conditions as discussed in the geotechnical reports. Information on writing effective geotechnical baseline reports is provided by Essex.(137) Important geotechnical information includes, at a minimum, soil type, density, strength, plasticity, moisture content, and gradation for each stratum to be mixed. If organic soils are encountered, the organic content should be measured on selected samples and reported.
In some situations, deep mixing may have been performed at nearby sites, but no information is available because the owner, engineer, and contractor are private entities different from those involved in the current project.
Available information developed by the owner or by the owner’s duly authorized representative (engineer) includes the following items:
• Geotechnical reports No.(s) ________ titled ________, dated ________.
• Pre-production deep mixing test program reports No.(s) ________ titled ________, dated ________.
• Deep mixing reports from adjacent sites reports No.(s) ________ titled ________, dated ________.
1.7 Construction Site Survey
Commentary: The location of both active and abandoned buried utilities at the site can have a significant impact on the design and construction of deep mixing works. Careful consideration of the presence and location of all utilities is required.
A. Prior to bidding, the contractor should review the available subsurface information and visit the site to assess the site geometry, equipment access conditions, location of existing structures, and above-ground utilities and facilities.
B. The contractor should field locate and verify the locations of all utilities prior to starting work. The contractor should maintain uninterrupted service for those utilities designated to remain in service throughout the work. The contractor should notify the engineer of any utility locations different from those shown in the plans that may require relocation of deep mixed elements or structure design modification. Subject to the engineer’s approval, the contractor should be compensated for additional costs of element relocation and/or structure design modifications resulting from utility locations different from those shown in the plans.
1.8 Submittals
A. Contractor experience profile: The contractor must submit documentation evidencing the experience requirements outlined in section 1.5.
B. Bench-scale testing report: The contractor must submit results from bench-scale tests conducted. The report should provide all data collected, including, at a minimum, descriptions of sampling techniques used, boring logs, classifications of all major soil strata

171
to be mixed, site groundwater conditions, binder materials used, mixed design proportions, laboratory mixing techniques used, and curing curves for unconfined compressive strength versus time for each major soil type. Discussion of tests results should be provided, including proposed mix designs for use in the field.
C. Field validation program plan: At least 30 days before the start of the field validation program, the contractor should submit a field validation program plan that contains descriptions of the construction procedures, equipment, and ancillary equipment to be used for mixing and binder proportioning and injection; mix design parameters and associated soil strata to be evaluated; operational and material parameters to be monitored during field validation; layout of the DMM elements to be constructed; a summary of QC/QA samples to be collected and tested; and examples of the forms that will be used to document the work.
D. Deep mixing work plan: Based on the results of the preconstruction testing (bench-scale and field validation program), at least 30 days prior to the start of deep mixing work, the contractor must submit a deep mixing work plan for review and approval. This plan must include the following items:
• Detailed descriptions of sequence of construction and all construction procedures, equipment (catalog cut sheets), and ancillary equipment to be used to penetrate the ground, proportion and mix binders, and inject and mix the site soils.
• Proposed mix design(s), including binder types, additives, fillers, reagents, and their relative proportions, and the required mixing time, water-to-binder ratio of the slurry (for wet mixing), binder factor (for dry and wet mixing), and volume ratio (for wet mixing) for a deep mixed element.
• Proposed injection and mixing parameters, including mixing slurry rates, slurry pumping rates, air injection pressure and volume flow rates, mixing tool rotational speeds, and penetration and withdrawal rates.
• Methods for controlling and recording the verticality and the top and bottom elevation of each element.
• The necessary procedure and measurement to confirm the end-bearing when DMM elements are required to penetrate into a bearing layer,.
• Working drawings and calculations for the DMM elements showing the site location of the DMM project as well as the dimensions, layout, and locations of all DMM elements. Drawings should indicate the identification number of every element if a multi-shaft mixing tool is used and every column if a single-auger mixing tool is used. Calculations and drawings should demonstrate that the element layout, depth, and quantity meet the specification requirements. For a design-build project, the design calculations should be performed by a professional engineer who is registered in the jurisdiction in which the project is located. He/she will also prepare, stamp, and sign the drawings.
• DMM schedule information (e.g., preloading or phasing schedule).

172
• Sample daily production report, including the items described in section 1.8.
• Details of all means and methods proposed for QC/QA activities, including surveying, process monitoring, sampling, testing, documenting, and marking schedule milestones.
• Names of any subcontractors used for QC/QA activities. An independent laboratory must be used for QC/QA testing and must be approved by the owner/engineer.
E. Material certifications: Certificates of compliance must be submitted as proof of conformance to materials standards and requirements for each truckload of binder, admixtures, and steel, as needed.
F. Production records: By the end of the next business day following each deep mixing shift, the contractor should submit a daily production report in the approved format. The report should be completed and signed by the contractor’s project superintendent. The report should contain at a minimum the following information:
• Project name.
• Day, month, year, and time of work shift (beginning and end).
• Name of field superintendent in charge of the work for the contractor.
• Deep mixing equipment (rig number) in operation during the shift and specific activities conducted by said equipment.
• Type of mixing tool.
• Treatment zone and reference drawing number.
• Elevation of top and bottom of treatment zone.
• Element number, diameter, and location coordinates.
• Date and time (start and finish) of element.
• Location of each completed column/element installed during the work shift and all zones completed to date on a plan of suitable scale to clearly show the location of the elements. Frequently, the owner/engineer will specify this scale at 1 inch = 10 ft or 1 inch = 20 ft, depending on the size of the elements and the amount of detail necessary.
• Mix design (not applicable for dry mixing).
• Slurry specific gravity measurements (not applicable for dry mixing).
• Binder slurry injection rate (gal/min (L/min)) plotted at each 3-ft (1-m) depth interval for the full depth of the treated zone. Variations in volumes should be noted (not applicable for TRD).
• Mixing tool rotation speed in revolutions per minute versus depth.

173
• Penetration/withdrawal rates of the mixing tool in ft/min (m/min) plotted at each 3 ft (1 m) of depth (not applicable for TRD).
• Element verticality measurements.
• Plots of BRN and binder factor versus depth for each element plotted at least every 3 ft (1 m) of depth. The total number of rotations should be reported for CSM (not applicable for TRD).
• For TRD, the vertical and horizontal rates of cutter chain travel should be reported along with the slurry injection rate. From these data, the average binder factor as a function of position can be calculated and reported.
• A description of obstructions, interruptions of binder injections, or other difficulties during installation and their resolution.
• Other pertinent observations including but not limited to binder escapes, ground settlement or heave, collapses of the treatment zone, and any unusual behavior of any equipment during the deep mixing process.
• For both wet grab samples and coring, provide collection date, time, plan location, elevation, and identification numbers of all deep mixed samples, including unsuccessful attempts to retrieve samples.
• For coring operations, provide the coring method, equipment, and personnel; recovery percentage and percent treatment (percent of run length that is treated) for each core run; sample collection, handling, and storage details; and name of person responsible for logging and collecting cores and samples to be tested.
• Quantities of all binder materials delivered to the site plus a reconciliation showing the amount actually injected.
• Summary of any down time or other unproductive time including time, duration, and reason.
• Detailed results of all testing.
G. QC/QA records: Calibration data must be submitted for all measurement devices used for binder production, deep mixing operational monitoring, and laboratory testing. Within 3 business days of completing any QC/QA testing, the contractor should submit the test results, including original data sheets from the laboratory and an evaluation of the compliance of the test results with project acceptance criteria. Equipment should be calibrated prior to initial use and repeated every 3 months.
H. As-built field measurement data:
Commentary: As-built measurement data can be required at the end of the project or after a phase of the project is completed, depending on project size and layout.

174
After completion of the project, the contractor must submit as-built field measurement data indicating surveyed as-built plan locations of each DMM element, including the element center (per site specific coordinates), the element dimension, the column verticality, and the top and bottom elevations of each element to the accuracy required by the project specifications.
1.9 Preconstruction Meeting
Commentary: Contractor attendance at the preconstruction meeting should be mandatory. The date, time, and location of the meeting should be included in this section.
The contractor is required to attend a pre-construction meeting on ____________.
PART 2—MATERIALS AND EQUIPMENT
2.1 Materials
Commentary: If use of onsite site water is permitted, the specifications should describe the source. The owner may want to specify the types of materials to be used for mixing. Alternatively, the owner may specify what materials and methods are not permitted (e.g., for environmental or cost reasons).
A. Cement binder materials should conform to ASTM C150 low-alkali type II PCC. Type III PCC should not be used. Slag cement should conform to ASTM C1157. All cement should be homogeneous in composition and properties and should be manufactured using the same methods at each plant by each supplier. Tricalcium aluminate content should not exceed 8 percent.
B. Water used in drilling, mixing cement grout, and other applications should be potable.
C. Admixtures will not be allowed unless the contractor submits documentation demonstrating the effects of the admixture and the admixture is approved by the engineer.
D. Binder slurry should be a stable homogeneous mixture of approved binder, approved admixtures, and water. The ratios of various components may be proposed for modifications by the contractor but should not be implemented until reviewed and accepted by the engineer. Any proposed deviations from the submitted and approved mix design should be resubmitted for the engineer’s approval. Revalidation through laboratory or field testing is necessary for changes that exceed 10 percent of previously approved mix designs. Regardless of such changes, the contractor is responsible for satisfying the acceptance criteria.
E. Soil-binder mixture should be a stable mixture of binder slurry and in situ soil. The contractor should propose the ratios and quantities of various components.
2.2 Equipment
Commentary: DMM equipment varies greatly, and the selection of mixing method and equipment is typically left to the contractor. The engineer may specify the general capacity requirements of the equipment and level of monitoring required to evaluate conformance with the specification.

175
Different levels of monitoring equipment are available, ranging from manually to fully automated control and recording.
A. Deep mixing equipment should be of sufficient size, capacity, and torque to perform the required deep mixing to the desired depths. Characteristics of deep mixing equipment are as follows:
• The equipment should be capable of advancing through previously installed elements to achieve designed overlapping or remixing as needed and be sufficient to maintain the necessary revolutions per minute and penetration rate at the maximum depth to achieve thorough mixing.
• The mixing and injection equipment should be sufficient to adequately blend and distribute the binder with the in situ soils to provide the required strength.
• The mixing tools should be adequately marked to allow the engineer to confirm the penetration depth to within 1 ft (0.3 m) during construction. If rigs with varying mixing tool lengths are used, the shortest tools should extend to the lowest element termination elevations indicated in the plans.
• All equipment should have monitoring equipment to permit accurate and continuous monitoring, recording, and controlling of mixing tool depth, location, binder volume flow rates and factors, binder injection pressures and quantities, tool rotational speeds, tool advancement, and withdrawal rates.
• The monitoring equipment should be calibrated at the beginning of the project, and the data should be submitted to the owner. Calibration should be repeated every 3 months.
• The owner/engineer should have access to monitoring equipment.
B. Binder materials handling and storage:
Commentary: Binder may be produced using either batching or a continuous mixing process, depending on the project size and production rate. The means used to prepare and pump the slurry (wet mixing) or convey the dry binder (dry mixing) to the injection point should be identified. Controls to ensure the proportioning or a monitoring system for proportion verification must be used, especially for continuous mixing processes. Calibration is required for slurry proportioning methods that do not rely on weighing each component for each batch. State emissions requirements must be considered. Air quality permits for material storage may be required in certain States.
• The contractor should measure, handle the transport, and store bulk binder in accordance with the manufacturer’s recommendations.
• Dry materials should be stored in dry containers. The binder should be adequately protected from moisture and contamination while in transit and when stored at the project site.

176
• Dry materials should be transported to the project site and placed in the onsite storage tanks using a closed system. Any air evacuated from the storage tanks during the loading process should be filtered before being discharged to the atmosphere.
• Material that has become caked due to moisture absorption should not be used. Binder materials containing lumps or foreign matter of a nature and in amounts that may be deleterious to the injection operation should not be used. In each instance in which the binder source is changed, the batch plant silos should be completely emptied before storing binder from the new source. Mixing binders from different sources in the same silos is not permitted.
• Equipment used for proportioning during binder production should be calibrated prior to initial use and repeated every 3 months or every time the batch plant is relocated, whichever is sooner. Calibration records must be submitted to the owner in accordance with section 1.8.
• Positive displacement pumps should be used to transfer the slurry to the injection point. The contractor should demonstrate that the equipment can uniformly deliver binder at suitable rates in accordance with the construction plan.
2.3 Products
Commentary: The product requirements will be verified by laboratory and field testing to confirm the parameters assumed in the design. It is critical that the design criteria be verifiable by measurements and testing and that all results be used to verify that the specification requirements have been satisfied or to provide measurement data for payment. It is important for the owner/engineer to understand which design parameter or payment item is being confirmed by each test to avoid unnecessary testing.
A. Geometric tolerance: DMM elements installed should meet the geometric tolerance outlined in section 3.6.
B, Strength: The strength of treated soils should meet the strength criteria outlined in section 3.6.
C. Uniformity: The uniformity of treated soils should meet the uniformity criteria outlined in section 3.6.
PART 3—EXECUTION
3.1 General
Deep mixed elements should be constructed to the lines, grades, and cross sections indicated in the plans and should meet the strength and uniformity requirements specified in section 3.6. The contractor should establish consistent procedures during construction to ensure that the acceptance criteria are satisfied. The procedures should be established based on the results of the field validation program.
177
3.2 Field Validation Program
Commentary: The contractor should determine and demonstrate the field mixing parameters that reliably produce mixed soil satisfying the specification requirements. Based on a review of the results of the field validation program, the contractor may propose changes to the originally intended means, methods, and materials. These changes to the installation procedures must be agreed on by the owner prior to production. It is important to recall that the strength of laboratory- and field-mixed materials will differ.
Sometimes, a contractor may install two test elements to become familiar with the soils and operational parameters. Only one full-depth core should be required from each group of elements installed using the same mixing parameters.
A. Prior to production, the contractor must construct a test section at the location shown in the plans to verify that the contractor’s proposed equipment, procedures, and mix design can uniformly mix the onsite soils and achieve the product requirements outlined in the acceptance criteria in section 3.6.
B. The contractor should submit the results of the field validation program to the owner as outlined in section 1.8.
C. Laboratory bench-scale testing should be used to identify initial mix designs for use in the field validation program. Bulk soil samples from the site should be obtained by the contractor. A suite of three mix designs is required for each major soil stratum encountered to the expected termination depth of the elements.
D. The test section should be installed at the location indicated in the plans. The contractor should submit a plan drawing showing the locations of the test section elements. At least three elements should be installed with different mixing parameters for each element. Each element should extend from the top elevation to the bottom elevation (or required penetration into bearing layer) if different mixing parameters are used. At least one full-depth core should be obtained from each element or group of elements installed using the same mixing parameters.
E. The contractor should obtain full-depth core samples from the test elements in accordance with the QC/QA requirements outlined in section 3.6. Test samples should be submitted to an approved independent laboratory for testing. The contractor may propose other sampling techniques to obtain continuous samples of the deep mixed material which, if approved by the engineer, could be submitted as further evidence of compliance with the acceptance requirements.
3.3 Binder Preparation (Wet Method)
A. The contractor should mix dry binder and water in the slurry plant to produce a uniform suspension of binder in the water.
B. The slurry should be held in the agitation tank for a maximum holding time of 4 h. Holding time is calculated from the beginning of the initial mixing.

178
C. Slurry density must be measured in accordance with the requirements outlined in section 3.6. If the slurry density is outside the tolerance required by the mix design, the contractor should recalibrate monitoring equipment and perform additional testing as required by the engineer at no additional cost to the owner. The contractor may also adjust binder or water quantities appropriately and retest at no additional cost to the owner. The specific gravity of the binder slurry measured during production may not deviate by more than 3 percent from the established specific gravity.
D. Monitoring data should be recorded in the daily production report.
3.4 Locating Elements
Commentary: The delay and standby procedures to be used when obstructions are encountered must be defined clearly. It is not always practical for the contractor to maintain production by moving to a different section of the site and continuing deep mixing while an obstruction is being investigated. Redrilling hardened elements with high target strengths may be impractical in some cases, so it is important that the columns/elements be located accurately by the contractor.
A. Before beginning installation, the contractor should accurately stake the location of the deep mixed elements shown in the plans using a licensed surveyor. The contractor should provide an adequate method for locating elements to allow the engineer to verify the as-built location of the elements during construction. The contractor will not be compensated for elements that are located outside of the tolerances specified in section 3.6. The owner will review the location of misaligned elements to determine if the elements interfere with the proposed construction. If the owner determines that misaligned elements will interfere with construction, the contractor should correct the alignment. The method of correction should be submitted by the contractor to the owner/engineer for review and approval.
B. If an obstruction is encountered that prevents drilling advancement, the contractor should immediately notify the engineer and investigate the location and extent of the obstruction using methods approved by the engineer. The contractor should propose remedial measures to clear the obstruction for approval by the engineer. The contractor will be compensated for removal or clearing of obstructions with prior approval from the owner. If the element cannot be installed at the design location due to obstructions, the element should be relocated as directed by the engineer.
3.5 Mixing
A. The equipment, installation procedures, materials, and sampling and testing methods established during the field validation program should be used for production. The contractor may request that the established mix design, equipment, installation procedure, or test methods be modified; however, the engineer may require additional testing or a new test section at no additional cost to the owner to verify that acceptable results can be achieved. The contractor should not employ modified mix designs, equipment, installation procedures, or sampling and testing methods until approved by the engineer in writing.
B. If the contractor must modify established methods due to equipment breakdowns, manpower changes, or improved conditions, a new test section should be installed at no cost to the

179
owner. If the owner requests modifications to the means and methods for design or other reasons (e.g., site conditions differ from what were encountered during the geotechnical explorations and the preproduction test program), the contractor should be compensated for new test sections.
C. Installation of each column should be continuous. If an interruption of more than 1 h occurs, the element should be remixed while injecting binder at the design rate for the entire height of the element at no additional cost to the owner.
D. Binder slurry injection rate: The contractor should record in the daily production report on a real-time basis the weight of dry binder or the volume of binder slurry injected for each 3 ft (1 m) (measured vertically) during penetration and withdrawal for each element. If the weight of dry binder or the volume of binder slurry injected per vertical foot (meter) is less than the amount required to meet the binder factor or volume ratio established during the field validation program, the element should be remixed, and additional binder should be injected at the design binder injection rate to a depth at least 3 ft (1 m) below the deficient zone at no additional cost to the owner. The binder factor should be recorded and plotted versus depth, and the records should be visible to the operator on a screen during construction so that proper adjustments may be made in real time.
E. Rotational speed and penetration/withdrawal rates: The necessary rotational speeds and penetration/withdrawal rates for the various soil layers encountered should be determined during the field validation program. The penetration and withdrawal rates must be monitored on a real-time basis. If the BRN is more than 15 percent below the value determined to be reliably acceptable from the field validation program, the column/element section must be remixed while injecting grout at the design binder injection rate.
F. Vertical alignment: The contractor should monitor and control the vertical alignment of the mixing tool stroke in two directions (longitudinal and transverse to the element alignment). Vertical alignment should be maintained within 1 percent of plumb during the element installation.
G. Element top and bottom elevations:
Commentary: The termination depth of DMM elements is designed to meet the foundation requirements of the structure, as discussed in chapter 6. For designs that specify the top and bottom elevations of the DMM elements, the constructed elements must extend from the specified bottom elevation or lower to the specified top elevation or higher. The specified top and bottom elevations may vary across the site depending on in situ ground conditions and facility requirements.
For sites that have a well-defined competent bearing stratum, the necessary bottom elevation can be based on refusal criteria determined from penetration speed, vertical load from the mixing tool, mixing energy, and/or power consumption needed for mixing tool penetration. The refusal criteria can be developed during the field validation program by installing test columns within 5 ft (1.5 m) of an existing boring and recording the operational parameters encountered when
180
the intended competent stratum is reached as indicated in the adjacent boring. If mix designs or operational procedures are modified during production, refusal criteria must be reestablished.
The total depth of penetration can be measured either by observing the length of the mixing shaft inserted below a reference point on the mast or by subtracting the exposed length of shaft above the reference point from the total shaft length. The contractor is responsible for achieving the specified top and bottom elevation requirements and for recording the actual elevations. However, remedial measures for elements of insufficient depth could significantly and adversely impact project costs and schedule, and it is helpful for the engineer to observe and confirm the column termination depth during construction. The mixing equipment must be adequately marked to allow QA personnel to confirm the penetration depth. The depth may also be determined by instrument and displayed in real time. The contractor should measure and record top and bottom elevations in the daily production report (see section 1.8).
If the depth to the competent soil layer at the bottom of the DMM element is found to be different from that indicated on the plans, the engineer may direct the contractor to shorten or deepen the element. The contractor should be compensated based on the decreased or increased amount of deep mixing as the engineer varies the termination depths. The contractor should not, however, be compensated for any portions of the elements that are above the top elevations or below the bottom elevations shown on the plans that are not approved by the engineer.
• Elements should be installed in accordance with the line and grades shown in the plans.
• The total depth of penetration should be measured either by observing the length of the mixing shaft inserted below a reference point on the mast or by subtracting the exposed length of shaft above the reference point from the total shaft length. Care should be taken to note ground surface heave that may affect reference points for measuring mixing shaft length. The contractor should note and record on the daily production report the final depth of the stroke. The equipment should be adequately marked to allow the engineer to confirm the penetration depth during construction.
• If the elevations of the top of competent soils are found to be different from those estimated, the engineer may direct the contractor to shorten or deepen the elements. Measurements of torque, down pressure, and/or the change in rotational speed may be used as indications of termination depth if a suitable correlation can be develop by the contractor to the satisfaction of the engineer. The contractor will be compensated based on the decreased or increased amount of deep mixing as termination depths vary. The contractor should not be compensated for any portions of the elements that are above the top elevations or below the bottom elevations shown on the plans unless approved by the engineer.
H. Bottom mixing:
Commentary: Bottom mixing is generally required to provide an adequate level of mixing in the lower portion of the DMM column. Bottom mixing may be conducted by lifting the mixing tool approximately 5 to 10 ft (1.5 to 3 m) above the element bottom elevation while maintaining mixing action and repenetrating to the element bottom elevation. The zone and procedure of

181
bottom mixing is established during the field validation program. (Bottom mixing is not applicable for TRD.)
The contractor should conduct bottom mixing as established in the field validation program.
I. Control of spoils:
Commentary: The contractor’s selection of means and methods can be heavily influenced by the requirements and procedures for handling spoils. Spoils may be handled in several different ways. Often, spoils are contained at the ground surface until they are sufficiently cured to be stockpiled and used for engineered fill. If unacceptably high pH levels preclude the use of spoils as fill, removal and offsite disposal may be necessary.
The contractor should control and dispose of all waste materials produced as a result of the mixing operation in accordance with the project requirements. The areas designated in the plans should be used for containing and processing the spoils.
3.6 QC
A. The contractor should provide all the personnel and equipment necessary to implement the QC/QA requirements of the project. The engineer will review daily production reports and QC/QA test reports to verify that QC/QA procedures are being properly implemented.
B. Deep mixing work plan: The contractor’s deep mixing work plan should include descriptions of all QC/QA activities and reporting as outlined in section 1.8. After the field validation program is conducted, the contractor may revise the QC/QA procedures, if approved by the engineer. The contractor should maintain the established and approved QC/QA procedures throughout production to ensure consistency in the deep mixing installation and to verify that the work complies with all requirements indicated in the approved working drawings.
C. Daily production records should be submitted as outlined in section 1.8.
D. Binder slurry density: The contractor should measure the specific gravity of the binder slurry at least twice per shift per slurry plant using the methods outlined in ASTM D4380 (not appropriate for dry mixing). The specific gravity of the binder slurry measured during production may not deviate by more than 3 percent from the established specific gravity. If the slurry density deviates by more than 3 percent, the contractor should recalibrate monitoring equipment and perform additional testing as required by the engineer at no additional cost to the owner. The contractor may also adjust binder or water quantities appropriately and retest at no additional cost to the owner.
E. The contractor should make simple routine checks of material quantities such as counting the number of bags or truckloads of binder materials that have been used. These quantities should be recorded in the daily production report.
F. Wet sampling and testing (not appropriate for dry mixing):

182
Commentary: Some deep mixed material may not be able to be wet grab sampled because either the mixture is too stiff or the material may not flow back into the void left after the sampler is extracted, possibly leaving a damaged element.
• The contractor should perform all wet sampling in the presence of the engineer. The contractor should notify the engineer at least 1 business day in advance of beginning sampling operations.
• The contractor should propose locations for wet sampling while considering input from the owner/engineer. Sample locations should be distributed uniformly both laterally and vertically within the deep mixed zone. Sampling depths should be selected to ensure that wet samples are retrieved from every main soil stratum underlying the site.
• The contractor should report the information required in the daily production report (see section 1.8) for all attempts, successful and unsuccessful, to obtain wet samples.
• The contractor should collect a minimum of three wet bulk samples (each sample is taken at one selected depth at one location) for each mix design used in each test section. At least one wet bulk sample (one selected depth at one location) should be collected from within each main soil layer from elements produced using each mix design.
• One wet bulk sample (one selected depth at one location) should be retrieved every 2 production days or for every 2,000 yd3 (1500 m3) of treated soil, whichever produces the higher sampling frequency.
• Wet bulk samples should be collected using a bailer-type sampling tool or similar.
• Eight test specimens from each wet bulk sample should be made with 3-inch (76-mm) diameter and 6-inch (152-mm) length, using the following general procedures (detailed procedures on specimen preparation are outlined in appendix A):
1. Pour the sample into a container, screening for oversized lumps (gravel versus unmixed soil). Place the sample in specimen molds in three to five layers. Tap, vibrate, or rod the specimens to remove trapped air bubbles. Use care to avoid additional mixing or kneading action as much as possible on the sample during screening and specimen preparation so that the sample is representative of in-place mixing conditions.
2. Measure and describe the volume and composition of oversized lumps.
3. Seal the specimen to prevent moisture from entering or leaving, and store the specimen in a humid environment in accordance with ASTM C192.
4. The engineer may request additional test specimens for QA testing.

183
G. Coring:
Commentary: The coring frequency should be selected by the engineer during the design stage based on considerations of project size, criticality, and complexity. The selected coring frequency can be stated in the specifications either as a percentage of elements or as a combination of the percentage of elements and the treatment area, depending on the project needs.
For production elements on typical DMM projects, one full-depth continuous core should be made for every 3 percent of elements. For smaller, more critical, or more complex projects or at more critical locations within otherwise typical projects such as at structure foundations, the engineer could specify that more elements be cored, up to 4 percent of the total production elements. For a larger, less critical, and less complex project, such as a large DMM embankment foundation project in similar subsurface soils along the entire alignment, the engineer could specify that 2 percent of the production elements be cored. At a minimum, five production elements should be cored at full depth so that a reasonable amount of data is collected, even for small projects.
Some deep mixing equipment produces a relatively large treated area in each element, whereas other equipment produces a relatively small treated area in each element. For example, if the same project were done using two different mixing machines that both produce 3-ft (1-m)-diameter columns and the same column overlap is used but one machine is single-axis and the other is a six-axis machine, then up to six times as many cores would be necessary for the single-axis machine as for the six-axis machine when the number of cored elements is specified on a percentage basis. A justification for requiring a smaller number of cores for equipment that produces larger treatment areas per element is that the same binder factor, mixing parameters, and blending action apply to the entire area treated. Nevertheless, an engineer may want to consider adding a treatment area criterion to the percentage criterion for determining the number of elements to be cored so that a sufficient amount of data can be collected even if the contractor uses equipment that produces a large treated area per element. For example, an engineer may want to specify that full-depth coring be done on 2.5 percent of elements or for every 1,000 ft2 (93 m2) of treated ground, whichever produces the greater number of cores. In this example, the 2.5 percent criterion would control for all types of elements that produce a treated area smaller than 25 ft2 (2.3 m2) after accounting for overlaps between elements, and the 1,000 ft2(93m2) criterion would control for all types of elements that produce a treated area larger than 25 ft2 (2.3 m2) after accounting for overlaps between elements.
For TRD or cutoff walls, every 1,000 yd3 (750 m3) of treated soil or every 300 ft (90 m) of wall in horizontal direction should be cored. For small sized projects, at least five elements should be cored to provide a reasonable amount of information for evaluation of deep mixing work.
• The contractor should perform all coring operations in the presence of the engineer. The contractor should notify the engineer at least 1 business day in advance of beginning sampling operations.
184
• The contractor should determine the time interval between element installation and coring except that the interval should be no longer than required to conduct 28-day strength testing.
• The full-depth samples should be obtained along a vertical alignment located one-fourth of a column diameter from the column center. If it is difficult to avoid drilling out of the column at this coring location, the contractor may drill one-fourth of a column diameter along the centerline of an element or shear wall so the core enters the adjacent column in the same element.
• Core samples should be retrieved using standard triple-tube or equivalent continuous coring techniques.
• Samples should have a diameter of at least 2.5 inches (65 mm), and each core run should be at least 3 ft (1 m) in length.
• For each field validation test section, the contractor should collect at least one full-depth core for each mix design at locations defined by the owner/engineer.
• The contractor should collect one full-depth core from 3 percent of elements or 860 ft2 (79 m2) of treated area, whichever produces a larger number of cored elements. The cores should be drilled at locations defined by the owner/engineer. An element is defined as the treated soil produced by one setup of either a single- or multiple-axis machine.
• The contractor should photograph each core run.
• Upon retrieval, the contractor should provide the cores to the engineer for logging and test specimen selection.
• Following logging, the engineer will select at least five specimens from each full-depth continuous core for strength testing. Each test specimen should have a length-to-diameter ratio of 2 or greater.
• Immediately following logging and test specimen selection by the engineer, the contractor should seal the entire full-depth sample, including the designated test specimens, in plastic wrap to prevent drying and transport the sealed sample to the laboratory. The samples should be protected against drying and mechanical damage prior to and during transport.
• The samples should be stored in a moist room in accordance with ASTM C192 until the test date.
• Samples must not be submerged in water during curing unless they are sealed in a water-tight plastic bag (e.g., a Ziploc® bag) with as much air removed as possible prior to sealing to void swelling.

185
• The contractor should retain portions of the samples that are not tested until completion and acceptance of all DMM work for possible future inspection and confirmation testing by the engineer. If a large volume of samples cannot be reasonably stored on the job site, cores from columns deemed satisfactory may be disposed of prior to project completion if approved by the engineer.
• All core holes should be filled with cement grout that will obtain a 28-day unconfined compressive strength equal to or greater than the 28-day unconfined compressive strength of the deep mixed material.
H. Strength testing:
• Strength testing should be conducted by an independent testing laboratory retained by the contractor and approved by the engineer.
• Testing for unconfined compressive strength should be conducted in accordance with ASTM D2166, except that loading should continue on all specimens until the cylinders break sufficiently to examine the interior of the specimen.
• The broken specimen should be photographed so that the engineer may document any apparent segregation, lenses, and pockets in the specimen.
• For field validation testing, unconfined compressive strength testing should be performed on specimens from wet grab samples 3, 7, 28, and 56 days or more after mixing.
• For full production work, unconfined compressive strength testing should be performed on specimens from wet grab samples 7 and 28 days after mixing.
• For specimens obtained by coring, unconfined compressive strength testing should be performed 28 days after mixing.
• Laboratory permeability testing should be performed on cylinders at 7 and 28 days for the test section and usually only at 28 days for the production elements. Laboratory permeability testing should be conducted in accordance with ASTM D5084.
I. Uniformity evaluation: The contractor should provide the continuous core samples to the engineer for logging and assessing uniformity in accordance with the acceptance criteria outlined in section 3.6.
J. Both the contractor’s testing and the engineer’s testing (if performed) must demonstrate that the required strengths are met prior to accepting the work. The contractor should conduct additional coring and testing required to demonstrate the acceptability of the DMM product due to non-conformance at no additional cost to the owner.
K. Geometric acceptance criteria:
Commentary: The overlap between any two adjacent elements should be as specified by the design engineer based on analyses of vertical shearing, as described in chapter 6, and

186
considering common tooling in the deep mixing industry. Overlap up to 20 percent of the cross-sectional area of a single column has been specified for shear walls. The amount of overlap and the vertical tolerance are interdependent, and both acceptance criteria should be considered together. The design effects of overlaps are discussed in chapter 6.
• The engineer should make the sole determination as to whether the test results satisfy the geometric acceptance criteria.
• The horizontal alignment of the DMM element should be within 4 inches (100 mm) of the planned location at the top of design DMM layout.
• The overlap between any two adjacent elements should be at least _____ percent (to be defined by the engineer) of the cross sectional area of a single column.
• Vertical alignment within 1 percent of plumb should be maintained during the DMM column installation.
• The top of the column should extend upward to the designated elevation or higher.
• The bottom of the DMM column should extend at least to the depth indicated on the construction drawings or to a specified penetration into the bearing layer or as modified by the engineer in the field.
L. Strength acceptance criteria:
Commentary: The acceptance criteria must reflect the level of risk and tolerances of the structure and the expected behavior of the deep mixed material. For example, strength criteria are critical for highly loaded individual deep mixed elements that serve as abutment support but may be less stringent for elements that are installed with a high area replacement ratio for embankment support. Acceptance criteria should be modified to accommodate these differences. A statistical approach to assessing strength criteria is preferred to an average or minimum unconfined compressive strength to avoid impact by inordinately high or low values.
Since deep mixing is an in situ ground engineering technique, the deep mixed soil product will vary based on characteristics of the native soil, construction methods, operational parameters, binder characteristics, and curing conditions. The acceptance criteria for the strength of deep mixed material are outlined in section 3.6. The acceptance criteria outline the acceptable variability of measured deep mixed soil strength relative to the product requirements.
The proposed mix design and installation procedures will vary based on the stringency of the acceptance criteria. It is critical to establish acceptance criteria based on the risk and criticality of the structure and the factor of safety assumed during design. Very tight acceptance criteria leave a relatively small margin for variability (e.g., a minimum unconfined compressive strength that must be met with no accommodation for test results that fall below the minimum is not an appropriate specification approach). The contractor must propose a mix design that produces a product that will consistently exceed the product requirement by a sufficient margin to avoid non-conformance. Over-conservatism produced by unnecessarily strict acceptance criteria

187
results in additional materials and mixing energy that will be reflected in the contractor’s bid price. Unit weight is typically not a criterion for acceptance of DMM work.
• The engineer should make the sole determination as to whether the test results satisfy the following strength acceptance criteria.
• The specified unconfined compressive strength of the deep mixed material as determined by ASTM D2166 at 28 days curing time should be _____ psi (to be defined by the engineer).
• 80 percent of unconfined compressive strength test results as determined by ASTM D2166 from each tested deep mixed element should equal or exceed the specified strength. If a strength specimen falls below the specified strength due to an obviously unrepresentative lump of unmixed soil in the specimen, the engineer has the option to select another specimen from the same core run and allow the contractor’s laboratory to test the replacement specimen and substitute the strength from the replacement specimen for the strength from the unrepresentative specimen that failed to satisfy the strength requirement. Only one such retest will be allowed per core run.
• To prevent a weak layer at one elevation in the DMM foundation system, strengths below the specified strength are not permitted within 10 ft (3 m) of the same elevation in more than two nearby cored elements. “Nearby cored elements” refer to cored elements without an intervening cored element that has a passing test result in the suspect elevation zone.
• 90 percent of all of the test results across the site should equal or exceed the specified strength.
M. Uniformity criteria:
• The engineer should make the sole determination as to whether the test results satisfy the uniformity acceptance criteria.
• Full-depth continuous core samples retrieved by the contractor from the DMM element should be used to evaluate uniformity.
• Core recovery (expressed as a percentage) should be reported for each run and is equal to the total length of recovered core divided by the total core run length. Length of recovered core includes lengths of treated and untreated soil.
• Percent treatment is calculated as the total length of recovered core minus the sum of the lengths of unmixed or poorly mixed soil regions or lumps that extend across the entire diameter of the core divided by the total core run length expressed as a percentage. Percent treatment must be at least 80 percent for every 5 ft (1.5 m) core run. If 80 percent treatment cannot be confirmed by coring in coarse sandy or gravelly soil, optical televiewer logs can be used to confirm uniformity.
188
• If the contractor uses core runs shorter than 5 ft (1.5 m) (e.g., 3 ft (1 m)), then the recovery and percent treatment can be calculated taking into equal amounts of core run length on either side of the short core run length to make up a total 5-ft (1.5-m) run length for calculation purposes
N. Non-conformance:
• The contractor is responsible for correcting the location or alignment of misplaced elements that will adversely affect the project quality. The contractor should correct misaligned elements that interfere with the project in a manner acceptable to the owner.
• If the strength and uniformity acceptance criteria are not achieved for production elements, the contractor should submit a proposed plan for investigating, remixing, or repairing failed sections for review and approval by the engineer.
• To prove acceptability of the failed element, the contractor may core elements on both sides of the failed element. If those two cores meet the criteria, then the element should be accepted. If the additional cores fail, then the contractor can propose additional investigations and remedial measures, which the engineer will review and has the option to accept or reject depending on whether the proposed remedial measures meet the design intent. Examples of such investigations and remedial measures include the following:
o In the case that the treated soil meets the uniformity criteria but fails to meet the strength criteria, the elements or zone could be assigned a lower strength level. The contractor could propose installing additional elements to compensate the strength required by the design intent. If the treated soil fails to meet the uniformity criteria, the elements need to be remixed or replaced.
o If the treated soil that failed to meet the uniformity criteria is concentrated in a narrow elevation range forming weak planes or zones, the contractor could propose redrilling and remixing to 3 ft (1 m) below the deficient zone. If redrilling and remixing cannot be done efficiently, the contractor must replace the elements to the full depth. If the treated soil in the narrow elevation meets the uniformity criteria but fails to meet the strength criteria, the contractor could propose to redrill and remix the deficient zone or to assign a lower strength level to the deficient zone and install additional elements to compensate for the strength deficiency.
o If the treated soil that failed to pass cannot be isolated in a specific zone, the contractor must provide remedial measures for all elements constructed during all rig shifts that occurred between passing elements.
o Remedial measures are subject to coring and application of the specification acceptance criteria.

189
PART 4—MEASUREMENT AND PAYMENT
Commentary: Contractor payment may be made as a percentage of completion to accommodate time lag in acceptance of work due to awaiting test results. Payment may be made when production is 50 percent complete and 50 percent upon submittal of acceptable test results.
Measurement and payment items are detailed in table 26.
Table 26. Measurement and payment items for DMM contracts.
Item Unit of
Measurement Mobilization/demobilization Lump sum Preproduction test program Lump sum
DMM production works (DMM columns/elements including working platform)
Production DMM works (defined by owner) Lump sum Add/deduct individual elements yd3 (m3) Add/deduct overlapping column/elements for buttresses, cells, or walls
yd3 (m3)
Add/deduct mass stabilization yd3 (m3)
QC/QA testing (including tests required for the preproduction test program)
QC/QA program (defined by owner) Lump sum Add/deduct coring ft (m) of coring Add/deduct unconfined compression testing of cores
Per each test
Add/deduct unconfined compression testing of wet samples (includes collection of sample and forming cylinder)
Per each sample
Add/deduct permeability testing Per each test Instrumentation Lump sum


191
APPENDIX D. TABULATED DATA FOR DMM METHODS AND EQUIPMENT USED INTERNATIONALLY
This appendix contains tables detailing equipment and tooling data and treated soil material properties for DMM techniques used internationally.
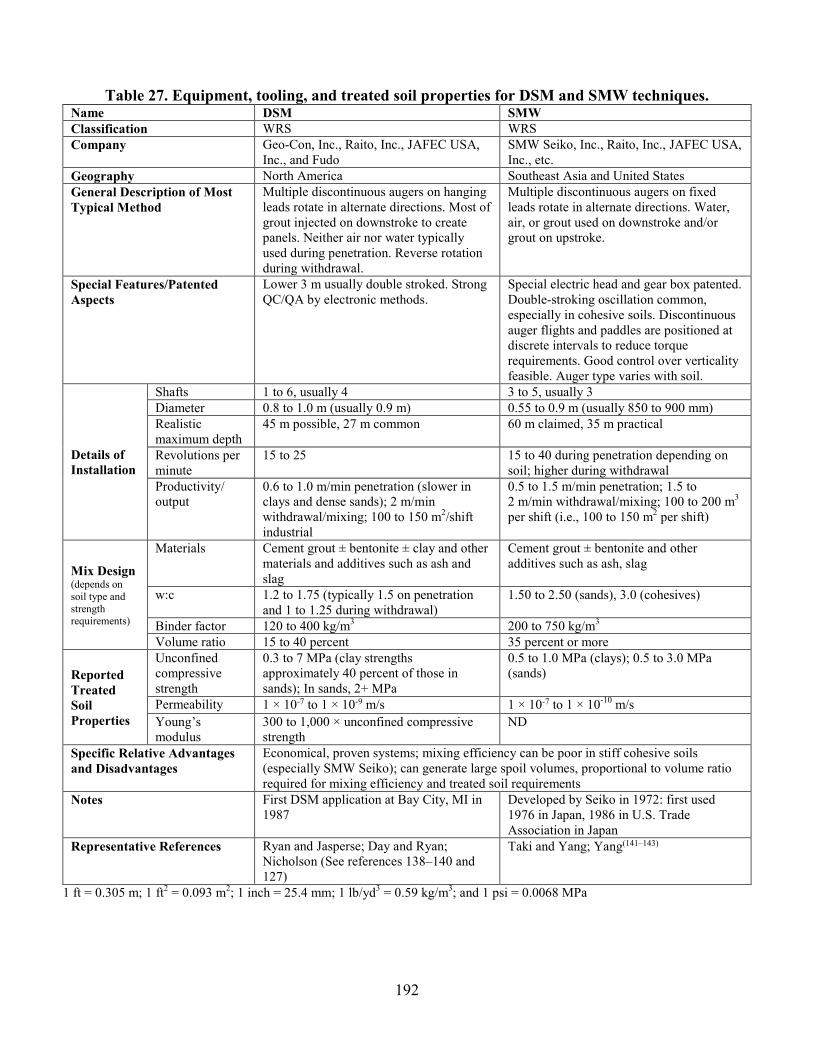
192
Table 27. Equipment, tooling, and treated soil properties for DSM and SMW techniques. Name DSM SMW Classification WRS WRS Company Geo-Con, Inc., Raito, Inc., JAFEC USA,
Inc., and Fudo SMW Seiko, Inc., Raito, Inc., JAFEC USA, Inc., etc.
Geography North America Southeast Asia and United States General Description of Most Typical Method
Multiple discontinuous augers on hanging leads rotate in alternate directions. Most of grout injected on downstroke to create panels. Neither air nor water typically used during penetration. Reverse rotation during withdrawal.
Multiple discontinuous augers on fixed leads rotate in alternate directions. Water, air, or grout used on downstroke and/or grout on upstroke.
Special Features/Patented Aspects
Lower 3 m usually double stroked. Strong QC/QA by electronic methods.
Special electric head and gear box patented. Double-stroking oscillation common, especially in cohesive soils. Discontinuous auger flights and paddles are positioned at discrete intervals to reduce torque requirements. Good control over verticality feasible. Auger type varies with soil.
Details of Installation
Shafts 1 to 6, usually 4 3 to 5, usually 3 Diameter 0.8 to 1.0 m (usually 0.9 m) 0.55 to 0.9 m (usually 850 to 900 mm) Realistic maximum depth
45 m possible, 27 m common 60 m claimed, 35 m practical
Revolutions per minute
15 to 25 15 to 40 during penetration depending on soil; higher during withdrawal
Productivity/ output
0.6 to 1.0 m/min penetration (slower in clays and dense sands); 2 m/min withdrawal/mixing; 100 to 150 m2/shift industrial
0.5 to 1.5 m/min penetration; 1.5 to 2 m/min withdrawal/mixing; 100 to 200 m3 per shift (i.e., 100 to 150 m2 per shift)
Mix Design (depends on soil type and strength requirements)
Materials Cement grout ± bentonite ± clay and other materials and additives such as ash and slag
Cement grout ± bentonite and other additives such as ash, slag
w:c 1.2 to 1.75 (typically 1.5 on penetration and 1 to 1.25 during withdrawal)
1.50 to 2.50 (sands), 3.0 (cohesives)
Binder factor 120 to 400 kg/m3 200 to 750 kg/m3 Volume ratio 15 to 40 percent 35 percent or more
Reported Treated Soil Properties
Unconfined compressive strength
0.3 to 7 MPa (clay strengths approximately 40 percent of those in sands); In sands, 2+ MPa
0.5 to 1.0 MPa (clays); 0.5 to 3.0 MPa (sands)
Permeability 1 × 10⁻⁷ to 1 × 10⁻⁹ m/s 1 × 10⁻⁷ to 1 × 10⁻¹⁰ m/s Young’s modulus
300 to 1,000 × unconfined compressive strength
ND
Specific Relative Advantages and Disadvantages
Economical, proven systems; mixing efficiency can be poor in stiff cohesive soils (especially SMW Seiko); can generate large spoil volumes, proportional to volume ratio required for mixing efficiency and treated soil requirements
Notes First DSM application at Bay City, MI in 1987
Developed by Seiko in 1972: first used 1976 in Japan, 1986 in U.S. Trade Association in Japan
Representative References Ryan and Jasperse; Day and Ryan; Nicholson (See references 138–140 and 127)
Taki and Yang; Yang(141–143)
1 ft = 0.305 m; 1 ft2 = 0.093 m2; 1 inch = 25.4 mm; 1 lb/yd3 = 0.59 kg/m3; and 1 psi = 0.0068 MPa

193
Table 28. Equipment, tooling, and treated soil properties for TREVIMIX Wet and Colmix techniques.
Name TREVIMIX Wet Colmix Classification WRS/WRE WRS Company TREVI Bachy Geography Worldwide Europe General Description of Most Typical Method
Multiple cable-suspended augers rotate in opposite directions. Grout injected during penetration. Prestroked with water in cohesive soils (if required). Auger rotation reversed during withdrawal.
Counter-rotating mixing shafts from fixed leads penetrate ground while slurry is injected. Blended soil moves from bottom to top of hole during penetration and reverses on withdrawal. Restroking of columns in cohesive soils.
Special Features/Patented Aspects
Real-time recording of drilling and grouting parameters. Developed especially for cohesionless soils of low/medium density and cohesive soils.
6 to 8 auger machines noted in Australian patent (1995). Changing direction of augers during extraction compacts columns. Patented in United States 4,662,792 (1987). Automatic drilling parameter recorder synchronizes slurry injection and penetration rates.
Details of Installation
Shafts 1 to 3 (configuration varies with soil) 2, 3, or 4 common (6 to 8 possible) Diameter 0.55 to 0.8 m at 0.4- to 0.6-m spacing 0.23 to 0.85 m Realistic maximum depth
25 m 20 m (10 m common)
Revolutions per minute
12 to 30 ND
Productivity/ output
0.35 to 1.5 m/min penetration; 0.5 to 2.0 m/min withdrawal
0.8 m/min penetration; 1.0 m/min withdrawal; 200 to 300 m/shift
Mix Design (depends on soil type and strength requirements)
Materials Cementitious grout, additives may be used
Cement, lime, flyash, and special grouts to absorb heavy metals and organics
w:c Typically low (i.e., 1.25 to 0.8 by weight)
1.0 typical, but wide range
Binder factor 150 to 250 kg/m3 typical Up to 320 kg/m3 (200 kg/m3 typical) Volume ratio 15 to 40 percent 30 to 50 percent
Reported Treated Soil Properties
Unconfined compressive strength
5 to 30 MPa (granular soils); 0.2 to 1 MPa (silts and clays)
3 to 4 MPa (clay), higher for sands
Permeability < 1 x 10⁻⁸ m/s < 1 x 10⁻⁷ m/s Young’s modulus
ND 50 to 100 × unconfined compressive strength
Specific Relative Advantages and Disadvantages
Goals are to optimize the quality of mixing and speed of installation and to minimize the amount of spoil
Low spoil claimed. Can be used on slopes and adjacent to structures. Columns have 10 to 20 percent larger diameters than shafts due to compaction effect. Flexible equipment and mix design.
Notes Developed by TREVI Developed in France in late 1980s Representative References Promotional materials from TREVI Harnan and Iagolnitzer(144)
ND = No data. 1 ft = 0.305 m; 1 ft2 = 0.093 m2; 1 inch = 25.4 mm; 1 lb/yd3 = 0.59 kg/m3; and 1 psi = 0.0068 MPa

194
Table 29. Equipment, tooling, and treated soil properties for Soil Removal Technique and CDM.
Name Soil Removal Technique CDM Classification WRS WRS Company Shimizu Corporation More than 48 members of CDM Association
in Japan and offered in United States by Raito, Inc., JAFEC USA, Inc., and Fudo
Geography Japan Japan, China General Description of Most Typical Method
Upper continuous auger flights on fixed leads extract soil to ground surface during penetration. Lower mixing blades rotate and mix soil with injected slurry during withdrawal.
Fixed leads support shafts with two to six mixing blades above drill bit. Grout injected during penetration and (mainly) withdrawal. Also a 2- to 8-min mixing period at full depth.
Special Features/Patented Aspects
Continuous flight augers from drill tip to the ground surface remove soil to limit ground displacements and lateral stresses during mixing.
Comprises numerous subtly different methods all under CDM Association
Details of Installation
Shafts 2 2 to 8 (marine); 1 to 6 (land) (each with 4 to 6 blades) (12 have been used)
Diameter 1 to 1.2 m 1 to 1.6 m (marine); 0.7 to 1.6 m (land) Realistic maximum depth
40 m 70 m (marine); 40 m (land)
Revolutions per minute
ND 20 to 40 (penetration); 20 to 40 (withdrawal)
Productivity/ output
ND 0.5 to 2 m/min (avg. 1 m/min) (penetration) 1 to 2 m/min (withdrawal) (1,000 m3/shift for marine; 100 to 200 m3/shift on land)
Mix Design (depends on soil type and strength requirements)
Materials Cement grout Wide range of materials, including PCC or slag cement, bentonite, gypsum, flyash, using fresh or seawater, plus various additives.
w:c ND 0.6 to 1.3, typically 1.0 Binder factor ND 100 to 300 kg/m3, typically 140 to 200 kg/m3 Volume ratio ND 20 to 30 percent
Reported Treated Soil Properties
Unconfined compressive strength
0.5 MPa (in soft silt) (70 percent of conventional DMM)
Strengths can be closely controlled by varying grout composition from < 0.5 to 4 MPa (typically 2 to 4 MPa)
Permeability ND 1 x 10⁻⁸ to 1 x 10⁻⁹ m/s Young’s modulus
ND ND
Specific Relative Advantages and Disadvantages
Reduces horizontal displacements and stresses imposed during mixing. Obviates need for pre-augering.
Vast amount of information available. Specifically developed for softer marine deposits and fills, now also used for land-based projects.
Notes Operational prototype stage. Possibly patented (assumed similar to CDM).
Association founded in 1977. Research initiated under Japanese Government (1967).
Representative References Hirai et al. (145) Promotional material from Cement Deep Mixing Method Association; Okumura(146)
ND = No data. 1 ft = 0.305 m; 1 ft2 = 0.093 m2; 1 inch = 25.4 mm; 1 lb/yd3 = 0.59 kg/m3; and 1 psi = 0.0068 MPa
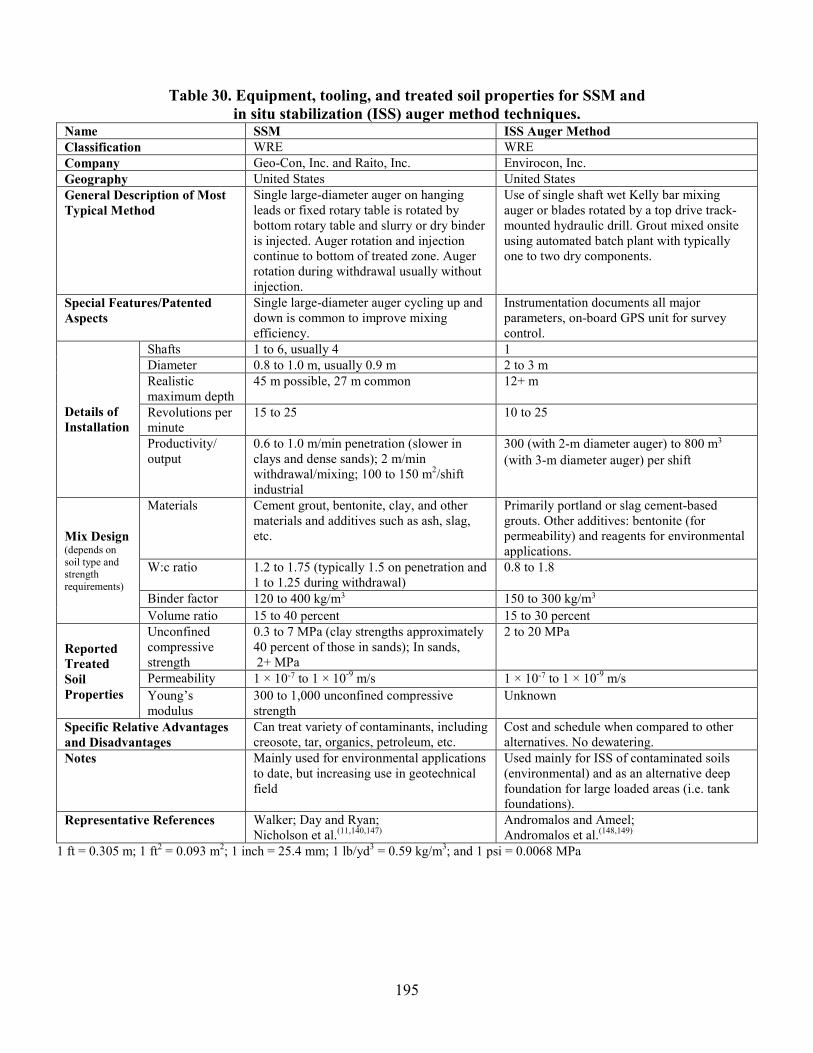
195
Table 30. Equipment, tooling, and treated soil properties for SSM and in situ stabilization (ISS) auger method techniques.
Name SSM ISS Auger Method Classification WRE WRE Company Geo-Con, Inc. and Raito, Inc. Envirocon, Inc. Geography United States United States General Description of Most Typical Method
Single large-diameter auger on hanging leads or fixed rotary table is rotated by bottom rotary table and slurry or dry binder is injected. Auger rotation and injection continue to bottom of treated zone. Auger rotation during withdrawal usually without injection.
Use of single shaft wet Kelly bar mixing auger or blades rotated by a top drive track-mounted hydraulic drill. Grout mixed onsite using automated batch plant with typically one to two dry components.
Special Features/Patented Aspects
Single large-diameter auger cycling up and down is common to improve mixing efficiency.
Instrumentation documents all major parameters, on-board GPS unit for survey control.
Details of Installation
Shafts 1 to 6, usually 4 1 Diameter 0.8 to 1.0 m, usually 0.9 m 2 to 3 m Realistic maximum depth
45 m possible, 27 m common 12+ m
Revolutions per minute
15 to 25 10 to 25
Productivity/ output
0.6 to 1.0 m/min penetration (slower in clays and dense sands); 2 m/min withdrawal/mixing; 100 to 150 m2/shift industrial
300 (with 2-m diameter auger) to 800 m3 (with 3-m diameter auger) per shift
Mix Design (depends on soil type and strength requirements)
Materials Cement grout, bentonite, clay, and other materials and additives such as ash, slag, etc.
Primarily portland or slag cement-based grouts. Other additives: bentonite (for permeability) and reagents for environmental applications.
W:c ratio 1.2 to 1.75 (typically 1.5 on penetration and 1 to 1.25 during withdrawal)
0.8 to 1.8
Binder factor 120 to 400 kg/m3 150 to 300 kg/m3 Volume ratio 15 to 40 percent 15 to 30 percent
Reported Treated Soil Properties
Unconfined compressive strength
0.3 to 7 MPa (clay strengths approximately 40 percent of those in sands); In sands, 2+ MPa
2 to 20 MPa
Permeability 1 × 10⁻⁷ to 1 × 10⁻⁹ m/s 1 × 10⁻⁷ to 1 × 10⁻⁹ m/s Young’s modulus
300 to 1,000 unconfined compressive strength
Unknown
Specific Relative Advantages and Disadvantages
Can treat variety of contaminants, including creosote, tar, organics, petroleum, etc.
Cost and schedule when compared to other alternatives. No dewatering.
Notes Mainly used for environmental applications to date, but increasing use in geotechnical field
Used mainly for ISS of contaminated soils (environmental) and as an alternative deep foundation for large loaded areas (i.e. tank foundations).
Representative References Walker; Day and Ryan; Nicholson et al.(11,140,147)
Andromalos and Ameel; Andromalos et al.(148,149)
1 ft = 0.305 m; 1 ft2 = 0.093 m2; 1 inch = 25.4 mm; 1 lb/yd3 = 0.59 kg/m3; and 1 psi = 0.0068 MPa

196
Table 31. Equipment, tooling, and treated soil properties for RAS column method and rectangular 1 (cutting wheels) techniques.
Name RAS Column Method Rectangular 1 (Cutting Wheels) Classification WRE WRE Company Raito Kogyo, Co. offered in United
States by Raito, Inc. Shimizu
Geography Japan Japan General Description of Most Typical Method
Large diameter, single-shaft, concentric double-rod system on fixed lead is rotated at high rpm into ground and grout injected over zone to be treated. Unit cycled up and down through zone with or without additional grout injection.
A pair of laterally connected shafts with horizontal mixing blades and vertical vanes are rotated during penetration. Grout injection during penetration and/or withdrawal. Vertical vanes create rectangular elements.
Special Features/Patented Aspects
Cutting blade on inner rod rotates in opposite direction from two mixing blades on outer rod. Slurry injection ports located at base of inner rod.
Use of claw-like vanes to create rectangular columns; vanes may be patented. Inclinometer fixed to mixing unit to monitor verticality.
Details of Installation
Shafts 1 2 Diameter 1.4 and 2.0 m (larger than typical
CDM) 1- by 1.8-m columns
Realistic maximum depth
24 m typical; 28 m possible. 15 m
Revolutions per minute
Up to 40 (in each direction) ND
Productivity/ output
0.5 m/min penetration; 1 m/min withdrawal
1 m/min penetration/withdrawal
Mix Design (depends on soil type and strength requirements)
Materials Cement grout Cement grout w:c ratio 0.8 (field trial) ND Binder factor 300 kg/m3 (field trial) ND Volume ratio 33 percent (field trial) ND
Reported Treated Soil Properties
Unconfined compressive strength
1 to 6 MPa ND
Permeability ND ND Young’s modulus
ND ND
Specific Relative Advantages and Disadvantages
Large-diameter auger speeds production, computer control and monitoring, and uniform mixing. Especially useful in dense soils.
Rectangular columns require less overlap than circular. Vertical flow during mixing and larger cross sectional column area per stroke.
Notes Assumed similar to CDM Operational prototype stage. Assumed similar to CDM
Representative References Isobe et al.(150) Watanabe et al.(151) ND = No data. 1 ft = 0.305 m; 1 ft2 = 0.093 m2; 1 inch = 25.4 mm; 1 lb/yd3 = 0.59 kg/m3; and 1 psi = 0.0068 MPa
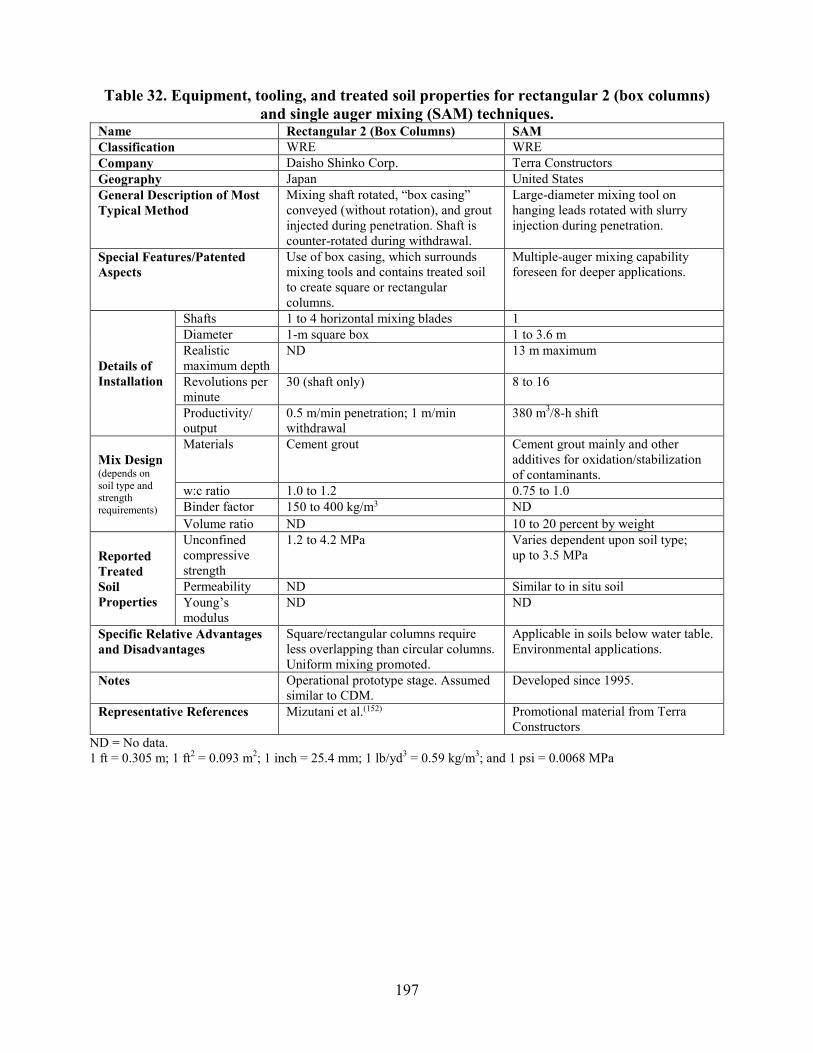
197
Table 32. Equipment, tooling, and treated soil properties for rectangular 2 (box columns) and single auger mixing (SAM) techniques.
Name Rectangular 2 (Box Columns) SAM Classification WRE WRE Company Daisho Shinko Corp. Terra Constructors Geography Japan United States General Description of Most Typical Method
Mixing shaft rotated, “box casing” conveyed (without rotation), and grout injected during penetration. Shaft is counter-rotated during withdrawal.
Large-diameter mixing tool on hanging leads rotated with slurry injection during penetration.
Special Features/Patented Aspects
Use of box casing, which surrounds mixing tools and contains treated soil to create square or rectangular columns.
Multiple-auger mixing capability foreseen for deeper applications.
Details of Installation
Shafts 1 to 4 horizontal mixing blades 1 Diameter 1-m square box 1 to 3.6 m Realistic maximum depth
ND 13 m maximum
Revolutions per minute
30 (shaft only) 8 to 16
Productivity/ output
0.5 m/min penetration; 1 m/min withdrawal
380 m3/8-h shift
Mix Design (depends on soil type and strength requirements)
Materials Cement grout Cement grout mainly and other additives for oxidation/stabilization of contaminants.
w:c ratio 1.0 to 1.2 0.75 to 1.0 Binder factor 150 to 400 kg/m3 ND Volume ratio ND 10 to 20 percent by weight
Reported Treated Soil Properties
Unconfined compressive strength
1.2 to 4.2 MPa Varies dependent upon soil type; up to 3.5 MPa
Permeability ND Similar to in situ soil Young’s modulus
ND ND
Specific Relative Advantages and Disadvantages
Square/rectangular columns require less overlapping than circular columns. Uniform mixing promoted.
Applicable in soils below water table. Environmental applications.
Notes Operational prototype stage. Assumed similar to CDM.
Developed since 1995.
Representative References Mizutani et al.(152) Promotional material from Terra Constructors
ND = No data. 1 ft = 0.305 m; 1 ft2 = 0.093 m2; 1 inch = 25.4 mm; 1 lb/yd3 = 0.59 kg/m3; and 1 psi = 0.0068 MPa

198
Table 33. Equipment, tooling, and treated soil properties for cementation and single axis tooling techniques.
Name Cementation Single Axis Tooling Classification WRE WRE Company Kvaerner Cementation Hayward Baker Inc., and Keller Co. Geography United Kingdom United States (with opportunities for
sister companies worldwide) General Description of Most Typical Method
Single auger on fixed leads rotated during penetration. Auger cycled up and down through 1-m length five times then raised to next 1-m increment. Repeat to surface. Injection upon penetration, cycling, and/or withdrawal.
Mast mounted shaft rotated by top rotary drive. Grout injected usually during penetration, followed by bottom remixing and oscillation at full depth and rapid extraction with injection of backfill grout only (1 to 5 percent total).
Special Features/Patented Aspects
Combination of a short interrupted length of auger with smaller diameter continuous flights.
ND
Details of Installation
Shafts Single with 2 or 3 pairs of mixing paddles above drill bit.
1
Diameter 0.5 to 2.4 m, typically 2.1 and 2.4 m 0.75 m (1 m also possible) Realistic maximum depth
20 m maximum 10+ m
Revolutions per minute
20 to 60 (penetration); higher upon withdrawal
ND
Productivity/ output
0.3 to 0.5 m/min (penetration); faster upon withdrawal. In excess of 500 m3/shift
0.5 to 0.67 m/min penetration/mixing
Mix Design (depends on soil type and strength requirements)
Materials Varied in response to soil type and needs Cement grout with or without flyash w/c ratio 1 to 2 (typically at lower end) 0.4 Binder factor 150 to 400 kg/m3 60 to 130 kg/m3 Volume ratio 25 to 50 percent Unknown
Reported Treated Soil Properties
Unconfined compressive strength
3.5 to 10 MPa (sands); 0.2 to 1.4 MPa (clays)
5 to 10 MPa
Permeability 1 × 10⁻⁷ m/s possible ND Young’s modulus
50 to 150 ksi ND
Specific Relative Advantages and Disadvantages
Low spoil, low heave potential, specific horizons can be treated, good in saturated ground where dewatering cannot be used.
Good mixing; moderate penetration capability; low spoils volume. Dry binder method also available.
Notes Not now apparently used in U.K. due to market conditions.
In development since 1990. Commercially viable since 1997.
Representative References Greenwood(153) Burke et al.; Burke and Sehn (154,155) ND = No data. 1 ft = 0.305 m; 1 ft2 = 0.093 m2; 1 inch = 25.4 mm; 1 lb/yd3 = 0.59 kg/m3; and 1 psi = 0.0068 MPa
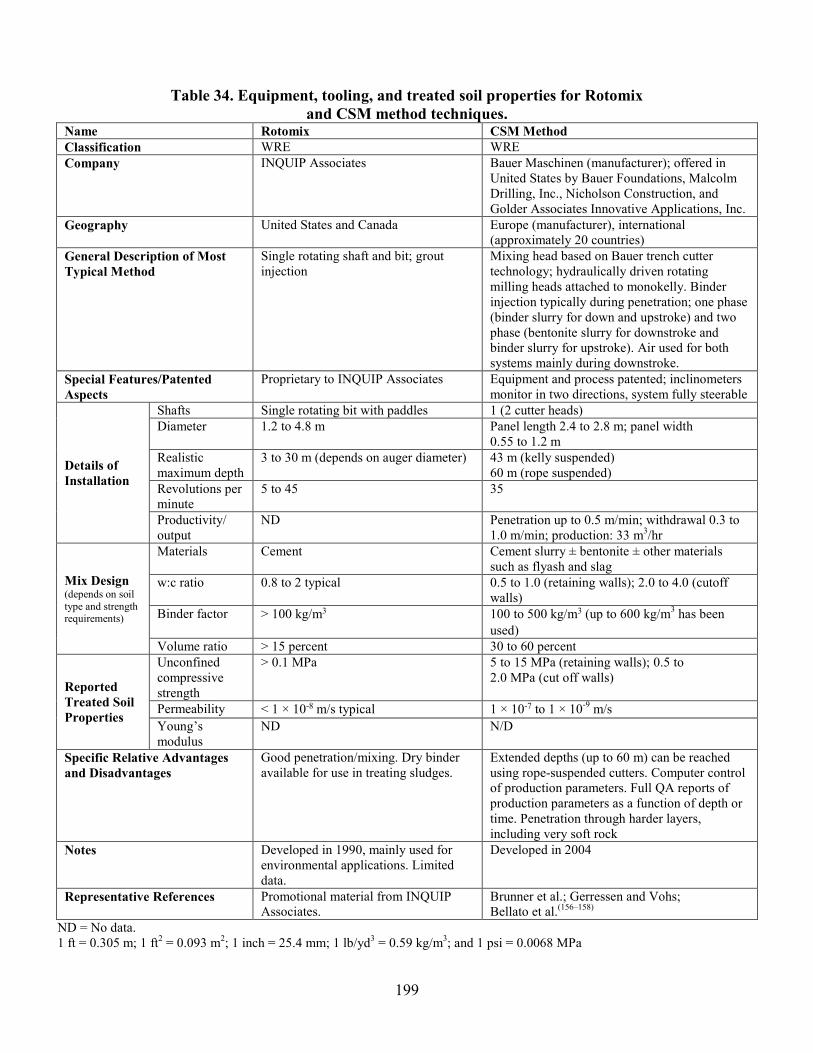
199
Table 34. Equipment, tooling, and treated soil properties for Rotomix and CSM method techniques.
Name Rotomix CSM Method Classification WRE WRE Company INQUIP Associates Bauer Maschinen (manufacturer); offered in
United States by Bauer Foundations, Malcolm Drilling, Inc., Nicholson Construction, and Golder Associates Innovative Applications, Inc.
Geography United States and Canada Europe (manufacturer), international (approximately 20 countries)
General Description of Most Typical Method
Single rotating shaft and bit; grout injection
Mixing head based on Bauer trench cutter technology; hydraulically driven rotating milling heads attached to monokelly. Binder injection typically during penetration; one phase (binder slurry for down and upstroke) and two phase (bentonite slurry for downstroke and binder slurry for upstroke). Air used for both systems mainly during downstroke.
Special Features/Patented Aspects
Proprietary to INQUIP Associates Equipment and process patented; inclinometers monitor in two directions, system fully steerable
Details of Installation
Shafts Single rotating bit with paddles 1 (2 cutter heads) Diameter 1.2 to 4.8 m Panel length 2.4 to 2.8 m; panel width
0.55 to 1.2 m Realistic maximum depth
3 to 30 m (depends on auger diameter) 43 m (kelly suspended) 60 m (rope suspended)
Revolutions per minute
5 to 45 35
Productivity/ output
ND Penetration up to 0.5 m/min; withdrawal 0.3 to 1.0 m/min; production: 33 m3/hr
Mix Design (depends on soil type and strength requirements)
Materials Cement Cement slurry ± bentonite ± other materials such as flyash and slag
w:c ratio 0.8 to 2 typical 0.5 to 1.0 (retaining walls); 2.0 to 4.0 (cutoff walls)
Binder factor > 100 kg/m3 100 to 500 kg/m3 (up to 600 kg/m3 has been used)
Volume ratio > 15 percent 30 to 60 percent
Reported Treated Soil Properties
Unconfined compressive strength
> 0.1 MPa 5 to 15 MPa (retaining walls); 0.5 to 2.0 MPa (cut off walls)
Permeability < 1 × 10⁻⁸ m/s typical 1 × 10⁻⁷ to 1 × 10⁻⁹ m/s Young’s modulus
ND N/D
Specific Relative Advantages and Disadvantages
Good penetration/mixing. Dry binder available for use in treating sludges.
Extended depths (up to 60 m) can be reached using rope-suspended cutters. Computer control of production parameters. Full QA reports of production parameters as a function of depth or time. Penetration through harder layers, including very soft rock
Notes Developed in 1990, mainly used for environmental applications. Limited data.
Developed in 2004
Representative References Promotional material from INQUIP Associates.
Brunner et al.; Gerressen and Vohs; Bellato et al.(156–158)
ND = No data. 1 ft = 0.305 m; 1 ft2 = 0.093 m2; 1 inch = 25.4 mm; 1 lb/yd3 = 0.59 kg/m3; and 1 psi = 0.0068 MPa

200
Table 35. Equipment, tooling, and treated soil properties for spread wing (SWING) technique.
Name Spread Wing (SWING) 17 Classification WJE Company Taisei Corporation, etc. Geography Japan and United States General Description of Most Typical Method
With blade retracted, 0.6-m-diameter pilot hole is rotary drilled to bottom of zone to be treated. Blade expanded and zone is treated with rotary mixing to 2-m diameter and air jetting to 3.6-m diameter.
Special Features/Patented Aspects
Retractable mixing blade allows treatment of specific depths to large diameter. Concentric mechanically mixed and jet mixed zones are produced. Patented trade association.
Details of Installation
Shafts 1 Diameter 0.6-m pilot hole, 2.0- (mechanical) to
3.6-m (jetted) column Realistic maximum depth
40 m
Revolutions per minute
ND
Productivity/ output
0.03 to 0.1 m/min penetration
Mix Design (depends on soil type and strength requirements)
Materials Cement grout w:c ratio ND Binder factor 450 kg/m3 Volume ratio ND
Reported Treated Soil Properties
Unconfined compressive strength
0.4 to 4.4 MPa (mechanically mixed zone); 1.5 MPa (sandy), 1.2 MPa (cohesive) (jet-mixed zone)
Permeability 1 × 10⁻⁸ m/s Youngs modulus
150 × unconfined compressive strength (mechanically mixed zone); 100 × unconfined compressive strength (jet-mixed zone)
Specific Relative Advantages and Disadvantages
Variable column size generated by varying pressures; retractable/expandable blade; jet mixing allows good contact with adjacent underground structures in difficult access areas.
Notes SWING Association with 17 members established in late 1980s in Japan.
Representative References Kawasaki; Yang et al.(159,160) ND = No data; NA = Not applicable. 1 ft = 0.305 m; 1 ft2 = 0.093 m2; 1 inch = 25.4 mm; 1 lb/yd3 = 0.59 kg/m3; and 1 psi = 0.0068 MPa

201
Table 36. Equipment, tooling, and treated soil properties for JACSMAN and LDis techniques.
Name JACSMAN LDis Classification WJE WJE Company Chemical Grout Co., Fudo Co., and others Onoda Chemical Co., Ltd. Geography Japan Japan General Description of Most Typical Method
Twin counter-rotating shafts, grout injected at low pressure from cutting blades during penetration. During withdrawal, inclined crossed jets on upper two pairs of blades are used at high velocities to increase diameter and enhance mixing efficiency.
The mixing tool is rotated to full depth. Tool is withdrawn (rotating) to break up and remove the soil followed by repenetration to full depth. Grout is injected during second withdrawal via jets at high pressure.
Special Features / Patented Aspects
The combination of DMM and jet grouting promotes good joints between adjacent columns and columns of controlled diameter and quality. Column formed is nominally 1.9 by 2.7 m in plan. Patented process. Trade association.
Conventional jet grout equipment with addition of single-blade auger to reduce volume of material displaced by jet and, therefore, limit ground movement (i.e., make volume injected equal to volume removed).
Details of Installation
Shafts 2 shafts at 0.8-m spacing each with 3 blades.
1
Diameter 1 m (blades at 0.8-m spacing along shaft) About 1.0 m (jetted) Realistic maximum depth
20 m 20 m
Revolutions per minute
20 3 to 40
Productivity/ output
1 m/min penetration; 0.5 to 1 m/min withdrawal
0.33 m/min penetration. Overall, about 65 percent of jet grouting.
Mix Design (depends on soil type and strength requirements)
Materials Cement grout Cement grout w:c ratio 1.0 ND Binder factor 200 kg/m3 (jetted); 320 kg/m3 (DMM).
Air also used to enhance jetting ND
Volume ratio 200 L/min per shaft during DM penetration; 300 L/min per shaft during withdrawal (jetting) (i.e., 20 to 30 percent)
About 40 percent
Reported Treated Soil Properties
Unconfined compressive strength
2 to 5.8 MPa (silty sand and clay); 1.2 to 3 MPa (silty sand)
2 MPa
Permeability ND ND Young’s modulus
ND ND
Specific Relative Advantages and Disadvantages
New system combining DMM and jet-grouting principles to enhance volume and quality of treatment; jetting provides good overlap between columns.
Repenetration causes production to be low. Spoil volume approximately equal to injected volume. Minimal ground heave.
Notes Name is an acronym for jet and churning system management.
Operational prototype stage. Assumed similar to conventional jet grouting.
Representative References Miyoshi and Hirayama(161) Ueki et al.(162) ND = No data. 1 ft = 0.305 m; 1 ft2 = 0.093 m2; 1 inch = 25.4 mm; 1 lb/yd3 = 0.59 kg/m3; and 1 psi = 0.0068 MPa

202
Table 37. Equipment, tooling, and treated soil properties for GeoJetTM and Hydramech techniques.
Name GeoJetTM Hydramech Classification WJE WJE Company Condon Johnson and Associates (CJA) Geo-Con, Inc. Geography Western United States United States General Description of Most Typical Method
Grout is jetted via ports on a “processor” during rapid penetration. The wings cut the soil and the jetted grout blends it.
Drill with water/bentonite or other drill fluid to bottom of hole. No compressed air used. At bottom, start low-pressure mechanical mixing through shaft. Cycle three times through bottom zone. Multiple high-pressure jets started at same time (350 to 450 MPa).
Special Features/Patented Aspects
Combination of mechanical and hydraulic cutting/mixing gives high-quality mixing and fast penetration. Licensed by CJA for five western States. TREVIICOS for the remainder. Very low environmental impact.
2-mm-diameter “hydra” nozzles on outer edges of mixing tool. Mechanical mixing occurs in center of columns, chunks of soil forced to perimeter where disaggregation occurs by jets.
Details of Installation
Shafts 1 shaft with pair of wings or similar “processor”
1
Diameter 0.6 to 1.2 m 1.2-m paddles on 0.9-m auger; column up to 2-m diameter depending on jet effectiveness.
Realistic maximum depth
45 m maximum (25 m typical) 20+ m
Revolutions per minute
150 to 200 (recent developments focusing on 80 to 90 rpm)
10 to 20
Productivity/ output
2 to 12 m/min (penetration) (6 m/min typical) 15 m/min (withdrawal); 150 m of piles/h possible
Up to 500 m3/shift
Mix Design (depends on soil type and strength requirements)
Materials Cement grout; additives if necessary Cement w/c ratio 0.5 to 1.5 (typically 0.8 to 1.0) 1.0 to 1.5 Binder factor 150 to 300 kg/m3 100 to 250 kg/m3 Volume ratio 20 to 40 percent 10 to 15 percent by weight of soil
Reported Treated Soil Properties
Unconfined compressive strength
0.7 to 5.5 MPa (Bay mud); 4.8 to 10.3 MPa (Beaumont clay)
Up to 10 MPa
Permeability ND Up to 1 × 10⁻⁹ m/s Young’s modulus
ND 100 to 300 × unconfined compressive strength
Specific Relative Advantages and Disadvantages
Computer control of penetration parameters excellent; high strength; low spoil volumes; high repeatability; excellent mixing; high productivity.
No air used. Very uniform mixing. Control over diameters provided at any depth. Several times cheaper than jet grouting. Mixing can be performed within specific horizons (i.e., plugs can be formed instead of full columns).
Notes Developed since early 1990s. Fully operational in Bay Area. Five patents on processor system and computer control; three patents pending.
Field-tested at Texas A&M. Fully operational from 1998.
Representative References Reavis and Freyaldenhoven(163) Geo-Con, Inc.; Nicholson and Jasperse(164,165)
ND = No data. 1 ft = 0.305 m; 1 ft2 = 0.093 m2; 1 inch = 25.4 mm; 1 lb/yd3 = 0.59 kg/m3; and 1 psi = 0.0068 MPa
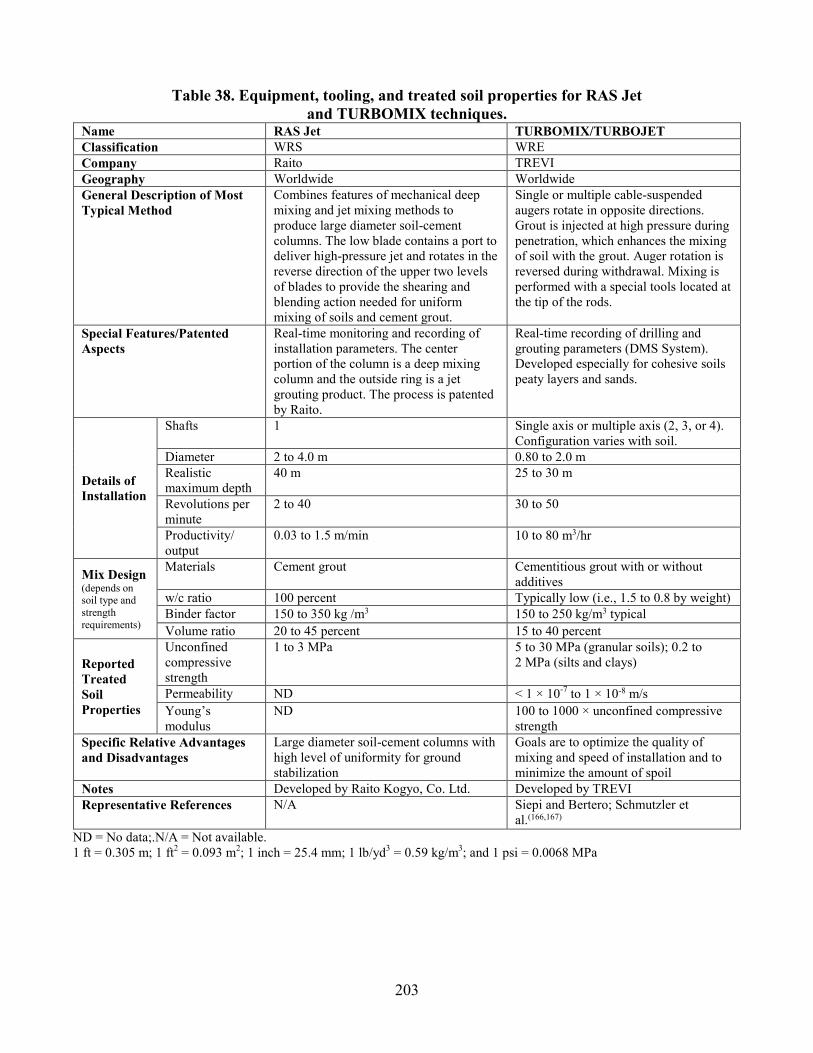
203
Table 38. Equipment, tooling, and treated soil properties for RAS Jet and TURBOMIX techniques.
Name RAS Jet TURBOMIX/TURBOJET Classification WRS WRE Company Raito TREVI Geography Worldwide Worldwide General Description of Most Typical Method
Combines features of mechanical deep mixing and jet mixing methods to produce large diameter soil-cement columns. The low blade contains a port to deliver high-pressure jet and rotates in the reverse direction of the upper two levels of blades to provide the shearing and blending action needed for uniform mixing of soils and cement grout.
Single or multiple cable-suspended augers rotate in opposite directions. Grout is injected at high pressure during penetration, which enhances the mixing of soil with the grout. Auger rotation is reversed during withdrawal. Mixing is performed with a special tools located at the tip of the rods.
Special Features/Patented Aspects
Real-time monitoring and recording of installation parameters. The center portion of the column is a deep mixing column and the outside ring is a jet grouting product. The process is patented by Raito.
Real-time recording of drilling and grouting parameters (DMS System). Developed especially for cohesive soils peaty layers and sands.
Details of Installation
Shafts 1 Single axis or multiple axis (2, 3, or 4). Configuration varies with soil.
Diameter 2 to 4.0 m 0.80 to 2.0 m Realistic maximum depth
40 m 25 to 30 m
Revolutions per minute
2 to 40 30 to 50
Productivity/ output
0.03 to 1.5 m/min 10 to 80 m3/hr
Mix Design (depends on soil type and strength requirements)
Materials Cement grout Cementitious grout with or without additives
w/c ratio 100 percent Typically low (i.e., 1.5 to 0.8 by weight) Binder factor 150 to 350 kg /m3 150 to 250 kg/m3 typical Volume ratio 20 to 45 percent 15 to 40 percent
Reported Treated Soil Properties
Unconfined compressive strength
1 to 3 MPa 5 to 30 MPa (granular soils); 0.2 to 2 MPa (silts and clays)
Permeability ND < 1 × 10⁻⁷ to 1 × 10⁻⁸ m/s Young’s modulus
ND 100 to 1000 × unconfined compressive strength
Specific Relative Advantages and Disadvantages
Large diameter soil-cement columns with high level of uniformity for ground stabilization
Goals are to optimize the quality of mixing and speed of installation and to minimize the amount of spoil
Notes Developed by Raito Kogyo, Co. Ltd. Developed by TREVI Representative References N/A Siepi and Bertero; Schmutzler et
al.(166,167) ND = No data;.N/A = Not available. 1 ft = 0.305 m; 1 ft2 = 0.093 m2; 1 inch = 25.4 mm; 1 lb/yd3 = 0.59 kg/m3; and 1 psi = 0.0068 MPa
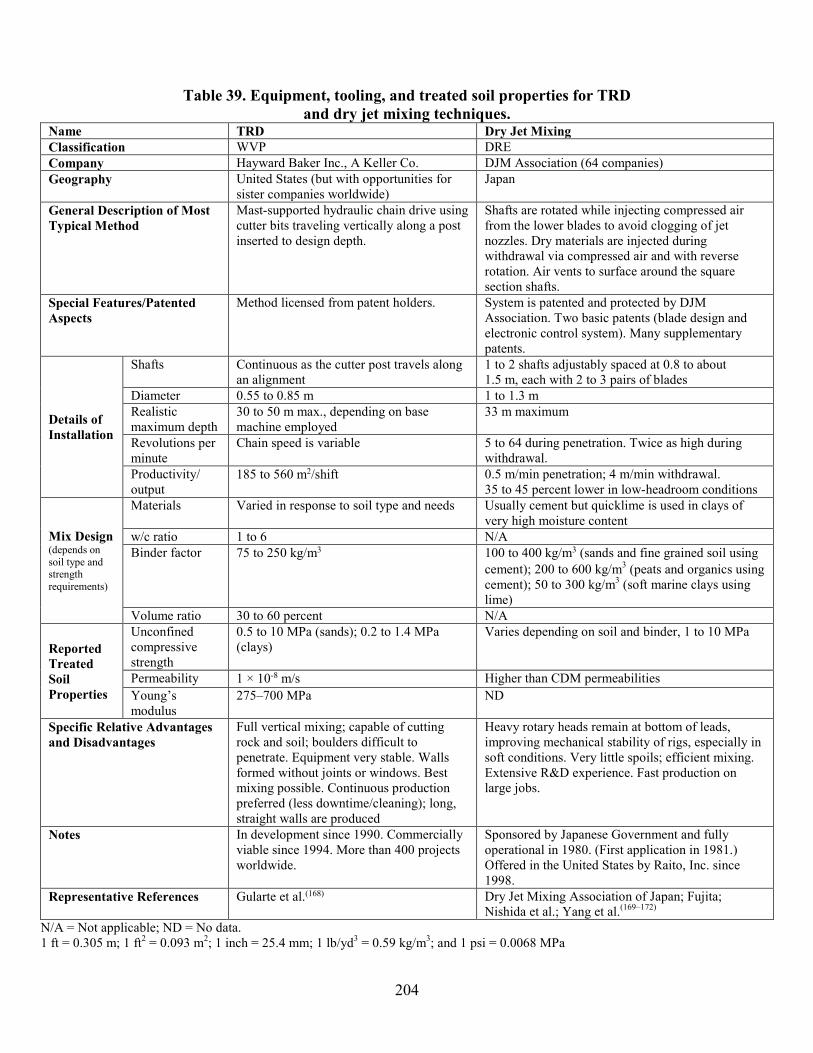
204
Table 39. Equipment, tooling, and treated soil properties for TRD and dry jet mixing techniques.
Name TRD Dry Jet Mixing Classification WVP DRE Company Hayward Baker Inc., A Keller Co. DJM Association (64 companies) Geography United States (but with opportunities for
sister companies worldwide) Japan
General Description of Most Typical Method
Mast-supported hydraulic chain drive using cutter bits traveling vertically along a post inserted to design depth.
Shafts are rotated while injecting compressed air from the lower blades to avoid clogging of jet nozzles. Dry materials are injected during withdrawal via compressed air and with reverse rotation. Air vents to surface around the square section shafts.
Special Features/Patented Aspects
Method licensed from patent holders. System is patented and protected by DJM Association. Two basic patents (blade design and electronic control system). Many supplementary patents.
Details of Installation
Shafts Continuous as the cutter post travels along an alignment
1 to 2 shafts adjustably spaced at 0.8 to about 1.5 m, each with 2 to 3 pairs of blades
Diameter 0.55 to 0.85 m 1 to 1.3 m Realistic maximum depth
30 to 50 m max., depending on base machine employed
33 m maximum
Revolutions per minute
Chain speed is variable 5 to 64 during penetration. Twice as high during withdrawal.
Productivity/ output
185 to 560 m2/shift 0.5 m/min penetration; 4 m/min withdrawal. 35 to 45 percent lower in low-headroom conditions
Mix Design (depends on soil type and strength requirements)
Materials Varied in response to soil type and needs Usually cement but quicklime is used in clays of very high moisture content
w/c ratio 1 to 6 N/A Binder factor 75 to 250 kg/m3 100 to 400 kg/m3 (sands and fine grained soil using
cement); 200 to 600 kg/m3 (peats and organics using cement); 50 to 300 kg/m3 (soft marine clays using lime)
Volume ratio 30 to 60 percent N/A
Reported Treated Soil Properties
Unconfined compressive strength
0.5 to 10 MPa (sands); 0.2 to 1.4 MPa (clays)
Varies depending on soil and binder, 1 to 10 MPa
Permeability 1 × 10⁻⁸ m/s Higher than CDM permeabilities Young’s modulus
275–700 MPa ND
Specific Relative Advantages and Disadvantages
Full vertical mixing; capable of cutting rock and soil; boulders difficult to penetrate. Equipment very stable. Walls formed without joints or windows. Best mixing possible. Continuous production preferred (less downtime/cleaning); long, straight walls are produced
Heavy rotary heads remain at bottom of leads, improving mechanical stability of rigs, especially in soft conditions. Very little spoils; efficient mixing. Extensive R&D experience. Fast production on large jobs.
Notes In development since 1990. Commercially viable since 1994. More than 400 projects worldwide.
Sponsored by Japanese Government and fully operational in 1980. (First application in 1981.) Offered in the United States by Raito, Inc. since 1998.
Representative References Gularte et al.(168) Dry Jet Mixing Association of Japan; Fujita; Nishida et al.; Yang et al.(169–172)
N/A = Not applicable; ND = No data. 1 ft = 0.305 m; 1 ft2 = 0.093 m2; 1 inch = 25.4 mm; 1 lb/yd3 = 0.59 kg/m3; and 1 psi = 0.0068 MPa

205
Table 40. Equipment, tooling, and treated soil properties for Nordic Method and TREVIMIX DRY techniques.
Name Nordic Method TREVIMIX DRY Classification DRE DRE Company Various (in Scandinavia/Far East). Offered in the
United States by Hayward Baker, Inc. TREVI
Geography Scandinavia, Far East, United States Worldwide General Description of Most Typical Method
Shaft is rotated while injecting compressed air below mixing tool to keep injection ports clear. Dry materials are injected during withdrawal via compressed air, and reverse rotation. Requires sufficient free water to hydrate binder (e.g., sand > 15 percent; silt > 20 percent; and clay > 35 percent).
Dry materials are injected via compressed air through nozzles on shaft below mixing paddles. Binder can be added during penetration and/or withdrawal of the mixing paddles.
Special Features/Patented Aspects
Very low spoil; high productivity; efficient mixing. No patents believed current. Strong reliance on computer control. Close involvement by Swedish Geotechnical Institute
Real-time recording of drilling and grouting parameters. Use of protection bells at surface to minimize loss of vented dry binder. Needs soil with moisture content of 50 to 145+ percent to allow hydration of binder.
Details of Installation
Shafts 1 to 2 (more common). Separated by fixed (but variable) distance of 0.8 to 3.0 m.
1 to 2 (more common). Separated by fixed (but variable) distance of 0.8 to 3.0 m.
Diameter 0.5 to 1.2 m, typically 0.6 or 0.8 m 0.8 to 1.0 m (most common) Realistic maximum depth
30 m maximum (20 m typical) 25 to 30 m
Revolutions per minute
100 to 200, usually 130 to 170 20 to 150
Productivity/ output
2 to 3 m/min (penetration); 0.6 to 0.9 m/min (withdrawal); 400 to1,000 m/shift (0.6-m diameter)
8 to 30 m3/hr
Mix Design (depends on soil type and strength requirements)
Materials Cement and lime in various percentages (typically 50:50 or 75:25)
Dry cement (most common), lime, other cementitious materials
w/c ratio N/A N/A Binder factor 23 to 28 kg/m (0.6 m diameter), typically
40 kg/m (0.8 m diameter); overall 20 to 60 kg/m (i.e., 80 to 150 kg/m3)
150 to 300 kg/m3
Volume ratio N/A N/A
Reported Treated Soil Properties
Unconfined compressive strength
Varies, but typically 0.2 to 0.5 MPa (0.2 to 2 MPa possible). Shear strength 0.1 to 0.30 MPa (up to 1 MPa in field)
2 to 6 MPa (sandy soil) 0.2 to 2 MPa (silts and clays)
Permeability For lime columns, 1,000 times higher than that of the clay; for lime-cement columns, the factor is 400 to 500
ND
Young’s modulus
50 to 200 × unconfined compressive strength 100 to 1000 × unconfined compressive strength
Specific Relative Advantages and Disadvantages
Same as for DJM; Swedish/Finnish research continues.
No spoil, uniform mixing, automatic control of binder quantity. System allows for possibility of injecting water during penetration.
Notes Developed by Swedish industry and government, with first commercial applications in mid 1970s, and first U.S. application in 1996.
Developed by TREVI in Italy in late 1980s.
Representative References Holm et al.; Rathmeyer(173,174) Restelli et al.; Calabresi et al.(175,176) ND = No data; N/A = Not applicable. 1 ft = 0.305 m; 1 ft2 = 0.093 m2; 1 inch = 25.4 mm; 1 lb/yd3 = 0.59 kg/m3; and 1 psi = 0.0068 MPa

206
Table 41. Equipment, tooling, and treated soil properties for MDM and dry soil mixing mass techniques.
Name MDM (Modified Deep Mixing) Dry Soil Mixing Mass Classification DRE DRE Company Various (in Scandinavia/Far East) Hayward Baker, Inc., a Keller Co. Geography Scandinavia, Europe, Far East, United States United States (but with opportunities for
sister companies worldwide) General Description of Most Typical Method
Shaft is rotated while injecting during penetration and withdrawal. Water in correct amounts is injected (low pressure) during penetration (typically) through jets in the tool head. Can be used in sand, silt or clay, hard to soft conditions.
Horizontal axis rotary drive at the end of an excavator mounted arm. Binder injected pneumatically during rotary mixing and arm movement throughout the cell.
Special Features / Patented Aspects
Very low spoil; high productivity; efficient mixing; strong reliance on computer control. Can be used either as a soil improvement technique or direct foundation system. Current patents in United States and Mexico; Europe and other countries pending.
No special features.
Details of Installation
Shafts Single shaft, various types of cutting/mixing blades.
Single horizontal with spiral mixing paddles around the rotating barrel.
Diameter 0.5 to 1.2 m, typically 0.6 or 0.8 m N/A Realistic maximum depth
30 m maximum (20 m typical) 5 m maximum
Revolutions per minute
200 to 220; 100 on down stroke if very hard soil
50 to 100
Productivity/ output
1.0 m/min finished column; 6,400 to 1,000 m/10-h shift (0.6-m diameter)
Work completed in defined cells. In excess of 700 m3/shift
Mix Design (depends on soil type and strength requirements)
Materials Cement only Varied in response to soil type and needs w:c ratio 0 to 3+ NA Binder factor 200 to 400 kg/m3. These amounts are final in
situ. A correction factor is programmed into the computer to reflect waste amounts.
75 to 250 kg/m3
Volume ratio N/A 0 to 5 percent
Reported Treated Soil Properties
Unconfined compressive strength
Depending on binder amount and soil type, range is 0.6 to 6.0 MPa. Generally, in clay with 400 kg/m3 yields 3.0 MPa design strength.
1.0 to 3.0 MPa (sands); 0.1 to 1.0 MPa (clays)
Permeability 400 to 500 times the k of the clay 1 × 10⁻⁷ m/s Young’s modulus
50 to 200 × unconfined compressive strength 50 to 150 ksi
Specific Relative Advantages and Disadvantages
Can be used in wide range of soils, hard, soft, dry, or wet. Binder and water amounts can be continuously changed during installation of column. Additives (e.g., accelerators or retarders) can be introduced through the water at specific depths.
Low quality mixing usually done at high treatment ratios to support uniform loads over soft or organic soil.
Notes Patented by LC Technology, Inc. and jointly developed by Swedish foundation contractor Hercules Gundeläggning AB. First commercial applications in Sweden in 2003
In development since 2003. Commercially viable since 2005.
Representative References Gunther et al.; Eriksson et al.(177,178) Burke et al.(30) N/A = Not applicable. 1 ft = 0.305 m; 1 ft2 = 0.093 m2; 1 inch = 25.4 mm; 1 lb/yd3 = 0.59 kg/m3; and 1 psi = 0.0068 MPa

207
Table 42. Equipment, tooling, and treated soil properties for Schnabel DMW technique. Name Schnabel DMW (Deep Mix Wall) Classification WRS Company Schnabel Foundation Company Geography North America General Description of Most Typical Method
Multiple discontinuous augers on a semi-fixed, crane supported lead. Augers rotate in opposite directions. Most of the binder slurry injected on the down stroke to create panels. Air injected during mixing in clays.
Special Features/Patented Aspects
Used primarily for structural cutoff walls as part of an earth retention system. Double stroking frequently done; 75 to 80 percent of the wall is exposed during excavation.
Details of Installation
Shafts Single shaft; various types of cutting/mixing blades. Diameter 0.5 to 1.2 m, typically 0.6 or 0.8 m Realistic maximum depth
30 m maximum (20 m typical)
Revolutions per minute
200 to 220; 100 on down stroke if very hard soil
Productivity/ output
1.0 m/min finished column; 64,00-1,000 m/10-h shift (0.6-m diameter)
Mix Design (depends on soil type and strength requirements)
Materials Cement only w/c ratio 0 to 3+ Binder factor 200 to 400 kg/m3. These amounts are final in situ. A
correction factor is programmed into the computer to reflect waste amounts.
Volume ratio N/A
Reported Treated Soil Properties
Unconfined compressive strength
Depending on binder amount and soil type, range is 0.6 to 6.0 MPa. Generally, in clay with 400 kg/m3 yields 3.0 MPa design strength.
Permeability 400 to 500 times the k of the clay Young’s modulus
50 to 200 × unconfined compressive strength
Specific Relative Advantages and Disadvantages
Economical proven system for structural cutoff walls. Special mixing tools designed for penetrating very dense, coarse-grained soils. Crane attachment allows flexibility in positioning mixing tools. High mobilization costs.
Notes Used for excavation retention system since 2000 Representative References Anderson; Porbaha et al.(15,10)
N/A = Not applicable. 1 ft = 0.305 m; 1 ft2 = 0.093 m2; 1 inch = 25.4 mm; 1 lb/yd3 = 0.59 kg/m3; and 1 psi = 0.0068 MPa


209
ACKNOWLEDGMENTS
Specialists nationally and internationally have contributed to the design and construction guidance outlined in this manual over the past 6 years. Engineers and construction representatives have reviewed case history descriptions and construction data and provided practical guidance on specifications and QC/QA recommendations. The authors acknowledge the cooperation and input from USACE, whose collaboration has allowed the standardization of design procedures to promote consistency between levee and embankment designs for Federal projects. The authors recognize the time and effort contributed by members of the Deep Foundations Institute’s soil mixing committee (2007–2012) in reviewing the draft manual. The authors appreciate the input received from the following individuals:
• Ken Andromolos.
• Dennis Boehm.
• Håkan Bredenberg.
• Donald Bruce.
• George Burke.
• Peter Cali.
• Richard Crockford.
• David Druss.
• Melvin Esrig.
• Franz-Werner Gerressen.
• Johan Gunther.
• Brian Jasperse.
• Deh-Jen Jang (Caltrans).
• Masaki Kitazume.
• Alan Macnab.
• Heinrich Majewski.
• Mario Mauro.
• Daniel Meyersohn (Caltrans).

210
• David Miller.
• Al Neumann.
• Peter Nicholson.
• Dominic Parmantier.
• Alex Reeb.
• Al Sehn.
• David Shiells (VDOT).
• Mikael Topolnicki.
• Loren Turner (Caltrans).
• Lee Vanzler.
• Andrew Walker.
• David Weatherby.
The authors gratefully acknowledge the guidance and technical direction received from the following FHWA and pooled fund representatives:
• Michael Adams (FHWA).
• Silas Nichols (FHWA).
• Dr. Jennifer Nicks (FHWA).
• Justice Maswoswe (FHWA).
• Bhaskar Joshi (Caltrans)
• Robert Arndorfer (WisDOT)
• Matt Barendse (New York Department of Transportation).
• Jim Brennan (Kansas Department of Transportation).
• Derrick Dasenbrock (MnDOT).
• David Horhota (FDOT).
• Terry McCleary (Illinois Department of Transportation).

211
• Parviz Noori (Nevada Department of Transportation).
• Mike Schulte (Wyoming Department of Transportation).


213
REFERENCES
1. Bruce, D.A. (2000). An Introduction to the Deep Mixing Method as Used in Geotechnical Applications, Report No. FHWA-RD-99-138, Federal Highway Administration, Washington, DC.
2. Bruce, D.A. (2000). Supplemental Reference Appendices for an Introduction to the Deep Mixing Method as Used in Geotechnical Applications, Volume II: Appendices, Report No. FHWA-RD-99-144, Federal Highway Administration, Washington, DC.
3. Bruce, D.A. (2001). An Introduction to the Deep Mixing Method as Used in Geotechnical Applications, Volume III: Verification and Properties of Treated Soil, Report No. FHWA-RD-99-167, Federal Highway Administration, Washington, DC.
4. Siddharthan, R.V. and Suthahar, N. (2005). Simplified Seismic Response Evaluation of Sites Improved by Deep Mixing, Version 1.3, University of Reno, Reno, NV.
5. Rutherford, C., Biscontin, G., and Briaud, J-L. (2004). Design Manual for Excavation Support Using Deep Mixing Technology, Texas A&M University, College Station, TX.
6. Bruce, D.A. (1996). “The Return of Deep Soil Mixing,” Civil Engineering, 66(2), 44–46.
7. Elias, V., Welsh, J., Warren, J., and Lukas, R. (2001). Demonstration Project 116: Ground Improvement Technical Summaries Volume II, Report No. FHWA-SA-98-086, Federal Highway Administration, Washington, DC.
8. Elias, V., Welsh, J., Warren, J., Lukas, R., Collin, J.G., and Berg, R.B. (2006). Ground Improvement Methods Volume I, Report No. FHWA-NHI-06-019, Federal Highway Administration, Washington, DC.
9. Elias, V., Welsh, J., Warren, J., Lukas, R., Collin, J.G., and Berg, R.B. (2006). Ground Improvement Methods Volume II, Report No. FHWA-NHI-06-020, Federal Highway Administration, Washington, DC.
10. Porbaha, A., Weatherby, D., Macnab, A., Lambrechts, J., Burke, G., Yang, D., and Puppala, A.J. (2005). “Regional Report: North American Practice of Deep Mixing Technology,” International Conference on Deep Mixing Best Practice and Recent Advances, R47–R73, Swedish Deep Stabilization Research Centre, Stockholm, Sweden.
11. Walker, A.D. (1992). “Soil Mixing and Jet Grouting on a Hazardous Waste Site, Pittsburgh, PA, USA,” Grouting in the Ground, 473–486, Institution of Civil Engineers, London, UK.
12. Nicholson, P.J. and Chu, E.K. (1994). “Boston Central Artery Tunnel Excavation Support Remediation by Ground Treatment,” Presented at the American Society of Civil Engineers Conference on Soil Structure Interaction and Environmental Issues, Hershey, PA.
214
13. Pearlman, S.L. and Himick, D.E. (1993). Anchored Excavation Support Using SMW (Soil Mixed Wall), Presented at the Deep Foundations Institute 18th Annual Member’s Conference and Meeting, Pittsburgh, PA.
14. O’Rourke, T.D. and McGinn, A.J. (2006). “Lessons Learned for Ground Movements and Soil Stabilization from the Boston Central Artery,” Journal of Geotechnical and Geoenvironmental Engineering, 132(8), 966–989.
15. Anderson, T.C. (1998). “Anchored Deep Soil Mixed Cut-Off/Retaining Walls for Lake Parkway Project in Milwaukee, WI,” Design and Construction of Earth Retaining Systems, 1–13, American Society of Civil Engineers, Reston, VA.
16. Bahner, E.W. and Naguib, A.M. (1998). “Design and Construction of a Deep Soil Mix Retaining Wall for the Lake Parkway Freeway Extension,” Soil Improvement for Big Digs, Geotechnical Special Publication 81, 41–58, Geo-Institute of the American Society of Civil Engineers, Reston, VA.
17. Saye, S.R., Esrig, M.I., Williams, J.L., Pilz, J., and Bartlett, S.F. (2001). “Lime Cement Columns for the Reconstruction of Interstate 15 in Salt Lake City, UT,” Foundations and Ground Improvement, Geotechnical Special Publication 113, 827–841, American Society of Civil Engineers, Reston, VA.
18. Lambrechts, J.R., Ganse, M.A., and Layhee, C.A. (2003). “Soil Mixing to Stabilize Organic Clay for I-95 Widening, Alexandria, VA.” Grouting and Ground Treatment: Proceedings of the Third International Conference, Geotechnical Special Publication 120, 575–585, American Society of Civil Engineers, Reston, VA.
19. Martin, G.R., Arulmoli, K., Yang, L., Esrig, M.I., and Capelli, R.P. (1999). “Dry Mix Soil-Cement Walls: An Application for Mitigation of Earthquake Ground Deformations in Soft or Liquefiable Soils,” Dry Deep Mix Methods for Deep Soil Stabilization, 27–44, Proceedings of the International Conference on Dry Deep Mix Methods for Deep Soil Stabilization, Stockholm, Sweden.
20. McMahon, D.R., Fishman, K.L., Maltese, P., and Andromalos, K.B. (2001). “A DSM Wall for Excavation Support,” Foundations and Ground Improvement, Geotechnical Special Publication 113, 670–684, American Society of Civil Engineers, Reston, VA.
21. Stewart, M.E., Navin, M.P., and Filz, G.M. (2004). “Analysis of a Column-Supported Test Embankment at the I-95/Route 1 Interchange,” Geotechnical Engineering for Transportation Projects, Geotechnical Special Publication 126, 1337–1346, American Society for Civil Engineers, Reston, VA.
22. Shiells, D.P., Pelnik III, T.W., and Filz, G.M. (2003). “Deep Mixing: An Owner’s Perspective,” Grouting and Ground Treatment: Proceedings of the Third International Conference, Geotechnical Special Publication 120, 489–500, American Society of Civil Engineers, Reston, VA.
215
23. Yang, D.S. and Takeshima, S. (2005). Application of DMM for Grade Separation/Interchange Projects, Presented at the International Conference on Deep Mixing, Swedish Geotechnical Institute, Stockholm Sweden.
24. Esrig, M.I., MacKenna, P.E., and Forte, E.P. (2003). “Ground Stabilization in the United States by the Scandinavian Lime Cement Dry Mix Process.” Grouting and Ground Treatment: Proceedings of the Third International Conference, Geotechnical Special Publication 120, 501–514, American Society of Civil Engineers, Reston, VA.
25. Mitchell, C.L.B. and Wu, M-J. (2004). Underpass Support Using Secant Pile Walls and Cement Deep Soil Mix Bottom Seal, Presented at the 29th Annual Conference on Deep Foundations, Deep Foundations Institute, Vancouver, BC, Canada.
26. Dasenbrock, D. (2004). “DMM Implementation Challenges at the Glen Road Interchange: Lessons Learned,” Geotechnical Engineering for Transportation Projects, Geotechnical Special Publication 126, 1347–1355, American Society for Civil Engineers, Reston, VA.
27. Dasenbrock, D. (2005). “Application of Deep Mixing Method to a Challenging Bridge Construction Project: The Glen Road Interchange,” Innovations in Grouting and Soil Improvement, Geotechnical Special Publication 136, 1–10, American Society of Civil Engineers, Reston, VA.
28. Parmantier, D.M., Fassett, R.A., and Porbaha, A. (2005). Reinforced Deep Mixed Columns for a Bridge Ramp Foundation in the San Francisco Bay Area, Presented at the International Conference on Deep Mixing, Swedish Geotechnical Institute, Stockholm Sweden.
29. Meyersohn, D. (2007). Use of Soil-Cement Piles for Bridge Support, Presented at the GeoDenver Conference, American Society of Civil Engineers, Denver, CO.
30. Burke, G.K., Sehn, A.L., Hussin, J.D., Hull, V.E., and Mann, J.A. (2007). “Dry Soil Mixing at Jewfish Creek,” Soil Improvement, GeoDenver Conference, 1–11, American Society of Civil Engineers, Reston, VA.
31. Sen, K.K. and Evans, A. (2010). “Innovative Construction Techniques Used at North Shore Construction Project,” The Journal of the Deep Foundations Institute, 4(2), 20–30.
32. Lee, T., Jenevein, D., and Fong, M. (2012). “Unique Design and Quality Control of Cement Deep Soil Mixing for Water Cutoff: BART Warm Springs Extension (WSX) Project, Fremont, CA” GeoCongress 2012, 3583–3592.
33. Pooranampillai, S., Parmantier, D., Dawson, K., and Shin, S. (2012). A Case History on the Design, Construction, and Field Quality Control of Cement Deep Soil Mixing, Presented at the 37th Annual Conference on Deep Foundations, Houston, TX.
34. Filz, G., Adams, T., Navin, M., and Templeton, A.E. (2012). “Design of Deep Mixing for Support of Levees and Floodwalls,” Grouting and Deep Mixing: 4th International
216
Conference on Grouting and Deep Mixing, Geotechnical Special Publication 228, 89–133, American Society of Civil Engineers, Reston, VA.
35. Lambrechts, J.R. (2005). Design Guidelines Manual for Support of Embankments on Soft Soils by Deep Mixing, National Deep Mixing Program, Boston, MA.
36. Terashi, M. (1983). “Problems and Research Orientation of the Deep Mixing Method,” Proceedings of the Journal of Japanese Society of Soil Mechanics and Foundation Engineering, Tsuchi To Kiso, 31(8), 75–83 (in Japanese).
37. Sabatini, P.J., Bachus, R.C., Mayne, P.W., Schneider, J.A., and Zettler, T.E. (2002). Evaluation of Soil and Rock Properties, Geotechnical Engineering Circular No. 5, Report No. FHWA-IF-02-034, Federal Highway Administration, Washington, DC.
38. Mayne, P.W., Christopher, B.R., and DeJong, J. (2001). Subsurface Investigations, Report No. FHWA-NHI-01-031, Federal Highway Administration, Washington, DC.
39. Samtani, N.C. and Nowatzki, E.A. (2006). Soils and Foundations Reference Manual Volume 1, Report No. FHWA-NHI-06-088, Federal Highway Administration, Washington, DC.
40. Samtani, N.C. and Nowatzki, E.A. (2006). Soils and Foundations Reference Manual Volume 2, Report No. FHWA-NHI-06-089, Federal Highway Administration, Washington, DC.
41. Rafalko, S.D., Filz, G.M., Brandon, T.L., and Mitchell, J.K. (2008). “Rapid Chemical Stabilization of Soft Clay Soils,” Transportation Research Record 2026, 39–46, Transportation Research Board, Washington, DC.
42. Vanzler, L. and Filz, G.M. (2008). Craney Island Eastward Expansion, Preliminary Study of Borrow Material Stabilization, S&ME, Inc., Blacksburg, VA.
43. Terashi, M. (1997). Deep Mixing Method—Brief State of the Art, Presented at the 17th International Conference on Soil Mechanics and Foundation Engineering, Hamburg, Germany.
44. Takenaka Civil Engineering. (1995). Deep Chemical Mixing Method Using Cement as Hardening Agent, Takenaka Corporation, Tokyo, Japan.
45. Dong, J., Hiroi, K., and Nakamura, K. (1996). “Experimental Study on Behavior of Composite Ground Improved by Deep Mixing Method Under Lateral Load,” Grouting and Deep Mixing: Proceedings of IS-Tokyo 96, 2nd International Conference on Ground Improvement Geosystems, 585–590, Tokyo, Japan.
46. Coastal Development Institute of Technology. (2002). The Deep Mixing Method: Principle, Design, and Construction, Balkema, Lisse, Netherlands.

217
47. Matsuo, O. (2002). “Determination of Design Parameters for Deep Mixing,” Proceedings of Tokyo Workshop 2002 on Deep Mixing, 75–79, Coastal Development Institute of Technology, Tokyo, Japan.
48. Miura, N., Horpibulsuk, S., and Nagaraj, T.S. (2002). “Engineering Behavior of Cement Stabilized Clay at High Water Content,” Soils and Foundations, 41(5), 33–45.
49. EuroSoilStab. (2002). Development of Design and Construction Methods to Stabilise Soft Organic Soils—Design Guide: Soft Soil Stabilization, CT97-0351, Project No. BE 96-3177, IHS BRE Press, Watford, UK.
50. Hayashi, H., Nishikawa, J., Ohishi, K., and Terashi, M. (2003). “Field Observation of Long-Term Strength of Cement Treated Soil,” Grouting and Ground Treatment: Proceedings of the Third International Conference, Geotechnical Special Publication 120, 598–609, American Society of Civil Engineers, Reston, VA.
51. Filz, G.M., Hodges, D.E., Weatherby, D.E., and Marr, W.A. (2005). “Standardized Definitions and Laboratory Procedures for Soil-Cement Specimens Applicable to the Wet Method of Deep Mixing,” Innovations in Grouting and Soil Improvement, Geotechnical Special Publication 136, 1–13, American Society of Civil Engineers, Reston, VA.
52. Jacobson, J.R., Filz, G.M., and Mitchell, J.K. (2005). “Factors Affecting Strength of Lime-Cement Columns Based on a Laboratory Study of Three Organic Soils,” Proceedings of the International Conference on Deep Mixing—Best Practice and Recent Advances, Deep Mixing’05, 87–94, Swedish Geotechnical Institute, Linköping, Sweden.
53. McGinn, A.J. and O’Rourke, T.D. (2003). Performance of Deep Mixing Methods at Fort Point Channel, Federal Highway Administration, Washington, DC.
54. Jacobson, J.R., Filz, G.M., and Mitchell, J.K. (2003). Factors Affecting Strength Gain in Lime-Cement Columns and Development of a Laboratory Testing Procedure, Virginia Transportation Research Council, Charlottesville, VA.
55. Horpibulsuk, S., Miura, N. and Nagara, T.S. (2003). “Assessment of Strength Development in Cement-Admixed High Water Content Clays with Abrams’ Law as a Basis,” Geotechnique, 53(4), 439–444.
56. Lorenzo, G.A. and Bergado, D.T. (2003). “New Consolidation Equation for Soil-Cement Pile Improved Ground,” Canadian Geotechnical Journal, 40, 265–275.
57. Hodges, D.K., Filz, G.M., and Weatherby, D.E. (2008). Laboratory Mixing, Curing, and Strength Testing of Soil-Cement Specimens Applicable to the Wet Method of Deep Mixing, CGPR Report No. 48, Virginia Tech Center for Geotechnical Practice and Research, Blacksburg, VA.
58. Kitazume, M., Nakamura, T., Terashi, M., and Ohishi, K. (2003). “Laboratory Tests on Long-Term Strength of Cement Treated Soil,” Grouting and Ground Treatment:

218
Proceedings of the Third International Conference, Geotechnical Special Publication 120, 586–597, American Society of Civil Engineers, Reston, VA.
59. Cali, M., Woodward, M., Bruce, D.A., and Forte, E. (2005). “Levee Stability Application for Deep Mixing (1)—Design for Full Scale Test Section Using Dry Mixed Soil Cement Columns,” Proceedings of the International Conference on Deep Mixing—Best Practice and Recent Advances, Deep Mixing ’05, 405–413, Swedish Geotechnical Institute, Linköping, Sweden.
60. Terashi, M. (2005). “Keynote Lecture: Design of Deep Mixing in Infrastructure Applications,” Proceedings of the International Conference on Deep Mixing—Best Practices and Recent Advances, Deep Mixing ’05, K25–K45, Swedish Geotechnical Institute, Linköping, Sweden.
61. Kivelo, M. (1998). Stabilization of Embankments on Soft Soil with Lime/cement Columns, Doctoral Thesis, Royal Institute of Technology, Stockholm, Sweden.
62. Tatsuoka, F. and Kobayashi, A. (1983). “Triaxial Strength Characteristics of Cement-Treated Soft Clay,” Proceedings of the 8th European Conference of SMFE, 421–426, Helsinki, Finland.
63. Kitazume, M., Okano, K., and Miyajima, S. (2000). “Centrifuge Model Tests on Failure Envelope of Column-Type DMM-Improved Ground,” Soils and Foundations, 40(4), 43–55.
64. Japanese Geotechnical Society. (2000). Practice for Making and Curing Stabilized Soil Specimens Without Compaction, JGS T 0821-2000, Japanese Geotechnical Society, Tokyo, Japan.
65. Baker, S. (2000). Deformation Behaviour of Lime/Cement Column Stabilized Clay, Swedish Deep Stabilization Research Centre, Linköping, Sweden.
66. Carlsten, P. and Ekstrom, J. (1997). Lime and Lime Cement Columns: Guide for Project Planning, Construction and Inspection, SGF Report 4:95E, Swedish Geotechnical Society, Linköping, Sweden.
67. Yang, D.S., Scheibel, L.L., Lobedan, F., and Nagata, C. (2001). “Oakland Airport Roadway Project,” Soil Mixing Specialty Seminar, 26th DFI Annual Conference, 55–71, St. Louis, MO.
68. Lambrechts, J.R. and Layhee, C.A. (2003). “Stability Analyses of Deep Soil Mix Buttresses in Organic Clay for I-95 Widening, Alexandria, VA,” Proceedings of the 12th Pan-American Conference on Soil Mechanics and Geotechnical Engineering, 2097–2104, Cambridge, MA.
69. Lambrechts, J.R., Roy, P.A., and Wishart, E. (1998). “Design Conditions and Analysis Methods for Soil-Cement in Fort Point Channel,” Design and Construction of Earth Retaining Structures, Proceedings of Sessions of Geo-Congress '98, 153–174, Reston, VA.

219
70. Maswoswe, J.J.G. (2001). “QA/QC for CA/T Deep Soil-Cement,” Foundations and Ground Improvement, Geotechnical Special Publication 113, 640–654, American Society of Civil Engineers, Reston, VA.
71. Cooling, T., Boeckmann, A., Cali, P., Evans, J., Leoni, F., and Filz, G. (2012). “Deep Mixing Design for Raising Levee Section, LPV 111, New Orleans, Louisiana,” Grouting and Deep Mixing 2012, Proceedings of the 4th International Conference on Grouting and Deep Mixing, Geotechnical Special Publication 228, 672–681, American Society of Civil Engineers, Reston, VA..
72. Bertero, A., Leoni, F.M., Filz, G., Nozu, M., and Druss, D. (2012). “Bench-Scale Testing and Quality Control/Quality Assurance Testing for Deep Mixing at Levee LPV 111,” Grouting and Deep Mixing 2012, Proceedings of the 4th International Conference on Grouting and Deep Mixing, Geotechnical Special Publication 228, 694–705, Reston, VA.
73. Filz, G.M. and Navin, M.P. (2006). Stability of Column-Supported Embankments, Virginia Transportation Research Council, Charlottesville, VA.
74. Filz, G.M. and Navin, M.P. (2010). “A Practical Method to Account for Strength Variability of Deep-Mixed Ground,” GeoFlorida 2010: Advances in Analysis, Modeling & Design, Geotechnical Special Publication 199, 2426–2433, American Society of Civil Engineers, Reston, VA.
75. Larsson, S. (2005). “State of Practice Report—Execution, Monitoring and Quality Control,” Proceedings of the International Conference on Deep Mixing—Best Practices and Recent Advances (CD-ROM), Swedish Deep Stabilization Research Centre, Linköping, Sweden.
76. Duncan, J.M. (2000). “Factors of Safety and Reliability in Geotechnical Engineering,” Journal of Geotechnical and Geoenvironmental Engineering, 126(4), 307–316.
77. Navin, M.P. (2005). Stability of Embankments Founded on Soft Soil Improved with Deep-Mixing-Method Columns, Doctoral dissertation, Virginia Polytechnic Institute and State University, Blacksburg, VA.
78. Broms, B.B. (2003). Deep Soil Stabilization: Design and Construction of Lime and Lime/Cement Columns, Royal Institute of Technology, Stockholm, Sweden.
79. Kitazume, M., Ikeda, T., Miyajima, S., and Karastanev, D. (1996). “Bearing Capacity of Improved Ground with Column Type DMM,” Grouting and Deep Mixing: Proceedings of IS-Tokyo 96 2nd International Conference on Ground Improvement Geosystems, 503–508, Tokyo, Japan.
80. Our, C., Wu, T., and Hsieh, H. (1996). “Analysis of Deep Excavation with Column Type of Ground Improvement in Soft Clay,” Journal of Geotechnical Engineering, 122(9), 709–716.
81. Navin, M.P. and Filz, G.M. (2006). Simplified Reliability-Based Procedures for Design and Construction Quality Assurance of Foundations Improved by the Deep Mixing Method, Federal Highway Administration, Washington, DC.
220
82. Tatsuoka, F., Kohata, Y., Uchida, K., and Imai, K. (1996) “Deformation and Strength Characteristics of Cement-Treated Soils in Trans-Tokyo Bay Highway Project,” Grouting and Deep Mixing: Proceedings of IS-Tokyo 96 2nd International Conference on Ground Improvement Geosystems, 453–459, Tokyo, Japan.
83. Terashi, M. (2003). “The State of Practice in Deep Mixing Methods,” Grouting and Ground Treatment: Proceedings of the Third International Conference, Geotechnical Special Publication 120, 25–49, American Society of Civil Engineers, Reston, VA.
84. Hebib, S. and Farrell, E.R. (2003). “Some Experiences on the Stabilization of Irish Peats,” Canadian Geotechnical Journal, 40, 107–120.
85. Broms, B.B. (1999). “Keynote Lecture: Design of Lime, Lime/Cement and Cement Columns,” International Conference on Dry Mix Methods: Dry Mix Methods for Deep Soil Stabilization, 125–153, Balkema, Rotterdam, Netherlands.
86. Cement Deep Mixing. (1985). Design and Construction Manual for CDM Institute, Partial English Translation, Cement Deep Mixing Association of Japan, Tokyo, Japan.
87. Spencer, E. (1967). “A Method of Analysis of the Stability of Embankments Assuming Parallel Inter-Slice Forces,” Geotechnique, 17(1), 11–26.
88. Filz, G.M. and Smith, M.E. (2006). Design of Bridging Layers in Geosynthetic-Reinforced, Column-Supported Embankments, Virginia Transportation Research Council, Charlottesville, VA.
89. Sloan, J.A. (2011). Column-Supported Embankments: Full-Scale Tests and Design Recommendations, Doctoral dissertation, Virginia Polytechnic Institute and State University, Blacksburg, VA.
90. Duncan, J.M. and Wright, S.G. (2004). Soil Strength and Slope Stability, Wiley, Hoboken, NJ.
91. Adams, T.E. and Filz, G.M. (2007). Technical Memorandum: Stability Analyses of the P24 Levee, New Orleans District, U.S. Army Corps of Engineers, New Orleans, LA.
92. Adams, T.E. and Filz, G.M. (2008). Technical Memorandum: Stability Analyses of the Gainard Woods Pump Station T-Wall, New Orleans District, U.S. Army Corps of Engineers, New Orleans, LA.
93. Adams, T.E., Filz, G.M., Cali, P.R., and Woodward, M.L. (2008). “Stability Analyses of a Levee on Deep Mixed Columns, Plaquemines Parish, Louisiana,” Geosustainability and Geohazard Mitigation, Geotechnical Special Publication 178, 708–715, American Society of Civil Engineers, Reston, VA.
94. Adams, T.E., Filz, G.M., Cali, P.R., and Woodward, M.L. (2008). “Deformation and Stability Analyses of a Pile Supported T-Wall with Deep Mixed Shear Panels in Plaquemines Parish, Louisiana,” Proceedings of the 2nd International Conference on

221
Geotechnical Engineering for Disaster Mitigation and Rehabilitation, 481–486, Nanjing, China.
95. Adams, T.E., Filz, G.M., and Navin, M.P. (2009). “Stability of Embankments and Levees on Deep Mixed Foundations,” Proceedings of the International. Symposium of Deep Mixing and Admixture Stabilization, Okinawa, Japan.
96. Bruce, D.A. and Cali, P.R. (2005). “State of Practice Report: Session 3—Design of Deep Mixing Applications,” Presented at the International Conference on Deep Mixing, Swedish Geotechnical Institute, Stockholm Sweden.
97. Cali, M., Woodward, M., and Bruce, D.A. (2005). “Levee Stability Application for Deep Mixing (2)—Conclusions Form Test Section Using Dry Mixed Soil Cement Columns,” Proceedings of the International Conference on Deep Mixing—Best Practice and Recent Advances, Deep Mixing ’05, 415–423, Swedish Geotechnical Institute, Linköping, Sweden.
98. Chai, J.C., Liu, S.Y., and Du, Y.J. (2002). “Field Properties and Settlement Calculation of Soil Cement Improved Soft Ground—A Case Study,” Lowland Technology International, 4(2), 51–58.
99. Han, J., Parsons, R.L., Huang, J., and Sheth, A.R. (2005). “Factors of Safety Against Deep-Seated Failure of Embankments Over Deep Mixed Columns,” Proceedings of the International Conference on Deep Mixing—Best Practice and Recent Advances, Deep Mixing ’05, 231–236, Swedish Geotechnical Institute, Linköping, Sweden.
100. Karastanev, D., Kitazume, M., Miyajima, S., and Ikeda, T. (1997). “Bearing Capacity of Shallow Foundation on Column Type DMM Improved Ground,” Proceedings of the 14th International Conference on Soil Mechanics and Foundation Engineering, 3, 1621–1624, Hamburg, Germany.
101. Kitazume, M. (2008). “Stability of Group Column Type DMM Improved Ground Under Embankment Loading,” Report of Port and Airport Research Institute, 47(1), 1–55.
102. Kitazume, M., Omine, K., Miyake, M., and Fujisawa, H. (1997). “JGS TC Report: Japanese Design Procedures and Recent Activities of DMM,” Grouting and Deep Mixing, 925–930, Balkema, Rotterdam, Netherlands.
103. Kitazume, M., Okano, K., and Miyajima, S. (2000). “Centrifuge Model Tests on Failure Envelope of Column Type Deep Mixing Method Improved Ground,” Soils and Foundations, 40(24), 43–55.
104. Kitazume, M. and Maruyama, K. (2005). “Collapse Failure of Group Column Type Deep Mixing Improved Ground Under Embankment,” Proceedings of the International Conference on Deep Mixing—Best Practice and Recent Advances, Deep Mixing ’05, 245–254, Swedish Geotechnical Institute, Linköping, Sweden.

222
105. Kitazume, M. and Maruyama, K. (2006). “External Stability of Group Column Type Deep Mixing Improved Ground Under Embankment Loading,” Soils and Foundations, 46(3), 323–340.
106. Kitazume, M. and Maruyama, K. (2007). “Centrifuge Model Tests on Failure Pattern of Group Column Type Deep Mixing Improved Ground,” Proceedings of the 17th International Offshore and Polar Engineering Conference, 1293–1300, Lisbon, Portugal.
107. Kitazume, M. and Maruyama, K. (2007). “Internal Stability of Group Column Type Deep Mixing Improved Ground Under Embankment Loading,” Soils and Foundations, 47(3), 437–455.
108. Miki, H. (1997). “Design of Deep Mixing Method of Stabilization with Low Improvement Ratio,” 1st Seminar on Ground Improvement in Highways, 97–204, Bangkok, Thailand.
109. Navin, M.P. and Filz, G.M. (2005). “Statistical Analysis of Strength Data from Ground Improved with DMM Columns.” Proceedings of the International Conference on Deep Mixing–—Best Practice and Recent Advances, Deep Mixing ’05, 145–154, Swedish Geotechnical Institute, Linköping, Sweden.
110. Navin, M.P. and Filz, G.M. (2006). “Numerical Stability Analyses of Embankments Supported on Deep Mixed Columns,” GeoShanghai 2006, Geotechnical Special Publication 152, 1–8, American Society of Civil Engineers, Reston, VA.
111. Navin, M.P. and Filz, G.M. (2006). “Reliability of Deep Mixing Method Columns for Embankment Support,” Geotechnical Engineering in the Information Technology Age: Proceedings of GeoCongress 2006 (CD-ROM), American Society of Civil Engineers, Reston, VA.
112. Navin, M.P., Kim, M., and Filz, G.M. (2005). “Stability of Embankments Founded on Deep Mixing-Method Columns: Three-Dimensional Considerations,” Proceedings of the 16th International Conference on Soil Mechanics and Geotechnical Engineering, 1227‒1230, Rotterdam, Netherlands.
113. Ohishi, K., Katagiri, M., Terashi, M., Ishii, T., and Miyakoshi, Y. (2005). “Physical and Numerical Simulation of Deep Mixed Foundation Part 2: Revetment on Treated Soil Block Underlain by a Sandy Layer,” Proceedings of the International Conference on Deep Mixing—Best Practice and Recent Advances, Deep Mixing ’05, 281–288, Swedish Geotechnical Institute, Linköping, Sweden.
114. Porbaha, A. (2000). “State of the Art in Deep Mixing Technology: Part IV—Design Considerations,” Ground Improvement, 3, 111–125.
115. Puebla, H., Butler, R.C., O’Neill, E.S., and Williams, R.R. (2006). “Static and Seismic Stress-Deformation Analyses of a Deep Soil Mix Wall,” Presented at the 4th International FLAC Symposium on Numerical Modeling in Geomechanics, Madrid, Spain.

223
116. Stewart, M.E. and Filz, G.M. (2005). “Factors Affecting Load Transfer to Deep Mixing Columns from Embankments with Geosynthetic Reinforcement,” Proceedings of the International Conference on Deep Mixing—Best Practice and Recent Advances, Deep Mixing ’05, 305–314, Swedish Geotechnical Institute, Linköping, Sweden.
117. Terashi, M. and Tanaka, H. (1983). “Bearing Capacity and Consolidation of the Improved Ground by a Group of Treated Soil Columns,” Report of the Port and Harbour Research Institute, 22(2), 213–266.
118. Topolnicki, M. (2004). “In Situ Soil Mixing,” Ground Improvement, 3rd Ed., CRC Press, New York, NY.
119. Brown, D.A., Turner, J.P., and Castelli, R.J. (2010). Drilled Shafts: Construction Procedures and LRFD Design Methods, NHI Course No. 132014, Geotechnical Engineering Circular No. 10, Report No. FHWA-NHI-10-016, Federal Highway Administration, Washington, DC.
120. Youd, T.L., Idriss, I.M., Andrus, R.D., Arango. I., Castro, G., Christian, J.T., Dobry, R., et al. (2001). “Liquefaction Resistance of Soils: Summary Report from the 1996 NCEER and 1998 NCEER/NSF Workshops on Evaluation of Liquefaction Resistance of Soils,” Journal of Geotechnical and Geoenvironmental Engineering, 127(10), 817–833.
121. California Department of Conservation, Division of Mines and Geology. (1997). Guidelines for Evaluating and Mitigating Seismic Hazards in California, CDMG Special Publication, Sacramento, CA.
122. Southern California Earthquake Center. (1999). Recommended Procedures for Implementation of DMG Special Publication 117 Guidelines for Analyzing and Mitigating Liquefaction Hazards in California, G.R. Martin and M. Lew (Eds.), University of Southern California, Los Angeles, CA.
123. Lust, K. (2011). “Early Contractor Involvement (ECI), Owner’s Perspective—A Contract Tool for Dam Safety,” Presented at the Workshop on Seepage Control Practices for Dams and Levees, Deep Foundations Institute, Hawthorne, NJ.
124. Cali et al. (2012). “Overview of Deep Mixing at Levee LPV 111, New Orleans, LA,” Grouting and Deep Mixing 2012, Proceedings of the 4th International Conference on Grouting and Deep Mixing, Geotechnical Special Publication 228, 661–671, American Society of Civil Engineers, Reston, VA.
125. Terra Engineers, Inc., Ninyo and Moore, GeoPentech, Inc., HDR Engineering, Environmental Science Associates, and Wilson, Ihrig & Associates, Inc. (2007). Results of CDSM Test Section Report: San Pablo Dam Seismic Upgrades, East Bay Municipal Utility District, Oakland, CA.
126. Porbaha, A., Raybaut, J.L., and Nicholson, P. (2001). “State of the Art in Construction Aspects of Deep Mixing Technology,” Journal of the International Society of Soil Mechanics and Geotechnical Engineering (TC-17), 5(3), 123–140.

224
127. Nicholson, P. (2008). Replacement Ratio, Slope Stabilization and Liquefaction Control, Soil Mixing Seminar, Deep Foundations Institute, New York, NY.
128. Mizuno, Y., Kamura, K., and Matumoto, J. (1988). “Experiment on the Improvement of Sandy Soil Using the Deep Mixing Method,” Proceedings of the 23rd Annual Meeting of JSSMFE, 2301–2304, Tokyo, Japan (in Japanese).
129. ASTM D4380. (2012). “Standard Test Method for Density of Bentonitic Slurries,” Book of Standards Volume 04.08, ASTM International, West Conshohocken, PA.
130. ASTM C192. (2012). “Standard Practice for Making and Curing Concrete Test Specimens in the Laboratory,” Book of Standards Volume 04.02, ASTM International, West Conshohocken, PA.
131. ASTM D2166. (2006). “Standard Specification for Unconfined Compressive Strength of Cohesive Soil,” Book of Standards Volume 04.08, ASTM International, West Conshohocken, PA.
132. Ahnberg, H., Bengtsson, P.E., and Holm, G. (1989). “Prediction of Strength of Lime Columns.” Proceedings of the 12th International Conference on Soil Mechanics and Foundation Engineering, 12(2), 1327–1330, Rio de Janeiro, Brazil.
133. ASTM D5084. (2010). “Standard Test Method for Measurement of Hydraulic Conductivity of Saturated Porous Materials Using a Flexible Wall Permeameter,” Book of Standards Volume 04.08, ASTM International, West Conshohocken, PA.
134. Terashi, M. and Kitazume, M. (2008). “International Survey of QC/QA Methods and Procedures for Deep Mixing,” Invitation to Task 3, International Collaborative Study on QC/QA for Deep Mixing.
135. GeoTesting Express. (1994). “Strength of Cement-Soil at C07A2,” Report prepared for Nicholson Construction Company, Acton, MA.
136. ASTM C918. (2007). “Standard Test Method for Measuring Early-Age Compressive Strength and Projecting Later-Age Strength,” Book of Standards Volume 04.02, ASTM International, West Conshohocken, PA.
137. Essex, R. (2007). Geotechnical Baseline Reports for Construction: Suggested Guidelines, American Society for Civil Engineers, Reston, VA.
138. Ryan, C.R. and Jasperse, B.H. (1989). “Deep Soil Mixing at Jackson Lake Dam,” Proceedings of the ASCE 1989 Foundation Engineering Congress, Foundation Engineering: Current Principles and Practices, Vols. 1 and 2, 354–367, Evanston, IL.
139. Ryan, C.R. and Jasperse, B.H. (1992). “Stabilization and Fixation Using Soil Mixing,” Grouting Soil Improvement and Geosynthetics, Geotechnical Special Publication 30, 1273–1284, American Society of Civil Engineers, New Orleans, LA.

225
140. Day, S.R. and Ryan, C.R. (1995). “Containment, Stabilization, and Treatment of Contaminated Soils Using in Situ Soil Mixing,” Proceedings of the ASCE Specialty Conference, New Orleans, LA.
141. Taki, O. and Yang, D.S. (1989). “Excavation Support and Groundwater Control Using Soil Cement Mixing Wall for Subway Projects,” Proceedings of the Rapid Excavation and Tunneling Conference, 156–175, Los Angeles, CA.
142. Taki, O. and Yang, D.S. (1991). “Soil-Cement Mixed Wall Technique,” Proceedings of the Geotechnical Engineering Congress, 298–309, American Society of Civil Engineers, Denver, CO.
143. Yang, D.S. (1997). “In situ Ground Improvement, Reinforcement, and Treatment: A Twenty-Year Update and a Vision for the 21st Century,” Geo-Institute Conference, 130–150, American Society of Civil Engineers, Logan, UT.
144. Harnan, C.N. and Iagolnitzer, Y.U. (1992). “COLMIX: The Process and Its Applications,” Grouting in the Ground, 511–525, Institution of Civil Engineers, London, England.
145. Hirai, T., Ise, J., Kusakari, T., Gotou, M., and Hibi, Y. (1996). “Development and Application of the Deep Mixing Soil Stabilization Method to Control Displacement of Adjacent Ground,” Grouting and Deep Mixing, Proceedings of IS-Tokyo ’96, Second International Conference on Ground Improvement Geosystems, 485–490, Tokyo, Japan.
146. Okumura, T. (1996). “Deep Mixing Method of Japan,” Grouting and Deep Mixing, Proceedings of IS-Tokyo ’96, Second International Conference on Ground Improvement Geosystems, 879–887, Tokyo, Japan.
147. Nicholson, P.J., Jasperse, B.H., and Fisher, M.J. (1997). “Economical Alternative for Containment Barriers,” Presented at the International Containment Technical Conference and Exhibit, St. Petersburg, FL.
148. Andromalos, K.B. and Ameel, M.E. (1994). “In-Situ Stabilization of the Geiger (C&M Oil) Superfund Site,” Presented at the Superfund XV Conference, Hazardous Materials Control Resources Institute, Washington, DC.
149. Andromalos, K.B., Hegazy, Y.A., and Jasperse, B.H. (2000). “Stabilization of Soft Soils by Soil Mixing,” Soft Ground Technology, 194–205, American Society of Civil Engineers, Reston, VA.
150. Isobe, K., Samaru, Y., Aoki, C., Sogo, K., and Murawaki, T. (1996). “Large-Scale Deep Soil Mixing and Quality Control,” Grouting and Deep Mixing, Proceedings of IS-Tokyo ’96, Second International Conference on Ground Improvement Geosystems, 619–624, Tokyo, Japan.
151. Watanabe, T., Nishimura, S., Moriya, M., and Hirai T. (1996). “Development and Application of New Deep Mixing Soil Improvement Method to Form Rectangular

226
Stabilized Soil Mass,” Grouting and Deep Mixing, Proceedings of IS-Tokyo ’96, Second International Conference on Ground Improvement Geosystems, 783–786, Tokyo, Japan.
152. Mizutani, T., Kanai, S., and Fujii, M. (1996). “Assessment of the Quality of Soil-Cement Columns of Square or Rectangular Shapes Formed by Deep Mixing Method,” Grouting and Deep Mixing, Proceedings of IS-Tokyo ’96, Second International Conference on Ground Improvement Geosystems, 637–642, Tokyo, Japan.
153. Greenwood, D.A. (1987). “Simple Techniques of Ground Improvement with Cement,” Proceedings International Conference on Foundations/Tunnels, 2, 8–19.
154. Burke, K., Furth, A., and Rhodes, D. (1996). “Site Remediation of Hexavalent Chromium in a Plater’s Sump: Heavy Metal Chemical Fixation—A Case History,” Presented at the PSC 17th Annual AESF/EPA Conference on Pollution Prevention and Control, Orlando, FL.
155. Burke, G.K. and Sehn, A.L. (2005). “An Analysis of Single Axis Wet Mix Performance,” Proceedings of the International Conference on Deep Mixing Best Practices and Recent Advances, 41–46, Swedish Deep Stabilization Research Centre, Linköping, Sweden.
156. Brunner, W., Fiorotto, R., Stötzer, E., and Schöpf, M. (2006). “The Innovative CSM-Cutter Soil Mixing for Constructing Retaining and Cut-Off Walls,” Geotechnical Engineering in the Information Technology Age: Proceedings of GeoCongress 2006, 1–6, American Society of Civil Engineers, Reston, VA.
157. Gerressen, F. and Vohs, T. (2012). “CSM-Cutter Soil Mixing—Worldwide Experiences of a Young Soil Mixing Method,” Grouting and Deep Mixing 2012, Proceedings of the 4th International Conference on Grouting and Deep Mixing, Geotechnical Special Publication 228, 281–290, American Society of Civil Engineers, Reston, VA.
158. Bellato, D., Simonini, P., Marzano, I.P., Leder, E., Grisolia, M., Vohs, T., and Gerressen, F.W. (2012). “Mechanical and Physical Properties of a CSM Cut-off/Retaining Wall,” Presented at the International Conference on Ground Improvement and Ground Control, Wollongong, Australia.
159. Kawasaki, K., Kotera, H., Nishida, K., and Murase, T. (1996). “Deep Mixing by Spreadable Wing Method,” Grouting and Deep Mixing, Proceedings of IS-Tokyo ’96, Second International Conference on Ground Improvement Geosystems, 631–636, Tokyo, Japan.
160. Yang, D.S., Yagihashi, J.N., and Yoshizawa, S.S. (1998). “SWING Method for Deep Mixing,” Soil Improvement for Big Digs, Geotechnical Special Publication 81, 111–121, American Society of Civil Engineers, Reston, VA.
161. Miyoshi, A. and Hirayama, K. (1996). “Test of Solidified Columns Using a Combined System of Mechanical Churning and Jetting,” Grouting and Deep Mixing, Proceedings of IS-Tokyo ‘96, Second International Conference on Ground Improvement Geosystems, 743–748, Tokyo, Japan.

227
162. Ueki, H, Hasegawa, K., Suzuki, K., and Bessho, M. (1996). “Development of a High-Pressure Jet Mixing Method for Displacement-Reducing,” Grouting and Deep Mixing, Proceedings of IS-Tokyo ’96, Second International Conference on Ground Improvement Geosystems, 767–772, Tokyo, Japan.
163. Reavis, G. and Feyaldenhoven, F.C. (1994). “GEOJET Foundation System,” Geotechnical News, 12(4), 56–60.
164. Geo-Con, Inc. (1998). Soil Mixing Seminar, New York, NY.
165. Nicholson, P.J. and Jasperse, B.H. (1998). “Hydraulic and Mechanical Cement Soil Mixing,” Deep Mixing Methods Short Course, University of Milwaukee-Wisconsin, Milwaukee, WI.
166. Siepi, M. and Bertero, A. (2002). Geojet®-Turbojet®—A Deep Mixing Method for the Solution of Geotechnical Problems, Presented at the Ninth International Conference on Piling and Deep Foundations, Deep Foundations Institute, Nice, France.
167. Schmutzler, W., Filippo, M.L., Bertero, A., Leoni, F., Nicholson, P, Druss, D., and Beckerle, J. (2012). “Construction Operations and Quality Control of Deep Mixing at Levee LPV111 New Orleans,” Grouting and Deep Mixing 2012, 682–693, American Society of Civil Engineers, Reston, VA.
168. Gularte, F., Barneich, J., Burton, J., Fordham, E., Watt, D., Johnson, T., and Weeks, J. (2007). “First Use of TRD Construction Technique for Soil Mix Cutoff Wall Construction in the United States,” Designing Our Underground Space, 1–12, American Society of Civil Engineers, Reston, VA.
169. Dry Jet Mixing Association of Japan. (1993). DJM Manual, Tokyo, Japan (in Japanese).
170. Fujita, T. (1996). “Application of DJM Under Special Conditions,” Grouting and Deep Mixing, Proceedings of IS-Tokyo ’96, Second International Conference on Ground Improvement Geosystems, 591–594, Tokyo, Japan.
171. Nishida, K., Koga, Y., and Miura, N. (1996). “Energy Consideration of the Dry Jet Mixing Method,” Grouting and Deep Mixing, Proceedings of IS-Tokyo ’96, Second International Conference on Ground Improvement Geosystems, 643–648, Tokyo, Japan.
172. Yang, D.S., Yagihashi, J.N., and Yoshizawa, S.S. (1998). “Dry Jet Mixing for Stabilization of Very Soft Soils and Organic Soils,” Soil Improvement for Big Digs, Geotechnical Special Publication 81, 96–110, American Society of Civil Engineers, Reston, VA.
173. Holm, G., Bredenberg, H. and Broms, B.B. (1981). “Lime Columns as Foundations for Light Structures,” Proceedings of the 10th International Conference on Soil Mechanics and Foundation Engineering, 3, 687–694, Stockholm, Sweden.

228
174. Rathmeyer, H. (1996). “Deep Mixing Methods for Soft Subsoil Improvement in the Nordic Countries,” Grouting and Deep Mixing, Proceedings of IS-Tokyo ’96, Second International Conference on Ground Improvement Geosystems, 869–877, Tokyo, Japan.
175. Restelli, A.B., Berrero, M., and Lodigiani, E. (1991). “Deep Mixing Technology to Improve the Bearing Capacity of a Very Soft Clayey Soil Under an Earth Embankment,” Presented at the Fourth International Conference on Piling and Foundations, Deep Foundations Institute, Stresa, Lago Maggiore, Italy.
176. Calabresi, G., Vanni, D., Zuffi, P., Zavatta, P., Calì, S., and Biggi, A. (2010). “Dry Soil Mixing In Rieti (Italy): Solution of a Geotechnical Problem,” Geotechnical Challenges in Urban Regeneration, Deep Foundations Institute, London, UK.
177. Gunther, J., Holm, G., Westberg, G., and Eriksson H. (2004). “Modified Dry Mixing (MDM)—A New Possibility in Deep Mixing,” Geotechnical Engineering for Transportation Projects, 1375–1384, American Society of Civil Engineers, Reston, VA.
178. Eriksson, H., Gunther, J., and Ruin, M. (2005). “MDM Combines the Advantages of Dry and Wet Mixing,” Proceedings of the International Conference On Deep Mixing—Best Practice and Recent Advances, 509–520, Stockholm, Sweden.