feasibility study using simulation based net present …
TRANSCRIPT
FEASIBILITY STUDY USING SIMULATION BASED NET PRESENT
VALUE ANALYSIS
(Case Study in Kopen Coffee, Yogyakarta)
Thesis
Submitted to International Program Department of Industrial Engineering
the Requirements for the degree of Sarjana Teknik Industri
at
Universitas Islam Indonesia
By
Khairesa Handayu (13 522 016)
INTERNATIONAL PROGRAM
INDUSTRIAL ENGINEERING DEPARTMENT
FACULTY OF INDUSTRIAL TECHNOLOGY
UNIVERSITAS ISLAM INDONESIA
YOGYAKARTA
August 2020

ii
1 Thesis Approval of Supervisor
FEASIBILITY STUDY USING SIMULATION BASED NET PRESENT
VALUE ANALYSIS
(Case Study in Kopen Coffee, Yogyakarta)
Thesis
By Khairesa Handayu
13 522 016
Yogyakarta, August 2020
Supervisor
Muhammad Ridwan Andi Purnomo, ST., M.Sc., Ph.D
iii
FEASIBILITY STUDY USING SIMULATION BASED NET PRESENT
VALUE ANALYSIS
(Case Study in Kopen Coffee, Yogyakarta)
THESIS
By
Khairesa Handayu
13 522 016
Had been defended in front of Examination Committee in Partial Fulfillment of the requirement for the bachelor degree of Industrial Engineering Department
Universitas Islam Indonesia
Examination Committee
Muhammad Ridwan Andi Purnomo, ST., M.Sc., PhD. Examination Committee Chair Annisa Uswatun Khasanah, ST., M.Sc. Member I Agus Mansur, ST., M.Eng.Sc Member II
Acknowledged by, Head of Undergraduate Program Department of Industrial Engineering
Faculty of Industrial Technology Universitas Islam Indonesia
(Dr. Taufiq Immawan, ST., MM.)

iv
2 DEDICATION
I dedicate my final project for my beloved parents especially my mother who
gave me everything that I need, everything that she has, forgiveness, and a
chance in every single mistake I’ve made,
Sisters who gave me motivation, my friends who support me, everyone who set
me down and everyone who wake me up.

v
3 MOTTO
“Tatkala umurku habis tanpa karya dan pengetahuan (ilmu), lantas apa makna umurku ini?."
(KH. Hasyim Asy’ari)

vi
4 PREFACE
Assalamualaikum Wr. Wb.
Alhamdulillah and gratitude are presented to Allah, which has always grants with His grace,
strength, and blessing so the author could complete this undergraduate thesis. The author
would like to thank for those who always help and support the author so that, this thesis can
be finish. Therefore, thanks to:
1. Allah SWT and Rasulullah Muhammad SAW as His blessing and guidance.
2. My beloved family alm. father, mother, sisters, and other families for their help, support,
motivation, and pray.
3. Mr. Muhammad Ridwan Andi Purnomo., ST., M.Sc., Ph.D for his patient, time, guiding,
helping, and supervising this thesis.
4. Mrs. Annisa Uswatun Khasanah, ST., M.Sc, and Mr. Agus Mansur, ST., M.Eng.sc for
their time and help in my defense.
5. Kopen Coffee for the accommodation of data in this research.
6. All of my friends from Industrial Engineering International Program especially batch
2013 for the support, motivation.
7. Mrs. Diana and Mrs. Devi that patiently help and facilitate the author.
8. Everyone who help and support the author lahir and batin that cannot be mention one by
one.
The author realizes as a human that there are a lot of mistakes and weaknesses in what
author wrote. But, the author hopes this thesis could help and bring advantages for everyone
who reads this.
Wassalamualaikum Wr. Wb.
Khairesa Handayu

vii
5 ABSTRACT
Coffee is one of the biggest commodities in Indonesia, along with rubber and textile. Nowadays, there are many coffee shops that established and this also in-line with the number of demands that increasing in Indonesia from period of 2018/2019 to 2019/2020. Luckily, Indonesia is the fourth biggest countries producing coffee beans after Brazil, Vietnam, and Colombia. Lots of people investing their money in coffee shop business. In Yogyakarta itself, coffee shop can be found in every inch of steps. One of the coffee shops in Yogyakarta that already established is Kopen Coffee. It is located in Condongcatur, where there are quite lots of undergraduate students lived and also one of densely populated area in Yogyakarta. With the competition and lots of people who invested and interested in this kind of business, this research would like to know the worth of the money invested in Kopen Coffee as well as the other similar business using Net Present Value (NPV) method that simulated using Monte Carlo. From the calculation that has been done, it is shown that the NPV of Kopen Coffee generates positive value, which is equal to Rp 336,506,243.61. From this result, it can be indicated that this project is feasible to run. After 1000 times of iteration, the NPV shows average of Rp 287,411,388, with mean standard error Rp 3,956,371. While the probability if the NPV is less than zero is 0.08%.
Keywords: Feasibility study, financial aspect, Monte Carlo, Net Present Value.
viii
6 TABLE OF CONTENT
THESIS APPROVAL OF SUPERVISOR ................................................................................................ II
DEDICATION ......................................................................................................................................... IV
MOTTO ..................................................................................................................................................... V
PREFACE…………………………………………………………………………………………………….VI
ABSTRACT .......................................................................................................................................... VIII
TABLE OF CONTENT ....................................................................................................................... VIIII
LIST OF TABLES ..................................................................................................................................... X
LIST OF FIGURES ................................................................................................................................ XII
CHAPTER I: INTRODUCTION .............................................................................................................. 1 1.1 BACKGROUND ....................................................................................................................... 1 1.2 PROBLEM FORMULATION.................................................................................................... 5 1.3 RESEARCH OBJECTIVE ......................................................................................................... 5 1.4 PROBLEM LIMITATION ......................................................................................................... 5 1.5 BENEFIT OF RESEARCH ........................................................................................................ 6 1.6 SYSTEMATICAL WRITING .................................................................................................... 6
CHAPTER II: LITERATURE REVIEW.................................................................................................. 8 2.1 CURRENT STUDY ................................................................................................................... 8 2.2 DEDUCTIVE STUDY ..............................................................................................................15
2.2.1 Feasibility Study ...................................................................................................................15 2.2.2 Feasibility Study Method ......................................................................................................16 2.2.3 Purpose of Business Feasibility Study ...................................................................................17 2.2.4 Net Present Value (NPV) ......................................................................................................18 2.2.5 Monte Carlo .........................................................................................................................19 2.2.6 Monte Carlo Definition ........................................................................................................19 2.2.7 Monte Carlo Implementation ................................................................................................19 2.2.8 Monte Carlo Simulation .......................................................................................................20 2.2.9 Monte Carlo Simulation Steps ..............................................................................................21 2.2.10 Monte Carlo Simulation Elements ....................................................................................22 2.2.11 Monte Carlo Simulation Advantage ..................................................................................22 2.2.12 Net Present Value using Monte Carlo...............................................................................22
CHAPTER III: RESEARCH METHOD..................................................................................................24 3.1 PROBLEM IDENTIFICATION ................................................................................................24 3.2 PROBLEM FORMULATION...................................................................................................24 3.3 LITERATURE REVIEW ..........................................................................................................24 3.4 DATA COLLECTION METHOD .............................................................................................25 3.2 DISCUSSIONS ........................................................................................................................29 3.3 CONCLUSION AND RECOMMENDATION ..........................................................................30 3.5 FLOWCHART .........................................................................................................................30
CHAPTER IV: DATA COLLECTION AND PROCESSING .................................................................31 4.1 DATA PROCESSING ..............................................................................................................32
4.1.1 Cash Flow ............................................................................................................................32 4.1.2 NPV .....................................................................................................................................33 4.1.3 NPV Simulation Analysis ......................................................................................................34

ix
4.1.4 Sensitivity Analysis ...............................................................................................................35 CHAPTER V: DISCUSSION ...................................................................................................................37
5.1 NET PRESENT VALUE ...........................................................................................................37 5.2 NPV SIMULATION ANALYSIS .............................................................................................37
CHAPTER VI: CONCLUSION AND RECOMMENDATION ...............................................................39 6.1 CONCLUSION ........................................................................................................................39 6.2 RECOMMENDATION ............................................................................................................39
REFERENCES .........................................................................................................................................40
x
7 LIST OF TABLES Table 1.1 Number of coffee shop in Yogyakarta ................................................................ 2 Table 3.1 Required data and the data sources ................................................................... 25 Table 4.1 Most likely, minimum and maximum of sales of the main products .................. 31 Table 4.2 Average selling price and production cost of the main products ........................ 31 Table 4.3 Required initial investment ............................................................................... 32 Table 4.4 Data about tax and bank interest ....................................................................... 32 Table 4.5 Recapitulation of cash flow calculation............................................................. 33 Table 4.6 Cash Flow Details ............................................................................................ 33 Table 4.7 NPV simulation result of 1000 iterations .......................................................... 34 Table 4.8 Recapitulation of Monte Carlo simulation result ............................................... 34 Table 4.9 Data for NPV Sensitivity Analysis.................................................................... 35 Table 4.10 Out Cash Flow and Net Present Value of Sensitivity Analysis ........................ 35

xi
8 LIST OF FIGURES Figure 1.1 The Biggest Coffee Producing Country in the World in 2018/2019 ................... 1 Figure 3.1 Diagram of minimum, most likely and maximum sales of coffee product ........ 26 Figure 3.2 Steps in conducting this study ......................................................................... 30 Figure 4.1 Sensitivity Analysis Scatter Diagram............................................................... 36

1
CHAPTER I
INTRODUCTION
1.1 BACKGROUND
Indonesia has abundant natural resources from coal to spices. One of the potential
commodities which needs to be developed is coffee bean. Coffee itself is a type of beverage
that is important for most people all over the world. Not only because of the enjoyment of
consumers of coffee drinkers but also because of the economic value for countries that
produce and export coffee beans. Coffee could be one of the people’s incomes, which can
increase the foreign exchange of a country through raw and processed coffee beans as well.
There are two varieties of coffee beans that are generally known, which are Arabica and
Robusta Coffee.
Countries that dominate world’s coffee production are in the regions of South America,
Africa, and Southeast Asia. In 2018, Brazil is pronounced as the largest coffee producer
country followed by Vietnam and Columbia. Figure 1.1 shows that Indonesia was able to
produce around 10,000 thousand 60 kg bags in 2018. This makes Indonesia currently ranked
fourth as the largest coffee producer country in the world.
Figure 1.1 The World’s Biggest Coffee’s Producer in 2018/2019
Total Production Exporting Countries in 2018/2019
(in thousand 60kg bags) 80,000 60,000 40,000 20,000
Brazil Viet Nam Colombia Indonesia Ethiopia

2
Indonesia's achievement as the fourth-largest coffee producer in the world is in line
with the high coffee consumption in Indonesia. Indonesia’s Coffee Consumption Annual
Data 2019 released by the Global Agricultural Information Network shows projections of
domestic consumption in 2019/2020 reaching 294,000 tons or around 13,9 per cent compared
to consumption in 2018/2019, which reached 258,000 tons (Widiati, 2020). That statement
also emphasized by coffee entrepreneurs who estimate that domestic coffee consumption is
now showing significant growth along with the development of café which has modified how
coffee is being served. The owners try to make interesting concepts to make consumers come
to their place of business in an effort to meet the desires and needs of consumers, as well as
to generate profit for the business. The growth of coffee shops business contributes a big role
in increasing the consumption of coffee faster. This phenomenon is expected to be able to
boost the increase in the level of coffee consumption per capita. Hence, there is an increasing
in the number of new coffee shops in Yogyakarta as cited from Harian Jogja which shown in
Table 1.1.
Table 1.1 Number of coffee shop in Yogyakarta
Years
Coffee
Shop Increasing
Percentage Amount
2008 156 0%
2009 186 19.23%
2010 191 2.68%
2011 196 2.61%
2012 235 19.89%

3
In accordance with the growth of the coffee shops, Indonesian economy is currently
experiencing rapid development. This was proven by data from the Central Bureau of
Statistics/Badan Pusat Statistik (BPS) which released the results of the first quarter of 2018
economic growth of 5.06 percent. This figure grew higher than the year-on-year economic
growth of 5.01 percent. Economic progress in Indonesia is marked by the number of new
businesses that have established, ranging from small-scale businesses to large-scale
businesses. The business that is in great demand by the public is a business engaged in the
service sector. Every company has its goals, in carrying out business activities, both short
and long-term goals. The short-term goal to be achieved by the company is the achievement
of profits so that the availability of continuous funds to be able to operate everyday business
could be maintained. While the long-term goal to be achieved is to guarantee the survival of
the business as well as developments in the future. This requires each business leader or owner
to act professionally in achieving the goals set by the business. The success of a business to
achieve its goals is determined by the business’s ability to manage various supported
resources and investments, in terms of establishing a business.
Investment in this business can help people's lives become more practical and
efficient. Many benefits can be obtained from investment activities, saving foreign exchange,
and adding foreign exchange. Basically, an increase in investment activities can escalate the
economic activity in a country. Of course, investment activities here is defined as the
investment activities that are economically profitable, not investment activities that lead to
future losses to the parties involved. In order to be able to carry out its function as a service
provider to the community, supporting facilities are needed so that it can run properly.
Nowadays, almost everyone especially students have lot of activities outside, in terms of
accomplishing the tasks, meetings, or just hang out with friends. These activities certainly
require supporting facilities in the form of a comfortable place that suitable for socializing.
One of the favorite places that often used by student is the co-working space in coffee shop.
Coffee shop, aside of considered as a comfortable place, coffee shop usually can
accommodate them with basic necessities while performing activities. Capturing these
opportunities, researcher tries to make a feasibility study for coffee shop business, named
Kopen Coffee.

4
Kopen Coffee is one of coffee shops in Yogyakarta. It was established with a concept
of a homey coffee place, which has a unique room design. Kopen Coffee offers several types
of coffee and non-coffee beverages such as Breve and Groen, which are pronounced as the
favorite menu. Students and young executives are the target market of Kopen Coffee, who
like to spend time for drinking coffee, having meeting or discussion with friends, or enjoy
the leisure time with their relatives. The location is strategic, unique, and comfortable. For
establishing and developing business, accuracy and carefulness need to be done. Hence, by a
proper feasibility study, it will be able to be analyzed whether a business can be declared
feasible or not. According to Jumingan (2009) a feasibility study is a comprehensive
assessment to assess the success of a project, and the feasibility study of the project has the
aim of avoiding investment too large for activities that turn out to be unprofitable.
Sofyan (2004) assessed the financial aspect by conducted the feasibility study using
Net Present Value (NPV) investment. It is calculating the difference between the present
value of an investment and the present value of net cash receipts (operational cash flow) in
the future. Implementation of the NPV method will encounter problems when faced with
conditions where the output is probabilistic and random in nature, one alternative approach
proposed for the decision diagram case with a probabilistic outcome is to use a Monte Carlo
simulation approach. real system 1 has a relatively high uncertainty factor. With the
simplicity possessed by this Monte Carlo method, the outcomes that have uncertainty factors
from a decision diagram will be accommodated. This is done by determining various outcome
values and their probabilities, then doing a Monte Carlo simulation based on random number
outputs on outcome probabilities (Cahyo, 2008). The random number used in this Monte
Carlo simulation is a representation of an uncertain situation in a real system.
Because Kopen Coffee is one of the newly established and developing coffee
businesses, the Monte Carlo method is very suitable for calculating investment feasibility in
this coffee shop. Estimated error of the option price generated by using the Monte Carlo
method is still small enough so that it is necessary to produce values with high accuracy.
Because Kopen Coffee's financial condition is quite good but there is no investor

5
who want to develop Kopen Coffee, therefore researchers need to conduct a feasibility
analysis on Kopen Coffee, so that in the future it will attract investors to contribute in
developing the business.
Based on the background mentioned above, it is necessary to have a feasibility study
especially from financial aspect aimed at reducing the risk of failure of an investment raised
as a basis for investment decision to expand business with the title "Feasibility Study using
Simulation based Net Present Value Analysis". Simulation is applied in this research, in order
to achieve reliable cash flow and NPV estimation.
1.2 PROBLEM FORMULATION
Based on this background, problem to be solved in this study is how to simulate financial
condition of Kopen Coffee using Monte Carlo simulation and analyze it using NPV. Result
of the analysis could be used as the basis of investment decision to expand the business.
1.3 RESEARCH OBJECTIVE
Referring to the formulation of the problem above, the purpose of this paper is focused on
identifying the feasibility study of investment in Kopen Coffee, in terms of financial aspect
using Monte Carlo Simulation for Net Present Value that is obtained.
1.4 PROBLEM LIMITATION
Under the large scope of the analysis of the problem system, the following constraints will
be provided: This study only discusses the feasibility study of Kopen Coffee, that concerns
about the financial aspect, using net present value method. The research only analyzes the
company’s perspective, because it is expected that the results of this study can help achieving
the company's purposes.

6
1.5 BENEFIT OF RESEARCH
This research is expected to provide a real picture of the actual situation related to the title
that previously selected by the. The expected benefits of the study are divided into theoretical uses
and practical uses.
1. Theoretical Purpose
The results of this study are theoretically expected to be useful as a contribution to
the development and theory deepening in the field of industrial engineering.
Especially the investment feasibility study using the Net Present Value method
which later can be used as a reference or literature for other researchers who want
to do further research.
2. Practical Purpose
As one of the decision considerations for both, investor and business owner who
wants to invest their money in coffee shop sector.
1.6 SYSTEMATICAL WRITING
Furthermore, this thesis writing will be continued as follows:
CHAPTER I INTRODUCTION
This chapter contains problem statement, problem background,
problem formulation, research objective, scope of problem, research
benefit, and systematically writing.
CHAPTER II LITERATURE REVIEW
This chapter will elaborate the inductive and deductive study.
Inductive study is primarily important to determine the literature study
of the previous research. Deductive study is needed to be elaborated to

7
provide basic supporting theories to develop the benchmarking
assessment.
CHAPTER II I RESEARCH METHODOLOGY
This chapter will describe the methodology which is applied in the
study. It consists of several parts: the arrangement of research position,
conceptual model and model development as improvement.
CHAPTER IV DATA COLLECTING AND PROCESSING
This chapter will present the elaboration of whole aspect assessment
using the data that have been collected based on the research. Result
of assessment would be developed in a model and simulated by using
Technomatrix Plant Simulation.
CHAPTER V DISCUSSION
Chapter five is going to discuss the results of data processing and the
analysis. Discussion will present the result of assessment based on the
parameters. It will also discuss the simulation result that has been
generated.
CHAPTER VI CONCLUSION AND DISCUSSION
The final section will describe the overall conclusions from the results
of study and the suggestion for the future research.
REFERENCES
8
CHAPTER II
LITERATURE REVIEW
In this chapter, it will be explained the literature review studies which are divided into two,
inductive and deductive. Inductive study is a study from reputable previous research. Besides,
deductive study is study that would be explain about the basic theory that has relation with
research that would be conducted from the textbooks, etc. Inductive and deductive study need
to be done to find out the gap between previous study and the research that would be
conducted and to avoid the plagiarism. This literature review will be divided into several sub
chapters.
2.1 CURRENT STUDY
There are several studies related to this study. Researcher Shaffie (2016) conducted research
about capital investment in Malaysia by using Net Present Value and add Monte Carlo
approach. Capital speculation ends up critical venture choice in unsure financial condition
should be made. Two noteworthy traps of old-style net present worth are vulnerability and
administrative adaptabilities. These disadvantages lead to uncertain money streams
estimation. This examination proposes the work of the Monte Carlo technique in the NPV
model so as to accomplish solid money streams estimation. Monte Carlo gives the hazard
examination which can be received by financial specialists in settling on capital planning
choices. Consequence of this examination found that Monte Carlo is a fitting device to insert
in NPV model.
Stretcher & Robert (2015) discussed about NPV with Monte Carlo Simulation study.
This paper introduces a system for showing Monte Carlo reenactment utilizing the instance
9
of a capital extension choice for ArkMed Corporation, a little biomedical gadget producer
situated in Houston, Texas. The organization proposes the idea of putting resources into an office
that can give custom items utilizing 3d printing. The office would serve the custom orthotics
and strong embed needs of the restorative network of the more noteworthy Houston
metropolitan territory. A reproduction of the budgetary achievability of the new office is
suitable since the assembling technique is new to the company's administration, and on the
grounds that the office would serve a specially requested item that would be quickly given,
inside a couple of hours to a couple of days, in contrast to the organization's present business.
The case gives a chance to enlarge inclusion of capital planning situation investigation, and
to give understudies an activity that requires multi-page referencing in Excel. It additionally
can give yield information that can be abridged into a histogram and recurrence appropriation
diagram. This procedure takes into consideration a visual of the hazard that an undertaking
could restore a negative NPV result. The dispersion of NPVs along these lines gives better
data on which to base a capital resource development choice than would a discrete NPV
worth dependent on midpoints of offers development, cost proportions, and expense rate.
Sachin et al. (2014) used Monte Carlo Simulation approach to manage the risks in
operational networks. The work introduced in this paper is an underlying exertion that
broadens the perspective of overseeing dangers with regards to GSC. This work tries to boost
the GSC environmental financial gains and guarantees manageability in business. The
commitment of this work can be condensed in two stages: in the underlying advance, the
various dangers identified with the operational system in GSC have been perceived and
estimated to assess their outcomes. In the last advance, the outcomes of the dangers explicitly
as far as deferral/unsettling influence have been investigated. In view of the past
examinations and sources of information obtained from the specialists, an absolute five
operational dangers in GSC were recognized and assessed to break down their results
regarding Time, Brand picture, Economic, Health and Safety, Quality and so forth. The most
extreme results were found in time-based outcomes and that was estimated as far as time
delays/aggravations and interruptions. Further, the human-based appraisal incapable to give
outrageous situation thus reproduction was utilized. Monte Carlo Simulation approach was
utilized to break down the operational hazard factors and their outcomes on the exhibition of
GSC and it additionally

10
catches the vulnerabilities in the data sources. An affectability investigation test was
performed to catch the outcomes of dangers on the postponement/unsettling influence profile
mean.
Ganame & Chaudhari (2015) assessed the development building timetable hazard
investigation utilizing Monte Carlo reproduction. For the likelihood of finishing the Hostel
working inside the due date, the recreation utilizing @RISK programming had demonstrated
that there is zero likelihood for the task to be finished inside 282 days (in all probability
length). This demonstrates the due date dependent on no doubt spans that had been utilized
by the development supervisory crew was not noteworthy in a vulnerability domain; it is
probably not going to be accomplished. The vulnerabilities lead the undertaking the board to
dangers and issues. The development timetable ought to be overhauled normally, and the
progressions of due date may happen more than once.
Hizkia (2018) evaluated investment risk in the construction of office buildings. Risk
analysis becomes necessary in a feasibility study, especially during a financial feasibility
study because uncertainty in income and construction costs is always present. This study aims
to conduct a financial feasibility study and carry out a risk analysis using a Monte Carlo
Simulation Method that is a simulation that considers the probability distribution of
predetermined variables into a model, which in this study is a Discounted Cash Flow Model
(Discounted Cash Flow, DCF). The results showed that the conclusion of feasibility produced
by financial analysis with the Discounted Cash Flow Method has a p-value of around 67%.
From the sensitivity analysis, it is known that the selling price has twice the impact on NPV
and IRR compared to construction costs.
Boufateh (2019) did research use Monte Carlo simulation to examine the
consequences of slipping of the identification restriction value and get the sensitivity of
variables. The sensitivity of the variables used to change the identification restriction of the
value. This research found that precision measurement should be considered.

11
Vajargah (2017) did research on evaluating random path of wave using multilevel of
Monte Carlo. This research found that the evaluation of random paths can be done with
Monte Carlo simulation as a simple and flexible tool to use. This research also comparing
Monte Carlo with Multilevel Monte Carlo result of the valuation of European options integral
discretization.
Bendob & Bentouir (2019) wrote paper that intends to testing the adequacy of the
most mainstream choices valuing models, which are the Monte Carlo reproduction strategy,
the Binomial model, and the benchmark model; the Black-Scholes model, when it
disregard/consider the Moneyness classifications and distinctive time to developments. The
outcome demonstrates that all models are overrated in all Moneyness classifications with an
abnormal state of instability In-the cash classification, other finding infers that the Monte
Carlo Simulation strategy is outflanking when the unpredictability is lower, while the Black-
Sholes model and the Binomial model are beating in the whole example with disregarding
the Moneyness.
Park & Sharp (1990) wrote a book "Advanced engineering economics" Park and
Sharp-Bette in his book write some further analysis of technical economics. One of the fields
shown by Park and Sharp-Bette is the manufacture of Monte Carlo simulations to
accommodate risk factors in the calculation of technical economics. In this book, the steps
for making the Monte Carlo simulation will be discussed in detail. However, in this book,
Park and Sharp-Bette only state the distribution of the economic method parameters of
technique they used, for example NPV. Park and SharpBette do not show how the subsequent
analysis (risk analysis) of the results of the distribution of these parameters.
In a study conducted by Komljenovic & Robertson (2016) proposing a high-level
Risk-Risk Decision framework in Asset Management that integrates the risk of extreme and
rare events as part of the overall risk assessment and management activities. This research
focuses on a methodology that aims to identify, assess, and manage these risks in Asset
Management. Researchers believe that this approach can support organizations to become

12
stronger and stronger companies in changing and complex environments. The study exposes
two case studies that show the application of the proposed model.
Another study did by Mujiningsih (2013) about feasibility stufy. The feasibility
analysis method used is the calculation of NPV, IRR, and BCR while to create a development
strategy using SWOT matrix analysis. The results showed that tempe small industries in
Matesih sub-district numbered 80 business units and were able to absorb 53 workers. The
feasibility analysis of NPV of small tempe industries in the sub-district of Karanganyar is
feasible, the BCR value of 1.37 is feasible, the IRR value of 38.72% is feasible and the
strategy used is the SO strategy that is to overcome existing weaknesses by taking advantage
of opportunities emerging.
A research of Wulan et al. (2012) uses qualitative and quantitative analysis tools.
Qualitative analysis used on technical aspects, market aspects and marketing, organizational
aspects, juridical aspects, management aspects, economic aspects and environmental aspects.
Quantitative analysis on financial aspects with Net Present Value (NPV) investment criteria,
Break Event Point (BEP), Internal Rate of Return (IRR), Payback Period (PP), Net Benefit
Cost Ratio (Net B / C), analysis of technical aspects, organizational aspects, and economic
aspects with the results of research that guest house investment projects are feasible.
Wirastuti (2012) examined the financial analysis of the development of The Magani
Hotel Kuta with research variables on financial aspects. This study uses an analysis of the
calculation of investment criteria, namely Benefit Cost Ratio (BCR), Net Present Value
(NPV), Internal Rate of Return (IRR) and Payback Period (PP) with the results of the
development research of The Magani Hotel Kuta feasible under fixed income conditions.
Nufaili & Utomo (2014) about Investment Analysis of Pesonna Makassar Hotels with
research variables on financial aspects. This study uses an analysis of calculation of Net
Present Value (NPV), Internal Rate of Return (IRR), and Payback Period (PP), with the
results of the study showing investment planning of Pesonna Makassar Hotel is feasible.
13
Manope et al. (2014) wrote financial analysis obtained from calculations Based on the
results of the analysis and discussion it can be concluded that: The business of commodity
seeds and mace pala is feasible to run. The six methods of analysis (Cash Flow, Payback
Period, Average Rate of Return (ARR), Net Present Value (NPV), Internal Rate of Return
(IRR), and Profitability Index (PI) all state that this business is feasible. the opportunity for
investors and entrepreneurs is still large enough to get profits from running commodity and
nutmeg seed business in Siau Island.
Cheon & Liang (2009) shows in theory that the samples generated by SAMC can be
used for Monte Carlo integration via a dynamically weighted estimator by calling some
results from the literature of nonhomogeneous Markov chains. Our numerical results indicate
that SAMC can yield significant savings over conventional Monte Carlo algorithms, such as
the Metropolis-Hastings algorithm, for the problems for which the energy landscape is
rugged.
Nurkhotimah (2014) analyze Kampoeng Doeloe Semarang Joglo Franchise
investment business, is a culinary product that was only established since 2010 and is risking
large capital in the long run, there will be problems whether investing Franchise at Kampoeng
Doeloe Joglo Restaurant is profitable or not. In analyzing the data and results of the study,
researchers used NPV analysis, IRR analysis, PI analysis, MIRR analysis, COC analysis,
Sensitivity analysis, and Monte Carlo simulation analysis.
Nuryanti (2015) wrote an analysis of feasibility study in PLTN SMR project in
Indonesia with considering the uncertainty variable. In order to accommodate the probability
which can cause uncertainty variable, this research use probabilistic analysis with Monte
Carlo technique. This technique simulating the correlation between uncertainty variable with
feasibility indicator of the project. The results showed that in the probabilistic approach the
SMR nuclear power plant project was considered feasible in the "most probable value".
Oztaş & Okmen (2004) examine risk in a construction project. This research use
Monte Carlo simulation to examine the uncertainty of a construction project. The results of

14
the Monte Carlo simulation are in the form of project duration distributions. After that a risk
analysis is carried out. The stages of risk analysis according to Akintoye and Maclead in
Oztaş & Okmen (2004) are establish an appropriate context, set goals and objectives,
identify and analyze risks, influence risk decision-making, and monitor and review risk
responses.
Krzysztof (2016) examine the effect of a few situations of loan cost changes in Poland
on the neighborhood governments' capacity to support their ebb and flow obligation loads.
Reproductions are directed with the Monte Carlo strategy. A few situations show a high
powerlessness of neighborhood governments to antagonistic changes in market financing
costs, however just in the event that they are joined with a decrease of division's working
excess. Such a monetary arrangement may offer ascent to foundational issues for the entire
open part.
Robert (2006) wrote a Monte Carlo Analysis connected investigations of business
angling have generally overlooked the intertemporal parts of rehashed site decisions. For
some fisheries, anglers may pick a progressively ideal voyage direction instead of
nearsighted everyday techniques and a model that overlooks these contemplations will
probably prompt one-sided parameter evaluations and poor strategy direction. A dynamic
irregular utility model is built up that uses a similar data as static site-decision models yet is
settled in the standards of dynamic advancement. Utilizing Monte Carlo investigation, they
assess the exhibition of this estimator when contrasted with the static model for an
assortment of reproduced fishery types.
Peleskei et all. (2015) investigate how the expense of development activities can be
assessed utilizing Monte Carlo Simulation. It explores if the diverse cost components in a
development venture pursue a particular likelihood circulation. The exploration inspects the
impact of connection between's various venture costs on the consequence of the Monte Carlo
Simulation. The paper discovers that Monte Carlo Simulation can be a useful apparatus for
hazard chiefs and can be utilized for cost estimation of development ventures. The

15
examination has demonstrated that cost dispersions are emphatically slanted and cost
components appear to have some reliant connections.
This study has similarities with the research from Mujiningsih (2013) that also uses
Monte Carlo simulations and equally researches about feasibility studies. In addition, this
research also examines the developing small industry. While the difference between the two
is that the research conducted by Mujiningsih aims to create a development strategy using a
SWOT matrix analysis while, in this study, aims to see the feasibility of an investor to invest
in Kopen Coffee.
Based on the studies that have been obtained, the conclusions that can be drawn from
previous research to this research is to use the Net Present Value method with Monte Carlo
simulations to design strategies in helping companies make decisions for investment policies.
The difference between this research and previous research is as follows:
1) This research focuses on the use of Monte Carlo simulations in analyzing coffee shop
investment feasibility studies. Outlining the project scope and conducting current
analysis which focuses on financial aspects.
2) This research provides suggestion regarding to the feasibility of financial aspects of
coffee shop business investment which can be used as a basis for making policies
regarding the sustainability and business development.
2.2 DEDUCTIVE STUDY 2.2.1 Feasibility Study
Business feasibility study is an activity that studies deeply about a business or business that
will be run, in order to determine whether or not the business is feasible (Kasmir and Jakfar,
2012). Meanwhile, how successfully a project can be completed, considering the factors that
influence it such as economic, technological, legal and scheduling factors.
Based on the definition above, it can be concluded that a business feasibility study is
an initial consideration that must be carried out before running a business, and to control

16
operational activities in order to obtain maximum profit. Therefore, it is important to identify
and to be familiar with business feasibility studies.
2.2.2 Feasibility Study Method
According to Kasmir and Jakfar (2008), the stages of business feasibility studies need to be
carried out correctly so that the goals set can be achieved. The stages of the feasibility study
are as follows:
1) Collecting Data and Information
Collecting the data and information in qualitative and quantitative. Data collection is
obtained from reliable source such the business owner, etc.
2) Data and Information Mining
After the required data and information are collected, the next step is to process data
and information. Data processing is carried out correctly and accurately with methods
and sizes that are commonly used in business.
3) Data Analysis
Data analysis to determine the feasibility basis for an aspect. Business feasibility is
determined by the criteria that have met the standard according to the factors that are
appropriate to use.
4) Decision Making
After being measured by certain criteria and the measurement has met the result, then
the next step is to make decisions on the results.
5) Recommendation
The last stage is to provide recommendations to certain parties on the study reports that
have been prepared. In recommendations, suggestions are also given if needed.
Other opinions also expressed by Cleverism (2017). Steps to conducting a feasibility
study, that are:
1) Conduct preliminary analysis

17
2) Outlining the project scope and conducting current analysis
3) Comparing your proposal with existing products/services
4) Examining the market conditions
5) Understanding the financial costs
6) Reviewing and analyzing data
Suliyanto (2010) said that the activity of preparing a business feasibility study is not
only done when there is an idea to start a truly new business, but a business feasibility study
is also needed when business people will do the following rights:
1) Starting a new business
When a businessperson will start a new business, a business feasibility study is
conducted to find out whether the business that will be pioneered is feasible or not.
2) Developing an existing business
When a businessperson will develop a business, a business feasibility study is
conducted to find out whether the business development idea is feasible or not.
3) Choosing the type of business or investment / project that is most profitable
Often investors and businesspeople are faced with the problem of choosing the type
of business or investment / project because of limited costs for investment. In order
to decide optimal investment, it is necessary to have a business feasibility study to
determine the choice of various investment alternatives.
2.2.3 Purpose of Business Feasibility Study
According to Kasmir and Jakfar (2008), there are five objectives why conducting feasibility
study is crucial before running a business, which are:
1) Avoid the risk of loss
The risk for future loss is full with uncertainties, in this case the function of a
feasibility study is to minimize the risks that can be controlled, or which cannot be
controlled.
18
2) Facilitate Planning
Planning includes how much funding is needed, when the business will be run, where,
how it will be implemented, how much profit will be obtained and how to monitor it
if there is a deviation.
3) Facilitate Implementation
With a plan that has been arranged so it is very easy to do business, business execution
can be done systematically.
4) Facilitate Supervision
By implementing the project according to plan, it is easy to supervise the running of
the business.
5) Facilitate Control
If it can be monitored, if a deviation occurs, it will be easily detected, making it easy
to control the deviation.
2.2.4 Net Present Value (NPV)
There are several meanings in the Net Present Value Method as follows, Net present value is
a model that considers the overall cash flow pattern of an investment, in relation to time,
based on a certain Discount Rate (Syafaruddin, 2001). Net present value of an investment
proposal is equal to the net present value of annual cash flows after taxes reduced by the
initial investment expenditure (Arthur, 2001). "Present Value" shows the current value of
money for a particular value in the future. The formula in the Net Present Value Method is:
/𝐵 −𝐶
𝑁𝑃𝑉=%' '(1+𝑖)'
Where:
NPV = Net Present Value (Rp)
𝐵' = Benefit in t-year
𝐶' = Cost in t-year
'01 (2.1)

19
i = Interest
t = t-period
If NPV > 0, then the business is profitable and provides benefits (feasible to run).
Whereas if NPV < 0, then the business is not profitable (not feasible to run).
2.2.5 Monte Carlo
The word "Monte Carlo" is the name of an area in Monaco which is famous for its judicial
facilities (Sediawan, 2013). The Monte Carlo method was first introduced to the world of
finance by David B. Hertz in 1964, in the article "Risk Analysis in Capital Investment "in the
Harvard Business Review.
2.2.6 Monte Carlo Definition
Monte Carlo is one of the most powerful computing tools to solve the high dimensions of
problems in physics, chemistry, economics, and information processing. Monte Carlo
method is a method used to calculate or estimate values or solutions using random numbers,
probabilities, and statistics (Nadinastiti, 2011).
The Monte Carlo method is defined to represent the solution of a problem as a
parameter of the hypothetical population, and use a random number sequence to construct a
sample of the population, where statistical estimates of parameters can be obtained.
The Monte Carlo method is the basis for all algorithms of the simulation method
which is based on the idea of solving a problem to get better results by giving as many values
as possible (Generated Random Number) to get higher accuracy. This method adheres to a
free programming system without too much being bound by certain rules or rules.
2.2.7 Monte Carlo Implementation

20
The Monte Carlo method has many applications in various fields. Nadinastiti (2011) mention
about the application of the Monte Carlo method is in the field, which are:
1) Graphic, used to light tracking
2) Biology, used to studying biological networking
3) Financial, used to assess and analyze financial models
4) Physics, the sections of physics that are used that include statistical physics and
particles. In particle physics, it is utilized for experiments. In nuclear science this
method is also widely applied
5) Probability and statistical sciences are used to simulate and understand the effects of
diversity.
6) Computer sciences are used as example of Las Vegas Algorithms and various
computer games
7) Chemical science, used for simulations involving atomic clusters
8) Environmental science, this method is used to understand the behavior of
contaminants
2.2.8 Monte Carlo Simulation
Construction of a Monte Carlo Simulation model is based on the probabilities obtained by
historical data of an event and its frequency, which is:
Where:
Pi = Probability of i occurrence
Fi = Frequency of i occurrence
𝑃𝑖=𝑓𝑖/𝑛
(2.2)
n = Number of frequencies of all events
Monte Carlo simulations, derived from statistical sampling, were first delivered by
Metropolis and Ulam in a journal entitled The Monte Carlo Method, Journal of the American
Statistical Association (Yeh & Sun, 2013)

21
Monte Carlo Monte Carlo simulation is one of simple simulation methods that can be
built quickly by using only spreadsheets, such as: Ms. Excell (Cahyo, 2008). Monte Carlo
simulation is a method for evaluating iteratively deterministic models using random numbers
as input (Yeh & Sun, 2013). Monte Carlo simulation is defined as all statistical sampling
techniques used to estimate solutions to quantitative problems (Achmad, 2008). Monte Carlo
simulation is sampling using random numbers with the working principle to generate random
numbers or samples of a random variable that is known to be distributed, so that data can be
obtained from the field, or in other words Monte Carlo simulations mimic field conditions
numerically. Monte Carlo simulations can be defined as real system simulations which are
units/particles, by observing the behavior of a number of units/particles that has random
conditions according to population distribution, similar to real systems through random
number generation (Sediawan, 2013).
2.2.9 Monte Carlo Simulation Steps
According to Sediawan (2013), there are three important steps in carrying out Monte Carlo
Simulation, which are:
1) Build a population distribution that closely represents the population distribution of
the real system.
2) Produce random numbers following population distribution, to represent the nature
or condition of the components that make up the system.
3) Predict the nature of the macroscopic system based on mathematical expectations of
the simulated system.
In the Monte Carlo method, simulations system consisted of a number of
units/particles that have random conditions, and their distribution are made as closely as
possible with real systems that are carried out through random number generation. The nature
of the macroscopic system is then only approached with relevant mathematical expectations.
22
2.2.10 Monte Carlo Simulation Elements
Based on Yeh & Sun (2013), the elements of a Monte Carlo Simulation Monte Carlo
simulations require the following elements, which are:
1) Probability density function (pdf).
2) Random number generator to provide random numbers.
3) Recipe sampling, samples from pdf of certain availability with a random number
interval unit.
4) Calculation, in which output results need to be given as total value.
5) Incorrect calculations, where the relationship between the number of statistical errors
that occur and the function of other numbers.
6) Reducing variations in techniques, to reduce the time needed to calculate Monte Carlo
Simulation.
7) Horizontal and vertical integration, to apply effective Monte Carlo simulation to
computational system structure.
2.2.11 Monte Carlo Simulation Advantage
The main advantage of Monte Carlo Simulation of other computational techniques is the
independence of computing resources on the dimensions of the problem. There are many
modifications of this method such as "classic" Monte Carlo, (samples taken from probability
distributions), "Quantum" Monte Carlo, (random walks are used to calculate quantum
mechanical energy and wave functions), "path-integral" quantum Monte Carlo, (Quantum
statistical mechanical integrals are calculated to obtain thermodynamic properties),
"simulation" Monte Carlo, (stochastic algorithms are used to produce initial conditions for
quasiclassical trajectory simulations).
2.2.12 Net Present Value using Monte Carlo
Following is the step by step on how to do the simulation in budgeting analysis using Monte
Carlo method, which is Net Present Value (Dhiensiri & Balsara, 2014).
23
1. Determining the input variables, there are some variables (unit sales) that will be
random number, some others (initial investment, price per unit, variable cost per
unit, depreciation, and tax percentage) are already fixed. The random number is
converted to a value according to a probability distribution function that already
determine.
2. Computing NPV from the key variables that already determined.
3. Then, repeating the same process up to 1,000.
4. For the NPV simulation analysis, there are several variables which can be
calculated, such as the average of 1000 iterations of NPV, low end of the
distribution given by the 5th percentile, the high end of the distribution given by
95th percentile standard deviation for each key input variable and NPV. A mean of
each key input variable and NPV is used as an estimation of the expected value.
Monte Carlo simulation is categorized as a powerful analytical tool since it provides
unbiased estimation. Hence, it makes the NPV is estimated accurately.

24
CHAPTER III:
RESEARCH METHOD
3.1 PROBLEM IDENTIFICATION
This research took place at Kopen Coffee, located in Harjosudiro street, Sanggrahan,
Condongcatur, Sleman, Yogyakarta. Expansion of that business requires capital investment,
and an investment requires financial analysis. However, the financial analysis must be
conducted for the future. Therefore, how to project financial condition in the future and
analyze it before investment would be an essential problem to be solved.
3.2 PROBLEM FORMULATION
Problem to be solved in this study is how to simulate financial condition of Kopen Coffee
using Monte Carlo simulation and analyze it by using NPV. Result of the analysis could be
used as the basis of investment decision to expand the business.
3.3 LITERATURE REVIEW
There are two types of literature review that carried out in this study. First is literatures’ survey
on current studies on feasibility analysis, including risk and financial analysis. Besides,
another study that has been reviewed is the use of Monte Carlo simulation to project condition
in the future based on historical data. This survey aims to support this study in determining
the suitable tools for analysis and to position this study to be comparable to the previous
studies. Second literatures’ survey is performed on basic theory that required in doing this
study, which are feasibility study, NPV analysis and Monte Carlo theory.

25
3.4 DATA COLLECTION METHOD
Basically, in the feasibility analysis, there are two types of required data that are cash inflow
and cash out flow. The cash inflow data was obtained from the sales of the Kopen Coffee
shop while cash out flow was obtained from the investment value and the operational cost in
running the business activities. Therefore, most of the data in this study are considered as
primary data that collected directly from the Kopen Coffee shop. Table 3.1 shows the
required data and the data sources.
Table 3.1 Required data and the data sources
Data Data Sources
Coffee sales (cup) Historical coffee sales (minimum, most likely, maximum)
Profit margin per unit product Initial investment: business space, equipment, tools, and licensing
Sales price and production cost per unit product
Interview and discussion with the owner
Tax rate Interview with the owner Interest rate Bank interest
3.1.1 Monte Carlo Simulation of Coffee Sales
Monte Carlo simulation for the coffee sales in this study was carried out based on triangular
distribution of the historical data. Triangular distribution is employed in this research because
of the uncertainty of demand (Salling, 2007). Random data generation based on the triangular
distribution could be explained using Figure 3.1 and the following equations.

26
Figure 3.1 Diagram of minimum, most likely and maximum sales of coffee product
Most likely coffee sales (h) could be estimated using Equation 3.1.
ℎ=2
(3.1) (𝑏−𝑎)
When probability of the triangle area is considered, then probability of X1 and X2 value appearance could be calculated using Equation 3.2 and Equation 3.3, respectively.
𝑃(𝑥:)=2×(𝑥:−𝑎)
(𝑏−𝑎)×(𝑐−𝑎)
(3.2)
𝑥:=𝑎+>=𝑃(𝑥:)×(𝑏−𝑎)×(𝑐−𝑎)
𝑃(𝑥?)=2×(𝑏−𝑥?)
(𝑏−𝑎)×(𝑏−𝑐)
(3.3)
𝑥?=𝑏−>@A1−𝑃(𝑥 )B×(𝑏−𝑎)×(𝑏−𝑐)
When Monte Carlo concept is incorporated at those equations, then the simulated sales could
be formulated as shown in Equation 3.4.
𝑆=D𝑥:
,if𝑛≤(𝑐−𝑎)
(𝑏−𝑎)
(3.4)
Where:
S : simulated coffee sales value n : random number from 0 to 1.
𝑥?,otherwise
3.1.2 Average Profit Margin per Unit Product
Actually, there are several products that have been sold in the Kopen Coffee Shop. However,
selling price and production cost of each products is not significantly different. Therefore,
?
27
profit margin that considered in this study is average profit margin per unit product. In this
study, profit margin per unit product was obtained by performing interview with the Kopen
Coffee shop owner regarding to estimated average production cost for a cup of coffee and the
average selling price. Interview was conducted because it is almost impossible to calculate
the production cost in detail since the process to produce a cup of coffee is quite complicated.
Average profit margin per cup of coffee then could be calculated using Equation 3.5.
𝑃Q=𝑘Q−𝑑̅ (3.5)
Where:
𝑃Q: Average profit margin of coffee product 𝑘Q: Average selling price of coffee product 𝑑̅: Average production cost of coffee product
3.1.3 Initial Investment
In this study, initial investment data collection was collected by carrying out interview with
the Kopen Coffee shop. Items in initial investment that should be considered are business
space, equipment, tools, and licensing costs. Total investment is the sum of all of considered
items, as formulated in Equation 3.6.
𝐼=𝑏+𝑒+𝑡+𝑙 (3.6) Where:
I : total investment cost b : business space rental cost e : equipment cost t : tools cost l : licensing cost
3.1.4 Depreciation
In this study, depreciation was implemented in order to payback the investment during
investment period. Average depreciation method was applied to calculate the depreciation
value, as shown in Equation 3.7.
𝐷Z=𝐼𝑀
(3.7)

28
Where:
𝐷Z: average depreciation value M : investment period
3.1.5 Before and After-Tax Profit
Before tax profit was calculated by subtracting total average profit margin with the
depreciation value, as shown in Equation 3.10.
𝐵𝑃\=𝑃Q×𝑆−𝐷Z (3.8)
After tax profit was calculated by multiplying before tax profit with 1 - tax percentage, as
shown in Equation 3.11.
𝐴𝑃\=𝐵𝑃\×(1−𝑡𝑥) (3.9)
Where:
BPm : Before tax profit at period m, during investment period APm : After tax profit at period m, during investment period tx : tax percentage m : period index during investment period
3.1.6 Cash Flow
Cash flow was calculated by summing APm and 𝐷Z, as shown in Equation 3.10. 𝐶𝐹\=𝐴𝑃\+𝐷Z (3.10)
Where:
CFm : cash flow in period m, during investment period.
3.1.7 NPV Simulation Analysis
NPV simulation was conducted using Microsoft Excel and has been ran for 1000 iterations.
Analysis on the result of NPV simulation was carried out for average NPV (as shown in

29
Equation 3.11), mean standard deviation of NPV and interest value (shown in Equation 3.12
and Equation 3.15, respectively), estimation of minimum and maximum of NPV value based
on 95% of confidence level (shown in Equation 3.13 and Equation 3.14, respectively) and
estimation of minimum and maximum of interest rate based on 90% of confidence level
(shown in Equation 3.16 and Equation 3.17, respectively). Such estimation would be used to
support the decision making before capital investment. ∑a 𝑁𝑃𝑉̀
Q𝑁QQ𝑃QQ𝑉Q= `0: 𝑅
(3.11)
>
𝑆𝑇def=ga`0:(𝑁𝑃𝑉−Q𝑁QQ𝑃QQ𝑉Q)?
𝑅−1(3.12)
𝐸𝑀𝑖𝑛𝑁𝑃𝑉ij=Q𝑁QQ𝑃QQ𝑉Q−𝑁𝑜𝑟𝑚𝑠𝑖𝑛𝑣(0.975)×𝑆𝑇def (3.13) 𝐸𝑀𝑎𝑥𝑁𝑃𝑉ij=Q𝑁QQ𝑃QQ𝑉Q+𝑁𝑜𝑟𝑚𝑠𝑖𝑛𝑣(0.975)×𝑆𝑇def (3.14)
>
𝑆𝑇`=g𝑃(𝑁𝑃𝑉<0)×A1−𝑃(𝑁𝑃𝑉<0)B
𝑅
(3.15)
𝐸𝑀𝑖𝑛𝐼i1=𝑃(𝑁𝑃𝑉<0)−𝑁𝑜𝑟𝑚𝑠𝑖𝑛𝑣(0.950)×𝑆𝑇` (3.16) Where:
𝐸𝑀𝑎𝑥𝐼i1=𝑃(𝑁𝑃𝑉<0)+𝑁𝑜𝑟𝑚𝑠𝑖𝑛𝑣(0.950)×𝑆𝑇` (3.17)
Q𝑁QQ𝑃QQ𝑉Q : average NPV value for R iterations
r : iteration index R : number of iterations 𝑆𝑇def𝐸𝑀𝑖𝑛𝑁𝑃𝑉ij𝐸𝑀𝑎𝑥𝑁𝑃𝑉ij𝐸𝑀𝑖𝑛𝐼i1𝐸𝑀𝑎𝑥𝐼i1
: standard deviation of NPV value after iterated : expected minimum NPV value with confident level at 95% : expected maximum NPV value with confident level at 95% : expected minimum interest value with confident level 90% : expected maximum interest value with confident level 90%
3.2 DISCUSSIONS
Next step is discussing important things that have not been discussed in previous steps. The
discussion would be the basis in arranging suggestions for next research.
∑

30
3.3 CONCLUSION AND RECOMMENDATION
Conclusion would be arranged in order to answer problem statement. Recommendation for
next research would also be arranged based on the previous discussion. Steps in this study
are depicted in a flowchart, as shown in Figure 3.2.
3.5 FLOWCHART
Figure 3.2 Steps in conducting this study
31
CHAPTER IV
DATA COLLECTION AND PROCESSING
4.1 DATA COLLECTING
The first set of data to be collected is sales of coffee products. Actually, there are several
products that sold by the Kopen Coffee shop. However, in this study, only the main products,
that made based on coffee, considered in the analysis. In the Kopen Coffee shop, number of
secondary products is insignificant and not considered as the core business of the Kopen
Coffee shop.
Sales data of the main products could be collected from the Kopen Coffee shop directly.
Sales estimation for the main products in the future would be conducted based on Monte
Carlo simulation and triangular random distribution. One-year sales data are available, and
Table 4.1 shows most likely, minimum and maximum sales of the main products.
Table 4.1 Most likely, minimum and maximum of sales of the main products
Min Most Likely Max Sales 1,825 29,200 43,800
Second data to be collected is average profit margin per unit products. This data would
be calculated from the raw data on average sales price of the main products and average
production cost of the main products. Table 4.2 shows the average selling price and average
production cost of the main products since there are several types of coffee in Kopen.
Table 4.2 Average selling price and production cost of the main products
Average Selling Price Average Production Cost
Main products Rp 16,500 Rp 11,700

32
The third data to be collected is the required initial investment. The data was collected
by direct observation in the Kopen Coffee shop and discussion with the owner, with the result
as shown in Table 4.3.
Table 4.3 Required initial investment
Items Amount (in IDR)
Rent a business space for 5 years 50,000,000 Equipment 10,270,000 Tools 22,960,000 Licensing 3,000,000 Total 86,230,000
The next data to be collected are tax that could be obtained by interviewing the owner
and interest rate that could be obtained by asking to bank that usually used by the coffee
owner to safe his money. Table 4.4 shows the data.
Table 4.4 Data about tax and bank interest
Items Percentage (per year)
Tax 10% Bank interest 5.4%
4.1 DATA PROCESSING
After collecting several data, the cash flow calculation has been done for five years ahead, with
the initial investment that has been calculated in Table 4.3, which equal to Rp 86,230,000.
This process of calculation employs Equation 3.1 to Equation 3.10 from the previous chapter,
to obtain cash flow and Net Present Value (NPV) of Kopen Coffee. Then the NPV simulation
will be analyzed using the formula stated in Equation 3.11 to Equation 3.17.
4.1.1 Cash Flow
Using the formula given in Equation 3.1 to Equation 3.10, Table 4.5 shows the result of
Kopen Coffee’s cash flow for the next five years.
33
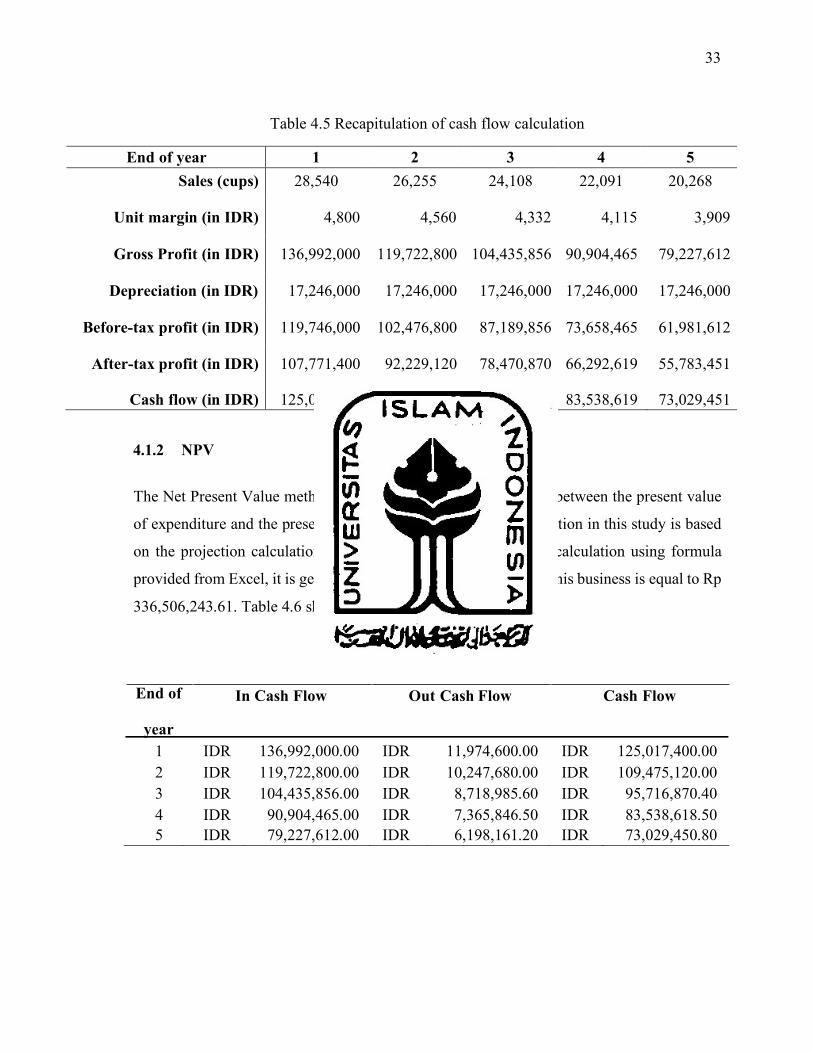
Table 4.5 Recapitulation of cash flow calculation
End of year 1 2 3 4 5 Sales (cups) 28,540 26,255 24,108 22,091 20,268
Unit margin (in IDR) 4,800 4,560 4,332 4,115 3,909
Gross Profit (in IDR) 136,992,000 119,722,800 104,435,856 90,904,465 79,227,612
Depreciation (in IDR) 17,246,000 17,246,000 17,246,000 17,246,000 17,246,000
Before-tax profit (in IDR) 119,746,000 102,476,800 87,189,856 73,658,465 61,981,612
After-tax profit (in IDR) 107,771,400 92,229,120 78,470,870 66,292,619 55,783,451
Cash flow (in IDR) 125,017,400 109,475,120 95,716,870 83,538,619 73,029,451
4.1.2 NPV
The Net Present Value method is used to calculate the difference between the present value
of expenditure and the present value of revenue. The NPV calculation in this study is based
on the projection calculation of five years ahead. Based on the calculation using formula
provided from Excel, it is generated that the Net Present Value of this business is equal to Rp
336,506,243.61. Table 4.6 shows the details cash flow.
End of
Table 4.6 Cash Flow Details
In Cash Flow Out Cash Flow Cash Flow
year
1 IDR 136,992,000.00 IDR 11,974,600.00 IDR 125,017,400.00 2 IDR 119,722,800.00 IDR 10,247,680.00 IDR 109,475,120.00 3 IDR 104,435,856.00 IDR 8,718,985.60 IDR 95,716,870.40 4 IDR 90,904,465.00 IDR 7,365,846.50 IDR 83,538,618.50 5 IDR 79,227,612.00 IDR 6,198,161.20 IDR 73,029,450.80

34
4.1.3 NPV Simulation Analysis
After that, NPV simulation was ran up to 1000 iterations using Microsoft Excel. From the
result of the simulation which is shown in Table 4.7, later it can be analyzed using several
categories, such as the average of the NPV result from 1000 iterations, the mean standard
error, the expected minimum and maximum NPV value with confident level at 95%, as well
as expected minimum and maximum interest value with confident level 90%, which can be
obtained using formula that has been stated in Equation 3.11 to Equation 3.17 and presented
in Table 4.8.
Table 4.7 NPV simulation result of 1000 iterations
Iteration NPV 1 IDR (38,040,935) 2 IDR (36,233,761) 3 IDR (35,936,572) 4 IDR (28,663,459) 5 IDR (16,927,477) 6 IDR (15,763,907) 7 IDR (15,172,390) 8 IDR (11,410) 9 IDR 861,744
10 IDR 2,389,914 ….. 999
IDR
….. 554,650,914
1000 IDR 556,519,523
Table 4.8 Recapitulation of Monte Carlo simulation result
Simulation Analysis Results
NPV Average IDR 287,411,388 Mean Std. Error IDR 3,956,371
Expected Min. NPV IDR 279,657,043 Expected Max. NPV IDR 295,165,732 Min. Interest Value -0.07% Max. Interest Value 0.23%
P (NPV < 0) 0.08%

35
4.1.4 Sensitivity Analysis
For the sensitivity analysis, it is conducted using Excel. Table 4.9 shows the data that are
used for the calculation, with fixed cost is equal to Rp 86,230,000 and depreciation is equal
to Rp 17,246,000, and tax rate 10%.
Table 4.9 Data for NPV Sensitivity Analysis
Pessimistic (min)
Base (most likely)
Optimistic (max)
Unit Sales 1825 29200 43800 Price per unit Rp 16,500.00 Variable cost per unit Rp 11,700.00 Fixed cost per year Rp 17,246,000.00
After that, Out Cash Flow (OCF) were calculated by considering price per unit,
variable cost per unit, fixed cost per year, depreciation cost, and tax for each categories,
pessimistic, base, and optimistic unit sales as shown in Table 4.10.
Table 4.10 Out Cash Flow and Net Present Value of Sensitivity Analysis
Pessimistic (min) Base (most likely) Optimistic (max)
OCF Rp (5,912,800.00) Rp 112,347,200.00 Rp 175,419,200.00 NPV Rp (111,548,728.14) Rp 394,842,962.74 Rp 664,918,531.21
To know how does the NPV reacted to the changes that happened especially in terms
of sales. Then, the scatter diagram was presented in Figure 4.1.

36
Figure 4.1 Sensitivity Analysis Scatter Diagram
Then, the slope was calculated to recognize how far the NPV will move, if there is a
change in the sales unit. From the calculation, it is shown that for every unit sale, the NPV
will move for about Rp 18,498.32661.
37
CHAPTER V
DISCUSSION
5.1 NET PRESENT VALUE
From the data processing in the previous chapter, it is generated that the NPV value for the
next five years is equal to Rp 336,506,243.61. NPV comes from the cash flow of year-1 to
year-5, by considering the interest rate of 5.4%. The interest rate comes from the deposit rate
of bank that usually used by the owner. First, the sales unit of the coffee was simulated by
using triangular random distribution method, which is divided into three categories, such as
worst, most likely, and best scenario. This research employs triangular distribution since it is
more reliable to predict the sales of Kopen Coffee based on the three scenarios of the demand.
From the triangular distribution, the demand will be fall more in the most likely value, but
also considering the worst and the best case of the value that has be determined. After that,
cash flow was calculated, by adding the after-tax profit and depreciation. It is shown that the
cash flow is quite good, even though the cash flow is decreasing each year due to the annual
decay, but the cash flow is still positive and beneficial. Hence, from the NPV result which
has been calculated, it is generally stated based on literature review, business of Kopen Coffee
or similar business is feasible to run, because NPV > 0.
5.2 NPV SIMULATION ANALYSIS
After obtaining the NPV result for the next five years, Monte Carlo simulation is
accomplished by running the iteration as many a 1000 times. Monte Carlo is one of reliable
tool which is unbiased. Besides, NPV is one of the financial aspects that can be easily
analyzed and compared for one project over others. In this project, the triangular random
distribution for the sales of the coffee cups is applied as the input to calculate the cash flow,
which will be more reliable because it will rely mostly on the most likely scenario, but also
considering the worst and best case.
38
Using the help of Microsoft Excel features, the result simulation can be obtained easily,
which is shown in Table 4.6.
The simulation generates an average value of NPV equal to Rp 287,411,388, with
mean standard error Rp 3,956,371. It is shown that the NPV is positive and above the initial
investment. With confidence level of 95%, the expected minimum NPV is Rp 279,657,043,
while the maximum NPV will be Rp 295,165,732. Theoretically, investor should accept the
project when the NPV is positive or NPV > 0. It is because the value of the revenues (cash
inflows) is greater than the costs (cash outflows). Hence, this business is beneficial for the
investor or business owner statistically with confidence level of 95%, because it is profitable
for both investor and business owner.
From the result of simulation, it can be seen that there is only a few of NPV result
which is less than 0 or showing the negative result. The probability of NPV < 0 is only 0.08%
which categorized as a very low possibility. The mean standard error for the probability is
0.001. Hence, with 90% of confidence level, the minimum NPV will be less than 0 is only
up to 0.23%, or it can be concluded that there is a little possibility for this business to result
negative NPV and create the loss. From this calculation, it is shown that this research 90%
confidence statistically, if at least 99.77% of this project is possible to be run and willgenerate
profit.
After conducting the sensitivity analysis for the NPV, it is shown that the differences
between the pessimistic and the mode is quite high, but not for the mode and the optimistic,
as in Figure 4.1. While for every change in sales unit will affect the NPV for about Rp
18,498.32661.

39
CHAPTER VI
CONCLUSION AND RECOMMENDATION
Problem to be solved in this study is how to simulate financial condition of Kopen Coffee
using Monte Carlo simulation and analyze it by using NPV. Result of the analysis could be
used as the basis of investment decision to expand the business.
6.1 CONCLUSION
The NPV shows positive result which is equal to Rp 336,506,243.61. After running 1000
iterations for NPV simulation, it is generated that the NPV will fall with average of Rp
287,411,388, with mean standard error Rp 3,956,371. From 1000 of iterations, the probability
the NPV will be resulted with negative value is only 0.08%. Hence, it can be concluded that
the financial condition of Kopen Coffee is great. Therefore, this business and other similar
coffee shop project is feasible to run.
6.2 RECOMMENDATION
There are several suggestions that the researcher can give, which are:
1) Kopen Coffee can conduct the other aspects to identify the feasibility, such as
marketing, technical, and legal aspect to consider the business as a whole.
2) For further research, feasibility studies in other fields are needed to be performed in
order to know other new business fields and open an entrepreneurial spirit for the
community.

40
REFERENCES
Arthur, J. K. (2001). Dasar-dasar Manajemen Keuangan, Edisi 7, Salemba Empat, Jakarta.
Bendob, A. & Bentouir, N. (2019). Options Pricing by Monte Carlo Simulation, Binomial
Tree, and BMS Model: a comparative study. Journal of Banking and Financial
Economics. Vol. 1
Boufateh, T. (2019). On the validity of exclusion restrictions in the structural multivariate
framework: a Monte Carlo simulation. Vol. 2. No. 2.
Cahyo, W. N. (2008). Pendekatan Simulasi Monte Carlo Untuk Pemilihan Alternatif Dengan
Decision Tree Pada Nilai Outcome Yang Probabilistik. Teknoin, 13(2), 11–17.
https://doi.org/10.20885/teknoin.vol13.iss2.art3
Cheon, S. & Liang, F. (2009). Bayesian phylogeny analysis via stochastic approximation
Monte Carlo. Molecular Phylogenetics and Evolution., Vol. 53, no. 2.
Cleverism. (2017). Business model canvas: Creating a Value Proposition. [ONLINE]
Available at: https://www.cleverism.com/business-model-canvas-creating-
valueproposition/ [Accessed 8 August 2020].
Dhiensiri, N., & Balsara, N. (2014). An Introductory Application of Monte Carlo Simulatoin
in Capital Budgeting Analysis. Journal of Financial Education, 40(1), 94–115.
Ganame, P., & Chaudhari, P. (2015). Construction Building Schedule Risk Analysis using
Monte- Carlo Simulation.
Hizkia, H. (2018). Analisis Risiko Investasi Pada Pembangunan Gedung Perkantoran. Jurnal
Muara Sains, Teknologi, Kedokteran, dan Ilmu Kesehatan. Universitas Tarumanagara.
Jumingan. (2009). Analisis Laporan Keuangan. Jakarta: Raja Grafindo Persada.
Kasmir & Jakfar. (2008). Studi Kelayakan Bisnis Edisi-2. Kencana Prenada Media.
Kasmir & Jakfar. (2012). Studi Kelayakan Bisnis. Cetakan ke Delapan. Jakarta: Kencana
Komljenovic, J. & Robertson, S. L. (2016). The dynamics of ‘market-making’ in higher
education. Journal of Education Policy, 31(5), 622-636.
Krzysztof, K. (2016). Sustainability of Local Government Sector Debt. Evidence from
Monte-Carlo Simulations. Journal Of Local Self Government. Vol. 14. No. 1.
Manope B.F., Kindangen P., & Tawas H. (2014). Analisis keleyakan usaha komoditas biji

41
dan fuli pala melalui penilaian aspek finansial pada pedagang pengumpul di pulau siau.
Jurnal EMBA. 2(4): 320-330.
Mujiningsih, M. I. (2013). Analisis Kelayakan Usaha dan Strategi Pengembangan Industry
Kecil Tempe di Kecamatan Matesih Kabupaten Karanganyar.
Nadinastiti. (2011). Metode Monte Carlo. Jurnal Sekolah Teknik Elektro dan Informatika –
Institut Teknologi Bandung.
Nufaili, R. & Utomo, C. (2014). Analisa Investasi Hotel Pessona Makasar. Jurnal Teknik ITS
Vol 3, No 2. Institut Teknologi Sepuluh Nopember Surabaya.
Nurkhotimah, S. (2014). Analisis Studi Kelayakan Investasi Waralaba (Franchise) “Studi
Kasus: Rumah Makan Joglo Kampoeng Doeloe, Semarang”. Skripsi Jurusan
Manajemen, Fakultas Ekonomi dan Bisnis Universitas Dian Nuswantoro Semarang
Nuryanti. (2015). Analisis Kelayakan Finansial Proyek PLTN SMR Di Indonesia Dengna
Mempertimbangkan Variabel Ketidakpastian. Jurnal Pengembangan Energi Nuklir
Volume 17, Nomor 2. Pusat Kajian Sistem Energi Nuklir (PKSEN) BATAN
Oztas, A. & Ökmen, Ö. (2004). Risk analysis in fixed-price design–build construction
projects. Building and Environment. 39. 229-237. 10.1016/j.buildenv.2003.08.018.
Peleskei, CA Dorca V, Munteanu RA & Munteanu R. (2015). Risk Consideration and Cost
Estimation in Construction Projects Using Monte Carlo Simulation. Management
knowledge and learning, Vol. 10, No. 2
Park, C. S & Sharp-Bette, G. P. (1990). Advanced Engineering Economics. New York:
Wiley.
Robert, L. (2006). Dynamic Random Utility Modeling: A Monte Carlo Analysis. American
Journal of Agricultural Economics. Vol. 88.
Sachin, K. M., et al. (2014). Monte Carlo Simulation-Based Approach to Manage Risks in
Operational Networks in Green Supply Chain. Journal of Procedia Engineering. Vol. 97
Salling, K. B. (2007). Risk analysis and Monte Carlo simulation within transport appraisal.
Lyngby, Denmark: Univ. of Denmark.
Shaffie, S. S. (2016). Monte Carlo on Net Present Value for Capital Investment in Malaysia.
Procedia - Social and Behavioral Sciences Volume 219
Sediawan, B.W. (2013). Application of Monte Carlo Simulation in Chemical Engineering.
Yogyakarta: Gajah Mada University Press.

42
Sofyan, A. (2004). Manajemen Produksi dan Operasi. Jakarta: Lembaga Fakultas Ekonomi
UI.
Stretcher & Robert. (2015). Net Present Value Simulation: A Case Study. Journal of Business
Strategies. Vol. 32, No. 2
Suliyanto. (2010). Studi Kelayakan Bisnis Pendekatan Praktis. Yogyakarta: ANDI
Syafaruddin, A. (2001). Manajemen Sumber Daya Manusia, Strategi Keunggulan
Kompetitif. Badan Penerbit Fakultas Ekonomi. Yogyakarta.
Vajargah, B. F. (2017). Evaluating Wave Random Path Using Multilevel Monte Carlo.
International Journal of e-Navigation and Maritime Economy. Vol. 7
Widiati, S. (2020). The Emerging Business of Coffee Shops in Indonesia. Retreived from
https://nowjakarta.co.id/dining/culinary-talk/the-emerging-business-of-coffee-shops-in-
indonesia (Accessed on 10 August, 2020).
Wirastuti, N. P. O. (2012). Analisis Finansial Pembangunan The Magani Hotel Kuta. Jurnal
Ilmiah Elektronik Infrastruktur Teknik Sipil Universitas Udayana Vol 1, No 1.
Wulan, S., Putra, A. R., & Arini, Y. W. (2012). Analisis Studi Kelayakan Bisnis Guest House
Family di Bandar Lampung.
Yeh, T. M., & Sun, J. J. (2013). Using the Monte Carlo simulation methods in gauge
repeatability and reproducibility of measurement system analysis. Journal of Applied
Research and Technology, 11(5), 780–796. https://doi.org/10.1016/S1665-
6423(13)71585-2